Embed Size (px)
Citation preview
19 February 2019
PreliminaryStatementofResultsfortheyearended31December2018
Kerry Group, the global taste & nutrition and consumer foods group, reports preliminary results for the year ended 31 December 2018.
HIGHLIGHTS
Adjusted EPS* of 353.4 cent – up 8.6% on a constant currency basis
Group revenue of €6.6 billion reflecting 3.5% volume growth
— Taste & Nutrition +4.1% volume growth
— Consumer Foods +1.1% volume growth
Group trading margin maintained at 12.2% despite a 30bps currency headwind
— Taste & Nutrition +20bps to 15.1%
— Consumer Foods ‐60bps to 7.5%
Basic EPS of 305.9 cent (2017: 333.6 cent – which included a one‐off US deferred tax credit)
Final dividend per share of 49.2 cent (total 2018 dividend up 12% to 70.2 cent)
Free cash flow of €447m (2017: €501m)
* Before brand related intangible asset amortisation and non‐trading items (net of related tax)
EdmondScanlon–ChiefExecutiveOfficerStatement
“We are pleased with our performance in 2018, with volume growth well ahead of our markets, underlying
margin expansion in line with expectations and adjusted earnings per share growth of 8.6% in constant currency.
This performance continues to highlight the uniqueness of Kerry’s business model in supporting customers, as
consumers continue to look for innovation and drive further marketplace fragmentation.
We have also made good progress across our strategic growth priorities, including further developing our industry
leading portfolio of taste and nutrition foundational technologies, completing a number of strategic acquisitions
and investments aligned to growth priorities as planned.
In 2019 we expect to deliver adjusted earnings per share growth of 6% to 10% on a constant currency basis.”
ContactInformation
Media
Catherine Keogh VP Corporate Affairs & Communications
+353 66 7182304 [email protected]
Investor Relations
Marguerite Larkin Chief Financial Officer +353 66 7182292 [email protected]
William Lynch Head of Investor Relations +353 66 7182292 [email protected]
Website
www.kerrygroup.com
Kerry Group Preliminary Statement of Results 2018 1
PRELIMINARYSTATEMENTOFRESULTS
For the year ended 31 December 2018
The Group achieved volume growth in 2018 well ahead of the market, where the rate of change continues to
accelerate. The food and beverage industry and end‐to‐end supply chain are experiencing unprecedented
disruption, as consumers are demanding more than ever before and are challenging traditional business models.
The application of Kerry’s leading taste and nutrition technology portfolio through our leading business model
continues to drive significant value for our customers as they seek to meet rapidly changing consumer demands
and increase speed to market. Major global consumer trends such as authenticity, healthfulness, convenience,
clean label, sustainability and premiumisation, aligned with local consumer preferences continue to generate
increased innovation opportunities.
Taste & Nutrition achieved sustained volume growth in North America, solid growth in Latin America, a good
performance in Europe and continued strong growth in APMEA.
While UK and Irish consumer foods markets encountered challenges impacting consumer sentiment, with market
growth rates reducing across the year, Kerry’s Consumer Foods division delivered a solid underlying performance.
Business Performance
Group revenue on a reported basis increased by 3.1% to €6.6 billion reflecting strong volume growth and
contribution from acquisitions, partially offset by adverse currency movements. Business volumes grew by 3.5%
and pricing decreased by 0.5% against a backdrop of lower raw material costs in the year. Taste & Nutrition
delivered 4.1% volume growth and pricing decreased by 0.5%. Consumer Foods’ business volumes increased by
1.1% and pricing decreased by 0.4%.
Group trading margin was maintained at 12.2%, reflecting a 20 basis points improvement in Taste & Nutrition,
positive underlying margin improvement in Consumer Foods offset by adverse sterling exchange rates resulting
in a 60 basis points margin reduction, and increased net investment on the KerryExcel programme.
Constant currency adjusted earnings per share increased by 8.6% to 353.4 cent (2017 currency adjusted: 325.4
cent). Basic earnings per share decreased by 8.3% to 305.9 cent (2017: 333.6 cent) primarily due to the one‐off
favourable impact of US tax reform in the prior year. The Board recommends a final dividend of 49.2 cent per
share, an increase of 12.1% on the final 2017 dividend. Together with the interim dividend of 21.0 cent per share,
this brings the total dividend for the year to 70.2 cent, an increase of 12% on 2017.
Kerry’s industry leading research and development expenditure increased to €275m due to additional investment
in Taste & Nutrition (2017: €269m). Net capital expenditure amounted to €286m (2017: €297m) as the Group
continued to invest in its strategic priorities for growth, in particular taste technologies and developing market
facilities. The Group achieved free cash flow of €447m reflecting cash conversion of 72% in the year (2017: €501m
/ 83%).
Kerry Group Preliminary Statement of Results 2018 2
Business Reviews
Taste&Nutrition
Kerry, the industry’s leading, globally‐connected Taste & Nutrition company, provides the largest most innovative portfolio of Taste & Nutrition Technologies and Systems, and Functional Ingredients & Actives for the global food, beverage and pharmaceutical industries.
2018 Growth
Revenue €5,351m 4.1%¹
Trading margin 15.1% +20bps
¹ volume growth
Volume growth of 4.1% driven by Meat, Beverage and Snacks End Use Markets (EUMs)
Pricing of (0.5%) – as lower raw material costs were reflected in customer partnership agreements
Trading margin +20bps – good underlying growth driven by operating leverage, portfolio enhancement
and efficiencies, partially offset by currency headwinds and investments for growth
The division achieved good growth across an increasingly diverse customer base. Developing markets delivered
strong volume growth of 9.5%, with APMEA the main driver. Foodservice delivered a good performance of 5.8%
volume growth, particularly considering the strong comparatives in 2017. Trading profit grew by 5.0% to €805m,
reflecting a 20 basis points improvement in trading margin to 15.1%.
Kerry’s taste technologies recorded a strong performance across all regions, with TasteSense™ technology and
natural extracts being key drivers of growth, as consumer demands for reduced sugar and authentic taste were
met through innovations across all categories. Kerry’s leading clean label technologies continued to perform well,
with its broad protein portfolio, nutritional bioactives, enzyme technologies, food protection and natural
preservation solutions all delivering good growth in the year. An increasing number of innovations brought to
market combined technologies from both Kerry’s authentic taste and nutrition portfolios, as Kerry’s Technology
& Innovation Centres supported customers from ideation all the way through to launch.
Americas Region
2.8% volume growth
Good performance driven by Meat, Beverage and Snacks EUMs
LATAM delivered solid growth
High levels of product churn continued across the marketplace, as consumer demands for clean label, new world
taste experiences and new convenience formats continued to evolve at pace in both the retail and foodservice
channels. These changing dynamics continued to weigh on centre of store categories. Kerry delivered volume
growth ahead of the market by winning market share through innovation across different customer categories.
Reported revenue in the Americas region increased by 2.5% to €2,745m, reflecting 2.8% volume growth, lower
pricing of 0.5%, contribution from business acquisitions of 6.2% and an adverse translation currency impact of
6.0%.
In North America, Kerry’s Meat EUM delivered strong growth, meeting consumer demands for authentic ethnic
flavours, natural shelf life preservation and a broader range of alternative protein‐based products. Smoke & Grill
enjoyed strong growth and business development, as Kerry’s Red Arrow technologies were deployed across a
broader range of meat and meat alternative applications, delivering additional clean label, taste and colour
attributes.
The Beverage EUM continued to deliver good growth, as Kerry’s development and applications expertise helped
customers launch a number of innovative new products across a variety of categories including cold brew,
refreshing beverages and functional health beverages.
The Snacks EUM performed well, in particular with growth through innovative healthier savoury snacks and
indulgent world taste experiences, as that EUM gains inspiration from other categories. The cereal category
Kerry Group Preliminary Statement of Results 2018 3
remained challenging in the year, as traditional consumption occasions continued to decline. Kerry’s dairy taste
and clean label technologies benefitted from enhanced wellness and premiumisation trends within the Meals
EUM.
Kerry’s Ganeden® probiotics and Wellmune® branded immunity enhancing ingredients continued to grow well,
as they broadened their market reach with a number of new launches into wider applications.
In LATAM, Mexico and Central America delivered good growth, while Brazil delivered a solid overall performance.
The Snacks and Bakery & Confectionery EUMs delivered good growth, with Kerry’s cleaner label solutions a key
driver. Kerryconnect was also successfully deployed in the region.
The global Pharma EUM once again delivered strong growth, driven by the excellent performance of excipients
in North America and APMEA. The Group acquired the pharmaceutical lactose manufacturing facility of Foremost
Farms – based in Rothschild, Wisconsin, further strengthening Kerry’s pharmaceutical lactose supply base. The
Group expanded its bio‐processing capacity for natural preservation and food protection at the Rochester,
Minnesota facility during the year.
In the last quarter the Group acquired Fleischmann’s Vinegar Company, Inc (FVC), a USDA certified all‐natural
producer of specialty ingredients that further supports Kerry’s taste and clean label strategies across a number
of EUMs. Headquartered in California, it has manufacturing facilities in Washington, New York, Maryland, Illinois,
Missouri, Alabama and California.
Since the year end, the Group acquired Southeastern Mills’ (SEM) coatings and seasonings business. SEM
manufactures from its strategically located base in Rome, Georgia. This acquisition complements Kerry's
authentic taste portfolio and further develops the Group's industry leading offering into the meat EUM.
The Group also reached agreement to acquire Ariake USA, which produces natural clean label savoury taste
solutions derived from poultry, pork and vegetables at its facility in Harrisonburg, Virginia. Ariake USA's highly
specialised extraction technologies and development capabilities produce a suite of tailored solutions across a
number of EUMs.
These acquisitions further enhance Kerry's extensive authentic taste and clean label portfolio, while
complementing the Group's from‐food‐for‐food heritage.
Europe Region
2.3% volume growth – versus very strong comparatives
Good performance in Beverage, Meat and Dairy EUMs
Foodservice performed well with a number of highly successful seasonal product launches and repeat LTOs
The region delivered a good performance, given the very strong comparatives particularly in the second half of
2017. Kerry continued to meet evolving local consumer preferences across the region by progressing its in‐market
customer engagement strategy. Reported revenue in the Europe region increased by 1.7% to €1,422m, reflecting
2.3% volume growth, lower pricing of 0.6%, an adverse transaction currency impact of 0.2%, contribution from
business acquisitions of 1.4% and an adverse translation currency impact of 1.2%.
The Beverage EUM delivered strong performance across a number of beverage categories within both retail and
foodservice channels, as Kerry’s TasteSense™ sugar‐reduction technology, natural extracts, and our protein range
were key drivers of growth.
The Meat EUM continued to deliver good growth, with Kerry’s clean label technologies, innovative texture
solutions and meat‐free technologies being successfully deployed in a number of new market launches, as the
category continues to evolve at pace. The recent Hasenosa acquisition in Spain and the majority shareholding in
Netherlands‐based Ojah are performing well and contributing to business development and access to new
customers in the meat category.
Kerry Group Preliminary Statement of Results 2018 4
The Bakery EUM delivered a solid performance, with growth delivered through meeting evolving consumer
demands for both clean label and premium offerings. Russia delivered strong growth, particularly into the Meat
and Snacks EUMs, while production commenced in Kerry’s first manufacturing facility in the country, providing a
key platform for future business development and growth.
The Dairy EUM continued to perform well in the rapidly evolving ice cream category, with a number of new
launches in both premium and dairy‐free ranges using Kerry’s taste technologies. International dairy markets
remained challenging during the year. Demand from major dairy importing countries for primary dairy products
continued to benefit from the appreciation of the nutritional values of dairy. While demand for butterfat in
particular remained relatively strong, market stability was impacted by continued shifts in supply / demand
balances.
Foodservice played a key role across a number of EUMs, particularly in the Beverage and Meat EUMs through
the continued nutritional enhancement of menu ranges, with successful seasonal products and repeat LTOs
delivering a very good performance across the year.
APMEA Region
10.1% volume growth
Strong overall performance across EUMs – in particular Meat, Meals and Snacks
Strategic expansion – both organic and acquisitive
The APMEA region continued to deliver very strong growth well ahead of the market across the region’s
developing markets. Kerry’s business model continued to be successfully deployed, with the selective rollout of
our industry‐leading foundational technology portfolio to meet rapidly evolving local consumer needs across the
region. The region continues to evolve as a highly fragmented marketplace with broad‐based market dynamics
and consumer trends including convenience, authenticity, wellness and a desire for new. These trends, together
with local consumer taste preferences, are driving major consumption change across both retail and foodservice
channels. Reported revenue in the APMEA region increased by 10.1% to €1,105m, reflecting 10.1% volume
growth, a decrease in pricing of 0.5%, an adverse transaction currency impact of 0.1%, contribution from business
acquisitions of 3.4% and an adverse translation currency impact of 2.8%.
The Meat EUM delivered very strong growth through customer partnerships with a number of new innovations,
as customers broaden their ranges to meet consumers’ changing needs for authentic taste, value and increasingly
food safety.
The Meals EUM continued to perform strongly in South East Asia and Greater China across both the retail and
foodservice channels, as new authentic cooking taste profiles were deployed across a number of new products.
The Snacks EUM delivered good growth due to the continued development of new snacking occasions across the
region. Local category leaders continued to innovate through the introduction of new authentic world flavours,
with Kerry’s Smoke & Grill, Barbecue and Dairy technologies being deployed across a range of products.
Sub‐Saharan Africa achieved strong growth, through better‐for‐you applications into the Beverage and Snacks
EUMs. The foodservice channel continued to outperform the market, with innovations to meet consumers’
‘desire for new’ including sparkling coffee, and convenience through home delivery, using Kerry’s technologies
to enhance the overall taste experience.
The Group continued to invest in its strategic growth priorities in the region to improve capabilities and capacity
to meet local market opportunities. Good progress was made through investments in ongoing footprint
expansion in Indonesia, China and Malaysia. Four acquisitions were completed in the year; Hangman ‐ a leading
China‐based producer of sweet and savoury flavours, SIAS Food Co. ‐ a leading China‐based supplier of culinary
and fruit ingredients and systems to the foodservice and food manufacturing industries, Season to Season ‐ a
leading South African supplier of taste ingredients and systems to the African snack and food sectors, and AATCO
Food Industries LLC ‐ a leading Oman headquartered provider of culinary sauces to the foodservice channel,
providing a strategic platform for business development in the Middle East and Africa.
Kerry Group Preliminary Statement of Results 2018 5
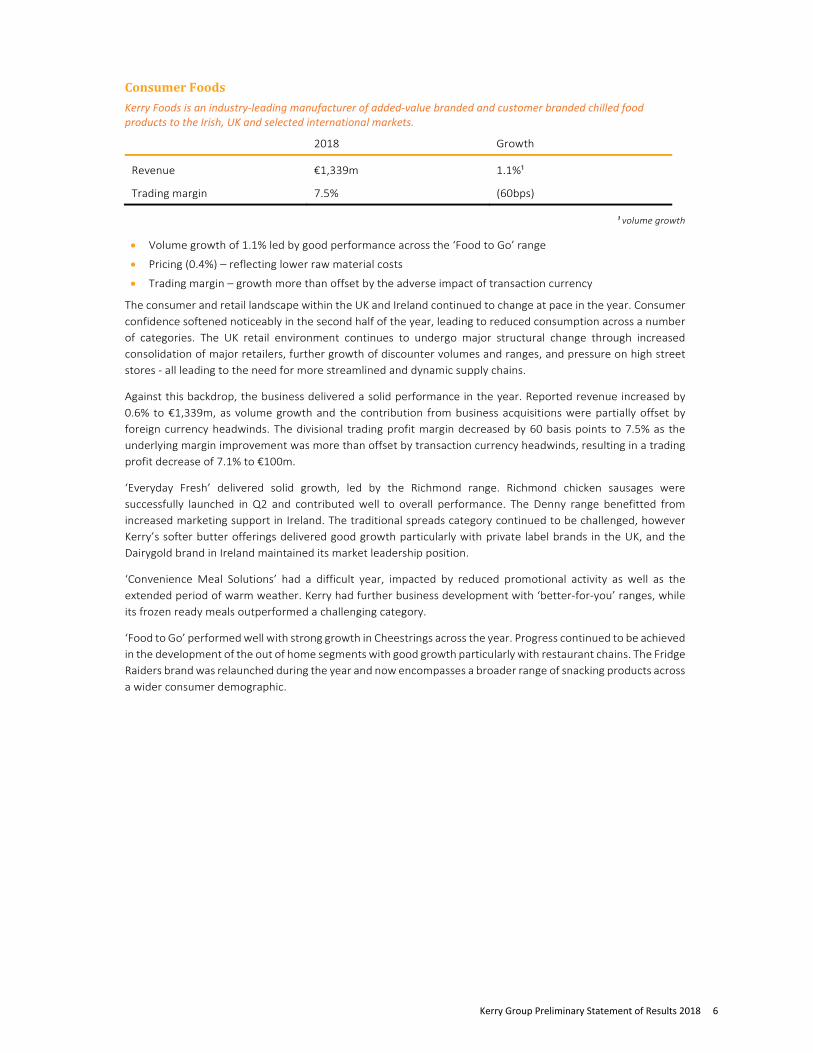
ConsumerFoods
Kerry Foods is an industry‐leading manufacturer of added‐value branded and customer branded chilled food products to the Irish, UK and selected international markets.
2018 Growth
Revenue €1,339m 1.1%¹
Trading margin 7.5% (60bps)
¹ volume growth
Volume growth of 1.1% led by good performance across the ‘Food to Go’ range
Pricing (0.4%) – reflecting lower raw material costs
Trading margin – growth more than offset by the adverse impact of transaction currency
The consumer and retail landscape within the UK and Ireland continued to change at pace in the year. Consumer
confidence softened noticeably in the second half of the year, leading to reduced consumption across a number
of categories. The UK retail environment continues to undergo major structural change through increased
consolidation of major retailers, further growth of discounter volumes and ranges, and pressure on high street
stores ‐ all leading to the need for more streamlined and dynamic supply chains.
Against this backdrop, the business delivered a solid performance in the year. Reported revenue increased by
0.6% to €1,339m, as volume growth and the contribution from business acquisitions were partially offset by
foreign currency headwinds. The divisional trading profit margin decreased by 60 basis points to 7.5% as the
underlying margin improvement was more than offset by transaction currency headwinds, resulting in a trading
profit decrease of 7.1% to €100m.
‘Everyday Fresh’ delivered solid growth, led by the Richmond range. Richmond chicken sausages were
successfully launched in Q2 and contributed well to overall performance. The Denny range benefitted from
increased marketing support in Ireland. The traditional spreads category continued to be challenged, however
Kerry’s softer butter offerings delivered good growth particularly with private label brands in the UK, and the
Dairygold brand in Ireland maintained its market leadership position.
‘Convenience Meal Solutions’ had a difficult year, impacted by reduced promotional activity as well as the
extended period of warm weather. Kerry had further business development with ‘better‐for‐you’ ranges, while
its frozen ready meals outperformed a challenging category.
‘Food to Go’ performed well with strong growth in Cheestrings across the year. Progress continued to be achieved
in the development of the out of home segments with good growth particularly with restaurant chains. The Fridge
Raiders brand was relaunched during the year and now encompasses a broader range of snacking products across
a wider consumer demographic.
Kerry Group Preliminary Statement of Results 2018 6
Financial Review
Reported
% change
2018
€’m
2017
€’m
Revenue 3.1% 6,607.6 6,407.9
Trading profit 3.1% 805.6 781.3
Trading margin 12.2% 12.2%
Computer software amortisation (25.0) (24.3)
Finance costs (net) (67.0) (65.6)
Adjusted earnings before taxation 713.6 691.4
Income taxes (excluding non‐trading items) (89.2) (89.5)
Adjusted earnings after taxation 3.7% 624.4 601.9
Brand related intangible asset amortisation (28.8) (23.6)
Non‐trading items (net of related tax) (55.1) 10.2
Profit after taxation 540.5 588.5
EPS
Cent
EPS
Cent
Basic EPS (8.3%) 305.9 333.6
Brand related intangible asset amortisation 16.3 13.4
Non‐trading items (net of related tax) 31.2 (5.8)
Adjusted* EPS 3.6% 353.4 341.2
Impact of retranslating prior year adjusted earnings per
share at current year average exchange rates ‐ (15.8)
Adjusted* EPS in constant currency 8.6% 353.4 325.4
* Before brand related intangible asset amortisation and non‐trading items (net of related tax)
AnalysisofResults
Revenue
Group reported revenue increased by 3.1% to €6.6 billion (2017: €6.4 billion), including volume growth of 3.5%,
pricing decrease of 0.5% related to raw material deflation passed through to customers, an adverse transaction
currency impact of 0.1%, an adverse translation currency impact of 3.4%, and contribution from business
acquisitions of 3.6%.
FY2017: Group reported revenue +4.5%, volume growth +4.3%, pricing +2.0%, transaction currency (0.2%), translation
currency (2.4%), acquisitions +0.8%.
Taste & Nutrition reported revenue increased by 3.7% to €5.4 billion (2017: €5.2 billion), including volume
growth of 4.1%, pricing decrease of 0.5% related to raw material deflation pass through, an adverse transaction
currency impact of 0.1%, an adverse translation currency impact of 4.0% and contribution from business
acquisitions of 4.2%.
FY2017: Taste & Nutrition reported revenue +5.7%, volume growth +4.7%, pricing +2.0%, translation currency (1.9%),
acquisitions +0.9%.
Kerry Group Preliminary Statement of Results 2018 7
Consumer Foods reported revenue increased by 0.6% to €1.3 billion (2017: €1.3 billion), including volume growth
of 1.1%, pricing decrease of 0.4% related to raw material deflation pass through, an adverse transaction currency
impact of 0.3%, an adverse translation currency impact of 0.6% and contribution from business acquisitions of
0.8%.
FY2017: Consumer Foods reported revenue (0.1%), volume growth +2.4%, pricing +2.0%, transaction currency (0.9%),
translation currency (3.8%), acquisitions +0.2%.
TradingProfit&Margin
Group trading profit increased by 3.1% to €805.6m (2017: €781.3m). Group trading profit margin was maintained
at 12.2%. Underlying margin expansion attributable to operating leverage, portfolio enhancement, efficiencies
and the effect of lower pricing were offset by transaction currency headwinds and increased Kerryconnect
investment due to the rollout in LATAM and planning for North America.
Trading profit margin in Taste & Nutrition increased by 20 bps to 15.1% (2017: 14.9%), due to the benefits of
operating leverage, portfolio enhancement, efficiencies and the effect from lower pricing, partially offset by
foreign currency headwinds. Trading profit margin in Consumer Foods decreased by 60 bps to 7.5% (2017: 8.1%)
due to significant transaction currency headwinds, partly offset by underlying margin expansion of 10 bps.
FinanceCosts(net)
Finance costs (net) for the year increased by €1.4m to €67.0m (2017: €65.6m) as acquisition expenditure was
partially offset by cash generation and a reduction in pension interest. The Group’s average interest rate for the
year was 3.8% (2017: 3.5%).
Taxation
The tax charge for the year before non‐trading items was €89.2m (2017: €89.5m) representing an effective tax
rate of 13.0% (2017: 13.4%). The reduction in the effective tax rate was due to changes in tax rates in a number
of jurisdictions.
Acquisitions&JointVentures
During the year the Group completed 10 acquisitions at a total consideration of €502.2m and an investment in a
joint venture of €15.6m. These investments were aligned to the Group’s strategic priorities for growth, bringing
additional taste and nutritional technologies, expanding our presence in developing markets and adding to our
foodservice offering.
The Group also announced it had reached agreement for two further strategic acquisitions for an expected total
consideration of €325.0m, subject to regulatory approval and customary closing conditions. The acquisition of
Southeastern Mills’ North American coatings and seasonings business (SEM) was completed after the year end.
The Group also expects to complete the acquisition of Ariake USA Inc. – a leading producer of natural clean label
savoury taste solutions by the end of Q2 2019.
Non‐TradingItems
During the year the Group incurred a non‐trading charge of €55.1m (2017: income of €10.2m) net of tax. The
charge in the year related to costs associated with the integration of recent acquisitions and the completion of
the Brexit Currency Mitigation Programme, where good progress was made in reducing the Group’s sterling
transaction exposure. The prior year non‐trading income arose primarily due to the one‐off deferred tax credit
arising from the US tax reform changes.
Kerry Group Preliminary Statement of Results 2018 8
AdjustedEPSinConstantCurrency
Adjusted EPS in constant currency increased by 8.6% in the year (2017: +9.4%). This was achieved through volume
growth ahead of our markets, underlying margin progression, together with the contribution from the effective
integration of acquired businesses. Adjusted EPS increased by 3.6% to 353.4 cent (2017: 341.2 cent) after
reflecting the adverse translation currency impact of 5.0%.
BasicEPS
Basic EPS decreased by 8.3% to 305.9 cent (2017: 333.6 cent) primarily due to the effect in 2017 of a one‐off
deferred tax credit arising from US tax reform changes. Basic EPS is calculated after accounting for brand related
intangible asset amortisation of 16.3 cent (2017: 13.4 cent) and non‐trading item charge of 31.2 cent net of
related tax (2017: net credit of 5.8 cent).
ReturnonAverageCapitalEmployed
The Group achieved ROACE of 12.0% (2017: 13.0%) which was in line with the Group’s strategic target of 12.0%.
The 2018 ROACE was adversely impacted by the timing of investments made in the year and foreign currency
movements.
ExchangeRates
Group results are impacted by fluctuations in exchange rates year‐on‐year versus the euro. The average rates
below are the principal rates used for the translation of results. The closing rates below are used to translate
assets and liabilities at year end.
Average Rates Closing Rates
2018 2017 2018 2017
Australian Dollar 1.58 1.47 1.62 1.53
Brazilian Real 4.34 3.62 4.44 3.96
British Pound Sterling 0.89 0.88 0.90 0.89
Chinese Yuan Renminbi 7.82 7.62 7.85 7.80
Mexican Peso 22.72 21.30 22.50 23.72
US Dollar 1.18 1.13 1.14 1.20
Kerry Group Preliminary Statement of Results 2018 9
BalanceSheet
A summary balance sheet as at 31 December is provided below:
2018
€’m
2017
€’m
Property, plant & equipment 1,767.0 1,529.6
Intangible assets 4,095.6 3,646.7
Other non‐current assets 189.7 192.2
Current assets 2,271.4 2,031.7
Total assets 8,323.7 7,400.2
Current liabilities 1,650.8 1,567.8
Non‐current liabilities 2,638.5 2,259.2
Total liabilities 4,289.3 3,827.0
Net assets 4,034.4 3,573.2
Shareholders’ equity 4,034.4 3,573.2
Property,Plant&Equipment
Property, plant and equipment increased by €237.4m to €1,767.0m (2017: €1,529.6m) primarily due to capital
expenditure in the year offset by depreciation. Net capital expenditure in the year amounted to €285.5m (2017:
€297.3m). This planned level of capital investment supports our growth initiatives, and included expanding our
industry‐leading clean label capability at our facility in Rochester, MI, USA; enhancing our savoury taste centre of
excellence in Clark, NJ, USA; and expanding our facility in Nantong, China.
IntangibleAssets
Intangible assets increased by €448.9m to €4,095.6m (2017: €3,646.7m) as additions of €478.6m primarily
relating to the 10 businesses acquired during the year were partially offset by foreign exchange movements and
the annual amortisation charge.
CurrentAssets
Current assets increased by €239.7m to €2,271.4m (2017: €2,031.7m), primarily due to an increase in cash in hand
at 31 December 2018.
RetirementBenefits
At the balance sheet date, the net deficit for defined benefit schemes (after deferred tax) was €44.0m (2017:
€102.0m). The decrease in the net deficit arises mainly due to favourable movement in discount rates, inflation
rates and the liability management programme. The net deficit expressed as a percentage of market
capitalisation at 31 December 2018 was 0.3% (2017: 0.6%).
Kerry Group Preliminary Statement of Results 2018 10
FreeCashFlow
Free cash flow is an important indicator of the strength and quality of the business and of the availability of funds
to the Group for reinvestment or for return to the shareholder. In 2018 the Group achieved free cash flow of
€446.5m (2017: €501.3m).
Free Cash Flow
2018
€’m
2017
€’m
Trading profit 805.6 781.3
Depreciation (net) 134.1 134.0
Movement in average working capital (57.1) 93.5
Pension contributions paid less pension expense (40.0) (95.3)
Cash flow from operations 842.6 913.5
Finance costs paid (net) (64.5) (60.2)
Income taxes paid (46.1) (54.7)
Purchase of non‐current assets (285.5) (297.3)
Free cash flow 446.5 501.3
Cash conversion¹ 72% 83%
¹ Cash conversion is free cash flow expressed as a percentage of adjusted earnings after tax
NetDebt
Net debt at the end of the year was €1,623.5m (2017: €1,341.7m) reflecting the cash flow generated offset by investment in acquisitions and the dividends paid in the year.
KeyFinancialCovenants
A significant portion of Group financing facilities are subject to financial covenants as set out in their facility
agreements. The Group’s balance sheet is in a healthy position. With a net debt to EBITDA* ratio of 1.7 times,
the organisation has sufficient headroom to support future growth plans. Group Treasury monitors compliance
with all financial covenants and at 31 December the key covenants were as follows:
Covenant
2018
Times
2017
Times
Net debt: EBITDA* Maximum 3.5 1.7 1.4
EBITDA: Net Interest Minimum 4.75 14.7 16.2
*Calculated in accordance with lenders’ facility agreements which take account of adjustments as outlined in Financial Definitions.
SharePriceandMarketCapitalisation
The Company’s shares traded in the range €78.05 to €98.85 during the year. The share price at 31 December
2018 was €86.50 (2017: €93.50) giving a market capitalisation of €15.2 billion (2017: €16.5 billion). Total
Shareholder Return for 2018 was ‐6.8% (2017: +38.6%) reflecting a general decline in global equity markets
during the last quarter in 2018 arising from uncertainties due to global trade and Brexit.
Kerry Group Preliminary Statement of Results 2018 11
AnnualReportandAnnualGeneralMeeting
The Group’s Annual Report will be published at the end of March and the Annual General Meeting will be held in Tralee on 2 May 2019.
FutureProspects
Kerry continues to adapt to the rapidly changing marketplace, investing in and further developing the Kerry
business model to consistently outperform our markets and respond to evolving local consumer trends and
customer requirements through industry leading innovation.
Kerry’s Taste & Nutrition has a strong innovation pipeline with good growth prospects, particularly in developing
markets where the business footprint expansion and successful roll out of the consumer led in‐country approach
continues. Within Consumer Foods we will continue to build on the strategy of realigning the core and investing
in adjacencies, whilst navigating the current uncertain environment.
While there continues to be uncertainty with respect to the outcome of the UK’s exit from the European Union,
Kerry currently anticipates that a managed transition will be the most likely outcome of the negotiations. The
Group has mitigation plans in place to limit the potential short term implications of a ‘no‐deal’ scenario. Kerry
remains cautious on the UK consumer landscape, but is confident it will continue to outperform the market.
The Group will continue to invest in business development and pursue M&A opportunities aligned to strategic
growth priorities.
In 2019 the Group expects to deliver adjusted earnings per share growth of 6% to 10% on a constant currency
basis.
Disclaimer:ForwardLookingStatements
This Announcement contains forward looking statements which reflect management expectations based on currently
available data. However actual results may differ materially from those expressed or implied by these forward looking
statements. These forward looking statements speak only as of the date they were made and the Company undertakes
no obligation to publicly update any forward looking statement, whether as a result of new information, future events
or otherwise.
Kerry Group Preliminary Statement of Results 2018 12
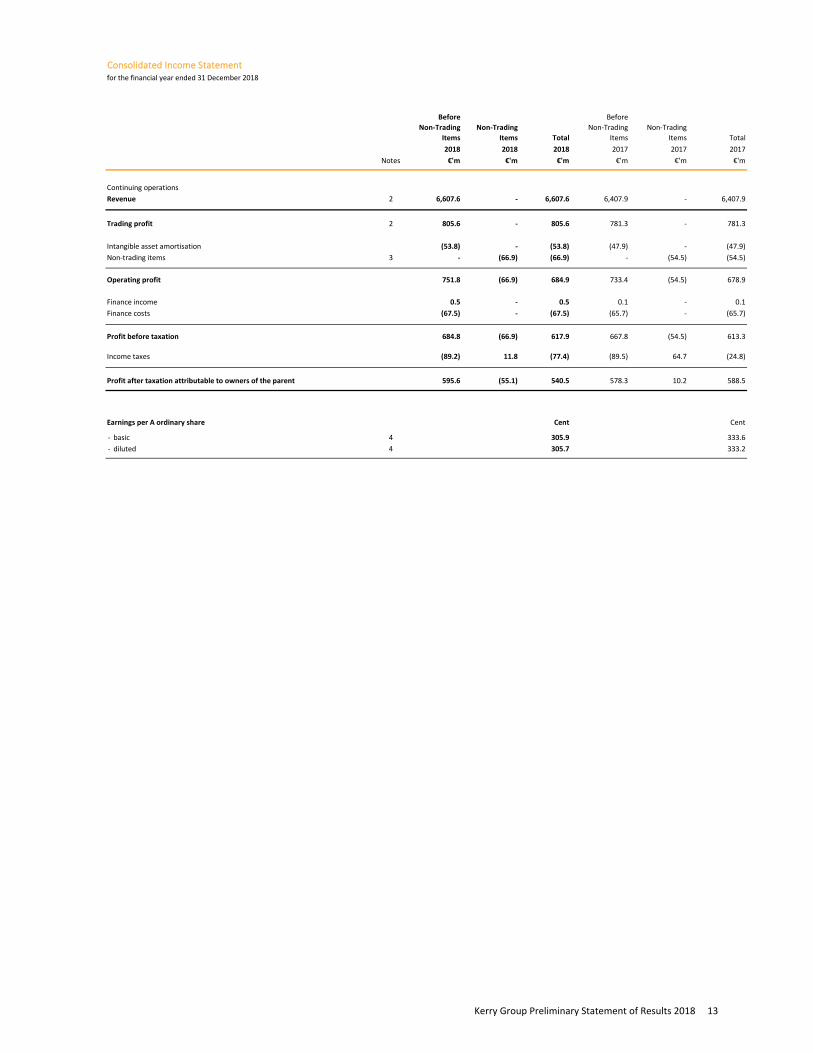
Consolidated Income Statementfor the financial year ended 31 December 2018
Before
Non‐Trading
Items
Non‐Trading
Items Total
Before
Non‐Trading
Items
Non‐Trading
Items Total
2018 2018 2018 2017 2017 2017
Notes €'m €'m €'m €'m €'m €'m
Continuing operations
Revenue 2 6,607.6 ‐ 6,607.6 6,407.9 ‐ 6,407.9
Trading profit 2 805.6 ‐ 805.6 781.3 ‐ 781.3
Intangible asset amortisation (53.8) ‐ (53.8) (47.9) ‐ (47.9)
Non‐trading items 3 ‐ (66.9) (66.9) ‐ (54.5) (54.5)
Operating profit 751.8 (66.9) 684.9 733.4 (54.5) 678.9
Finance income 0.5 ‐ 0.5 0.1 ‐ 0.1
Finance costs (67.5) ‐ (67.5) (65.7) ‐ (65.7)
684.8 (66.9) 617.9 667.8 (54.5) 613.3
Income taxes (89.2) 11.8 (77.4) (89.5) 64.7 (24.8)
595.6 (55.1) 540.5 578.3 10.2 588.5
Earnings per A ordinary share Cent Cent
‐ basic 4 305.9 333.6
‐ diluted 4 305.7 333.2
Profit before taxation
Profit after taxation attributable to owners of the parent
Kerry Group Preliminary Statement of Results 2018 13
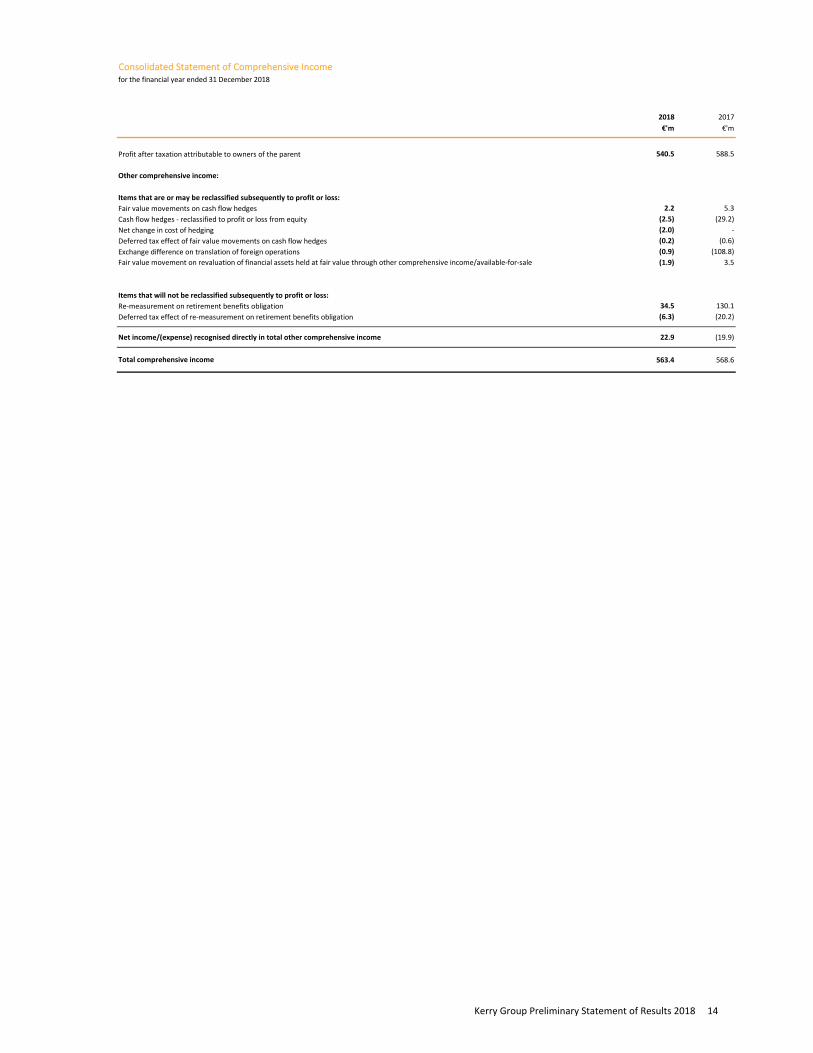
Consolidated Statement of Comprehensive Income for the financial year ended 31 December 2018
2018 2017
€'m €'m
Profit after taxation attributable to owners of the parent 540.5 588.5
Other comprehensive income:
Items that are or may be reclassified subsequently to profit or loss:
Fair value movements on cash flow hedges 2.2 5.3
Cash flow hedges ‐ reclassified to profit or loss from equity (2.5) (29.2)
Net change in cost of hedging (2.0) ‐
Deferred tax effect of fair value movements on cash flow hedges (0.2) (0.6)
Exchange difference on translation of foreign operations (0.9) (108.8)
(1.9) 3.5
Items that will not be reclassified subsequently to profit or loss:
Re‐measurement on retirement benefits obligation 34.5 130.1
Deferred tax effect of re‐measurement on retirement benefits obligation (6.3) (20.2)
Net income/(expense) recognised directly in total other comprehensive income 22.9 (19.9)
563.4 568.6
Fair value movement on revaluation of financial assets held at fair value through other comprehensive income/available‐for‐sale
Total comprehensive income
Kerry Group Preliminary Statement of Results 2018 14
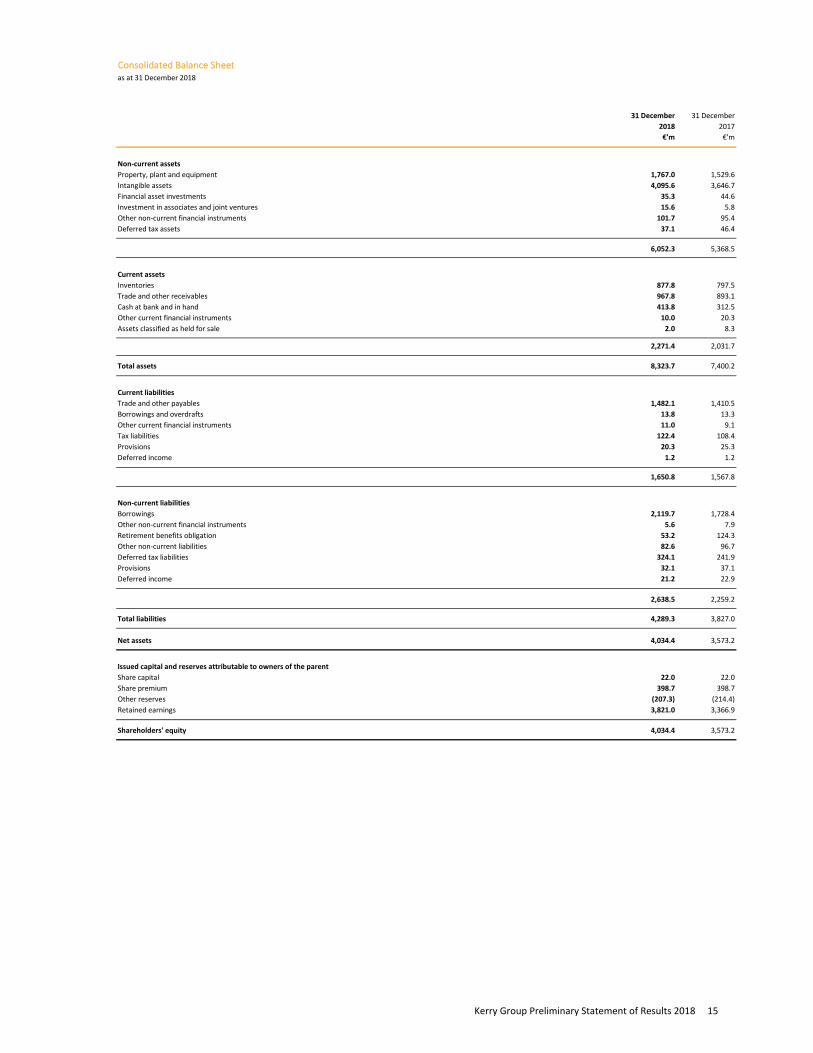
Consolidated Balance Sheetas at 31 December 2018
31 December 31 December
2018 2017
€'m €'m
Non‐current assets
Property, plant and equipment 1,767.0 1,529.6
Intangible assets 4,095.6 3,646.7
Financial asset investments 35.3 44.6
Investment in associates and joint ventures 15.6 5.8
Other non‐current financial instruments 101.7 95.4
Deferred tax assets 37.1 46.4
6,052.3 5,368.5
Current assets
Inventories 877.8 797.5
Trade and other receivables 967.8 893.1
Cash at bank and in hand 413.8 312.5
Other current financial instruments 10.0 20.3
Assets classified as held for sale 2.0 8.3
2,271.4 2,031.7
Total assets 8,323.7 7,400.2
Current liabilities
Trade and other payables 1,482.1 1,410.5
Borrowings and overdrafts 13.8 13.3
Other current financial instruments 11.0 9.1
Tax liabilities 122.4 108.4
Provisions 20.3 25.3
Deferred income 1.2 1.2
1,650.8 1,567.8
Non‐current liabilities
Borrowings 2,119.7 1,728.4
Other non‐current financial instruments 5.6 7.9
Retirement benefits obligation 53.2 124.3
Other non‐current liabilities 82.6 96.7
Deferred tax liabilities 324.1 241.9
Provisions 32.1 37.1
Deferred income 21.2 22.9
2,638.5 2,259.2
Total liabilities 4,289.3 3,827.0
Net assets 4,034.4 3,573.2
Issued capital and reserves attributable to owners of the parent
Share capital 22.0 22.0
Share premium 398.7 398.7
Other reserves (207.3) (214.4)
Retained earnings 3,821.0 3,366.9
Shareholders' equity 4,034.4 3,573.2
Kerry Group Preliminary Statement of Results 2018 15
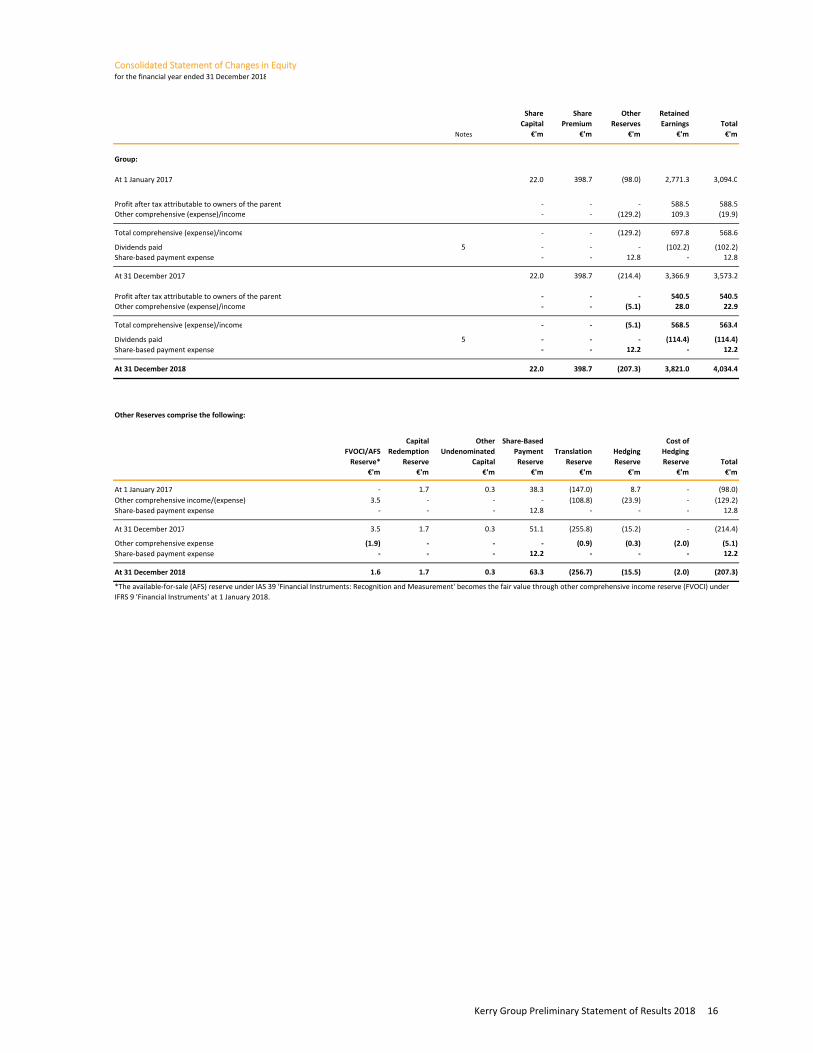
Consolidated Statement of Changes in Equityfor the financial year ended 31 December 2018
Share
Capital
Share
Premium
Other
Reserves
Retained
Earnings Total
Notes €'m €'m €'m €'m €'m
Group:
At 1 January 2017 22.0 398.7 (98.0) 2,771.3 3,094.0
‐ ‐ ‐ 588.5 588.5
Other comprehensive (expense)/income ‐ ‐ (129.2) 109.3 (19.9)
Total comprehensive (expense)/income ‐ ‐ (129.2) 697.8 568.6
Dividends paid 5 ‐ ‐ ‐ (102.2) (102.2)
Share‐based payment expense ‐ ‐ 12.8 ‐ 12.8
At 31 December 2017 22.0 398.7 (214.4) 3,366.9 3,573.2
‐ ‐ ‐ 540.5 540.5
Other comprehensive (expense)/income ‐ ‐ (5.1) 28.0 22.9
Total comprehensive (expense)/income ‐ ‐ (5.1) 568.5 563.4
Dividends paid 5 ‐ ‐ ‐ (114.4) (114.4)
Share‐based payment expense ‐ ‐ 12.2 ‐ 12.2
At 31 December 2018 22.0 398.7 (207.3) 3,821.0 4,034.4
Other Reserves comprise the following:
FVOCI/AFS
Reserve*
Capital
Redemption
Reserve
Other
Undenominated
Capital
Share‐Based
Payment
Reserve
Translation
Reserve
Hedging
Reserve
Cost of
Hedging
Reserve Total
€'m €'m €'m €'m €'m €'m €'m €'m
At 1 January 2017 ‐ 1.7 0.3 38.3 (147.0) 8.7 ‐ (98.0)
Other comprehensive income/(expense) 3.5 ‐ ‐ ‐ (108.8) (23.9) ‐ (129.2)
Share‐based payment expense ‐ ‐ ‐ 12.8 ‐ ‐ ‐ 12.8
At 31 December 2017 3.5 1.7 0.3 51.1 (255.8) (15.2) ‐ (214.4)
Other comprehensive expense (1.9) ‐ ‐ ‐ (0.9) (0.3) (2.0) (5.1)
Share‐based payment expense ‐ ‐ ‐ 12.2 ‐ ‐ ‐ 12.2
At 31 December 2018 1.6 1.7 0.3 63.3 (256.7) (15.5) (2.0) (207.3)
Profit after tax attributable to owners of the parent
Profit after tax attributable to owners of the parent
*The available‐for‐sale (AFS) reserve under IAS 39 'Financial Instruments: Recognition and Measurement' becomes the fair value through other comprehensive income reserve (FVOCI) under
IFRS 9 'Financial Instruments' at 1 January 2018.
Kerry Group Preliminary Statement of Results 2018 16
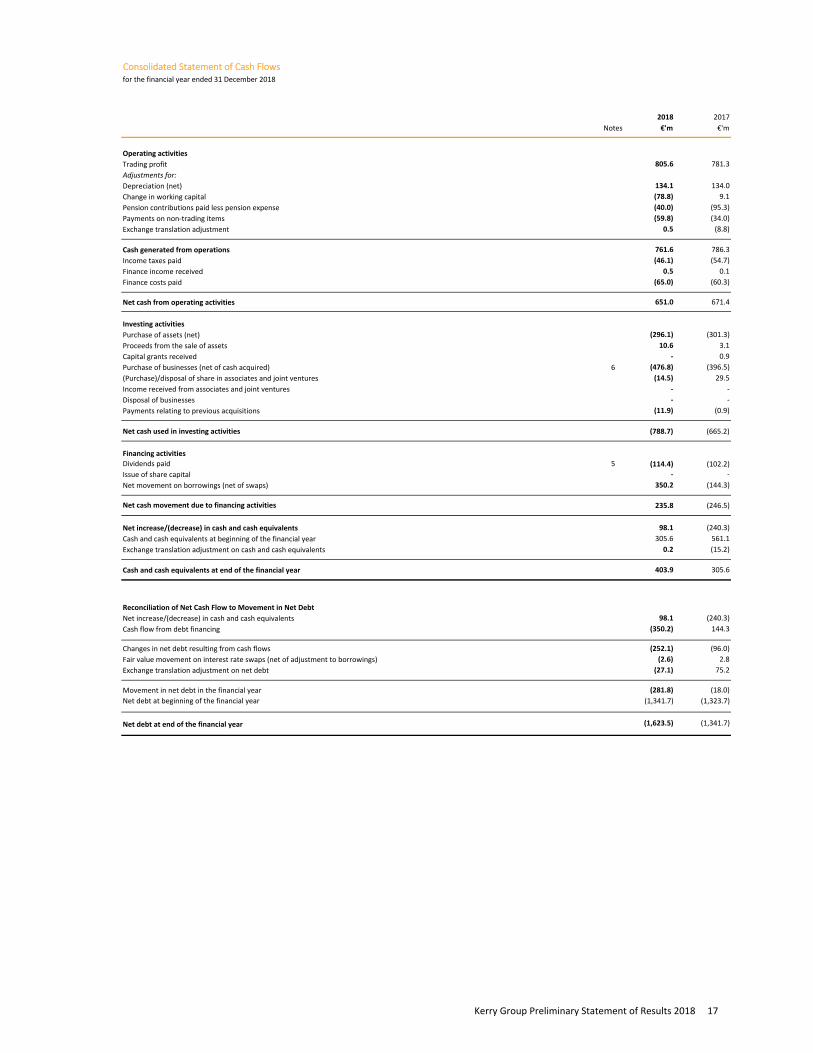
Consolidated Statement of Cash Flows for the financial year ended 31 December 2018
2018 2017
Notes €'m €'m
Operating activities
Trading profit 805.6 781.3
Adjustments for:
Depreciation (net) 134.1 134.0
Change in working capital (78.8) 9.1
Pension contributions paid less pension expense (40.0) (95.3)
Payments on non‐trading items (59.8) (34.0)
Exchange translation adjustment 0.5 (8.8)
Cash generated from operations 761.6 786.3
Income taxes paid (46.1) (54.7)
Finance income received 0.5 0.1
Finance costs paid (65.0) (60.3)
Net cash from operating activities 651.0 671.4
Investing activities
Purchase of assets (net) (296.1) (301.3)
Proceeds from the sale of assets 10.6 3.1
Capital grants received ‐ 0.9
Purchase of businesses (net of cash acquired) 6 (476.8) (396.5)
(Purchase)/disposal of share in associates and joint ventures (14.5) 29.5
Income received from associates and joint ventures ‐ ‐
Disposal of businesses ‐ ‐
Payments relating to previous acquisitions (11.9) (0.9)
Net cash used in investing activities (788.7) (665.2)
Financing activities
Dividends paid 5 (114.4) (102.2)
Issue of share capital ‐ ‐
Net movement on borrowings (net of swaps) 350.2 (144.3)
Net cash movement due to financing activities 235.8 (246.5)
Net increase/(decrease) in cash and cash equivalents 98.1 (240.3)
Cash and cash equivalents at beginning of the financial year 305.6 561.1
Exchange translation adjustment on cash and cash equivalents 0.2 (15.2)
Cash and cash equivalents at end of the financial year 403.9 305.6
Reconciliation of Net Cash Flow to Movement in Net Debt
Net increase/(decrease) in cash and cash equivalents 98.1 (240.3)
Cash flow from debt financing (350.2) 144.3
Changes in net debt resulting from cash flows (252.1) (96.0)
Fair value movement on interest rate swaps (net of adjustment to borrowings) (2.6) 2.8
Exchange translation adjustment on net debt (27.1) 75.2
Movement in net debt in the financial year (281.8) (18.0)
Net debt at beginning of the financial year (1,341.7) (1,323.7)
Net debt at end of the financial year (1,623.5) (1,341.7)
Kerry Group Preliminary Statement of Results 2018 17
Notes to the Financial Statements
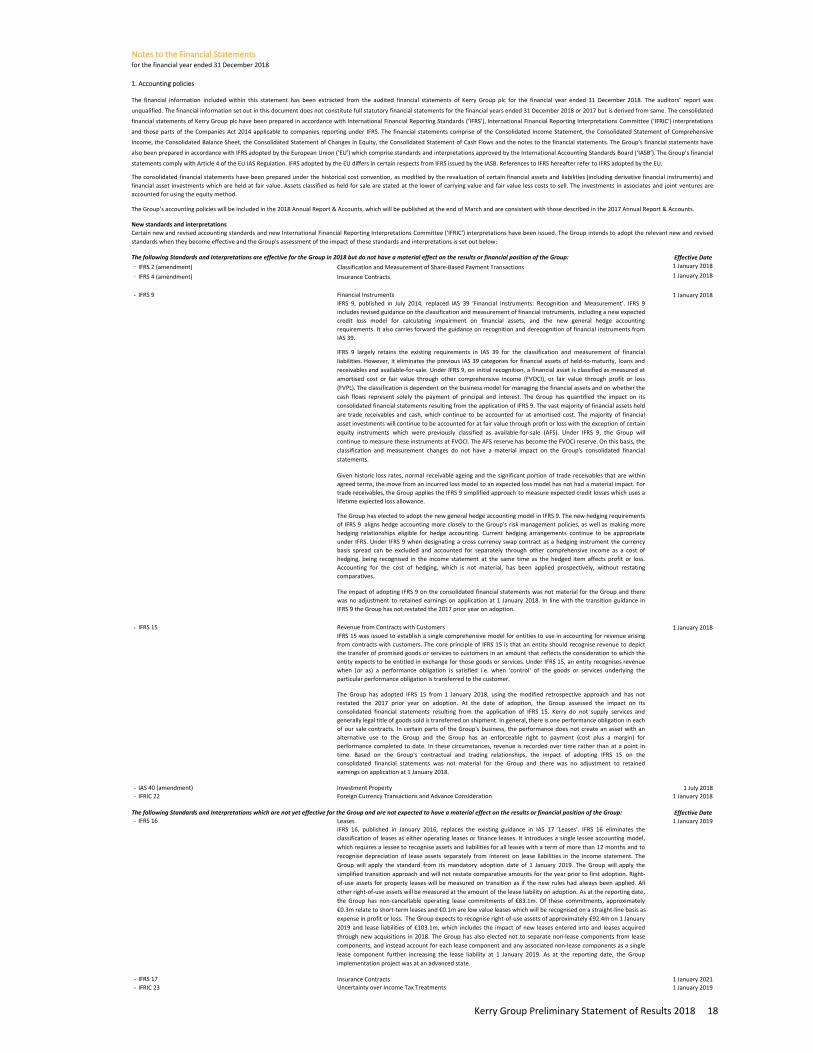
1. Accounting policies
New standards and interpretations
Effective Date
‐ Classification and Measurement of Share‐Based Payment Transactions 1 January 2018
‐ Insurance Contracts 1 January 2018
‐ 1 January 2018
‐ 1 January 2018
‐ IAS 40 (amendment) Investment Property 1 July 2018
‐ IFRIC 22 Foreign Currency Transactions and Advance Consideration 1 January 2018
Effective Date
‐ 1 January 2019
‐ 1 January 2021
‐ IFRIC 23 Uncertainty over Income Tax Treatments 1 January 2019
IFRS 9, published in July 2014, replaced IAS 39 'Financial Instruments: Recognition and Measurement'. IFRS 9
includes revised guidance on the classification and measurement of financial instruments, including a new expected
credit loss model for calculating impairment on financial assets, and the new general hedge accounting
requirements. It also carries forward the guidance on recognition and derecognition of financial instruments from
IAS 39.
Certain new and revised accounting standards and new International Financial Reporting Interpretations Committee ('IFRIC') interpretations have been issued. The Group intends to adopt the relevant new and revised
standards when they become effective and the Group's assessment of the impact of these standards and interpretations is set out below:
for the financial year ended 31 December 2018
The financial information included within this statement has been extracted from the audited financial statements of Kerry Group plc for the financial year ended 31 December 2018. The auditors’ report was
unqualified. The financial information set out in this document does not constitute full statutory financial statements for the financial years ended 31 December 2018 or 2017 but is derived from same. The consolidated
financial statements of Kerry Group plc have been prepared in accordance with International Financial Reporting Standards (‘IFRS’), International Financial Reporting Interpretations Committee (‘IFRIC’) interpretations
and those parts of the Companies Act 2014 applicable to companies reporting under IFRS. The financial statements comprise of the Consolidated Income Statement, the Consolidated Statement of Comprehensive
Income, the Consolidated Balance Sheet, the Consolidated Statement of Changes in Equity, the Consolidated Statement of Cash Flows and the notes to the financial statements. The Group’s financial statements have
also been prepared in accordance with IFRS adopted by the European Union ('EU') which comprise standards and interpretations approved by the International Accounting Standards Board (‘IASB’). The Group’s financial
statements comply with Article 4 of the EU IAS Regulation. IFRS adopted by the EU differs in certain respects from IFRS issued by the IASB. References to IFRS hereafter refer to IFRS adopted by the EU.
The consolidated financial statements have been prepared under the historical cost convention, as modified by the revaluation of certain financial assets and liabilities (including derivative financial instruments) and
financial asset investments which are held at fair value. Assets classified as held for sale are stated at the lower of carrying value and fair value less costs to sell. The investments in associates and joint ventures are
accounted for using the equity method.
The Group’s accounting policies will be included in the 2018 Annual Report & Accounts, which will be published at the end of March and are consistent with those described in the 2017 Annual Report & Accounts.
The following Standards and Interpretations are effective for the Group in 2018 but do not have a material effect on the results or financial position of the Group:
IFRS 2 (amendment)
IFRS 4 (amendment)
IFRS 9 Financial Instruments
IFRS 9 largely retains the existing requirements in IAS 39 for the classification and measurement of financial
liabilities. However, it eliminates the previous IAS 39 categories for financial assets of held‐to‐maturity, loans and
receivables and available‐for‐sale. Under IFRS 9, on initial recognition, a financial asset is classified as measured at
amortised cost or fair value through other comprehensive income (FVOCI), or fair value through profit or loss
(FVPL). The classification is dependent on the business model for managing the financial assets and on whether the
cash flows represent solely the payment of principal and interest. The Group has quantified the impact on its
consolidated financial statements resulting from the application of IFRS 9. The vast majority of financial assets held
are trade receivables and cash, which continue to be accounted for at amortised cost. The majority of financial
asset investments will continue to be accounted for at fair value through profit or loss with the exception of certain
equity instruments which were previously classified as available‐for‐sale (AFS). Under IFRS 9, the Group will
continue to measure these instruments at FVOCI. The AFS reserve has become the FVOCI reserve. On this basis, the
classification and measurement changes do not have a material impact on the Group's consolidated financial
statements.
Given historic loss rates, normal receivable ageing and the significant portion of trade receivables that are within
agreed terms, the move from an incurred loss model to an expected loss model has not had a material impact. For
trade receivables, the Group applies the IFRS 9 simplified approach to measure expected credit losses which uses a
lifetime expected loss allowance.
The Group has elected to adopt the new general hedge accounting model in IFRS 9. The new hedging requirements
of IFRS 9 aligns hedge accounting more closely to the Group's risk management policies, as well as making more
hedging relationships eligible for hedge accounting. Current hedging arrangements continue to be appropriate
under IFRS. Under IFRS 9 when designating a cross currency swap contract as a hedging instrument the currency
basis spread can be excluded and accounted for separately through other comprehensive income as a cost of
hedging, being recognised in the income statement at the same time as the hedged item affects profit or loss.
Accounting for the cost of hedging, which is not material, has been applied prospectively, without restating
comparatives.
The impact of adopting IFRS 9 on the consolidated financial statements was not material for the Group and there
was no adjustment to retained earnings on application at 1 January 2018. In line with the transition guidance in
IFRS 9 the Group has not restated the 2017 prior year on adoption.
IFRS 15 Revenue from Contracts with Customers
IFRS 17 Insurance Contracts
IFRS 15 was issued to establish a single comprehensive model for entities to use in accounting for revenue arising
from contracts with customers. The core principle of IFRS 15 is that an entity should recognise revenue to depict
the transfer of promised goods or services to customers in an amount that reflects the consideration to which the
entity expects to be entitled in exchange for those goods or services. Under IFRS 15, an entity recognises revenue
when (or as) a performance obligation is satisfied i.e. when 'control' of the goods or services underlying the
particular performance obligation is transferred to the customer.
The Group has adopted IFRS 15 from 1 January 2018, using the modified retrospective approach and has not
restated the 2017 prior year on adoption. At the date of adoption, the Group assessed the impact on its
consolidated financial statements resulting from the application of IFRS 15. Kerry do not supply services and
generally legal title of goods sold is transferred on shipment. In general, there is one performance obligation in each
of our sale contracts. In certain parts of the Group's business, the performance does not create an asset with an
alternative use to the Group and the Group has an enforceable right to payment (cost plus a margin) for
performance completed to date. In these circumstances, revenue is recorded over time rather than at a point in
time. Based on the Group's contractual and trading relationships, the impact of adopting IFRS 15 on the
consolidated financial statements was not material for the Group and there was no adjustment to retained
earnings on application at 1 January 2018.
The following Standards and Interpretations which are not yet effective for the Group and are not expected to have a material effect on the results or financial position of the Group:
IFRS 16 Leases
IFRS 16, published in January 2016, replaces the existing guidance in IAS 17 'Leases'. IFRS 16 eliminates the
classification of leases as either operating leases or finance leases. It introduces a single lessee accounting model,
which requires a lessee to recognise assets and liabilities for all leases with a term of more than 12 months and to
recognise depreciation of lease assets separately from interest on lease liabilities in the income statement. The
Group will apply the standard from its mandatory adoption date of 1 January 2019. The Group will apply the
simplified transition approach and will not restate comparative amounts for the year prior to first adoption. Right‐
of‐use assets for property leases will be measured on transition as if the new rules had always been applied. All
other right‐of‐use assets will be measured at the amount of the lease liability on adoption. As at the reporting date,
the Group has non‐cancellable operating lease commitments of €83.1m. Of these commitments, approximately
€0.3m relate to short‐term leases and €0.1m are low value leases which will be recognised on a straight‐line basis as
expense in profit or loss. The Group expects to recognise right‐of‐use assets of approximately €92.4m on 1 January
2019 and lease liabilities of €103.1m, which includes the impact of new leases entered into and leases acquired
through new acquisitions in 2018. The Group has also elected not to separate non‐lease components from lease
components, and instead account for each lease component and any associated non‐lease components as a single
lease component further increasing the lease liability at 1 January 2019. As at the reporting date, the Group
implementation project was at an advanced state.
Kerry Group Preliminary Statement of Results 2018 18
Notes to the Financial Statements
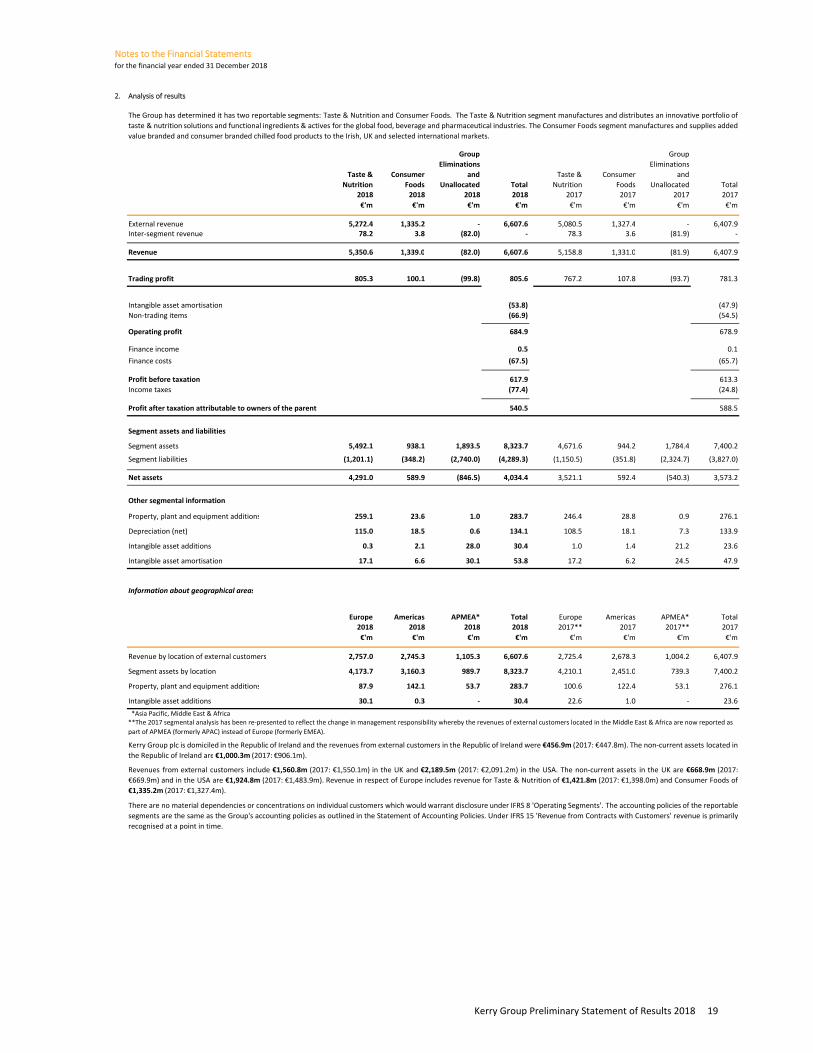
2. Analysis of results
Group Group
Eliminations Eliminations
Taste & Consumer and Taste & Consumer and
Nutrition Foods Unallocated Total Nutrition Foods Unallocated Total
2018 2018 2018 2018 2017 2017 2017 2017
€'m €'m €'m €'m €'m €'m €'m €'m
External revenue 5,272.4 1,335.2 ‐ 6,607.6 5,080.5 1,327.4 ‐ 6,407.9Inter‐segment revenue 78.2 3.8 (82.0) ‐ 78.3 3.6 (81.9) ‐
Revenue 5,350.6 1,339.0 (82.0) 6,607.6 5,158.8 1,331.0 (81.9) 6,407.9
Trading profit 805.3 100.1 (99.8) 805.6 767.2 107.8 (93.7) 781.3
Intangible asset amortisation (53.8) (47.9)
Non‐trading items (66.9) (54.5)
Operating profit 684.9 678.9
Finance income 0.5 0.1
Finance costs (67.5) (65.7)
Profit before taxation 617.9 613.3
Income taxes (77.4) (24.8)
540.5 588.5
Segment assets and liabilities
Segment assets 5,492.1 938.1 1,893.5 8,323.7 4,671.6 944.2 1,784.4 7,400.2
Segment liabilities (1,201.1) (348.2) (2,740.0) (4,289.3) (1,150.5) (351.8) (2,324.7) (3,827.0)
Net assets 4,291.0 589.9 (846.5) 4,034.4 3,521.1 592.4 (540.3) 3,573.2
Other segmental information
Property, plant and equipment additions 259.1 23.6 1.0 283.7 246.4 28.8 0.9 276.1
Depreciation (net) 115.0 18.5 0.6 134.1 108.5 18.1 7.3 133.9
Intangible asset additions 0.3 2.1 28.0 30.4 1.0 1.4 21.2 23.6
Intangible asset amortisation 17.1 6.6 30.1 53.8 17.2 6.2 24.5 47.9
Information about geographical areas
Europe Americas APMEA* Total Europe Americas APMEA* Total
2018 2018 2018 2018 2017** 2017 2017** 2017
€'m €'m €'m €'m €'m €'m €'m €'m
Revenue by location of external customers 2,757.0 2,745.3 1,105.3 6,607.6 2,725.4 2,678.3 1,004.2 6,407.9
Segment assets by location 4,173.7 3,160.3 989.7 8,323.7 4,210.1 2,451.0 739.3 7,400.2
Property, plant and equipment additions 87.9 142.1 53.7 283.7 100.6 122.4 53.1 276.1
Intangible asset additions 30.1 0.3 ‐ 30.4 22.6 1.0 ‐ 23.6
for the financial year ended 31 December 2018
The Group has determined it has two reportable segments: Taste & Nutrition and Consumer Foods. The Taste & Nutrition segment manufactures and distributes an innovative portfolio of
taste & nutrition solutions and functional ingredients & actives for the global food, beverage and pharmaceutical industries. The Consumer Foods segment manufactures and supplies added
value branded and consumer branded chilled food products to the Irish, UK and selected international markets.
Profit after taxation attributable to owners of the parent
*Asia Pacific, Middle East & Africa**The 2017 segmental analysis has been re‐presented to reflect the change in management responsibility whereby the revenues of external customers located in the Middle East & Africa are now reported as
part of APMEA (formerly APAC) instead of Europe (formerly EMEA).
Kerry Group plc is domiciled in the Republic of Ireland and the revenues from external customers in the Republic of Ireland were €456.9m (2017: €447.8m). The non‐current assets located in
the Republic of Ireland are €1,000.3m (2017: €906.1m).
Revenues from external customers include €1,560.8m (2017: €1,550.1m) in the UK and €2,189.5m (2017: €2,091.2m) in the USA. The non‐current assets in the UK are €668.9m (2017:
€669.9m) and in the USA are €1,924.8m (2017: €1,483.9m). Revenue in respect of Europe includes revenue for Taste & Nutrition of €1,421.8m (2017: €1,398.0m) and Consumer Foods of
€1,335.2m (2017: €1,327.4m).
There are no material dependencies or concentrations on individual customers which would warrant disclosure under IFRS 8 'Operating Segments'. The accounting policies of the reportable
segments are the same as the Group's accounting policies as outlined in the Statement of Accounting Policies. Under IFRS 15 'Revenue from Contracts with Customers' revenue is primarily
recognised at a point in time.
Kerry Group Preliminary Statement of Results 2018 19
Notes to the Financial Statementsfor the financial year ended 31 December 2018
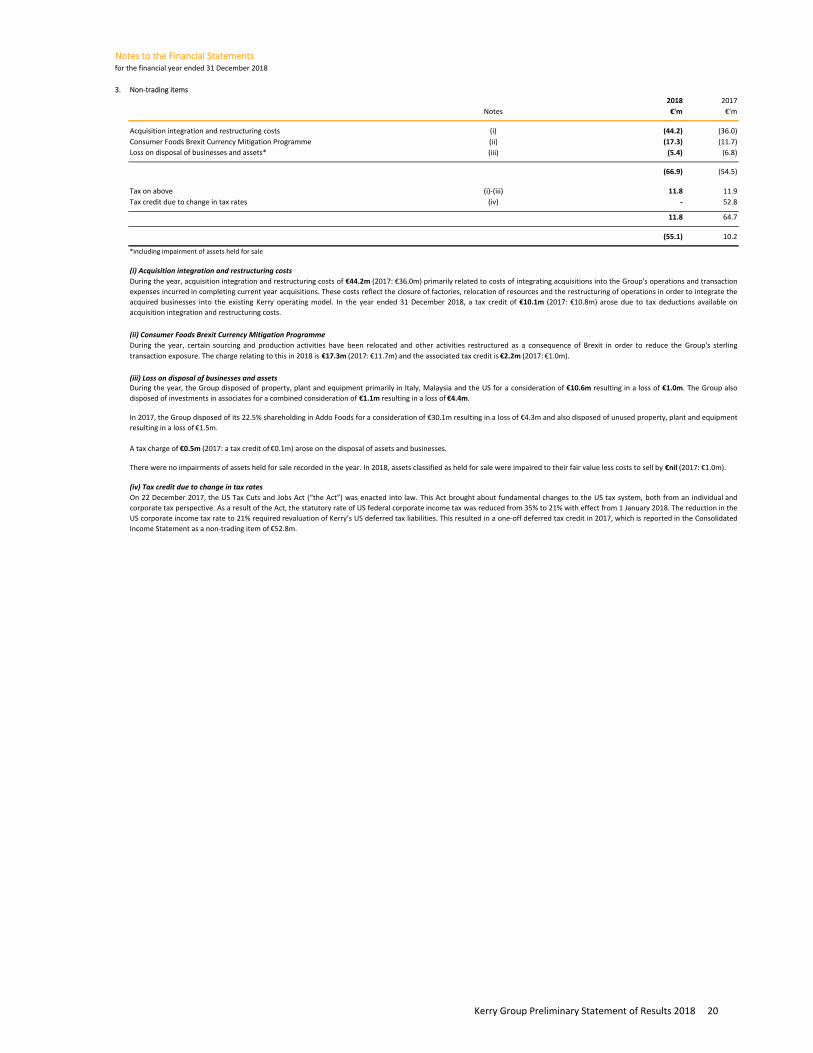
3. Non‐trading items
2018 2017
Notes €'m €'m
Acquisition integration and restructuring costs (i) (44.2) (36.0)
Consumer Foods Brexit Currency Mitigation Programme (ii) (17.3) (11.7)
Loss on disposal of businesses and assets* (iii) (5.4) (6.8)
(66.9) (54.5)
Tax on above (i)‐(iii) 11.8 11.9
Tax credit due to change in tax rates (iv) ‐ 52.8
11.8 64.7
(55.1) 10.2
*including impairment of assets held for sale
(i) Acquisition integration and restructuring costs
(ii) Consumer Foods Brexit Currency Mitigation Programme
(iii) Loss on disposal of businesses and assets
(iv) Tax credit due to change in tax rates
During the year, acquisition integration and restructuring costs of €44.2m (2017: €36.0m) primarily related to costs of integrating acquisitions into the Group's operations and transaction
expenses incurred in completing current year acquisitions. These costs reflect the closure of factories, relocation of resources and the restructuring of operations in order to integrate the
acquired businesses into the existing Kerry operating model. In the year ended 31 December 2018, a tax credit of €10.1m (2017: €10.8m) arose due to tax deductions available on
acquisition integration and restructuring costs.
During the year, certain sourcing and production activities have been relocated and other activities restructured as a consequence of Brexit in order to reduce the Group's sterling
transaction exposure. The charge relating to this in 2018 is €17.3m (2017: €11.7m) and the associated tax credit is €2.2m (2017: €1.0m).
On 22 December 2017, the US Tax Cuts and Jobs Act (“the Act”) was enacted into law. This Act brought about fundamental changes to the US tax system, both from an individual and
corporate tax perspective. As a result of the Act, the statutory rate of US federal corporate income tax was reduced from 35% to 21% with effect from 1 January 2018. The reduction in the
US corporate income tax rate to 21% required revaluation of Kerry’s US deferred tax liabilities. This resulted in a one‐off deferred tax credit in 2017, which is reported in the Consolidated
Income Statement as a non‐trading item of €52.8m.
During the year, the Group disposed of property, plant and equipment primarily in Italy, Malaysia and the US for a consideration of €10.6m resulting in a loss of €1.0m. The Group also
disposed of investments in associates for a combined consideration of €1.1m resulting in a loss of €4.4m.
In 2017, the Group disposed of its 22.5% shareholding in Addo Foods for a consideration of €30.1m resulting in a loss of €4.3m and also disposed of unused property, plant and equipment
resulting in a loss of €1.5m.
A tax charge of €0.5m (2017: a tax credit of €0.1m) arose on the disposal of assets and businesses.
There were no impairments of assets held for sale recorded in the year. In 2018, assets classified as held for sale were impaired to their fair value less costs to sell by €nil (2017: €1.0m).
Kerry Group Preliminary Statement of Results 2018 20
Notes to the Financial Statementsfor the financial year ended 31 December 2018
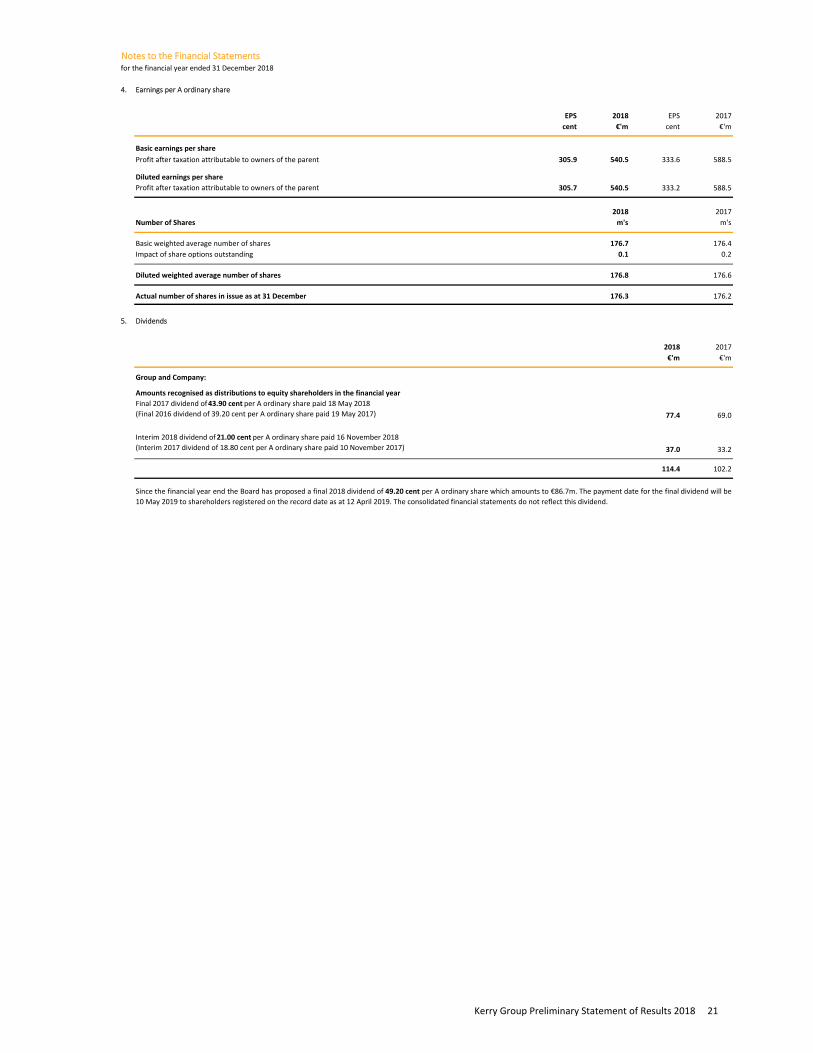
4. Earnings per A ordinary share
EPS 2018 EPS 2017
cent €'m cent €'m
Basic earnings per share
Profit after taxation attributable to owners of the parent 305.9 540.5 333.6 588.5
Diluted earnings per share
Profit after taxation attributable to owners of the parent 305.7 540.5 333.2 588.5
2018 2017
Number of Shares m's m's
Basic weighted average number of shares 176.7 176.4
Impact of share options outstanding 0.1 0.2
Diluted weighted average number of shares 176.8 176.6
Actual number of shares in issue as at 31 December 176.3 176.2
5. Dividends
2018 2017
€'m €'m
Group and Company:
Amounts recognised as distributions to equity shareholders in the financial year
77.4 69.0
37.0 33.2
114.4 102.2
Final 2017 dividend of 43.90 cent per A ordinary share paid 18 May 2018
(Final 2016 dividend of 39.20 cent per A ordinary share paid 19 May 2017)
Interim 2018 dividend of 21.00 cent per A ordinary share paid 16 November 2018
(Interim 2017 dividend of 18.80 cent per A ordinary share paid 10 November 2017)
Since the financial year end the Board has proposed a final 2018 dividend of 49.20 cent per A ordinary share which amounts to €86.7m. The payment date for the final dividend will be
10 May 2019 to shareholders registered on the record date as at 12 April 2019. The consolidated financial statements do not reflect this dividend.
Kerry Group Preliminary Statement of Results 2018 21
Notes to the Financial Statements for the financial year ended 31 December 2018
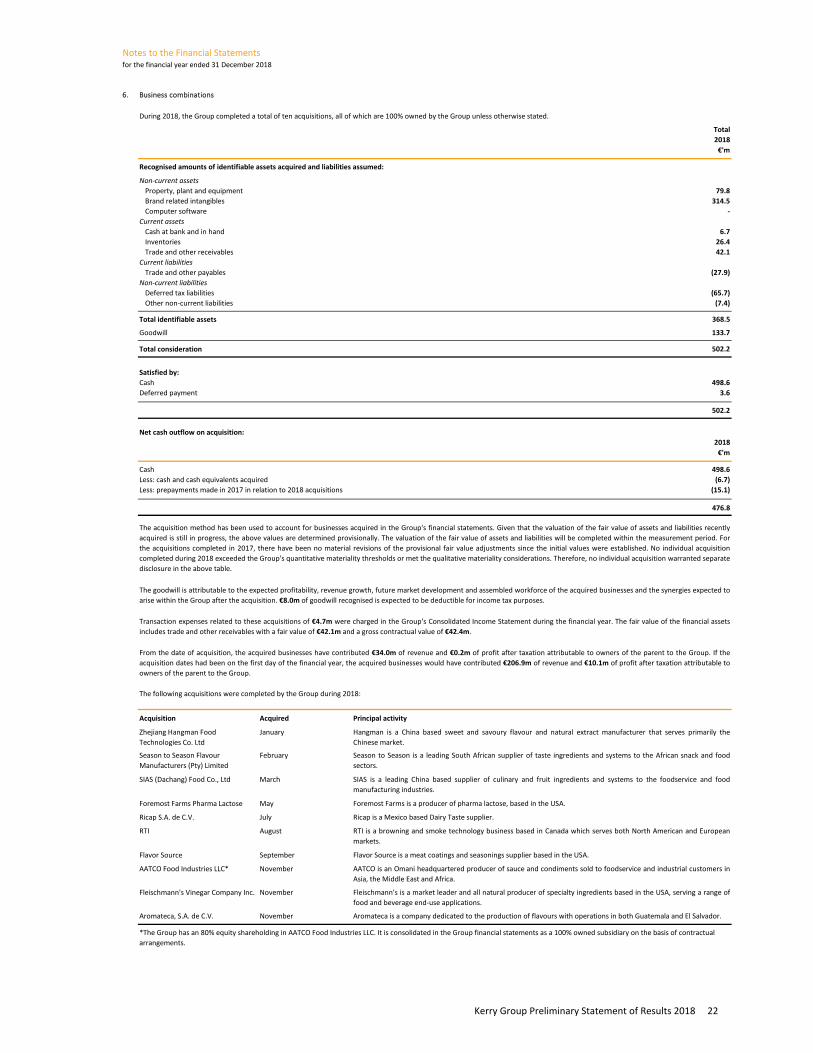
6. Business combinations
Total
2018
€'m
Non‐current assets
Property, plant and equipment 79.8
Brand related intangibles 314.5
Computer software ‐
Current assets
Cash at bank and in hand 6.7
Inventories 26.4
Trade and other receivables 42.1
Current liabilities
Trade and other payables (27.9)
Non‐current liabilities
Deferred tax liabilities (65.7)
Other non‐current liabilities (7.4)
Total identifiable assets 368.5
Goodwill 133.7
Total consideration 502.2
Satisfied by:
Cash 498.6
Deferred payment 3.6
502.2
Net cash outflow on acquisition:
2018
€'m
Cash 498.6
Less: cash and cash equivalents acquired (6.7)
Less: prepayments made in 2017 in relation to 2018 acquisitions (15.1)
476.8
The following acquisitions were completed by the Group during 2018:
Acquisition Acquired
Zhejiang Hangman Food
Technologies Co. Ltd
January
Season to Season Flavour
Manufacturers (Pty) Limited
February
SIAS (Dachang) Food Co., Ltd March
Foremost Farms Pharma Lactose May
Ricap S.A. de C.V. July
RTI August
Flavor Source September
AATCO Food Industries LLC* November
Fleischmann's Vinegar Company Inc. November
Aromateca, S.A. de C.V. November
During 2018, the Group completed a total of ten acquisitions, all of which are 100% owned by the Group unless otherwise stated.
Recognised amounts of identifiable assets acquired and liabilities assumed:
SIAS is a leading China based supplier of culinary and fruit ingredients and systems to the foodservice and food
manufacturing industries.
The acquisition method has been used to account for businesses acquired in the Group's financial statements. Given that the valuation of the fair value of assets and liabilities recently
acquired is still in progress, the above values are determined provisionally. The valuation of the fair value of assets and liabilities will be completed within the measurement period. For
the acquisitions completed in 2017, there have been no material revisions of the provisional fair value adjustments since the initial values were established. No individual acquisition
completed during 2018 exceeded the Group's quantitative materiality thresholds or met the qualitative materiality considerations. Therefore, no individual acquisition warranted separate
disclosure in the above table.
The goodwill is attributable to the expected profitability, revenue growth, future market development and assembled workforce of the acquired businesses and the synergies expected to
arise within the Group after the acquisition. €8.0m of goodwill recognised is expected to be deductible for income tax purposes.
Transaction expenses related to these acquisitions of €4.7m were charged in the Group's Consolidated Income Statement during the financial year. The fair value of the financial assets
includes trade and other receivables with a fair value of €42.1m and a gross contractual value of €42.4m.
From the date of acquisition, the acquired businesses have contributed €34.0m of revenue and €0.2m of profit after taxation attributable to owners of the parent to the Group. If the
acquisition dates had been on the first day of the financial year, the acquired businesses would have contributed €206.9m of revenue and €10.1m of profit after taxation attributable to
owners of the parent to the Group.
Principal activity
Hangman is a China based sweet and savoury flavour and natural extract manufacturer that serves primarily the
Chinese market.
Season to Season is a leading South African supplier of taste ingredients and systems to the African snack and food
sectors.
Aromateca is a company dedicated to the production of flavours with operations in both Guatemala and El Salvador.
*The Group has an 80% equity shareholding in AATCO Food Industries LLC. It is consolidated in the Group financial statements as a 100% owned subsidiary on the basis of contractual
arrangements.
Foremost Farms is a producer of pharma lactose, based in the USA.
Ricap is a Mexico based Dairy Taste supplier.
RTI is a browning and smoke technology business based in Canada which serves both North American and European
markets.
Flavor Source is a meat coatings and seasonings supplier based in the USA.
AATCO is an Omani headquartered producer of sauce and condiments sold to foodservice and industrial customers in
Asia, the Middle East and Africa.
Fleischmann's is a market leader and all natural producer of specialty ingredients based in the USA, serving a range of
food and beverage end‐use applications.
Kerry Group Preliminary Statement of Results 2018 22
Notes to the Financial Statementsfor the financial year ended 31 December 2018
7. Events after the balance sheet date
Since the financial year end, the Group has:
‐
‐ proposed a final dividend of 49.20 cent per A ordinary share (note 5).
8. General information
The statutory financial statements of Kerry Group plc for the financial year ended 31 December 2018 were approved by the Board of Directors and authorised for issue on 18 February 2019 and
will be filed with the Registrar of Companies following the annual general meeting. The statutory financial statements of Kerry Group plc for the financial year ended 31 December 2017, to which
an unqualified audit opinion was received, were annexed to the annual return and filed with the Registrar of Companies.
There have been no other significant events, outside the ordinary course of business, affecting the Group since 31 December 2018.
completed the acquisition of the business and assets of Southeastern Mills, Inc. based in the US. The Group also expects to complete the previously announced acquisition of Ariake U.S.A., Inc.
based in the US in the second quarter of 2019. The combined consideration for these acquisitions is expected to be €325m; and
Kerry Group Preliminary Statement of Results 2018 23
FINANCIAL DEFINITIONS
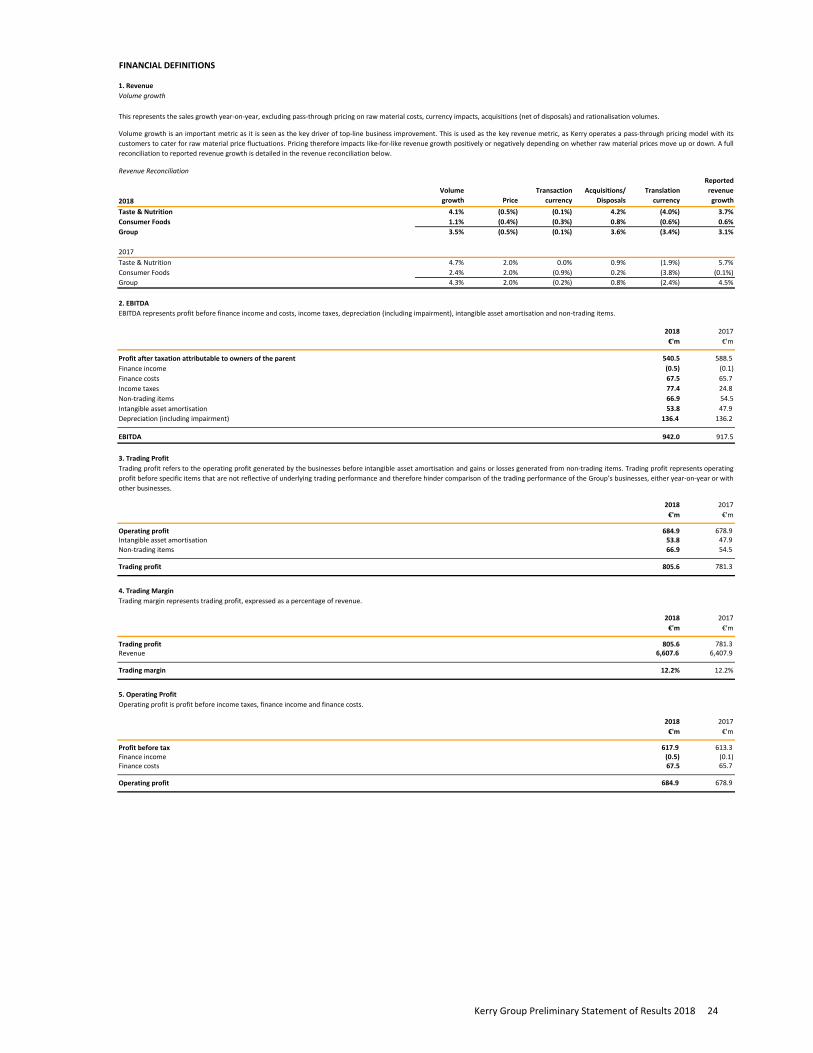
1. Revenue
Volume growth
Revenue Reconciliation
2018
Volume
growth Price
Transaction
currency
Acquisitions/
Disposals
Translation
currency
Reported
revenue
growth
Taste & Nutrition 4.1% (0.5%) (0.1%) 4.2% (4.0%) 3.7%
Consumer Foods 1.1% (0.4%) (0.3%) 0.8% (0.6%) 0.6%
Group 3.5% (0.5%) (0.1%) 3.6% (3.4%) 3.1%
2017
Taste & Nutrition 4.7% 2.0% 0.0% 0.9% (1.9%) 5.7%
Consumer Foods 2.4% 2.0% (0.9%) 0.2% (3.8%) (0.1%)
Group 4.3% 2.0% (0.2%) 0.8% (2.4%) 4.5%
2. EBITDA
2018 2017
€'m €'m
540.5 588.5
(0.5) (0.1)
67.5 65.7
77.4 24.8
66.9 54.5
53.8 47.9
Depreciation (including impairment) 136.4 136.2
EBITDA 942.0 917.5
3. Trading Profit
2018 2017
€'m €'m
Operating profit 684.9 678.9 Intangible asset amortisation 53.8 47.9
Non‐trading items 66.9 54.5
Trading profit 805.6 781.3
4. Trading Margin
2018 2017
€'m €'m
Trading profit 805.6 781.3 Revenue 6,607.6 6,407.9
Trading margin 12.2% 12.2%
5. Operating Profit
2018 2017
€'m €'m
Profit before tax 617.9 613.3 Finance income (0.5) (0.1)Finance costs 67.5 65.7
Operating profit 684.9 678.9
Profit after taxation attributable to owners of the parent
This represents the sales growth year‐on‐year, excluding pass‐through pricing on raw material costs, currency impacts, acquisitions (net of disposals) and rationalisation volumes.
Volume growth is an important metric as it is seen as the key driver of top‐line business improvement. This is used as the key revenue metric, as Kerry operates a pass‐through pricing model with its
customers to cater for raw material price fluctuations. Pricing therefore impacts like‐for‐like revenue growth positively or negatively depending on whether raw material prices move up or down. A full
reconciliation to reported revenue growth is detailed in the revenue reconciliation below.
EBITDA represents profit before finance income and costs, income taxes, depreciation (including impairment), intangible asset amortisation and non‐trading items.
Finance income
Finance costs
Income taxes
Non‐trading items
Intangible asset amortisation
Trading profit refers to the operating profit generated by the businesses before intangible asset amortisation and gains or losses generated from non‐trading items. Trading profit represents operating
profit before specific items that are not reflective of underlying trading performance and therefore hinder comparison of the trading performance of the Group’s businesses, either year‐on‐year or with
other businesses.
Trading margin represents trading profit, expressed as a percentage of revenue.
Operating profit is profit before income taxes, finance income and finance costs.
Kerry Group Preliminary Statement of Results 2018 24
FINANCIAL DEFINITIONS (continued)
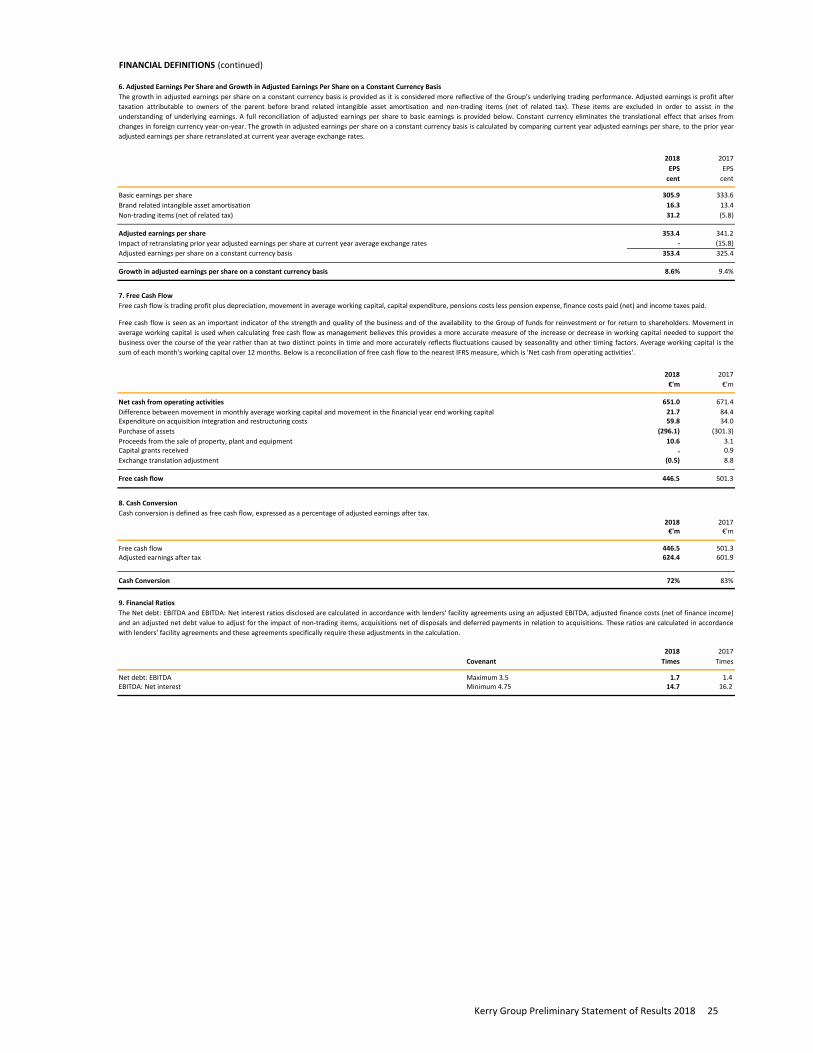
6. Adjusted Earnings Per Share and Growth in Adjusted Earnings Per Share on a Constant Currency Basis
2018 2017
EPS EPS
cent cent
305.9 333.6
Brand related intangible asset amortisation 16.3 13.4
31.2 (5.8)
Adjusted earnings per share 353.4 341.2
Impact of retranslating prior year adjusted earnings per share at current year average exchange rates ‐ (15.8)
Adjusted earnings per share on a constant currency basis 353.4 325.4
Growth in adjusted earnings per share on a constant currency basis 8.6% 9.4%
7. Free Cash Flow
2018 2017
€'m €'m
651.0 671.4
21.7 84.459.8 34.0
(296.1) (301.3)
10.6 3.1
‐ 0.9
(0.5) 8.8
Free cash flow 446.5 501.3
8. Cash Conversion
2018 2017€'m €'m
446.5 501.3624.4 601.9
Cash Conversion 72% 83%
9. Financial Ratios
2018 2017
Covenant Times Times
Net debt: EBITDA Maximum 3.5 1.7 1.4 EBITDA: Net interest Minimum 4.75 14.7 16.2
The growth in adjusted earnings per share on a constant currency basis is provided as it is considered more reflective of the Group’s underlying trading performance. Adjusted earnings is profit after
taxation attributable to owners of the parent before brand related intangible asset amortisation and non‐trading items (net of related tax). These items are excluded in order to assist in the
understanding of underlying earnings. A full reconciliation of adjusted earnings per share to basic earnings is provided below. Constant currency eliminates the translational effect that arises from
changes in foreign currency year‐on‐year. The growth in adjusted earnings per share on a constant currency basis is calculated by comparing current year adjusted earnings per share, to the prior year
adjusted earnings per share retranslated at current year average exchange rates.
Basic earnings per share
Non‐trading items (net of related tax)
Free cash flow is trading profit plus depreciation, movement in average working capital, capital expenditure, pensions costs less pension expense, finance costs paid (net) and income taxes paid.
Free cash flow is seen as an important indicator of the strength and quality of the business and of the availability to the Group of funds for reinvestment or for return to shareholders. Movement in
average working capital is used when calculating free cash flow as management believes this provides a more accurate measure of the increase or decrease in working capital needed to support the
business over the course of the year rather than at two distinct points in time and more accurately reflects fluctuations caused by seasonality and other timing factors. Average working capital is the
sum of each month's working capital over 12 months. Below is a reconciliation of free cash flow to the nearest IFRS measure, which is 'Net cash from operating activities'.
Net cash from operating activities
Difference between movement in monthly average working capital and movement in the financial year end working capitalExpenditure on acquisition integration and restructuring costs
Purchase of assets
Proceeds from the sale of property, plant and equipmentCapital grants received
Exchange translation adjustment
Cash conversion is defined as free cash flow, expressed as a percentage of adjusted earnings after tax.
Free cash flowAdjusted earnings after tax
The Net debt: EBITDA and EBITDA: Net interest ratios disclosed are calculated in accordance with lenders' facility agreements using an adjusted EBITDA, adjusted finance costs (net of finance income)
and an adjusted net debt value to adjust for the impact of non‐trading items, acquisitions net of disposals and deferred payments in relation to acquisitions. These ratios are calculated in accordance
with lenders' facility agreements and these agreements specifically require these adjustments in the calculation.
Kerry Group Preliminary Statement of Results 2018 25
FINANCIAL DEFINITIONS (continued)
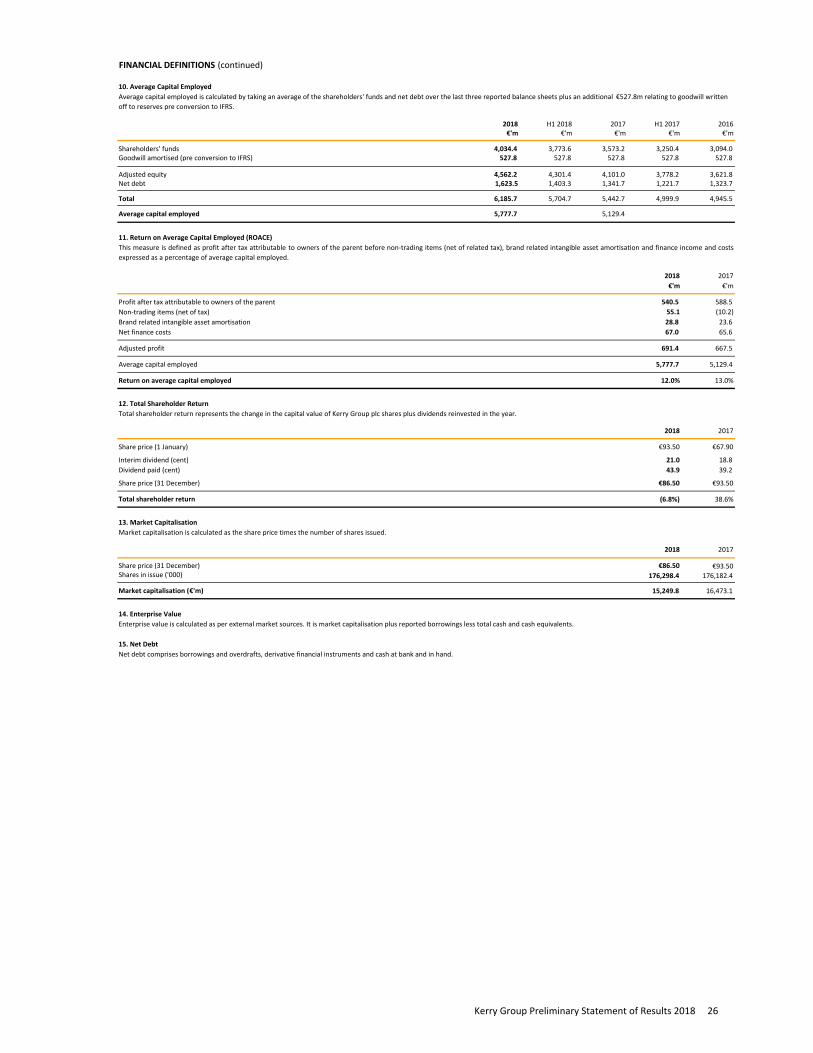
10. Average Capital Employed
2018 H1 2018 2017 H1 2017 2016€'m €'m €'m €'m €'m
Shareholders' funds 4,034.4 3,773.6 3,573.2 3,250.4 3,094.0 Goodwill amortised (pre conversion to IFRS) 527.8 527.8 527.8 527.8 527.8
Adjusted equity 4,562.2 4,301.4 4,101.0 3,778.2 3,621.8 Net debt 1,623.5 1,403.3 1,341.7 1,221.7 1,323.7
Total 6,185.7 5,704.7 5,442.7 4,999.9 4,945.5
Average capital employed 5,777.7 5,129.4
11. Return on Average Capital Employed (ROACE)
2018 2017
€'m €'m
Profit after tax attributable to owners of the parent 540.5 588.5
Non‐trading items (net of tax) 55.1 (10.2)
Brand related intangible asset amortisation 28.8 23.6
Net finance costs 67.0 65.6
Adjusted profit 691.4 667.5
Average capital employed 5,777.7 5,129.4
Return on average capital employed 12.0% 13.0%
12. Total Shareholder Return
2018 2017
Share price (1 January) €93.50 €67.90
Interim dividend (cent) 21.0 18.8
Dividend paid (cent) 43.9 39.2
Share price (31 December) €86.50 €93.50
Total shareholder return (6.8%) 38.6%
13. Market Capitalisation
2018 2017
Share price (31 December) €86.50 €93.50Shares in issue ('000) 176,298.4 176,182.4
Market capitalisation (€'m) 15,249.8 16,473.1
14. Enterprise Value
15. Net Debt
This measure is defined as profit after tax attributable to owners of the parent before non‐trading items (net of related tax), brand related intangible asset amortisation and finance income and costs
expressed as a percentage of average capital employed.
Average capital employed is calculated by taking an average of the shareholders' funds and net debt over the last three reported balance sheets plus an additional €527.8m relating to goodwill written
off to reserves pre conversion to IFRS.
Total shareholder return represents the change in the capital value of Kerry Group plc shares plus dividends reinvested in the year.
Market capitalisation is calculated as the share price times the number of shares issued.
Enterprise value is calculated as per external market sources. It is market capitalisation plus reported borrowings less total cash and cash equivalents.
Net debt comprises borrowings and overdrafts, derivative financial instruments and cash at bank and in hand.
Kerry Group Preliminary Statement of Results 2018 26


Kerry GroupPrince’s StreetTraleeCo. KerryIreland
T:+ 353 66 718 2000F:+ 353 66 718 2961
www.kerrygroup.com
Kerry Group mark