Embed Size (px)
Citation preview
NEWS RELEASE
Tuesday 23 February 2016
Preliminary Statement of Results
for the year ended 31 December 2015
Kerry, the global taste & nutrition and consumer foods group, reports preliminary results
for the year ended 31 December 2015.
Highlights
Adjusted EPS* up 8.2% to 301.9 cent
Group revenue of €6.1 billion reflecting 3.8% business volume growth
Taste & Nutrition €4.7 billion, +4% volume growth
Consumer Foods €1.5 billion, +3% volume growth
Trading profit increased by 10% to €700m
Group trading margin up 40 basis points to 11.5%
Taste & Nutrition +40 basis points to 14.1%
Consumer Foods +20 basis points to 8.5%
Final dividend per share of 35 cent (Total 2015 dividend up 11.1% to 50 cent)
Free cash flow of €453m (2014: €303m)
Industry-leading RD&A investment
*before brand related intangible asset amortisation and non-trading items (net of related tax)
Commenting on the results Kerry Group Chief Executive Stan McCarthy said; “In a record year of
business development in 2015, the Group achieved a strong financial performance, delivering
continued business margin expansion and 8.2% growth in adjusted earnings per share. Our industry-
leading technologies are well positioned to meet today’s consumer and customer requirements. We
expect to achieve 6% to 10% growth in adjusted earnings per share in 2016 taking into account a
3% currency headwind at today’s exchange rates”.
Contacts:
Media
Frank Hayes, Director of Corporate Affairs
Tel: +353 66 718 2304
Email: [email protected]
Kerry Web Site: www.kerrygroup.com
Investor Relations
Brian Mehigan, Chief Financial Officer
Ronan Deasy, Group Financial Controller
William Lynch, Head of Investor Relations
Tel: +353 66 718 2253
Email: [email protected]
1

PRELIMINARY STATEMENT OF RESULTS
for the year ended 31 December 2015
Kerry Group achieved a strong financial performance coupled with solid business development in all
our core business areas and markets in 2015. In a challenging year marked by regional variation in
economic growth, geopolitical instability, and significant commodity and currency volatility, global
and regional food and beverage providers also continued to address the changing marketplace
arising from consumer shopping patterns and channel dynamics. The ‘new connected consumer’
increasingly demands on-trend food & beverage experience at retail and foodservice level -
accelerating the requirement for innovation and speed to market. In addition health, wellness,
nutrition and convenience are key differentiators across all end-use-markets – providing strong
opportunities for growth through Kerry’s unique Taste & Nutrition technology portfolio.
While economic conditions continued to improve in most regional developed markets – consumer
demand remained weak. Developing markets overall exhibited slower economic growth, with many
regional markets impacted by intensified geopolitical activity and significant currency movement.
However Kerry continued to achieve good volume growth through its Taste & Nutrition technologies
and systems in all regions. In a record year of acquisition investment, the Group also continued to
consolidate Kerry’s leading global infrastructure and expand its technology and market footprint for
future growth.
Kerry Foods performed well, benefiting from the improved economic conditions in the UK and Irish
markets and growing consumer demand for snacking and convenience offerings. The restructured
Kerry Foods’ portfolio is well positioned to meet consumer requirements across all channels including
the fast growing food-to-go sector and e-commerce channels.
RESULTS
Group businesses continued to outperform market growth rates in 2015. Sales revenue on a reported
basis increased by 6.1% to €6.1 billion. Business volumes progressively improved during the year
delivering 3.8% year-on-year growth. This performance reflected continued strong market
development in American markets, an improved performance in the EMEA region and good growth
in Asia despite lower economic growth in some regional developing markets. Pricing declined by
2.2% against a background of approximately 4.5% lower raw material costs. Currency movements
contributed a positive 6.9% translation impact to revenue.
Taste & Nutrition achieved 4% growth in business volumes and pricing was 2.3% lower. Kerry Foods’
business volumes grew by 3% and pricing reduced by 1.9%.
Group trading performance was again assisted by 1 Kerry efficiency programmes, improved product
mix and the repositioned Kerry Foods business portfolio. Group trading profit increased by 10% to
€700m. The Group trading profit margin increased by 40 basis points to 11.5%, reflecting a 40 basis
points improvement in Taste & Nutrition to 14.1% and a 20 basis points improvement in Kerry Foods’
margin to 8.5%.
2

Basic earnings per share increased by 9.4% to 298.7 cent. Adjusted earnings per share increased
by 8.2% to 301.9 cent (2014: 278.9 cent). The Board recommends a final dividend of 35 cent per
share, an increase of 11.1% on the 2014 final dividend. Together with the interim dividend of 15
cent per share, this brings the total dividend for the year to 50 cent, an increase of 11.1% on 2014.
Expenditure on research and development in 2015 increased to €234m (2014: €197m). Net capital
expenditure amounted to €229m (2014: €257m). The Group achieved a free cash flow of €453m
(2014: €303m).
BUSINESS REVIEWS
TASTE & NUTRITION
2015 Growth
Revenue €4,716m 4%*
Trading profit €663m +11.9%
Trading margin 14.1% +40bps
*volume growth
Kerry provides the largest, most innovative portfolio of Taste & Nutrition Technologies and Systems,
and Functional Ingredients & Actives for the global food, beverage and pharmaceutical industries.
The changing marketplace continues to drive a strong pipeline of innovation and demand for Kerry’s
Taste & Nutrition Technologies and Systems. Solid market development was achieved in all regions
as the Group’s global and regional customers addressed consumer demand for ‘better-for-you’,
natural, authentic taste, ‘free-from’, ‘clean-label’, convenience products. Developed market
conditions remain challenging as food and beverage providers compete to meet changing consumer
lifestyles, shopping behaviours, and retail / foodservice channel requirements. Regional developing
markets continue to be impacted by slower economic growth, significant currency movements and
geopolitical issues. Against this background, Kerry’s Taste & Nutritional technology portfolio and
Global Technology & Innovation Centre network was to the fore in product development and
innovation through the Group’s commercial alliances.
Reported revenue increased by 8.7% to €4.7 billion, reflecting 4% business volume growth and
2.3% lower net pricing. Trading profit grew by 11.9% to €663m reflecting a 40 basis points increase
in divisional trading margin to 14.1%. In 2015, Taste & Nutrition accounted for 76% of Group
revenue and 84% of Group trading profit.
Americas Region
Combining Kerry’s taste capability with the Group’s unique Nutrition & General Wellness enabling
technology portfolio delivered good growth throughout American food and beverage markets in
2015. Whilst sectoral industry issues impacted overall development in some traditional retail food
categories, demand for innovation accelerated in particular in wellness, nutrition and snacking
categories, and to meet ‘eating-out-of-home’ market requirements. Development in Latin American
3
markets was impacted by significant currency devaluation particularly in Brazil which impacted ‘out-
of-home’ food consumption, but Kerry maintained satisfactory business development in Mexico,
Central America and the Andean region. The Group’s recent acquisitions assisted growth in Brazil
despite the prevailing macro-economic conditions.
Sales revenue in the Americas region increased by 21.4% on a reported basis to €2,308m, reflecting
4.1% volume growth and 1.9% lower pricing.
Americas region market development was boosted in 2015 through completion of a number of
strategic acquisitions. Kerry achieved solid growth in the North American meat sector and across
American foodservice channels through successful deployment of Kerry taste technologies and
‘clean-label’ systems. The breakfast meats sector provided good growth opportunities at retail and
foodservice level, and meat snacking continued to grow across all channels. Kerry coatings,
seasonings, fermented ingredient systems and smoke/grill technologies achieved strong growth
based on such trends. KFI Savory, the U.S. based savoury flavour business of Kraft Food Ingredients
acquired in June 2015, performed in line with expectations. Wynnstarr Flavors assisted performance
in the North American culinary sector and recent acquisitions assisted growth in the Brazilian
foodservice sector despite the challenging macro-economic conditions. Central American markets
presented good growth opportunities. Baltimore Spice, a Costa Rican based spices, seasonings and
condiments producer with production facilities located in Costa Rica, Guatemala and
Panama acquired in July, significantly strengthened Kerry’s market positioning in the culinary and
snack sectors in Central America and the Caribbean.
The acquisition of Red Arrow Products was completed in December significantly strengthening
Kerry’s taste technology and savoury flavour industry leadership. Operating from manufacturing
facilities in Wisconsin, supported by Application & Development Centres in Germany and Sweden,
Red Arrow is a leading supplier of natural smoke flavours and authentic savoury grill flavours serving
meat, culinary and food industry markets worldwide.
The snack bar and bagged snacks categories continued to provide good opportunities for Kerry
innovation including application of organic certified seasonings. Savoury snack applications achieved
strong growth in Mexico and Central America. Development in the bakery sector was driven by
increased consumer demand for ‘free-from’, ‘clean-label’, convenience and tasteful products,
enabling Kerry to record solid growth through its Taste & Nutrition technologies and gluten-free,
organic and non-GMO lines.
Trends in international dairy markets limited development through dairy and culinary systems.
However Kerry saw breakthrough innovation in the ice-cream sector through its proprietary ‘Rapid
Fire’ development process, and through smoothie and yoghurt applications. Kerry continued to invest
in the expansion and broadening of its beverage solutions technologies and to consolidate the
Group’s industry-leading positioning as provider of the broadest portfolio of beverage solutions.
Taste and lower calorie trends provided strong innovation opportunities in soft drinks, coffee and
nutritional beverages. The fast growing ‘single serve’ market led to increased applications in the hot
beverage, soup, broth and sauce markets. Kerry’s Big Train, DaVinci Gourmet and Oregon Chai
brands benefited from growing consumption of ‘out-of-home’ beverages through c-stores and
4
specialist outlets. Extension of the Big Train range to Kerry’s branded offering in Latin American
markets achieved good results. Insight Beverages, a leading U.S. based supplier of custom beverage
solutions to foodservice and convenience store channels in North American markets, acquired in
May, performed in line with expectations. In September the Group also acquired Island Oasis a
category leading provider of all-natural premium cocktail mixes and customised beverage solutions
serving ‘on-premise’, restaurant, leisure and hospitality segments of the U.S. market. Distributed
and marketed though national and regional chains, QSR’s and independents; the Island Oasis
portfolio includes innovative frozen and shelf-stable fruit purées, coffee blends, performance
nutrition beverage systems and customised ‘on-premise’ beverage equipment. Headquartered in
Walpole (MA), the business operates from manufacturing facilities in Byesville (OH) and Buffalo (NY).
Pharma ingredients continued to achieve good growth throughout excipient and cell nutrition
applications across Kerry’s global markets. Kerry saw increased success in 2015 through the Group’s
custom-developed complex media systems in cell nutrition. In September the Group acquired
Biothera Inc.’s Wellmune® business which produces and markets the unique Wellmune® branded
natural food, beverage and supplement ingredient clinically proven to strengthen the immune
system – improving health and wellness. Kosher, Halal, non-allergenic, GMO-free, gluten-free and
‘Informed Sport’ certified, Wellmune® is formulated in a growing number of food, beverage and
supplement products in more than fifty countries throughout the world.
EMEA Region
European economies continued to recover in 2015 but the overall deflationary environment
continued to heighten competitiveness in food and beverage markets. Geopolitical instability
continued to constrain development in regional developing markets. Kerry’s performance throughout
the region improved in 2015 with good growth reported in the second half of the year. Nutrition and
general wellness trends continued to drive development and innovation in EMEA food and beverage
markets with an increased focus on sodium, calorie and fat reduction coupled with continued growth
in demand for convenient food and beverage solutions. Establishment of the Group’s Global
Technology & Innovation Centre in Ireland mid-year, supported by Kerry Development & Application
Centres in Moscow, Dubai and Durban has led to a significant increase in customer engagement and
innovation. Business volumes in 2015 increased by 0.9% and with lower raw material pricing, in
particular dairy, overall net pricing reduced by 2.9%. This resulted in reported revenue of €1,546m
similar to the prior year level.
Kerry dairy taste technologies and systems continued to progress development in the bakery,
processed cheese and spread sectors. While dairy and culinary technologies were impacted by
sectoral competiveness issues, Kerry recorded good growth and market development in the
foodservice channel. Snacking trends provided good growth opportunities in the appetizers market.
Demand for clean-label remains the primary driver of innovation in a comparatively flat bakery
market providing increased opportunity for Kerry fermentation technology. Competitiveness in the
European meat industry accelerated the requirement for more differentiated offerings including
improved taste, functionality and nutritional solutions.
5

Kerry continued to extend its beverage and sweet taste technologies in the EMEA region into wider
market sectors including the coffee segment, dairy beverages, nutritional drinks and ‘beyond
carbonates’. Good growth was achieved through Kerry’s natural extracts range and through water
and coffee enhancers. Functional beverages exhibited good growth and the energy drinks, RTD teas
and coffee segments provided solid opportunities for innovation. Beverage systems maintained
strong growth, in particular in the foodservice channel through Kerry’s branded ‘Big Train’ and
‘DaVinci Gourmet’ products.
The MENAT sub-region delivered encouraging growth through beverage applications and snacks.
Turkey based PST Pastacilik Gida, a branded provider of sweet ingredient solutions to the fine
bakery, confectionery, ice cream and foodservice sectors in Turkey and the Middle East, was acquired
in July. Market conditions in Sub-Saharan Africa remained highly competitive. In South Africa, an
increased focus on sodium reduction has generated innovation opportunities in the bakery, snacks
and meat sectors. The brewing industry in Africa saw good growth where Kerry achieved solid growth
through its beverage taste technologies. Industry development in Russia continues to be impacted
by the political and economic situation. While new product development remains on hold, Kerry
continued to assist its Russian customers in recipe optimisation and production processes.
The European primary dairy sector has operated under extremely challenging conditions in 2015 as
a substantial increase in output in exporting countries and a slowdown in import demand led to a
significant fall in prices along the EU dairy supply chain.
The Group’s Europe based nutritional technologies continued to advance applications across all life-
stage end-use-markets in particular in the Asian infant nutrition sector. Ongoing investment at
Kerry’s facilities in Ireland has significantly expanded production and packaging capability to meet
customer nutritional product applications. Demand for hydrolysed proteins for clinical and infant
nutrition continues to grow. Enzymes delivered good growth in the bakery, beverage and nutritional
sectors. The recently established Global Technology & Innovation Centre in Ireland also includes
Kerry’s Global Centre of Excellence for Nutrition. The Centre, which also hosts Kerry’s Nutrition
Discovery Centre, is the focal point for the Group’s commercial, technical, nutritional science and
strategic marketing teams and the Global Centre for Kerry customer engagement on nutrition and
general wellness. In 2015 the Kerry Health and Nutrition Institute supported by a Scientific Advisory
Council was also launched to bring industry–leading insight to the science and policy of health, taste,
nutrition and general wellness.
Asia-Pacific Region
Kerry continued to successfully establish and consolidate a world-class operational and market
development footprint throughout the Asia-Pacific region in 2015 – notwithstanding the slowdown
in economic growth and currency movements in regional developing markets. Business performance
remained robust throughout the region with an accelerated growth level in Q4. Localisation of taste
is critical to success in individual markets which increased the demand for innovation and speed of
launch. Demand for balanced life-stage nutrition, healthy snacking, convenient tasteful beverage
applications and customised foodservice solutions continues to reflect strong growth. Regional
business volumes grew by 10.1%. Revenues reported at €784m reflected the business volume
6
growth, 2.1% lower pricing, currency movements and the impact of the sale of the Pinnacle Lifestyle
bakery business in Australia completed in May.
Dairy Taste technologies continued to achieve strong growth in particular through cheese and butter
systems in Indonesia, Vietnam, China and the Philippines. Snacking trends provided strong
innovation opportunities for Kerry culinary applications in South East Asia. Completion of the new
sauce systems production plant at Kerry’s Plentong facility in Malaysia facilitated continued growth
through premium sauce systems in Malaysia and China. Interest in Kerry’s ‘clean-label’ technologies
is growing in the region and achieved encouraging development progress in the meat and bakery
sectors in Australia and New Zealand.
Demand for protein enriched foods and enhanced nutritional values across all the life-stages
continues to grow in Asia. Nutritional beverage applications led to increased demand for Kerry
hydrolysed proteins particularly in clinical and infant nutrition. Functional hydrolysates also grew
sales in the confectionery markets in India and Indonesia. Demand for premium quality infant
nutrition products in China continues to provide excellent opportunities for growth through Kerry
nutritional technologies and systems. Phase 1 of a major investment programme at the Group’s
Nantong, China production facility was completed in 2015. The Group’s recently acquired ‘Wellmune’
immune-health ingredient continues to grow applications in Asia – in particular in China where
results from a recently completed clinical study added to the growing body of clinical evidence of
Wellmune’s ability to strengthen the immune system of children.
Beverage taste technologies and systems recorded strong growth – in particular in the foodservice
sector throughout Asia-Pacific markets. Kerry’s branded beverage offerings including DaVinci, Café
D’Amore and Big Train are successfully extending market reach into wider geographic markets and
channels – including c-stores. Solid market development continues to be achieved in India through
beverage flavours, emulsifiers, texturants and meat systems.
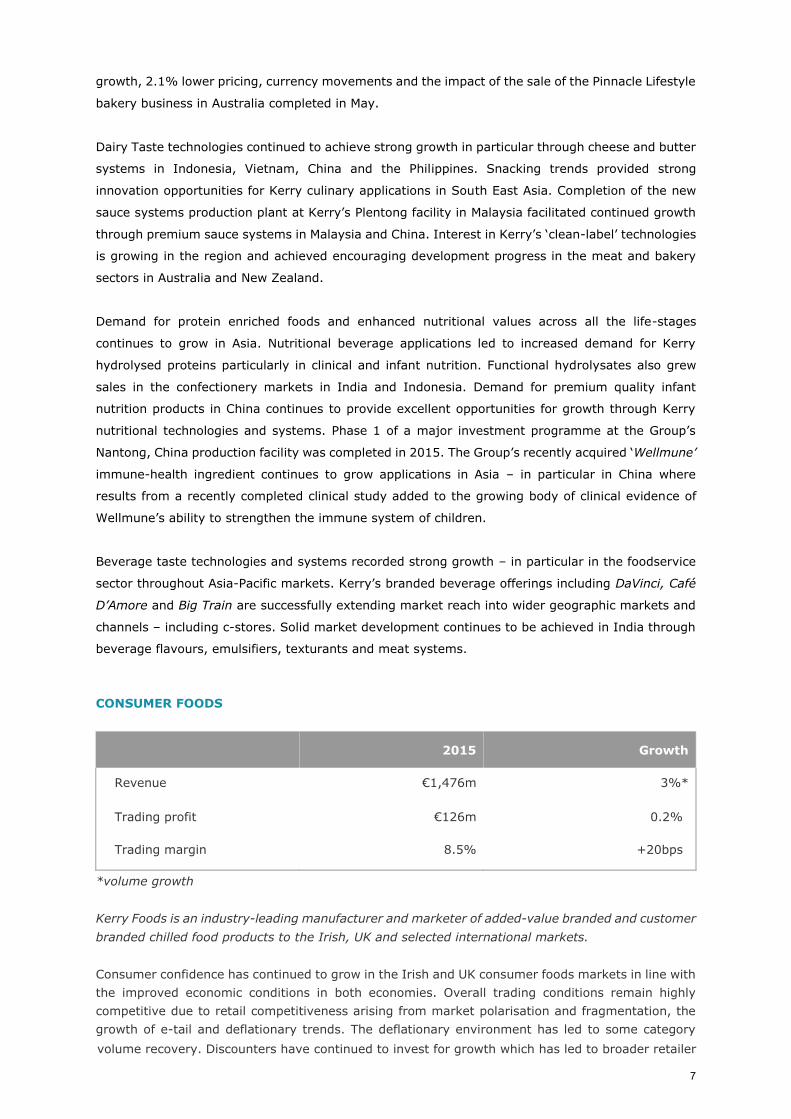
CONSUMER FOODS
2015 Growth
Revenue €1,476m 3%*
Trading profit €126m 0.2%
Trading margin 8.5% +20bps
*volume growth
Kerry Foods is an industry-leading manufacturer and marketer of added-value branded and customer
branded chilled food products to the Irish, UK and selected international markets.
Consumer confidence has continued to grow in the Irish and UK consumer foods markets in line with
the improved economic conditions in both economies. Overall trading conditions remain highly
competitive due to retail competitiveness arising from market polarisation and fragmentation, the
growth of e-tail and deflationary trends. The deflationary environment has led to some category
volume recovery. Discounters have continued to invest for growth which has led to broader retailer
7
focus on EDLP. Changing lifestyles have also contributed to continued growth in snacking – with
increased demand for healthier options. Online grocery shopping maintained a strong growth
momentum where Kerry out performed category e-tail growth rates.
The repositioned Kerry Foods’ portfolio performed well against this background delivering 3% volume
growth in 2015. Net pricing was 1.9% lower. Following the sale of the division’s pastry manufacturing
assets in August 2014 and the management buy-out of the Direct-To-Store business in the UK
completed at the end of February 2015, sales revenue in the repositioned Kerry Foods’ portfolio was
reported at €1,476m. Trading in the division’s continuing businesses improved during the year, with
reported trading profit similar to the prior year level at €126m despite the business disposals.
UK Brands had a mixed performance due to category specific competitiveness issues. Mattessons
meat snacks continued to drive growth in the meat snacking sector delivering double digit brand
growth with increased sales through the convenience channel and successful extension of the brand
to the adults’ snack segment. In the sausage sector, Richmond branded offerings were impacted by
the changing promotional environment. Richmond and Wall’s continued to bring innovative offerings
to the category through convenient solutions meeting today’s consumer lifestyles including
‘Richmond Perfect Bake’ and ‘Wall’s Ready Baked’.
Cheestrings performed well in the UK as the children’s cheese snack sector returned to growth.
‘LowLow Snack Bites’ continued to grow the adult cheese snack sector. ‘Pure’, Kerry Foods’ ‘free
from’ brand consolidated its leadership position in the growing UK dairy-free spreads sector. Rollover
Ltd., acquired in January 2015, extended Kerry Foods’ ‘hot-to-go’ UK offering and channel
distribution.
UK Customer Brands achieved strong growth in each of its key sectors in the meal solutions
category – chilled ready meals, ‘Ready-to-Cook’ and frozen ready meals. The frozen meals category
returned to growth where the Bisto and Sharwoods brands achieved excellent growth. The private
label spreads sector lost some market share to block butter and spreadable butter but Kerry Foods’
spreads volumes outperformed the market significantly. A major investment programme at Kerry
Foods’ Ossett production facility was significantly advanced in 2015.
Brands Ireland performed well in the Irish grocery market which returned to growth in 2015. The
‘Denny Gold Medal’ sausage range achieved good brand growth year-on-year. Kerry Foods ‘Fire and
Smoke’ range of branded sliced cooked meats recorded an excellent performance – achieving a
number of notable innovation awards including an international taste award at Germany’s ANUGA
Food Fair.
‘Dairygold’ maintained its brand leadership position in the Irish spreads market and LowLow
consolidated its position as brand leader in the low fat cheese and spreads sectors. ‘Charleville’
achieved good brand growth in the cheese category and successfully launched the ‘Charleville
Snackfuls’ range of cheese snacking products. 2015 saw ‘Yollies’, an innovative children’s yoghurt
snack range, gain increased market momentum in the Irish and UK markets.
International markets provided further growth opportunities for the Cheestrings range. Available
now in eight European markets, Cheestrings saw a strong performance in France and Germany in
2015.
8
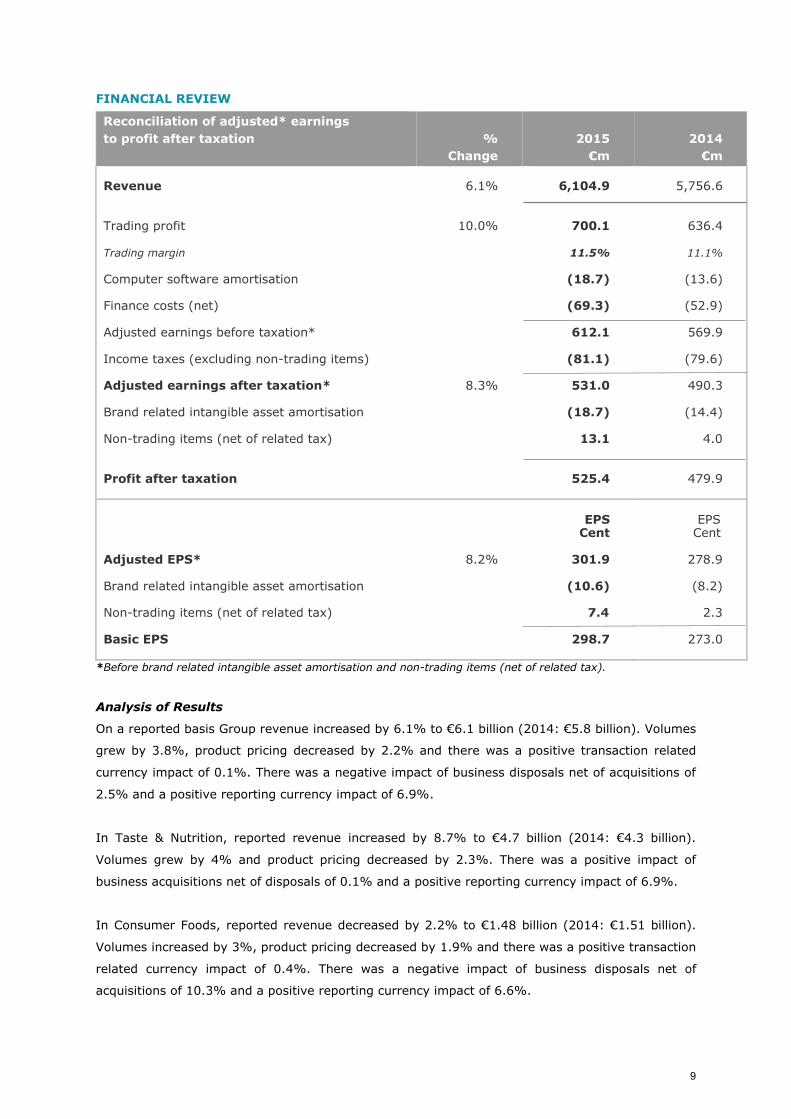
FINANCIAL REVIEW
*Before brand related intangible asset amortisation and non-trading items (net of related tax).
Analysis of Results
On a reported basis Group revenue increased by 6.1% to €6.1 billion (2014: €5.8 billion). Volumes
grew by 3.8%, product pricing decreased by 2.2% and there was a positive transaction related
currency impact of 0.1%. There was a negative impact of business disposals net of acquisitions of
2.5% and a positive reporting currency impact of 6.9%.
In Taste & Nutrition, reported revenue increased by 8.7% to €4.7 billion (2014: €4.3 billion).
Volumes grew by 4% and product pricing decreased by 2.3%. There was a positive impact of
business acquisitions net of disposals of 0.1% and a positive reporting currency impact of 6.9%.
In Consumer Foods, reported revenue decreased by 2.2% to €1.48 billion (2014: €1.51 billion).
Volumes increased by 3%, product pricing decreased by 1.9% and there was a positive transaction
related currency impact of 0.4%. There was a negative impact of business disposals net of
acquisitions of 10.3% and a positive reporting currency impact of 6.6%.
Reconciliation of adjusted* earnings
to profit after taxation %
Change
2015
€m
2014
€m
Revenue
Trading profit
Trading margin
Computer software amortisation
Finance costs (net)
Adjusted earnings before taxation*
Income taxes (excluding non-trading items)
Adjusted earnings after taxation*
Brand related intangible asset amortisation
Non-trading items (net of related tax)
Profit after taxation
6.1%
10.0%
8.3%
6,104.9
700.1
11.5%
(18.7)
(69.3)
612.1
(81.1)
531.0
(18.7)
13.1
525.4
5,756.6
636.4
11.1%
(13.6)
(52.9)
569.9
(79.6)
490.3
(14.4)
4.0
479.9
Adjusted EPS*
Brand related intangible asset amortisation
Non-trading items (net of related tax)
Basic EPS
8.2%
EPS Cent
301.9
(10.6)
7.4
298.7
EPS Cent
278.9
(8.2)
2.3
273.0
9

Trading Profit & Margin
On a reported basis, Group trading profit increased by 10% to €700m (2014: €636m). Group trading
profit margin increased 40 basis points (bps) to 11.5%. The improvement in Kerry trading profit
margin was attributed to operating leverage and improved product mix, coupled with the benefits
accruing through the 1 Kerry Business Transformation Programme and the positive impact from
exiting non-core business activities.
Trading profit margin in Taste & Nutrition increased by 40 bps to 14.1%, due to the benefits of
improved product mix, operating leverage and business efficiency programmes. Trading profit
margin in Consumer Foods increased by 20 bps to 8.5% due to business efficiency gains combined
with the positive impact from exiting non-core business activities.
Computer Software Amortisation
Computer software amortisation increased to €18.7m (2014: €13.6m) reflecting the ongoing
progression of the Kerryconnect project. The capitalised element of the cost of this project is being
amortised over a 7 year period.
Finance Costs (net)
Finance costs (net) for the year increased by €16.4m to €69.3m (2014: €52.9m) primarily due to
acquisition financing, foreign exchange movements and higher finance costs relating to post
retirement benefit obligations, offset by cash generated in the period. The Group’s average interest
rate for the year was 3.6% (2014: 3.6%).
Taxation
The tax charge for the year, before non-trading items, was €81.1m (2014: €79.6m) representing
an effective tax rate of 13.7% (2014: 14.3%). The decrease in the effective tax rate is primarily
driven from the geographical split of profits, R&D investment mainly in Ireland and changes in
country tax rates.
Acquisitions and Disposals
During the year, the Group completed 10 acquisitions at a net cost of €888m. The Group also
disposed of the Pinnacle lifestyle bakery business in Australia and the Consumer Foods Direct-To-
Store business in the UK. The total consideration was €154m before disposal related costs.
Non-Trading Items
Non-trading items totalling to an income of €13.1m net of tax (2014: €4.0m) were recorded in 2015.
The Group realised a profit of €26.7m on the disposal of the Pinnacle Lifestyle Bakery and Direct-to-
Store businesses and a loss of €4.2m on the disposal of miscellaneous property, plant and
equipment. In addition the Group incurred €7.8m of acquisition transaction and integration costs
relating to the acquisitions completed during the year and a €5.3m loss relating to the impairment
of assets held for sale. A tax credit of €3.7m was recognised on these non-trading items.
10
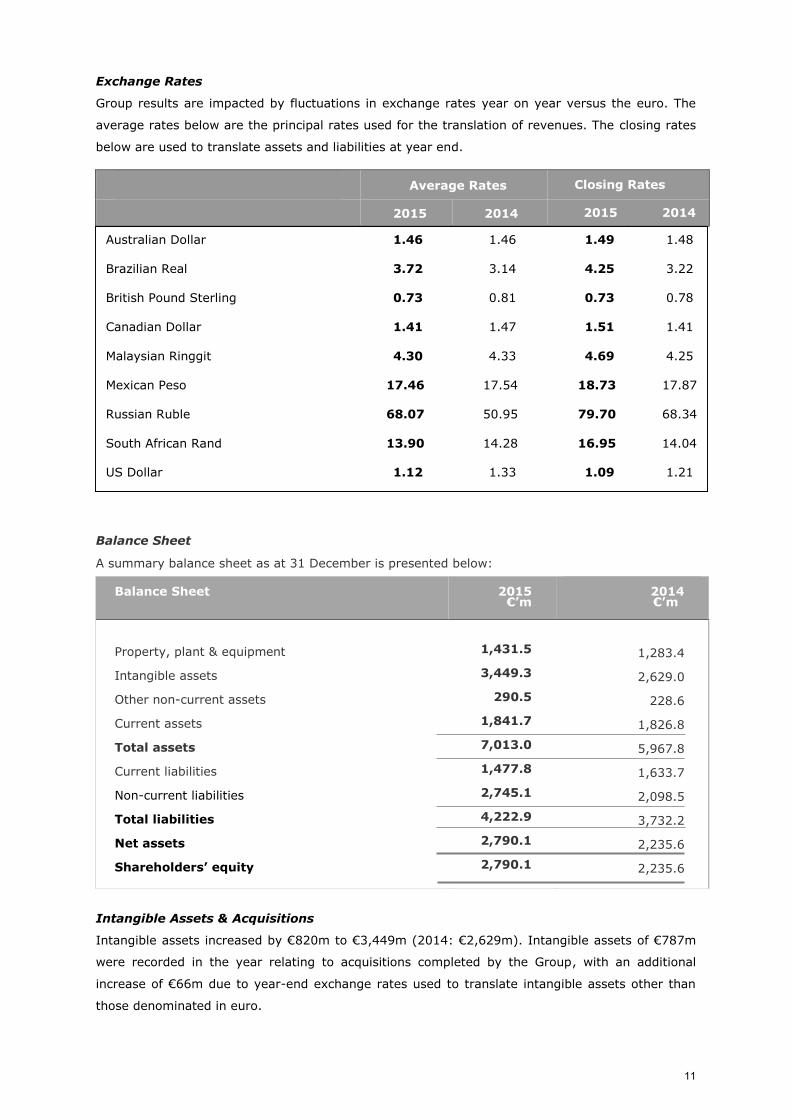
Exchange Rates
Group results are impacted by fluctuations in exchange rates year on year versus the euro. The
average rates below are the principal rates used for the translation of revenues. The closing rates
below are used to translate assets and liabilities at year end.
Balance Sheet
A summary balance sheet as at 31 December is presented below:
Balance Sheet 2015 €’m
2014 €’m
Property, plant & equipment
Intangible assets
Other non-current assets
Current assets
Total assets
Current liabilities
Non-current liabilities
Total liabilities
Net assets
Shareholders’ equity
1,431.5
3,449.3
290.5
1,841.7
7,013.0
1,477.8
2,745.1
4,222.9
2,790.1
2,790.1
1,283.4
2,629.0
228.6
1,826.8
5,967.8
1,633.7
2,098.5
3,732.2
2,235.6
2,235.6
Intangible Assets & Acquisitions
Intangible assets increased by €820m to €3,449m (2014: €2,629m). Intangible assets of €787m
were recorded in the year relating to acquisitions completed by the Group, with an additional
increase of €66m due to year-end exchange rates used to translate intangible assets other than
those denominated in euro.
Average Rates Closing Rates
2015 2014 2015 2014
Australian Dollar 1.46 1.46 1.49 1.48
Brazilian Real 3.72 3.14 4.25 3.22
British Pound Sterling 0.73 0.81 0.73 0.78
Canadian Dollar 1.41 1.47 1.51 1.41
Malaysian Ringgit 4.30 4.33 4.69 4.25
Mexican Peso 17.46 17.54 18.73 17.87
Russian Ruble 68.07 50.95 79.70 68.34
South African Rand 13.90 14.28 16.95 14.04
US Dollar 1.12 1.33 1.09 1.21
11
Retirement Benefits
At the balance sheet date, the net deficit for defined benefit schemes (after deferred tax) was €253m
(2014: €393m). The decrease is due to an increase in the discount rates in the UK, Eurozone and
the US, together with cash contributions during the year. The net deficit expressed as a percentage
of market capitalisation at 31 December was 1.9% (2014: 3.9%). The charge to the income
statement during the year, for both defined benefit and defined contribution schemes was €54.3m
(2014: €50.4m).
Financing
In April, following a limited syndication process, the Group agreed a new €1.1bn revolving credit
facility replacing the existing arrangements. The syndication was more than two times
oversubscribed.
In September, the Group announced its debut Eurobond issuing €750m 10 year notes at an annual
coupon of 2.375%. The bonds, which were over 3.5 times oversubscribed, are listed on the Irish
Stock Exchange and provide Kerry with an additional source of debt finance. These new facilities
significantly increase the amount of committed debt available. They extend the maturity profile of
Group debt and were used to retire existing debt, fund acquisitions and for general corporate
purposes.
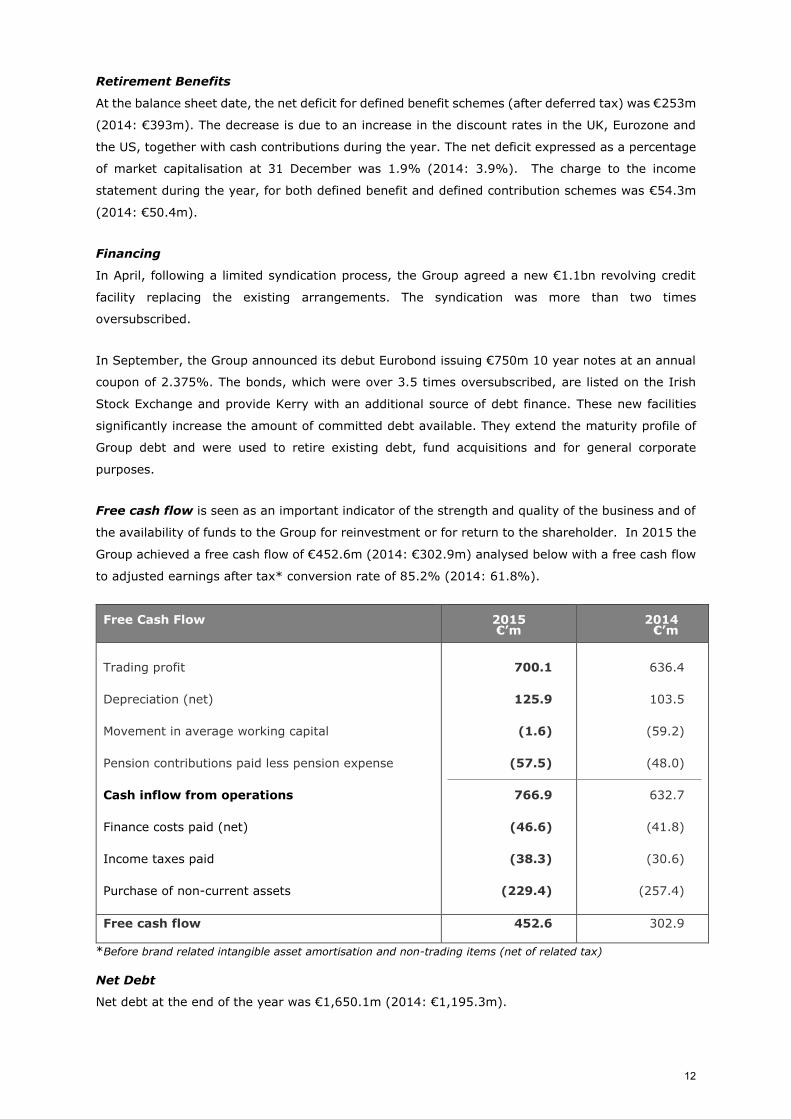
Free cash flow is seen as an important indicator of the strength and quality of the business and of
the availability of funds to the Group for reinvestment or for return to the shareholder. In 2015 the
Group achieved a free cash flow of €452.6m (2014: €302.9m) analysed below with a free cash flow
to adjusted earnings after tax* conversion rate of 85.2% (2014: 61.8%).
*Before brand related intangible asset amortisation and non-trading items (net of related tax)
Net Debt
Net debt at the end of the year was €1,650.1m (2014: €1,195.3m).
Free Cash Flow 2015 €’m
2014 €’m
Trading profit
Depreciation (net)
Movement in average working capital
Pension contributions paid less pension expense
Cash inflow from operations
Finance costs paid (net)
Income taxes paid
Purchase of non-current assets
700.1
125.9
(1.6)
(57.5)
766.9
(46.6)
(38.3)
(229.4)
636.4
103.5
(59.2)
(48.0)
632.7
(41.8)
(30.6)
(257.4)
Free cash flow 452.6 302.9
12
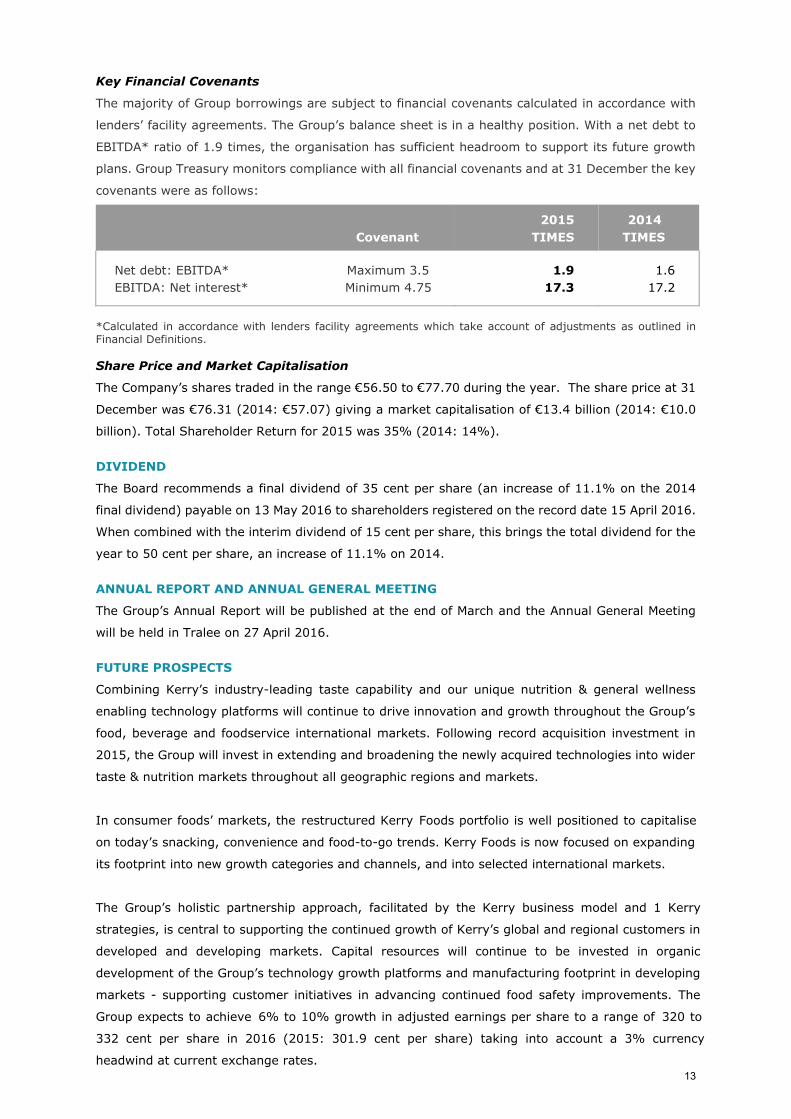
Key Financial Covenants
The majority of Group borrowings are subject to financial covenants calculated in accordance with
lenders’ facility agreements. The Group’s balance sheet is in a healthy position. With a net debt to
EBITDA* ratio of 1.9 times, the organisation has sufficient headroom to support its future growth
plans. Group Treasury monitors compliance with all financial covenants and at 31 December the key
covenants were as follows:
Covenant
2015
TIMES
2014
TIMES
Net debt: EBITDA* Maximum 3.5
EBITDA: Net interest* Minimum 4.75
1.9
17.3
1.6
17.2
*Calculated in accordance with lenders facility agreements which take account of adjustments as outlined in Financial Definitions.
Share Price and Market Capitalisation
The Company’s shares traded in the range €56.50 to €77.70 during the year. The share price at 31
December was €76.31 (2014: €57.07) giving a market capitalisation of €13.4 billion (2014: €10.0
billion). Total Shareholder Return for 2015 was 35% (2014: 14%).
DIVIDEND
The Board recommends a final dividend of 35 cent per share (an increase of 11.1% on the 2014
final dividend) payable on 13 May 2016 to shareholders registered on the record date 15 April 2016.
When combined with the interim dividend of 15 cent per share, this brings the total dividend for the
year to 50 cent per share, an increase of 11.1% on 2014.
ANNUAL REPORT AND ANNUAL GENERAL MEETING
The Group’s Annual Report will be published at the end of March and the Annual General Meeting
will be held in Tralee on 27 April 2016.
FUTURE PROSPECTS
Combining Kerry’s industry-leading taste capability and our unique nutrition & general wellness
enabling technology platforms will continue to drive innovation and growth throughout the Group’s
food, beverage and foodservice international markets. Following record acquisition investment in
2015, the Group will invest in extending and broadening the newly acquired technologies into wider
taste & nutrition markets throughout all geographic regions and markets.
In consumer foods’ markets, the restructured Kerry Foods portfolio is well positioned to capitalise
on today’s snacking, convenience and food-to-go trends. Kerry Foods is now focused on expanding
its footprint into new growth categories and channels, and into selected international markets.
The Group’s holistic partnership approach, facilitated by the Kerry business model and 1 Kerry
strategies, is central to supporting the continued growth of Kerry’s global and regional customers in
developed and developing markets. Capital resources will continue to be invested in organic
development of the Group’s technology growth platforms and manufacturing footprint in developing
markets - supporting customer initiatives in advancing continued food safety improvements. The
Group expects to achieve 6% to 10% growth in adjusted earnings per share to a range of 320 to
332 cent per share in 2016 (2015: 301.9 cent per share) taking into account a 3% currency
headwind at current exchange rates.
13

Kerry Group plc
Consolidated Income Statementfor the financial year ended 31 December 2015
BeforeNon-Trading
ItemsNon-Trading
Items Total
BeforeNon-Trading
ItemsNon-Trading
Items Total2015 2015 2015 2014 2014 2014
Notes €'m €'m €'m €'m €'m €'m
Continuing operationsRevenue 2 6,104.9 - 6,104.9 5,756.6 - 5,756.6
Trading profit 2 700.1 - 700.1 636.4 - 636.4
Intangible asset amortisation (37.4) - (37.4) (28.0) - (28.0)Non-trading items 3 - 9.4 9.4 - 0.1 0.1
Operating profit 662.7 9.4 672.1 608.4 0.1 608.5
Finance income 1.8 - 1.8 1.1 - 1.1Finance costs (71.1) - (71.1) (54.0) - (54.0)
593.4 9.4 602.8 555.5 0.1 555.6
Income taxes (81.1) 3.7 (77.4) (79.6) 3.9 (75.7)
512.3 13.1 525.4 475.9 4.0 479.9
Earnings per A ordinary share Cent Cent
- basic 4 298.7 273.0- diluted 4 298.4 272.7
Profit before taxation
Profit after taxation and attributable to owners of the parent
14
Kerry Group plc
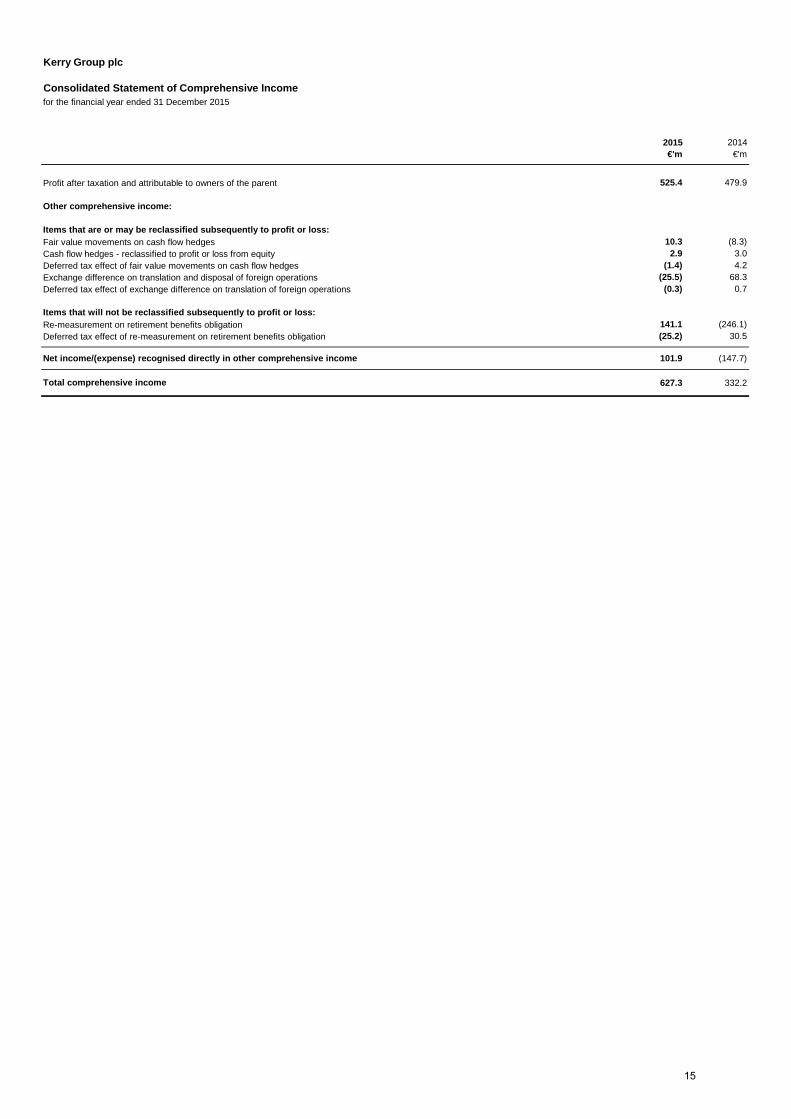
Consolidated Statement of Comprehensive Income for the financial year ended 31 December 2015
2015 2014Notes €'m €'m
Profit after taxation and attributable to owners of the parent 525.4 479.9
Other comprehensive income:
Items that are or may be reclassified subsequently to profit or loss:Fair value movements on cash flow hedges 10.3 (8.3)Cash flow hedges - reclassified to profit or loss from equity 24 2.9 3.0Deferred tax effect of fair value movements on cash flow hedges 17 (1.4) 4.2Exchange difference on translation and disposal of foreign operations 30 (25.5) 68.3Deferred tax effect of exchange difference on translation of foreign operations 17 (0.3) 0.7
Items that will not be reclassified subsequently to profit or loss:Re-measurement on retirement benefits obligation 26 141.1 (246.1)Deferred tax effect of re-measurement on retirement benefits obligation 17 (25.2) 30.5
Net income/(expense) recognised directly in other comprehensive income 101.9 (147.7)
627.3 332.2Total comprehensive income
15
Kerry Group plc
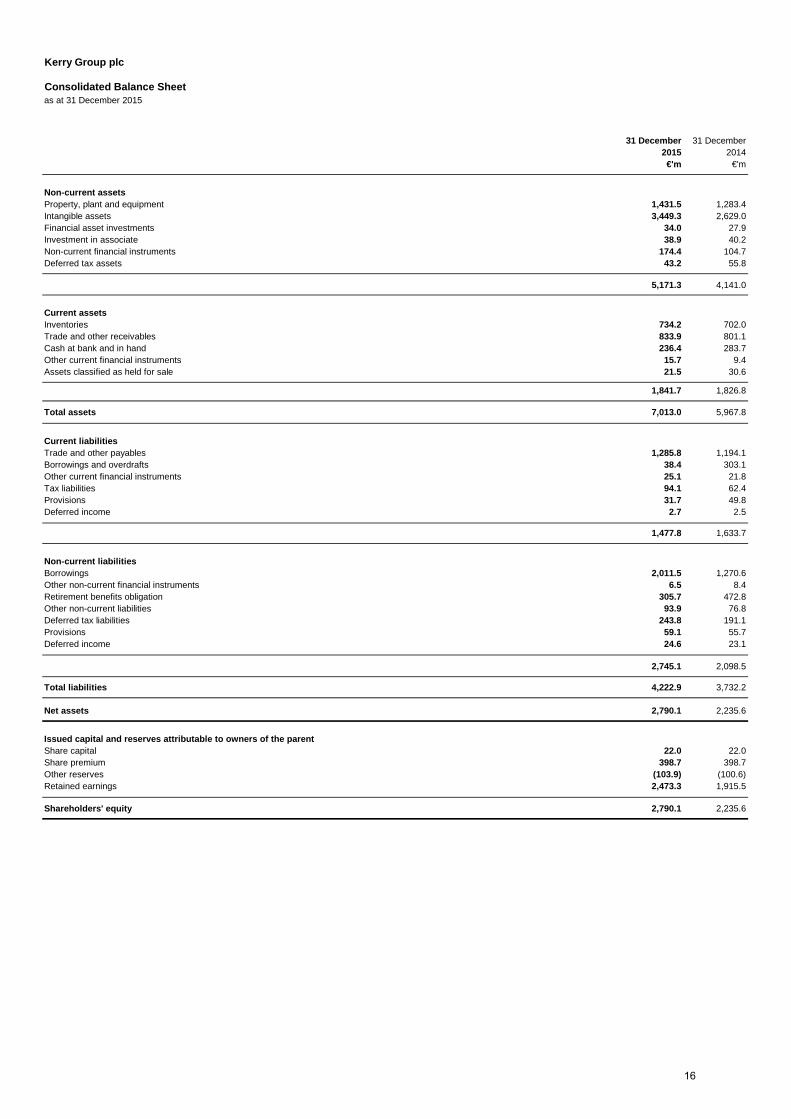
Consolidated Balance Sheetas at 31 December 2015
31 December 31 December2015 2014
Notes €'m €'m
Non-current assetsProperty, plant and equipment 11 1,431.5 1,283.4Intangible assets 12 3,449.3 2,629.0Financial asset investments 13 34.0 27.9Investment in associate 14 38.9 40.2Non-current financial instruments 23 174.4 104.7Deferred tax assets 17 43.2 55.8
5,171.3 4,141.0
Current assetsInventories 16 734.2 702.0Trade and other receivables 19 833.9 801.1Cash at bank and in hand 23 236.4 283.7Other current financial instruments 23 15.7 9.4Assets classified as held for sale 18 21.5 30.6
1,841.7 1,826.8
Total assets 7,013.0 5,967.8
Current liabilitiesTrade and other payables 20 1,285.8 1,194.1Borrowings and overdrafts 23 38.4 303.1Other current financial instruments 23 25.1 21.8Tax liabilities 94.1 62.4Provisions 25 31.7 49.8Deferred income 21 2.7 2.5
1,477.8 1,633.7
Non-current liabilitiesBorrowings 23 2,011.5 1,270.6Other non-current financial instruments 23 6.5 8.4Retirement benefits obligation 26 305.7 472.8Other non-current liabilities 22 93.9 76.8Deferred tax liabilities 17 243.8 191.1Provisions 25 59.1 55.7Deferred income 21 24.6 23.1
2,745.1 2,098.5
Total liabilities 4,222.9 3,732.2
Net assets 2,790.1 2,235.6
Issued capital and reserves attributable to owners of the parentShare capital 27 22.0 22.0Share premium 398.7 398.7Other reserves (103.9) (100.6)Retained earnings 2,473.3 1,915.5
Shareholders' equity 2,790.1 2,235.6
16
Kerry Group plc
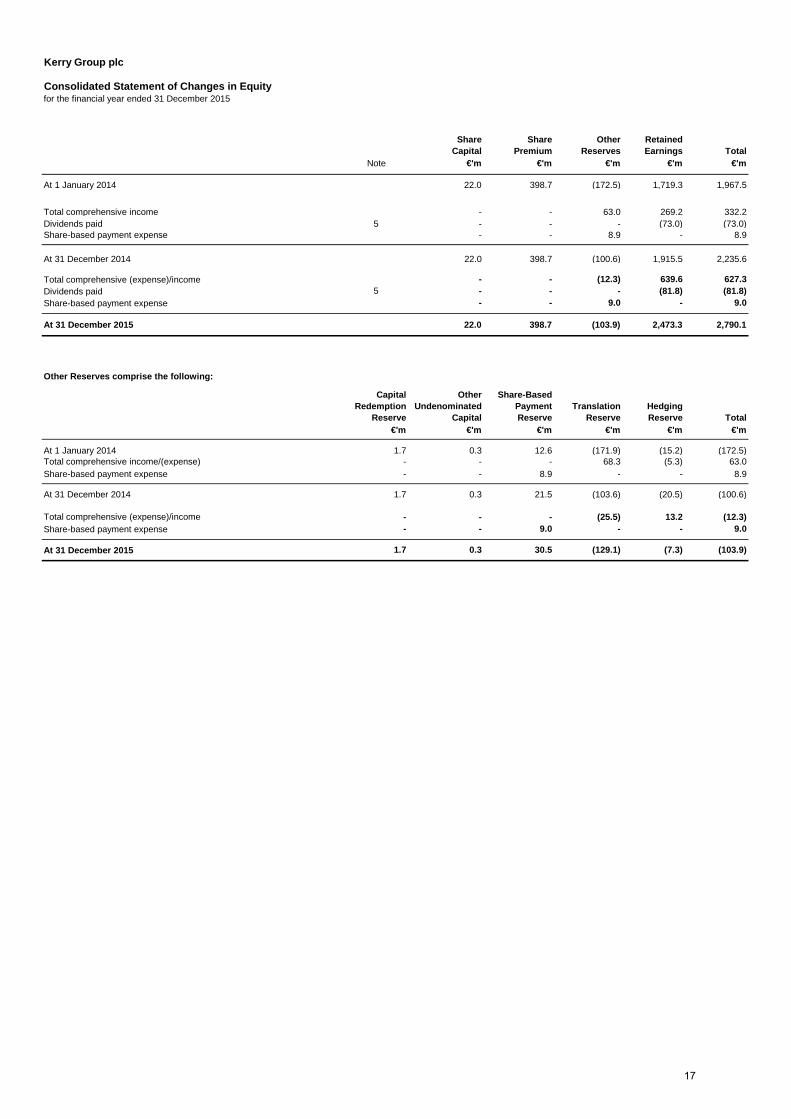
Consolidated Statement of Changes in Equityfor the financial year ended 31 December 2015
ShareCapital
Share Premium
Other Reserves
Retained Earnings Total
Note €'m €'m €'m €'m €'m
At 1 January 2014 22.0 398.7 (172.5) 1,719.3 1,967.5
Total comprehensive income - - 63.0 269.2 332.2Dividends paid 5 - - - (73.0) (73.0)Share-based payment expense 28 - - 8.9 - 8.9
At 31 December 2014 22.0 398.7 (100.6) 1,915.5 2,235.6
- - (12.3) 639.6 627.3Dividends paid 5 - - - (81.8) (81.8)Share-based payment expense 28 - - 9.0 - 9.0
At 31 December 2015 22.0 398.7 (103.9) 2,473.3 2,790.1
Other Reserves comprise the following:
Capital Redemption
Reserve
Other Undenominated
Capital
Share-BasedPaymentReserve
Translation Reserve
Hedging Reserve Total
Notes €'m €'m €'m €'m €'m €'m
At 1 January 2014 1.7 0.3 12.6 (171.9) (15.2) (172.5)Total comprehensive income/(expense) - - - 68.3 (5.3) 63.0Share-based payment expense 28 - - 8.9 - - 8.9
At 31 December 2014 1.7 0.3 21.5 (103.6) (20.5) (100.6)
Total comprehensive (expense)/income - - - (25.5) 13.2 (12.3)Share-based payment expense 28 - - 9.0 - - 9.0
At 31 December 2015 1.7 0.3 30.5 (129.1) (7.3) (103.9)
Total comprehensive (expense)/income
The nature and purpose of each reserve within shareholders' equity are described in note 36.
17
Kerry Group plc
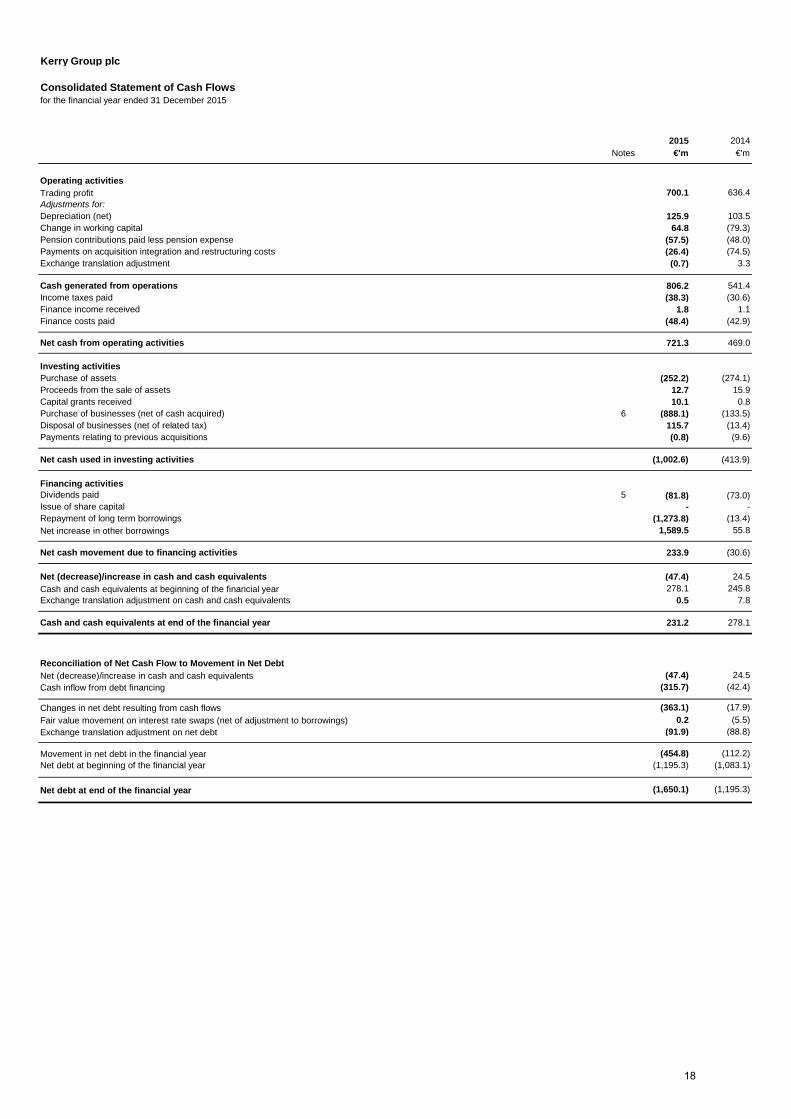
Consolidated Statement of Cash Flowsfor the financial year ended 31 December 2015
2015 2014Notes €'m €'m
Operating activitiesTrading profit 29 700.1 636.4Adjustments for:Depreciation (net) 3 125.9 103.5Change in working capital 29 64.8 (79.3)Pension contributions paid less pension expense (57.5) (48.0)Payments on acquisition integration and restructuring costs (26.4) (74.5)Exchange translation adjustment 30 (0.7) 3.3
Cash generated from operations 806.2 541.4Income taxes paid (38.3) (30.6)Finance income received 1.8 1.1Finance costs paid (48.4) (42.9)
Net cash from operating activities 721.3 469.0
Investing activitiesPurchase of assets 29 (252.2) (274.1)Proceeds from the sale of assets 12.7 15.9Capital grants received 10.1 0.8Purchase of businesses (net of cash acquired) 6 (888.1) (133.5)Disposal of businesses (net of related tax) 115.7 (13.4)Payments relating to previous acquisitions (0.8) (9.6)
Net cash used in investing activities (1,002.6) (413.9)
Financing activitiesDividends paid 5 (81.8) (73.0)Issue of share capital 27 - -Repayment of long term borrowings (1,273.8) (13.4)Net increase in other borrowings 1,589.5 55.8
Net cash movement due to financing activities 233.9 (30.6)
Net (decrease)/increase in cash and cash equivalents (47.4) 24.5Cash and cash equivalents at beginning of the financial year 278.1 245.8Exchange translation adjustment on cash and cash equivalents 30 0.5 7.8
Cash and cash equivalents at end of the financial year 29 231.2 278.1
Reconciliation of Net Cash Flow to Movement in Net DebtNet (decrease)/increase in cash and cash equivalents (47.4) 24.5Cash inflow from debt financing (315.7) (42.4)
Changes in net debt resulting from cash flows (363.1) (17.9)Fair value movement on interest rate swaps (net of adjustment to borrowings) 0.2 (5.5)Exchange translation adjustment on net debt 30 (91.9) (88.8)
Movement in net debt in the financial year (454.8) (112.2)Net debt at beginning of the financial year (1,195.3) (1,083.1)
Net debt at end of the financial year 23 (1,650.1) (1,195.3)
18
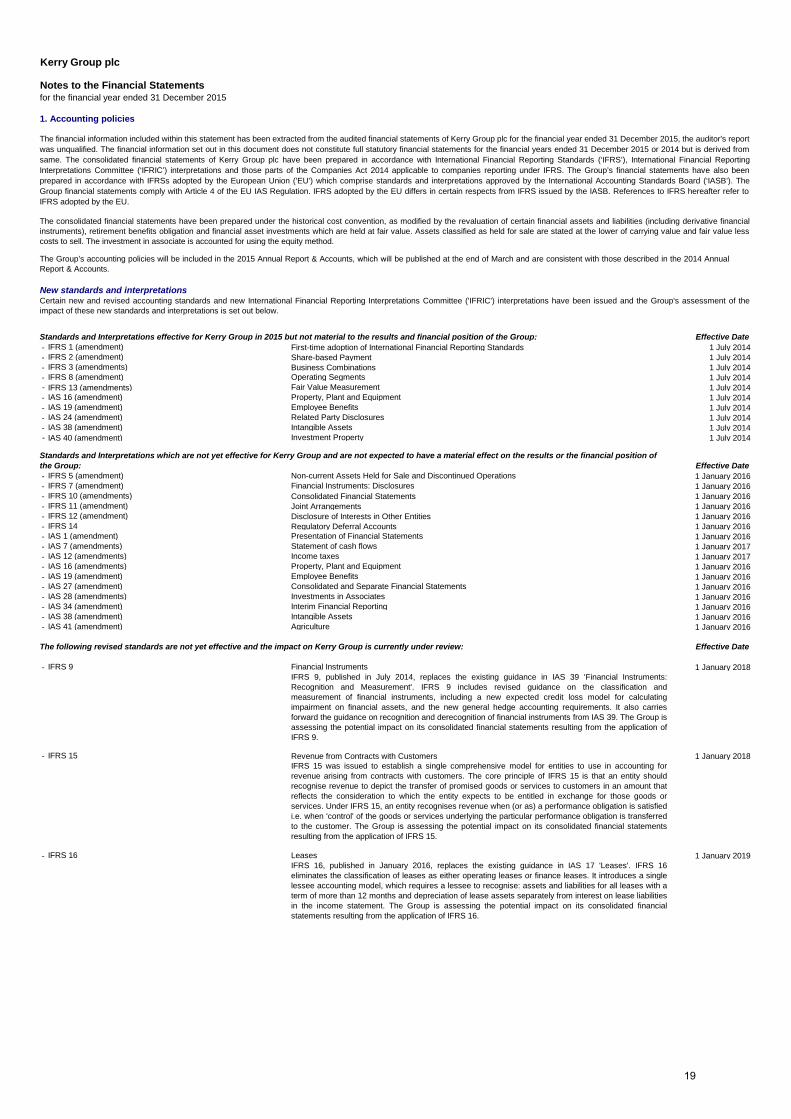
Effective Date- IFRS 1 (amendment) First-time adoption of International Financial Reporting Standards 1 July 2014- IFRS 2 (amendment) Share-based Payment 1 July 2014- IFRS 3 (amendments) Business Combinations 1 July 2014- IFRS 8 (amendment) Operating Segments 1 July 2014- IFRS 13 (amendments) Fair Value Measurement 1 July 2014- IAS 16 (amendment) Property, Plant and Equipment 1 July 2014- IAS 19 (amendment) Employee Benefits 1 July 2014- IAS 24 (amendment) Related Party Disclosures 1 July 2014- IAS 38 (amendment) Intangible Assets 1 July 2014- IAS 40 (amendment) Investment Property 1 July 2014
Effective Date- Non-current Assets Held for Sale and Discontinued Operations 1 January 2016- Financial Instruments: Disclosures 1 January 2016- Consolidated Financial Statements 1 January 2016- Joint Arrangements 1 January 2016- Disclosure of Interests in Other Entities 1 January 2016- Regulatory Deferral Accounts 1 January 2016- IAS 1 (amendment) Presentation of Financial Statements 1 January 2016- IAS 7 (amendments) Statement of cash flows 1 January 2017- IAS 12 (amendments) Income taxes 1 January 2017- IAS 16 (amendments) Property, Plant and Equipment 1 January 2016- IAS 19 (amendment) Employee Benefits 1 January 2016- IAS 27 (amendment) Consolidated and Separate Financial Statements 1 January 2016- IAS 28 (amendments) Investments in Associates 1 January 2016- IAS 34 (amendment) Interim Financial Reporting 1 January 2016- IAS 38 (amendment) Intangible Assets 1 January 2016- IAS 41 (amendment) Agriculture 1 January 2016
Effective Date
- 1 January 2018
- Revenue from Contracts with Customers 1 January 2018
- 1 January 2019LeasesIFRS 16IFRS 16, published in January 2016, replaces the existing guidance in IAS 17 'Leases'. IFRS 16eliminates the classification of leases as either operating leases or finance leases. It introduces a singlelessee accounting model, which requires a lessee to recognise: assets and liabilities for all leases with aterm of more than 12 months and depreciation of lease assets separately from interest on lease liabilitiesin the income statement. The Group is assessing the potential impact on its consolidated financialstatements resulting from the application of IFRS 16.
IFRS 9, published in July 2014, replaces the existing guidance in IAS 39 'Financial Instruments:Recognition and Measurement'. IFRS 9 includes revised guidance on the classification andmeasurement of financial instruments, including a new expected credit loss model for calculatingimpairment on financial assets, and the new general hedge accounting requirements. It also carriesforward the guidance on recognition and derecognition of financial instruments from IAS 39. The Group isassessing the potential impact on its consolidated financial statements resulting from the application ofIFRS 9.
IFRS 15IFRS 15 was issued to establish a single comprehensive model for entities to use in accounting forrevenue arising from contracts with customers. The core principle of IFRS 15 is that an entity shouldrecognise revenue to depict the transfer of promised goods or services to customers in an amount thatreflects the consideration to which the entity expects to be entitled in exchange for those goods orservices. Under IFRS 15, an entity recognises revenue when (or as) a performance obligation is satisfiedi.e. when 'control' of the goods or services underlying the particular performance obligation is transferredto the customer. The Group is assessing the potential impact on its consolidated financial statementsresulting from the application of IFRS 15.
IFRS 11 (amendment)IFRS 12 (amendment)IFRS 14
The following revised standards are not yet effective and the impact on Kerry Group is currently under review:
IFRS 9 Financial Instruments
IFRS 10 (amendments)
Kerry Group plc
Notes to the Financial Statementsfor the financial year ended 31 December 2015
1. Accounting policies
The financial information included within this statement has been extracted from the audited financial statements of Kerry Group plc for the financial year ended 31 December 2015, the auditor's report was unqualified. The financial information set out in this document does not constitute full statutory financial statements for the financial years ended 31 December 2015 or 2014 but is derived from same. The consolidated financial statements of Kerry Group plc have been prepared in accordance with International Financial Reporting Standards (‘IFRS’), International Financial Reporting Interpretations Committee (‘IFRIC’) interpretations and those parts of the Companies Act 2014 applicable to companies reporting under IFRS. The Group’s financial statements have also been prepared in accordance with IFRSs adopted by the European Union ('EU') which comprise standards and interpretations approved by the International Accounting Standards Board (‘IASB’). The Group financial statements comply with Article 4 of the EU IAS Regulation. IFRS adopted by the EU differs in certain respects from IFRS issued by the IASB. References to IFRS hereafter refer to IFRS adopted by the EU.
The consolidated financial statements have been prepared under the historical cost convention, as modified by the revaluation of certain financial assets and liabilities (including derivative financial instruments), retirement benefits obligation and financial asset investments which are held at fair value. Assets classified as held for sale are stated at the lower of carrying value and fair value less costs to sell. The investment in associate is accounted for using the equity method.
The Group’s accounting policies will be included in the 2015 Annual Report & Accounts, which will be published at the end of March and are consistent with those described in the 2014 Annual Report & Accounts.
New standards and interpretationsCertain new and revised accounting standards and new International Financial Reporting Interpretations Committee ('IFRIC') interpretations have been issued and the Group's assessment of the impact of these new standards and interpretations is set out below.
Standards and Interpretations effective for Kerry Group in 2015 but not material to the results and financial position of the Group:
Standards and Interpretations which are not yet effective for Kerry Group and are not expected to have a material effect on the results or the financial position of the Group:
IFRS 5 (amendment)IFRS 7 (amendment)
19
Kerry Group plc
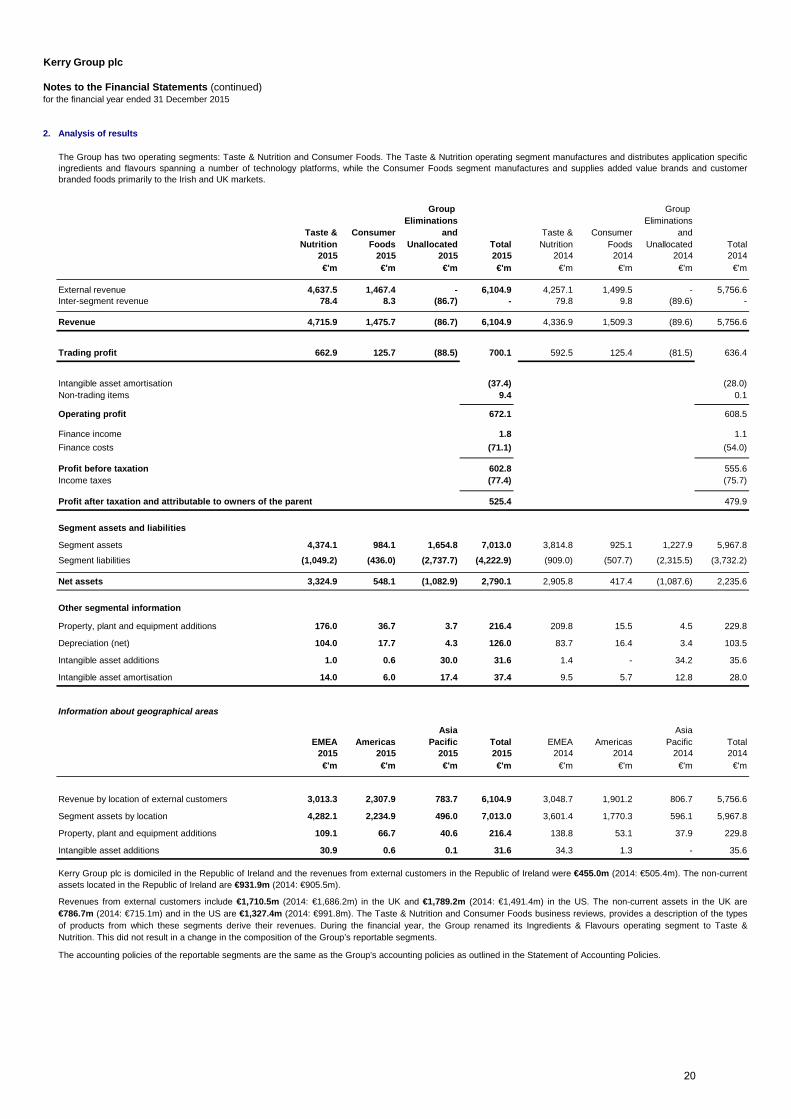
2. Analysis of results
Group Group Eliminations Eliminations
Taste & Consumer and Taste & Consumer andNutrition Foods Unallocated Total Nutrition Foods Unallocated Total
2015 2015 2015 2015 2014 2014 2014 2014€'m €'m €'m €'m €'m €'m €'m €'m
External revenue 4,637.5 1,467.4 - 6,104.9 4,257.1 1,499.5 - 5,756.6Inter-segment revenue 78.4 8.3 (86.7) - 79.8 9.8 (89.6) -
Revenue 4,715.9 1,475.7 (86.7) 6,104.9 4,336.9 1,509.3 (89.6) 5,756.6
Trading profit 662.9 125.7 (88.5) 700.1 592.5 125.4 (81.5) 636.4
Intangible asset amortisation (37.4) (28.0)Non-trading items 9.4 0.1
Operating profit 672.1 608.5
Finance income 1.8 1.1Finance costs (71.1) (54.0)
Profit before taxation 602.8 555.6Income taxes (77.4) (75.7)
525.4 479.9
Segment assets and liabilities
Segment assets 4,374.1 984.1 1,654.8 7,013.0 3,814.8 925.1 1,227.9 5,967.8
Segment liabilities (1,049.2) (436.0) (2,737.7) (4,222.9) (909.0) (507.7) (2,315.5) (3,732.2)
Net assets 3,324.9 548.1 (1,082.9) 2,790.1 2,905.8 417.4 (1,087.6) 2,235.6
Other segmental information
Property, plant and equipment additions 176.0 36.7 3.7 216.4 209.8 15.5 4.5 229.8
Depreciation (net) 104.0 17.7 4.3 126.0 83.7 16.4 3.4 103.5
Intangible asset additions 1.0 0.6 30.0 31.6 1.4 - 34.2 35.6
Intangible asset amortisation 14.0 6.0 17.4 37.4 9.5 5.7 12.8 28.0
Information about geographical areas
Asia AsiaEMEA Americas Pacific Total EMEA Americas Pacific Total
2015 2015 2015 2015 2014 2014 2014 2014€'m €'m €'m €'m €'m €'m €'m €'m
Revenue by location of external customers 3,013.3 2,307.9 783.7 6,104.9 3,048.7 1,901.2 806.7 5,756.6
Segment assets by location 4,282.1 2,234.9 496.0 7,013.0 3,601.4 1,770.3 596.1 5,967.8
Property, plant and equipment additions 109.1 66.7 40.6 216.4 138.8 53.1 37.9 229.8
Intangible asset additions 30.9 0.6 0.1 31.6 34.3 1.3 - 35.6
Kerry Group plc is domiciled in the Republic of Ireland and the revenues from external customers in the Republic of Ireland were €455.0m (2014: €505.4m). The non-currentassets located in the Republic of Ireland are €931.9m (2014: €905.5m).
The accounting policies of the reportable segments are the same as the Group's accounting policies as outlined in the Statement of Accounting Policies.
Profit after taxation and attributable to owners of the parent
for the financial year ended 31 December 2015
Revenues from external customers include €1,710.5m (2014: €1,686.2m) in the UK and €1,789.2m (2014: €1,491.4m) in the US. The non-current assets in the UK are€786.7m (2014: €715.1m) and in the US are €1,327.4m (2014: €991.8m). The Taste & Nutrition and Consumer Foods business reviews, provides a description of the typesof products from which these segments derive their revenues. During the financial year, the Group renamed its Ingredients & Flavours operating segment to Taste &Nutrition. This did not result in a change in the composition of the Group’s reportable segments.
Notes to the Financial Statements (continued)
The Group has two operating segments: Taste & Nutrition and Consumer Foods. The Taste & Nutrition operating segment manufactures and distributes application specificingredients and flavours spanning a number of technology platforms, while the Consumer Foods segment manufactures and supplies added value brands and customerbranded foods primarily to the Irish and UK markets.
20
Kerry Group plc
for the financial year ended 31 December 2015
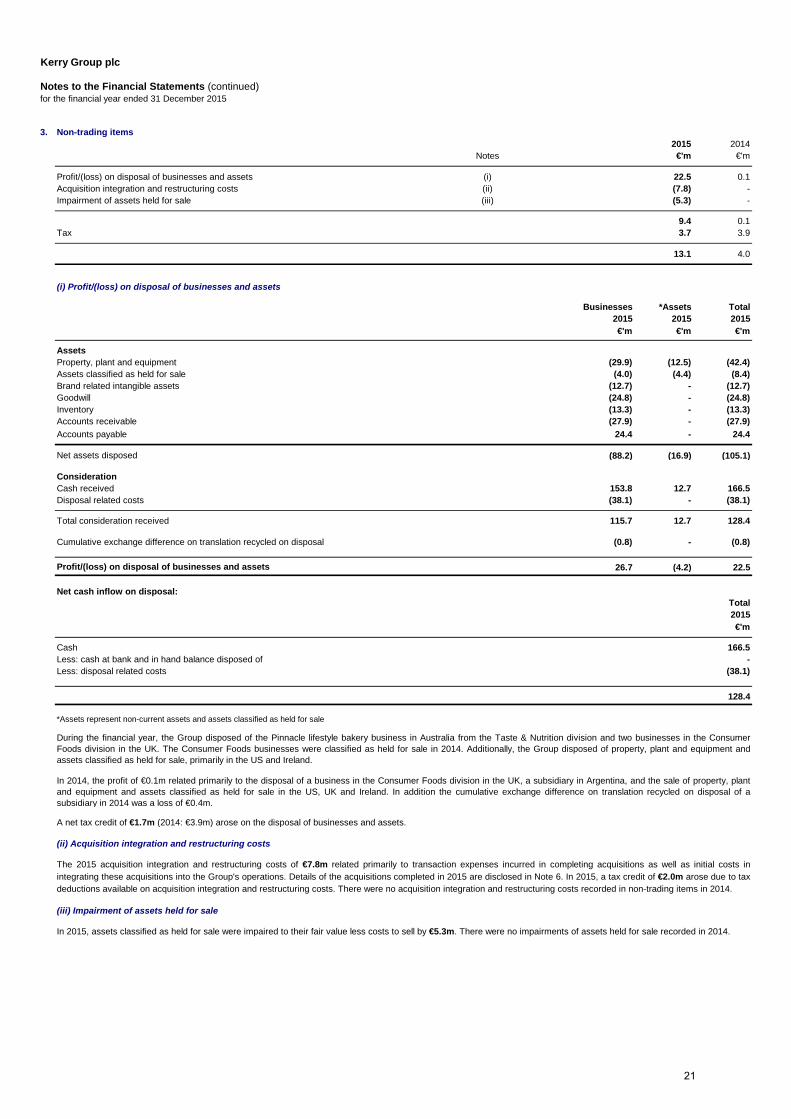
3. Non-trading items2015 2014
Notes €'m €'m
Profit/(loss) on disposal of businesses and assets (i) 22.5 0.1Acquisition integration and restructuring costs (ii) (7.8) -Impairment of assets held for sale (iii) (5.3) -
9.4 0.1Tax 7 3.7 3.9
13.1 4.0
(i) Profit/(loss) on disposal of businesses and assets
Businesses *Assets Total2015 2015 2015
Notes €'m €'m €'m
AssetsProperty, plant and equipment 11 (29.9) (12.5) (42.4)Assets classified as held for sale 18 (4.0) (4.4) (8.4)Brand related intangible assets 12 (12.7) - (12.7)Goodwill 12 (24.8) - (24.8)Inventory (13.3) - (13.3)Accounts receivable (27.9) - (27.9)Accounts payable 24.4 - 24.4
Net assets disposed (88.2) (16.9) (105.1)
ConsiderationCash received 153.8 12.7 166.5Disposal related costs (38.1) - (38.1)
Total consideration received 115.7 12.7 128.4
Cumulative exchange difference on translation recycled on disposal 30 (0.8) - (0.8)
Profit/(loss) on disposal of businesses and assets 26.7 (4.2) 22.5
Net cash inflow on disposal:Total2015€'m
Cash 166.5Less: cash at bank and in hand balance disposed of -Less: disposal related costs (38.1)
128.4
(ii) Acquisition integration and restructuring costs
(iii) Impairment of assets held for sale
Notes to the Financial Statements (continued)
In 2015, assets classified as held for sale were impaired to their fair value less costs to sell by €5.3m. There were no impairments of assets held for sale recorded in 2014.
*Assets represent non-current assets and assets classified as held for sale
A net tax credit of €1.7m (2014: €3.9m) arose on the disposal of businesses and assets.
During the financial year, the Group disposed of the Pinnacle lifestyle bakery business in Australia from the Taste & Nutrition division and two businesses in the ConsumerFoods division in the UK. The Consumer Foods businesses were classified as held for sale in 2014. Additionally, the Group disposed of property, plant and equipment andassets classified as held for sale, primarily in the US and Ireland.
In 2014, the profit of €0.1m related primarily to the disposal of a business in the Consumer Foods division in the UK, a subsidiary in Argentina, and the sale of property, plantand equipment and assets classified as held for sale in the US, UK and Ireland. In addition the cumulative exchange difference on translation recycled on disposal of asubsidiary in 2014 was a loss of €0.4m.
The 2015 acquisition integration and restructuring costs of €7.8m related primarily to transaction expenses incurred in completing acquisitions as well as initial costs inintegrating these acquisitions into the Group's operations. Details of the acquisitions completed in 2015 are disclosed in Note 6. In 2015, a tax credit of €2.0m arose due to taxdeductions available on acquisition integration and restructuring costs. There were no acquisition integration and restructuring costs recorded in non-trading items in 2014.
21
Kerry Group plc
for the financial year ended 31 December 2015
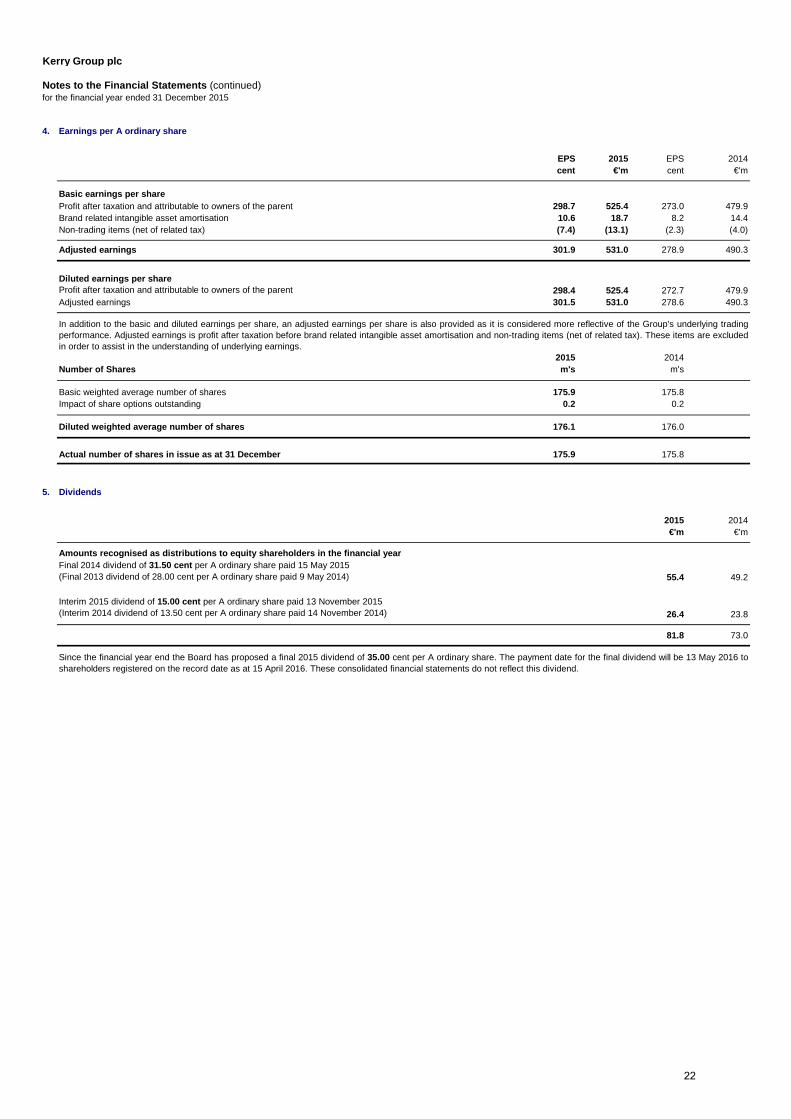
4. Earnings per A ordinary share
EPS 2015 EPS 2014Notes cent €'m cent €'m
Basic earnings per shareProfit after taxation and attributable to owners of the parent 298.7 525.4 273.0 479.9Brand related intangible asset amortisation 12 10.6 18.7 8.2 14.4Non-trading items (net of related tax) 5 (7.4) (13.1) (2.3) (4.0)
Adjusted earnings 301.9 531.0 278.9 490.3
Diluted earnings per shareProfit after taxation and attributable to owners of the parent 298.4 525.4 272.7 479.9Adjusted earnings 301.5 531.0 278.6 490.3
2015 2014Number of Shares Note m's m's
Basic weighted average number of shares 175.9 175.8Impact of share options outstanding 0.2 0.2
Diluted weighted average number of shares 176.1 176.0
Actual number of shares in issue as at 31 December 27 175.9 175.8
5. Dividends
2015 2014€'m €'m
Amounts recognised as distributions to equity shareholders in the financial year
55.4 49.2
26.4 23.8
81.8 73.0
Notes to the Financial Statements (continued)
In addition to the basic and diluted earnings per share, an adjusted earnings per share is also provided as it is considered more reflective of the Group's underlying tradingperformance. Adjusted earnings is profit after taxation before brand related intangible asset amortisation and non-trading items (net of related tax). These items are excludedin order to assist in the understanding of underlying earnings.
Final 2014 dividend of 31.50 cent per A ordinary share paid 15 May 2015(Final 2013 dividend of 28.00 cent per A ordinary share paid 9 May 2014)
Since the financial year end the Board has proposed a final 2015 dividend of 35.00 cent per A ordinary share. The payment date for the final dividend will be 13 May 2016 toshareholders registered on the record date as at 15 April 2016. These consolidated financial statements do not reflect this dividend.
Interim 2015 dividend of 15.00 cent per A ordinary share paid 13 November 2015(Interim 2014 dividend of 13.50 cent per A ordinary share paid 14 November 2014)
22
Kerry Group plc
for the financial year ended 31 December 2015
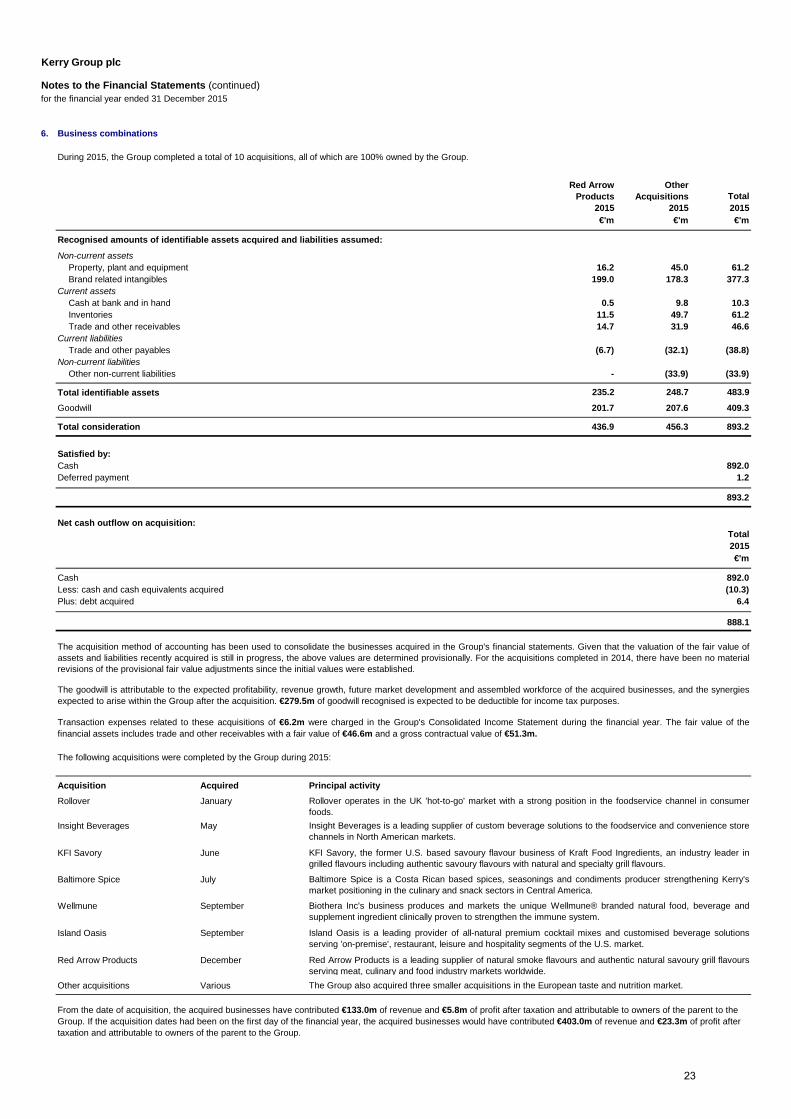
6. Business combinations
Red Arrow Products
Other Acquisitions Total
2015 2015 2015Notes €'m €'m €'m
Non-current assetsProperty, plant and equipment 11 16.2 45.0 61.2Brand related intangibles 12 199.0 178.3 377.3
Current assetsCash at bank and in hand 0.5 9.8 10.3Inventories 11.5 49.7 61.2Trade and other receivables 14.7 31.9 46.6
Current liabilitiesTrade and other payables (6.7) (32.1) (38.8)
Non-current liabilitiesOther non-current liabilities - (33.9) (33.9)
Total identifiable assets 235.2 248.7 483.9
Goodwill 12 201.7 207.6 409.3
Total consideration 436.9 456.3 893.2
Satisfied by:Cash 892.0Deferred payment 1.2
893.2
Net cash outflow on acquisition:Total2015€'m
Cash 892.0Less: cash and cash equivalents acquired (10.3)Plus: debt acquired 6.4
888.1
The following acquisitions were completed by the Group during 2015:
Acquisition AcquiredRollover January
Insight Beverages May
KFI Savory June
Baltimore Spice July
Wellmune September
Island Oasis September
Red Arrow Products December
Other acquisitions Various
Notes to the Financial Statements (continued)
Principal activity
During 2015, the Group completed a total of 10 acquisitions, all of which are 100% owned by the Group.
The acquisition method of accounting has been used to consolidate the businesses acquired in the Group's financial statements. Given that the valuation of the fair value ofassets and liabilities recently acquired is still in progress, the above values are determined provisionally. For the acquisitions completed in 2014, there have been no materialrevisions of the provisional fair value adjustments since the initial values were established.
The goodwill is attributable to the expected profitability, revenue growth, future market development and assembled workforce of the acquired businesses, and the synergiesexpected to arise within the Group after the acquisition. €279.5m of goodwill recognised is expected to be deductible for income tax purposes.
Transaction expenses related to these acquisitions of €6.2m were charged in the Group's Consolidated Income Statement during the financial year. The fair value of thefinancial assets includes trade and other receivables with a fair value of €46.6m and a gross contractual value of €51.3m.
Recognised amounts of identifiable assets acquired and liabilities assumed:
From the date of acquisition, the acquired businesses have contributed €133.0m of revenue and €5.8m of profit after taxation and attributable to owners of the parent to the Group. If the acquisition dates had been on the first day of the financial year, the acquired businesses would have contributed €403.0m of revenue and €23.3m of profit after taxation and attributable to owners of the parent to the Group.
Rollover operates in the UK 'hot-to-go' market with a strong position in the foodservice channel in consumerfoods.Insight Beverages is a leading supplier of custom beverage solutions to the foodservice and convenience storechannels in North American markets.
Baltimore Spice is a Costa Rican based spices, seasonings and condiments producer strengthening Kerry'smarket positioning in the culinary and snack sectors in Central America.
Biothera Inc's business produces and markets the unique Wellmune® branded natural food, beverage andsupplement ingredient clinically proven to strengthen the immune system.
Island Oasis is a leading provider of all-natural premium cocktail mixes and customised beverage solutionsserving 'on-premise', restaurant, leisure and hospitality segments of the U.S. market.
KFI Savory, the former U.S. based savoury flavour business of Kraft Food Ingredients, an industry leader ingrilled flavours including authentic savoury flavours with natural and specialty grill flavours.
Red Arrow Products is a leading supplier of natural smoke flavours and authentic natural savoury grill flavoursserving meat, culinary and food industry markets worldwide.The Group also acquired three smaller acquisitions in the European taste and nutrition market.
23

Kerry Group plc
for the financial year ended 31 December 2015
7. Events after the balance sheet date
Since the financial year end, the Group has proposed a final dividend of 35.00 cent per A ordinary share (note 5).
8. General information
There have been no other significant events, outside the ordinary course of business, affecting the Group since 31 December 2015.
The statutory financial statements of Kerry Group plc for the the financial year ended 31 December 2015 were approved by the Board of Directors and authorised for issue onthe 22 February 2016 and will be filed with the Registrar of Companies following the annual general meeting. The statutory financial statements of Kerry Group plc for thefinancial year ended 31 December 2014, to which an unqualified audit opinion was received, were annexed to the annual return and filed with the Registrar of Companies.
Notes to the Financial Statements (continued)
24
Kerry Group plc
SUPPLEMENTARY INFORMATION
FINANCIAL DEFINITIONS
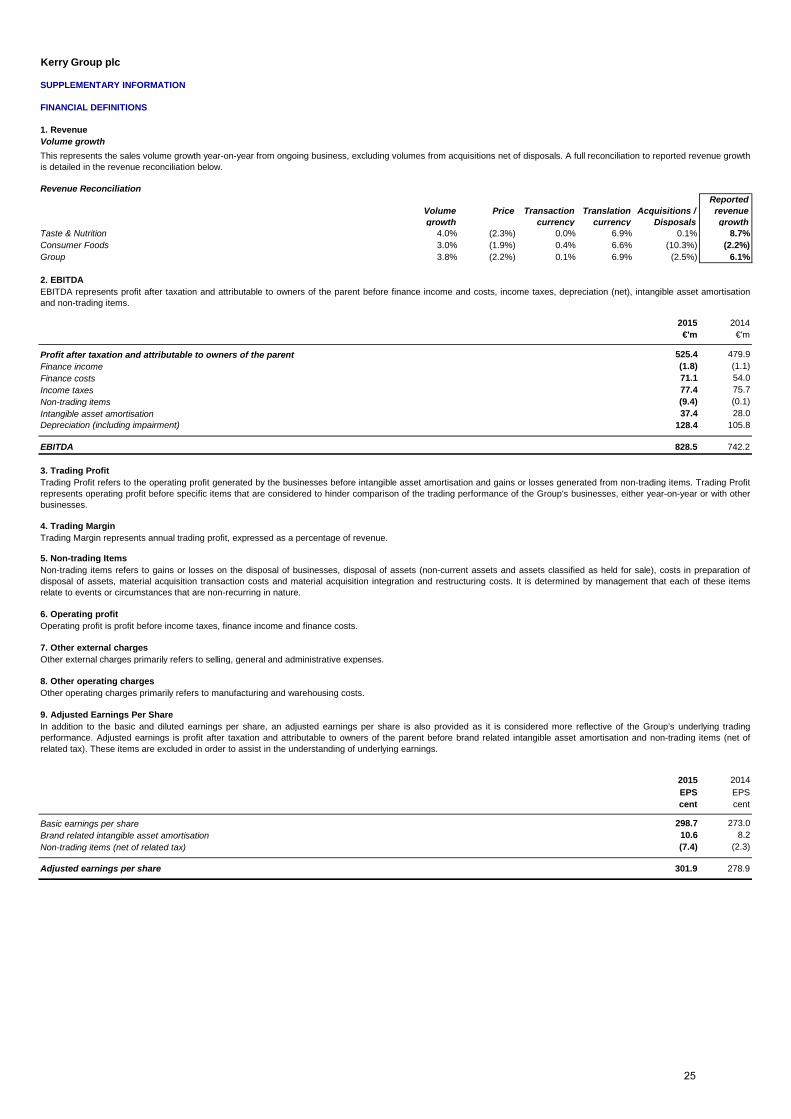
1. RevenueVolume growth
Revenue Reconciliation
Volume growth
Price Transaction currency
Translation currency
Acquisitions / Disposals
Reportedrevenue growth
Taste & Nutrition 4.0% (2.3%) 0.0% 6.9% 0.1% 8.7%Consumer Foods 3.0% (1.9%) 0.4% 6.6% (10.3%) (2.2%)Group 3.8% (2.2%) 0.1% 6.9% (2.5%) 6.1%
2. EBITDA
2015 2014€'m €'m
525.4 479.9 (1.8) (1.1)71.1 54.0 77.4 75.7 (9.4) (0.1)37.4 28.0
Depreciation (including impairment) 128.4 105.8
EBITDA 828.5 742.2
3. Trading Profit
4. Trading Margin
5. Non-trading Items
6. Operating profit
7. Other external charges
8. Other operating charges
9. Adjusted Earnings Per Share
2015 2014EPS EPScent cent
298.7 273.0Brand related intangible asset amortisation 10.6 8.2
(7.4) (2.3)
Adjusted earnings per share 301.9 278.9
In addition to the basic and diluted earnings per share, an adjusted earnings per share is also provided as it is considered more reflective of the Group’s underlying tradingperformance. Adjusted earnings is profit after taxation and attributable to owners of the parent before brand related intangible asset amortisation and non-trading items (net ofrelated tax). These items are excluded in order to assist in the understanding of underlying earnings.
Trading Margin represents annual trading profit, expressed as a percentage of revenue.
Basic earnings per share
Non-trading items (net of related tax)
Profit after taxation and attributable to owners of the parent
This represents the sales volume growth year-on-year from ongoing business, excluding volumes from acquisitions net of disposals. A full reconciliation to reported revenue growthis detailed in the revenue reconciliation below.
EBITDA represents profit after taxation and attributable to owners of the parent before finance income and costs, income taxes, depreciation (net), intangible asset amortisationand non-trading items.
Finance incomeFinance costsIncome taxesNon-trading itemsIntangible asset amortisation
Trading Profit refers to the operating profit generated by the businesses before intangible asset amortisation and gains or losses generated from non-trading items. Trading Profitrepresents operating profit before specific items that are considered to hinder comparison of the trading performance of the Group’s businesses, either year-on-year or with otherbusinesses.
Non-trading items refers to gains or losses on the disposal of businesses, disposal of assets (non-current assets and assets classified as held for sale), costs in preparation ofdisposal of assets, material acquisition transaction costs and material acquisition integration and restructuring costs. It is determined by management that each of these itemsrelate to events or circumstances that are non-recurring in nature.
Operating profit is profit before income taxes, finance income and finance costs.
Other external charges primarily refers to selling, general and administrative expenses.
Other operating charges primarily refers to manufacturing and warehousing costs.
25

Kerry Group plc
SUPPLEMENTARY INFORMATION (continued)
FINANCIAL DEFINITIONS (continued)
10. Free Cash Flow
2015 2014€'m €'m
721.3 469.0(66.4) 20.1
26.4 74.5(252.2) (274.1)
12.7 15.910.1 0.80.7 (3.3)
Free cash flow 452.6 302.9
11. Financial Ratios
12. Return on Average Equity (ROAE)
13. Return on Average Capital Employed (ROACE)
14. Cash Flow Return on Investment (CFROI)
15. Total Shareholder Return (TSR)
16. Market Capitalisation
17. Enterprise ValueEnterprise Value is calculated as per external market sources. It is market capitalisation plus reported borrowings less total cash and cash equivalents.
Total shareholder return (TSR) represents the change in the capital value of Kerry Group shares plus dividends reinvested in the year.
This measure is defined as profit after tax and attributable to owners of the parent before non-trading items (net of tax) and brand related intangible asset amortisation expressedas a percentage of average equity. Average equity is calculated by taking the average shareholders' funds over a 12 month period plus an additional €528m relating to goodwillwritten off to reserves pre conversion to IFRS.
This measure is defined as profit after tax and attributable to owners of the parent before non-trading items (net of tax), brand related intangible asset amortisation and financeincome and costs / Average Capital Employed. Average capital employed is calculated by taking the average shareholders' funds and net debt over a 12 month period plus anadditional €528m relating to goodwill written off to reserves pre conversion to IFRS.
CFROI is calculated as free cash flow before finance costs (net) expressed as a percentage of average capital employed. Average capital employed for the CFROI calculation isthe same as that used for ROACE.
The Net debt: EBITDA and EBITDA: Net interest ratios disclosed are calculated in accordance with lender's facility agreements using an adjusted EBITDA, adjusted finance costs(net of finance income) and an adjusted net debt value to adjust for the impact of non-trading items, acquisitions net of disposals and deferred payments in relation to acquisitions.These ratios are calculated in accordance with lender's facility agreements and these agreements specifically exclude these items from the calculation.
Free Cash Flow is seen as an important indicator of the strength and quality of the business and of the availability to the Group of funds for reinvestment or for return toshareholders. Movement in average working capital is used when management believes this provides a more accurate measure of the increase or decrease in working capitalneeded to support the business over the course of the year rather than at two distinct points in time. Movement in average working capital measures more accurately fluctuationscaused by seasonality and other timing factors. Below is a reconciliation of free cash flow to the nearest IFRS measure, which is "Net cash from operating activities".
Net cash from operating activitiesDifference between movement in average working capital and movement in the financial year end working capitalExpenditure on acquisition integration and restructuring costsPurchase of assetsProceeds from the sale of property, plant and equipmentCapital grants receivedExchange translation adjustment
Free Cash Flow is trading profit plus depreciation, movement in average working capital, capital expenditure, pensions costs less pension expense, finance costs paid (net) andincome taxes paid.
Market Capitalisation is calculated as the share price times the number of shares issued.
26