Embed Size (px)
Citation preview

Preliminary results for the yearended 31 March 2020
20 May 2020

Strategic and operational overview
Brian Cassin, Chief Executive Officer
3 © Experian Public
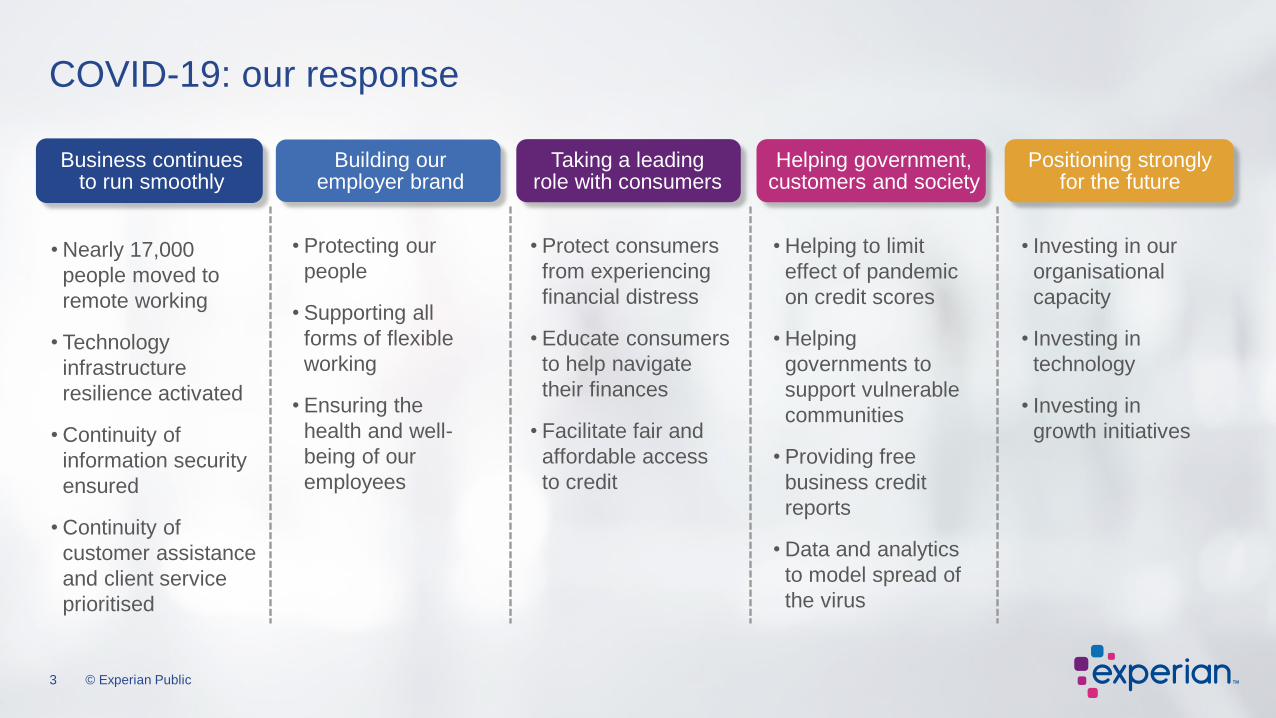
COVID-19: our response
• Nearly 17,000
people moved to
remote working
• Technology
infrastructure
resilience activated
• Continuity of
information security
ensured
• Continuity of
customer assistance
and client service
prioritised
Business continues to run smoothly
Building our employer brand
Taking a leading role with consumers
• Protecting our
people
• Supporting all
forms of flexible
working
• Ensuring the
health and well-
being of our
employees
• Protect consumers
from experiencing
financial distress
• Educate consumers
to help navigate
their finances
• Facilitate fair and
affordable access
to credit
Helping government, customers and society
• Helping to limit
effect of pandemic
on credit scores
• Helping
governments to
support vulnerable
communities
• Providing free
business credit
reports
• Data and analytics
to model spread of
the virus
Positioning strongly for the future
• Investing in our
organisational
capacity
• Investing in
technology
• Investing in
growth initiatives
3 © Experian Public
4 © Experian Public
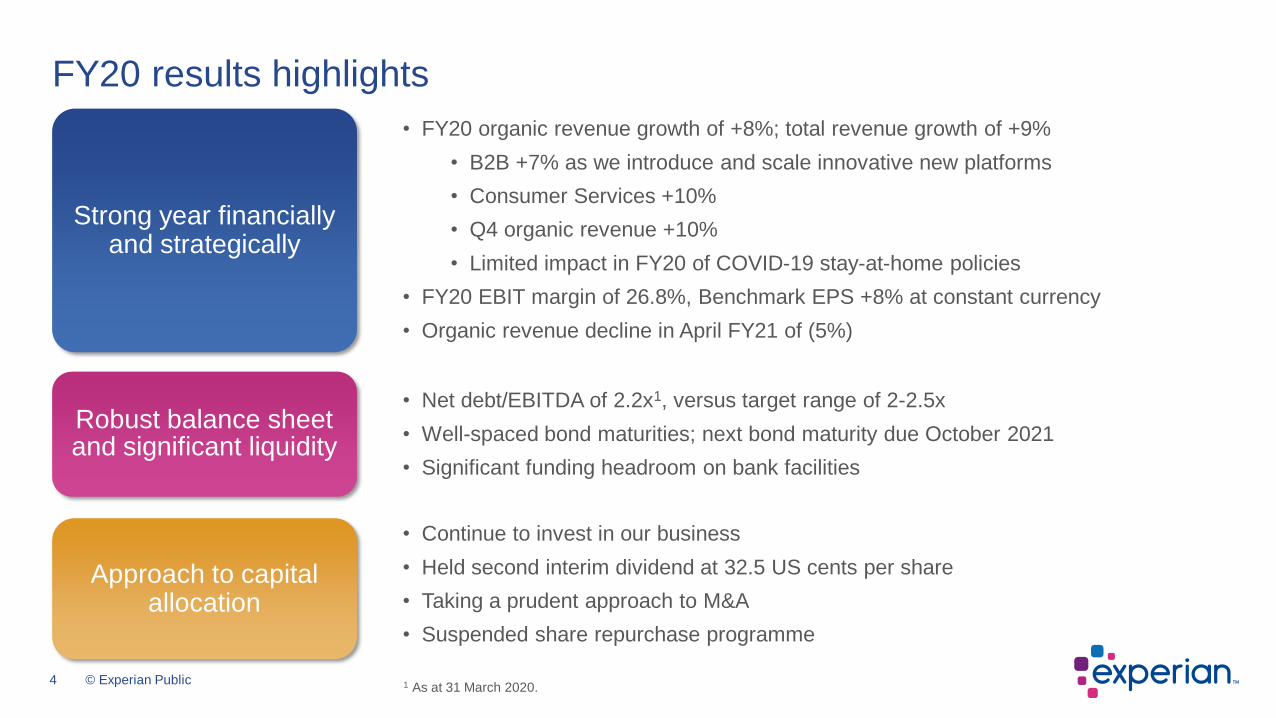
FY20 results highlights
• FY20 organic revenue growth of +8%; total revenue growth of +9%
• B2B +7% as we introduce and scale innovative new platforms
• Consumer Services +10%
• Q4 organic revenue +10%
• Limited impact in FY20 of COVID-19 stay-at-home policies
• FY20 EBIT margin of 26.8%, Benchmark EPS +8% at constant currency
• Organic revenue decline in April FY21 of (5%)
Strong year financially and strategically
Robust balance sheet and significant liquidity
• Continue to invest in our business
• Held second interim dividend at 32.5 US cents per share
• Taking a prudent approach to M&A
• Suspended share repurchase programme
Approach to capital allocation
• Net debt/EBITDA of 2.2x1, versus target range of 2-2.5x
• Well-spaced bond maturities; next bond maturity due October 2021
• Significant funding headroom on bank facilities
1 As at 31 March 2020.
5 © Experian Public
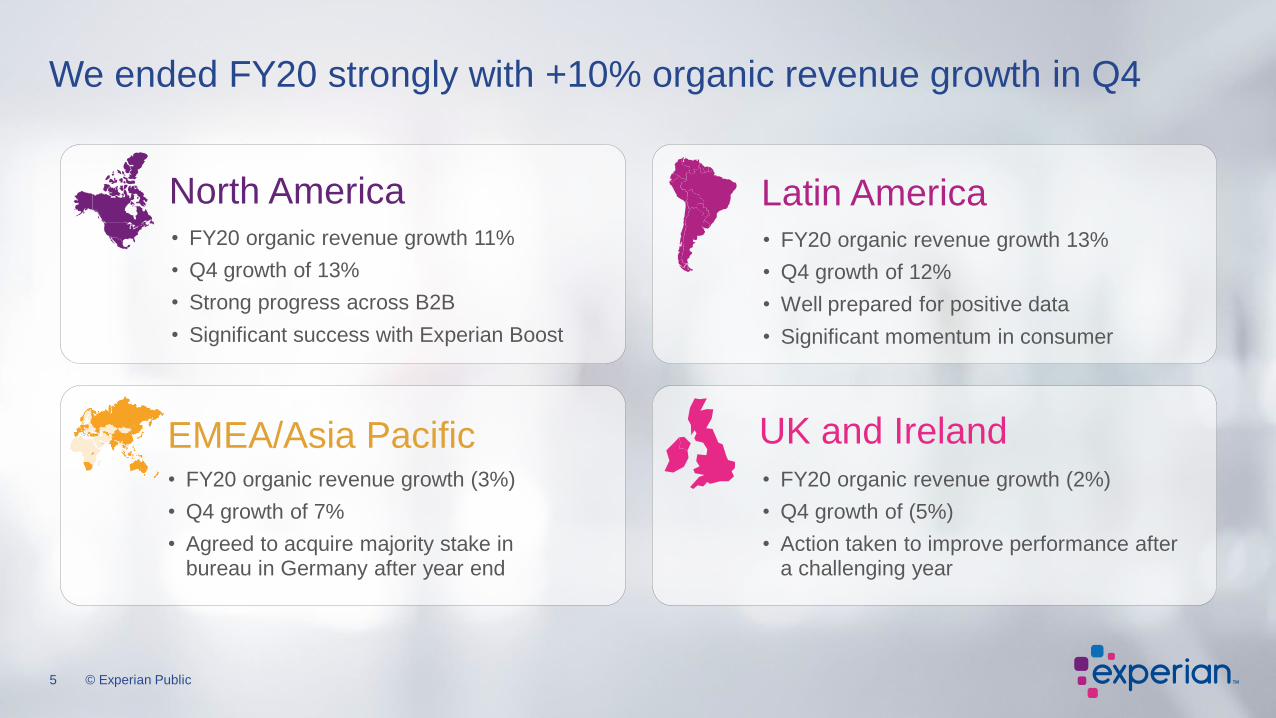
We ended FY20 strongly with +10% organic revenue growth in Q4
North America
UK and Ireland• FY20 organic revenue growth (2%)
• Q4 growth of (5%)
• Action taken to improve performance after a challenging year
• FY20 organic revenue growth 11%
• Q4 growth of 13%
• Strong progress across B2B
• Significant success with Experian Boost
EMEA/Asia Pacific• FY20 organic revenue growth (3%)
• Q4 growth of 7%
• Agreed to acquire majority stake in bureau in Germany after year end
Latin America• FY20 organic revenue growth 13%
• Q4 growth of 12%
• Well prepared for positive data
• Significant momentum in consumer
5 © Experian Public
6 © Experian Public
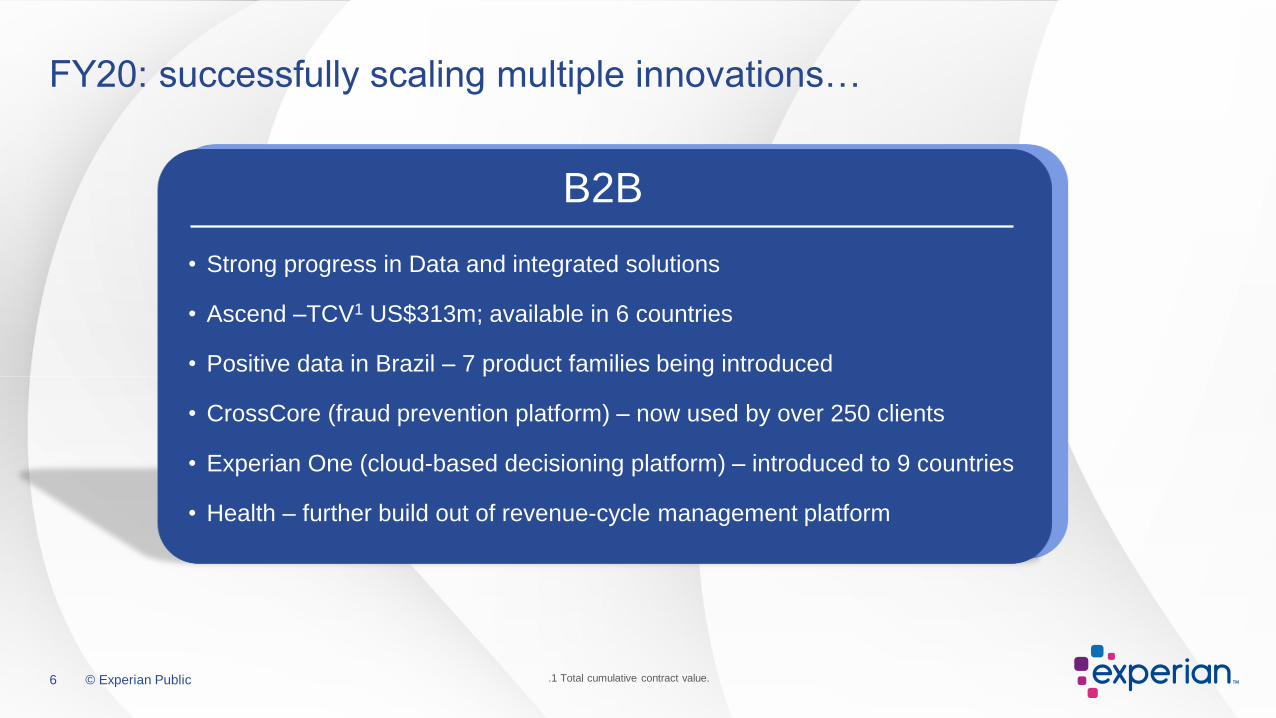
FY20: successfully scaling multiple innovations…
.1 Total cumulative contract value.
• Strong progress in Data and integrated solutions
• Ascend –TCV1 US$313m; available in 6 countries
• Positive data in Brazil – 7 product families being introduced
• CrossCore (fraud prevention platform) – now used by over 250 clients
• Experian One (cloud-based decisioning platform) – introduced to 9 countries
• Health – further build out of revenue-cycle management platform
B2B
6 © Experian Public
7 © Experian Public
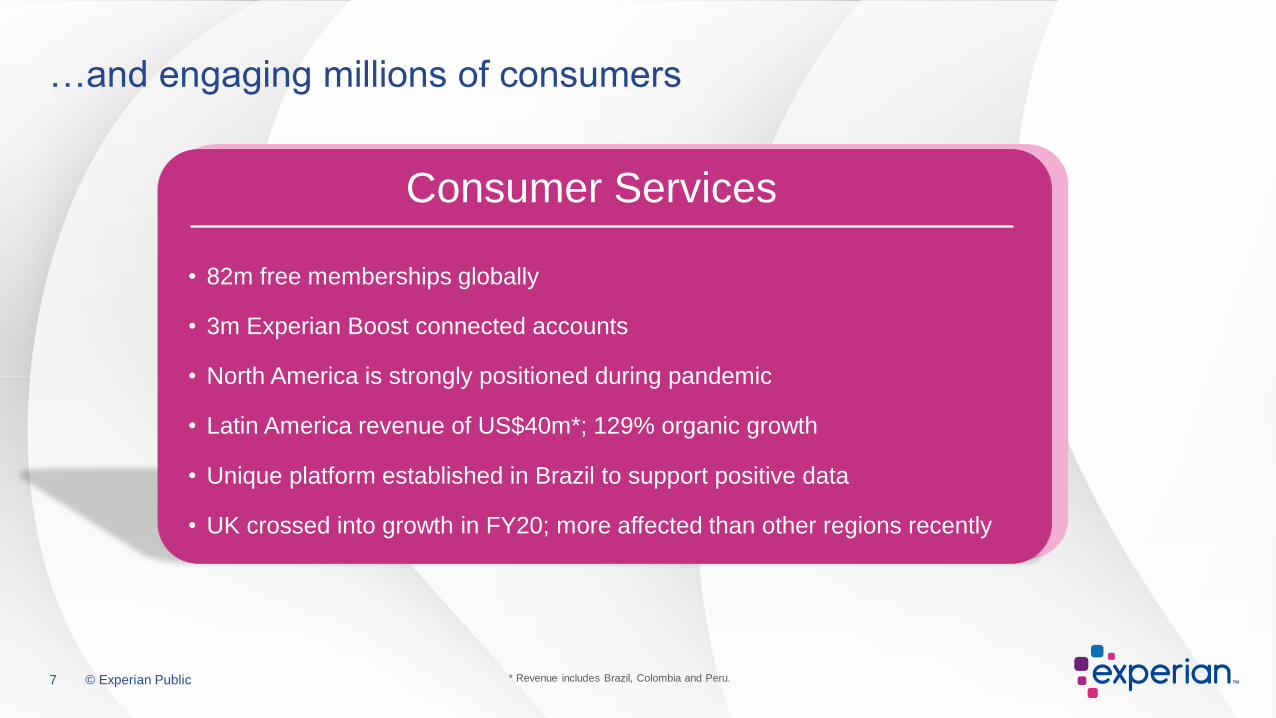
…and engaging millions of consumers
* Revenue includes Brazil, Colombia and Peru.
Consumer Services
7 © Experian Public
• 82m free memberships globally
• 3m Experian Boost connected accounts
• North America is strongly positioned during pandemic
• Latin America revenue of US$40m*; 129% organic growth
• Unique platform established in Brazil to support positive data
• UK crossed into growth in FY20; more affected than other regions recently
Consumer Services
8 © Experian Public
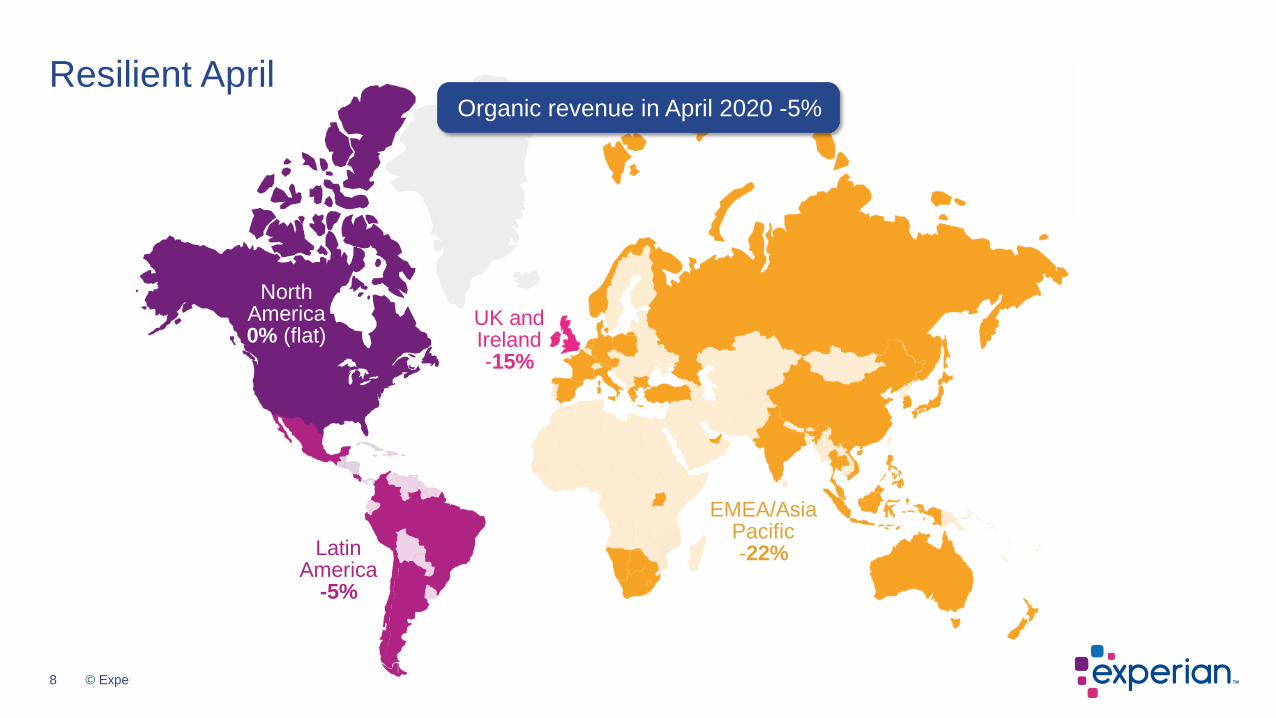
North America 0% (flat)
Latin America
-5%
EMEA/Asia Pacific-22%
UK and Ireland-15%
Organic revenue in April 2020 -5%
Resilient April
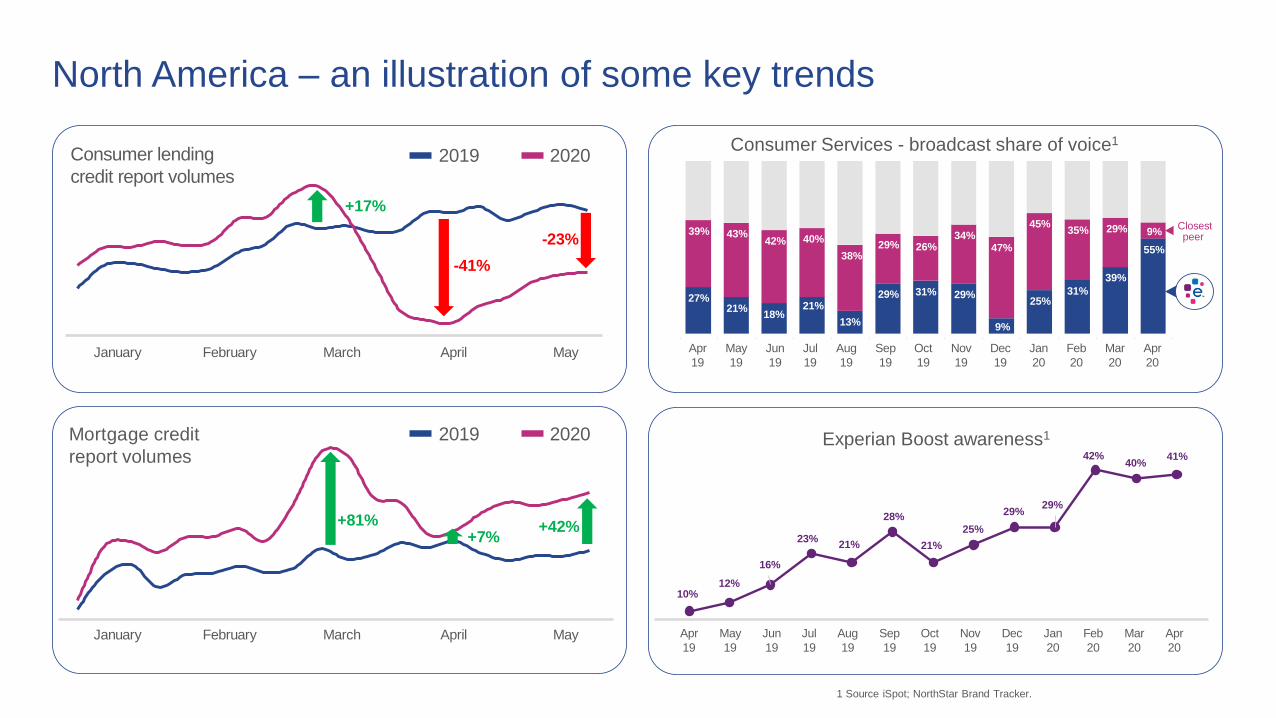
North America – an illustration of some key trends
Consumer lending
credit report volumes2019 2020
Consumer Services - broadcast share of voice1
Mortgage credit
report volumes
2019 2020
10%12%
16%
23%21%
28%
21%
25%
29%29%
42%40%
41%
Apr
19
May
19
Jun
19
Jul
19
Aug
19
Sep
19
Oct
19
Nov
19
Dec
19
Jan
20
Feb
20
Mar
20
Apr
20
Experian Boost awareness1
Closestpeer
27%21%
18%13%
29% 31% 29%
9%
25%31%
39%
55%
39% 43%42% 40%
38%29% 26%
34%47%
45%35% 29% 9%
Apr
19
May
19
Jun
19
Jul
19
Aug
19
Sep
19
Oct
19
Nov
19
Dec
19
Jan
20
Feb
20
Mar
20
Apr
20
21%
+42%+81%+7%
January February March April May
-23%
-41%
+17%
1 Source iSpot; NorthStar Brand Tracker.
January February March April May
10 © Experian Public
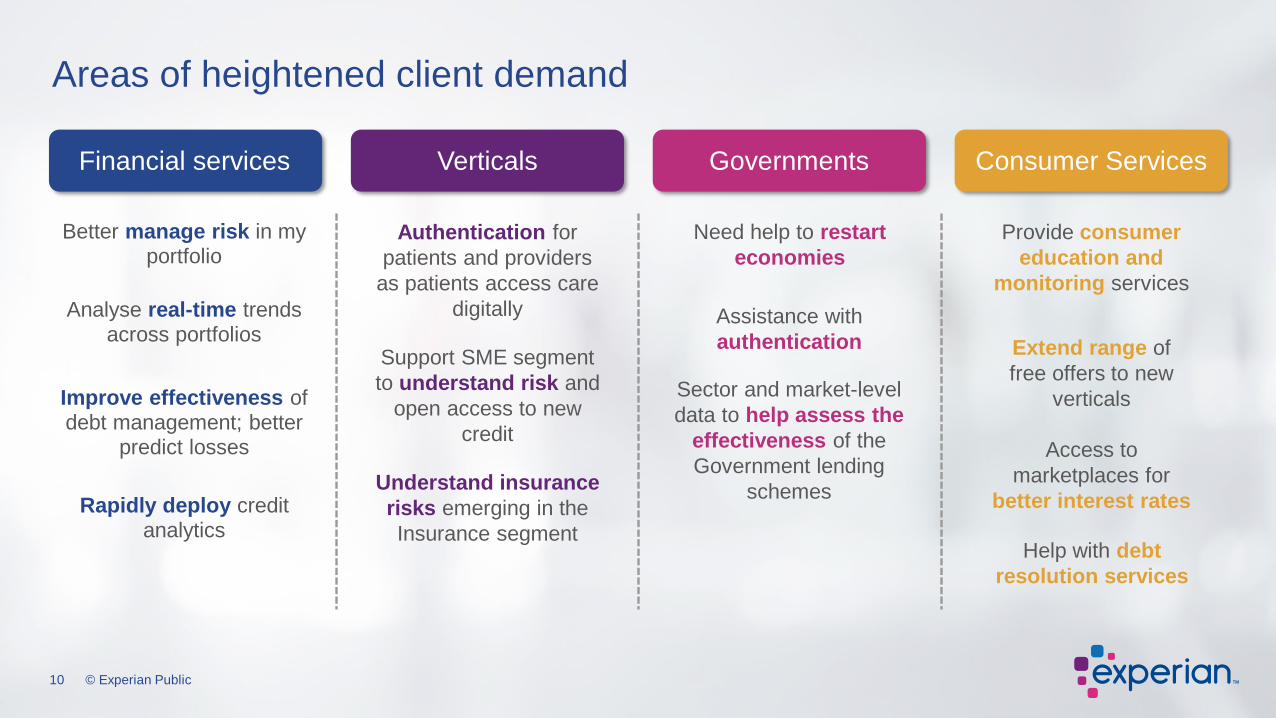
Financial services Verticals Governments Consumer Services
Rapidly deploy credit analytics
Better manage risk in my portfolio
Analyse real-time trends across portfolios
Improve effectiveness of debt management; better
predict losses
Authentication for
patients and providers
as patients access care
digitally
Support SME segment
to understand risk and
open access to new
credit
Understand insurance
risks emerging in the
Insurance segment
Provide consumer
education and
monitoring services
Extend range of
free offers to new
verticals
Access to
marketplaces for
better interest rates
Help with debt
resolution services
Need help to restart
economies
10 © Experian Public
Assistance with
authentication
Areas of heightened client demand
Sector and market-level
data to help assess the
effectiveness of the
Government lending
schemes
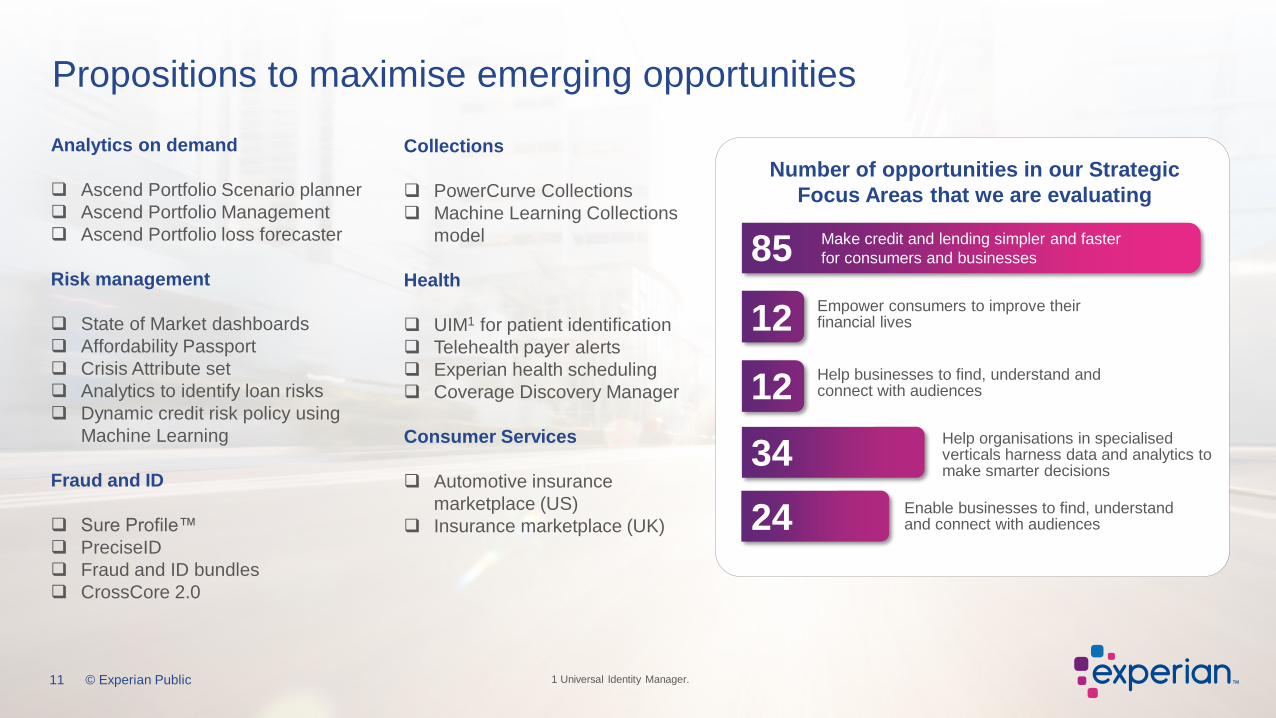
11 © Experian Public
Number of opportunities in our Strategic
Focus Areas that we are evaluating
Analytics on demand
❑ Ascend Portfolio Scenario planner
❑ Ascend Portfolio Management
❑ Ascend Portfolio loss forecaster
Risk management
❑ State of Market dashboards
❑ Affordability Passport
❑ Crisis Attribute set
❑ Analytics to identify loan risks
❑ Dynamic credit risk policy using
Machine Learning
Fraud and ID
❑ Sure Profile™
❑ PreciseID
❑ Fraud and ID bundles
❑ CrossCore 2.0
Collections
❑ PowerCurve Collections
❑ Machine Learning Collections
model
Health
❑ UIM1 for patient identification
❑ Telehealth payer alerts
❑ Experian health scheduling
❑ Coverage Discovery Manager
Consumer Services
❑ Automotive insurance
marketplace (US)
❑ Insurance marketplace (UK)
Make credit and lending simpler and faster
for consumers and businesses
Empower consumers to improve their financial lives
Help businesses to find, understand and connect with audiences
Help organisations in specialised verticals harness data and analytics to make smarter decisions
Enable businesses to find, understand and connect with audiences
85
12
12
34
24
11 © Experian Public 1 Universal Identity Manager.
Propositions to maximise emerging opportunities
12 © Experian Public
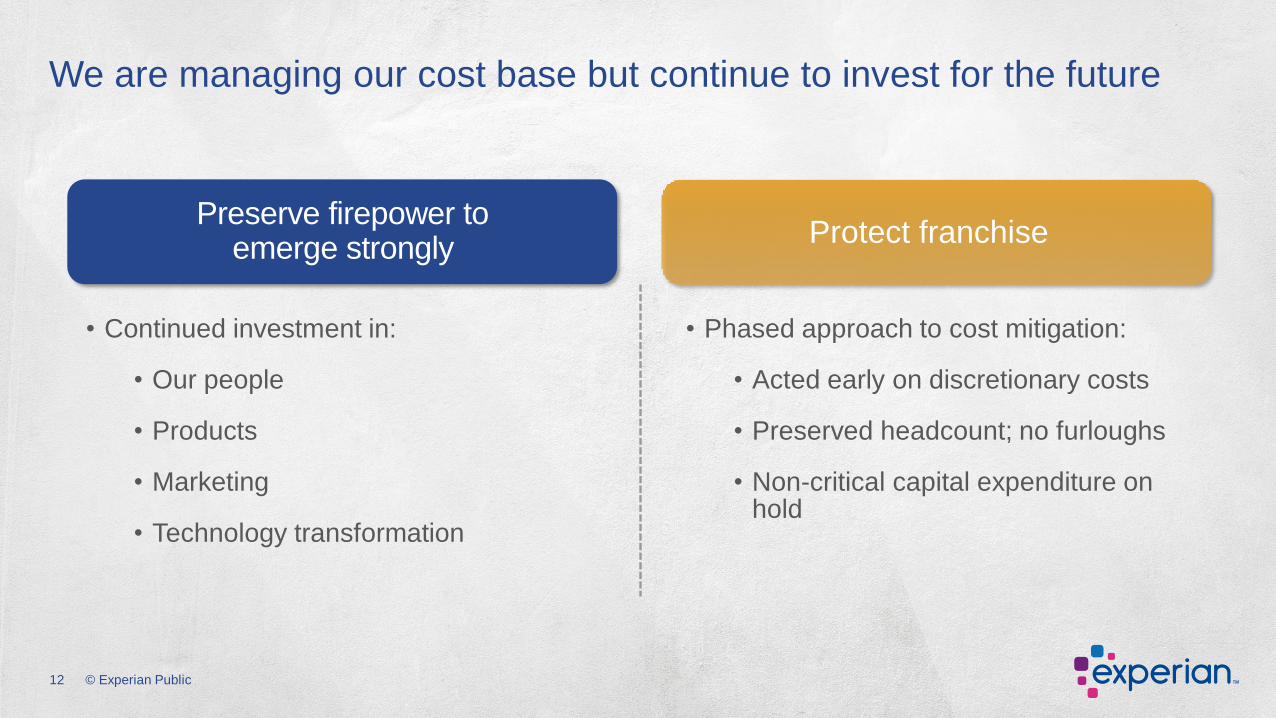
We are managing our cost base but continue to invest for the future
• Continued investment in:
• Our people
• Products
• Marketing
• Technology transformation
Preserve firepower to emerge strongly
Protect franchise
• Phased approach to cost mitigation:
• Acted early on discretionary costs
• Preserved headcount; no furloughs
• Non-critical capital expenditure on hold
12 © Experian Public

Financial Review
Lloyd Pitchford, Chief Financial Officer
14 © Experian Public
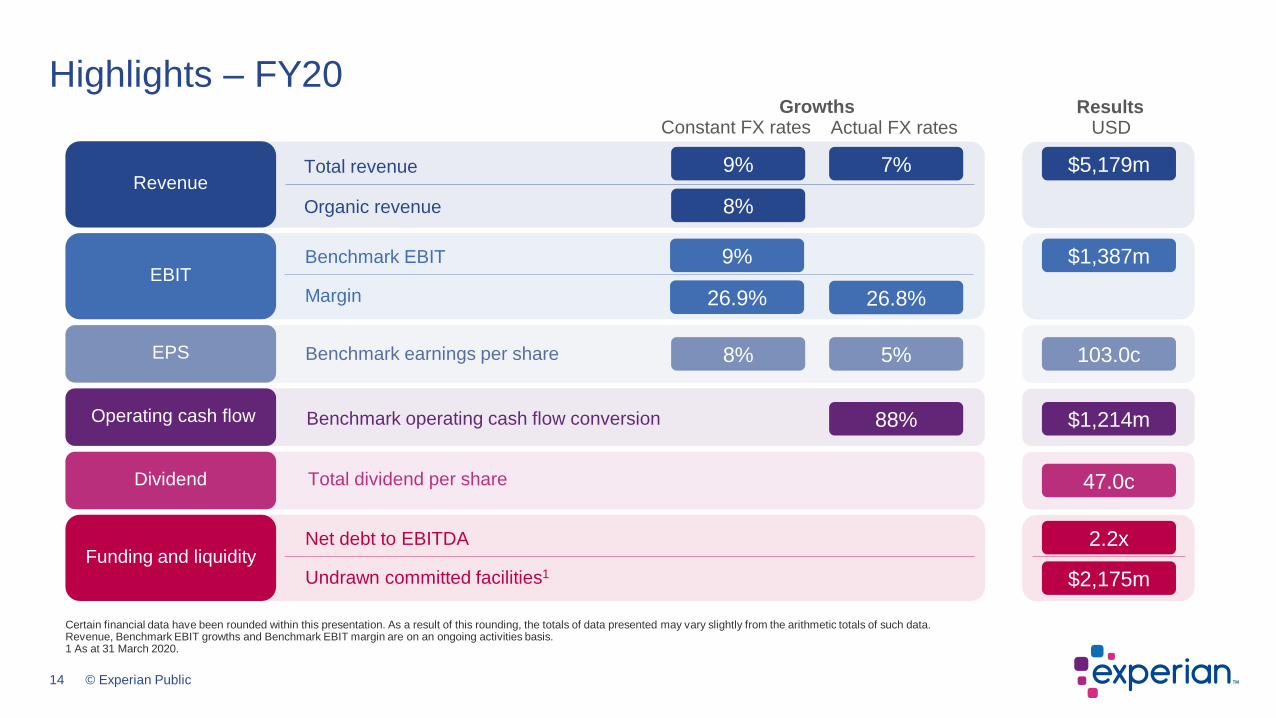
Highlights – FY20
Certain financial data have been rounded within this presentation. As a result of this rounding, the totals of data presented may vary slightly from the arithmetic totals of such data.Revenue, Benchmark EBIT growths and Benchmark EBIT margin are on an ongoing activities basis.1 As at 31 March 2020.
Total dividend per share
Benchmark earnings per share
Benchmark EBIT
Margin
Total revenue
Organic revenue
Constant FX rates
7%
8%
9%
9%
26.9%
5%8%
Benchmark operating cash flow conversion 88%
Revenue
EBIT
EPS
Operating cash flow
Dividend
Funding and liquidity2.2x
$2,175m
$5,179m
$1,387m
103.0c
$1,214m
47.0c
Growths
Net debt to EBITDA
Undrawn committed facilities1
Actual FX rates USDResults
26.8%
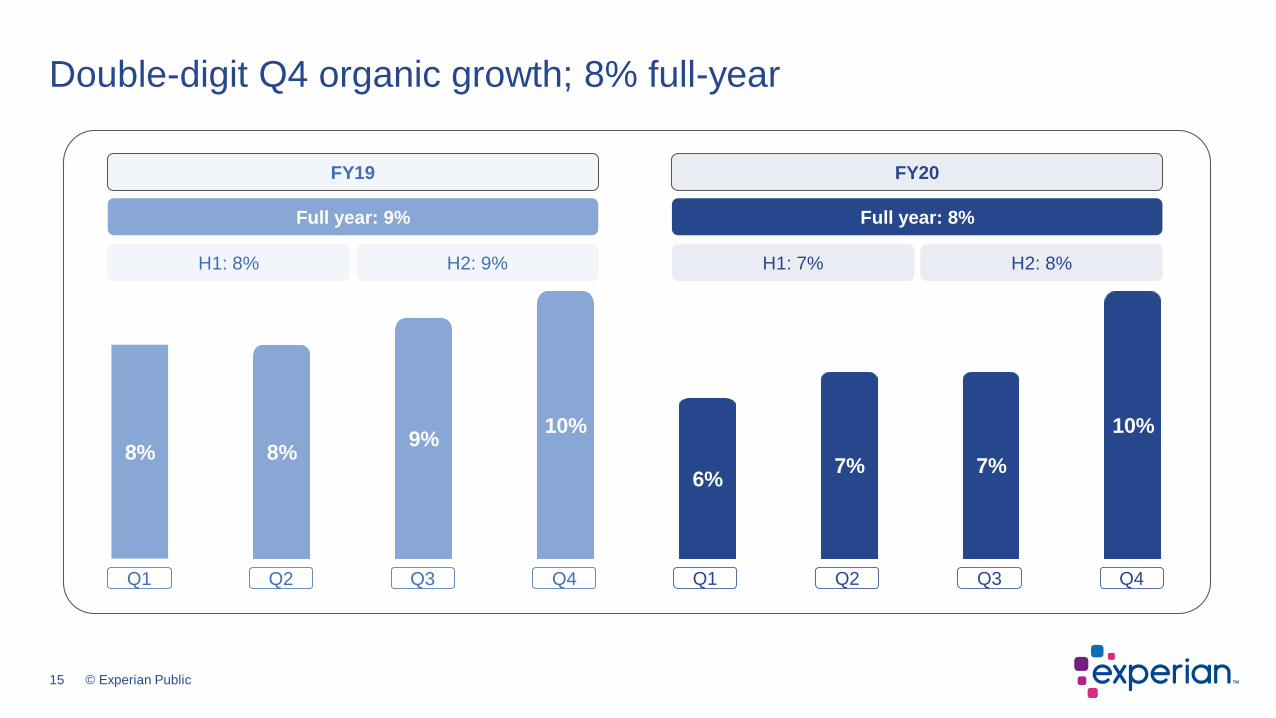
15 © Experian Public
Double-digit Q4 organic growth; 8% full-year
8% 8%9%
10%
6%7% 7%
10%
H2: 8%
Full year: 8%
H1: 7%
FY20
Q1 Q2 Q3 Q4Q1 Q2 Q3 Q4
H2: 9%
Full year: 9%
H1: 8%
FY19
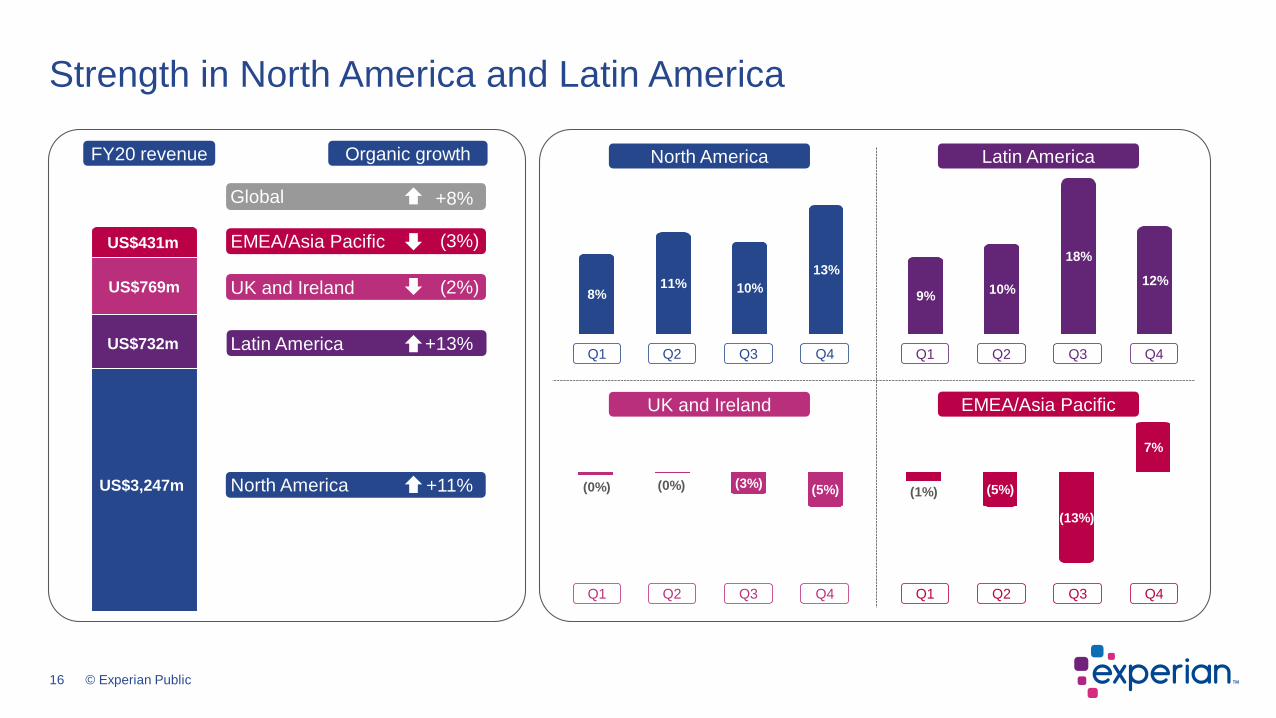
16 © Experian Public
(1%) (5%)
(13%)
7%
8%11% 10%
13%
9%10%
18%
12%
(0%) (0%) (3%)(5%)
North America Latin America
EMEA/Asia PacificUK and Ireland
Q1 Q2 Q3 Q4 Q1 Q2 Q3 Q4
Q1 Q2 Q3 Q4 Q1 Q2 Q3 Q4
Strength in North America and Latin America
North America
Latin America
UK and Ireland
EMEA/Asia Pacific
FY20 revenue
US$3,247m
US$732m
US$769m
US$431m
Organic growth
+11%
+13%
(2%)
(3%)
Global +8%
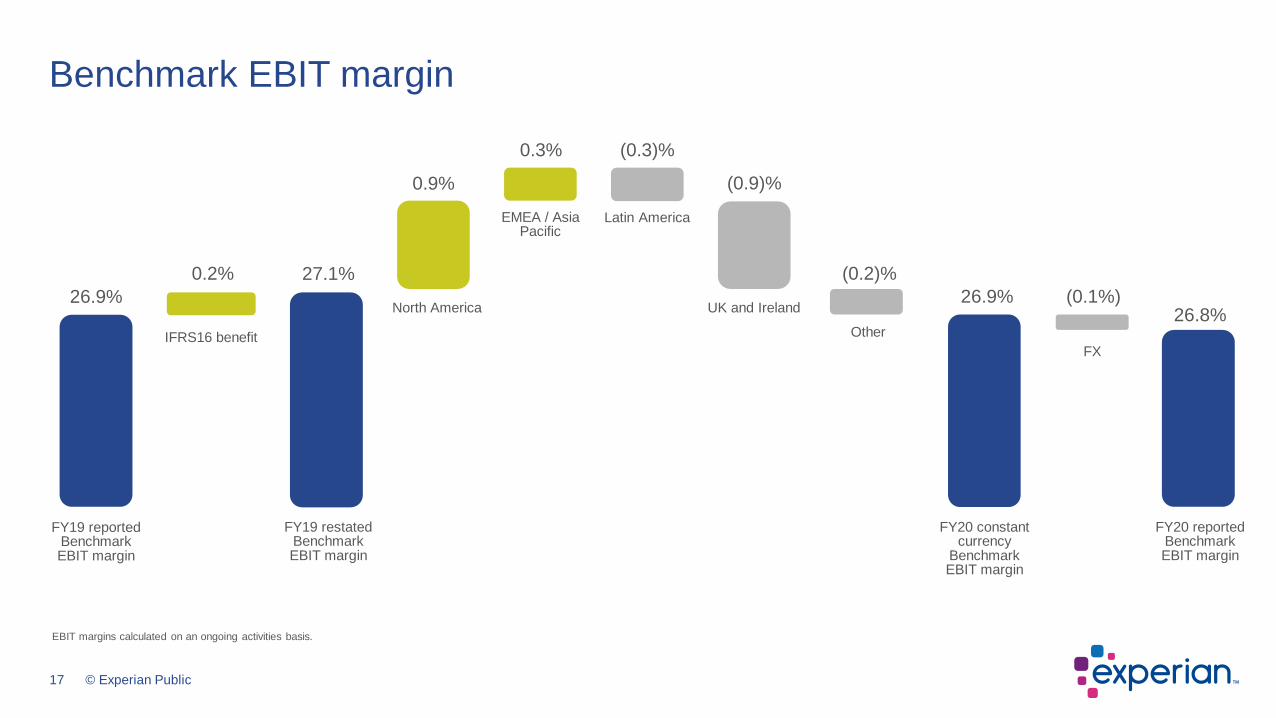
17 © Experian Public
Benchmark EBIT margin
EBIT margins calculated on an ongoing activities basis.
26.9%
0.9%
0.3% (0.3)%
(0.9)%
(0.2)%
26.9%
27.1% 0.2%
(0.1%)26.8%
FY19 reportedBenchmark EBIT margin
FY20 reportedBenchmark EBIT margin
FY19 restatedBenchmark EBIT margin
FY20 constant currency
Benchmark EBIT margin
IFRS16 benefit
North America
Latin AmericaEMEA / Asia Pacific
UK and Ireland
Other
FX
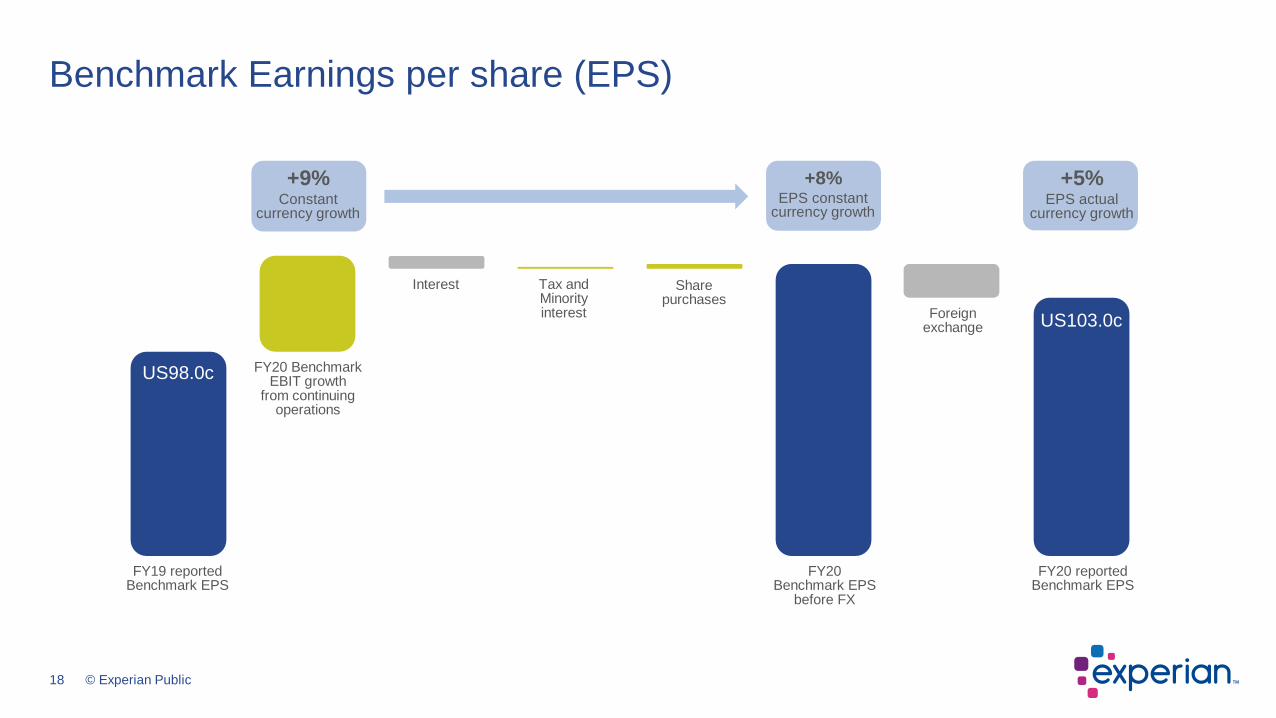
18 © Experian Public
+5%EPS actual
currency growth
+8%EPS constant
currency growth
+9%Constant
currency growth
Benchmark Earnings per share (EPS)
FY20 reported Benchmark EPS
FY20 Benchmark EPS
before FX
US98.0c
US103.0c
FY19 reportedBenchmark EPS
FY20 Benchmark EBIT growth
from continuing operations
Interest Tax and Minority interest
Share purchases
Foreign exchange
19 © Experian Public
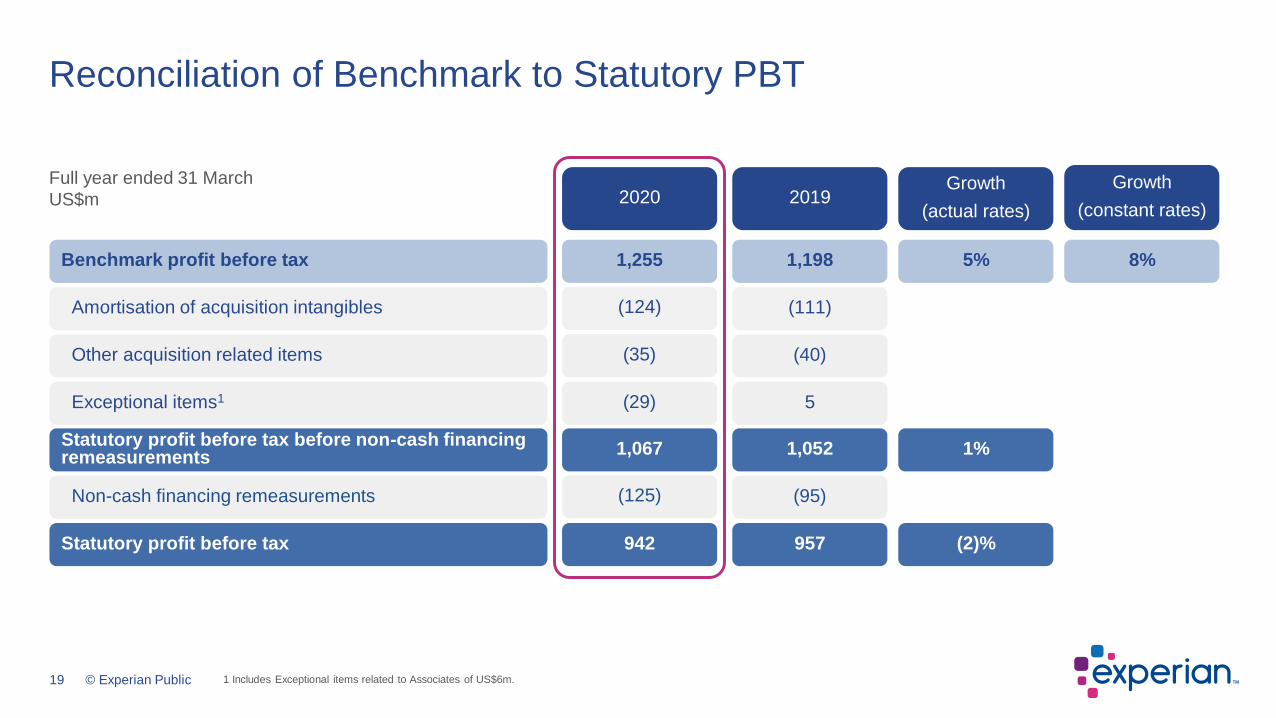
Reconciliation of Benchmark to Statutory PBT
Full year ended 31 March
US$mGrowth
(actual rates)
(124)Amortisation of acquisition intangibles
2020
(35)Other acquisition related items
1,255Benchmark profit before tax
(111)
2019
(40)
1,198 5%
Growth
(constant rates)
8%
1,067 1,052Statutory profit before tax before non-cash financing remeasurements
1%
(29)Exceptional items1 5
942 957Statutory profit before tax (2)%
(125) (95)Non-cash financing remeasurements
1 Includes Exceptional items related to Associates of US$6m.
20 © Experian Public
0
200
400
600
800
1,000
1,200
1,400
1,600
1,800
2,000
Cashgenerated
Uses ofcash
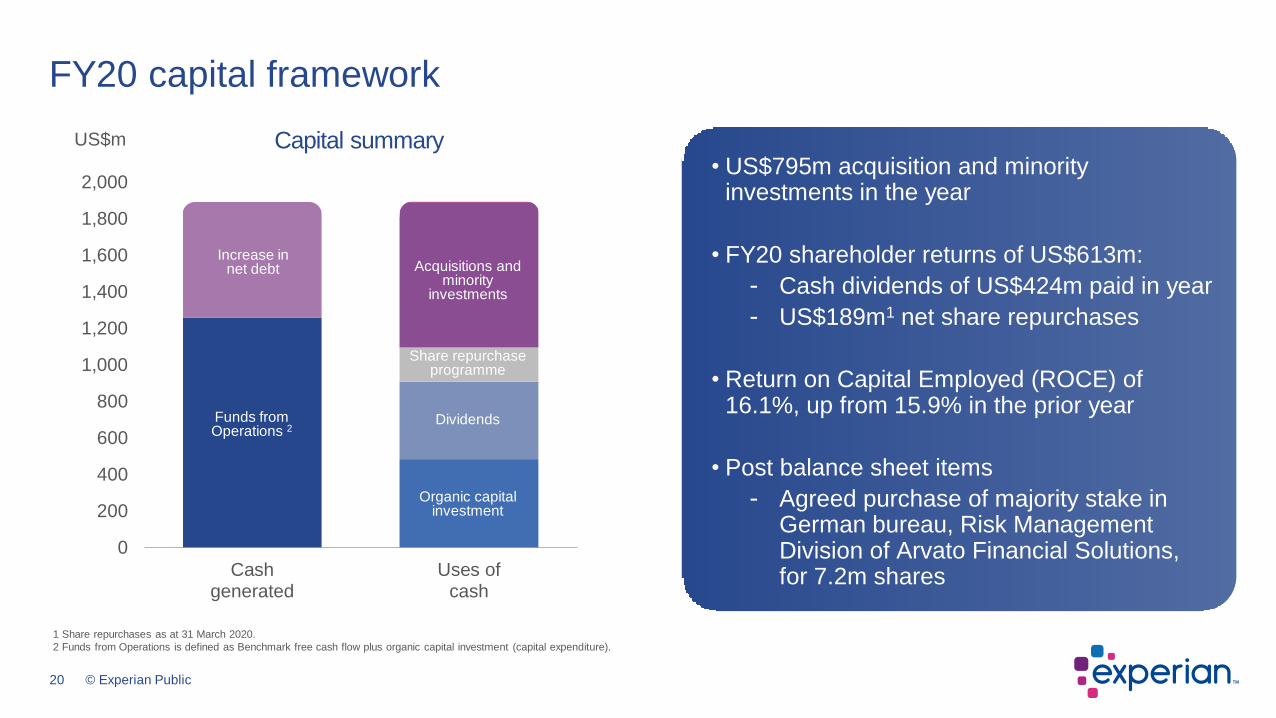
FY20 capital framework
1 Share repurchases as at 31 March 2020.
2 Funds from Operations is defined as Benchmark free cash flow plus organic capital investment (capital expenditure).
Capital summary• US$795m acquisition and minority
investments in the year
• FY20 shareholder returns of US$613m:
- Cash dividends of US$424m paid in year
- US$189m1 net share repurchases
• Return on Capital Employed (ROCE) of 16.1%, up from 15.9% in the prior year
• Post balance sheet items
- Agreed purchase of majority stake in German bureau, Risk Management Division of Arvato Financial Solutions, for 7.2m shares
US$m
Organic capital investment
Dividends
Share repurchaseprogramme
Acquisitions and minority
investments
Increase in net debt
Funds from Operations 2
21 © Experian Public
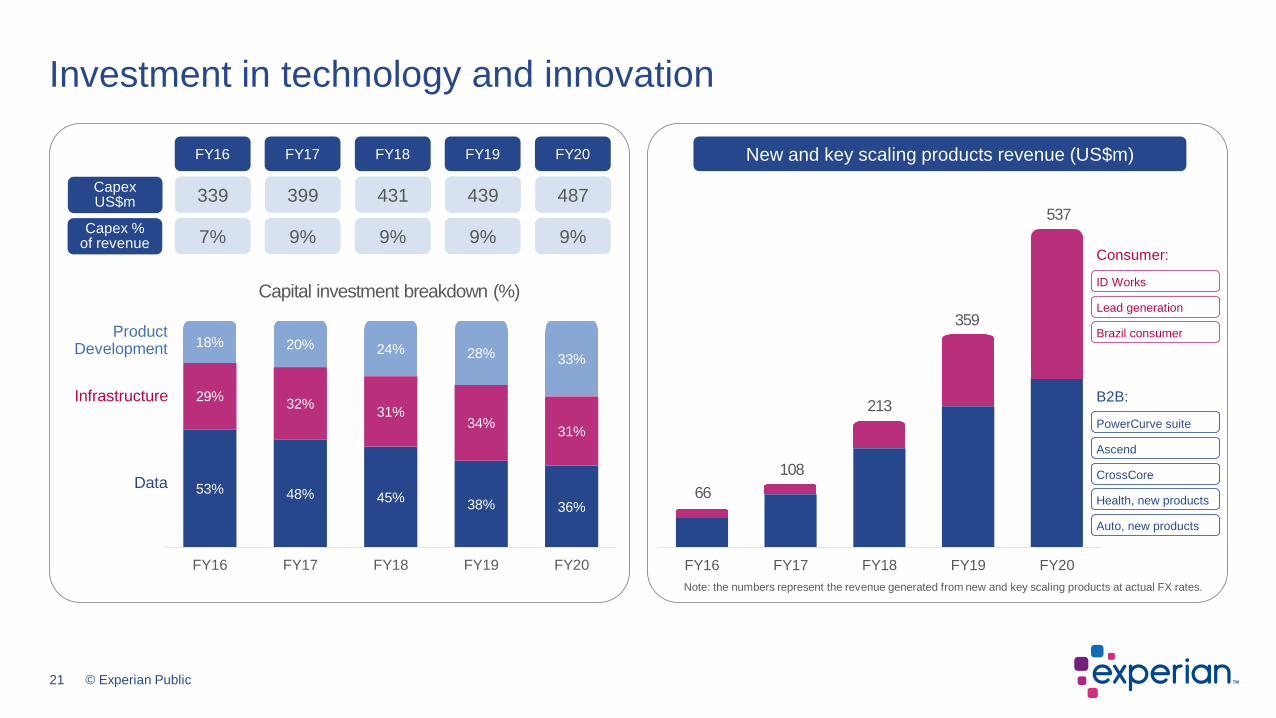
Investment in technology and innovation
FY16 FY17 FY18 FY19 FY20
53% 48% 45%38% 36%
29%32%
31%34%
31%
18% 20% 24% 28% 33%
FY16 FY17 FY18 FY19 FY20
7% 9% 9% 9% 9%
339 399 431 439 487
Capex % of revenue
Capex US$m
FY16 FY17 FY18 FY19 FY20
Infrastructure
Data
Product Development
Capital investment breakdown (%)
New and key scaling products revenue (US$m)
66
108
213
359
537
Consumer:
ID Works
Lead generation
Brazil consumer
B2B:
PowerCurve suite
Ascend
CrossCore
Health, new products
Auto, new products
Note: the numbers represent the revenue generated from new and key scaling products at actual FX rates.
22 © Experian Public
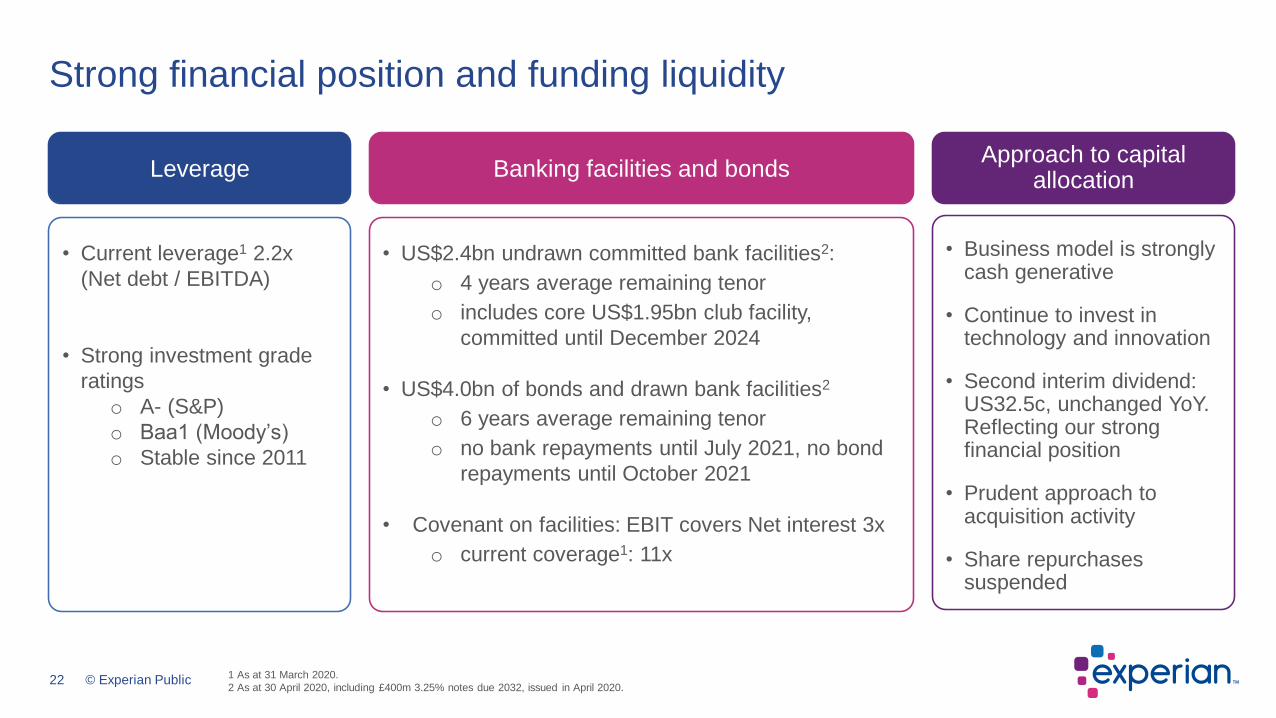
Strong financial position and funding liquidity
• Current leverage1 2.2x
(Net debt / EBITDA)
• Strong investment grade
ratings
o A- (S&P)
o Baa1 (Moody’s)
o Stable since 2011
Leverage
• US$2.4bn undrawn committed bank facilities2:
o 4 years average remaining tenor
o includes core US$1.95bn club facility,
committed until December 2024
• US$4.0bn of bonds and drawn bank facilities2
o 6 years average remaining tenor
o no bank repayments until July 2021, no bond
repayments until October 2021
• Covenant on facilities: EBIT covers Net interest 3x
o current coverage1: 11x
Banking facilities and bonds
• Business model is strongly cash generative
• Continue to invest in technology and innovation
• Second interim dividend: US32.5c, unchanged YoY. Reflecting our strong financial position
• Prudent approach to acquisition activity
• Share repurchases suspended
Approach to capital allocation
1 As at 31 March 2020.
2 As at 30 April 2020, including £400m 3.25% notes due 2032, issued in April 2020.
23 © Experian Public
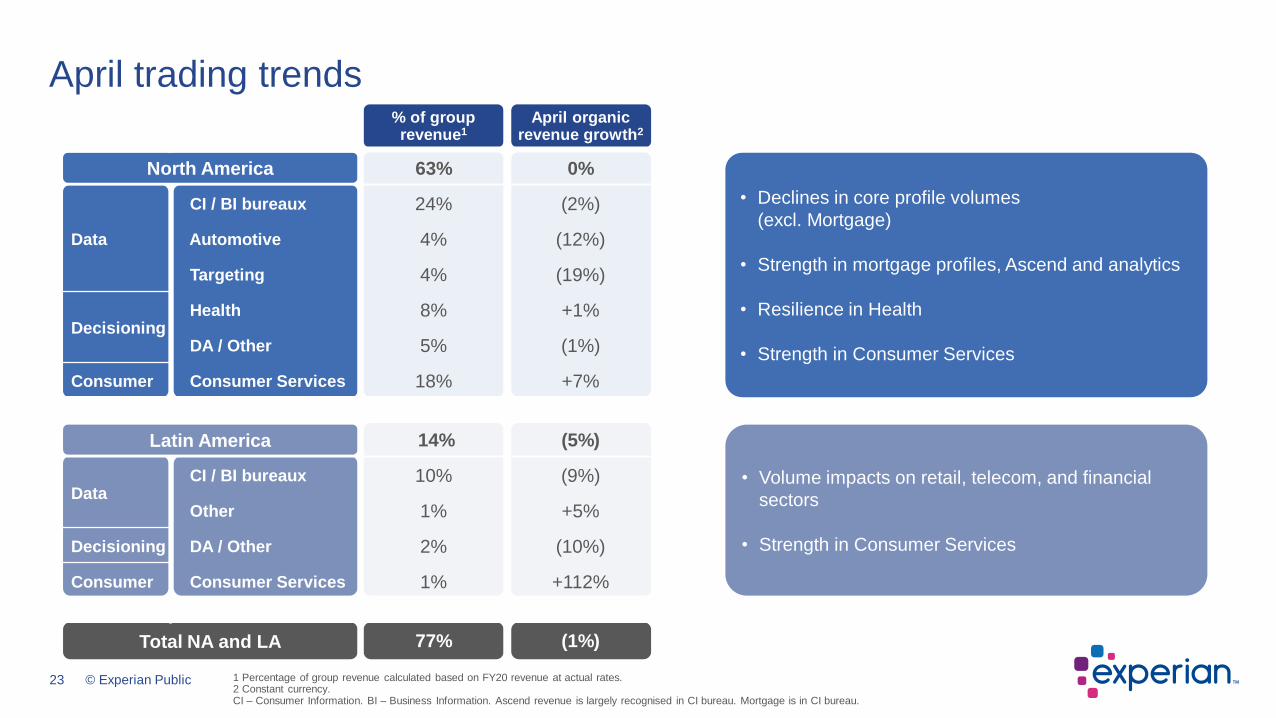
• Volume impacts on retail, telecom, and financial
sectors
• Strength in Consumer Services
• Declines in core profile volumes
(excl. Mortgage)
• Strength in mortgage profiles, Ascend and analytics
• Resilience in Health
• Strength in Consumer Services
April trading trends
1 Percentage of group revenue calculated based on FY20 revenue at actual rates.2 Constant currency.CI – Consumer Information. BI – Business Information. Ascend revenue is largely recognised in CI bureau. Mortgage is in CI bureau.
North America
Latin America
Total NA and LA
% of group revenue1
April organic revenue growth2
63% 0%
Data
CI / BI bureaux 24% (2%)
Automotive 4% (12%)
Targeting 4% (19%)
DecisioningHealth 8% +1%
DA / Other 5% (1%)
Consumer Consumer Services 18% +7%
14% (5%)
DataCI / BI bureaux 10% (9%)
Other 1% +5%
Decisioning DA / Other 2% (10%)
Consumer Consumer Services 1% +112%
77% (1%)
24 © Experian Public
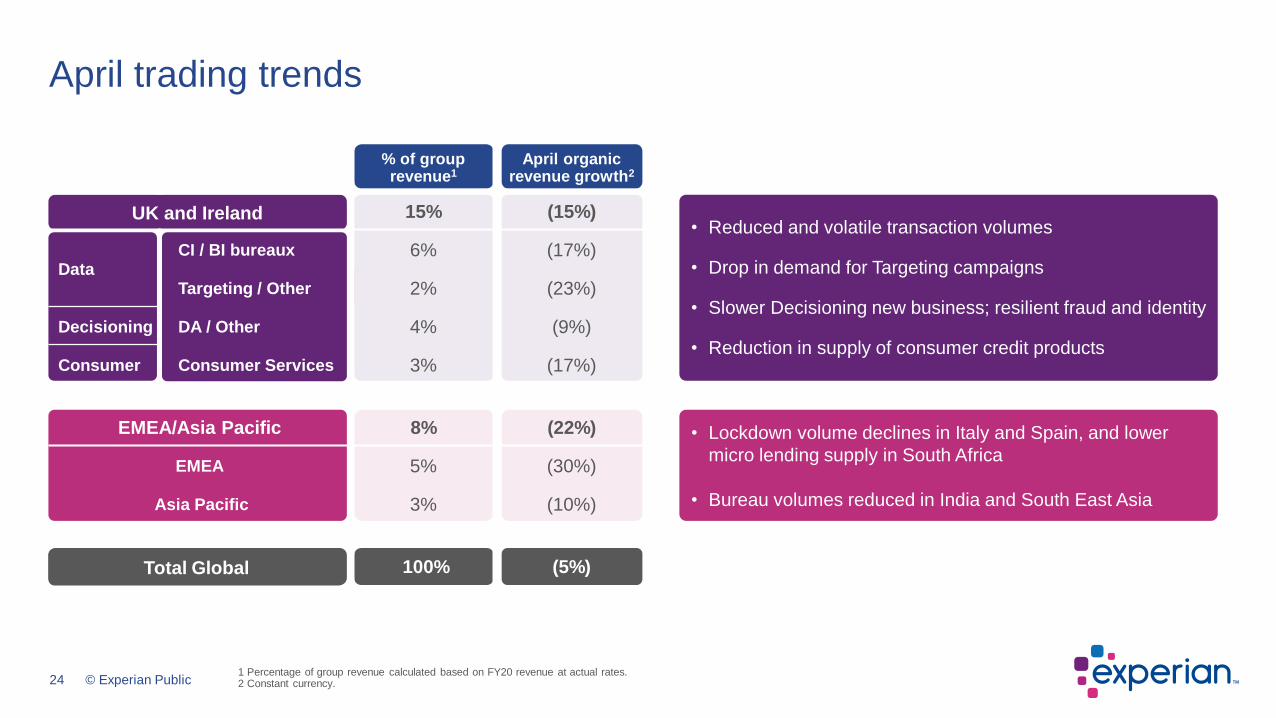
April trading trends
1 Percentage of group revenue calculated based on FY20 revenue at actual rates.2 Constant currency.
UK and Ireland
Total Global
• Reduced and volatile transaction volumes
• Drop in demand for Targeting campaigns
• Slower Decisioning new business; resilient fraud and identity
• Reduction in supply of consumer credit products
• Lockdown volume declines in Italy and Spain, and lower
micro lending supply in South Africa
• Bureau volumes reduced in India and South East Asia
% of group revenue1
April organic revenue growth2
15% (15%)
DataCI / BI bureaux 6% (17%)
Targeting / Other 2% (23%)
Decisioning DA / Other 4% (9%)
Consumer Consumer Services 3% (17%)
EMEA/Asia Pacific 8% (22%)
EMEA 5% (30%)
Asia Pacific 3% (10%)
100% (5%)
25 © Experian Public
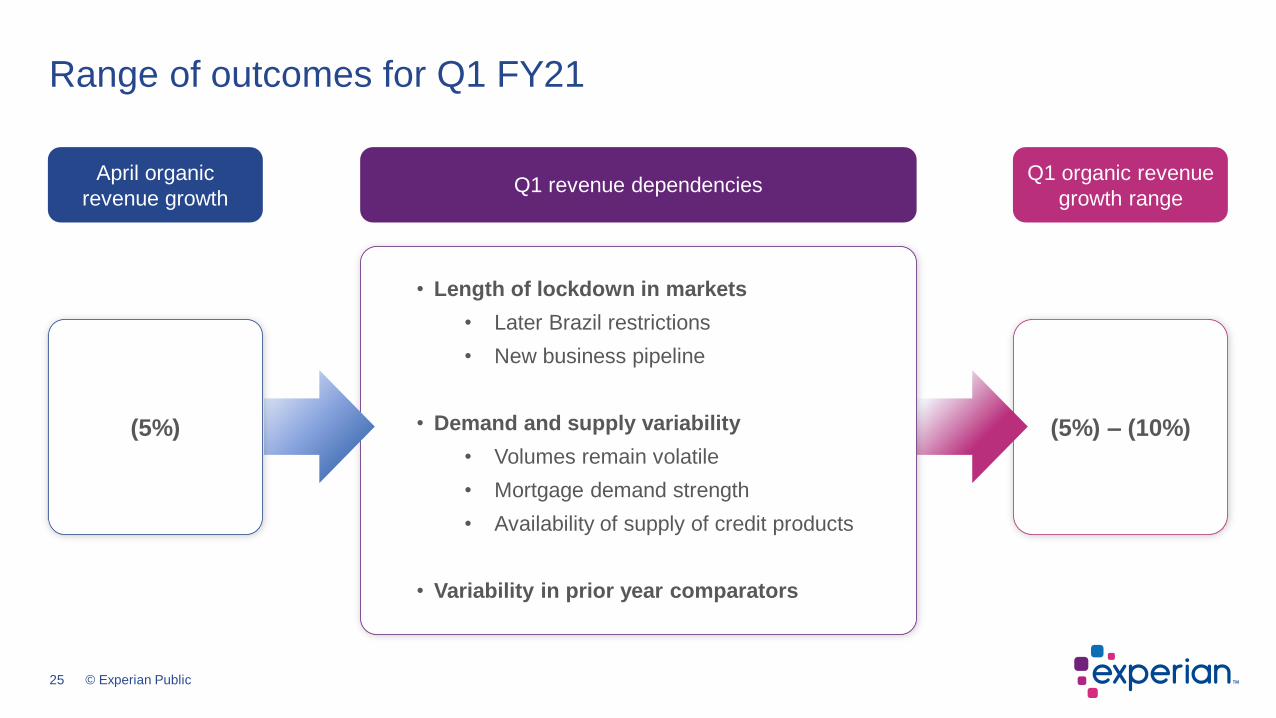
(5%) – (10%)
Q1 revenue dependencies
Range of outcomes for Q1 FY21
Q1 organic revenue
growth range
April organic
revenue growth
• Length of lockdown in markets
• Later Brazil restrictions
• New business pipeline
• Demand and supply variability
• Volumes remain volatile
• Mortgage demand strength
• Availability of supply of credit products
• Variability in prior year comparators
(5%)
26 © Experian Public
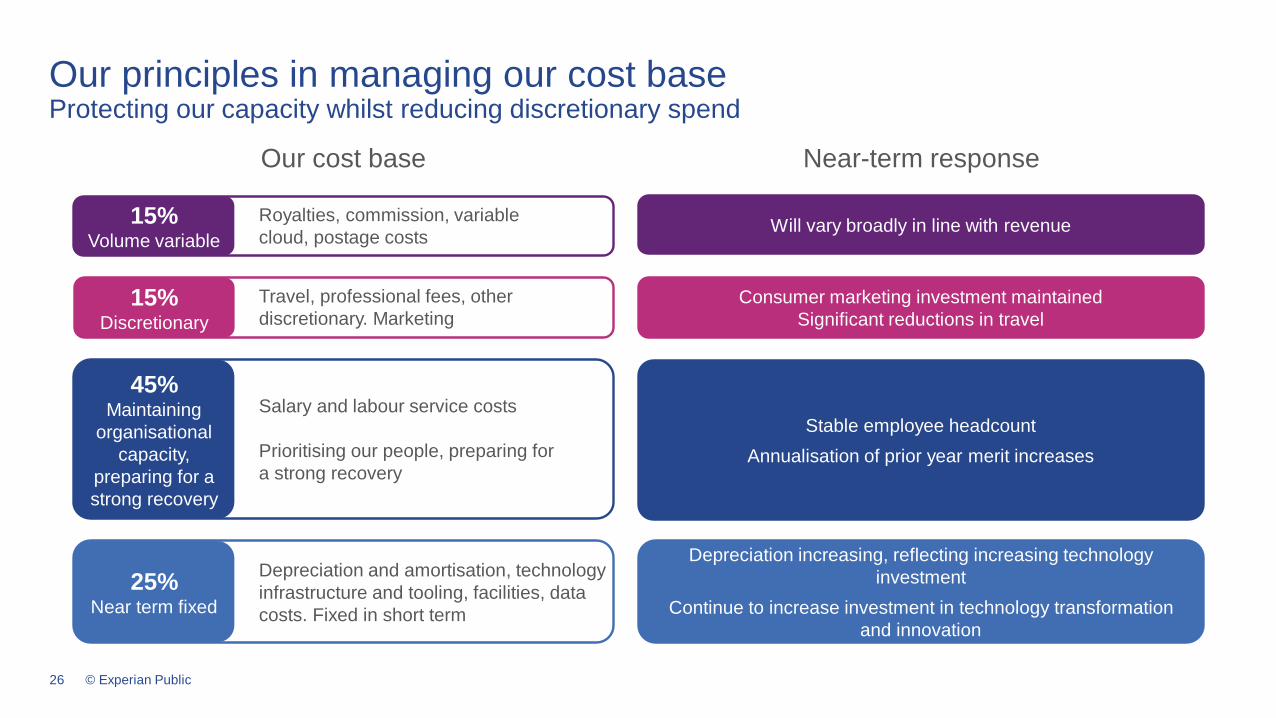
Our cost base Near-term response
15%Volume variable
Royalties, commission, variable
cloud, postage costs
45%Maintaining
organisational
capacity,
preparing for a
strong recovery
Salary and labour service costs
Prioritising our people, preparing for
a strong recovery
15%Discretionary
Travel, professional fees, other
discretionary. Marketing
25%Near term fixed
Depreciation and amortisation, technology
infrastructure and tooling, facilities, data
costs. Fixed in short term
Will vary broadly in line with revenue
Consumer marketing investment maintained
Significant reductions in travel
Stable employee headcount
Annualisation of prior year merit increases
Depreciation increasing, reflecting increasing technology
investment
Continue to increase investment in technology transformation
and innovation
Our principles in managing our cost baseProtecting our capacity whilst reducing discretionary spend
27 © Experian Public
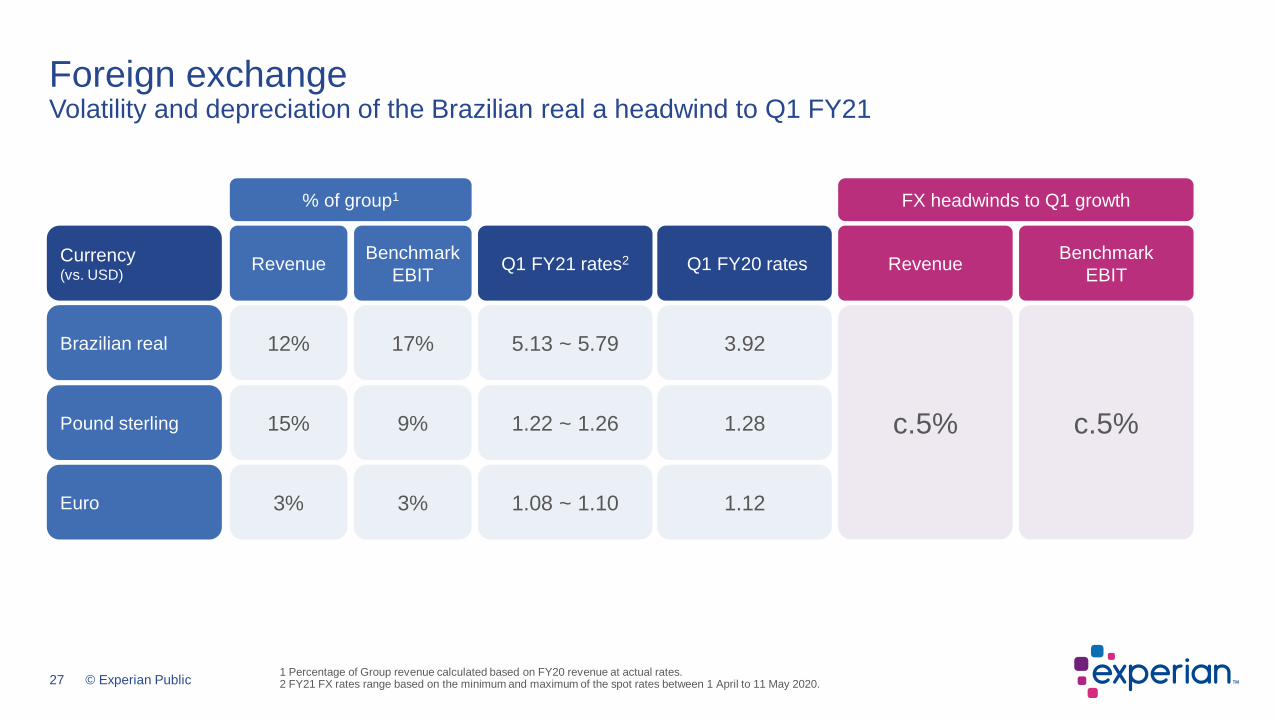
Currency(vs. USD)
Revenue Q1 FY21 rates2 Q1 FY20 rates
Brazilian real 12% 5.13 ~ 5.79 3.92
Euro 3% 1.08 ~ 1.10 1.12
Pound sterling 15% 1.22 ~ 1.26 1.28
Revenue
c.5%
Benchmark
EBIT
17%
3%
9%
Benchmark
EBIT
c.5%
% of group1 FX headwinds to Q1 growth
1 Percentage of Group revenue calculated based on FY20 revenue at actual rates.2 FY21 FX rates range based on the minimum and maximum of the spot rates between 1 April to 11 May 2020.
Foreign exchangeVolatility and depreciation of the Brazilian real a headwind to Q1 FY21
28 © Experian Public
• A strong FY20 for Experian, financially and strategically
• Taken swift action in response to the COVID-19 pandemic
• Business is running smoothly, as we protect our people and help society through the crisis
• Strong balance sheet with significant funding headroom and liquidity
• While short-term headwinds will affect performance our business has resilient qualities and we are rapidly pivoting to new areas of demand
• Taking a thoughtful approach to cost management as we position the business strongly for the future
Closing summary

Preliminary results for the yearended 31 March 2020
20 May 2020

Appendix
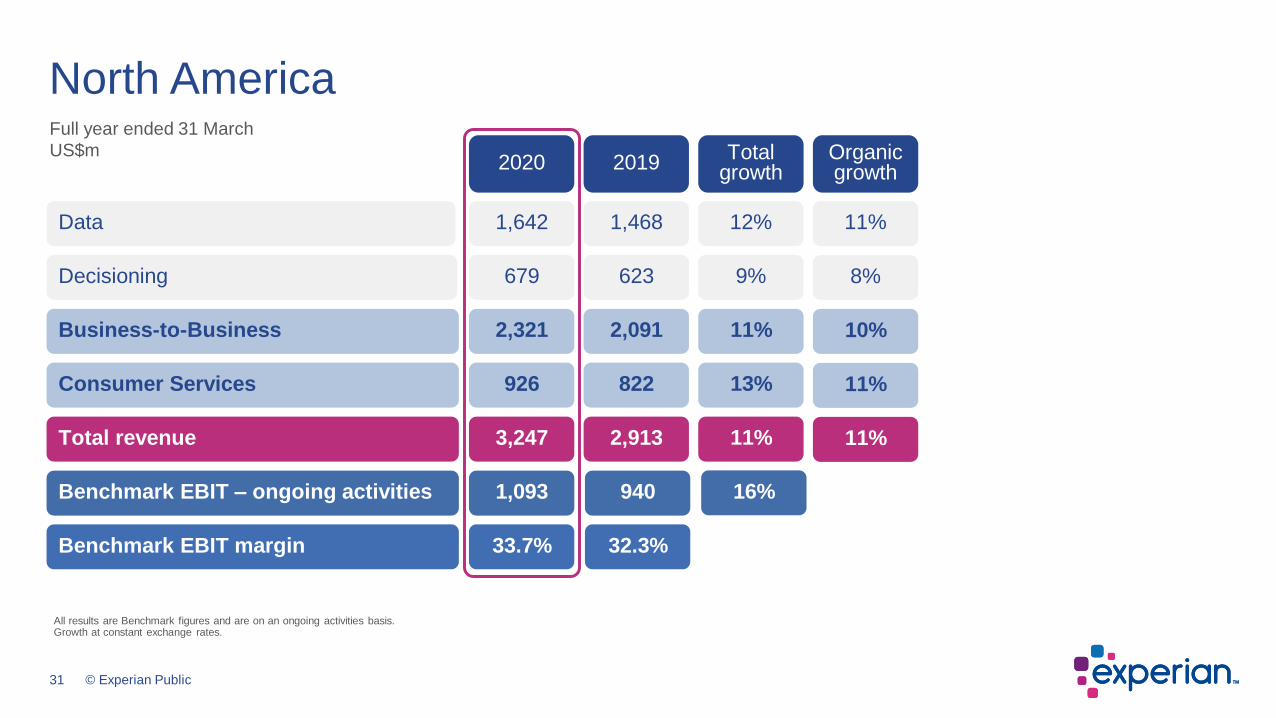
31 © Experian Public
Full year ended 31 March
US$m
North America
All results are Benchmark figures and are on an ongoing activities basis.Growth at constant exchange rates.
Total growth
679Decisioning
2020
2,321
926
3,247
1,093
33.7%
Business-to-Business
Consumer Services
1,642Data
623
2019
2,091
822
2,913
940
32.3%
1,468
Total revenue
Benchmark EBIT – ongoing activities
Benchmark EBIT margin
9%
11%
13%
11%
16%
12%
Organic growth
8%
10%
11%
11%
11%
32 © Experian Public
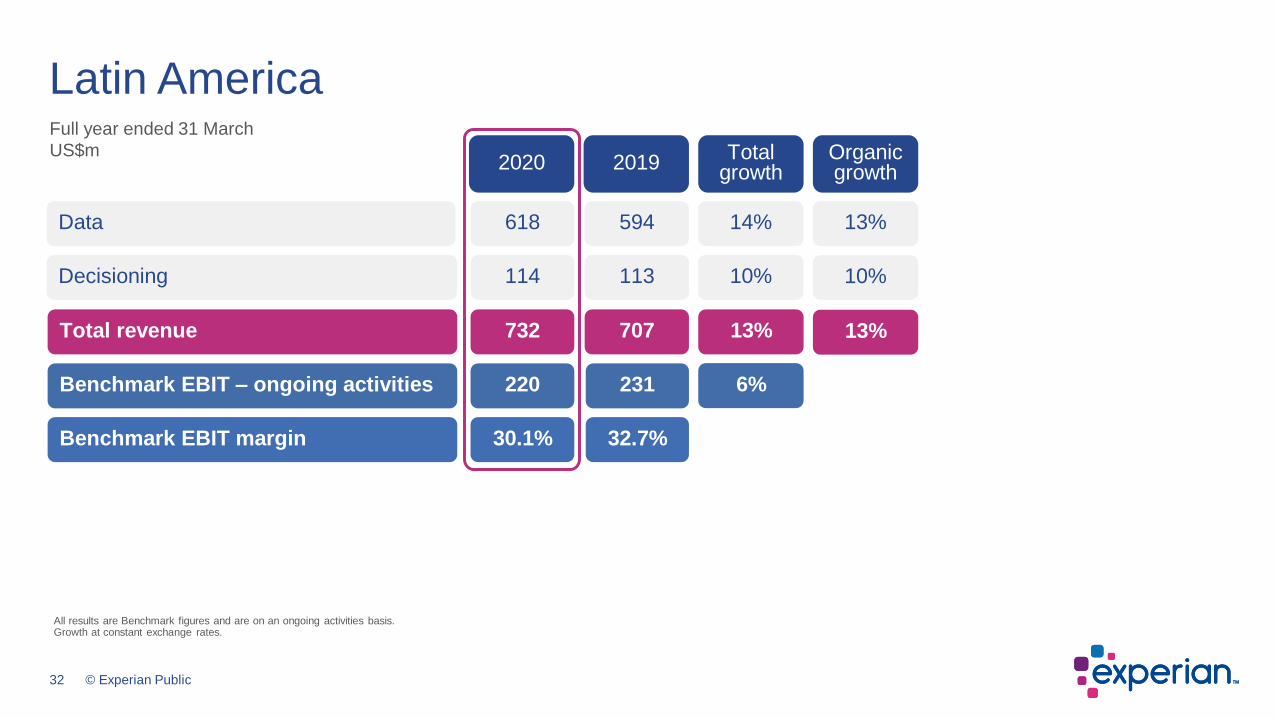
Latin AmericaFull year ended 31 March
US$m Total growth
Decisioning
2020
Data
2019Organic growth
732
220
30.1%
707
231
32.7%
Total revenue
Benchmark EBIT – ongoing activities
Benchmark EBIT margin
13%
6%
13%
114
618
113
594
10%
14%
10%
13%
All results are Benchmark figures and are on an ongoing activities basis.Growth at constant exchange rates.

33 © Experian Public
Full year ended 31 March
US$m Total growth
Decisioning
2020
Business-to-Business
Consumer Services
Data
2019
Total revenue
Benchmark EBIT – ongoing activities
Benchmark EBIT margin
Organic growth
227
608
161
769
171
22.2%
381
262
650
163
813
230
28.3%
388
(10)%
(3)%
2%
(2)%
(22)%
1%
(10)%
(3)%
2%
(2)%
1%
UK and Ireland
All results are Benchmark figures and are on an ongoing activities basis.Growth at constant exchange rates.FY19 has been restated for the divestment of certain B2B businesses.
34 © Experian Public
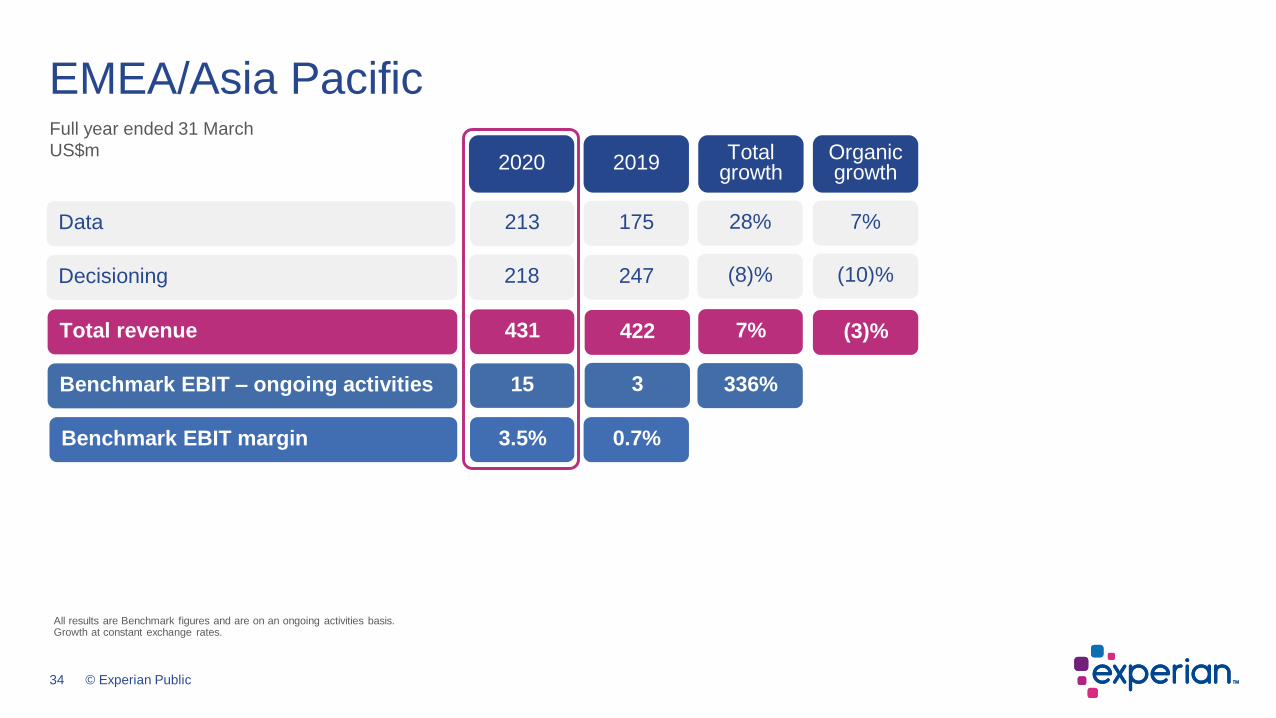
EMEA/Asia PacificFull year ended 31 March
US$m Total growth
Decisioning
2020
Data
2019Organic growth
Total revenue
Benchmark EBIT – ongoing activities
Benchmark EBIT margin
431
15
3.5%
422
3
0.7%
7%
336%
(3)%
218
213
247
175
(8)%
28%
(10)%
7%
All results are Benchmark figures and are on an ongoing activities basis.Growth at constant exchange rates.
Appendix
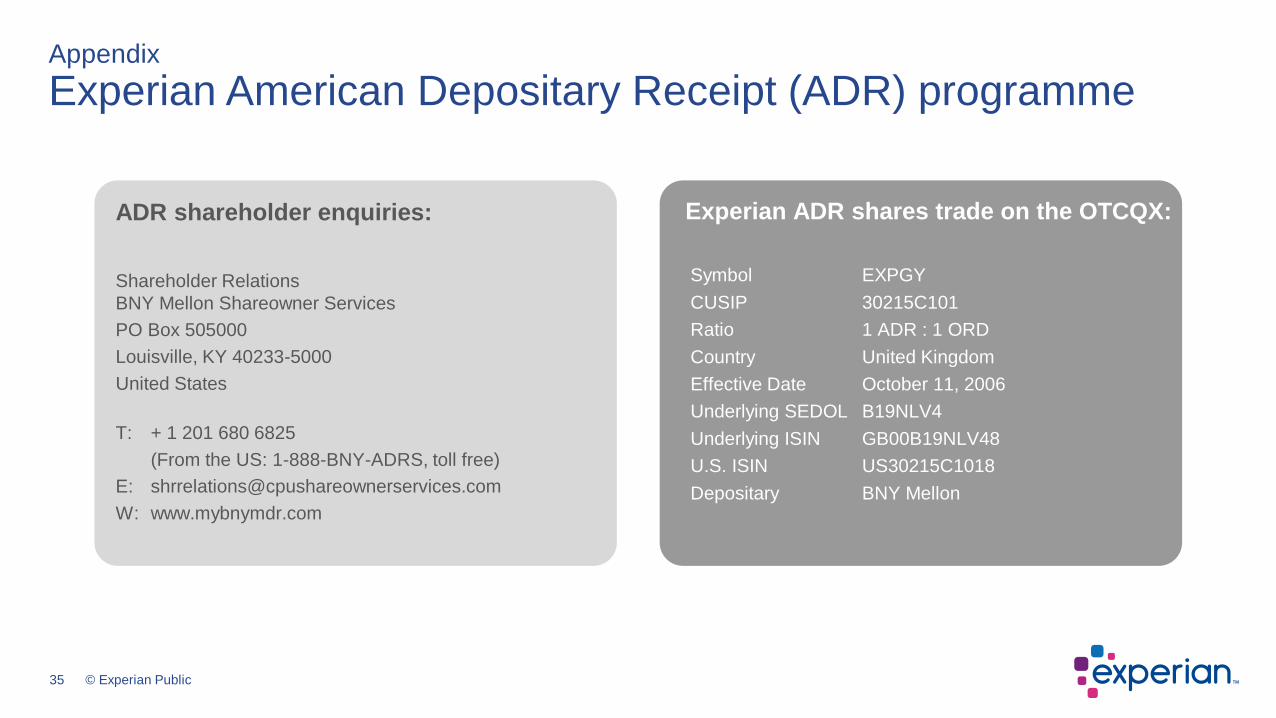
Experian American Depositary Receipt (ADR) programme
ADR shareholder enquiries:
Shareholder Relations
BNY Mellon Shareowner Services
PO Box 505000
Louisville, KY 40233-5000
United States
T: + 1 201 680 6825
(From the US: 1-888-BNY-ADRS, toll free)
W: www.mybnymdr.com
Experian ADR shares trade on the OTCQX:
Symbol EXPGY
CUSIP 30215C101
Ratio 1 ADR : 1 ORD
Country United Kingdom
Effective Date October 11, 2006
Underlying SEDOL B19NLV4
Underlying ISIN GB00B19NLV48
U.S. ISIN US30215C1018
Depositary BNY Mellon
35 © Experian Public

Experian
+44 (0)203 042 4200
www.experianplc.com/investors
Nadia Ridout-Jamieson Evelyne Bull
Chief Communications Officer VP Director Investor Relations
[email protected] [email protected]
Sarah Schibli Alex Sanderson
Investor Relations and Communications Manager Financial Reporting Manager
[email protected] [email protected]
Appendix
Contacts
36 © Experian Public

37 © Experian Public
• This presentation is being made only to, and is only directed at, persons to whom this presentation may lawfully be communicated (“relevant persons”). Any person who is not a relevant person should not act or rely on this presentation or any of its contents.
• Information in this presentation relating to the price at which relevant investments have been bought or sold in the past or the yield on such investments cannot be relied upon as a guide to the future performance of such investments.
• This presentation does not constitute or form part of, and should not be construed as, an offering of securities or otherwise constitute an invitation, inducement or recommendation to any person to underwrite, subscribe for or otherwise acquire securities in any company within the Experian group (the “Group”).
• Certain statements made in this presentation are forward looking statements. Such statements are based on current expectations and are subject to a number of risks and uncertainties that could cause actual events or results to differ materially from any expected future events or results expressed or implied in these forward-looking statements. Forward-looking statements speak only as of the date of this presentation.
• This presentation contains certain non-GAAP financial information. The Group’s management believes that these measures provide valuable additional information in understanding the performance of the Group or the Group’s businesses because they provide measures used by the Group to assess performance. Although these measures are important in the management of the business, they should not be viewed as replacements for, but rather as complementary to, the GAAP measures.
Appendix
Event calendar
37 © Experian Public
16 July 2020 First quarter trading update, FY21
22 July 2020 Annual General Meeting
17 November 2020 Half-year financial report, FY21
Disclaimer