Embed Size (px)
Citation preview
PRELIMINARY INVESTIGATION OF SOIL AND GROUND-WATER
CONTAMINATION AT A U.S. ARMY PETROLEUM TRAINING FACILITY,
FORT LEE, VIRGINIA, SEPTEMBER - OCTOBER 1989
by Winfield G. Wright and John D. Powell
U.S. GEOLOGICAL SURVEY
Open-File Report 90-387
Prepared cooperation with the
U.S. DEPARTMENT OF DEFENSE, U.S. ARMY
Richmond, Virginia 1990
U.S. DEPARTMENT OF THE INTERIOR
MANUEL LUJAN, JR., Secretary
U.S. GEOLOGICAL SURVEY
Dallas L. Peck, Director
For additional information write to:
Chief, Virginia OfficeU.S. Geological Survey3600 West Broad Street, Room 606Richmond, Virginia 23230
Copies of this report can be purchased from:
U.S. Geological Survey Books and Open-File Services Section Box 25425, Federal Center, Bldg. 810 Denver, Colorado 80225
11
CONTENTS
Page
Abstract.....................................................................................^ 1Introduction......................................... 1
Purpose and scope................................................................................................................ 4Previous studies................................................................................................................... 4
Geographic setting................................................................................................................... 4Design of field-study program and summary of field work.................................................... 6
Time sequence of work performed...................................................................................... 6Health and safety plan.......................................................................................................... 6Quality assurance for field and laboratory data................................................................... 6Monitoring well design and installation.............................................................................. 7Surveying............................................................................................................................. 9Sampling program............................................................................................................... 9
Site description........................................................................................................................ 11History of release and characteristics of contaminants....................................................... 11Hydrogeology...................................................................................................................... 11
Hydrogeologic framework............................................................................................... 11Ground-water hydrology................................................................................................... 12
Soil and ground-water contamination........................................................................................ 15Soil............................................................................................................................... 15Ground water....................................................................................................................... 15
Risk identification..................................................................................................................... 22Preliminary remedial alternatives............................................................................................. 24Summary and conclusions........................................................................................................ 26References................................................................................................................................. 27Appendix A: Records of wells at the Petroleum Training Facility,
Fort Lee, Virginia............................................................................................. 28
ILLUSTRATIONS
Page
Figure 1-3. Maps showing:1. Location of Fort Lee, Virginia, and the study
area 22. The Petroleum Training Facility and locations
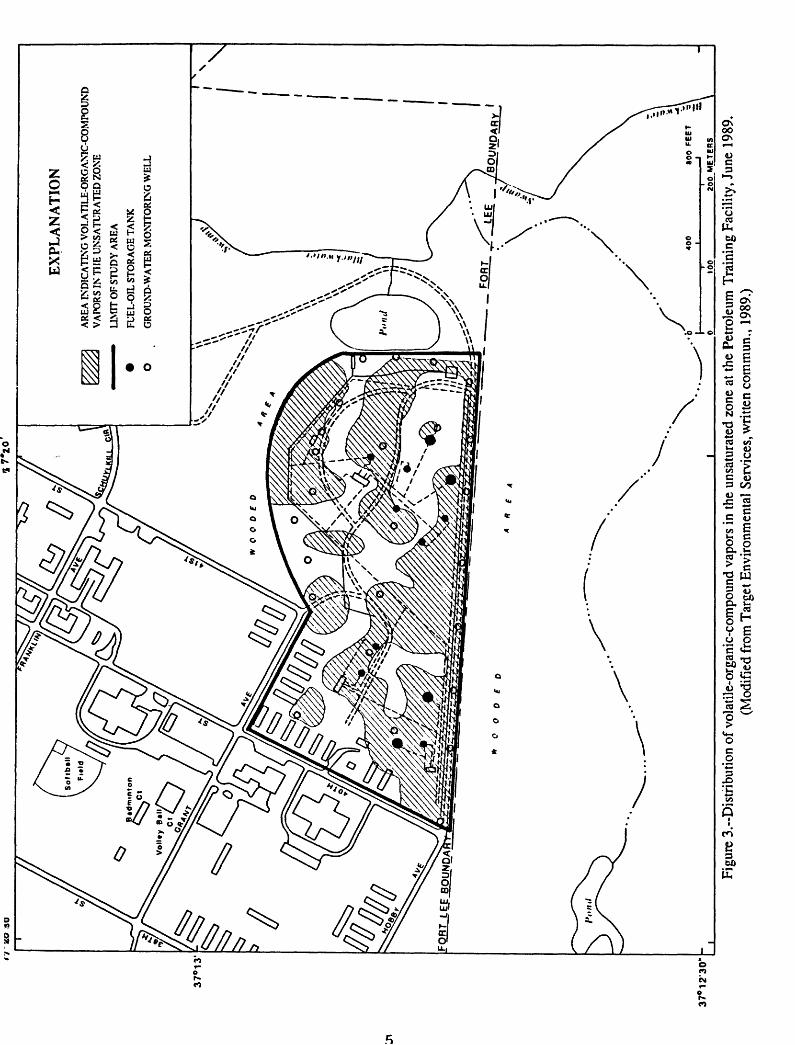
of ground-water monitoring wells 33. Distribution of volatile-organic-compound vapors in the
unsaturated zone at the Petroleum Training Facility, June 1989 5 4. Diagram showing section of unconsolidated sediments from well
number 19, and schematic diagram showing the construction of wells installed by the U.S. Geological Survey 8
in
DLLUSTRATIONS-contintied
Page
5. Generalized lithologic column from wells located in thevicinity of the Petroleum Training Facility 13
6-9. Maps showing6. Water-level altitudes, water-table contours, and
inferred directions of ground-water flow at the PetroleumTraining Facility, October 24-26,1989 14
7. Concentrations of total petroleum hydrocarbons in soilsamples collected from selected locations at the PetroleumTraining Facility, September 1989 * 16
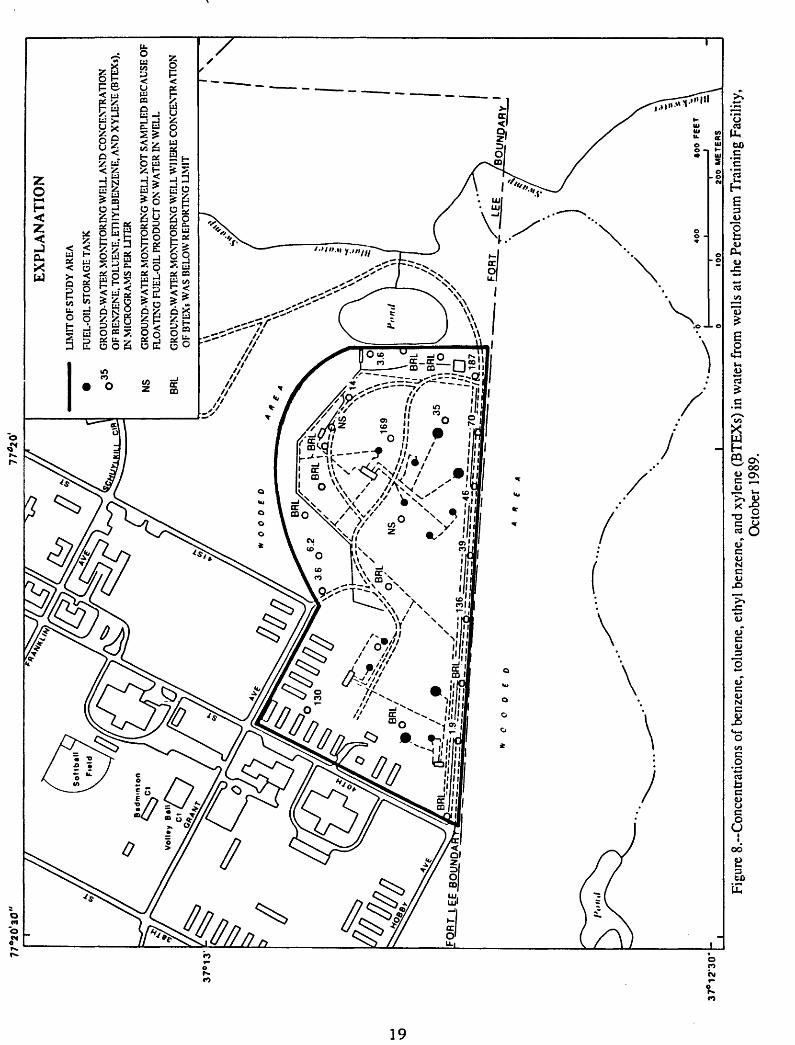
8. Concentrations of benzene, toluene, ethyl btnzene,and xylene (BTEXs) in water from wells at the PetroleumTraining Facility, October 1989 -i - 19
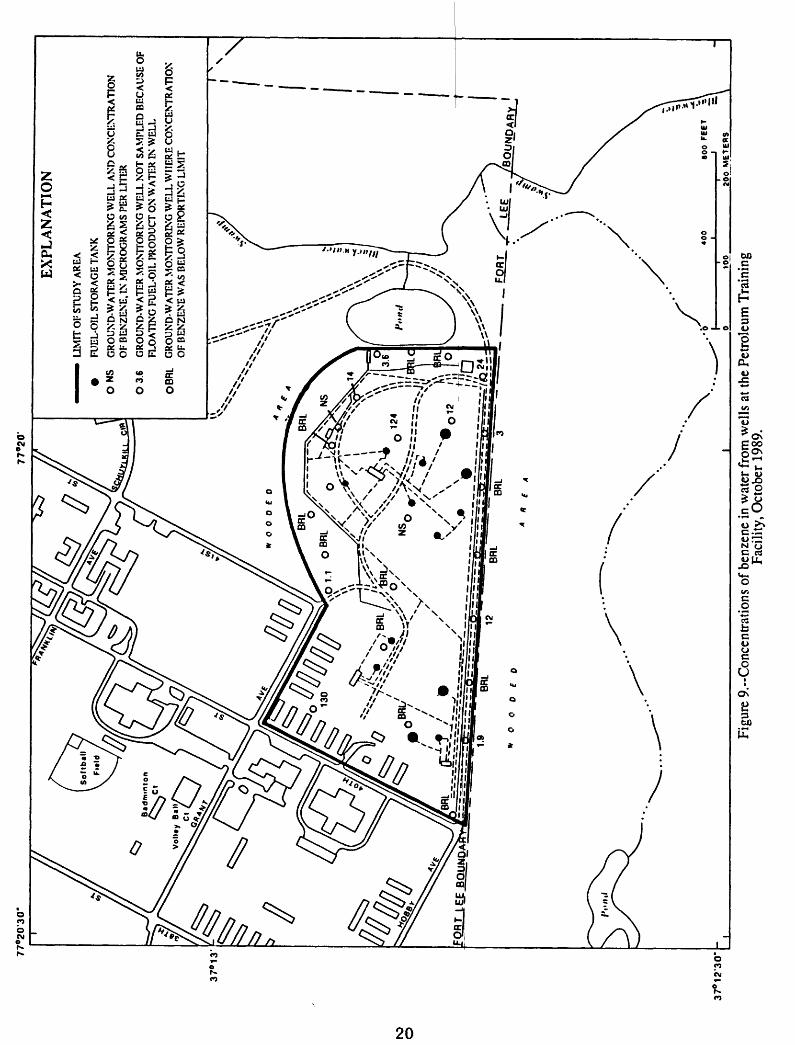
9. Concentrations of benzene in water from w£llsat the Petroleum Training Facility, October 1989 20
TABLES
Page
Table 1. Analytical constituents and minimum reporting limits for analysis of soil and ground-water samples at the Petroleum Training Facility 9
2. Dates of collection and results of analyses for soil samples collectedat the Petroleum Training Facility, September 1989 - 15
3. Types of analyses, dates water samples were collected, and field-data measurements of pH, specific conductance, temperature, and dissolved oxygen, October 1989 - 17
4. Concentrations of total petroleum hydrocarbons^ benzene,toluene, ethylbenzene, xylene (BTEXs), and total BTEX compoundsin water from wells at the Petroleum Training Facility,October 1989 18
5. Quality-assurance results for ground-water sampling and sample shipment for samples collected collected at the Petroleum Training Facility, October 1989--^ 21
6. Toxicity characteristics for chemical constituents of concernat the Petroleum Training Facility ....... ... 22
7. Waste-release characteristics for chemical constituents ofconcern at the Petroleum Training Facility 23
8. Applicable standards for chemical constituents ctf concern atthe Petroleum Training Facility - 23
9. General responses and remedial technologies for remediation ofsoil and ground water at the Petroleum Training Facility - 25
IV
CONVERSION FACTORS AND ABBREVIATIONS
Multiply inch-pound unit By T0 obtain metric unit
Lengthinch (in.) 25.4 millimeter (mm) foot (ft) 0.3048 meter (m) mile (mi) 1.609 kilometer (km)
acre 4,047 square meter (m2)0.4047 hectare (ha)
Volume gallon (gal) 3.785 liter (L)
Chemical concentration, temperature, and specific conductance are given in metric units. Chemical concentration is expressed in milligrams per liter (mg/L). Temperature in degrees Celsius (°C) can be converted to degrees Fahrenheit (°F), and vice versa, as follows:
°F = (1.8x°C) + 32 °C = (°F- 32) x 0.5555
Specific conductance is expressed in microsiemens per centimeter at 25 °C (|o,S/cm). This unit is identical to micromhos per centimeter at 25 °C, formerly used by the U.S. Geological Survey.
Chemical concentration in water is expressed in milligrams per liter (mg/L) or micrograms per liter (M£/L). Chemical concentration in soil or sediment is expressed in milligrams per kilogram (mg/kg).
Sea level: In this report "sea level" refers to the National Geodetic Vertical Datum of 1929 (NGVD of 1929)- a geodetic datum derived from a general adjustment of the first-order level nets of both the United States and Canada, formerly called "Sea Level Datum of 1929."
PRELIMINARY INVESTIGATION OF SOIL AND GROUND-WATERCONTAMINATION AT A U.S. ARMY PETROLEUM TRAINING FACILITY,
FORT LEE, VIRGINIA, SEPTEMBER-OCTOBER 1989
by Winfield G. Wright and John D. Powell
ABSTRACT
This report describes the preliminary investigation of fuel-oil constituents in the soil and ground water at the Fort Lee Petroleum Training Facility near Petersburg, Virginia. The study, conducted by the U.S. Geological Survey (USGS) in cooperation with the Department of Defense, U.S. Army, included installation of 25 ground-water monitoring wells and description of ground-water flow patterns of the shallow-aquifer system underlying the facility. Soil and ground-water samples were collected to determine the concentrations of fuel-oil constituents and to determine the potential for off-site migration of the contituents.
Total petroleum hydrocarbon concentrations as large as 18,400 milligrams per kilogram were reported in soil samples. Concentrations of benzene in water from wells at the facility were reported as large as 130 |ig/L (micrograms per liter), and concentrations of ethylbenzene and xylene were reported as large as 54 and 120 jig/L, respectively. Fuel-oil constituents in the soil and ground-water are scattered and widespread throughout the facility. Potential exists for off-site migration of the contaminants and migration of contaminants downward to deeper aquifers. Further investigations of these potential constituent-migration pathways are warranted.
Risk identification at the Petroleum Training Facility cannot be properly addressed because the distribution of fuel-oil constituents has not been fully characterized. Preliminary identification of risk, however, was assessed by an examination of toxicity data for the chemical constituents reported in ground water at the facility. Concentrations of constituents were compared to the maximum contaminant levels (MCLs) for drinking water established by the U.S. Environmental Protection Agency (USEPA). Concentrations of benzene in water from wells at the facility exceed the USEPA's 5 \Lg/L MCL by as much as 26 times. Sufficient data are not available to design the remedial-action plan for the facility; however, general responses to contamination of the type associated with the facility include no action, monitoring, institutional controls, removal, and treatment.
INTRODUCTION
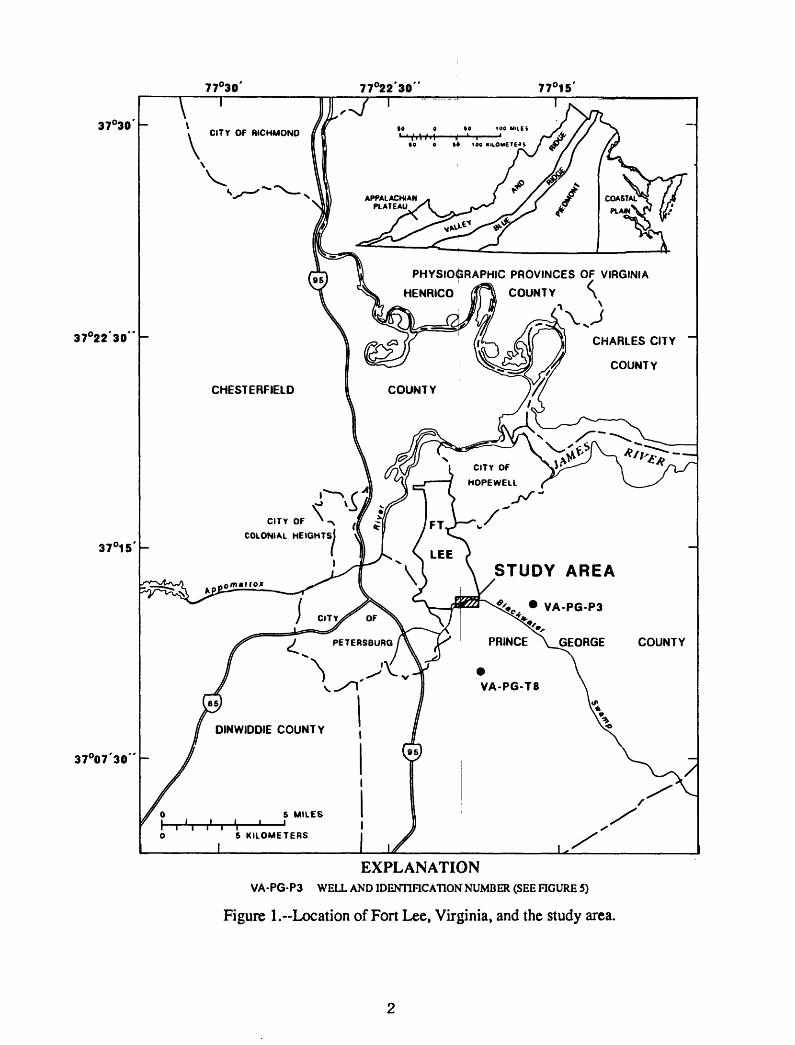
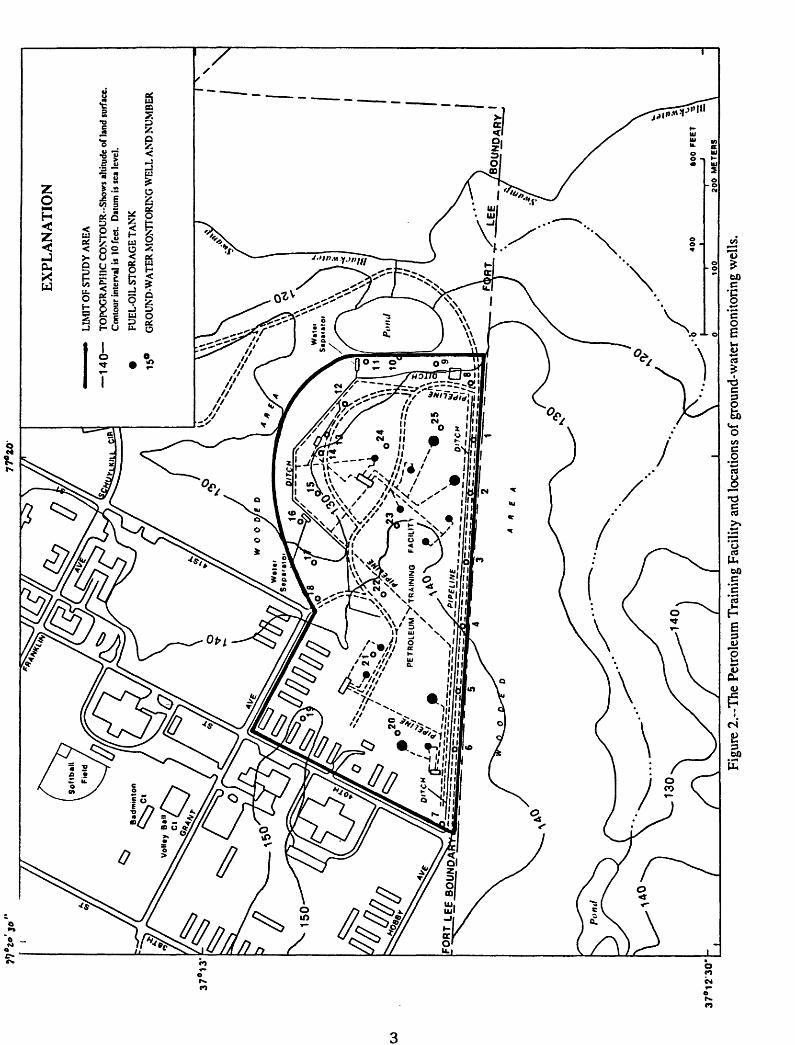
Fort Lee is located approximately 5 mi (miles) east of Petersburg, Virginia, (fig. 1) and operates primarily as a military training facility. The Petroleum Training Facility is located in Fort Lee and maintained by the U.S. Army (fig. 2). The facility is used to train military personnel in fuel-transfer operations including tank storage, pipeline operations, and maintenance. The facility consists of fuel-storage tanks, associated pump stations, and several miles of piping, all of which are above ground. The area also includes a depot area, a railroad-car loading station, simulated-ship transfer station, and several small buildings and shelters.
In April 1989, personnel at Fort Lee discovered the presence of fuel oil in the ground water during excavation at the Petroleum Training Facility and notified the Virginia Water Control Board. In June 1989, the Engineer's Office at Fort Lee contacted the USGS to perform a preliminary investigation of the distribution of fuel-oil constituents in the soil and ground water at the facility.
77°30' 77°22'30" 77°15'
37°30' -
37°22'30" -
37°15' -
37°07'30" -
to o to 100 MILES ' 'I'M i'i| rM-iCITY OF RICHMOND
CHARLES CITY
COUNTY
CHESTERFIELD
CITY OF
COLONIAL HEIGHTS
STUDY AREA
VA-PG-P3CITY
^
PETERSBURG
DINWIDDIE COUNTY
EXPLANATIONVA-PG-P3 WELL AND IDENTlFICATlONi NUMBER (SEE FIGURE 5)
Figure 1.-Location of Fort Lee, Virginia, and the study area.
77*2
0
37*1
2 3
0" -
EX
PLA
NA
TIO
N
LIM
IT O
F ST
UD
Y A
REA
1 4
0
TOPO
GR
APH
IC C
ON
TO
UR
-Sho
ws
altit
ude
of la
nd s
urfa
ce.
Con
tour
inte
rval
is 1
0 fe
et.
Dat
um is
sea
leve
l.
'V
/
) //
PE
TR
OL
EU
M^
TR
AIN
ING
F
AC
HIT
V //
Figu
re 2
.--T
he P
etro
leum
Tra
inin
g Fa
cilit
y an
d lo
catio
ns o
f gro
und-
wat
er m
onito
ring
wel
ls.
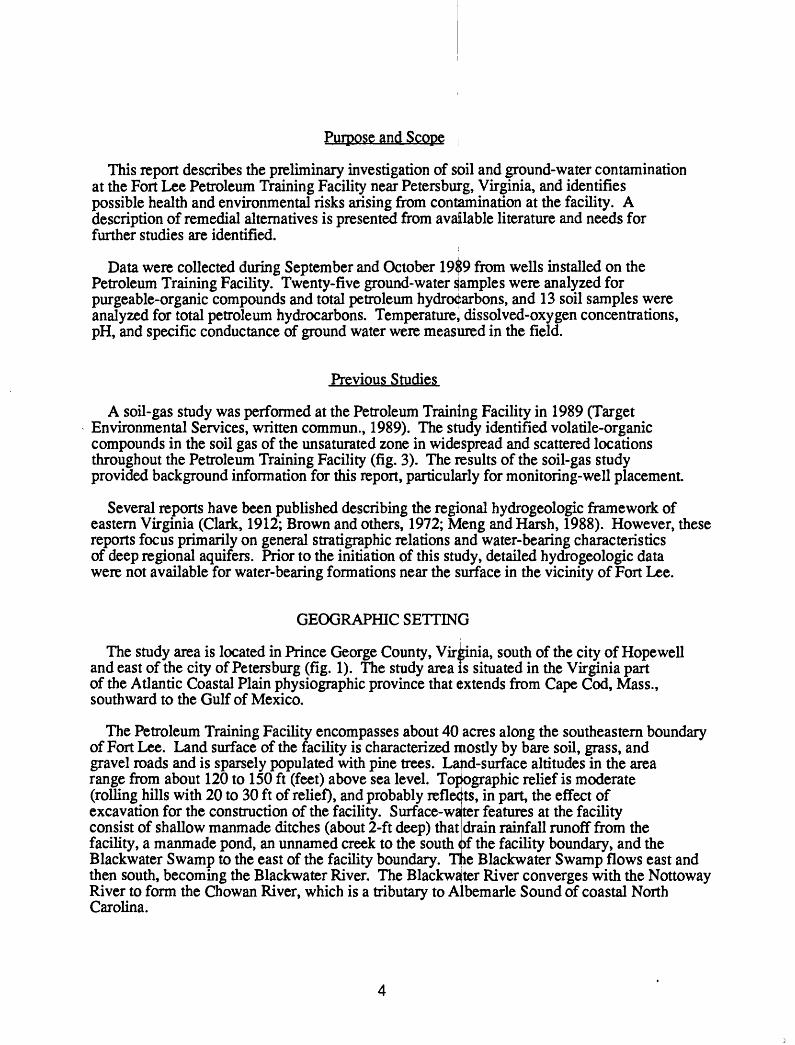
Purpose and Scope
This report describes the preliminary investigation of soil and ground-water contamination at the Fort Lee Petroleum Training Facility near Petersburg, Virginia, and identifies possible health and environmental risks arising from contamination at the facility. A description of remedial alternatives is presented from available literature and needs for further studies are identified.
Data were collected during September and October 19$9 from wells installed on the Petroleum Training Facility. Twenty-five ground-water samples were analyzed for purgeable-organic compounds and total petroleum hydrocarbons, and 13 soil samples were analyzed for total petroleum hydrocarbons. Temperaturej dissplved-oxygen concentrations, pH, and specific conductance of ground water were measured in the field.
Previous Studies
A soil-gas study was performed at the Petroleum Training Facility in 1989 (Target Environmental Services, written commun., 1989). The study identified volatile-organic compounds in the soil gas of the unsaturated zone in widespread and scattered locations throughout the Petroleum Training Facility (fig. 3). The results of the soil-gas study provided background information for this report, particularly for monitoring-well placement
Several reports have been published describing the regional hydrogeologic framework of eastern Virginia (Clark, 1912; Brown and others, 1972; Meng and Harsh, 1988). However, these reports focus primarily on general stratigraphic relations and water-bearing characteristics of deep regional aquifers. Prior to the initiation of this study, detailed hydrogeologic data were not available for water-bearing formations near the surface in the vicinity of Fort Lee.
GEOGRAPHIC SETTING
The study area is located in Prince George County, Virginia, south of the city of Hopewell and east of the city of Petersburg (fig. 1). The study area is situated in the Virginia part of the Atlantic Coastal Plain physiographic province that extends from Cape Cod, Mass., southward to the Gulf of Mexico.
The Petroleum Training Facility encompasses about 40|acres along the southeastern boundary of Fort Lee. Land surface of the facility is characterized mostly by bare soil, grass, and gravel roads and is sparsely populated with pine trees. La id-surface altitudes in the area range from about 120 to 150 ft (feet) above sea level. Topographic relief is moderate (rolling hills with 20 to 30 ft of relief), and probably reflects, in part, the effect of excavation for the construction of the facility. Surface-water features at the facility consist of shallow manmade ditches (about 2-ft deep) that drain rainfall runoff from the facility, a manmade pond, an unnamed creek to the south of the facility boundary, and the Blackwater Swamp to the east of the facility boundary. The Blackwater Swamp flows east and then south, becoming the Blackwater River. The Blackwajter River converges with the Nottoway River to form the Chowan River, which is a tributary to Albemarle Sound of coastal North Carolina.
17'Z
O1
37
°13
' -
37
°12
'30
" -
EX
PLA
NA
TIO
N
AR
EA I
ND
ICA
TIN
G V
OLA
TILE
-OR
GA
X1C
-CO
MPO
UN
D
VA
POR
S IN
TH
E U
NSA
TU
RA
TE
D Z
ON
E
LLM
IT O
F ST
UD
Y A
RE
A
FUEL
-OIL
STO
RA
GE
TA
NK
GR
OU
ND
-WA
TER
MO
NIT
OR
ING
WEL
L
FQH
I__L
EE
_BO
UN
DA
Figu
re 3
.--D
istr
ibut
ion
of v
olat
ile-o
rgan
ic-c
ompo
und
vapo
rs in
the
uns
atur
ated
zon
e at
the
Petr
oleu
m T
rain
ing
Faci
lity,
Jun
e 19
89.
(Mod
ifie
d fr
om T
arge
t Env
iron
men
tal
Serv
ices
, wri
tten
com
mun
., 19
89.)
DESIGN OF FIELD-STUDY PROGRAM AND SUMMARY OF FIELD WORK
The field-study program was designed as a preliminary investigation of fuel-oil constituents in the shallow ground-water system underlying the Petroleum Training Facility. Monitoring wells were placed on the periphery of the Petroleum Training Facility to determine the quality of ground water flowing from the facility in the near-surface water-table aquifer. Monitoring wells also were placed in the middle of the facility to determine the quality of ground water within the facility and to collect water levels in monitoring wells to estimate ground-water-flow directions. The data collected as part of this preliminary report will be used in designing followup studies that will describe the Vertical and horizontal extent and rate of movement of the contamination.
Time Sequence of Work Performed
The field-study program began in September 1989 with the drilling and installation of monitoring wells at the Petroleum Training Facility. Soils were sampled during well drilling. Monitoring wells were developed October 2-17,1989, and water samples were collected from the wells October 24-26,1989. Level surveys for the altitudes of the wells were conducted October 29-30,1989. Water levels in the wells were measured after well development and before water-sample collection.
Health and Safety Plan
A health and safety plan was established by the Virginia Office of the USGS for work assignments relating to ground-water-contamination investigations. This plan includes safety training for all personnel involved in site investigations, maintainance of an exposure data sheet, periodic medical examinations to monitor accumulation of toxic chemicals in the body, and the wearing of proper field-safety apparel. Field-safety apparel for work performed at the Petroleum Training Facility includes splash-proof coveralls, eye protection, rubber gloves, and air-purifying respirators. Hard hats are required for work near well-drilling equipment.
Quality Assurance for Field and Laboratory Data
The objective of a quality-assurance (QA) program is to design, document, and execute sound and standardized procedures for field sampling, laboratory analysis, and reporting that will provide reliable scientific data for proper interpretation of results. This program presents the acceptable standards that field and laboratory teams must meet before sampling begins. Specific procedures for field-quality assurance for ground-water sampling were designed to check the sampling methods, shipping integrity, and analytical reproducibility ofthe laboratory. The types of QA samples collected in the field consist of the following:
(1) Duplicate samples from selected wells. Duplicate samples were collected from 10 percent of the total number of wells sampled during the field-study program. Collection and analysis of duplicates tests reproducibility within the laboratory. Duplicate and original water samples from wells were obtained from the same boiler; the laboratory form for the duplicate sample did not indicate that it was a duplicate and did not indicate the relation to the original sample.
(2) Trip blanks. A trip blank was included with every Sample-shipping container in order to ensure that positive analytical results were not caused by cross-contamination within the sample shipping container or by handling prior to analysis. Trip-blank sample bottles contained organic-free deionized water and were filled at the office prior to each day of
sampling.(3^ Ambient-condition blanks. Ambient-condition blanks were collected to identify the
effects of atmospheric contaminants or other field conditions that could affect the analytical results. Ambient-condition-blank bottles were filled with organic-free deionized water at the well site.
(4^ Equipment blanks.- Equipment blanks were collected to investigate the possibility of detection of contaminants in ground-water samples that could result from cross contamination by sampling equipment. Equipment-blank bottles were filled with equipment wash water or organic-free deionized water collected after rinsing bailers or sampling hoses.
Monitoring Well Design and Installation
Twenty-five wells were installed in September 1989 to define the location and concentrations of fuel-oil constituents in the ground water. The wells are numbered 1 to 25. Wells were installed using the hollow-stem auger drilling method. Each hollow-stem auger had a 6 7/8-in. (inch) outside diameter and a 4-in. inside diameter. After the first auger flight was advanced, the chuck was unbolted from the auger flight, and a new 5-ft section of auger was added by bolting it to the flight of auger already in the ground. The process of drilling 5 ft and then adding a new 5-ft section was continued until the augers encountered the top of a clay layer observed at this site.
Sediment samples of the unsaturated zone were collected during drilling of the monitoring wells; in addition, a continuous core of the sediments was collected while drilling well number 19 to determine the composition and general stratigraphy of the shallow, unconsolidated sediments underlying the Petroleum Training Facility. Samples were obtained by lowering a hollow-tube sampler on a drill rod through the stem of the augers to the bottom of the hole. A pulley-operated hammer was attached to the rod and the sampler was hammered 2 ft into the sediments. The sampler was then removed, the sample was taken from the sampler, and drilling continued. Samples were visually examined for the type of sediments. Soil samples were placed in glass jars; after allowing the samples to sit for about 5 minutes, the presence of organic vapors in the sediments was qualitatively evaluated using a portable photoionization detector (PID). The samples being sent to the laboratory were chilled immediately after collection.
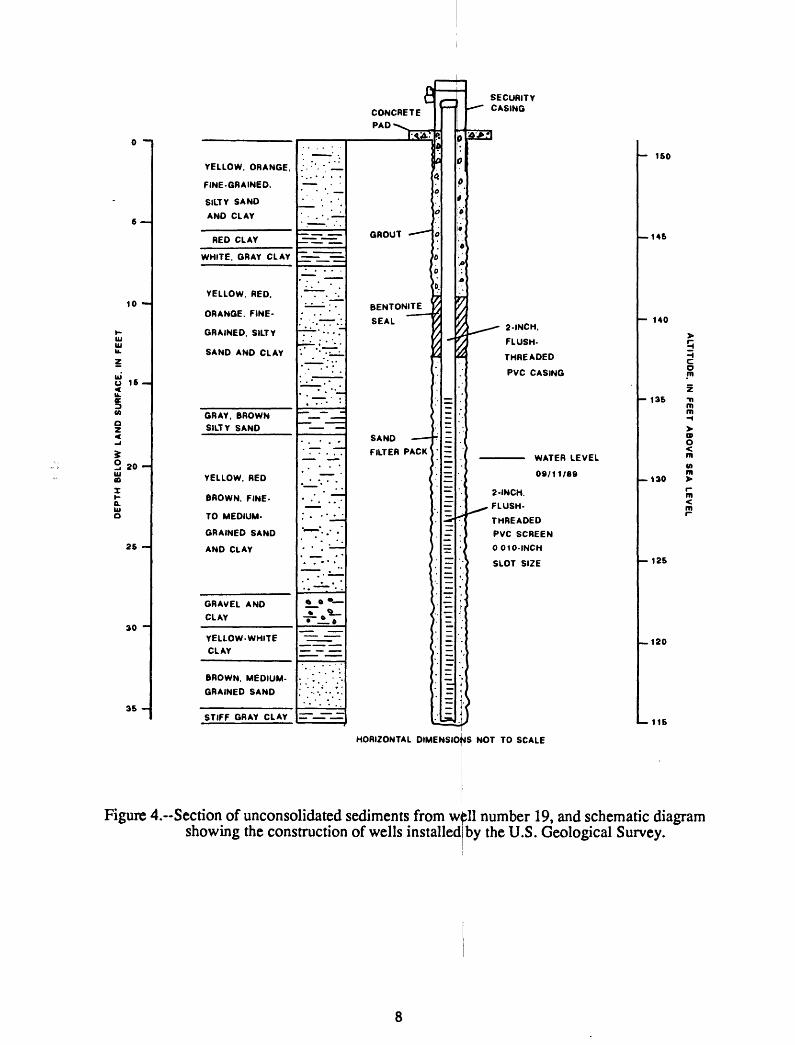
Wells were constructed by lowering well screen and casing through the center of the augers to the bottom of the borehole; augers then were removed while the well screen and casing remained in place. All of the wells were constructed of 2-in. inside diameter flush-threaded polyvinyl chloride (PVC) well casing (fig. 4). Well screens were constructed of flush- threaded PVC with 0.010-in. slots. Screen lengths were designed to place the top of the screened interval above the water table so that fuel-oil product, if present in the aquifer, could flow into the well through the well screen. The bottom of the screened intervals were placed on top of a clay layer that was first identified in well number 1 and then consistently identified in other boreholes by examination of auger cuttings (fig. 4). The lengths of well screens ranged from 5 to 20 ft. Filter sand was poured slowly into the hole to about 2 ft above the top of the screen. Bentonite pellets were poured into the hole to about 3 ft above the top of the filter sand. Moisture in the ground caused the bentonite to swell, forming a seal. Portland cement was inserted into the hole from the top of the bentonite seal to the land surface. A 6-in. square by 5-ft long metal security casing was installed over each well. Each security casing was set into concrete. Concrete pads (2 ft by 2 ft by 4 in.) were constructed around the security casings. Each well was identified by a well number on a brass plate set into the concrete pad.
After installation of the ground-water monitoring wells, each well was developed by
5
10
O 15
§20tu
26
30 ~
35
YELLOW. ORANGE.
FINE-GRAINED.
SILTY SAND
AND CLAY
RED CLAY
WHITE. GRAY CLAY
YELLOW. RED.
ORANGE. FINE
GRAINED. SILTY
SAND AND CLAY
GRAY. BROWNSILTY SAND
YELLOW. RED
BROWN. FINE-
TO MEDIUM-
GRAINED SAND
AND CLAY
GRAVEL AND
CLAY
YELLOW-WHITECLAY
BROWN. MEDIUM-
GRAINED SAND
STIFF GRAY CLAY
~~ ' '
'"~
IrEr=EI~
.^T-.V
_^nr -* ,' '..
: ;'. .' '
"~ ~
' ' 'm ~
''..
. -
» * * --..- . . '
T ' -'-'-
*^o "»~^Lo"=- ="
-
' :': '.'."..*'
I~LJT
£CONCRETE
PAD><Ssr<sr
GROUT ""
BENTONITE
SEAL
SAND
FILTER PACK
i
i
i
i
0mtm
j6
Q
s)
9
t
.
t/t / t /t *""
/^
-
«
3
~
=
5--
5n
=
=,
**
0
0
0
4
10
iM
'.
'l
^
' (
'':
,
f
\*1..iJ
SECURITY CASING
2-INCH.
FLUSH-
THREADED
PVC CASING
WATER LEVEL
09/11/89
2-INCH.
FLUSH-
THREADED
PVC SCREEN
0010-INCH
SLOT SIZE
150
146
140
Omz
136 -n m m
130
12S
120
L- 116
HORIZONTAL DIMENSIONS NOT TO SCALE
Figure 4.-Section of unconsolidated sediments from wdl showing the construction of wells installed!
number 19, and schematic diagram by the U.S. Geological Survey.
purging 10 to 30 well volumes. Well development withdraws ground water that may have been disturbed or contaminated during drilling from the aquifer near the borehole. Development also improves well yield and reduces turbidity by removing silt from the sand-filter pack surrounding the well screen.
Surveying
Level surveys were conducted for each of the wells located at the Petroleum Training Facility to determine accurate altitudes of measuring-points. Altitudes of measuring points on the wells were determined by surveying from local benchmarks to the wells at the Petroleum Training Facility. Thus, the general direction of ground-water flow could be inferred from altitudes of water levels measured in the monitoring wells.
Sampling Program
Thirteen soil samples were collected from boreholes on the periphery of the Petroleum Training Facility in September 1989 to monitor the possibility of off-site migration of fuel-oil product in the soil. Soil samples were collected at selected well sites from a 2-ft interval above the water table; this interval was the zone most likely to be affected by fuel-oil constituents floating on the water table. Samples were placed in glass jars, chilled, and shipped by overnight express to the laboratory. Soil samples were analyzed for total petroleum hydrocarbons using USEPA method E418.1 (U.S. Environmental Protection Agency, 1983) (table 1).
Table 1 . Analytical constituents and minimum reporting limits for analysis of soil and ground-water samples at the Petroleum Training Facility
[mg/kg indicates milligrams per kilogram; jig/L indicates micrograms per liter; mg/L indicates milligrams per liter, minimum reporting limit is equivalent to detection limit]
Minimum Constituent reporting limit Units
SoilTotalTjetroleum hydrocarbons 30 mg/kg
Ground waterTotal petroleum hydrocarbons 1.0 mg/L Purgeable-organic compounds
Benzene 0.7Toluene 1Ethylbenzene 1Total xylene 21,3-DjchIorobenzene 21,2-DichIorobenzene 21,4-DichIorobenzene .5
Twenty-five ground-water samples were collected from ground-water monitoring wells in October 1989 to determine if ground water at the Petroleum Training Facility is contaminated with fuel-oil constituents. Measurements of temperature, pH, specific conductance, and dissolved oxygen were performed in the field. Ground-water samples sent to the laboratory were analyzed for total petroleum hydrocarbons using USEPA method 418.1 (U.S. Environmental
Protection Agency, 1983) and purgeable-organic compounds using USEPA method 602 (U.S. Environmental Protection Agency, 1984) (table 1).
In this report, reporting limits are the smallest concentrations the laboratory can report for a particular analysis. Detection limits are the minimum concentrations achievable by a laboratory instrument for a particular analytical protocol. Reporting limits are ideally equivalent to detection limits; however, reporting limits are affected by many factors, such as dilution of samples with extremely large concentrations, analytical interferences from target and nontarget parameters, and analytical equipment performance. Minimum reporting limits for analyses of soil and ground-water samples are presented in table 1.
Prior to sampling, the water level in each well was measured to the nearest 0.01 ft, using the surveyed measuring point as the reference. The wells then were purged until a minimum of two to three well volumes (based on borehole diameter) of water were removed. The types of pumps used were (1) a centrifugal pump for wells where the water levels were within 20 ft of land surface; a polyvinyl chloride hose was dedicated to each well to prevent cross- contamination of wells; and (2) a positive displacement, air-driven, stainless-steel pump for wells where water levels were deeper than 20 ft below lartd surface; this pump was washed with detergent and water and rinsed with tap water after each u se. If fuel oil was observed on the steel water-level-measuring tape, the thickness of the oil in the well was measured using an electric oil-water interface probe; these wells were not purged or sampled because the presence of fuel oil in the well confirmed contamination.
Ground-water samples were collected with 3-ft long, 2-in. outside diameter polyethylene bailers dedicated to each well to prevent possible cross contamination between wells. Water samples were collected from the upper 5 ft of water in the well. For analysis of purgeable- organic compounds, the samples were placed in 40-milliliter Teflon-septum vials, preserved with concentrated hydrochloric acid to about a pH of 2 to prevent degradation of target constituents by biodegradation, and immediately chilled on ice. For total petroleum hydrocarbon compounds in ground water, samples were placed in 1-liter glass bottles and preserved with concentrated sulfuric acid to about a pH o£ 2, and immediately chilled on ice. For total petroleum hydrocarbon compounds in soil, samples were collected in a hollow-tube sampler and then placed in 1-liter glass bottles and immediately chilled on ice. Samples collected each day were stored in ice-filled coolers, provided with a chain-of-custody form, and forwarded by overnight delivery to the laboratory, i
Field measurements of ground-water temperature, pH, dissolved oxygen, and specific conductance were made at each sampling site. The concentration of dissolved oxygen in the ground water was measured in wells by lowering a probe to the bottom of the wells and raising and lowering the probe to maintain an adequate movement of water across the probe membrane. Temperature was measured with thermometers accurate t^> 0.5 °C (degrees Celsius) in the range of 0 to 40 °C. Meters used to measure dissolved oxygen ^jvere calibrated every day using a probe-calibration chamber, barometer, and a barometric-pressure dissolved-oxygen chart. Meters used to measure pH were calibrated every day using a two-buffer calibration that bracketed the range of expected pH. Specific-conductance measurements were made with meters that had been checked using standards. Meter performance is checked |>y periodically calibrating the instruments to standard-reference water samples provided by the Quality Control Section of the USGS National Water-Quality Laboratory in Denver, Colorado. Notebooks kept with each meter show the daily calibrations, indicating changes in the instrument's performance.
'Use of brand/trade names in this report is for identification purposes only and does not constitute endorsement by the U.S. Geological Survey.
10
SITE DESCRIPTION
History of Release and Characteristics of Contaminants
Little information is available regarding the history of release of the contaminants at the Petroleum Training Facility. Most of the contaminant releases at the Petroleum Training Facility resulted from leaking oil-storage tanks and transfer lines. Fuel oil may have leaked slowly from temporary oil-storage tanks; some of the tanks that have an expected life of a few years were assembled at the Petroleum Training Facility in the 1950's and are still in use. Some contaminant releases were accidental spills; some releases presumably involved spills of thousands of gallons of fuel oil (S. Holsinger, Fort Lee Environmental Engineering, oral commun., 1989).
The fuel-oil constituents of concern for contamination at the Petroleum Training Facility arc those of no. 2 fuel oil or diesel fuel, and are comprised of petroleum-based hydrocarbons. Petroleum hydrocarbons are a complex mixture of hydrocarbons that have a wide range of physical and chemical properties. When petroleum hydrocarbons come into contact with water, the more soluble components of the oil dissolve into the water. The less soluble components tend to float on the water table. Benzene is one of the most soluble of the hydrocarbons; toluene, ethyl benzene, and xylene arc also hydrocarbons that dissolve into water. These soluble hydrocarbons benzene, toluene, ethyl benzene, and xylene or BTEXs are known as purgeable-organic compounds.
Fuel-oil contaminants in ground water at the Petroleum Training Facility can be altered by geochemical and natural microbiological processes in the hydrogeologic regime. The rates of chemical alteration or degradation depend on the concentrations of dissolved oxygen in the contaminated ground water. The degradation of dissolved fuel-oil constituents in ground water also may occur in an anaerobic and reducing geochemical environment if the proper minerals or nutrients are available (Cozzarelli and others, 1989, p. 22). Baedecker and others (1989) suggest that the reduction of iron and manganese is an important mechanism for decomposition of organic matter in aquifers. Resulting metabolites or products of degradation of the organic contaminants in a reducing environment may consist of organic acids and dissolved alkylbenzenes (Cozzarelli and others, 1989, p. 25).
Some hydrocarbon molecules of petroleum hydrocarbons may endure for long periods of time in natural ecosystems because they are degraded very slowly or not at all (Alexander, 1980, p. 136). Molecules of these chemicals are known as recalcitrant molecules. A compound that is not readily destroyed in a hydrogeologic system can be transported for considerable distances from the source. Furthermore, recalcitrant molecules are more difficult to remove from a hydrogeologic system by remediation measures. Some constituents of fuel-oil contaminants in ground water at the Petroleum Training Facility can endure in the hydrogeologic system for long periods of time, can be transported great distances from the source(s), and may resist remediation measures to extract or biologically degrade the contamination.
Hydrogeology
Hydrogeologic Framework
The Coastal Plain physiographic province of Virginia consists of an eastward-thickening sedimentary wedge composed principally of unconsolidated gravel, sand, silt, and clay, with variable amounts of shells (Meng and Harsh, 1988, p. 6). The regional hydrogeologic
11
framework of the Virginia Coastal Plain includes numerous aquifers and confining units and typically consists of an uppermost unconfined aquifer underlain by confined aquifers and intervening confining units, attaining a maximum thickness of about 6,000 ft below land surface beneath the Delmarva Peninsula of easternmost Virginia. The unconfined aquifers, such as the near-surface water-table aquifer at the Petroleum Training Facility, are arcally discontinuous because of stream erosion, contain interlayered sand and clay strata, and are used for light industrial or domestic ground-water supply. The unconfined aquifers are not a significant regional source for public ground-water supplies (Meng and Harsh, 1988). The underlying confined aquifers are laterally continuous and are sources of water for numerous ground-water users in the Coastal Plain province.
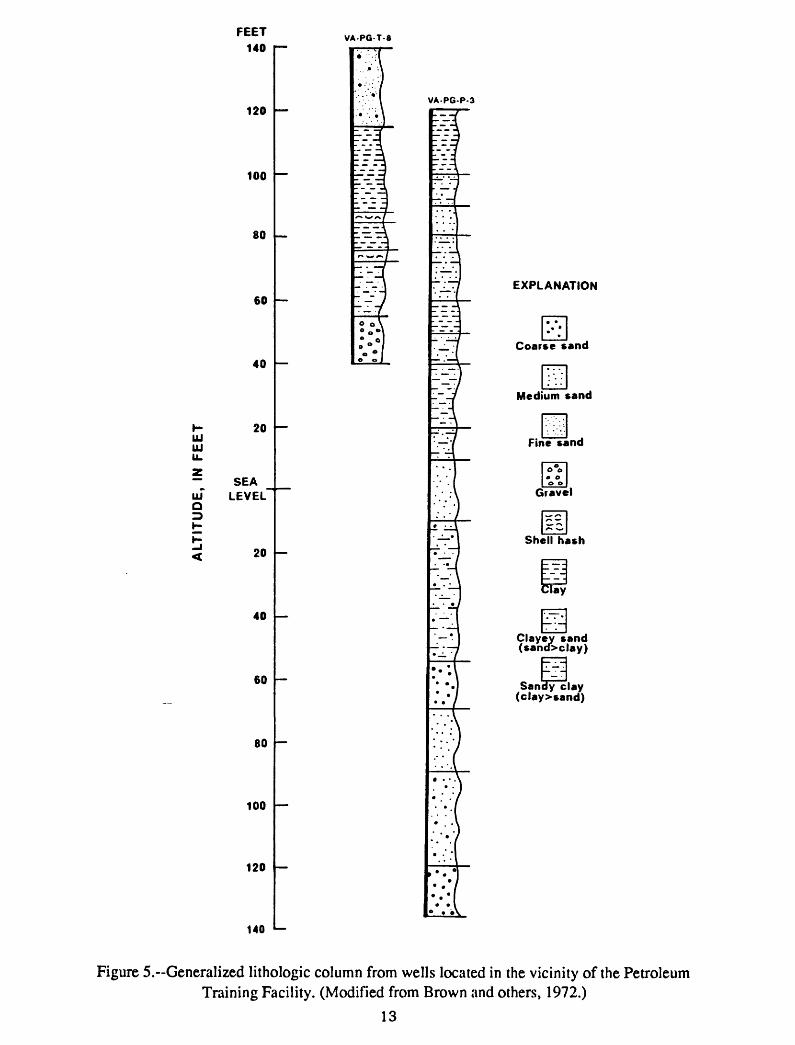
Generally, the sediments underlying the study area are Composed of fine- to medium-grained sand interbedded with clay. The thicknesses of the clay and sand units differ arcally. Brown and others (1972) present two well logs representing the Stratigraphy and lithology of an area east of Fort Lee (fig. 5); the locations of these wells (VAiPG-P3 and VA-PG-T8) are shown infigure 1. The stratigraphy and lithology of the sediments underlying Fort Lee are probablysimilar to those shown in figure 5; however, additional investigations and drilling of deeper wells at Fort Lee are needed.
Samples of the unconsolidated sediments underlying the Petroleum Training Facility were collected during the drilling and installation of monitoring well number 19. A generalized stratigraphic column showing the composition of these sediments is shown in figure 4. Heterogeneous conditions of the sediments (or interlaying and interbedding of sand, silt, and clay of various grain sizes) were also indicated during installation of other monitoring wells at the facility; therefore, the geologic conditions presented in this column are probably not consistent throughout the Petroleum Training Facility.
A clay layer was identified at depths ranging from 15 to 35 ft below land surface underlying the Petroleum Training Facility. TTbe first well drilled and installed (well number 1) penetrated this clay layer at about 30 ft below land surface; this clay layer is approximately 5-ft thick. The clay layer was identified in subsequent boreholes by examination of drill cuttings on the end of the auger-drill bit. This is probably the same clay layer shown at the base of the stratigraphic column for well number 19 (fig. 4).
Ground-Water Hydrologyi
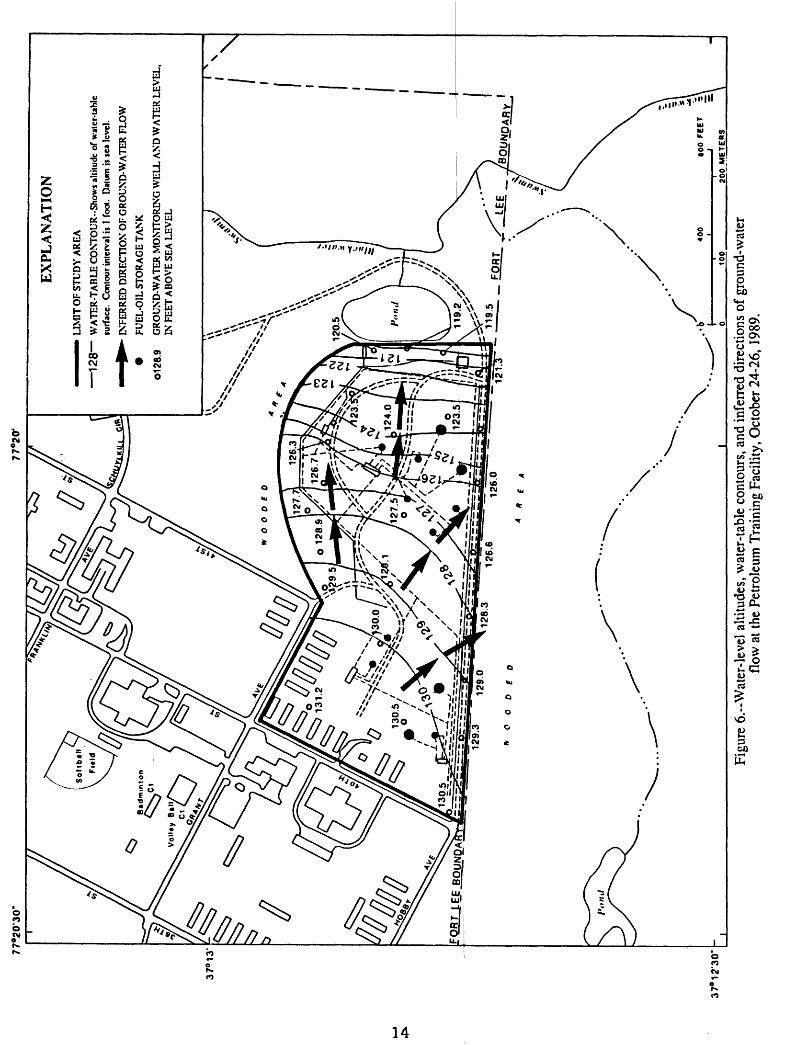
Water-level data were collected on October 24-26,1989, and are shown in figure 6 as water-level altitudes referenced to sea level. From the water-level altitudes, the inferred direction of ground-water flow at the Petroleum Training Facility is generally to the east and southeast (fig. 6). Depths to water in the wells generally ranged from about 3 to 9 ft below land surface along the northern edge of the study site (wefo numbers 13 to 18, fig. 2) and ranged from about 10 to 15 ft below land surface along tlje southern edge of the site (well numbers 2 to 7, fig. 2). j
The water-level measurement from well number 1 is n^t included in the water-level map because the clay layer that underlies the Petroleum Training Facility was penetrated during drilling of this well; therefore, well number 1 is probably open to a different, deeper ground-water system. The water level in well number 1 was approximately 114 ft above sea level when measured on October 24,1989, which was about 10 ft lower than water levels in nearby wells finished above the clay layer. This indicates a downward hydraulic gradient between the aquifer above the clay layer and the aquifer below the clay layer; thus, the day layer acts as a confining unit that impedes, but probably does not prevent, the vertical movement of ground water and contaminants.
12
0101
01o
5 <
FEET 140
120
100
80
60
40
20
SEALEVEL"
20
40
60
80
100
120
140
VA-PG T-8
VA-PG-P-3
EXPLANATION
Coarse sand
Medium sand
Fine sand
Gravel
Shell hash
Clayey i (sandx
, -. sand (sand>clay)
Sandy clay (clay>sand)
Figure 5.-Generalized lithologic column from wells located in the vicinity of the Petroleum Training Facility. (Modified from Brown and others, 1972.)
13
77
°20
J
37°1
3'
37
°12
130- -
EX
PLA
NA
TIO
N
LIM
IT O
F ST
UD
Y A
REA
128
WA
TER
-TA
BLE
CO
NTO
UR
-Sho
ws
altit
ude
of w
alcr
-labi
c su
rface
. Co
ntou
r int
erva
l is
1 fo
ol.
Dat
um is
sea
leve
l.
INFE
RR
ED D
IREC
TIO
N O
F G
RO
UN
D-W
AT
ER
FLO
W
FUEL
-OIL
STO
RA
GE
TA
NK
0128
.9
GR
OU
ND
-WA
TE
R M
ON
ITO
RIN
G W
ELL
AN
D W
AT
ER
LEV
EL
IN F
EET
AB
OV
E S
EA L
EVEL
QR
!_L
EE
_BO
yND
A
* 0
0
D
f o
Figu
re 6
.--W
ater
-leve
l alti
tude
s, w
ater
-tabl
e co
ntou
rs, a
nd in
ferr
ed d
irect
ions
of g
roun
d-w
ater
flo
w a
t the
Pet
role
um T
rain
ing
Faci
lity,
Oct
ober
24-
26,1
989.
Ground-water velocity (or the rate of ground-water flow) could not be estimated using the limited field data available for the Petroleum Training Facility. Aquifer tests required to determine hydraulic conductivity, an important variable in the velocity equation, were beyond the scope of this report. However, visual observations of the sediments comprising the aquifer above the clay layer indicate that the overall hydraulic conductivity of the aquifer is probably low and differs areally because of the numerous clay layers and sand interlayered with clays comprising the near-surface sediments.
The configuration of the water table implies that the unnamed tributary to the south of the facility and the Blackwater Swamp to the east of the facility are probably ground-water discharge zones. Additional wells and ground-water data are needed to verify this assumption. The effects of the manmade pond on the ground-water system are undetermined.
SOIL AND GROUND-WATER CONTAMINATION
Soil
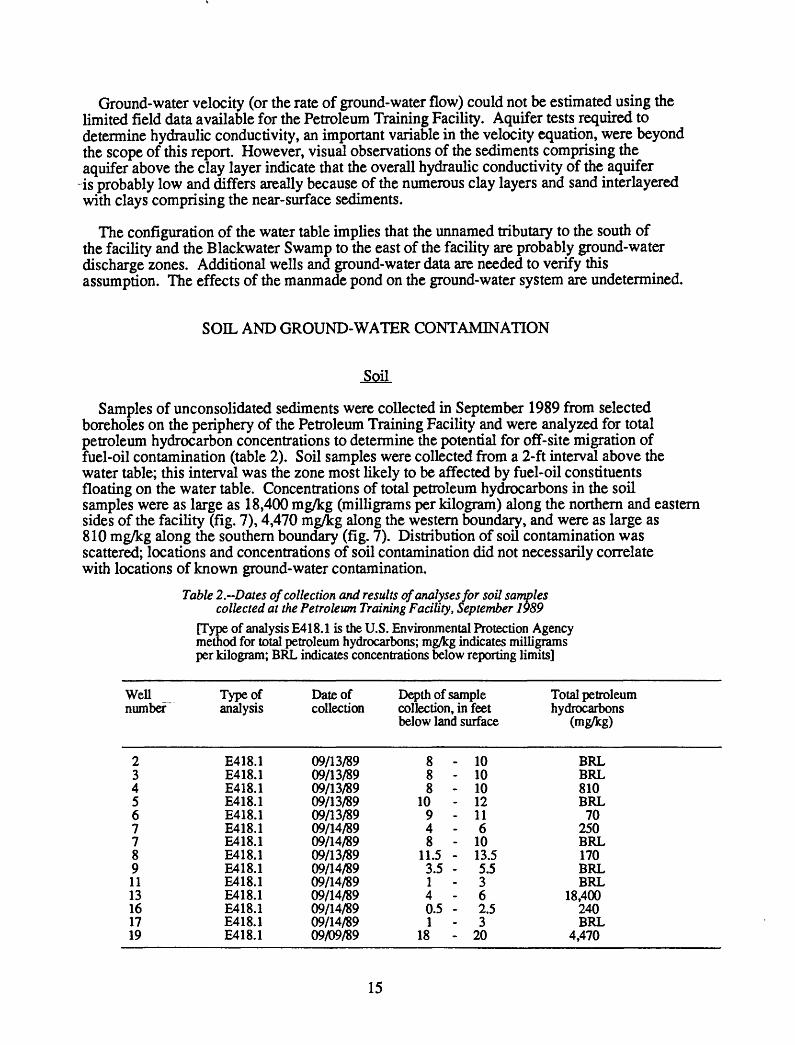
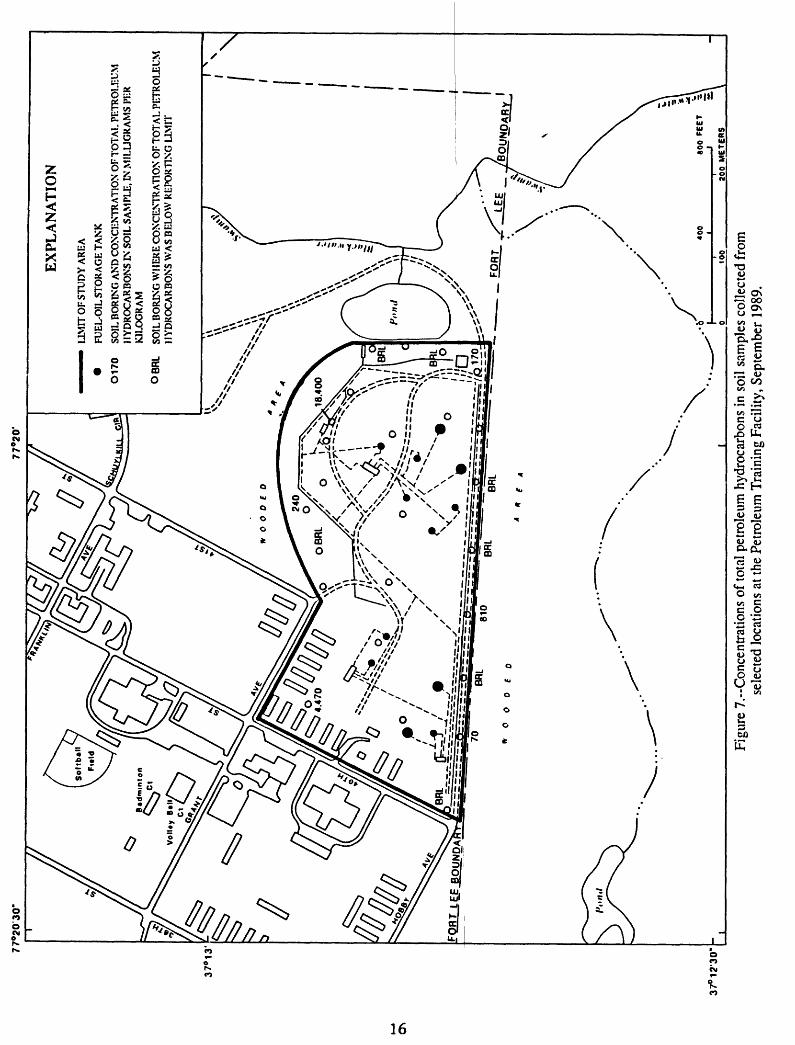
Samples of unconsolidated sediments were collected in September 1989 from selected boreholes on the periphery of the Petroleum Training Facility and were analyzed for total petroleum hydrocarbon concentrations to determine the potential for off-site migration of fuel-oil contamination (table 2). Soil samples were collected from a 2-ft interval above the water table; this interval was the zone most likely to be affected by fuel-oil constituents floating on the water table. Concentrations of total petroleum hydrocarbons in the soil samples were as large as 18,400 mg/kg (milligrams per kilogram) along the northern and eastern sides of the facility (fig. 7), 4,470 mg/Tcg along the western boundary, and were as large as 810 mg/kg along the southern boundary (fig. 7). Distribution of soil contamination was scattered; locations and concentrations of soil contamination did not necessarily correlate with locations of known ground-water contamination.
Table 2.-Dates of collection and results of analyses for soil samples collected at the Petroleum Training Facility, September 1989
[Type of analysis E418.1 is the U.S. Environmental Protection Agency method for total petroleum hydrocarbons; mg/kg indicates milligrams per kilogram; BRL indicates concentrations below reporting limits]
Wellnumber
Type ofanalysis
Date ofcollection
Depth of samplecollection, in feetbelow land surface
2345677891113161719
E418.1E418.1E418.1E418.1E418.1E418.1E418.1E418.1E418.1E418.1E418.1E418.1E418.1E418.1
09/13/8909/13/8909/13/8909/13/8909/13/8909/14/8909/14/8909/13/8909/14/8909/14/8909/14/8909/14/8909/14/8909/09/89
888
10948
11.53.5140.51
18
- 10- 10- 10- 12- 11- 6- 10- 13.5- 5.5- 3- 6- 2.5- 3- 20
Total petroleumhydrocarbons
(mg/kg)
BRLBRL810BRL70
250BRL170BRLBRL
18,400240BRL
4,470
15
°2030"
77°2
0'
37
°13
'
37°1
2'30
" -
EX
PLA
NA
TIO
N
LIM
IT O
F ST
UD
Y A
REA
FUEL
-OIL
STO
RA
GE
TAN
K
01
70
SO
IL B
OR
ING
AN
D C
ON
CEN
TRA
TIO
X O
F TO
TAL
PETR
OLE
UM
HY
DR
OC
AR
BO
NS
IN S
OIL
SA
MPL
E. IN
MIL
LIG
RA
MS
PER
KIL
OG
RA
M
O B
RL
SOIL
BO
RIN
G W
HER
E C
ON
CEN
TRA
TIO
N O
F TO
TAL
PETR
OLE
UM
H
YD
RO
CA
RB
ON
S W
AS
BEL
OW
REP
OR
TIN
G L
LM1T
*
0
0
0
f n
Figu
re 7
.--C
once
ntra
tions
of t
otal
pet
role
um h
ydro
carb
ons
in s
oil s
ampl
es c
olle
cted
from
se
lect
ed lo
catio
ns a
t the
Pet
role
um T
rain
ing
Faci
lity,
Sep
tem
ber
1989
.
Two soil samples were collected at well number 7 (table 2). One soil sample was collected from 4 to 6 ft below land surface because of discolorations observed in the sediments during drilling; concentrations of total petroleum hydrocarbons in this sample were 250 mg/kg. Another soil sample was collected from 8 to 10 ft below land surface, immediately above the water table; concentrations of total petroleum hydrocarbons in this sample were below reporting limits.
Ground Water
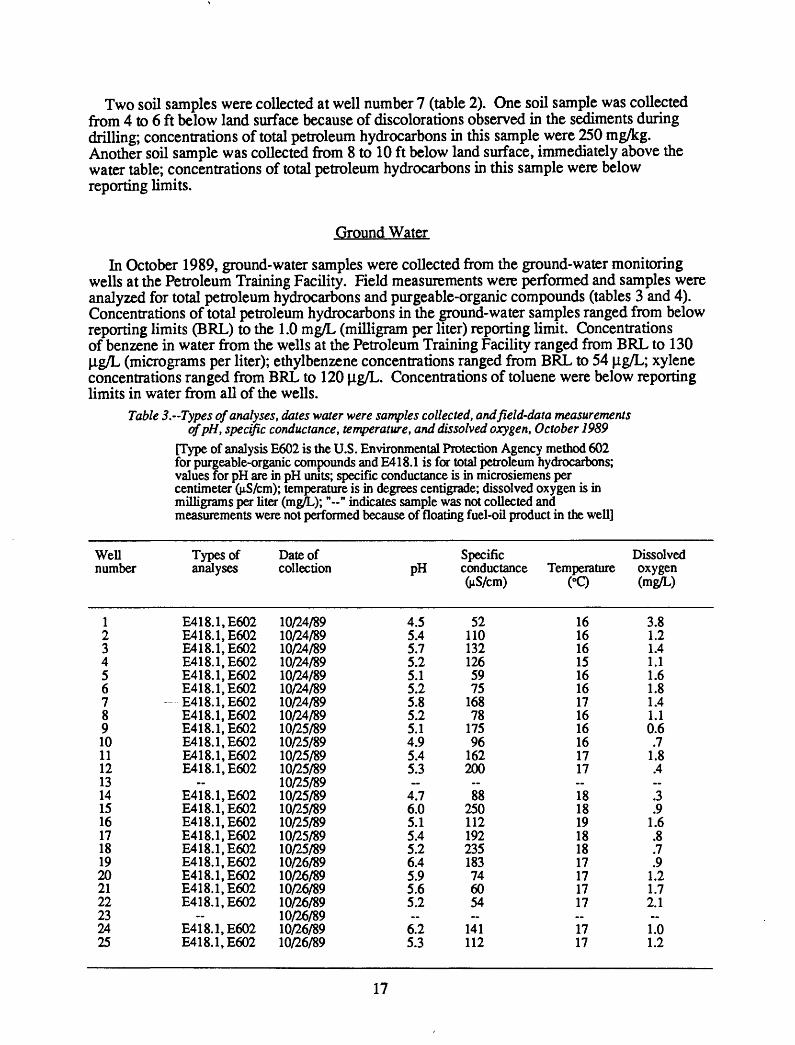
In October 1989, ground-water samples were collected from the ground-water monitoring wells at the Petroleum Training Facility. Field measurements were performed and samples were analyzed for total petroleum hydrocarbons and purgeable-organic compounds (tables 3 and 4). Concentrations of total petroleum hydrocarbons in the ground-water samples ranged from below reporting limits (BRL) to the 1.0 mg/L (milligram per liter) reporting limit. Concentrations of benzene in water from the wells at the Petroleum Training Facility ranged from BRL to 130 |ig/L (micrograms per liter); ethylbenzene concentrations ranged from BRL to 54 |ig/L; xylene concentrations ranged from BRL to 120 |ig/L. Concentrations of toluene were below reporting limits in water from all of the wells.
Table 3. Types of analyses, dates water were samples collected, and field-data measurements ofpH, specific conductance, temperature, and dissolved oxygen, October 1989
[Type of analysis E602 is the U.S. Environmental Protection Agency method 602 for purgeable-organic compounds and E418.1 is for total petroleum hydrocarbons; values for pH are in pH units; specific conductance is in microsiemens per centimeter OiS/cm); temperature is in degrees centigrade; dissolved oxygen is in milligrams per liter (mg/L);"--" indicates sample was not collected and measurements were not performed because of floating fuel-oil product in the well]
Well number
Types of analyses
Date of collection
Specific DissolvedpH conductance Temperature oxygen
CiS/cm) (°C) (mg/L)
12345678910111213141516171819202122232425
E418.1.E602E418.1.E602E418.1.E602E418.1.E602E418.1.E602E418.1.E602
E418.1.E602E418.1.E602E418.1.E602E418.1.E602E418.1.E602E418.1.E602
~E418.1.E602E418.1.E602E418.1.E602E418.1.E602E418.1.E602E418.1.E602E418.1.E602E418.1.E602E418.1.E602
E418.1.E602E418.1.E602
10/24/8910/24/8910/24/8910/24/8910/24/8910/24/8910/24/8910/24/8910/25/8910/25/8910/25/8910/25/8910/25/8910/25/8910/25/8910/25/8910/25/8910/25/8910/26/8910/26/8910/26/8910/26/8910/26/8910/26/8910/26/89
4.55.45.75.25.15.25.85.25.14.95.45.3~
4.76.05.15.45.26.45.95.65.2..
6.25.3
521101321265975
16878
17596
162200 88
250112192235183746054
141112
161616151616171616161717«181819181817171717..1717
3.81.21.41.11.61.81.41.10.6
.71.8.4~.3.9
1.6.8.7.9
1.21.72.1..1.01.2
17
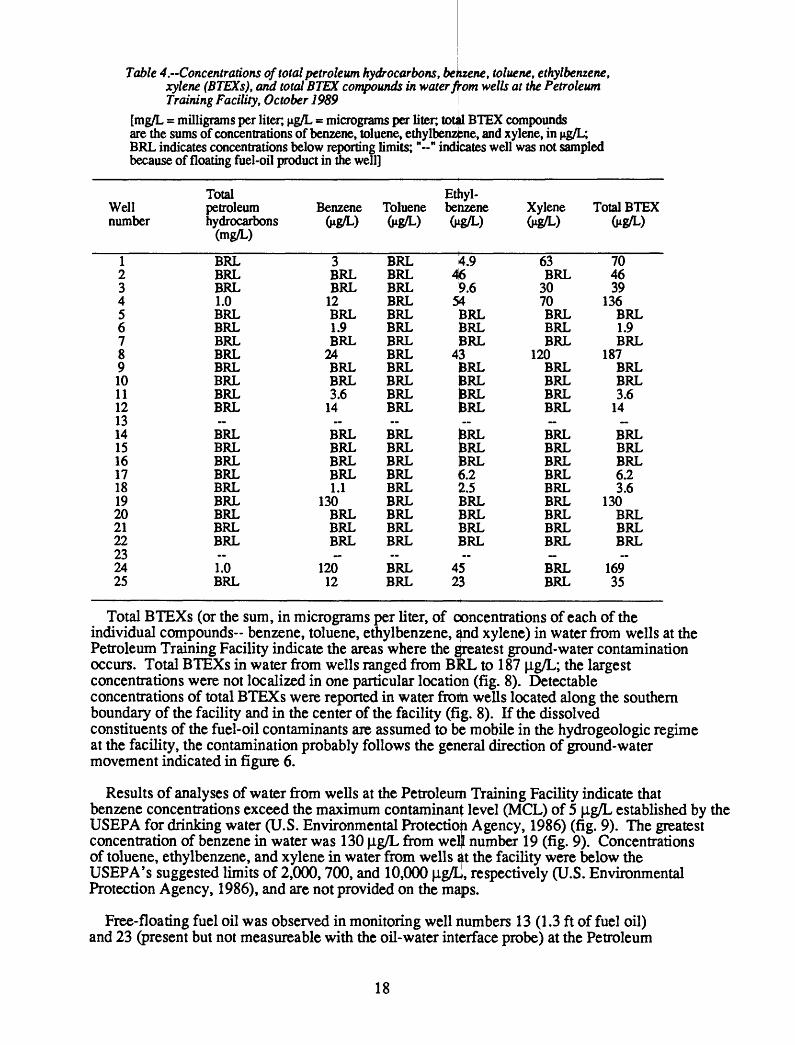
Table 4. Concentrations of total petroleum hydrocarbons, bekzene, toluene, ethylbenzene, xylene (BTEXs), and total BTEX compounds in water from wells at the Petroleum Training Facility, October 1989 \
[mg/L = milligrams per liter; jxg/L = micrograms per liter; toud BTEX compounds are the sums of concentrations of benzene, toluene, ethylbenzMie, and xylene, in jig/L; BRL indicates concentrations below reporting limits;"--" indicates well was not sampled because of floating fuel-oil product in the well]
Well number
12345678910111213141516171819202122232425
Total petroleum hydrocarbons
(mg/L)
BRLBRLBRL1.0BRLBRLBRLBRLBRLBRLBRLBRL..
BRLBRLBRLBRLBRLBRLBRLBRLBRL..1.0BRL
Benzene (ng/L)
3BRLBRL
12BRL1.9BRL
24BRLBRL3.6
14..
BRLBRLBRLBRL1.1
130BRLBRLBRL_
12012
Toluene (Hg/L)
BRLBRLBRLBRLBRLBRLBRLBRLBRLBRLBRLBRL..
BRLBRLBRLBRLBRLBRLBRLBRLBRL..
BRLBRL
Ethyl- benzene fog/L)
-T3 469.6
54BRLBRLBRL
43BRLBRLBRLBRL
BRLBRLBRL6.22.5BRLBRLBRLBRL..
4523
Xylene (Hg/L)
63BRL
3070BRLBRLBRL
120BRLBRLBRLBRL_
BRLBRLBRLBRLBRLBRLBRLBRLBRL_
BRLBRL
Total BTEX (Hg/L)
704639
136BRL1.9BRL
187BRLBRL3.6
14_
BRLBRLBRL6.23.6
130BRLBRLBRL..
16935
Total BTEXs (or the sum, in micrograms per liter, of concentrations of each of the individual compounds- benzene, toluene, ethylbenzene, and xylene) in water from wells at the Petroleum Training Facility indicate the areas where the greatest ground-water contamination occurs. Total BTEXs in water from wells ranged from BRL to 187 |ig/L; the largest concentrations were not localized in one particular location (fig. 8). Detectable concentrations of total BTEXs were reported in water frorti wells located along the southern boundary of the facility and in the center of the facility (fig. 8). If the dissolved constituents of the fuel-oil contaminants are assumed to be mobile in the hydrogeologic regime at the facility, the contamination probably follows the general direction of ground-water movement indicated in figure 6.
Results of analyses of water from wells at the Petroleuiji Training Facility indicate that benzene concentrations exceed the maximum contaminant level (MCL) of 5 |ig/L established by the USEPA for drinking water (U.S. Environmental Protectioh Agency, 1986) (fig. 9). The greatest concentration of benzene in water was 130 |ig/L from well number 19 (fig. 9). Concentrations of toluene, ethylbenzene, and xylene in water from wells at the facility were below the USEPA's suggested limits of 2,000,700, and 10,000 ^g/t, respectively (U.S. Environmental Protection Agency, 1986), and are not provided on the maps.
Free-floating fuel oil was observed in monitoring well numbers 13 (1.3 ft of fuel oil) and 23 (present but not measureable with the oil-water interface probe) at the Petroleum
18
77*2
0'30
77*2
0'
37°1
3'
'-
37
°12
'30
" -
EX
PLA
NA
TIO
N
LIM
IT O
F ST
UD
Y A
REA
FUEL
-OIL
STO
RAG
E TA
NK
Q 3
5 G
RO
UN
D-W
ATE
R M
ONI
TORI
NG W
ELL
AN
D C
ON
CEN
TRA
TIO
NO
F BE
NZE
NE.
TO
LUEN
E. E
TI1Y
LBEN
ZEN
E. A
ND
XY
LEN
E (B
TEX
s),
IN M
1CRO
GRA
MS
PER
LITE
R
GR
OU
ND
-WA
TER
MO
NITO
RING
WEL
L N
OT
SAM
PLED
BEC
AU
SE O
F FL
OA
TIN
G F
UEL-
OIL
PR
OD
UC
T O
N W
ATE
R IN
WEL
L
BRL
GR
OU
ND
-WA
TER
MO
NITO
RING
WEL
L W
HER
E C
ON
CEN
TRA
TIO
N
OF
BTEX
s WA
S BE
LOW
REP
ORT
ING
LLM
IT
~~
3r~
:^:
70 -
'/A
187
Figu
re 8
.-Con
cent
ratio
ns o
f ben
zene
, tol
uene
, eth
yl b
enze
ne, a
nd x
ylen
e (B
TEX
s) in
wat
er fr
om w
ells
at t
he P
etro
leum
Tra
inin
g Fa
cilit
y,O
ctob
er 1
989.
77°2
0'30
"77
°20'
37°1
3'
37
°12
130"
-
EX
PLA
NA
TIO
N
LLM
IT O
F ST
UD
Y A
REA
FUEL
-OIL
STO
RA
GE
TAN
K
GR
OU
ND
-WA
TER
MO
NIT
OR
ING
WEL
L A
ND
CO
NC
ENTR
ATI
ON
O
F B
ENZE
NE.
LN
MIC
RO
GR
AM
S PE
R LI
TER
GR
OU
ND
-WA
TER
MO
NIT
OR
ING
WEL
L N
OT
SAM
PLED
BEC
AU
SE O
F FL
OA
TIN
G F
UEL
-OIL
PR
OD
UC
T O
N W
ATE
R IN
WEL
L
GR
OU
ND
-WA
TER
MO
NIT
OR
ING
WEL
L W
HER
E C
ON
CEN
TRA
TIO
N
OF
BEN
ZEN
E W
AS
BEL
OW
REP
OR
TIN
G L
LMIT
Figu
re 9
.~C
once
ntra
tions
of b
enze
ne in
wat
er fr
om w
ells
at t
he P
etro
leum
Tra
inin
gFa
cilit
y, O
ctob
er 1
989.
Training Facility during the sampling round on October 24-26,1989; thus, these wells were not sampled. Large concentrations of petroleum hydrocarbons (18,400 mg/kg) were reported in a soil sample collected above the water table at well number 13 (fig. 7).
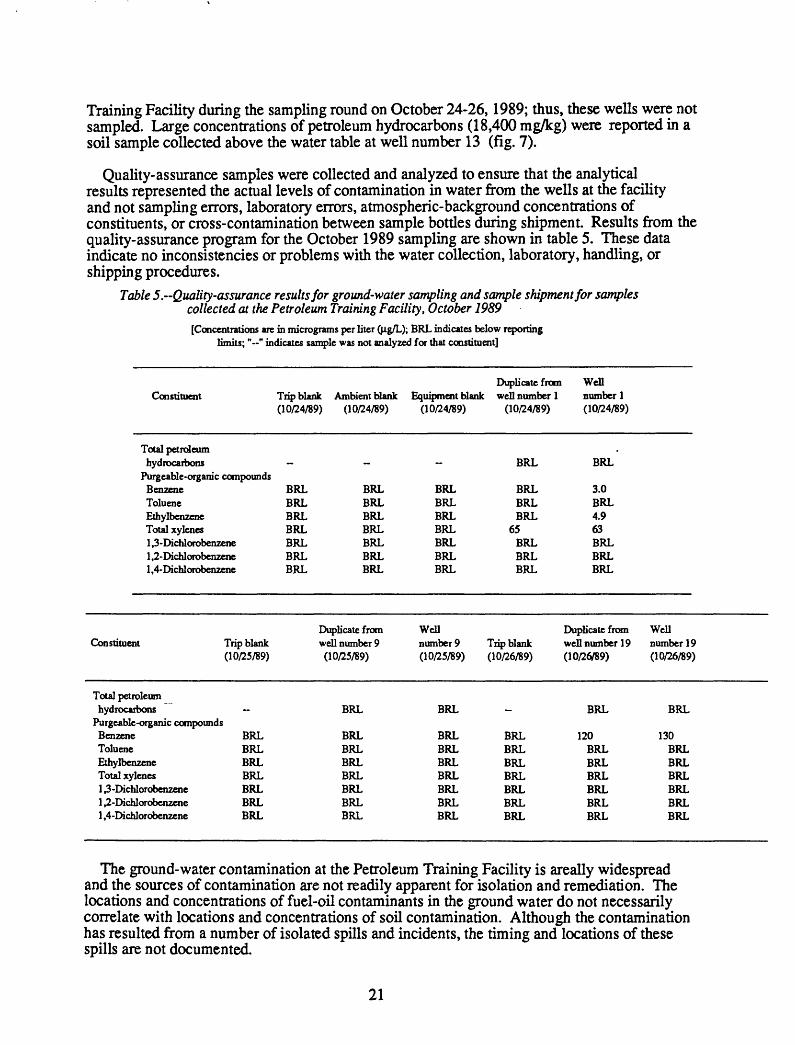
Quality-assurance samples were collected and analyzed to ensure that the analytical results represented the actual levels of contamination in water from the wells at the facility and not sampling errors, laboratory errors, atmospheric-background concentrations of constituents, or cross-contamination between sample bottles during shipment. Results from the quality-assurance program for the October 1989 sampling are shown in table 5. These data indicate no inconsistencies or problems with the water collection, laboratory, handling, or shipping procedures.
Table 5. Quality-assurance results for ground-water sampling and sample shipment for samples collected at the Petroleum Training Facility, October 1989[Concentrations are in micrograms per liter (fig/L); BRL indicates below reporting
limits; "--" indicates sample was not analyzed for that constituent]
ConstituentDuplicate from Well
Trip blank Ambient blank Equipment blank well number 1 number 1(10/24/89) (10/24/89) (10/24/89) (10/24/89) (10/24/89)
Total petroleum hydrocarbons - - - BRL BRL
Purgeable-organic compoundsBenzene BRL BRL BRL BRL 3.0 Toluene BRL BRL BRL BRL BRL Ethylbenzene BRL BRL BRL BRL 4.9 Total xylenes BRL BRL BRL 65 63 1,3-Dichlorobenzene BRL BRL BRL BRL BRL 1,2-Dichlorobcnzene BRL BRL BRL BRL BRL 1,4-Dichlorobenzene BRL BRL BRL BRL BRL
Constituent Trip blank (10/25/89)
Duplicate from well number 9 (10/25/89)
Well number 9 (10/25/89)
Trip blank (10/26/89)
Duplicate from well number 19 (10/26789)
Well number 19 (10/26/89)
Total petroleum hydrocarbons
Purgeable-organic compounds Benzene BRL Toluene BRL Ethylbenzene BRL Total xylenes BRL 1,3-Dichlorobenzene BRL 1,2-Dichlorobenzene BRL 1,4-Dichlorobenzene BRL
BRL
BRL BRL BRL BRL BRL BRL BRL
BRL
BRL BRL BRL BRL BRL BRL BRL
BRL BRL BRL BRL BRL BRL BRL
BRL
120 BRL BRL BRL BRL BRL BRL
BRL
130 BRL BRL BRL BRL BRL BRL
The ground-water contamination at the Petroleum Training Facility is areally widespread and the sources of contamination are not readily apparent for isolation and remediation. The locations and concentrations of fuel-oil contaminants in the ground water do not necessarily correlate with locations and concentrations of soil contamination. Although the contamination has resulted from a number of isolated spills and incidents, the timing and locations of these spills are not documented.
21
RISK IDENTIFICATION
The purpose of risk identification is to determine the likelihood of negative effects of exposure to hazardous chemical constituents identified at a site on human or wildlife populations. A prerequisite for identifying risk to potential receptors is the complete characterization of the types and extent of hazardous chemicals at the site. Once the extent of contamination has been characterized, the health threats to potential receptors can be assessed and remedial measures can be designed to prevent exposure and to ameliorate the contamination. At the Petroleum Training Facility, the distribution and directions of movement of the fuel-oil constituents have not been fully characterized; therefore, risk identification cannot be fully documented. However, in the following paragraphs, the site problems and toxicity data are presented for the chemical constituents identified at the Petroleum Training Facility.
The site problems at the Petroleum Training Facility include (1) fuel-oil constituents that could migrate vertically or horizontally to ground-water sources outside of the facility, (2) fuel-oil constituents that migrate to and contaminate surface-water sources, and (3) fuel- oil constituents in the soil.
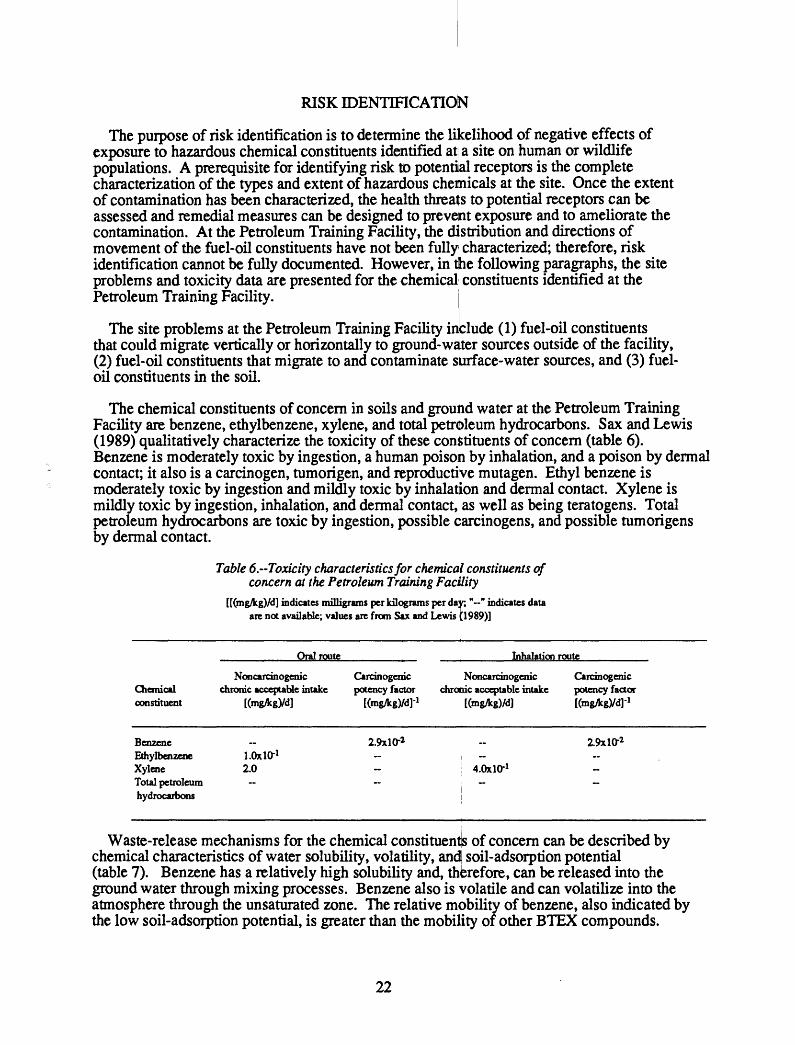
The chemical constituents of concern in soils and ground water at the Petroleum Training Facility are benzene, ethylbenzene, xylene, and total petroleum hydrocarbons. Sax and Lewis (1989) qualitatively characterize the toxicity of these constituents of concern (table 6). Benzene is moderately toxic by ingestion, a human poison by inhalation, and a poison by dermal contact; it also is a carcinogen, tumorigen, and reproductive mutagen. Ethyl benzene is moderately toxic by ingestion and mildly toxic by inhalation and dermal contact. Xylene is mildly toxic by ingestion, inhalation, and dermal contact, as well as being teratogens. Total petroleum hydrocarbons are toxic by ingestion, possible carcinogens, and possible tumorigens by dermal contact.
Table 6.~Toxicity characteristics for chemical constituents of concern at the Petroleum Training Facility
[[(mgAg)/d] indicates milligrams per kilograms per day; "--" indicates data are not available; values are from Sax and Lewis (1989)]
Oral route Inhalation route
Chemicalconstituent
BenzeneEthylbenzeneXyleneTotal petroleumhydrocarbons
Noncarcinogenicchronic acceptable intake
[(mg/kgVd]
LOxicr12.0-
Carcinogenic Noncarcinogenicpotency factor chronic acceptable intake
[(mg/kg)/d]-'
2.9x10-* ~-
[(mg/kg)/d]
~
4.0X10"1-
Carcinogenicpotency factorKmg/kgVd]
2.9xl(T2 --
-i
Waste-release mechanisms for the chemical constituent|s of concern can be described by chemical characteristics of water solubility, volatility, anc^ soil-adsorption potential (table 7). Benzene has a relatively high solubility and, therefore, can be released into the ground water through mixing processes. Benzene also is volatile and can volatilize into the atmosphere through the unsaturated zone. The relative mobility of benzene, also indicated by the low soil-adsorption potential, is greater than the mobility of other BTEX compounds.
22
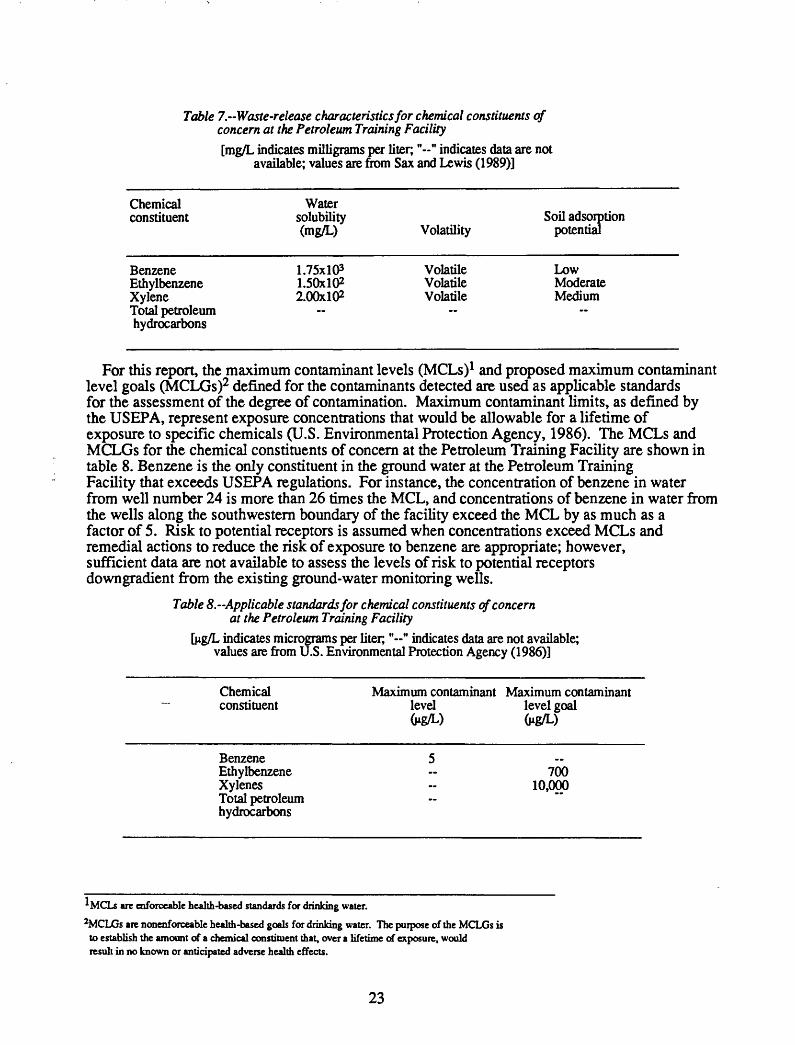
Table 7. Waste-release characteristics for chemical constituents of concern at the Petroleum Training Facility[mg/L indicates milligrams per liter;"--" indicates data are not
available; values are from Sax and Lewis (1989)]
Chemicalconstituent
BenzeneEthylbenzeneXyleneTotal petroleumhydrocarbons
Watersolubility(mg/L)
l.TSxlO31.50x1022.00x102
~
Volatility
VolatileVolatileVolatile
~
Soil adsorptionpotential
LowModerateMedium
For this report, the maximum contaminant levels (MCLs)1 and proposed maximum contaminant level goals (MCLGs)2 defined for the contaminants detected are used as applicable standards for the assessment of the degree of contamination. Maximum contaminant limits, as defined by the USEPA, represent exposure concentrations that would be allowable for a lifetime of exposure to specific chemicals (U.S. Environmental Protection Agency, 1986). The MCLs and MCLGs for the chemical constituents of concern at the Petroleum Training Facility are shown in table 8. Benzene is the only constituent in the ground water at the Petroleum Training Facility that exceeds USEPA regulations. For instance, the concentration of benzene in water from well number 24 is more than 26 times the MCL, and concentrations of benzene in water from the wells along the southwestern boundary of the facility exceed the MCL by as much as a factor of 5. Risk to potential receptors is assumed when concentrations exceed MCLs and remedial actions to reduce the risk of exposure to benzene are appropriate; however, sufficient data are not available to assess the levels of risk to potential receptors downgradient from the existing ground-water monitoring wells.
Table 8. Applicable standards for chemical constituents of concern at the Petroleum Training Facility
[ng/L indicates micrograms per liter, "--" indicates data are not available; values are from U.S. Environmental Protection Agency (1986)]
Chemical Maximum contaminant Maximum contaminant constituent level level goal
Benzene 5Ethylbenzene - 700Xylenes - 10,000Total petroleumhydrocarbons
*MCLs are enforceable health-based standards for drinking water.
2MCLGs are nonenforceable health-based goals for drinking water. The purpose of the MCLGs is to establish the amount of a chemical constituent that, over a lifetime of exposure, would result in no known or anticipated adverse health effects.
23
Sufficient data are not available to address risk to wildlife populations at the facility. Ground water from the Petroleum Training Facility probibly discharges through seeps and springs into the Blackwater Swamp and its tributaries. If the contaminated ground water identified at the facility migrates as far as these discharge points, aquatic fauna in the swamp could be exposed to the contaminants.
PRELIMINARY REMEDIAL ALTERNATIVES
Sufficient data are not available to completely characterize ground-water contamination at the Petroleum Training Facility or to fully screen or develop the alternative remedial actions. Uncertainties such as the sources, vertical and horizontal extent and magnitude of contamination, volume of soil affected, and the human arid environmental risk associated with the contamination at the facility preclude a detailed design of remedial alternatives. Because of the preliminary nature of this report and the need for additional data, general response actions that present possible situations for future remedial actions are discussed below, and a preliminary screening of applicable remedial technologies is presented (table 9).
The no action general response represents the situation if remedial actions are not taken; this response could include, at a minimum, continued monitoring. This response is considered through the entire selection process to help judge the feasibility of remedial actions compared to the no action response. Because fuel-oil product is present in two wells at the Petroleum Training Facility, the no-action response is probably inappropriate.
The monitoring general response is designed to detect the presence or change in the magnitude of contamination, either through space or time. Although this action has no remedial effect on the extent or magnitude of contamination, it is useful to record and document conditions to more fully characterize the nature of the contamination. Monitoring generally coincides with any of the selected remedial alternatives to assess the effectiveness of the remediation. Continued monitoring at the Petroleum Training Facility includes installation and sampling of additional ground-water monitoring wells, sampling of privately owned wells in the area of the Petroleum Training Facility, and stream-water sampling.
The institutional controls general response limits or eliminates access to or use of the site or its resources. Although this action has no effect on the extent or magnitude of contamination, it reduces exposure to the human population. This general response action is most commonly used when the contamination is widespread and difficult to remove or alter to a less hazardous form.
The removal general response involves the physical removal of the contaminated media through collection and extraction procedures for ground-water contaminants and excavation and removal of contaminated soils. Removal actions are typically followed by treatment and disposal once the waste is removed. Removal of contaminants from the Petroleum Training Facility can involve several methods. These include (1) subsurface drains to intercept and withdraw fuel-oil product, (2) ground-water pumping from subsurface drains or extraction wells, (3) soil-gas recovery to remove purgeable-organic compounds from the unsaturated zone and possibly from the saturated zone, and (4) because of the persistency of purgeable-organic hydrocarbons in the hydrogeologic environment, enhanced removal of fuel-oil constituents by steam extraction (U.S. Environmental Protection Agency, 1985).
The treatment general response is designed to remove contaminants from particular media to reduce the media's toxicity and to render the environment safe for human and wildlife populations. The treatment can occur in-situ or the material can be removed prior to
24
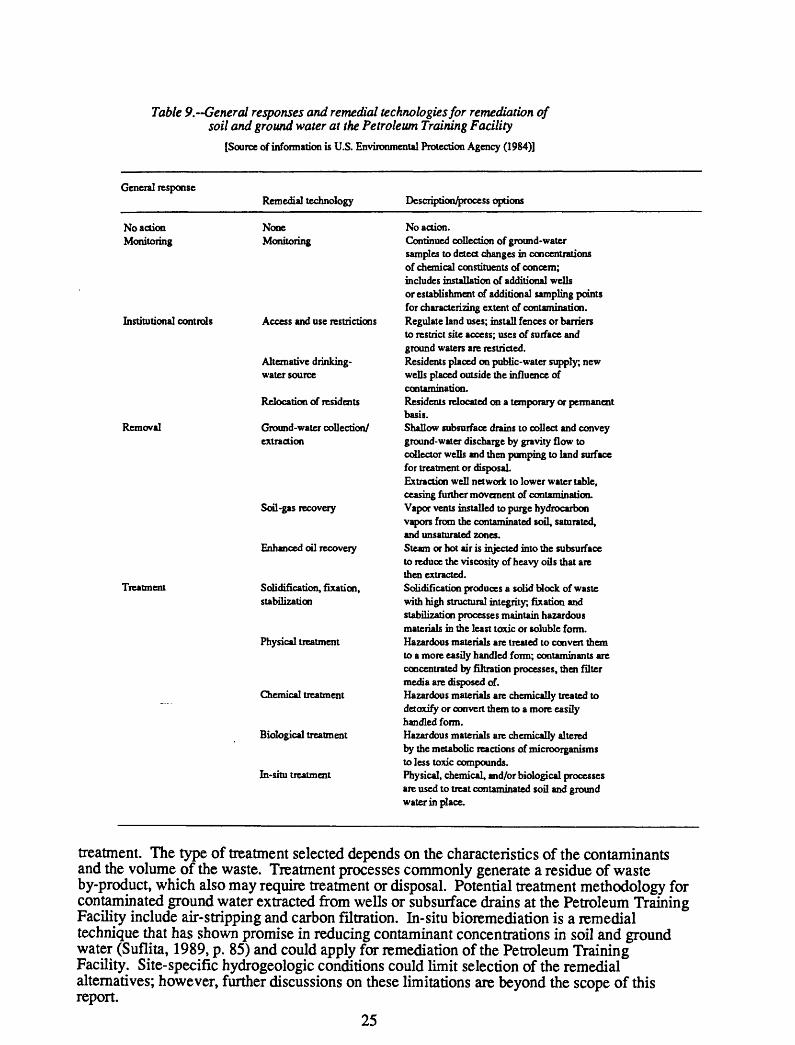
Table 9.--General responses and remedial technologies for remediation of soil and ground water at the Petroleum Training Facility
[Source of information is U.S. Environmental Protection Agency (1984)]
General responseRemedial technology Description/process options
No action Monitoring
Institutional controls
Removal
Treatment
None Monitoring
Access and use restrictions
Alternative drinking- water source
Relocation of residents
Ground-water collection/ extraction
Soil-gas recovery
Enhanced oil recovery
Solidification, fixation, stabilization
Physical treatment
Chemical treatment
Biological treatment
In-situ treatment
No action.Continued collection of ground-watersamples to detect changes in concentrationsof chemical constituents of concern;includes installation of additional wellsor establishment of additional sampling pointsfor characterizing extent of contamination.Regulate land uses; install fences or barriersto restrict site access; uses of surface andground waters are restricted.Residents placed on public-water supply; newwells placed outside the influence ofcontamination.Residents relocated on a temporary or permanentbasis.Shallow subsurface drains to collect and conveyground-water discharge by gravity flow tocollector wells and then pumping to land surfacefor treatment or disposalExtraction well network to lower water table,ceasing further movement of contamination.Vapor vents installed to purge hydrocarbonvapors from the contaminated soil, saturated,and unsaturated zones.Steam or hot air is injected into the subsurfaceto reduce the viscosity of heavy oils that arethen extracted.Solidification produces a solid block of wastewith high structural integrity, fixation andstabilization processes maintain hazardousmaterials in the least toxic or soluble form.Hazardous materials are treated to convert themto a more easily handled form; contaminants areconcentrated by filtration processes, then filtermedia are disposed of.Hazardous materials are chemically treated todetoxify or convert them to a more easilyhandled form.Hazardous materials are chemically alteredby the metabolic reactions of microorganismsto less toxic compounds.Physical, chemical, and/or biological processesare used to treat contaminated soil and groundwater in place.
treatment. The type of treatment selected depends on the characteristics of the contaminants and the volume of the waste. Treatment processes commonly generate a residue of waste by-product, which also may require treatment or disposal. Potential treatment methodology for contaminated ground water extracted from wells or subsurface drains at the Petroleum Training Facility include air-stripping and carbon filtration. In-situ bioremediation is a remedial technique that has shown promise in reducing contaminant concentrations in soil and ground water (Suflita, 1989, p. 85) and could apply for remediation of the Petroleum Training Facility. Site-specific hydrogeologic conditions could limit selection of the remedial alternatives; however, further discussions on these limitations are beyond the scope of this report.
25
SUMMARY AND CONCLUSIONS
In April 1989, the presence of fuel oil was observed in ^he ground water that infiltrated an excavation trench at the Petroleum Training Facility at Fort Lee, Virginia. Some of the releases were accidental spills, but most of the contaminant releases at the Petroleum
Training Facility resulted from leaking oil-storage tanks and transfer lines. Ground-water monitoring wells were placed on the periphery of the site to determine the quality of ground water flowing out of the site from within the facility boundary. Wells also were installed in the interior of the facility to locate the sources of contamination and to determine the concentrations of contaminants within the facility. The field-study program was designed as a preliminary investigation of shallow zones of soU and ground-water contamination; therefore, additional detailed studies are needed to describe fully the vertical and horizontal extent and rate of movement of the contamination.
The Petroleum Training Facility and surrounding area e ncompasses about 40 acres and is underlain by unconsolidated deposits of the Coastal Plain physiographic province of Virginia. Monitoring wells were drilled and installed by the hollow^stem augering method to depths ranging from 20 to 35 ft below land surface; wells were constructed of 2-in. diameterflush-threaded PVC casing. Geologic data were collectedthe lithology of the shallow stratum consists of fine- to medium-grained sand and clay, the thicknesses of which differ areally depending upon the de positional and erosional history ofthe area. Additional geologic data are needed to adequate framework at the facility.
during the installation of the wells;
y describe the hydrogeologic
The generalized direction of ground-water flow at the Petroleum Training Facility, inferred from water-level data collected October 1989, is to the east and southeast from the facility. Data are not available to estimate the rate of ground-water flow at the facility. The Blackwater Swamp and its tributaries are probable hydrologic boundaries and discharge areas for ground water flowing away from the facility.
Soil samples were collected in boreholes within 2 ft above the water table at 13 locations around the periphery of the facility. Laboratory analyses <i>f the soil samples indicate total petroleum concentrations ranging from below reporting limits (BRL) to 18,400 mg/kg, and were as large as 810 mg/kg along the southern boundary of the facility.
Ground-water contamination at the facility is scattered and widespread and the source areas of the contamination are not readily discernable. Laboratory analyses of ground-water samples, which were collected from wells at the Petroleum Training Facility during October 1989, indicate concentrations of total petroleum hydrocarbons ranging from BRL to 1 mg/L. Concentrations of benzene, ethylbenzene, and xylene ranged from BRL to 130,54, and 120 |ig/L, respectively. Concentrations of toluene were below reporting limits in water from all of the wells. Free-floating fuel oil was observed in two monitoring wells at the facility.
Risk identification at the Petroleum Training Facility cadnot be properly addressed because the extent and types of contamination have not been fully characterized. However, an examination of toxicity data for the chemical constituents identified in the ground water (benzene, ethylbenzene, and xylene) indicates that benzent concentrations are as much as 26 times the USEPA MCL. Benzene has relatively high potential and migration within a hydrogeological regime and, therefore, is more mobile than the other compounds reported.
Sufficient data are not available to design fully the remedial-action plan for the site. Uncertainties such as the sources, vertical and horizontal extent and magnitude of the contamination, volume of soil effected, and the human and environmental risk associated with exposure to contamination at the facility preclude a detailed design of remedial alternatives. However, general responses to contamination of the type associated with the facility include no action, monitoring, institutional controls, removal, and treatment.
26
REFERENCES
Alexander, Martin, 1980, Biodegradation of chemicals of environmental concern: Science, v. 211, p. 132-211.
Baedecker, M.J., Siegal, D.I., Bennett, P., and Cozzarelli, I.M., 1989, The fate and effects of crude oil in a shallow aquifer I. The distribution of chemical species and geochemical facies, in U.S. Geological Survey toxic substances hydrology program- Proceedings of the technical meeting, Phoenix, Arizona, September 26-30,1988: U.S. Geological Survey Water-Resources Investigations Report 88-4220, p. 13-20.
Brown, P.M., Miller, J.M., Swain, P.M., 1972, Structural and stratigraphic framework, and spatial distribution of permeability of the Atlantic Coastal Plain, North Carolina to New York: U.S. Geological Survey Professional Paper 796,79 p., 59 pi.
Clark, W.B., 1912, The physiography and geology of the Coastal Plain province of Virginia: Virginia Geological Survey Bulletin 4, p. 13-322.
Cozzarelli, I.M., Eganhouse, R.P., and Baedecker, M.J., 1989, The fate and effects of crude oil in a shallow aquifer- n. Evidence of anaerobic degradation of monoaromatic hydrocarbons, in U.S. Geological Survey toxic substances hydrology program- Proceedings of the technical meeting, Phoenix, Arizona, September 26-30,1988: U.S. Geological Survey Water-Resources Investigations Report 88-4220, p. 21-33.
Meng, A. A., in, and Harsh, J.F., 1988, Hydrogeologic framework of the Virginia Coastal Plain: U.S. Geological Survey Professional Paper 1404-C, 82 p.
Sax, N.I., and Lewis, R.J., Sr., 1989, Dangerous properties of industrial materials, Seventh Edition, Volume II: New York, Van Nostrand Reinhold, 3,124 p.
Suflita, J.M., 1989, Microbiological principles influencing the biorestoration of aquifers, in U.S. Environmental Protection Agency, Transport and fate of contaminants in the subsurface: EPA/625/4-89/019, Sept. 1989,148 p.
U.S. Environmental Protection Agency, 1983, Methods for chemical analysis of water and waste: EPA-600/4-79-020, (Revised 1983).
___ 1984~~Guidlines for establishing test procedures for analysis of pollution under the Clean Water Act (pan 136, Final rule, interim final rule, and proposed rule): U.S. Code of Federal Regulations, Title 40, Part VIE, U.S. Environmental Protection Agency, Washington, D.C.
___ 1985, Handbook - Remedial action at waste disposal sites (Revised): EPA/625/6-85/006.
___ 1986, Maximum contaminant levels (subpart B of part 141, National primary drinking-water regulations): U.S. Code of Federal Regulations, Title 40, parts 100 to 149, revised July 1,1986, U.S. Environmental Protection Agency, Washington, D.C, p. 524-528.
27
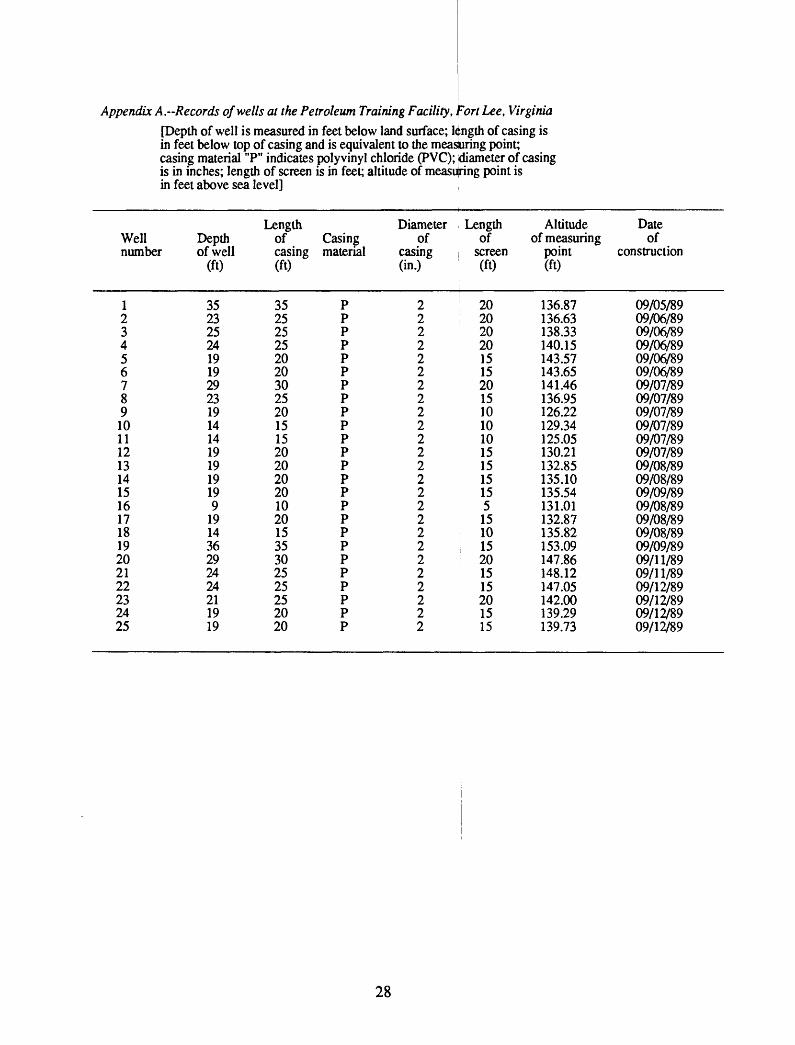
Appendix A. Records of wells at the Petroleum Training Facility, fort Lee, Virginia[Depth of well is measured in feet below land surface; length of casing is in feet below top of casing and is equivalent to the measuring point; casing material "P" indicates polyvinyl chloride (PVC); Kliameter of casing is in inches; length of screen is in feet; altitude of measuring point is in feet above sea level]
Well number
12345678910111213141516171819202122232425
Depth of well
(ft)
3523252419192923191414191919199
191436292424211919
Length of casing (ft)
35252525202030252015152020202010201535302525252020
Casing material
PPPPPPPPPPPPPPPPPPPPPPPPP
Diameter of
casing (in.)
2222222222222222222222222
Length of
screen (ft)
2020202015152015101010151515155
151015201515201515
Altitude of measuring
point (ft)
136.87136.63138.33140.15143.57143.65141.46136.95126.22129.34125.05130.21132.85135.10135.54131.01132.87135.82153.09147.86148.12147.05142.00139.29139.73
Date of
construction
09/05/8909/06/8909/06/8909/06/8909/06/8909/06/8909/07/8909/07/8909/07/8909/07/8909/07/8909/07/8909/08/8909/08/8909/09/8909/08/8909/08/8909/08/8909/09/8909/11/8909/11/8909/12/8909/12/8909/12/8909/12/89
28