Embed Size (px)
Citation preview

PP
P The Polar Prediction Projectand the
Year of Polar Prediction
YOPP and short -range NWP
Pho
to: G
. Die
ckm
ann,
AW
IYOPP and short -range NWP
WW
RP
Trond Iversenon behalf of the PPP steering group and ICO
38th (EWGLAM) and 23rd (SRNWP) EUMETNET meetings Rome, 2-6 Oct. 2016

PP
P Why?Significant gaps in the polar observing systems
Hard task for data assimilation where (i) observations are rare
WW
RP
Polar data coverage of conventional observations in the E CMWF operational analysison 1 January 2012
Synop, AIREP, DRIBU, TEMP and PILOT
P. Bauer (ECMWF)

PP
P Why?
200Tropics
200
Tropics: Ocean-only (DJF) Arctic: Sea ice-covered ocean (DJF)
Hard task for data assimilation where (i) observations are rare and (ii) models are deficient
Strong differences between polar and lower latitudes
1015
925
850
700
500
DynRadVDiffConvLSP
1015
925
850
700
500
Pre
ssur
e (h
Pa)
DynRadVDiffConvLSP
WW
RP
S. Serrar (AWI)
-7 -6 -5 -4 -3 -2 -1 0 1 2 3 4 5 6 7Mean Temperature Tendency (K/day)
1015-7 -6 -5 -4 -3 -2 -1 0 1 2 3 4 5 6 7
Mean Temperature Tendency (K/day)
1015
T-tendencies:dynamical cooling by advection and ascent (Dyn); radiative (Rad);vertical diffusion (VDiff); convective (Conv);evaporative cooling of large-scale precipitation (LSP);
Model difficulties : - stably stratified boundary layers over sea ice- mixed-phase clouds- presence of sea-ice; difficult rheology

PP
P
Analysis and forecast quality
Why?
TIGGE* analysis spread (Oct-Nov 2010)* UKMO, ECMWF, NCEP, CMC, CMA
2-meter temperature (K) 500hPa geop. height (m)
* UKMO, ECMWF, NCEP, CMC, CMA
WW
RP
Hamill 2012, (pers. comm.)
PP
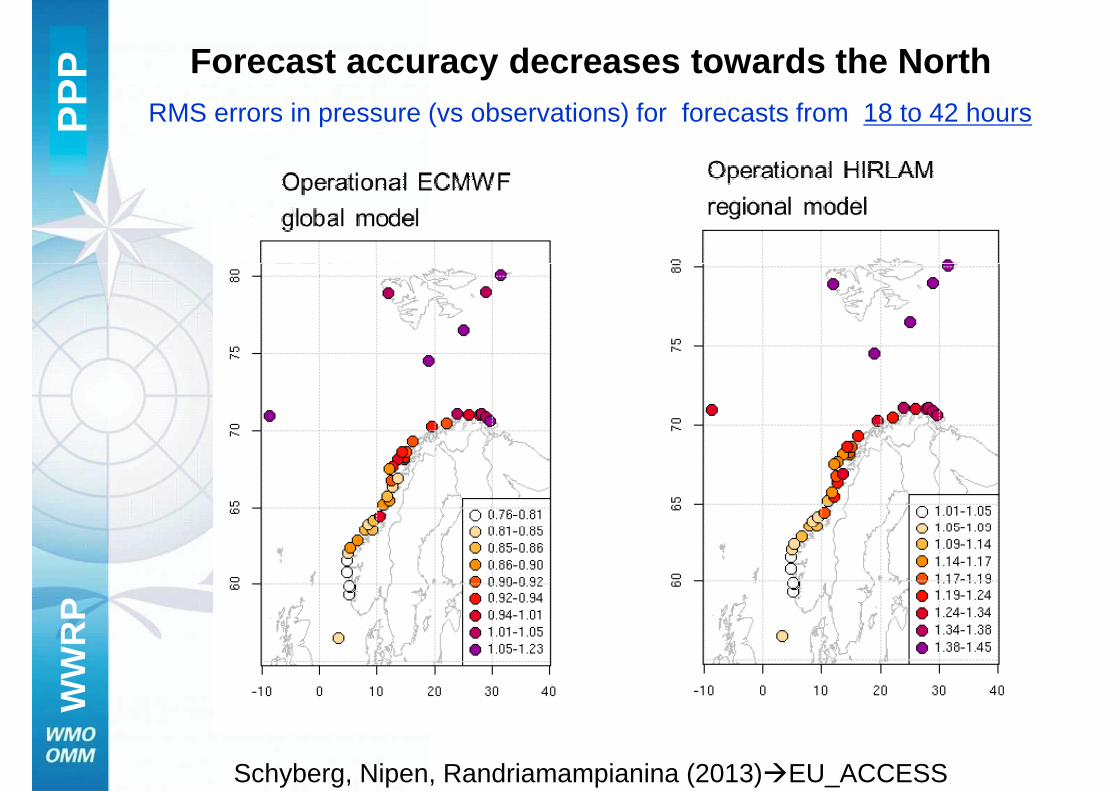
P Forecast accuracy decreases towards the NorthRMS errors in pressure (vs observations) for forecasts from 18 to 42 hours
WW
RP
Schyberg, Nipen, Randriamampianina (2013)�EU_ACCESS

PP
P Year of Polar Prediction
MOSAiC
YOPP mid- Consolida on
a period of intensive observing, modelling, prediction, verification, user engagement and
education activities
Prepara on Phase 2013 to mid-2017
Consolida on Phase mid-2019 to 2022
Community engagement
Alignment with other
planned ac vi es
Development of
Intensive observing periods
& satellite snapshot
Dedicated model
experiments Model developments
Data denial experiments
Prepara on Phase 2013 to mid-2017
YOPP mid- 2017 to
mid-2019
Consolida on Phase
mid-2019 to
2022
Coupled data
WW
RP
Fundraising &
Resource mobiliza on
Preparatory research
Summer school
Workshops
Development of
Implementa on Plan
Research into use &
value of forecasts
Intensive verifica on
effort
Dedicated reanalyses
Opera onal
implementa on
YOPP publica ons
YOPP conference Summer school
Coupled data
assimila on

PP
PThe YOPP-Observational Component
ADM/Aelous wind Lidar
SOP-NH (buoys, shipis, synops, temps)
SOP-SH
ADM/Aelous wind Lidar
WW
RP
YOPP Field campaigns(Schematic)
YFCs(aircrafts, vessels, etc)
SOP-SH

PP
P• Identify polar specific scientific issues that requ ire
addressing in NWP systems to advance predictive ski ll• Devise numerical experiments that provide guidance on
how to implement improvements
The YOPP Modeling Component
How do we diagnose/quantify this ?Model forecasts :
• Observation impact : contribution of observations to predictive skill (FSOI, OSE, OSSE)
• Ensemble diagnostics : sensitivity of forecasts to location/magnitude of initial perturbations
• Relaxation experiments : sensitivity of forecasts to ‘accurate’ states in selected areas, linkages
WW
RP
areas, linkages
Analysis/initial conditions :• Observation impact : contribution of observations to analysis (DFS, increments)
• Ensemble diagnostics : consistency of uncertainty definition in analysis• Tendency diagnostics : contribution of processes to tendencies, error growth
• Reanalyses : representation of trends, budgets (incl. most of the above!)
NB: Climate change may hamper statistical calibration of extremes

PP
P
Core Datasets: Main modelling datasets produced primarily to support YOPP. Covering YOPP core period (mid-2017 to mid-2019) but could be extended to cover
YOPP Model Dataset Categories
2017 to mid-2019) but could be extended to cover MOSAiC period
Supplementary Datasets:
Outside YOPP, but providing valuable resources to support YOPP scientific studies.
Experimental Datasets:
Experiments running during YOPP aimed at studying and improving model performance for polar prediction. This will include contributions
WW
RP
Datasets:polar prediction. This will include contributions from a wide range of YOPP scientists.

PP
P Example: Analysis Uncertainty
Large spread in the analysis of T2m in regions of sea ice
and snow– except summer when the ice temperature is close to ice temperature is close to
melting.
WW
RP
October 29, 2014Jung et al. 2014

PP
PForecast sensitivity to the observing system within the
Arctic (>68N) –Winter (S. Keeley, ECMWF )
ALLSKY-MHSAIRSIASI
AMSU-A
FSOI (%)
SCAT
AIRCRAFT
SYNOP
BUOYFSOI per obs. (x 10 -5 J/kg)
Adjoint sensitivity tool (FSOI = Forecast Sensitivity to Observations Impact)
AIRCRAFTSCATAMVsATMS
GPS-ROBUOY
CrISTEMP
SYNOPALLSKY-MHS
AMSU-A
MWHS-FY3
GPS-RO
ALLSKY-SSMIS
ALLSKY-MHS
PROFILER
AMVs
TEMP
PILOT
WW
RP
October 29, 2014 11
41r1 for 1 st November 2015 – 28 February 2016
0 5 10 15 20
O3PROFILER
MWHS-FY3HIRS
PILOTALLSKY-SSMIS
AIRCRAFT
-0,8 -0,6 -0,4 -0,2 0
O3
IASI
CrIS
AIRS
HIRS
ATMS

PP
P OSE – Impact of remote radiosonde stationsIPY-THORPEX study (March 2008) Randriamampianina et al. (2011)
Examples from short-range NWP:
Z700 Z850
OSSE – impact of more ~24 (x2) BUOYsEU FP7 ACCESS study (August 2013) Randriamampianina & Schyberg (2014)
WW
RP
Z1000
Rh850

PP
PExample: Relaxation experiments
Atmosphere model coupled with observed SSTs
+2d +5d
WW
RP
(Jung et al. 2015)T2m Difference: Observed Minus Persisted Sea Ice;
Nov. 2011 (ECMWF)
+7d +10d

PP
P Polar lows:
Polar Low
•A small-scale, rapidly
developing and fairlydeveloping and fairly
intense cyclone over ice-
free ocean
•October - May
•Rapidly changing
weather
WW
RP
«Regular» Low on the polar front
•Gale or storm force
winds
•Severe snow intensity

PP
P24h forecast, valid at 16.03.2008 12 UTC
HARMONIE verifying analysis16.03.2008 12 UTC
IASI & campaign data employedIASI-data No IASI-data
stu
-dat
aRandriamampianina , Iversen and Storto, 2011, Q.J.R.M.S.. DOI:10.1002/qj.838
Example from IPY ThorpexC
ampa
ign
in-s
tu
stu
-dat
aW
WR
PN
o ca
mpa
ign
in-s
tu
NOAA-18, 16.03.2008 09:26Campaign observations + IASI ����improved forecast

PP
POperational short-range NWP with Arctic cover
AROME-Arctic
WW
RP
Categorical (deterministic) 60hconvective scale (2.5km) atmosphere model
coupled to simplified sea-ice model
Also a candidate for re-analysis
Other European Systems are welcome!

PP
P Possible (Nordic) short-range contributions to the YOPP modelling plan:
● Core datasets○ AROME-Arctic forecast data sets with additional variables○ Re-analysis with AROME-Arctic○ Re-analysis with AROME-Arctic
● Supplementary datasets○ GLAMEPS forecast data
● Experimental Set-ups○ Data-denial experiments with AROME-Arctic○ Experiments with GLAMEPS (possibly)
WW
RP
○ Experiments with GLAMEPS (possibly)○ High-resolution coupled model system experiments
NB: To obtain YOPP endorsement of projects����http://apps3.awi.de/YPP/

PP
P Arctic-specific phenomena can be relevant for NWP at mid-latitudes,
e.g.: • Stable ABL, • Fog & Stratus-clouds; • Mesoscale storm systems (Mediteranean «hurricanes») • Weather systems associated with strong surface contrasts• Weather systems associated with strong surface contrasts• Linkages:
WW
RP

PP
P
Kolstad and Bracegirdle, 2007, Clim Dyn:
Climate Change: Profoundly new extremes (?)
Should SRNWP address potential C.C.-induced NWP-challen ges? W
WR
P
8 Jan 2010IPCC AR4
First PL North of Svalbard

PP
PW
WR
P

PP
P
Reduced Arctic Sea-ice extent
1979-1990
National Snow and Ice Data Center
1991-2002 2003-2014
WW
RP

PP
P Predicting extremes in the ArcticExtreme Forecast Index (EFI) for T2m; 30 Dec. 2015
L. Magnusson; E C M W F
30 Dec 29 Dec 28 Dec30 Dec 29 Dec 28 Dec
WW
RP
27 Dec 26 Dec 25 Dec 24 Dec

PP
PW
WR
P
�http://apps3.awi.de/YPP/

PP
P16:01 UTC on 3 March 11:28 UTC on 4 March
Føre et al, 2011 , (IPY Thorpex) QJRMS
Pot Temp
Rel Hum
WW
RP
Wind

PP
P MCAO (M>3.4)-Hit Rate 1989-2010, ERA InterimKolstad, 2011, QJRMS, 137
WW
RP
Additional requirement are needed for PLs to actually occ ur: E.g.: upper-level PV anomaly: p 2pvu > 470 hPa

PP
P The YOPP-Observational Component
� Purpose: Comprehensive observational „snapshot“ for
• Improved initial conditions• Model development• Forecast verification
� Selected Elements• Mobile systems (buoys, ships etc.) �SOPs• Extra observations from existing sites �SOPs• Supersites � model grid box (e.g., MOSAiC and SIOS)• Satellite snapshots
WW
RP
• Satellite snapshots• YOPP field campaigns (aircraft etc.)• User relevant data � verification• Data availability (GTS, data sharing)

PP
P Example for experiments: OSE and OSSE
What : quantify improvement of
analysis/forecast analysis/forecast contributed by
(simulated) observations
How : perform experiments with
existing and simulated
WW
RP
(Masutani et al. 2015)
simulated observations (needs
calibration)

PP
PW
WR
P
28

PP
P Growth mechanism: consequence of ABL contrasts specific for the Arctic
Linders and Sætra, 2010, J.A.S.
High CAPE ���� Low CINi.e.: unconditional instability/ ongoing deep convection tCAPE<1h; tPL~>1d/ ongoing deep convection tCAPE<1h; tPL~>1d
There is no CAPE-reservoirfor PL kinetic energy.
Plausible energy source:Continuously replenishedturbulent surface fluxes
WW
RP
High CIN ���� Low CAPEStably capped, unstable ABL,i.e. during cold air outbreaks
turbulent surface fluxes

PP
P
Climate change: Arctic opening and increased activity
Why?
Optimal Arctic shipping routes
open water ships(40% success)
polar class 6 ships
1979-2005 2040-2059 (RCP 4.5)
(94% success)
WW
RP
Smith and Stephenson (2013)

PP
P
Linkages: Potential for improved predictionsin middle latitudes
Why?
Day 1-5 Day 6-10 Day 11-30
WW
RP
Jung et al. (2014), Geophys. Res. Lett.