Embed Size (px)
Citation preview
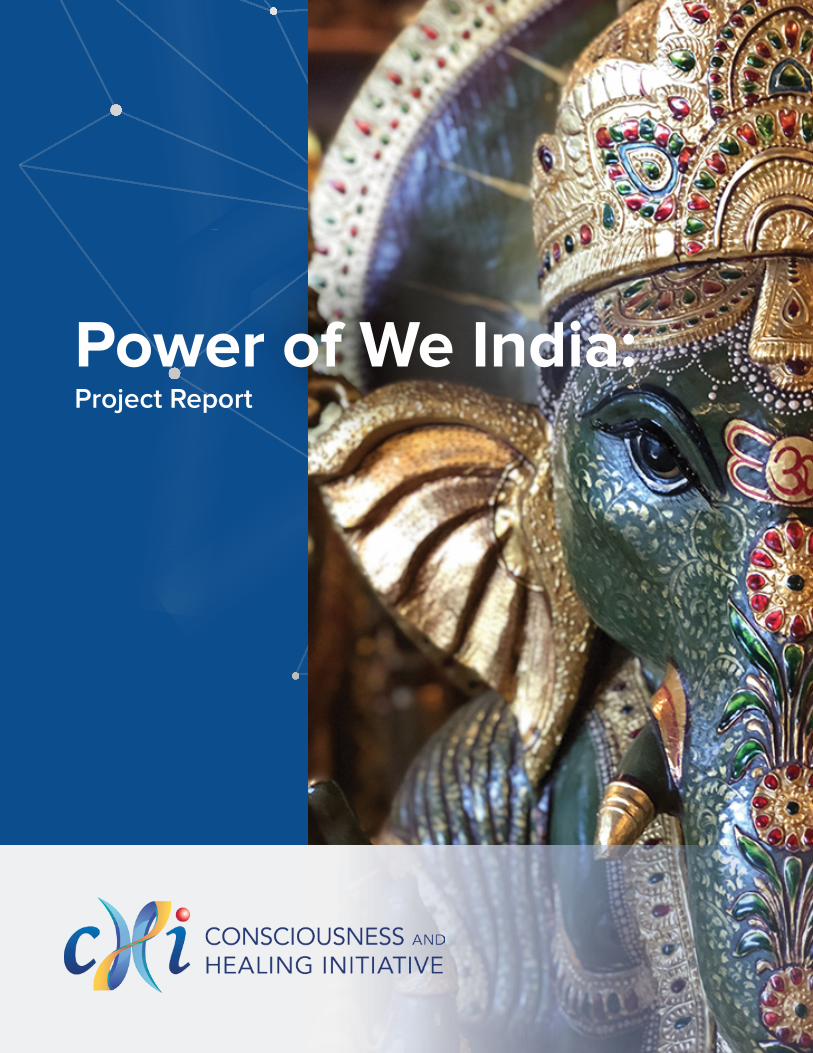
Power of We India: Project Report
Power of We India Project | 5
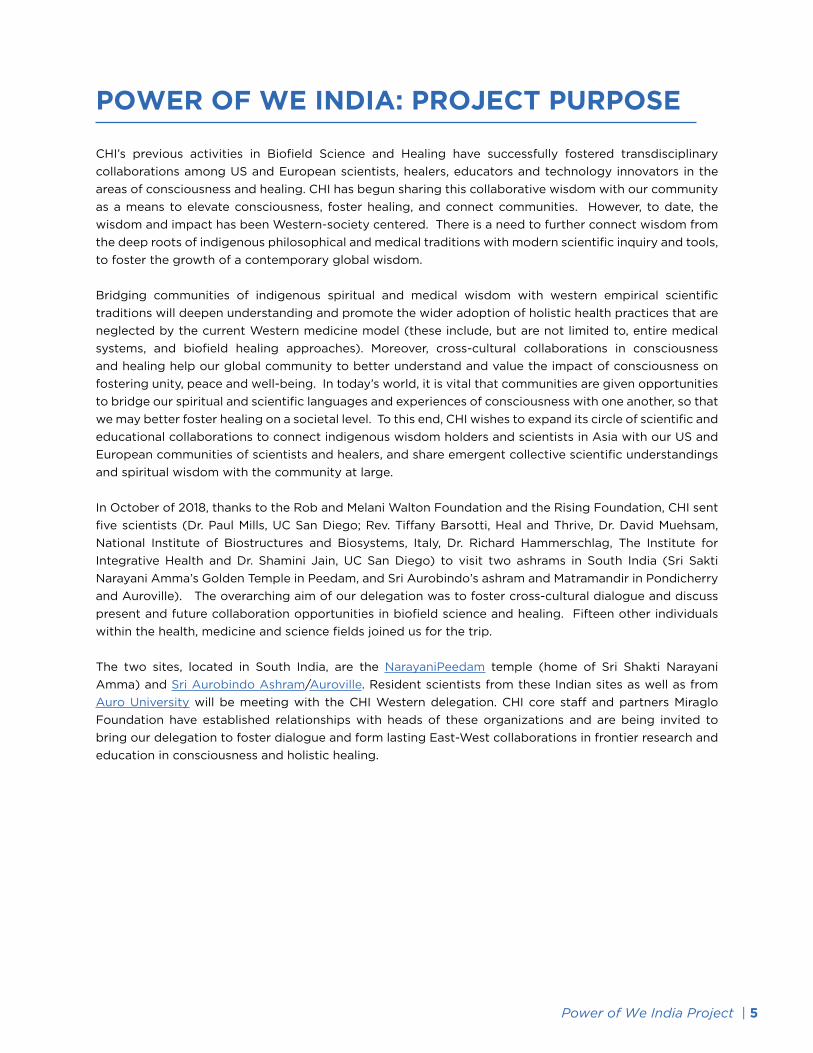
POWER OF WE INDIA: PROJECT PURPOSE
CHI’s previous activities in Biofield Science and Healing have successfully fostered transdisciplinary
collaborations among US and European scientists, healers, educators and technology innovators in the
areas of consciousness and healing. CHI has begun sharing this collaborative wisdom with our community
as a means to elevate consciousness, foster healing, and connect communities. However, to date, the
wisdom and impact has been Western-society centered. There is a need to further connect wisdom from
the deep roots of indigenous philosophical and medical traditions with modern scientific inquiry and tools,
to foster the growth of a contemporary global wisdom.
Bridging communities of indigenous spiritual and medical wisdom with western empirical scientific
traditions will deepen understanding and promote the wider adoption of holistic health practices that are
neglected by the current Western medicine model (these include, but are not limited to, entire medical
systems, and biofield healing approaches). Moreover, cross-cultural collaborations in consciousness
and healing help our global community to better understand and value the impact of consciousness on
fostering unity, peace and well-being. In today’s world, it is vital that communities are given opportunities
to bridge our spiritual and scientific languages and experiences of consciousness with one another, so that
we may better foster healing on a societal level. To this end, CHI wishes to expand its circle of scientific and
educational collaborations to connect indigenous wisdom holders and scientists in Asia with our US and
European communities of scientists and healers, and share emergent collective scientific understandings
and spiritual wisdom with the community at large.
In October of 2018, thanks to the Rob and Melani Walton Foundation and the Rising Foundation, CHI sent
five scientists (Dr. Paul Mills, UC San Diego; Rev. Tiffany Barsotti, Heal and Thrive, Dr. David Muehsam,
National Institute of Biostructures and Biosystems, Italy, Dr. Richard Hammerschlag, The Institute for
Integrative Health and Dr. Shamini Jain, UC San Diego) to visit two ashrams in South India (Sri Sakti
Narayani Amma’s Golden Temple in Peedam, and Sri Aurobindo’s ashram and Matramandir in Pondicherry
and Auroville). The overarching aim of our delegation was to foster cross-cultural dialogue and discuss
present and future collaboration opportunities in biofield science and healing. Fifteen other individuals
within the health, medicine and science fields joined us for the trip.
The two sites, located in South India, are the NarayaniPeedam temple (home of Sri Shakti Narayani
Amma) and Sri Aurobindo Ashram/Auroville. Resident scientists from these Indian sites as well as from
Auro University will be meeting with the CHI Western delegation. CHI core staff and partners Miraglo
Foundation have established relationships with heads of these organizations and are being invited to
bring our delegation to foster dialogue and form lasting East-West collaborations in frontier research and
education in consciousness and holistic healing.

6 | The Consciousness and Healing Initiative - CHI
Results of Cross-Cultural Dialogue
We received a warm welcome from leaders at both ashrams (including Sri Sakti Narayani Amma at the
Golden Temple, and Sraddhalu Ranade at the Sri Aurobindo Ashram) who facilitated invaluable access
to spiritual sites (as research locales) and key individuals (as discussion partners). Highlights of these
encounters included:
• Meetings with several spiritually-oriented scientists in Auroville, working in the areas of sound
healing, spiritual psychology, and community sustainability, to discuss CHI’s work and possible
collaborations. Reflections of these meetings are presented in videos, brief essays and photos
posted on our webpage for the project: https://www.chi.is/india-research/
• Fostering cross-cultural, collaborative research of spiritual practice within real-world settings,
including formal temple-based pujas and ashram-based meditation groups, to explore and
compare biofield synchrony during different types of spiritually prescribed group meditative
practices.
Research Implementation, Data Collection and Analysis
For our cross-cultural research, we asked two main questions:
1) Does group meditation facilitate synchronization of our biofields? Specifically, do our EEG-
detectable brainwaves come into coherence during group meditation?
2) Does group meditation create a coherent group field in the meditative environment?
Specifically, are there measureable changes in the energy field of the room during group meditation?
By travelling to India to learn from and dialogue with masters and leaders in meditation and subtle energy,
we were not only able to gain insights into their practices via direct dialogue, but to collect data from expert
meditators in their naturalistic meditation settings. Thanks to Interaxon for their generous donation of their
newest wireless Muse EEG headsets, with which we were able to collect brainwave data simultaneously
for 6 people during group meditations, and thanks to the Bio-well group, we were able to collect data,
during these same meditation sessions, on group field coherence. Finally, thanks to the cooperation of our
colleagues in Auroville (in Pondicherry, India), we were able to collect data during a guided group meditation
session in a carefully timed process. We understood that travelling to a foreign culture to collect data
in a field setting such as during pujas (Tamil Hindu rituals) and group meditation requires open-hearted
cooperation between all parties, including the participants and facilitator, and we feel very fortunate to have
collaborated with such spiritually motivated leaders who were also ‘research-friendly.’ We credit our team
of scientists, all of whom are also veteran meditators, with the ability to engage in the kind of cross-cultural
dialogue that shows respect and sensitivity to the values and practices of the local practitioners, and to
bridge the gap between indigenous spiritual practices and the Western science world view. We believe that
such an approach not only makes the results more meaningful, but is necessary to conduct research of this
nature and to guide future research endeavors.

Power of We India Project | 7
Summary of ResultsWe present findings below for the group meditation session that occurred at Auroville, with meditation
leader Sraddhalu Ranade. Because this data was the cleanest to analyze given the diverse field settings
we were in, this dataset in particular was chosen for analysis. The study conditions and protocol reflect
the knowledge, cooperation and collaboration of Mr. Ranade with our research team.
Detailed analyses of both EEG and Sputnik data are provided in Appendices A and B, respectively.
Because this particular meditation was conducted only one time, as opposed to being collected over
multiple time frames, our research group considers these very promising results preliminary. In order to
be considered definitive scientifically, this protocol would need to be replicated over multiple time frames
(i.e., at least 3 times and ideally 6). We strive to publish these findings in a peer-reviewed journal, however
the decision-making of publication is ultimately up to the journal where the paper is submitted, rather than
our team.
Our preliminary data gathered in India suggest that coming together in guided group meditation with
a skilled facilitator and experienced practitioners fosters brainwave coherence among participant
meditators, and that this brainwave coherence can increase during particular periods of the meditation.
Further, our preliminary results suggest that room electromagnetic field changes can be detected
during meditation practices.
Figure 1: Meditation session in Pondicherry. Sraddhalu Renade (2nd from left in yellow), and his group
of 5 experienced meditators, Rev. Tiffany Barsotti (4th from left) operating Bio-Well device), Dr. David
Muehsam, (seated on floor at right) monitoring EEG data stream.
These exciting preliminary results demonstrate that modern research techniques can be adapted to use
in naturalistic settings of meditation practice, and also demonstrate that sophisticated measures of group
brainwave coherence and electromagnetic status of the meditation environment can provide meaningful
insights into group meditation, moving us into understanding the nature of human to human connection
during collective spiritual practice. These results provide strong impetus for further study in this area, and
proof of principle that it is possible to ‘bring the lab to the meditators’ to gather data in the authentic
settings in which meditation and religious rituals are practiced.

8 | The Consciousness and Healing Initiative - CHI
Dissemination of Study Work Product
Our initial explorations into publishing the data in a scientific journal from these preliminary results have
not yet borne fruit; the major concern is the collection of data at only one timepoint for the Pondicherry
data, which is the cleanest data that we have. (Unfortunately, the EEG data collected at the Golden
Temple is fraught with artifacts due to the environmental factors that were there (loud noises that created
muscle and eye artifacts) during the recordings). Journals are requesting a repetition of the experiment
up to 6 times to ensure that the results are not spurious (shown by chance).
Our collaborators in Auroville are actually very enthusiastic about replicating this experiment. The group
desires to foster the next step for this effort, which will include a replication of the original protocol and
training of Auroville staff to collect data independently, thus allowing for ease of ongoing data collection
(the data will then be sent to the CHI team in the US to analyze). However, these next steps are funding
dependent – an additional grant will be needed to execute this replication and extension of original results.
APPENDIX A: Group Meditation And Brain Synchrony
Data collection: David Muehsam, Richard Hammerschlag, Lauren Evanow
Data analysis and technical report: Arnaud Delorme
Protocol and Set Up
6 expert meditators where fitted with the Muse 2016 headsets (Interaxon Inc.), and went through an
approximately 30-minute guided meditation led by Sr. Each Muse device was associated with an iPod
running the Muse Monitor app and configured to collect raw data at about 300 Hz through Bluetooth
connection (see Annex 2 picture on the right). Prior to wearing the Muse, data was time-synchronized using
custom made cables (see picture in Annex 3). For synchronization, Dr. Muehsam developed a method which
could be implemented in the field: the Fpz electrodes (center forehead) of 6 headsets were connected using
a strip of conductive rubber. The Muse auxiliary channels were connected to this ground using a custom-
made 6-headed ‘hydra’ cable consisting of one male banana plug connecting to 6 male RCA connectors
connected via female RCAs to auxiliary channel pin 4 on each of the 6 Muse headset via a custom-made
micro USB connector. Holding the banana plug in contact with the conductive rubber sent the aux channel
values to a flat value, then manually releasing the banana plug released all 6 channels simultaneously to open
channel noise. After synching, the aux channels were then connected to the ECG leads and muse headsets
were placed on participants, with ECG electrodes on the left side of the torso a few inches below the armpit
or left-center chest region or on the left-center chest. For the ECG measurements, a custom shielded cable
was designed. Shielded cables were used throughout, and shielding from the ECG electrode to the USB male
connectors (pin 4) was maintained via the outer RCA conductors. This configuration allowed for accurate
synchronization of the data from 6 Muse headsets under field conditions to within on sampling period of the
256Hz Muse data sampling rate, without the need for external clocking devices.
Power of We India Project | 9
Data analysis
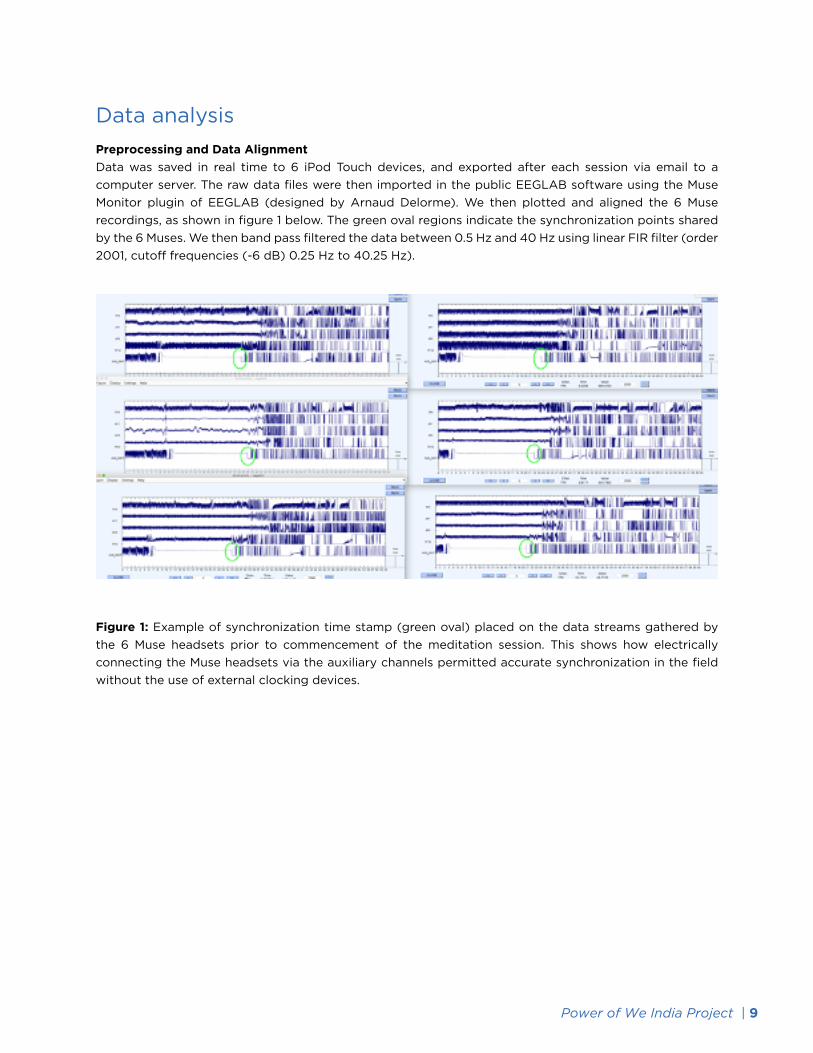
Preprocessing and Data Alignment
Data was saved in real time to 6 iPod Touch devices, and exported after each session via email to a
computer server. The raw data files were then imported in the public EEGLAB software using the Muse
Monitor plugin of EEGLAB (designed by Arnaud Delorme). We then plotted and aligned the 6 Muse
recordings, as shown in figure 1 below. The green oval regions indicate the synchronization points shared
by the 6 Muses. We then band pass filtered the data between 0.5 Hz and 40 Hz using linear FIR filter (order
2001, cutoff frequencies (-6 dB) 0.25 Hz to 40.25 Hz).
Figure 1: Example of synchronization time stamp (green oval) placed on the data streams gathered by
the 6 Muse headsets prior to commencement of the meditation session. This shows how electrically
connecting the Muse headsets via the auxiliary channels permitted accurate synchronization in the field
without the use of external clocking devices.
10 | The Consciousness and Healing Initiative - CHI
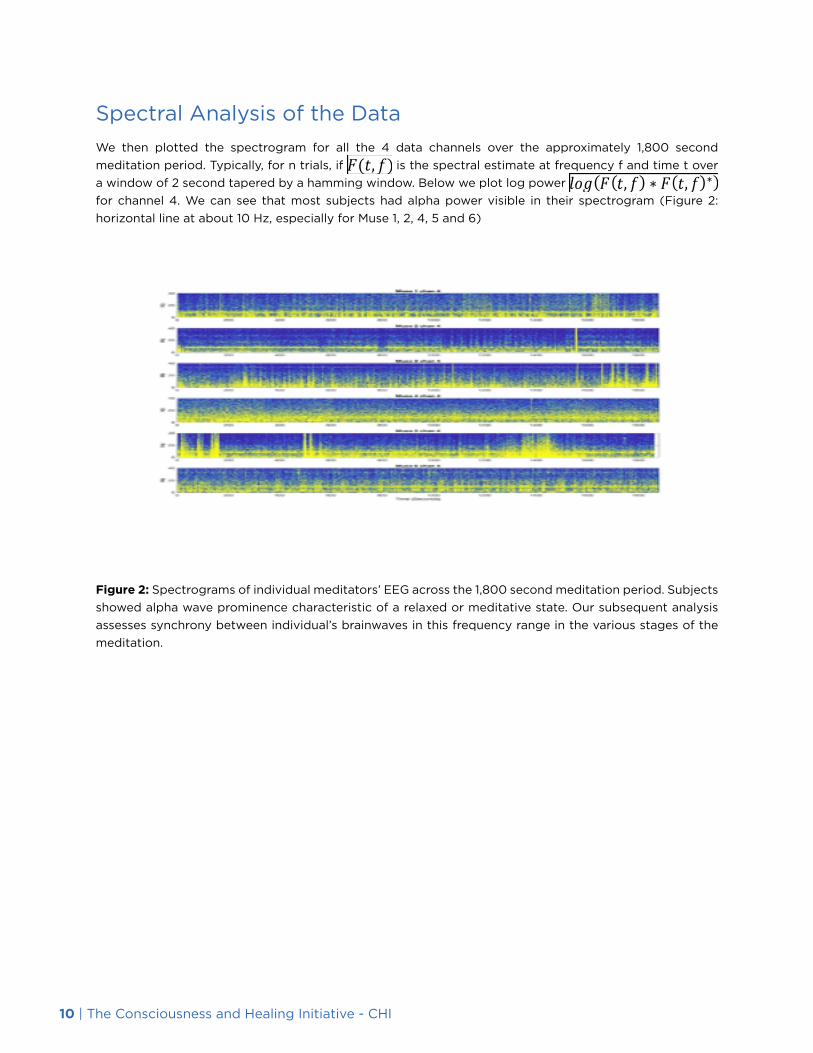
Spectral Analysis of the Data
We then plotted the spectrogram for all the 4 data channels over the approximately 1,800 second
meditation period. Typically, for n trials, if is the spectral estimate at frequency f and time t over
a window of 2 second tapered by a hamming window. Below we plot log power
for channel 4. We can see that most subjects had alpha power visible in their spectrogram (Figure 2:
horizontal line at about 10 Hz, especially for Muse 1, 2, 4, 5 and 6)
Figure 2: Spectrograms of individual meditators’ EEG across the 1,800 second meditation period. Subjects
showed alpha wave prominence characteristic of a relaxed or meditative state. Our subsequent analysis
assesses synchrony between individual’s brainwaves in this frequency range in the various stages of the
meditation.
Power of We India Project | 11
Brainwave Coherence AnalysisWe analyzed instantaneous phase coherence in the alpha frequency band (which is the dominant
frequency band in EEG and has been shown to be involved during meditation). For each pair of channel
x and y, we calculated for each pair of channels across all subjects (a total of 24 pairs for 6 subjects).
Coh =
This is a complex number, the real part of which indicates phase synchronization in the alpha frequency
band. We thus took the average of the real part of coherence across all pairs of frontal channels pairs for
the frontal forehead channels (AF7 and AF8 in standard EEG nomenclature) between each subtset of 2
subjects (a total of 4 values).
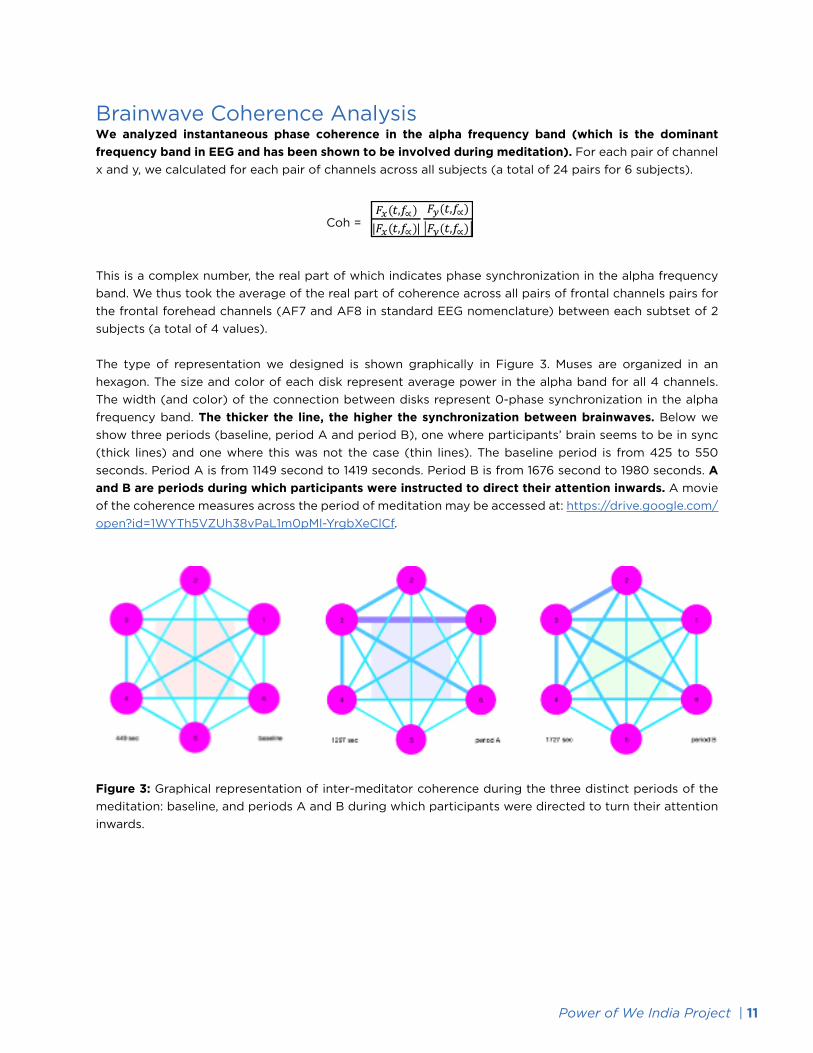
The type of representation we designed is shown graphically in Figure 3. Muses are organized in an
hexagon. The size and color of each disk represent average power in the alpha band for all 4 channels.
The width (and color) of the connection between disks represent 0-phase synchronization in the alpha
frequency band. The thicker the line, the higher the synchronization between brainwaves. Below we
show three periods (baseline, period A and period B), one where participants’ brain seems to be in sync
(thick lines) and one where this was not the case (thin lines). The baseline period is from 425 to 550
seconds. Period A is from 1149 second to 1419 seconds. Period B is from 1676 second to 1980 seconds. A
and B are periods during which participants were instructed to direct their attention inwards. A movie
of the coherence measures across the period of meditation may be accessed at: https://drive.google.com/
open?id=1WYTh5VZUh38vPaL1m0pMl-YrgbXeClCf.
Figure 3: Graphical representation of inter-meditator coherence during the three distinct periods of the
meditation: baseline, and periods A and B during which participants were directed to turn their attention
inwards.

12 | The Consciousness and Healing Initiative - CHI
Global EEG Coherence Across the Meditation Session
Global coherence through time is shown in Figure 4. Global coherence is simply calculated by averaging all
coherence pairs at each time point. The coherence values are smoothed using a 60-point moving average
(1 minute). We can see that each period A and B (of focus inward) showed marked increases in group
coherence, whereas coherence generally decreased during other periods of the meditation.
Figure 4: Group coherence measure across the period of meditation. Group coherence during periods
A and B, during which meditators were instructed to turn their attention inwards produced increases in
group coherence.
Summary of EEG Coherence Results
Analyses of these data show that pairwise and group coherence measures can be obtained from EEG
data gathered in the field using portable Muse headsets. These results are provocative, in that group
coherence increased markedly during periods of inward focus on the part of the meditators. While
further studies are needed to assess the reproducibility of these results, and the effects of experienced
vs. novice meditators, meditation style and specific guided intention, etc., these data show a remarkable
correlation between group coherence and the specific phases of meditation practiced here.

Power of We India Project | 13
APPENDIX B:
Group Meditation and Changes in Electromagnetic Field Characteristics of the Local Environment
Data collection: Rev. Tiffany Barsotti
Data analysis and technical report: Rev. Tiffany Barsotti and Dmitry Orlov, General Manager BioWell EU
Protocol and Set Up
We sought to assess whether the Bio-Well accessory the Sputnik could detect a state change in the
environment during the Guided Meditation. The methods used here provide a means for assessing changes
in the electromagnetic field (EMF) characteristics of the meditation environment, providing a frontier measure
of possible interactions of the EMF interaction between participants and the effects of this interaction on the
state of the local environment.
The Bio-Well is a device made specially for express-assessment of the energetic state of a person, water
or environment. A modern day Kirilian Photography device from Russia. Bio-Well Sputnik Sensor is an
attachment for the Bio-Well device designated for the measurements of the electrical capacity of
the space around the Sputnik antenna. It can be used for evaluation of the EMF characteristics of the
environment, and for studying effects that people may have on the environment. The Sputnik Sensor is
connected to the Calibration Unit inserted into the Bio-Well lens, creating connected resonance contours
(Figure 1). Bias current in the electrical chain of this contour depends on the capacitance of space between
Sputnik antenna and environmental-grounded and electroconductive subjects. Both geophysical parameters
of the particular environment and man-made electromagnetic fields and constructions would influence this
capacitance.
Figure 1: Bio-Well (white box on left) with Sputnik atmospheric sensor (antenna device on right). Bio-Well
Sputnik sensor is an attachment for the Bio-Well device designated for the measurements of the electrical
capacity of the space around Sputnik. It can be used for evaluation of the auspiciousness of the environment
and for relative studies of various effects of people can have on the environment, and vice versa.

14 | The Consciousness and Healing Initiative - CHI
Analysis of Bio-Well Sputnik Data
The output of Deviation S (Figure 2) is a Bio-Well software parameter calculated as standard deviation
of the Area parameter. The Area parameter calculates the number of pixels of Gas Discharge glow – the
biophotonic light emitted by the gas (air) due to the excitation of the environment’s molecules by the
electrons and photons.
Figure 2: Activity Level of Environment (ALE) data. Data show substantially lower Deviation S readings during the guided meditation, as compared to baseline (period 2) and after meditation (period 8).
Timestamps on Figure 1 Explained
Section: 1 -- 5 minutes timestamp from the start to allow ample recording time using the Sputnik
Section: 2 -- Beginning of the baseline period.
Section: 3 – 5 minutes post baseline
Section: 4 -- Beginning of Period A during which meditators were instructed to direct their attention inwards.
Section: 5 – 5 minutes post Period A
Section: 6 -- Beginning of Period B during which meditators were instructed to direct their attention inwards.
Section: 7 – 5 minutes post Period B
Section: 8 – post-meditation baseline
Connection of Activity Level of Environment (ALE) with the state of a person
All the fields present in the surrounding space (room) are changing with some activity therefore we can
mathematically calculate the overall activity of the space. Activity Level of Environment (ALE) – is a
measure of the overall activity of all the physic-chemical and structural characteristics of space in time.
Thus, the more stable the EMF characteristics of the space, the lower will be the ALE.

Power of We India Project | 15
Summary of Bio-Well Sputnik Results
ALE values of Deviation S were reduced throughout the period of formal meditation (Sections 3-7
in Figure 1). Reduced ALE values were found for the particular periods during which meditators were
instructed to direct their attention inwards (Sections 4 and 6), however, these did not differ substantially
from ALE values across the period of formal meditation. These results suggest that group meditation
may result in a conditioning effect on the electromagnetic field state of the local environment, and
that these changes may not be correlated with the particular meditative method or intention. Further
studies are needed to assess the reproducibility of these results and particular changes due to number of
people in group meditation, experienced meditators vs. advanced participants in this study, etc.