Embed Size (px)
Citation preview
Post-16 Institutions Omnibus Wave 3 findings
January 2017
IFF Research
Contents List of Figures 3
List of Tables 5
Executive summary 6
1. Introduction and aims 6
2. Key findings 8
1. Introduction 12
1.1 Methodology 12
2. AS and A level reform 16
2.1 AS levels 18
3. Technical education and vocational qualifications 20
3.1 The provision of technical education and vocational qualifications 20
3.1.1 Sufficiency of teaching staff 22
3.2 Employer involvement in technical education and vocational qualifications 22
4. Core maths 26
5. Careers education 28
5.1 Careers education 28
5.2 Careers-related mentoring 31
6. Work experience 33
6.1 Challenges in offering work placements 34
6.2 Recording information about work placements 37
7. National Citizen Service 38
8. Post-16 student population 39
8.1 Most academically able students 39
8.2 SEN Support 42
8.3 Young people with mental health issues 44
Annex A: Response rate 47
Annex B: Weighting 48
2
List of Figures Figure 1: key findings infographic for A levels, AS levels and Core Maths ........................ 6
Figure 2: key findings infographic for technical education, mentoring and work experience ........................................................................................................................................... 7
Figure 3: Confidence in teaching the second wave of new AS and A levels .................... 17
Figure 4: Proportion of AS level exams that institutions expect students to sit ................ 18
Figure 5: Proportion of AS exams expected to be in revised subjects ............................. 19
Figure 6: Ways in which institutions planned to increase their technical education/vocational qualification provision ..................................................................... 21
Figure 7: Agreement that institutions have a sufficient number of teaching staff to start delivering current or planned technical education/vocational courses ............................. 22
Figure 8: Employer involvement in the design and delivery of technical education or vocational courses ........................................................................................................... 23
Figure 9: Comparison of employer involvement in the design and delivery of technical education and vocational courses .................................................................................... 24
Figure 10: challenges preventing employer involvement in the design and delivery of technical education and vocational courses ..................................................................... 25
Figure 11: Institutions’ core maths offering ...................................................................... 26
Figure 12: Ways in which institutions provide careers education ..................................... 29
Figure 13: Providers of careers education ....................................................................... 30
Figure 14: Institutions’ careers-related mentoring offer to post-16 students .................... 31
Figure 15: Providers of careers-related mentoring ........................................................... 32
Figure 16: Proportion of post-16 students undertaking work experience ......................... 34
Figure 17: Main challenges in offering work placements ................................................. 35
Figure 18: Factors that would make it easier to offer work placements ........................... 36
Figure 19: Proportion of institutions offering access to the National Citizen Service ....... 38
Figure 20: Methods of identifying the most academically able students .......................... 40
3

Figure 21: Methods of stretching the most academically able students ........................... 41
Figure 22: Confidence in the institution’s ability to stretch the most academically able students ........................................................................................................................... 42
Figure 23: Institutions’ views on their ability to support and meet the needs of post-16 students requiring SEN .................................................................................................... 43
Figure 24: Extent of agreement or disagreement with the institution’s ability to support students with mental health issues .................................................................................. 45
4
List of Tables Table 1: Respondent job title ........................................................................................... 13
Table 2: Sample drawn and interviews achieved at wave 3............................................. 15
Table 3: Response rate achieved from eligible sample by institution ............................... 47
Table 4: Population (number of institutions) ..................................................................... 48
Table 5: Population (number of students) ........................................................................ 48
5
Executive summary
1. Introduction and aims In recent years there has been an increasing emphasis on addressing the UK’s skills gap.1 Existing qualifications such as A levels have been reformed and new technical and applied qualifications have been developed. This research aimed to gain a better understanding of post-16 institutions’ views about these changes and explore how they are preparing learners for adult life.
This report presents the findings of the third survey in the Post-16 Institutions Omnibus series which is delivered biannually. In the third wave, 503 post-16 institutions in England were interviewed.2 3 The survey was primarily conducted via telephone, though four respondents opted to take part online. The majority of interviews took place with Headteachers/Principals (17%), Assistant Heads/Principals (27%), or Heads of post-16 education (37%).
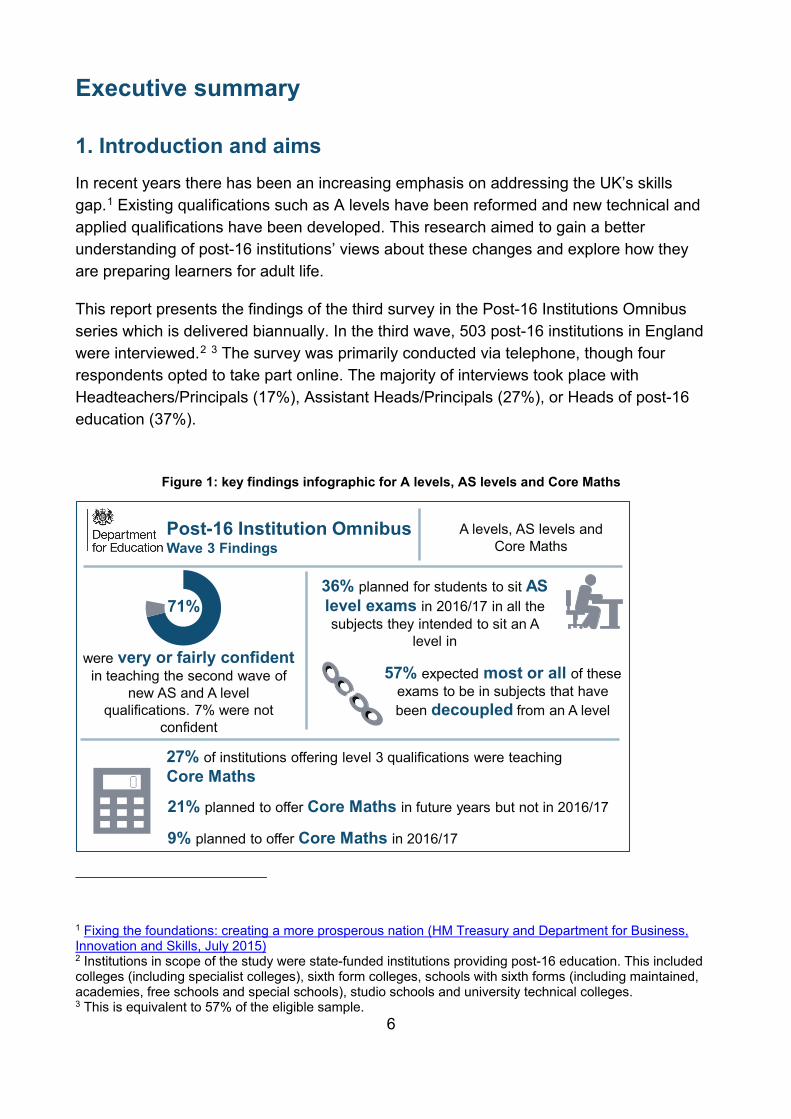
Figure 1: key findings infographic for A levels, AS levels and Core Maths
1 Fixing the foundations: creating a more prosperous nation (HM Treasury and Department for Business, Innovation and Skills, July 2015) 2 Institutions in scope of the study were state-funded institutions providing post-16 education. This included colleges (including specialist colleges), sixth form colleges, schools with sixth forms (including maintained, academies, free schools and special schools), studio schools and university technical colleges. 3 This is equivalent to 57% of the eligible sample.
Post-16 Institution Omnibus Wave 3 Findings
were very or fairly confident in teaching the second wave of
new AS and A level qualifications. 7% were not
confident
71%
A levels, AS levels and Core Maths
27% of institutions offering level 3 qualifications were teaching Core Maths
36% planned for students to sit AS level exams in 2016/17 in all the subjects they intended to sit an A
level in
57% expected most or all of these exams to be in subjects that have been decoupled from an A level
9% planned to offer Core Maths in 2016/17
21% planned to offer Core Maths in future years but not in 2016/17
6
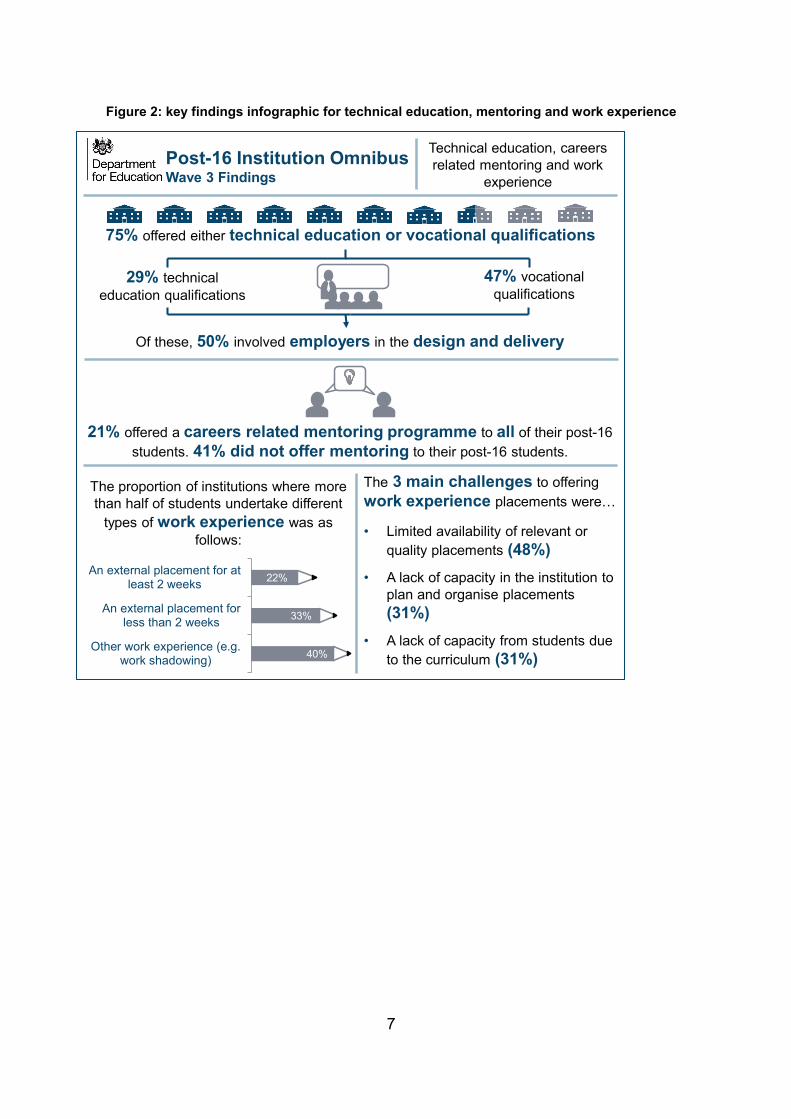
Figure 2: key findings infographic for technical education, mentoring and work experience
Post-16 Institution Omnibus Wave 3 Findings
29% technical education qualifications
47% vocational qualifications
75% offered either technical education or vocational qualifications
Of these, 50% involved employers in the design and delivery
22%
33%
40%
An external placement for atleast 2 weeks
An external placement forless than 2 weeks
Other work experience (e.g.work shadowing)
The proportion of institutions where more than half of students undertake different
types of work experience was as follows:
Technical education, careers related mentoring and work
experience
21% offered a careers related mentoring programme to all of their post-16 students. 41% did not offer mentoring to their post-16 students.
The 3 main challenges to offering work experience placements were…
Limited availability of relevant or quality placements (48%)A lack of capacity in the institution to plan and organise placements (31%) A lack of capacity from students due to the curriculum (31%)
7
2. Key findings AS and A level reform (Chapter 2)
AS and A level qualifications are being reformed in four phases to ensure they better prepare students for higher education or employment.4 The first wave of new AS and A level qualifications were introduced in September 2015, with the teaching of the second, third and fourth waves due to commence in September 2016, 2017 and 2018 respectively.5
The majority of institutions that offered A levels were confident about teaching the second wave from September 2016 (71%). Seven percent were not confident.
Now that AS levels are in the process of being decoupled, there was considerable variation in the planned AS level provision for 2016/2017 (Section 2.1):
• Over one-third of institutions that planned for students to sit AS exams reported that this would be in all the subjects that students intended to sit an A level in (36%)
• 28% planned for AS level exams to be taken in the majority (but not all) subjects • 32% planned for AS levels to be taken in a minority of subjects.
Technical education and vocational qualifications (Chapter 3)
Technical education qualifications and vocational qualifications are those which develop occupation or industry specific skills that enable entry to employment.
Three in ten institutions (29%) offered technical education qualifications at post-16, and these cover almost three-fifths of the post-16 student population (57%). Additionally, around half (47%) of institutions did not offer technical education qualifications but did offer vocational qualifications (Section 3.1).
Half of institutions that offered technical education or vocational courses involved employers in their design and delivery, rising to 69% among institutions that specifically offered technical education. It was common for employers to provide course-related work placements (93%) or the use of their facilities (74%) (Section 3.2).
The majority of institutions wished to increase employer involvement in the design and delivery of technical education/vocational courses (56% among those that were involving employers and 73% among institutions not currently involving employers).
4 The importance of teaching: the schools white paper 2010 5 Get the facts: AS and A level reform; Announcement that revised community languages will be taught from 2018
8
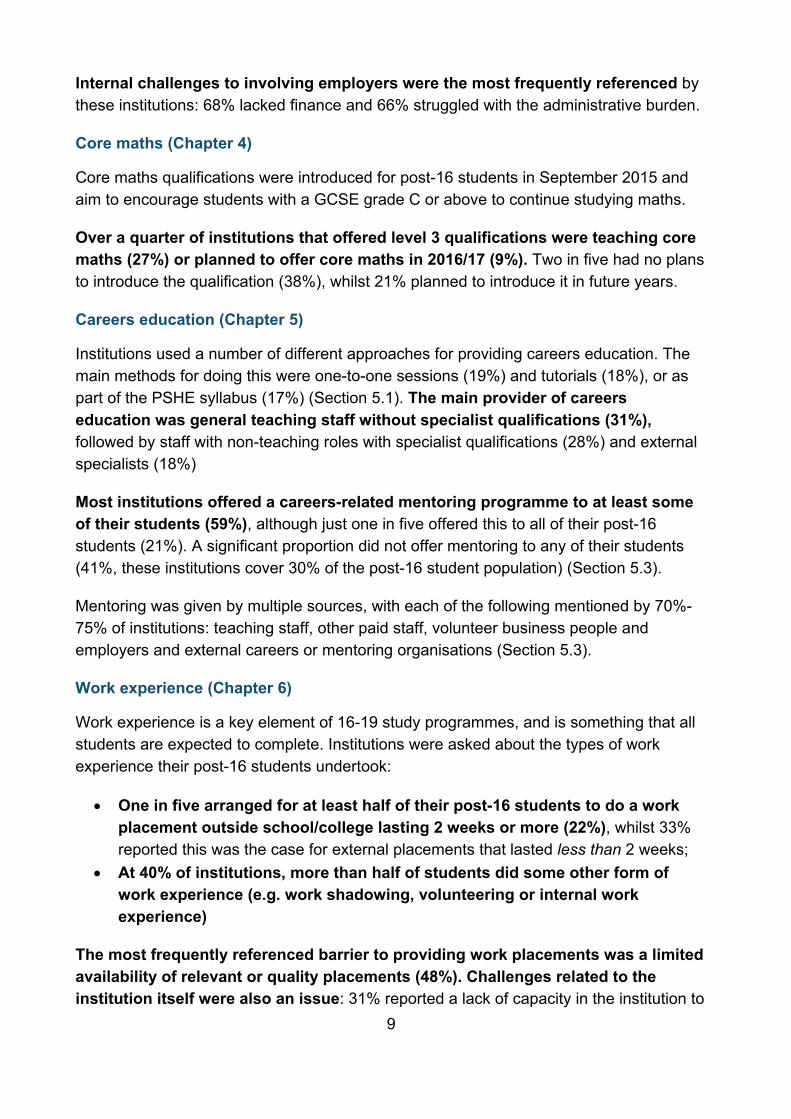
Internal challenges to involving employers were the most frequently referenced by these institutions: 68% lacked finance and 66% struggled with the administrative burden.
Core maths (Chapter 4)
Core maths qualifications were introduced for post-16 students in September 2015 and aim to encourage students with a GCSE grade C or above to continue studying maths.
Over a quarter of institutions that offered level 3 qualifications were teaching core maths (27%) or planned to offer core maths in 2016/17 (9%). Two in five had no plans to introduce the qualification (38%), whilst 21% planned to introduce it in future years.
Careers education (Chapter 5)
Institutions used a number of different approaches for providing careers education. The main methods for doing this were one-to-one sessions (19%) and tutorials (18%), or as part of the PSHE syllabus (17%) (Section 5.1). The main provider of careers education was general teaching staff without specialist qualifications (31%), followed by staff with non-teaching roles with specialist qualifications (28%) and external specialists (18%)
Most institutions offered a careers-related mentoring programme to at least some of their students (59%), although just one in five offered this to all of their post-16 students (21%). A significant proportion did not offer mentoring to any of their students (41%, these institutions cover 30% of the post-16 student population) (Section 5.3).
Mentoring was given by multiple sources, with each of the following mentioned by 70%-75% of institutions: teaching staff, other paid staff, volunteer business people and employers and external careers or mentoring organisations (Section 5.3).
Work experience (Chapter 6)
Work experience is a key element of 16-19 study programmes, and is something that all students are expected to complete. Institutions were asked about the types of work experience their post-16 students undertook:
• One in five arranged for at least half of their post-16 students to do a work placement outside school/college lasting 2 weeks or more (22%), whilst 33% reported this was the case for external placements that lasted less than 2 weeks;
• At 40% of institutions, more than half of students did some other form of work experience (e.g. work shadowing, volunteering or internal work experience)
The most frequently referenced barrier to providing work placements was a limited availability of relevant or quality placements (48%). Challenges related to the institution itself were also an issue: 31% reported a lack of capacity in the institution to
9
plan or organise work placements and the same proportion mentioned a lack of capacity from students due to the demands of the curriculum (Section 6.1).
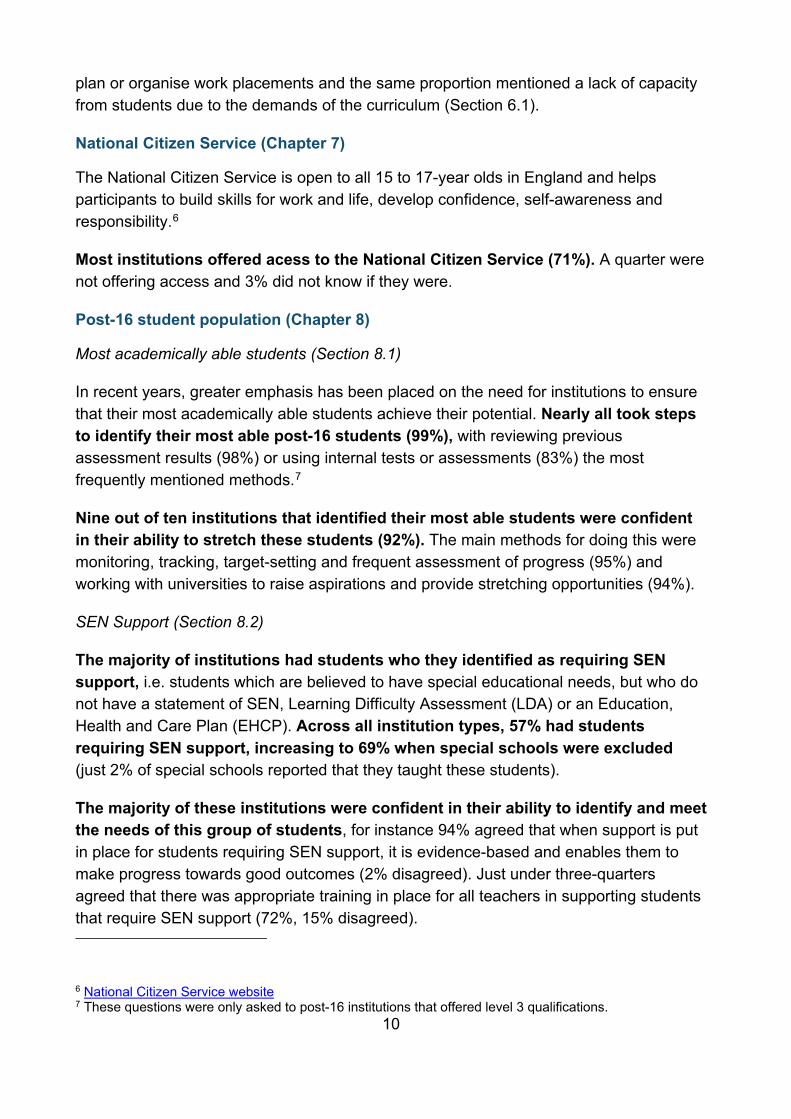
National Citizen Service (Chapter 7)
The National Citizen Service is open to all 15 to 17-year olds in England and helps participants to build skills for work and life, develop confidence, self-awareness and responsibility.6
Most institutions offered acess to the National Citizen Service (71%). A quarter were not offering access and 3% did not know if they were.
Post-16 student population (Chapter 8)
Most academically able students (Section 8.1)
In recent years, greater emphasis has been placed on the need for institutions to ensure that their most academically able students achieve their potential. Nearly all took steps to identify their most able post-16 students (99%), with reviewing previous assessment results (98%) or using internal tests or assessments (83%) the most frequently mentioned methods.7
Nine out of ten institutions that identified their most able students were confident in their ability to stretch these students (92%). The main methods for doing this were monitoring, tracking, target-setting and frequent assessment of progress (95%) and working with universities to raise aspirations and provide stretching opportunities (94%).
SEN Support (Section 8.2)
The majority of institutions had students who they identified as requiring SEN support, i.e. students which are believed to have special educational needs, but who do not have a statement of SEN, Learning Difficulty Assessment (LDA) or an Education, Health and Care Plan (EHCP). Across all institution types, 57% had students requiring SEN support, increasing to 69% when special schools were excluded (just 2% of special schools reported that they taught these students).
The majority of these institutions were confident in their ability to identify and meet the needs of this group of students, for instance 94% agreed that when support is put in place for students requiring SEN support, it is evidence-based and enables them to make progress towards good outcomes (2% disagreed). Just under three-quarters agreed that there was appropriate training in place for all teachers in supporting students that require SEN support (72%, 15% disagreed).
6 National Citizen Service website 7 These questions were only asked to post-16 institutions that offered level 3 qualifications.
10
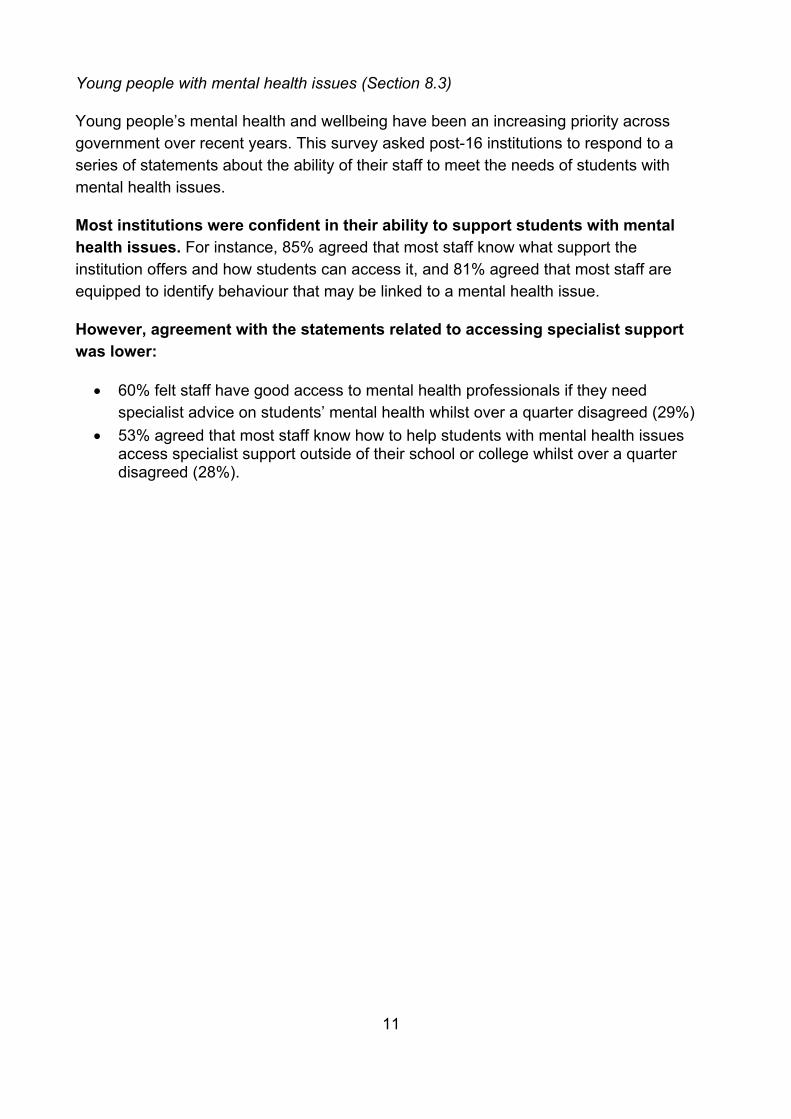
Young people with mental health issues (Section 8.3)
Young people’s mental health and wellbeing have been an increasing priority across government over recent years. This survey asked post-16 institutions to respond to a series of statements about the ability of their staff to meet the needs of students with mental health issues.
Most institutions were confident in their ability to support students with mental health issues. For instance, 85% agreed that most staff know what support the institution offers and how students can access it, and 81% agreed that most staff are equipped to identify behaviour that may be linked to a mental health issue.
However, agreement with the statements related to accessing specialist support was lower:
• 60% felt staff have good access to mental health professionals if they need specialist advice on students’ mental health whilst over a quarter disagreed (29%)
• 53% agreed that most staff know how to help students with mental health issues access specialist support outside of their school or college whilst over a quarter disagreed (28%).
11
1. Introduction In recent years there has been an increasing emphasis on addressing the UK’s skills gap. 8 This is demonstrated in the ambitious changes to the post-16 landscape to ensure that students are challenged with rigorous qualifications that are responsive to employers’ needs, with Professor Alison Wolf’s pioneering review of vocational education in 2011 laying the foundations for many of these changes.9 Existing qualifications such as A levels have been reformed and new qualifications, e.g. technical and applied qualifications have been developed.
The purpose of this research was to gain a better understanding of post-16 institutions’ views about these changes and explore what they are doing to ensure learners are prepared for adult life. This was the third survey in the Post-16 Institutions Omnibus series which is delivered biannually, allowing the Department to track changes over time.10 The third wave was conducted between May and June 2016, 6 months after the second wave (November and December 2015) and 11 months after the first wave (June and July 2015).
Since the survey was conducted, the Government published the Post-16 Skills Plan alongside the Report of the Independent Panel on Technical Education chaired by Lord Sainsbury. The Post-16 Skills Plan sets out further reforms to technical education to make sure it is as well-regarded as academic routes at post-16 and prepares individuals for skilled employment. It is hoped these reforms will foster economic growth and increase productivity.11
1.1 Methodology This report presents the findings of 503 interviews conducted with post-16 institutions12 in England.13 The survey was primarily conducted via telephone, though there was an opportunity for respondents to take part via an online survey if they preferred. Four interviews were completed online. The majority of interviews took place with
8 Fixing the foundations: creating a more prosperous nation (HM Treasury and Department for Business, Innovation and Skills, July 2015) 9 Review of Vocational Education - The Wolf Report 10 Post-16 institutions wave 1 findings and results 11 Post-16 Skills Plan 12 Institutions in scope of the study were state-funded institutions providing post-16 education. This included colleges (including specialist colleges), sixth form colleges, schools with sixth forms (including maintained, academies, free schools and special schools), studio schools and university technical colleges. The study excluded commercial and charitable providers, higher education providers, independent specialist providers and non-maintained special schools. 13 This is equivalent to 57% of the eligible sample.
12
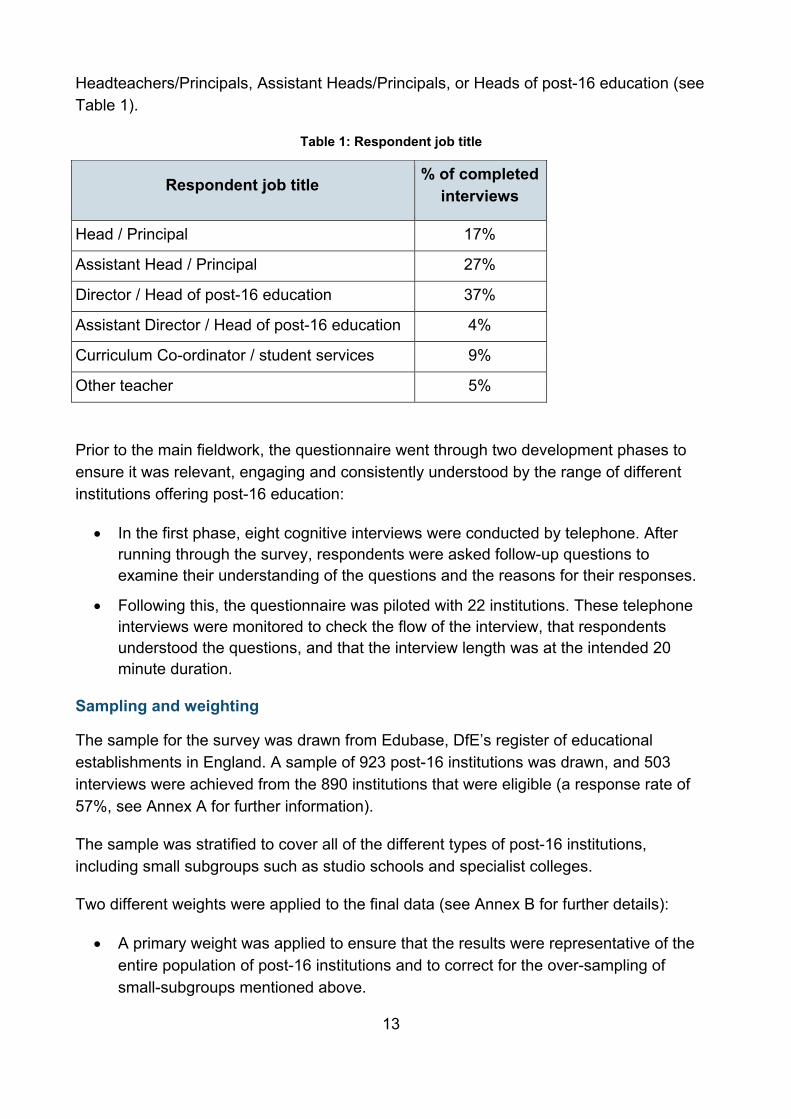
Headteachers/Principals, Assistant Heads/Principals, or Heads of post-16 education (see Table 1).
Table 1: Respondent job title
Respondent job title % of completed interviews
Head / Principal 17%
Assistant Head / Principal 27%
Director / Head of post-16 education 37%
Assistant Director / Head of post-16 education 4%
Curriculum Co-ordinator / student services 9%
Other teacher 5%
Prior to the main fieldwork, the questionnaire went through two development phases to ensure it was relevant, engaging and consistently understood by the range of different institutions offering post-16 education:
• In the first phase, eight cognitive interviews were conducted by telephone. After running through the survey, respondents were asked follow-up questions to examine their understanding of the questions and the reasons for their responses.
• Following this, the questionnaire was piloted with 22 institutions. These telephone interviews were monitored to check the flow of the interview, that respondents understood the questions, and that the interview length was at the intended 20 minute duration.
Sampling and weighting
The sample for the survey was drawn from Edubase, DfE’s register of educational establishments in England. A sample of 923 post-16 institutions was drawn, and 503 interviews were achieved from the 890 institutions that were eligible (a response rate of 57%, see Annex A for further information).
The sample was stratified to cover all of the different types of post-16 institutions, including small subgroups such as studio schools and specialist colleges.
Two different weights were applied to the final data (see Annex B for further details):
• A primary weight was applied to ensure that the results were representative of the entire population of post-16 institutions and to correct for the over-sampling of small-subgroups mentioned above.
13
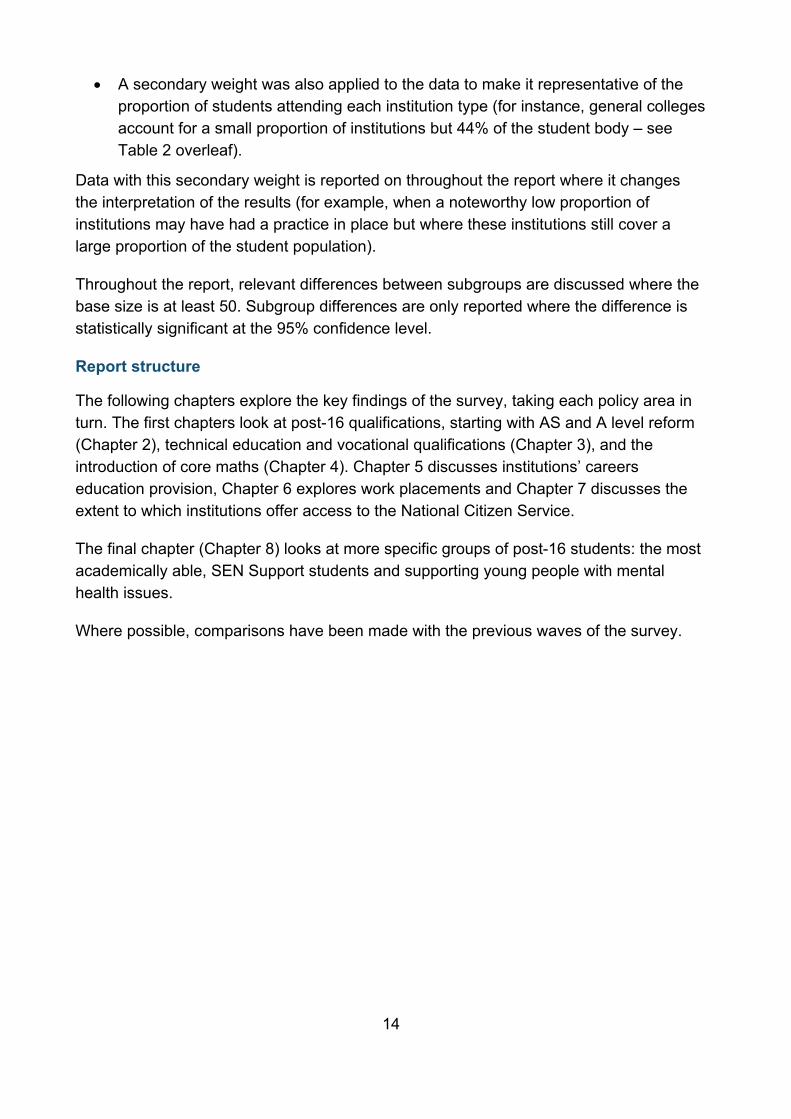
• A secondary weight was also applied to the data to make it representative of the proportion of students attending each institution type (for instance, general colleges account for a small proportion of institutions but 44% of the student body – see Table 2 overleaf).
Data with this secondary weight is reported on throughout the report where it changes the interpretation of the results (for example, when a noteworthy low proportion of institutions may have had a practice in place but where these institutions still cover a large proportion of the student population).
Throughout the report, relevant differences between subgroups are discussed where the base size is at least 50. Subgroup differences are only reported where the difference is statistically significant at the 95% confidence level.
Report structure
The following chapters explore the key findings of the survey, taking each policy area in turn. The first chapters look at post-16 qualifications, starting with AS and A level reform (Chapter 2), technical education and vocational qualifications (Chapter 3), and the introduction of core maths (Chapter 4). Chapter 5 discusses institutions’ careers education provision, Chapter 6 explores work placements and Chapter 7 discusses the extent to which institutions offer access to the National Citizen Service.
The final chapter (Chapter 8) looks at more specific groups of post-16 students: the most academically able, SEN Support students and supporting young people with mental health issues.
Where possible, comparisons have been made with the previous waves of the survey.
14
Table 2: Sample drawn and interviews achieved at wave 3
Institution type Population % of population
% of student body
Sample drawn
Interviews achieved
General Further Education (FE) colleges14 221 7% 45% 108 63
Specialist colleges 19 1% 2% 10 5
Sixth Form colleges 95 3% 13% 47 29
Schools with sixth forms 2,099 68% 38% 629 317
Special schools 573 19% 1% 95 66
Studio Schools 37 1% <0.5% 14 11
University Technical Colleges 39 1% <0.5% 20 12
Total 923 503
14 General FE colleges are distinct from sixth form colleges and tend to offer a wider range of courses such as vocational qualifications.
2. AS and A level reform This chapter assesses institutions’ confidence in teaching new AS and A level qualifications, the proportion of institutions that planned for students to sit AS level exams in the 2016/17 academic year and the proportion of these exams that will be in reformed subjects.
AS level and A level qualifications taught in schools in England are being reformed in four phases to ensure they better prepare students for higher education or employment.15 The first wave of new AS level and A level qualifications were introduced in September 2015, with the teaching of the second, third and fourth waves due to commence in September 2016, September 2017 and September 2018 respectively.16 17
AS qualifications have now been decoupled, meaning that they no longer count towards an A level qualification. Both AS levels and A level qualifications will be linear with all external assessment taking place at the end of the course, and most subjects will be assessed by examination rather than coursework.
A levels were taught by three-quarters (76%) of institutions, and these institutions cover 79% of the post-16 student population. This figure is consistent with the results of waves 1 and 2: where 77% and 76% respectively taught A levels.
The proportion of institutions that offered A levels varied by institution type. Nearly all schools with sixth forms taught A levels (97%), compared to three-fifths of general colleges (62%) and a minority of special schools (5%).
Figure 3 shows that the majority of institutions that taught A levels felt confident about teaching the second wave from September 2016 (71%). Over half (54%) were fairly confident and 17% were very confident. Seven percent of institutions were not confident about teaching the second wave of new AS and A level qualifications and 17% reported being neither confident nor unconfident. These figures are consistent with the findings of wave 2 of the Post-16 Institutions Omnibus where 75%18 of institutions that taught A levels were confident and 6% were not confident about teaching the second wave of new AS and A levels.
15 The importance of teaching: the schools white paper 2010 16 A timetable of the subjects which are being reformed at each of the three phases can be found in Get the facts: AS and A level reform. 17 Announcement that revised community languages will be taught from 2018 18 This figure is based on all institutions that offered A levels and excludes 18 institutions that reported the question about the second wave of new AS and A levels was not relevant (when including these 18 institutions, 72% of institutions were confident).
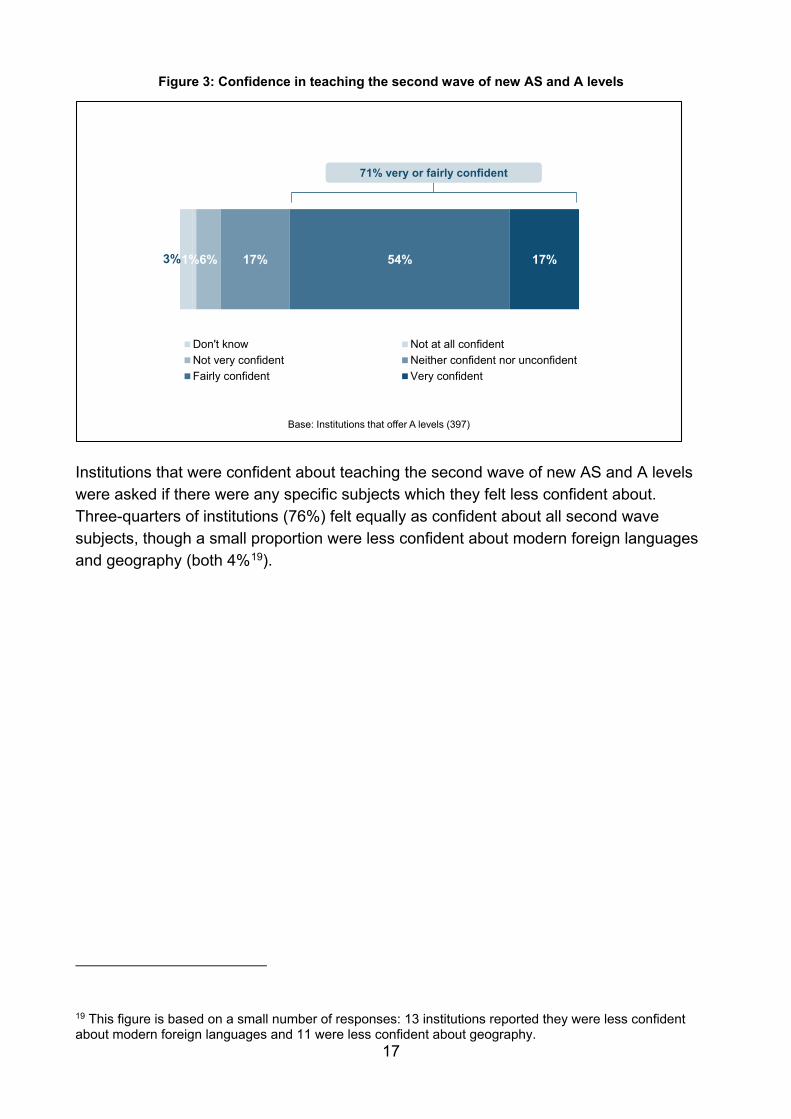
Figure 3: Confidence in teaching the second wave of new AS and A levels
Institutions that were confident about teaching the second wave of new AS and A levels were asked if there were any specific subjects which they felt less confident about. Three-quarters of institutions (76%) felt equally as confident about all second wave subjects, though a small proportion were less confident about modern foreign languages and geography (both 4%19).
19 This figure is based on a small number of responses: 13 institutions reported they were less confident about modern foreign languages and 11 were less confident about geography.
3%1%6% 17% 54% 17%
Don't know Not at all confidentNot very confident Neither confident nor unconfidentFairly confident Very confident
71% very or fairly confident
Base: Institutions that offer A levels (397)
17
2.1 AS levels Now that AS levels are being decoupled from the reformed A levels, institutions were asked about their intended AS level provision during the 2016/2017 academic year. The majority of institutions that offered A levels planned for students to sit AS exams in the subjects they intended to sit an A level in (69%). This figure rose to 80% among schools with sixth forms that were not academies which was significantly higher than those with academy status (64%).
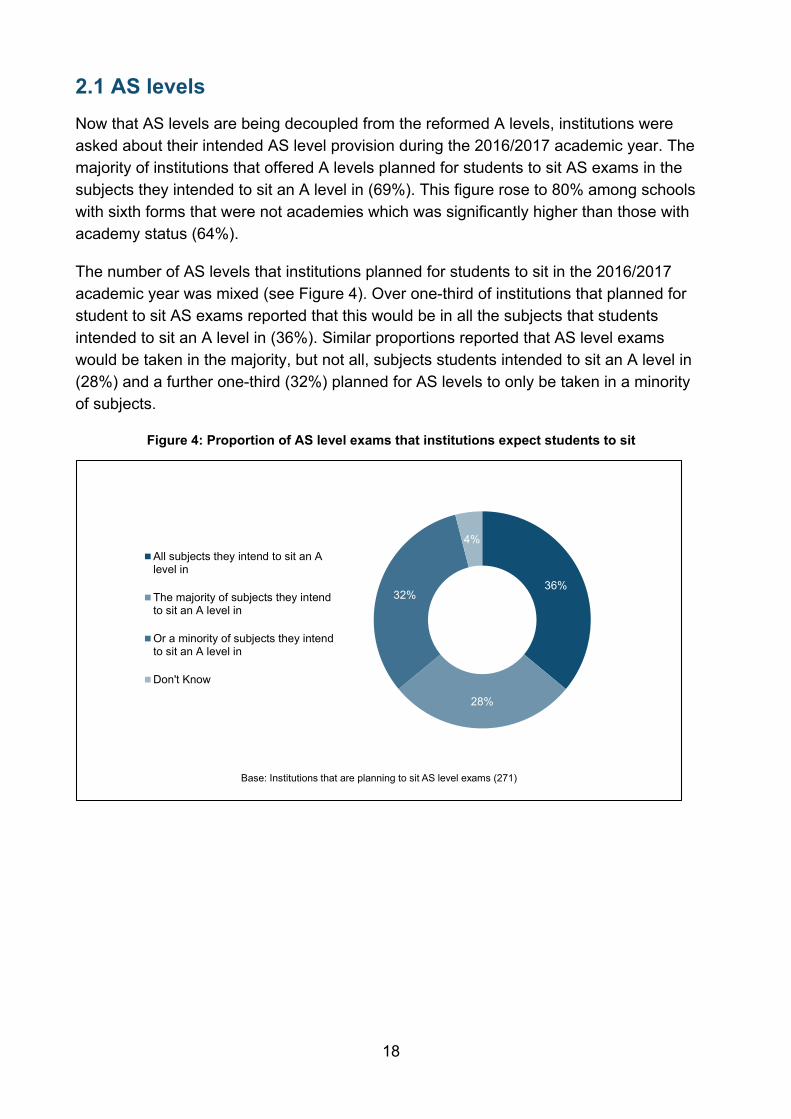
The number of AS levels that institutions planned for students to sit in the 2016/2017 academic year was mixed (see Figure 4). Over one-third of institutions that planned for student to sit AS exams reported that this would be in all the subjects that students intended to sit an A level in (36%). Similar proportions reported that AS level exams would be taken in the majority, but not all, subjects students intended to sit an A level in (28%) and a further one-third (32%) planned for AS levels to only be taken in a minority of subjects.
Figure 4: Proportion of AS level exams that institutions expect students to sit
36%
28%
32%
4%All subjects they intend to sit an Alevel in
The majority of subjects they intendto sit an A level in
Or a minority of subjects they intendto sit an A level in
Don't Know
Base: Institutions that are planning to sit AS level exams (271)
18
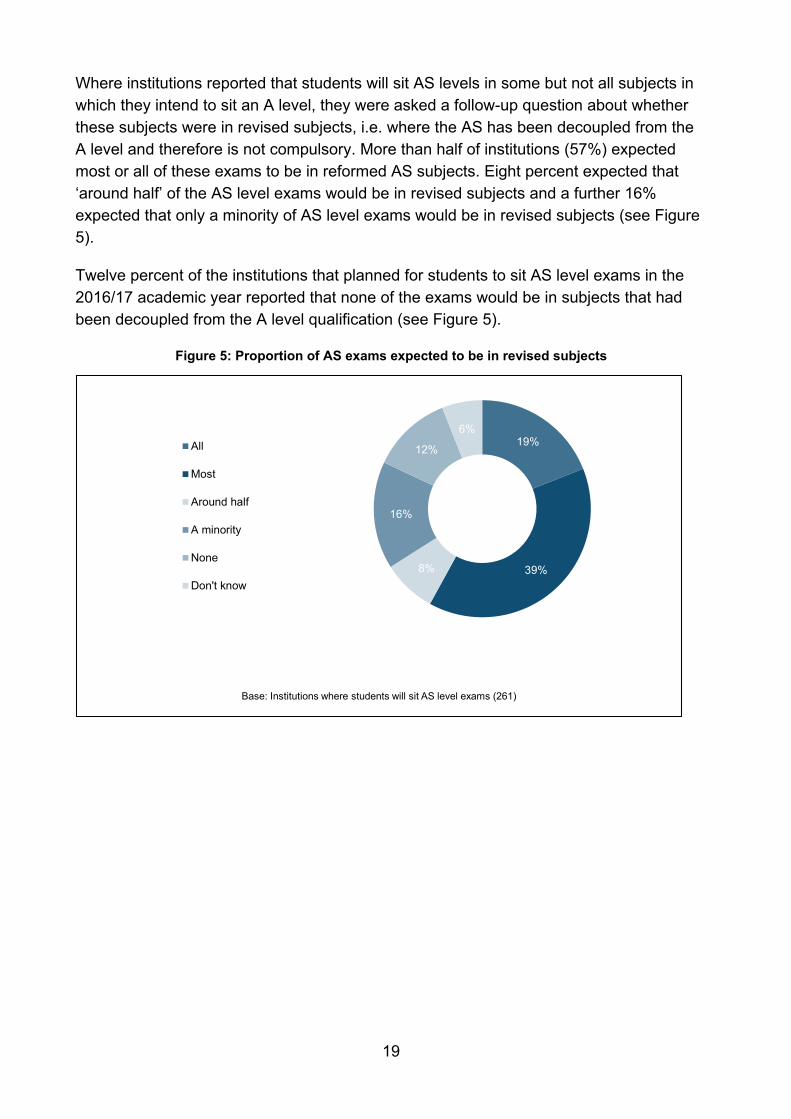
Where institutions reported that students will sit AS levels in some but not all subjects in which they intend to sit an A level, they were asked a follow-up question about whether these subjects were in revised subjects, i.e. where the AS has been decoupled from the A level and therefore is not compulsory. More than half of institutions (57%) expected most or all of these exams to be in reformed AS subjects. Eight percent expected that ‘around half’ of the AS level exams would be in revised subjects and a further 16% expected that only a minority of AS level exams would be in revised subjects (see Figure 5).
Twelve percent of the institutions that planned for students to sit AS level exams in the 2016/17 academic year reported that none of the exams would be in subjects that had been decoupled from the A level qualification (see Figure 5).
Figure 5: Proportion of AS exams expected to be in revised subjects
19%
39%8%
16%
12%
6%All
Most
Around half
A minority
None
Don't know
Base: Institutions where students will sit AS level exams (261)
19
3. Technical education and vocational qualifications This chapter explores institutions’ technical education20 or vocational qualification offer, and the ways in which employers are involved in their delivery.
Technical education qualifications and other vocational qualifications are those which develop specialist knowledge and skills that prepare learners for a particular job or vocational area. Technical qualifications were developed following the findings of the Wolf Report, which reported that 350,000 16-19 year olds were studying qualifications with ‘limited labour market value’.21
At the time of the survey, there were two types of technical qualifications for 16-19 year olds: tech levels (level 3) and technical certificates (level 2). A third category, applied general qualifications, recognises approved qualifications in applied subjects that are designed to enable entry to higher education. These were introduced after the consultation on the reform of level 3 vocational qualifications.22 Only those technical and applied qualifications that meet stretching requirements, and have been approved by DfE, will be recognised in 16-19 performance tables alongside academic qualifications.23 Other vocational qualifications may still be taught as long as they are approved for teaching to 16-19 year olds.
3.1 The provision of technical education and vocational qualifications Twenty-nine percent of institutions reported that they offer technical education qualifications as part of their post-16 curriculum, and these cover almost three-fifths of the post-16 student population (57%). Provision of technical education courses was significantly higher among general colleges (92%) compared to schools with sixth forms and special schools (22% and 18% respectively).
Around half (47%) of institutions reported that they do not offer technical qualifications but do offer vocational qualifications. This means that three-quarters (75%) of post-16 institutions offered either technical education qualifications or vocational qualifications.
Two-fifths (43%) of institutions that offered technical education or vocational qualifications had plans in place to increase their provision of these qualifications in the future. General colleges and special schools were significantly more likely to have plans
20 In the survey, technical education qualifications were defined as those which develop occupation or industry specific skills that enable entry to employment – for example a diploma in electrical engineering, accounting or clinical healthcare. Institutions were not asked specifically about whether they were offering tech levels, technical certificates or applied general qualifications. 21 Review of vocational education: the Wolf report 22 Government proposals to reform vocational qualifications for 16-to-19-year-olds 23 16 to 19 qualifications technical guide: 2017 and 2018 performance tables
20
to increase their provision (70% and 60% respectively) compared to schools with sixth forms (36%). Among institutions that did not offer technical education or vocational qualifications, only 12% planned to start offering them in the future.
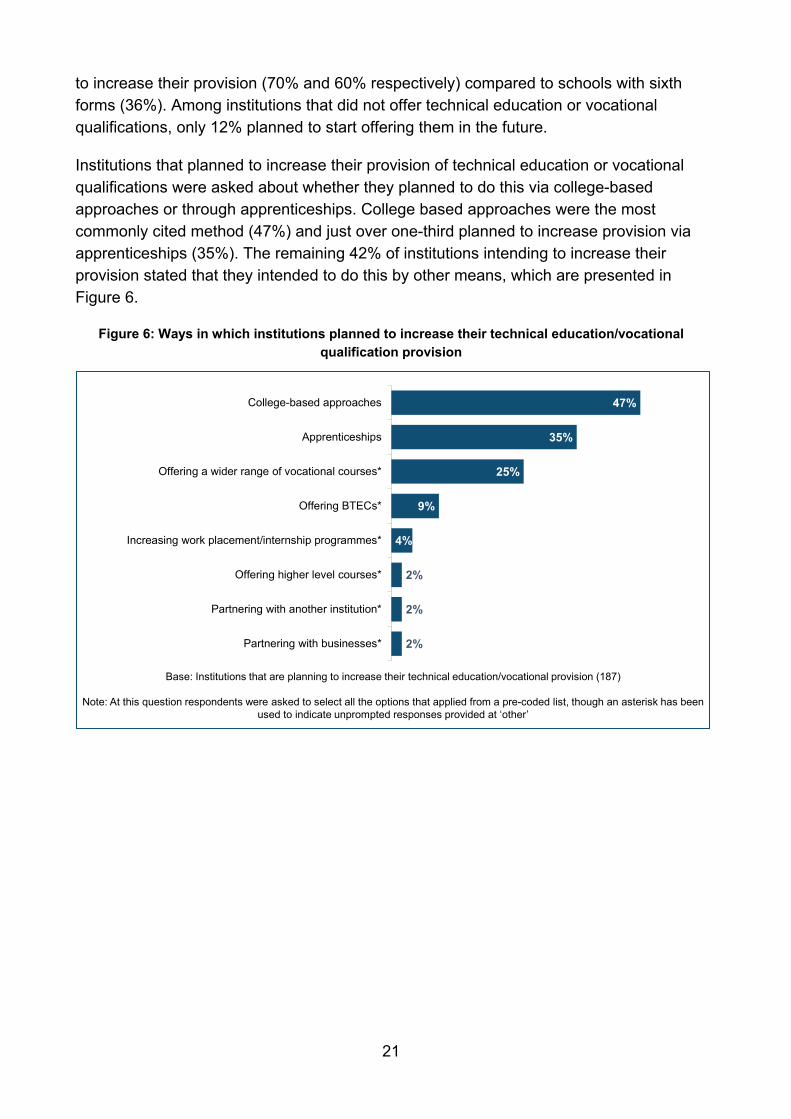
Institutions that planned to increase their provision of technical education or vocational qualifications were asked about whether they planned to do this via college-based approaches or through apprenticeships. College based approaches were the most commonly cited method (47%) and just over one-third planned to increase provision via apprenticeships (35%). The remaining 42% of institutions intending to increase their provision stated that they intended to do this by other means, which are presented in Figure 6.
Figure 6: Ways in which institutions planned to increase their technical education/vocational qualification provision
47%
35%
25%
9%
4%
2%
2%
2%
College-based approaches
Apprenticeships
Offering a wider range of vocational courses*
Offering BTECs*
Increasing work placement/internship programmes*
Offering higher level courses*
Partnering with another institution*
Partnering with businesses*
Base: Institutions that are planning to increase their technical education/vocational provision (187)
Note: At this question respondents were asked to select all the options that applied from a pre-coded list, though an asterisk has been used to indicate unprompted responses provided at ‘other’
21
3.1.1 Sufficiency of teaching staff
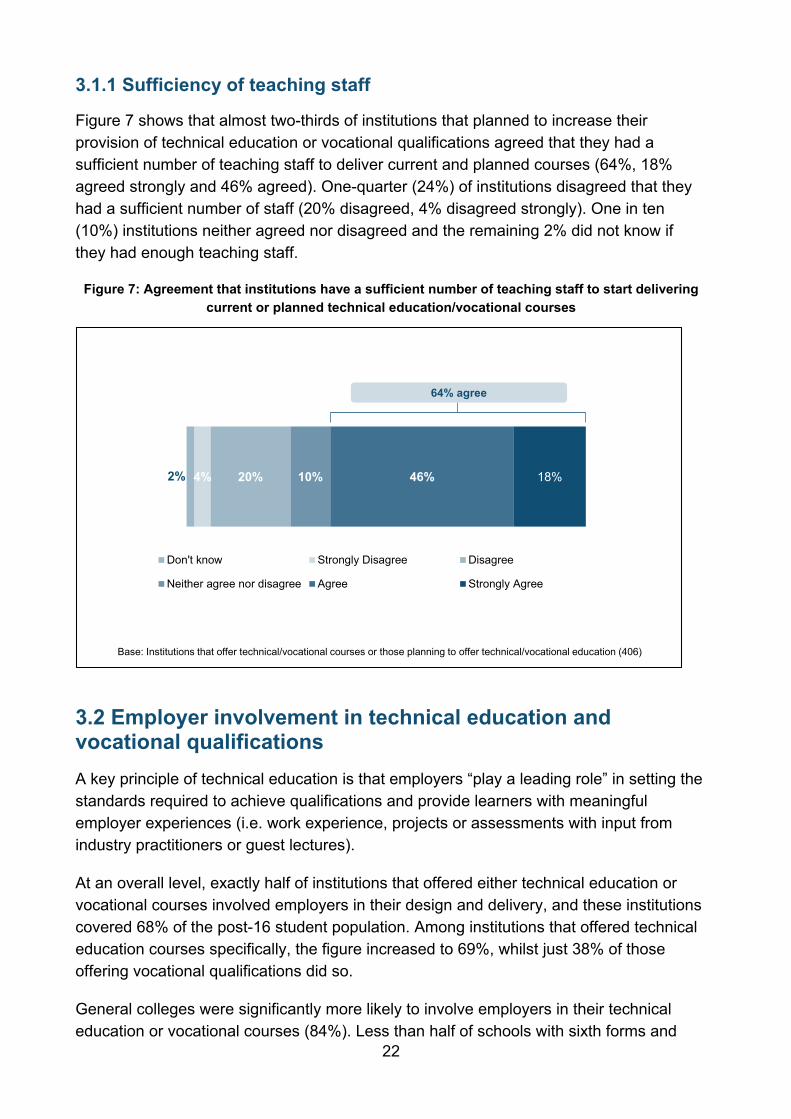
Figure 7 shows that almost two-thirds of institutions that planned to increase their provision of technical education or vocational qualifications agreed that they had a sufficient number of teaching staff to deliver current and planned courses (64%, 18% agreed strongly and 46% agreed). One-quarter (24%) of institutions disagreed that they had a sufficient number of staff (20% disagreed, 4% disagreed strongly). One in ten (10%) institutions neither agreed nor disagreed and the remaining 2% did not know if they had enough teaching staff.
Figure 7: Agreement that institutions have a sufficient number of teaching staff to start delivering current or planned technical education/vocational courses
3.2 Employer involvement in technical education and vocational qualifications A key principle of technical education is that employers “play a leading role” in setting the standards required to achieve qualifications and provide learners with meaningful employer experiences (i.e. work experience, projects or assessments with input from industry practitioners or guest lectures).
At an overall level, exactly half of institutions that offered either technical education or vocational courses involved employers in their design and delivery, and these institutions covered 68% of the post-16 student population. Among institutions that offered technical education courses specifically, the figure increased to 69%, whilst just 38% of those offering vocational qualifications did so.
General colleges were significantly more likely to involve employers in their technical education or vocational courses (84%). Less than half of schools with sixth forms and
2% 4% 20% 10% 46% 18%
Don't know Strongly Disagree Disagree
Neither agree nor disagree Agree Strongly Agree
Base: Institutions that offer technical/vocational courses or those planning to offer technical/vocational education (406)
64% agree
22
special schools involved employers in their technical education/vocational courses (46% and 31% respectively).
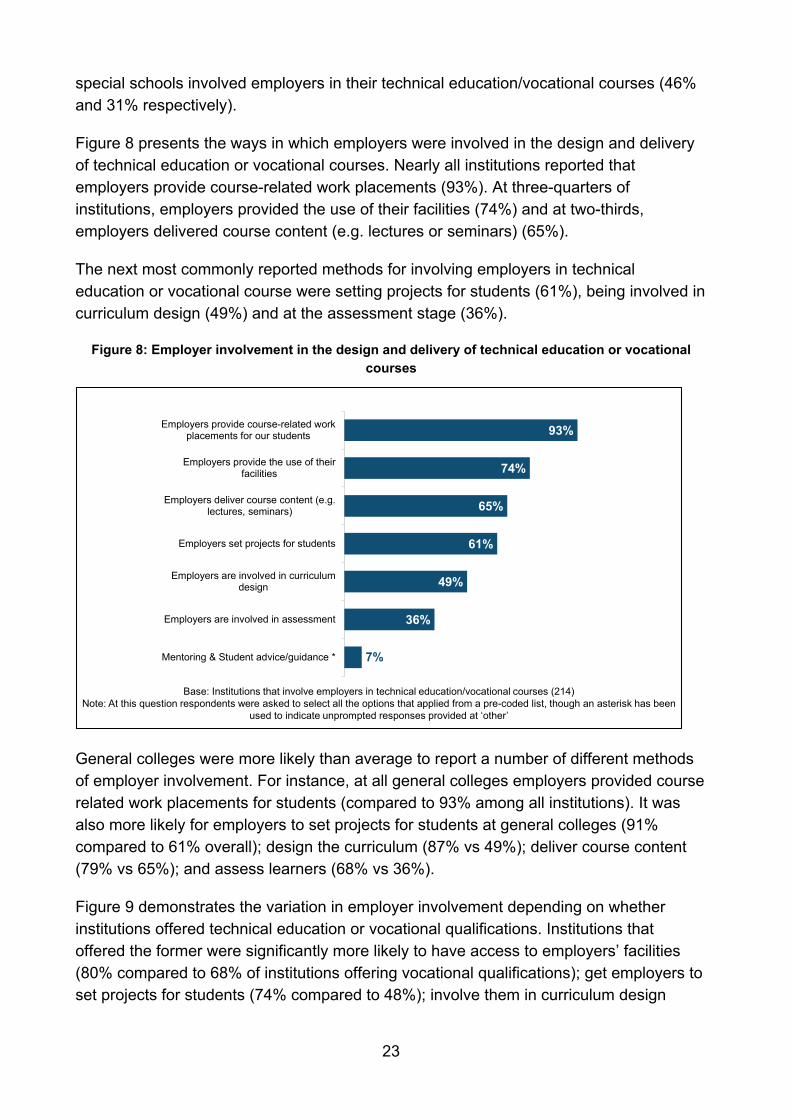
Figure 8 presents the ways in which employers were involved in the design and delivery of technical education or vocational courses. Nearly all institutions reported that employers provide course-related work placements (93%). At three-quarters of institutions, employers provided the use of their facilities (74%) and at two-thirds, employers delivered course content (e.g. lectures or seminars) (65%).
The next most commonly reported methods for involving employers in technical education or vocational course were setting projects for students (61%), being involved in curriculum design (49%) and at the assessment stage (36%).
Figure 8: Employer involvement in the design and delivery of technical education or vocational courses
General colleges were more likely than average to report a number of different methods of employer involvement. For instance, at all general colleges employers provided course related work placements for students (compared to 93% among all institutions). It was also more likely for employers to set projects for students at general colleges (91% compared to 61% overall); design the curriculum (87% vs 49%); deliver course content (79% vs 65%); and assess learners (68% vs 36%).
Figure 9 demonstrates the variation in employer involvement depending on whether institutions offered technical education or vocational qualifications. Institutions that offered the former were significantly more likely to have access to employers’ facilities (80% compared to 68% of institutions offering vocational qualifications); get employers to set projects for students (74% compared to 48%); involve them in curriculum design
7%
36%
49%
61%
65%
74%
93%
Mentoring & Student advice/guidance *
Employers are involved in assessment
Employers are involved in curriculumdesign
Employers set projects for students
Employers deliver course content (e.g.lectures, seminars)
Employers provide the use of theirfacilities
Employers provide course-related workplacements for our students
Base: Institutions that involve employers in technical education/vocational courses (214)Note: At this question respondents were asked to select all the options that applied from a pre-coded list, though an asterisk has been
used to indicate unprompted responses provided at ‘other’
23
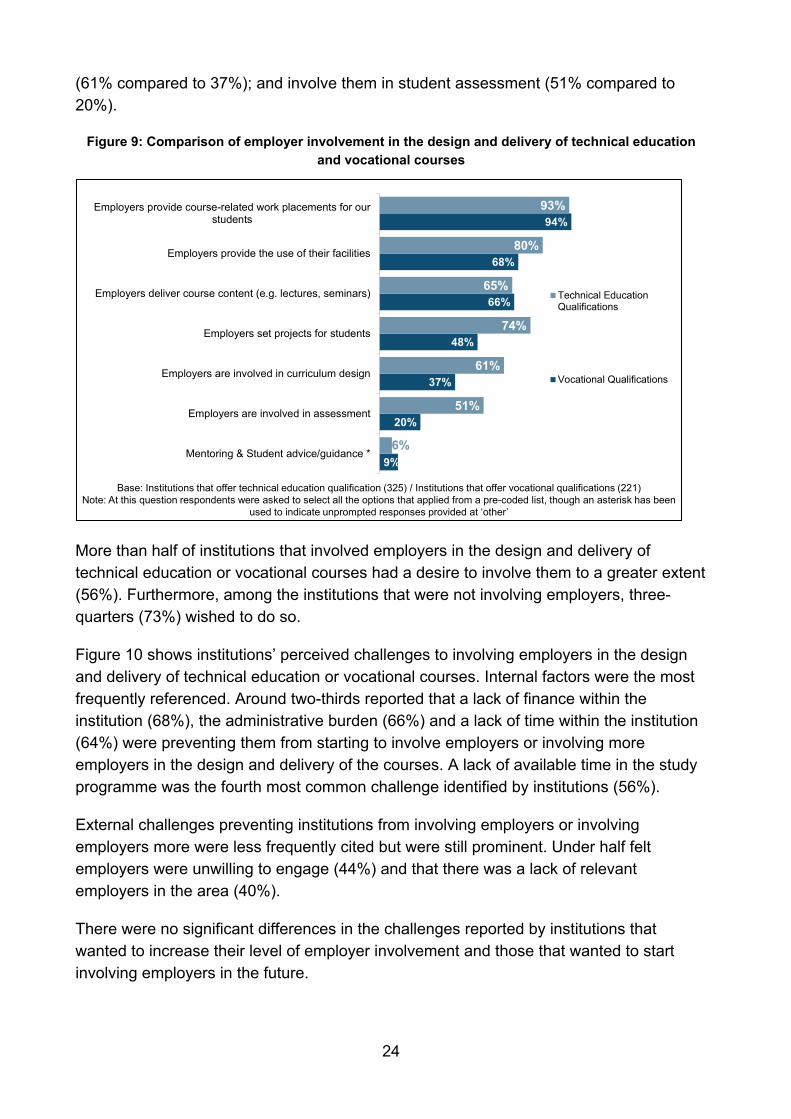
(61% compared to 37%); and involve them in student assessment (51% compared to 20%).
Figure 9: Comparison of employer involvement in the design and delivery of technical education and vocational courses
More than half of institutions that involved employers in the design and delivery of technical education or vocational courses had a desire to involve them to a greater extent (56%). Furthermore, among the institutions that were not involving employers, three-quarters (73%) wished to do so.
Figure 10 shows institutions’ perceived challenges to involving employers in the design and delivery of technical education or vocational courses. Internal factors were the most frequently referenced. Around two-thirds reported that a lack of finance within the institution (68%), the administrative burden (66%) and a lack of time within the institution (64%) were preventing them from starting to involve employers or involving more employers in the design and delivery of the courses. A lack of available time in the study programme was the fourth most common challenge identified by institutions (56%).
External challenges preventing institutions from involving employers or involving employers more were less frequently cited but were still prominent. Under half felt employers were unwilling to engage (44%) and that there was a lack of relevant employers in the area (40%).
There were no significant differences in the challenges reported by institutions that wanted to increase their level of employer involvement and those that wanted to start involving employers in the future.
9%
20%
37%
48%
66%
68%
94%
6%
51%
61%
74%
65%
80%
93%
Mentoring & Student advice/guidance *
Employers are involved in assessment
Employers are involved in curriculum design
Employers set projects for students
Employers deliver course content (e.g. lectures, seminars)
Employers provide the use of their facilities
Employers provide course-related work placements for ourstudents
Technical EducationQualifications
Vocational Qualifications
Base: Institutions that offer technical education qualification (325) / Institutions that offer vocational qualifications (221)Note: At this question respondents were asked to select all the options that applied from a pre-coded list, though an asterisk has been
used to indicate unprompted responses provided at ‘other’
24
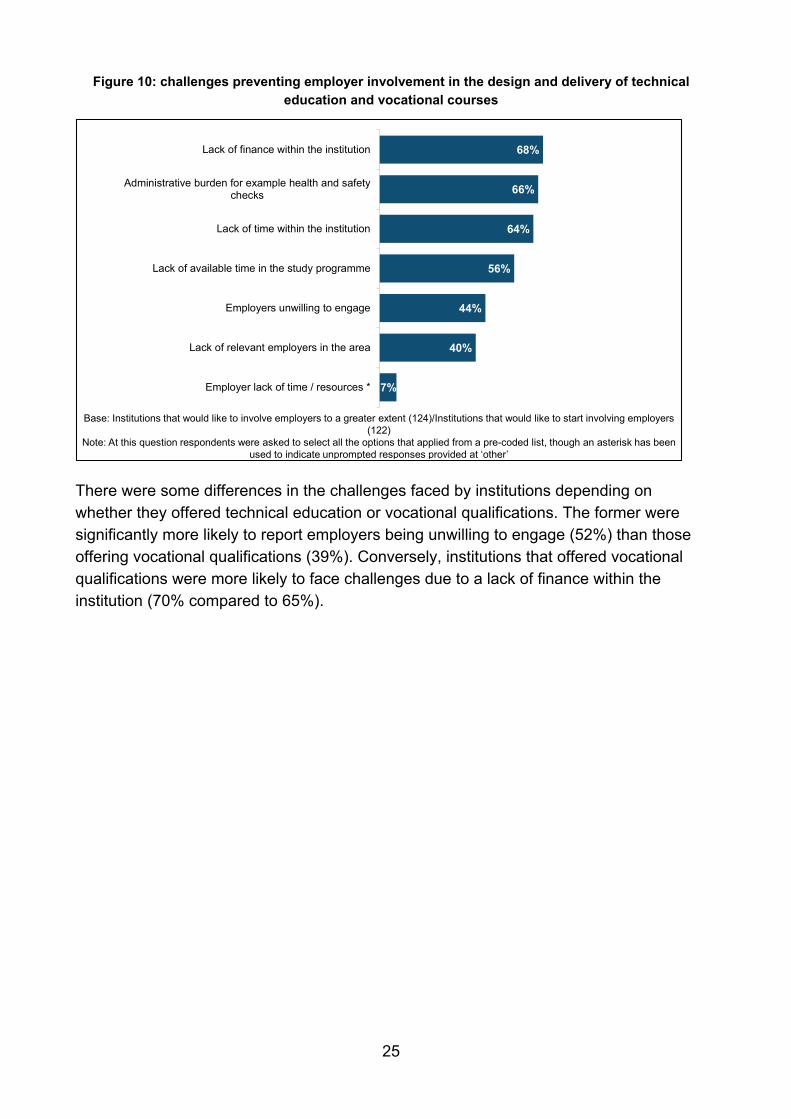
Figure 10: challenges preventing employer involvement in the design and delivery of technical education and vocational courses
There were some differences in the challenges faced by institutions depending on whether they offered technical education or vocational qualifications. The former were significantly more likely to report employers being unwilling to engage (52%) than those offering vocational qualifications (39%). Conversely, institutions that offered vocational qualifications were more likely to face challenges due to a lack of finance within the institution (70% compared to 65%).
68%
66%
64%
56%
44%
40%
7%
Lack of finance within the institution
Administrative burden for example health and safetychecks
Lack of time within the institution
Lack of available time in the study programme
Employers unwilling to engage
Lack of relevant employers in the area
Employer lack of time / resources *
Base: Institutions that would like to involve employers to a greater extent (124)/Institutions that would like to start involving employers (122)
Note: At this question respondents were asked to select all the options that applied from a pre-coded list, though an asterisk has been used to indicate unprompted responses provided at ‘other’
25
4. Core maths In September 2015, core maths qualifications were introduced for post-16 learners.24 These qualifications were designed to encourage students that achieve a C or above in GCSE maths to continue to study mathematics beyond the age of 16, even if they have chosen not to study A level maths or Level 3 International Baccalaureate mathematics.
Core maths qualifications focus on developing the mathematical understanding and skills of students beyond GCSE level and on enabling students to apply mathematical techniques to situations that they are likely to encounter in vocational and academic study, employment and life in general.25
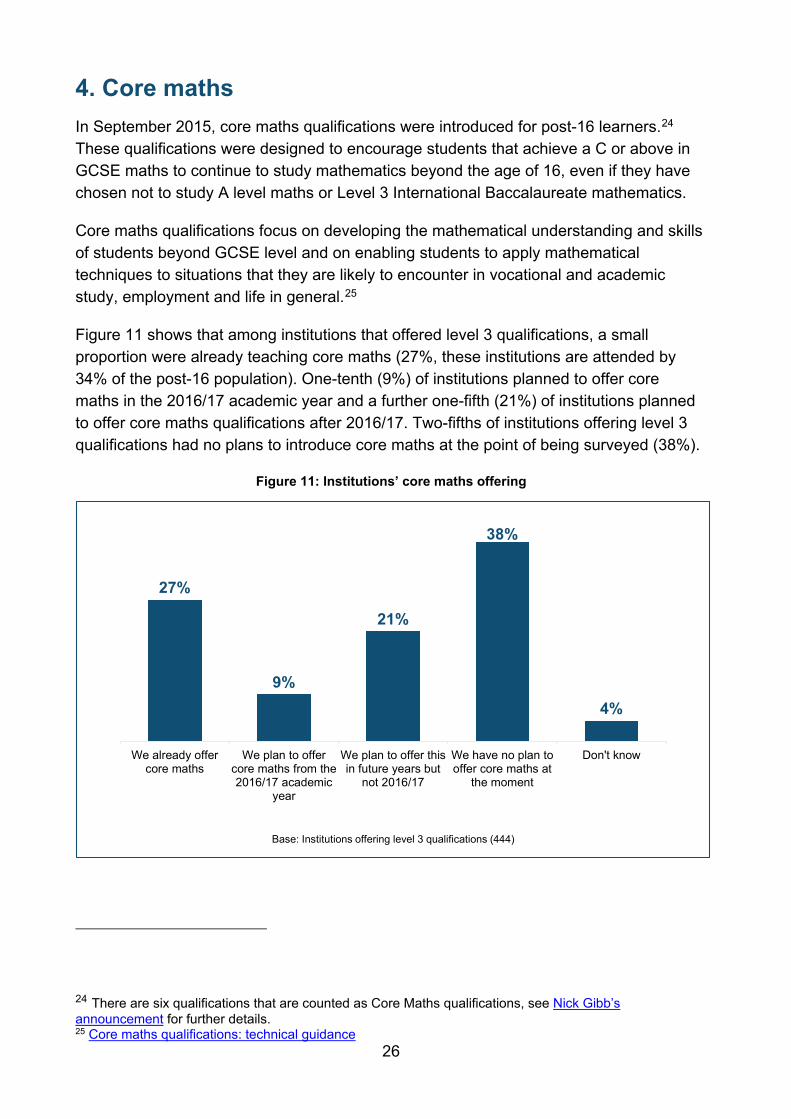
Figure 11 shows that among institutions that offered level 3 qualifications, a small proportion were already teaching core maths (27%, these institutions are attended by 34% of the post-16 population). One-tenth (9%) of institutions planned to offer core maths in the 2016/17 academic year and a further one-fifth (21%) of institutions planned to offer core maths qualifications after 2016/17. Two-fifths of institutions offering level 3 qualifications had no plans to introduce core maths at the point of being surveyed (38%).
Figure 11: Institutions’ core maths offering
24 There are six qualifications that are counted as Core Maths qualifications, see Nick Gibb’s announcement for further details. 25 Core maths qualifications: technical guidance
27%
9%
21%
38%
4%
We already offercore maths
We plan to offercore maths from the2016/17 academic
year
We plan to offer thisin future years but
not 2016/17
We have no plan tooffer core maths at
the moment
Don't know
Base: Institutions offering level 3 qualifications (444)
26

The uptake of core maths was significantly higher among general colleges than other institution types. They were significantly more likely than schools with sixth forms to already be offering core maths (43% compared 24%), or have plans to offer it in the 2016/17 academic year (24% compared to 8%). Equally, schools with sixth forms were more likely than general colleges to have no plans to offer core maths qualifications in place (41% compared to 11%).
27
5. Careers education This chapter focuses on post-16 institutions’ careers education offering and the types of work experience placements being undertaken by students.
Since September 2013, all FE colleges and sixth form colleges have been required to provide access to independent careers guidance for 16-18 year olds.
5.1 Careers education Institutions were using a number of different methods to provide careers education to their post-16 students. The most commonly reported were themed days and events (e.g. employer visits or careers fairs), and offering careers education via one-to-one sessions (both 93%, see Figure 12). Incorporating careers education into tutorials (87%) and the PSHE syllabus (70%) were also mentioned by the majority of institutions.
The next commonly mentioned method was integrating careers education across the curriculum or into other subject lessons (64%), with one-third also reporting that careers education is an element timetabled in its own right (34%).
There were a number of statistically significant differences in the activities undertaken by institution type. Nearly all general colleges and schools with sixth forms offered careers education via themed days and events (100% and 98% respectively, compared to 71% of special schools) and in one-to-one sessions (95% and 97%, compared to 77% of special schools). Conversely, special schools were more likely than other institutions to integrate careers education across the curriculum (86% compared to 54% of schools with sixth forms), and to report that it is an element timetabled in its own right (61% compared to 38% of general colleges and 26% of schools with sixth forms).
28
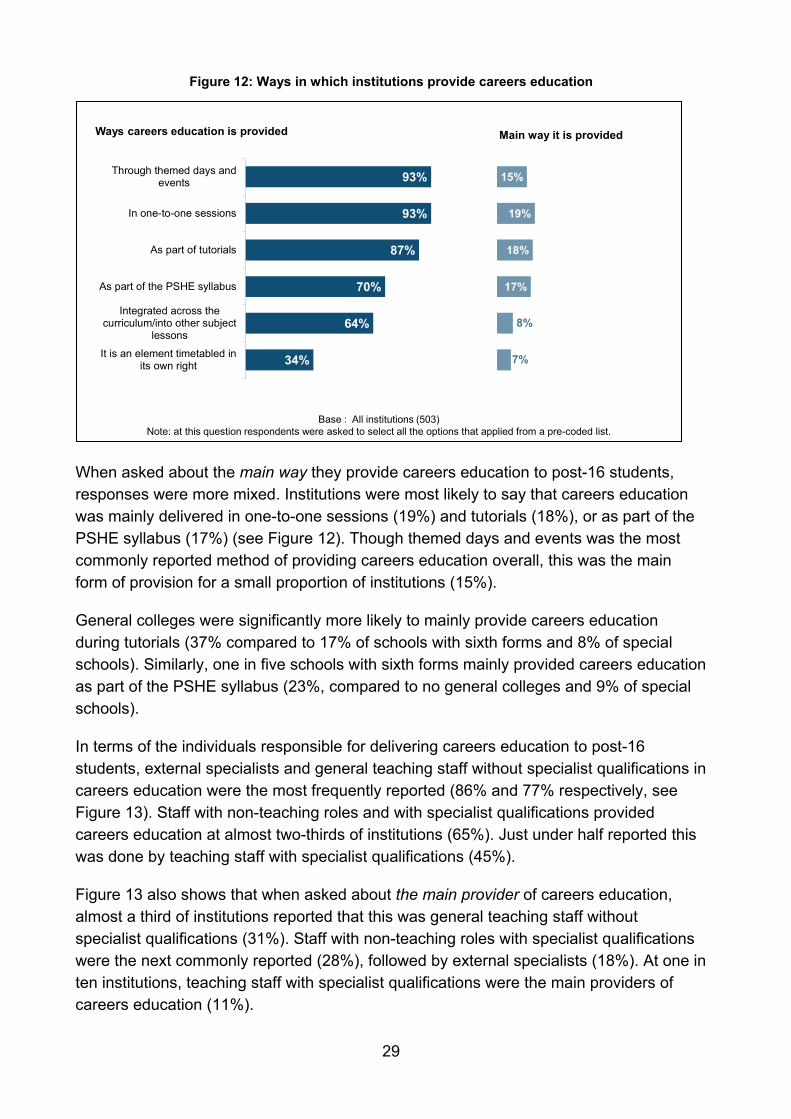
Figure 12: Ways in which institutions provide careers education
When asked about the main way they provide careers education to post-16 students, responses were more mixed. Institutions were most likely to say that careers education was mainly delivered in one-to-one sessions (19%) and tutorials (18%), or as part of the PSHE syllabus (17%) (see Figure 12). Though themed days and events was the most commonly reported method of providing careers education overall, this was the main form of provision for a small proportion of institutions (15%).
General colleges were significantly more likely to mainly provide careers education during tutorials (37% compared to 17% of schools with sixth forms and 8% of special schools). Similarly, one in five schools with sixth forms mainly provided careers education as part of the PSHE syllabus (23%, compared to no general colleges and 9% of special schools).
In terms of the individuals responsible for delivering careers education to post-16 students, external specialists and general teaching staff without specialist qualifications in careers education were the most frequently reported (86% and 77% respectively, see Figure 13). Staff with non-teaching roles and with specialist qualifications provided careers education at almost two-thirds of institutions (65%). Just under half reported this was done by teaching staff with specialist qualifications (45%).
Figure 13 also shows that when asked about the main provider of careers education, almost a third of institutions reported that this was general teaching staff without specialist qualifications (31%). Staff with non-teaching roles with specialist qualifications were the next commonly reported (28%), followed by external specialists (18%). At one in ten institutions, teaching staff with specialist qualifications were the main providers of careers education (11%).
93%
93%
87%
70%
64%
34%
Through themed days andevents
In one-to-one sessions
As part of tutorials
As part of the PSHE syllabus
Integrated across thecurriculum/into other subject
lessons
It is an element timetabled inits own right
Base : All institutions (503)Note: at this question respondents were asked to select all the options that applied from a pre-coded list.
Ways careers education is provided Main way it is provided
15%
19%
18%
17%
8%
7%
29
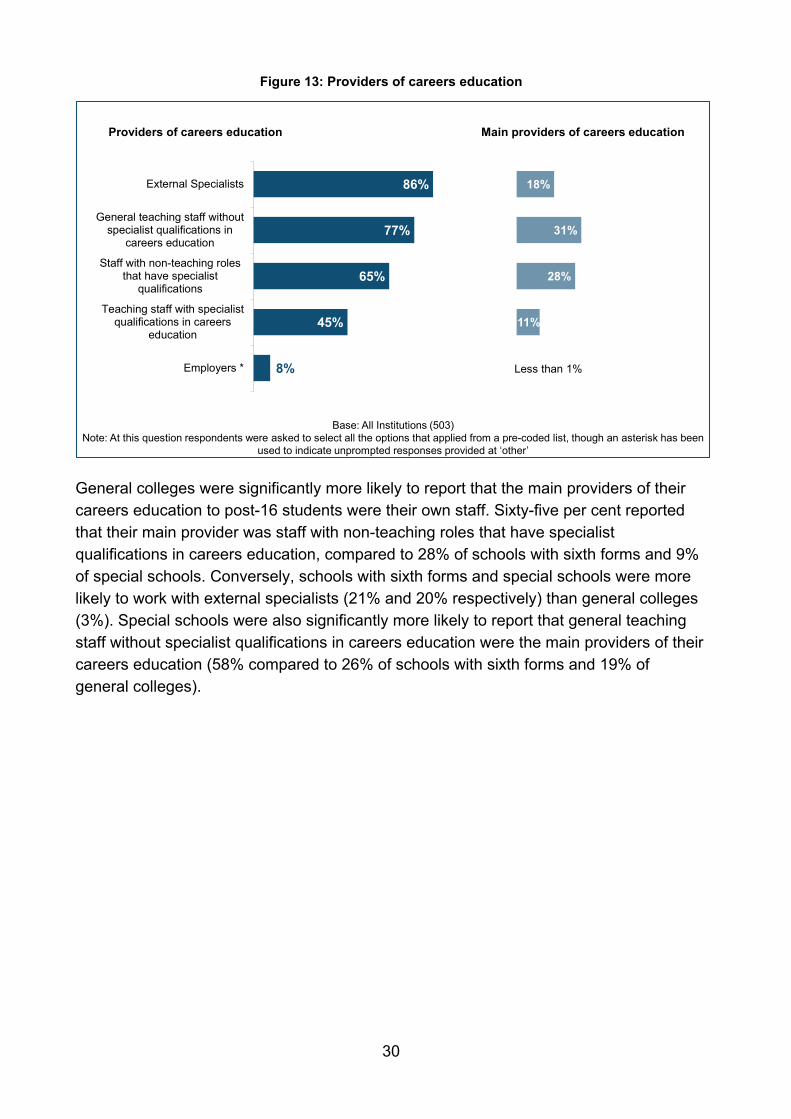
Figure 13: Providers of careers education
General colleges were significantly more likely to report that the main providers of their careers education to post-16 students were their own staff. Sixty-five per cent reported that their main provider was staff with non-teaching roles that have specialist qualifications in careers education, compared to 28% of schools with sixth forms and 9% of special schools. Conversely, schools with sixth forms and special schools were more likely to work with external specialists (21% and 20% respectively) than general colleges (3%). Special schools were also significantly more likely to report that general teaching staff without specialist qualifications in careers education were the main providers of their careers education (58% compared to 26% of schools with sixth forms and 19% of general colleges).
86%
77%
65%
45%
8%
External Specialists
General teaching staff withoutspecialist qualifications in
careers education
Staff with non-teaching rolesthat have specialist
qualifications
Teaching staff with specialistqualifications in careers
education
Employers *
Providers of careers education
18%
31%
28%
11%
Main providers of careers education
Base: All Institutions (503)Note: At this question respondents were asked to select all the options that applied from a pre-coded list, though an asterisk has been
used to indicate unprompted responses provided at ‘other’
Less than 1%
30
5.2 Careers-related mentoring In early 2016 David Cameron, Prime Minister at the time, announced an investment fund managed by the Careers & Enterprise Company in order to expand a national mentoring programme for young people.26 The aim of this programme is to connect students at risk of underachieving and dropping out with volunteer business mentors, teaching staff or others who are able to meet regularly to provide guidance and support. Mentors may assist with job applications or interviews, arranging work experience or other activities related to employment.
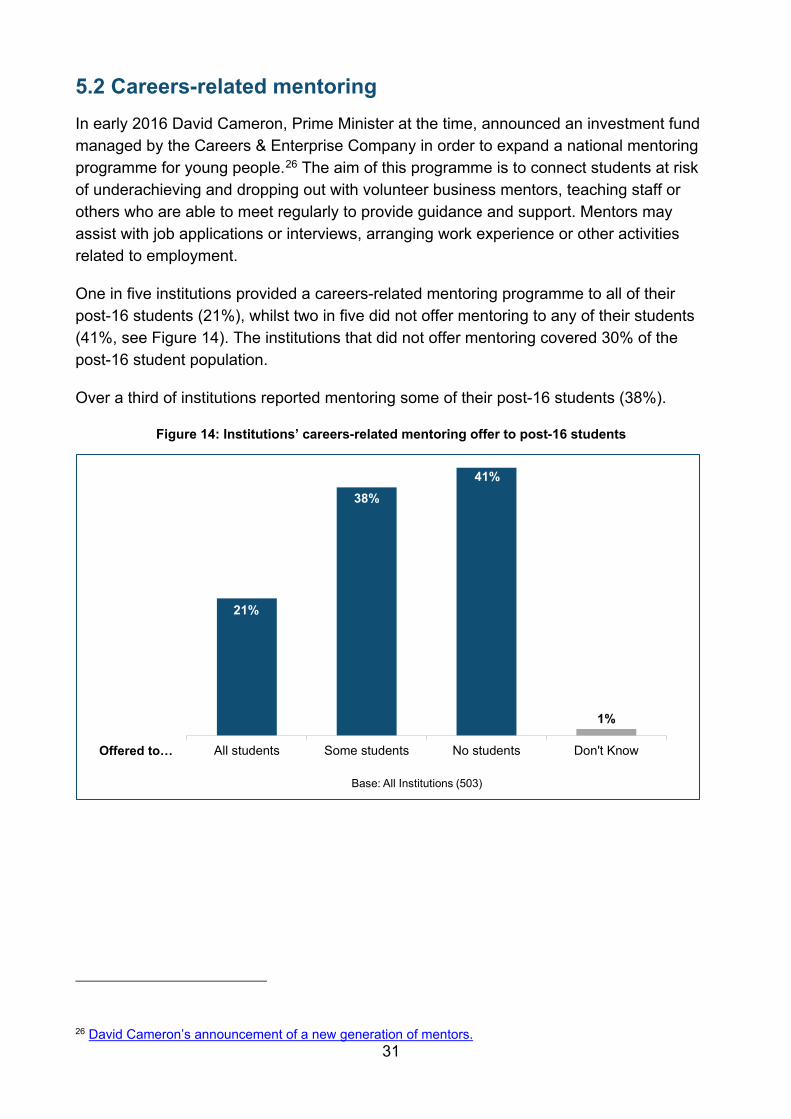
One in five institutions provided a careers-related mentoring programme to all of their post-16 students (21%), whilst two in five did not offer mentoring to any of their students (41%, see Figure 14). The institutions that did not offer mentoring covered 30% of the post-16 student population.
Over a third of institutions reported mentoring some of their post-16 students (38%).
Figure 14: Institutions’ careers-related mentoring offer to post-16 students
26 David Cameron’s announcement of a new generation of mentors.
21%
38%41%
1%
All students Some students No students Don't Know
Base: All Institutions (503)
Offered to…
31
Among the 38% of institutions that mentored some of their post-16 students, the most commonly reported types of students to receive mentoring from these institutions were:
• Students in certain year groups (75%)
• Those most at risk of under-achieving (62%)
• Students from the most disadvantaged backgrounds (52%)
• Those on specific courses (15%), and
• High achievers / those considered gifted and talented (10%)
More than two-thirds of general colleges and three in five schools with sixth forms offered a careers-related mentoring programme to all or some of their post-16 students (68% and 59% respectively). The proportion of special schools that did so was significantly lower at 45%.
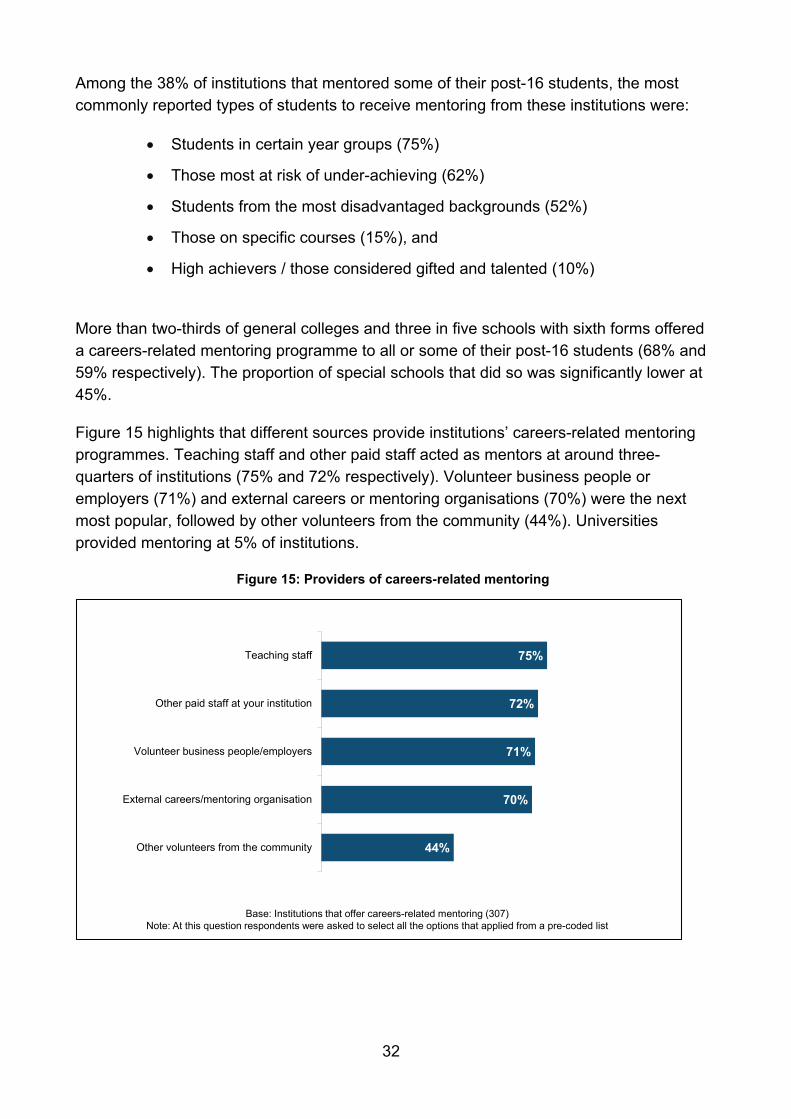
Figure 15 highlights that different sources provide institutions’ careers-related mentoring programmes. Teaching staff and other paid staff acted as mentors at around three-quarters of institutions (75% and 72% respectively). Volunteer business people or employers (71%) and external careers or mentoring organisations (70%) were the next most popular, followed by other volunteers from the community (44%). Universities provided mentoring at 5% of institutions.
Figure 15: Providers of careers-related mentoring
75%
72%
71%
70%
44%
Teaching staff
Other paid staff at your institution
Volunteer business people/employers
External careers/mentoring organisation
Other volunteers from the community
Base: Institutions that offer careers-related mentoring (307)Note: At this question respondents were asked to select all the options that applied from a pre-coded list
32
6. Work experience This chapter starts with an explanation of the proportion of post-16 students undertaking different types of work experience. It then goes on to examine the challenges faced by institutions in offering work experience placements, as well as what factors would make it easier. It closes with a summary of where students progress and learning aims are recorded whilst they are out on placements.27
Work experience is a key element of 16-19 study programmes, and is something that all students are expected to undertake. The Wolf Review highlighted the need for work experience opportunities to help learners develop employability skills, and to ensure it is effective DfE guidance states that it is meaningful, has clear roles and responsibilities and results in some form of reference or employer feedback.28
Institutions were asked about the various work experience their post-16 students were undertaking and about what challenges they faced in offering placements. Figure 16 shows the proportion of students doing a placement outside school or college lasting two weeks or more, a placement outside school or college lasting less than two weeks, or some other form of work experience, e.g. work shadowing, employer visits, volunteering or internal work placements.
One in five institutions reported that more than half of their post-16 students did a work placement outside school/college lasting two weeks or more (22%); these institutions cover 29% of the student population. Almost a quarter of institutions had no students that undertook an external work placement lasting two weeks or more (23%).
A higher proportion of institutions had students that did a shorter placement. One-third reported that more than half of their students do a work placement outside school/college lasting less than two weeks – these institutions cover a similar proportion of the student population at 31%. A small proportion of institutions reported that none of their students did an external placement lasting less than two weeks (16%).
Doing some other form of work experience (e.g. work shadowing, employer visits, volunteering or internal work placements) was the most popular of the three options, with two in five institutions reporting that at least half of their post-16 students did this (40%). These institutions cover 40% of the student population. Just 5% reported that none of their students did this kind of work experience.
27 At the time of the survey there were no requirements for how long a work placement should last. Lord Sainsbury’s Report of the Independent Panel on Technical Education has since suggested that they should take place over a significant period of time (e.g. 2 or 4 months) and be undertaken in blocks. 28 Post-16 work experience guidance
33
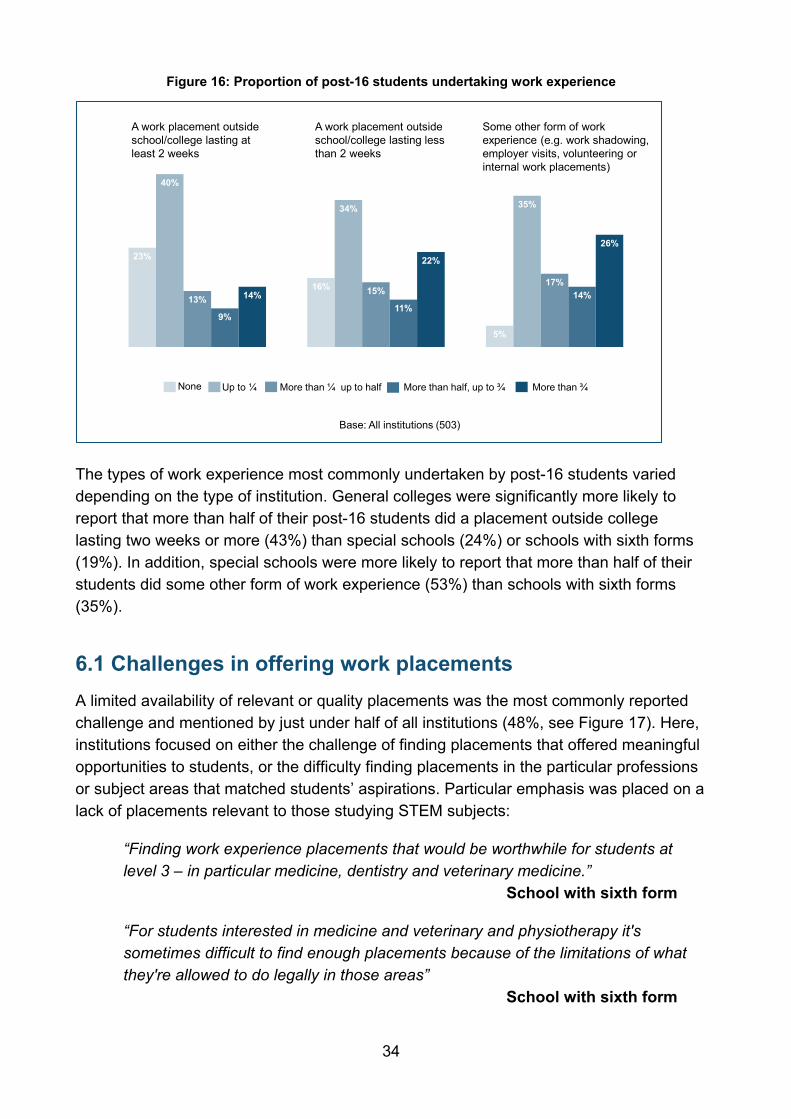
Figure 16: Proportion of post-16 students undertaking work experience
The types of work experience most commonly undertaken by post-16 students varied depending on the type of institution. General colleges were significantly more likely to report that more than half of their post-16 students did a placement outside college lasting two weeks or more (43%) than special schools (24%) or schools with sixth forms (19%). In addition, special schools were more likely to report that more than half of their students did some other form of work experience (53%) than schools with sixth forms (35%).
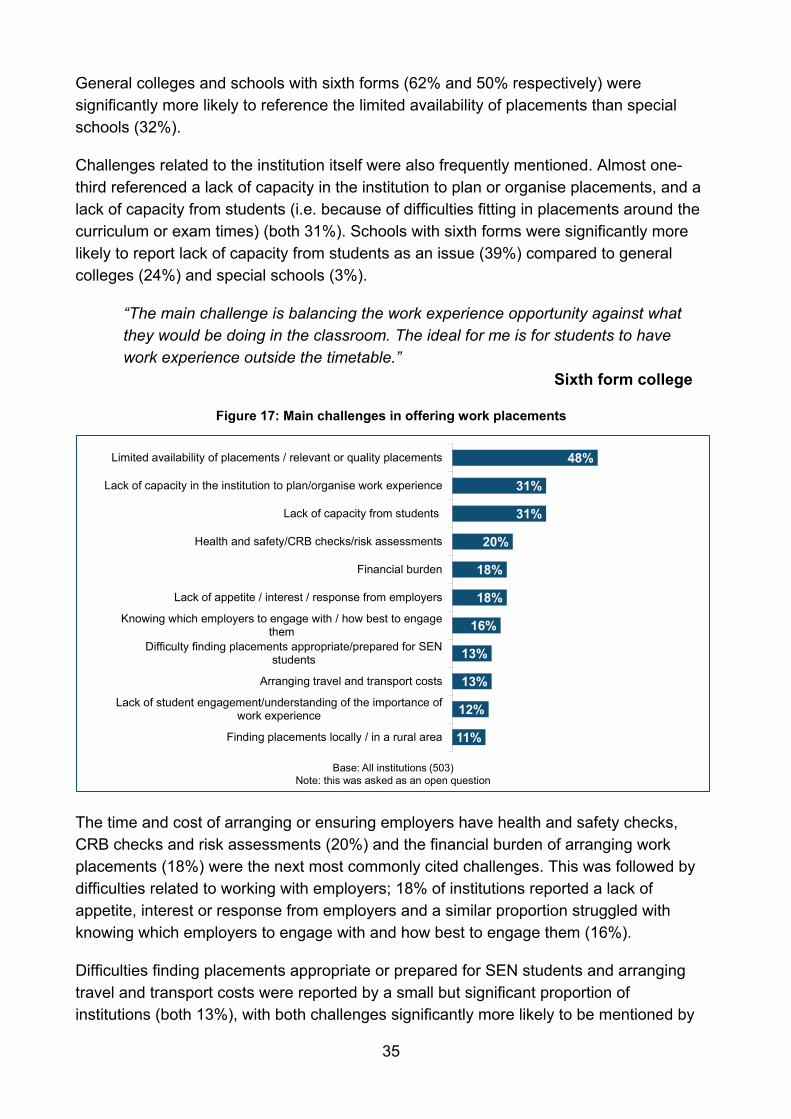
6.1 Challenges in offering work placements A limited availability of relevant or quality placements was the most commonly reported challenge and mentioned by just under half of all institutions (48%, see Figure 17). Here, institutions focused on either the challenge of finding placements that offered meaningful opportunities to students, or the difficulty finding placements in the particular professions or subject areas that matched students’ aspirations. Particular emphasis was placed on a lack of placements relevant to those studying STEM subjects:
“Finding work experience placements that would be worthwhile for students at level 3 – in particular medicine, dentistry and veterinary medicine.”
School with sixth form
“For students interested in medicine and veterinary and physiotherapy it's sometimes difficult to find enough placements because of the limitations of what they're allowed to do legally in those areas”
School with sixth form
23%
16%
5%
40%
34% 35%
13%15%
17%
9%11%
14%14%
22%
26%
A work placement outside school/college lasting at least 2 weeks
A work placement outside school/college lasting less than 2 weeks
Some other form of work experience (e.g. work shadowing, employer visits, volunteering or internal work placements)
None Up to ¼ More than ¼ up to half More than half, up to ¾ More than ¾
Base: All institutions (503)
34
General colleges and schools with sixth forms (62% and 50% respectively) were significantly more likely to reference the limited availability of placements than special schools (32%).
Challenges related to the institution itself were also frequently mentioned. Almost one-third referenced a lack of capacity in the institution to plan or organise placements, and a lack of capacity from students (i.e. because of difficulties fitting in placements around the curriculum or exam times) (both 31%). Schools with sixth forms were significantly more likely to report lack of capacity from students as an issue (39%) compared to general colleges (24%) and special schools (3%).
“The main challenge is balancing the work experience opportunity against what they would be doing in the classroom. The ideal for me is for students to have work experience outside the timetable.”
Sixth form college
Figure 17: Main challenges in offering work placements
The time and cost of arranging or ensuring employers have health and safety checks, CRB checks and risk assessments (20%) and the financial burden of arranging work placements (18%) were the next most commonly cited challenges. This was followed by difficulties related to working with employers; 18% of institutions reported a lack of appetite, interest or response from employers and a similar proportion struggled with knowing which employers to engage with and how best to engage them (16%).
Difficulties finding placements appropriate or prepared for SEN students and arranging travel and transport costs were reported by a small but significant proportion of institutions (both 13%), with both challenges significantly more likely to be mentioned by
11%
12%
13%
13%
16%
18%
18%
20%
31%
31%
48%
Finding placements locally / in a rural area
Lack of student engagement/understanding of the importance ofwork experience
Arranging travel and transport costs
Difficulty finding placements appropriate/prepared for SENstudents
Knowing which employers to engage with / how best to engagethem
Lack of appetite / interest / response from employers
Financial burden
Health and safety/CRB checks/risk assessments
Lack of capacity from students
Lack of capacity in the institution to plan/organise work experience
Limited availability of placements / relevant or quality placements
Base: All institutions (503)Note: this was asked as an open question
35
special schools. Over two-thirds of special schools found it difficult to find placements for their SEN students (68% compared to 3% of general colleges and no schools with sixth forms) and two in five (21%) struggled with arranging travel and transport costs (compared to 11% of schools with sixth forms and 8% of general colleges).
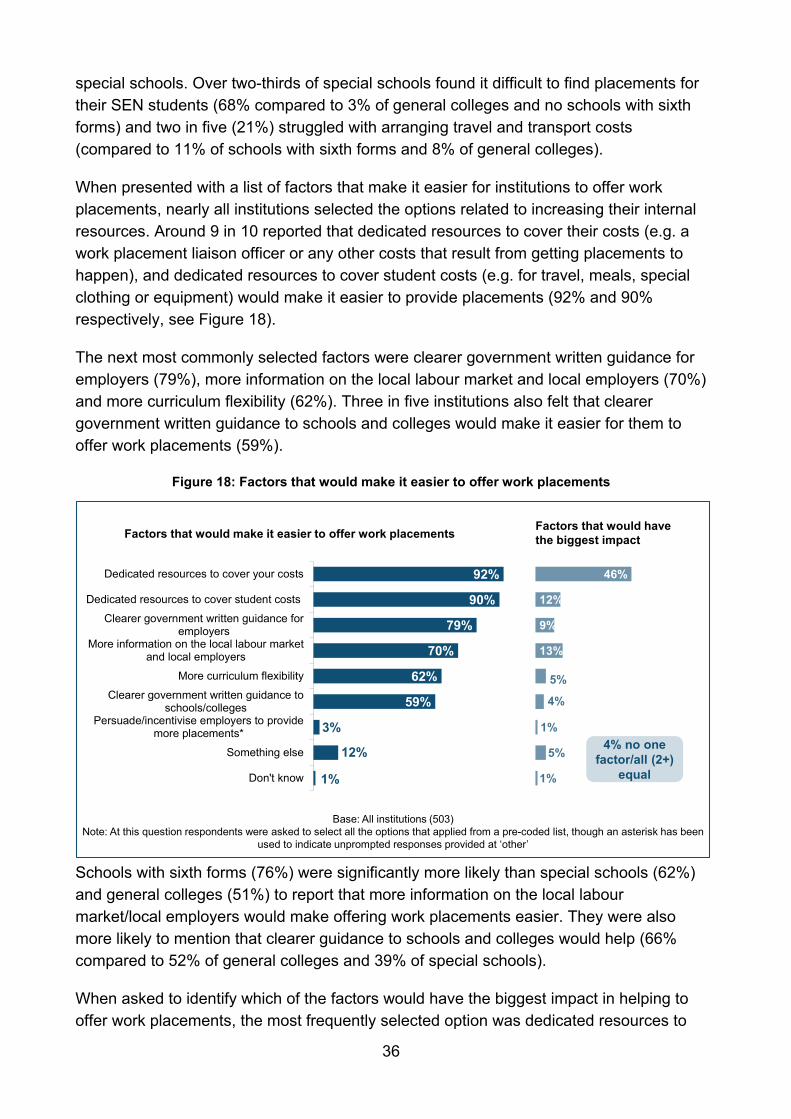
When presented with a list of factors that make it easier for institutions to offer work placements, nearly all institutions selected the options related to increasing their internal resources. Around 9 in 10 reported that dedicated resources to cover their costs (e.g. a work placement liaison officer or any other costs that result from getting placements to happen), and dedicated resources to cover student costs (e.g. for travel, meals, special clothing or equipment) would make it easier to provide placements (92% and 90% respectively, see Figure 18).
The next most commonly selected factors were clearer government written guidance for employers (79%), more information on the local labour market and local employers (70%) and more curriculum flexibility (62%). Three in five institutions also felt that clearer government written guidance to schools and colleges would make it easier for them to offer work placements (59%).
Figure 18: Factors that would make it easier to offer work placements
Schools with sixth forms (76%) were significantly more likely than special schools (62%) and general colleges (51%) to report that more information on the local labour market/local employers would make offering work placements easier. They were also more likely to mention that clearer guidance to schools and colleges would help (66% compared to 52% of general colleges and 39% of special schools).
When asked to identify which of the factors would have the biggest impact in helping to offer work placements, the most frequently selected option was dedicated resources to
92%
90%
79%
70%
62%
59%
3%
12%
1%
Dedicated resources to cover your costs
Dedicated resources to cover student costs
Clearer government written guidance foremployers
More information on the local labour marketand local employers
More curriculum flexibility
Clearer government written guidance toschools/colleges
Persuade/incentivise employers to providemore placements*
Something else
Don't know
46%
12%
9%
13%
5%
4%
1%
5%
1%
4% no one factor/all (2+)
equal
Factors that would make it easier to offer work placements Factors that would have the biggest impact
Base: All institutions (503)Note: At this question respondents were asked to select all the options that applied from a pre-coded list, though an asterisk has been
used to indicate unprompted responses provided at ‘other’
36
cover institutions’ costs (46%, see the second bar chart at Figure 18). Around one in ten institutions opted for more information on the local labour market/local employers (13%), dedicated resources to cover student costs (12%), and clearer government written guidance for employers (9%).
6.2 Recording information about work placements Institutions were asked about the recording of various pieces of information relating to work placements including students’ learning aims, their progress against these learning aims and employer feedback:
• Learning aims: over half of institutions recorded post-16 students’ learning aims while they are out on placement in a log book (54%). A further quarter reported they were recorded somewhere else while 16% stated that they were not recorded;
• Progress against learning aims: a smaller proportion reported that progress against students’ learning aims was recorded in a log book (41%), whilst 31% recorded this somewhere else and 22% did not record this information at all;
• Employer feedback: over one-third recorded employer feedback on work placements in a log book (37%), 45% recorded this somewhere else and 13% did not record this information.
37
7. National Citizen Service The National Citizen Service is open to all 15 to 17-year olds in England. Participants take part in residential activity weeks and develop and deliver a social action project in their community. It encourages social development, helps participants to build skills for work and life, and helps to develop confidence, self-awareness and responsibility.29
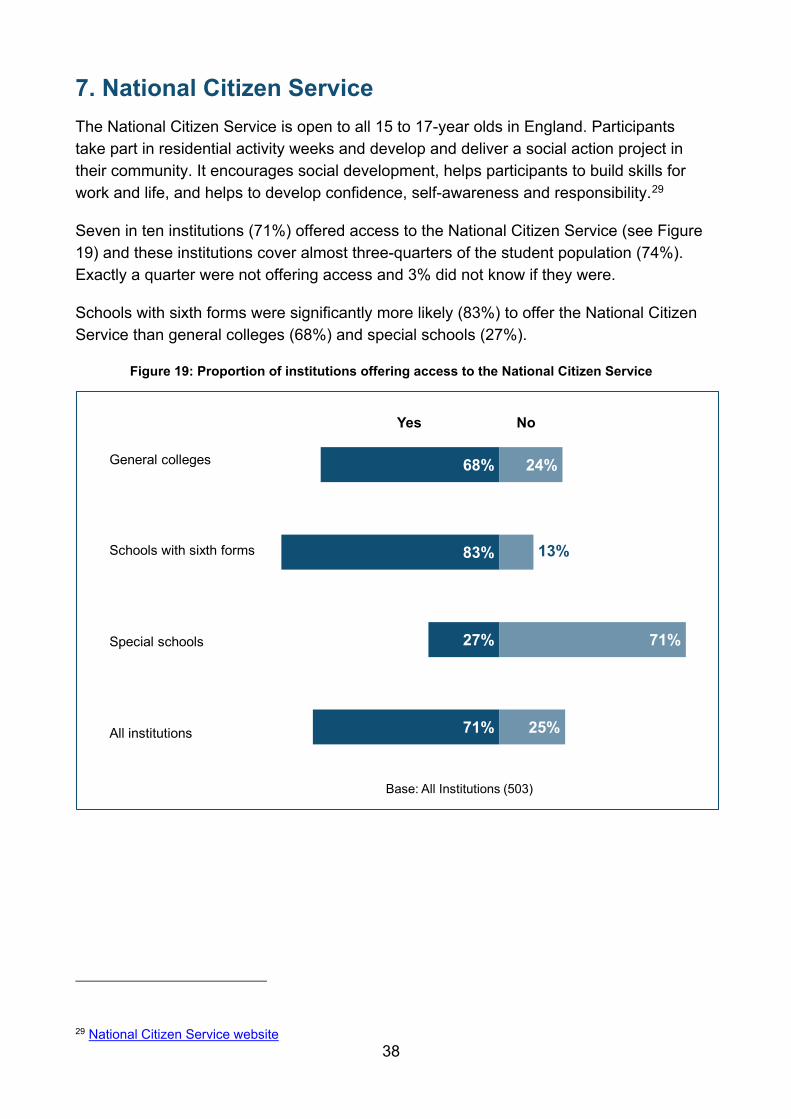
Seven in ten institutions (71%) offered access to the National Citizen Service (see Figure 19) and these institutions cover almost three-quarters of the student population (74%). Exactly a quarter were not offering access and 3% did not know if they were.
Schools with sixth forms were significantly more likely (83%) to offer the National Citizen Service than general colleges (68%) and special schools (27%).
Figure 19: Proportion of institutions offering access to the National Citizen Service
29 National Citizen Service website
68%
83%
27%
71%
24%
13%
71%
25%
Base: All Institutions (503)
Yes No
General colleges
Schools with sixth forms
Special schools
All institutions
38
8. Post-16 student population This final chapter of the report discusses particular groups of post-16 students. The first section addresses the most academically able students, the methods institutions use to identify them, how they are stretched and institutions’ confidence in stretching them. It then moves on to look at institutions’ views about their ability to support and meet the needs of post-16 SEN (special educational needs) support students (i.e. those identified as having special educational needs but do not have a statement, EHC Plan or Learning Difficulty Assessment). The chapter ends with a summary of how confident institutions are in their ability to support students with mental health issues.
8.1 Most academically able students In recent years, greater emphasis has been placed on the need for institutions to ensure that their most academically able students achieve their potential. Though it focused on key stages 3 and 4 (rather than post-16), Ofsted’s Most Able Students Report highlighted that schools were not doing enough to challenge students, most able students were not being encouraged to apply to top universities, and that support with university applications was minimal.30
Overall, nearly all (99%) of institutions that offered Level 3 qualifications carried out at least one activity in order to identify the most academically able post-16 students. Special schools were significantly less likely to carry out any specific activity to identify the most academically able students (22% vs 1% of institutions overall).
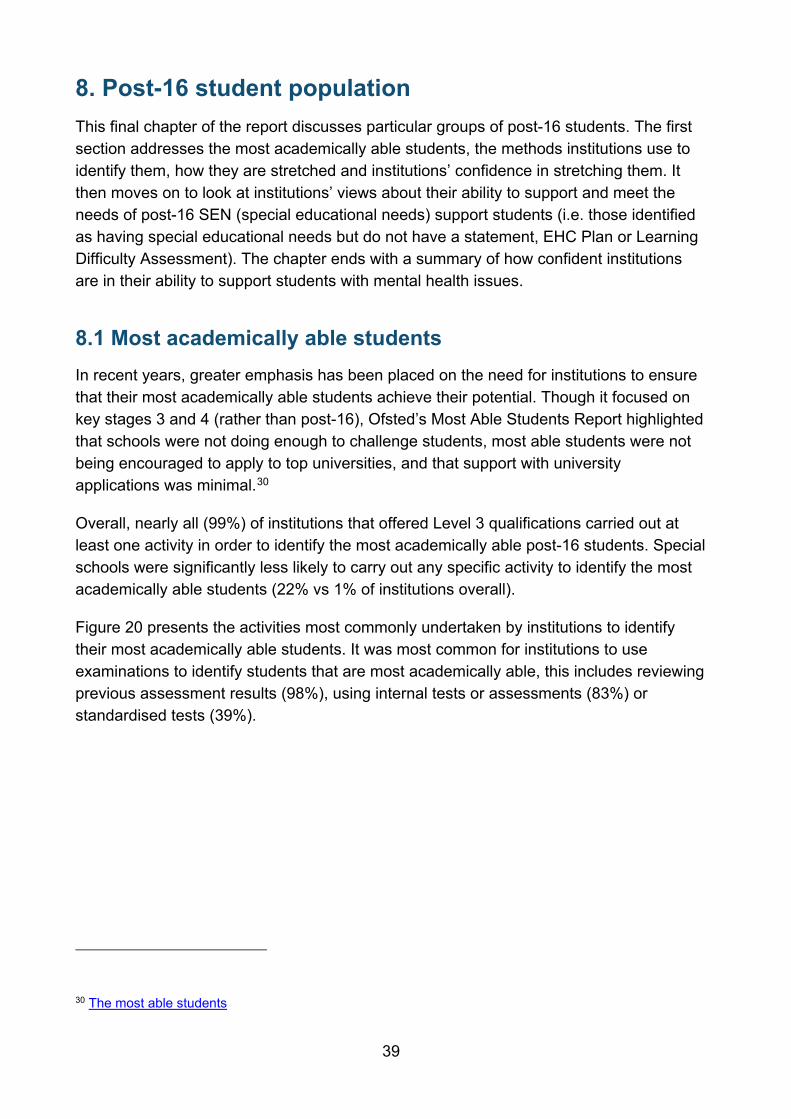
Figure 20 presents the activities most commonly undertaken by institutions to identify their most academically able students. It was most common for institutions to use examinations to identify students that are most academically able, this includes reviewing previous assessment results (98%), using internal tests or assessments (83%) or standardised tests (39%).
30 The most able students
39
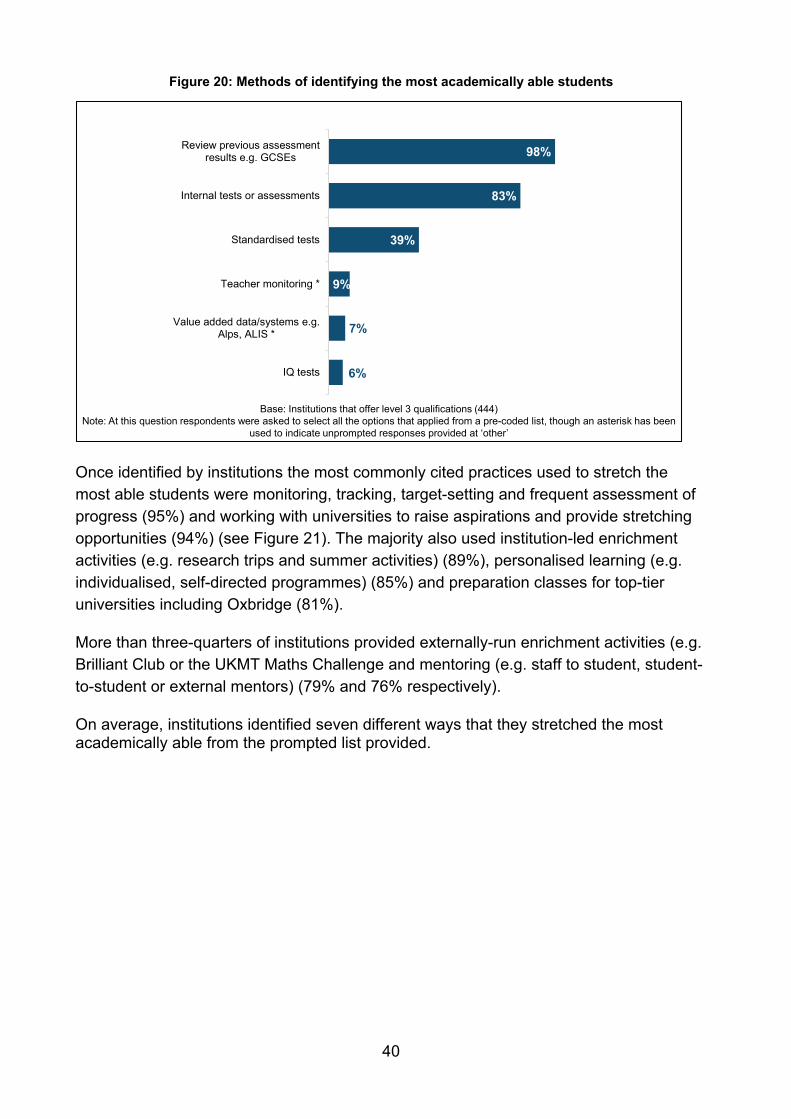
Figure 20: Methods of identifying the most academically able students
Once identified by institutions the most commonly cited practices used to stretch the most able students were monitoring, tracking, target-setting and frequent assessment of progress (95%) and working with universities to raise aspirations and provide stretching opportunities (94%) (see Figure 21). The majority also used institution-led enrichment activities (e.g. research trips and summer activities) (89%), personalised learning (e.g. individualised, self-directed programmes) (85%) and preparation classes for top-tier universities including Oxbridge (81%).
More than three-quarters of institutions provided externally-run enrichment activities (e.g. Brilliant Club or the UKMT Maths Challenge and mentoring (e.g. staff to student, student-to-student or external mentors) (79% and 76% respectively).
On average, institutions identified seven different ways that they stretched the most academically able from the prompted list provided.
6%
7%
9%
39%
83%
98%
IQ tests
Value added data/systems e.g.Alps, ALIS *
Teacher monitoring *
Standardised tests
Internal tests or assessments
Review previous assessmentresults e.g. GCSEs
Base: Institutions that offer level 3 qualifications (444)Note: At this question respondents were asked to select all the options that applied from a pre-coded list, though an asterisk has been
used to indicate unprompted responses provided at ‘other’
40
Figure 21: Methods of stretching the most academically able students
There were certain practices undertaken to stretch the most academically able students that were significantly more prevalent in schools with sixth forms than in general colleges. These include:
• Working with universities to raise aspirations and provide stretching opportunities (97% vs 90%);
• Preparation classes for top-tier universities (88% vs 50%);
• Externally-run enrichment activities (82% vs 60%); and
• Assigning responsibilities for this group to a discrete post or a specific person at leadership level (64% vs 37%).
In addition to being more likely than general colleges to undertake the practices intended to stretch their most academically able students listed above, schools with sixth forms were more likely on average to use more of the listed methods to stretch students than general colleges (8 vs 7).
55%
61%
65%
76%
79%
81%
85%
89%
94%
95%
Signposting or utilising distance learning courses e.g.online learning
Assigning responsibilities for this group to a discretepost or a specific person at leadership level
Accelerating the level and difficulty of the curriculumbased on ability, not age
Providing mentoring e.g. staff to student, student-to-student, external mentors
Externally-run enrichment activities e.g. Brilliant Club,UKMT Maths Challenge
Preparation classes for top-tier universities, includingOxbridge
Personalised learning, e.g. individualised, self-directedprogrammes
Institution-led enrichment activities e.g. research trips,summer activities
Working with universities to raise aspirations andprovide stretching opportunities
Monitoring, tracking, target-setting and frequentassessment of progress
Base: Institutions that identify more academically able students (441)Note: At this question respondents were asked to select all the options that applied from a pre-coded list
41
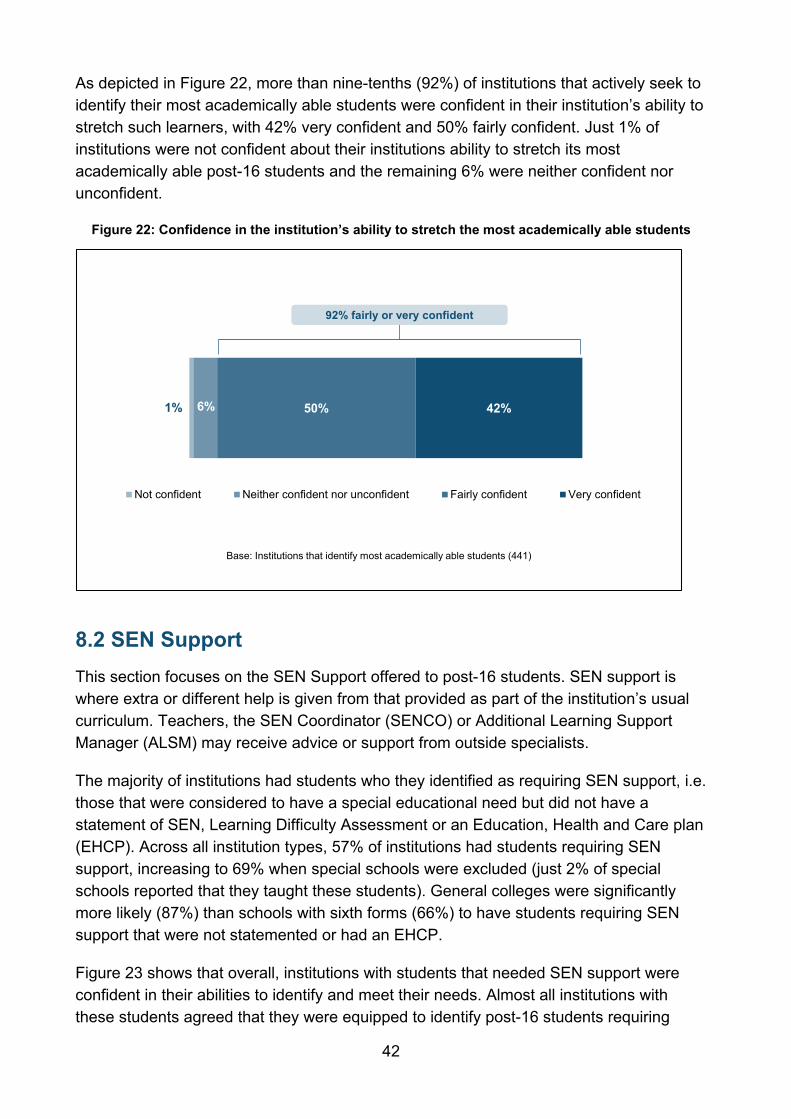
As depicted in Figure 22, more than nine-tenths (92%) of institutions that actively seek to identify their most academically able students were confident in their institution’s ability to stretch such learners, with 42% very confident and 50% fairly confident. Just 1% of institutions were not confident about their institutions ability to stretch its most academically able post-16 students and the remaining 6% were neither confident nor unconfident.
Figure 22: Confidence in the institution’s ability to stretch the most academically able students
8.2 SEN Support This section focuses on the SEN Support offered to post-16 students. SEN support is where extra or different help is given from that provided as part of the institution’s usual curriculum. Teachers, the SEN Coordinator (SENCO) or Additional Learning Support Manager (ALSM) may receive advice or support from outside specialists.
The majority of institutions had students who they identified as requiring SEN support, i.e. those that were considered to have a special educational need but did not have a statement of SEN, Learning Difficulty Assessment or an Education, Health and Care plan (EHCP). Across all institution types, 57% of institutions had students requiring SEN support, increasing to 69% when special schools were excluded (just 2% of special schools reported that they taught these students). General colleges were significantly more likely (87%) than schools with sixth forms (66%) to have students requiring SEN support that were not statemented or had an EHCP.
Figure 23 shows that overall, institutions with students that needed SEN support were confident in their abilities to identify and meet their needs. Almost all institutions with these students agreed that they were equipped to identify post-16 students requiring
1% 6% 50% 42%
Not confident Neither confident nor unconfident Fairly confident Very confident
Base: Institutions that identify most academically able students (441)
92% fairly or very confident
42
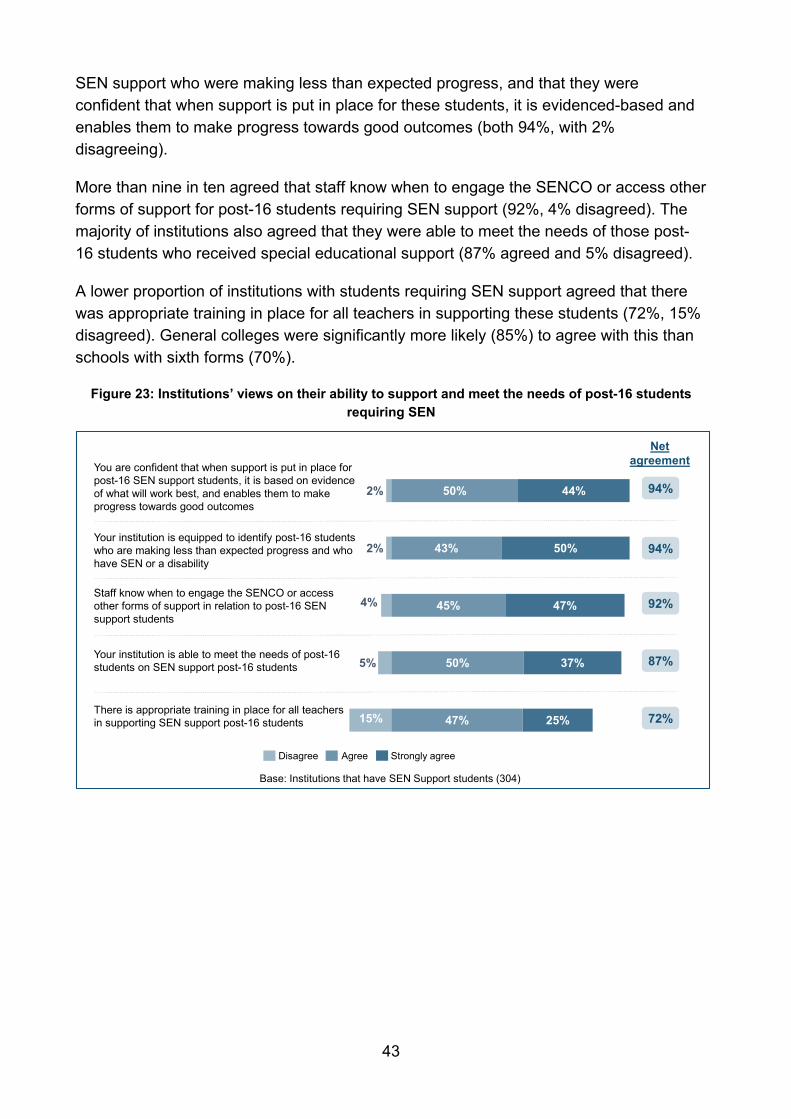
SEN support who were making less than expected progress, and that they were confident that when support is put in place for these students, it is evidenced-based and enables them to make progress towards good outcomes (both 94%, with 2% disagreeing).
More than nine in ten agreed that staff know when to engage the SENCO or access other forms of support for post-16 students requiring SEN support (92%, 4% disagreed). The majority of institutions also agreed that they were able to meet the needs of those post-16 students who received special educational support (87% agreed and 5% disagreed).
A lower proportion of institutions with students requiring SEN support agreed that there was appropriate training in place for all teachers in supporting these students (72%, 15% disagreed). General colleges were significantly more likely (85%) to agree with this than schools with sixth forms (70%).
Figure 23: Institutions’ views on their ability to support and meet the needs of post-16 students requiring SEN
47%
50%
45%
43%
50%
25%
37%
47%
50%
44%
15%
5%
4%
2%
2%
Base: Institutions that have SEN Support students (304)
94%
Net agreementYou are confident that when support is put in place for
post-16 SEN support students, it is based on evidence of what will work best, and enables them to make progress towards good outcomes
Your institution is equipped to identify post-16 students who are making less than expected progress and who have SEN or a disability
Staff know when to engage the SENCO or access other forms of support in relation to post-16 SEN support students
Your institution is able to meet the needs of post-16 students on SEN support post-16 students
There is appropriate training in place for all teachers in supporting SEN support post-16 students
94%
92%
87%
72%
Agree Strongly agreeDisagree
43
8.3 Young people with mental health issues Young people’s mental health and wellbeing have been an increasing priority across government over recent years. In 2014 the government announced a £1.4 billion investment to fund improved access for specialist mental health provision and ensure 70,000 more children and young people have access to high quality care by 2020.31
Institutions were asked whether they agreed or disagreed with a number of statements relating to their ability to support students with mental health issues.32 Figure 24 shows that overall institutions were quite confident in supporting students with mental health issues.
More than four-fifths of institutions agreed that most staff know what support the institution offers students with mental health issues and how students can access it (85%), with just 7% disagreeing. Four-fifths of institutions also agreed that most staff are equipped to identify behaviour that may be linked to a mental health issue (81%), with one in 10 disagreeing (9%). The majority of institutions felt that most staff are equipped to teach students who have mental health needs (68% agreed and 17% disagreed).
Agreement with the statements related to specialist support was lower. Three in five institutions felt staff have good access to mental health professionals if they need specialist advice on students’ mental health (60% agreed and 29% disagreed).
Although the majority of institutions agreed that most staff are aware of internal support and how students can access it, only half (53%) agreed that most staff know how to help students with mental health issues access specialist support outside of their school or college. Over a quarter (28%) disagreed.
31 NHS commits to major transformation of mental health care 32 These were the only questions in wave 3 of the survey that were asked about all learners in the institution (the majority of the questions ask about post-16 students specifically).
44
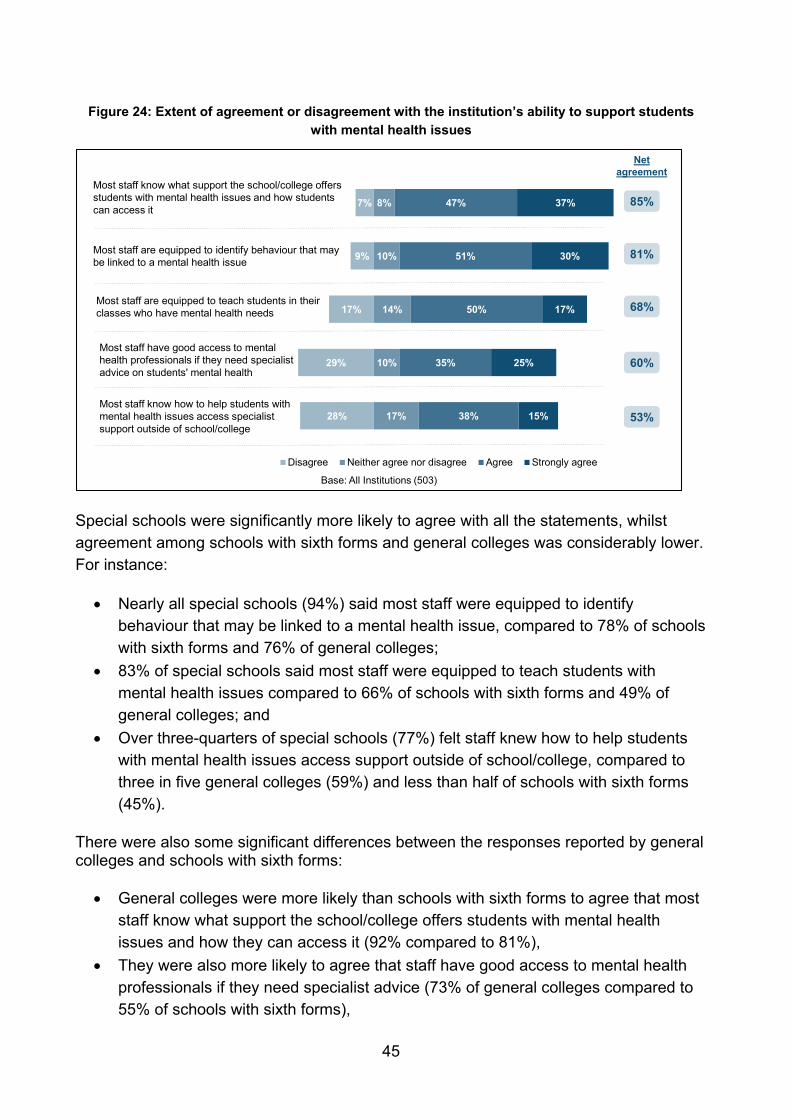
Figure 24: Extent of agreement or disagreement with the institution’s ability to support students
with mental health issues
Special schools were significantly more likely to agree with all the statements, whilst agreement among schools with sixth forms and general colleges was considerably lower. For instance:
• Nearly all special schools (94%) said most staff were equipped to identify behaviour that may be linked to a mental health issue, compared to 78% of schools with sixth forms and 76% of general colleges;
• 83% of special schools said most staff were equipped to teach students with mental health issues compared to 66% of schools with sixth forms and 49% of general colleges; and
• Over three-quarters of special schools (77%) felt staff knew how to help students with mental health issues access support outside of school/college, compared to three in five general colleges (59%) and less than half of schools with sixth forms (45%).
There were also some significant differences between the responses reported by general colleges and schools with sixth forms:
• General colleges were more likely than schools with sixth forms to agree that most staff know what support the school/college offers students with mental health issues and how they can access it (92% compared to 81%),
• They were also more likely to agree that staff have good access to mental health professionals if they need specialist advice (73% of general colleges compared to 55% of schools with sixth forms),
7%
9%
17%
29%
28%
8%
10%
14%
10%
17%
47%
51%
50%
35%
38%
37%
30%
17%
25%
15%
Disagree Neither agree nor disagree Agree Strongly agree
81%
85%
53%
68%
60%
Net agreement
Base: All Institutions (503)
Most staff know what support the school/college offers students with mental health issues and how students can access it
Most staff are equipped to identify behaviour that may be linked to a mental health issue
Most staff are equipped to teach students in their classes who have mental health needs
Most staff have good access to mental health professionals if they need specialist advice on students' mental health
Most staff know how to help students with mental health issues access specialist support outside of school/college
45

• However, schools with sixth forms were more likely than general colleges to agree that most staff are equipped to teach students in their classes who have mental health needs (66% compared to 49%).
46
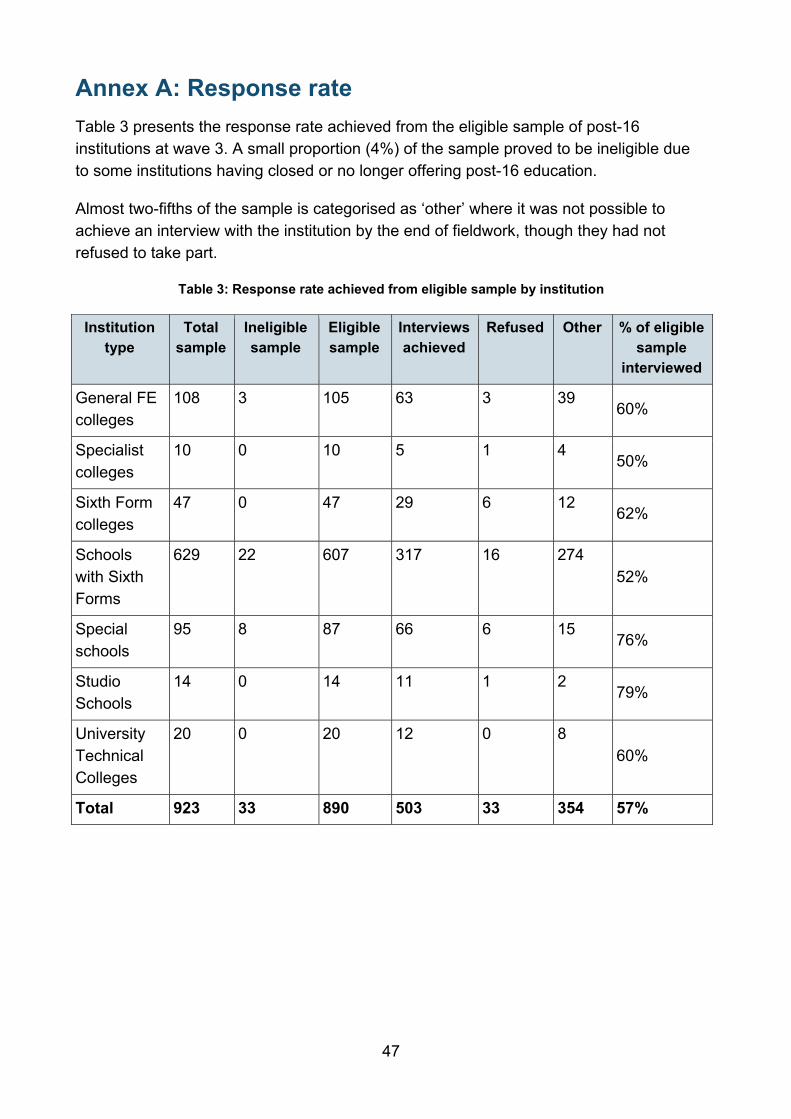
Annex A: Response rate Table 3 presents the response rate achieved from the eligible sample of post-16 institutions at wave 3. A small proportion (4%) of the sample proved to be ineligible due to some institutions having closed or no longer offering post-16 education.
Almost two-fifths of the sample is categorised as ‘other’ where it was not possible to achieve an interview with the institution by the end of fieldwork, though they had not refused to take part.
Table 3: Response rate achieved from eligible sample by institution
Institution type
Total sample
Ineligible sample
Eligible sample
Interviews achieved
Refused Other % of eligible sample
interviewed
General FE colleges
108 3 105 63 3 39 60%
Specialist colleges
10 0 10 5 1 4 50%
Sixth Form colleges
47 0 47 29 6 12 62%
Schools with Sixth Forms
629 22 607 317 16 274 52%
Special schools
95 8 87 66 6 15 76%
Studio Schools
14 0 14 11 1 2 79%
University Technical Colleges
20 0 20 12 0 8 60%
Total 923 33 890 503 33 354 57%
47
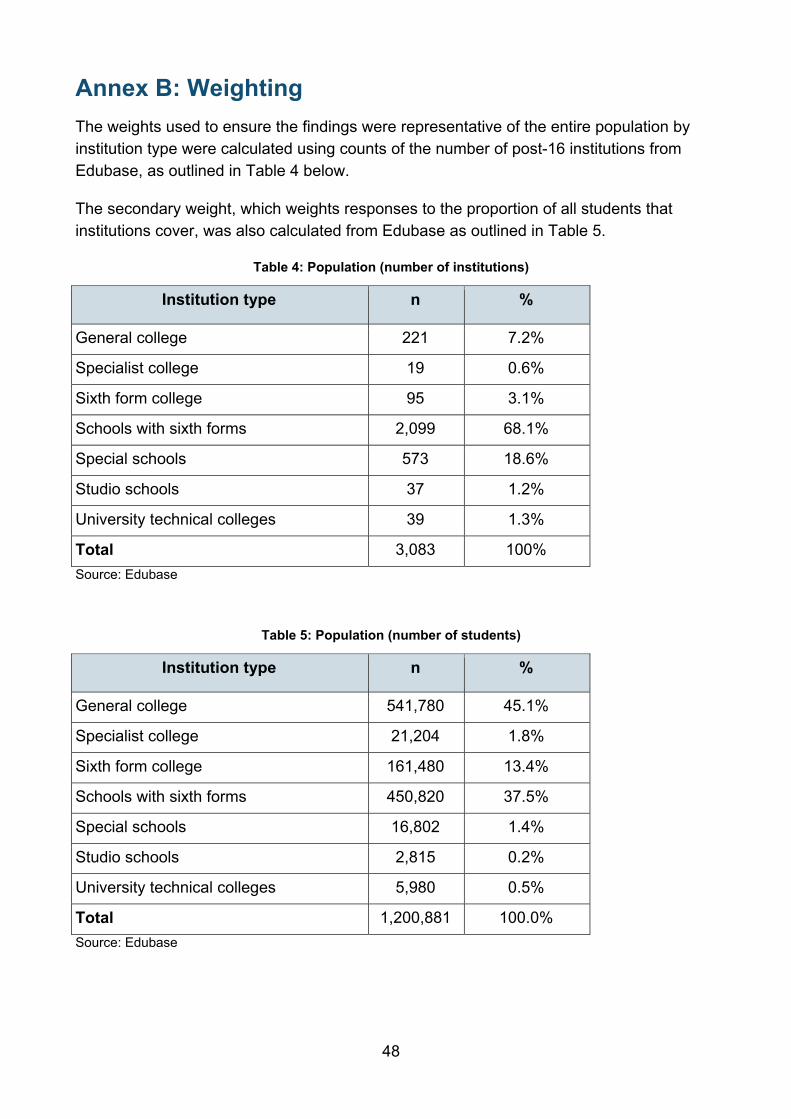
Annex B: Weighting The weights used to ensure the findings were representative of the entire population by institution type were calculated using counts of the number of post-16 institutions from Edubase, as outlined in Table 4 below.
The secondary weight, which weights responses to the proportion of all students that institutions cover, was also calculated from Edubase as outlined in Table 5.
Table 4: Population (number of institutions)
Institution type n %
General college 221 7.2%
Specialist college 19 0.6%
Sixth form college 95 3.1%
Schools with sixth forms 2,099 68.1%
Special schools 573 18.6%
Studio schools 37 1.2%
University technical colleges 39 1.3%
Total 3,083 100% Source: Edubase
Table 5: Population (number of students)
Institution type n %
General college 541,780 45.1%
Specialist college 21,204 1.8%
Sixth form college 161,480 13.4%
Schools with sixth forms 450,820 37.5%
Special schools 16,802 1.4%
Studio schools 2,815 0.2%
University technical colleges 5,980 0.5%
Total 1,200,881 100.0% Source: Edubase
48
© IFF Research 2016
Reference: DFE- RR619
ISBN: 978-1-78105-677-6
The views expressed in this report are the authors’ and do not necessarily reflect those of the Department for Education.
Any enquiries regarding this publication should be sent to us at: [email protected]
This document is available for download at www.gov.uk/government/publications
49