Embed Size (px)
Citation preview

Post-16 Institutions Omnibus Wave 5 findings
December 2017
IFF Research
2
Contents List of figures 3
List of tables 4
Executive summary 5
Introduction and aims 5
Key findings 8
1. Introduction 12
1.1 Introduction 12
1.2 Methodology 12
2. AS level and A level reform 15
3. Technical and vocational education 17
3.1 The provision of technical qualifications and vocational education 17
3.2 Employer involvement in technical qualifications and vocational qualifications 18
3.3 Technical education routes 20
4. Provision of other qualifications at post-16 22
4.1 Apprenticeships and traineeships 22
4.2 Supported internships 23
4.3 Applied General qualifications 23
4.4 GCSEs 23
5. Post-16 mathematics: level 3 qualifications 25
5.1 AS level and A level mathematics and further mathematics 25
5.2 Core Maths 27
6. Careers education 29
7. Mental health 34
8. SEN Support 37
9. Teacher workloads and post-16 budget management 39
9.1 Teacher workload 39
9.2 Post-16 budget 41
Annex A: Response rate 43
Annex B: Weighting 44

3
List of figures Figure 1.1: key findings infographic for A levels, AS levels and Core Maths .................................. 6
Figure 2.2: key findings infographic for technical qualifications and careers education.................. 7
Figure 2.1: Extent to which the institutions were confident about teaching the third wave of new AS and A levels ............................................................................................................................. 16
Figure 3.1: Ways in which institutions planned to increase their technical or vocational qualification ................................................................................................................................... 18
Figure 3.2: Employer involvement in the design and delivery of technical qualifications and vocational qualifications ................................................................................................................ 19
Figure 3.3: Challenges in preparing for the delivery of new technical education routes .............. 20
Figure 5.1: Anticipated number of learners taking AS and A level mathematics in September 2017 compared to September 2016 ...................................................................................................... 26
Figure 5.2: Proportion of learners expected to be entering A level mathematics and A level further mathematics in the 2017-18 academic year ................................................................................. 27
Figure 5.3: Core Maths provison ................................................................................................... 28
Figure 6.1: Provision of Careers Education .................................................................................. 29
Figure 6.2: Methods of Careers Provision .................................................................................... 31
Figure 6.3: Providers and Main Providers of careers education ................................................... 32
Figure 6.4: Opportunities institutions provide for learners to have contact with employers .......... 33
Figure 7.1: Extent to which institutions agree or disagree with statements about their ability to support students with mental health issues .................................................................................. 35
Figure 8.1: Institutions’ views on their ability to support and meet the needs of post-16 students requiring SEN support ................................................................................................................... 38
Figure 9.3: Actions taken by institutions to evaluate and reduce unnecessary teacher workload (mentioned by at least 5%) ........................................................................................................... 40
Figure 9.4: Extent to which actions taken to evaluate and reduce unnecessary workload had reduced workload on average ....................................................................................................... 41
Figure 9.5: Actions undertaken to help institutions get the most out of their post-16 budget (mentioned by at least 10%) ......................................................................................................... 42
4
List of tables Table 1.1 Respondent job title ......................................................................................... 12
Table 1.2: Sample drawn and interviews achieved at wave 5 .......................................... 14
Table 4.1: Provision of apprenticeships and traineeships, by institution .......................... 22
Table 4.2: Provision of GCSEs, by institution .................................................................. 24
Table 5.1: Provision of A level and AS level mathematics qualifications ......................... 26
Table A1: Response rate achieved from eligible sample by institution ............................ 43
Table B1: Population (number of institutions) .................................................................. 44
Table B2: Population (number of learners) ...................................................................... 44
5
Executive summary
Introduction and aims There has been a large-scale transformation of post-16 education in recent years resulting in reforms to AS and A levels qualifications, the introduction of new technical and applied technical qualifications and changes to careers education. The purpose of this research was to gain a better understanding of post-16 institutions’ views about these changes and explore what they are doing to ensure learners are prepared for adult life.
This was the fifth survey in the Post-16 Institutions Omnibus series which was conducted between June and July 2017. The survey has been delivered biannually since June 2015 to allow the Department for Education (DfE) to track changes over time.
In the fifth wave, 501 interviews were conducted by telephone with post-16 institutions in England1 2. Most interviews took place with Headteachers/Principals (18%), Assistant Heads/Principals (27%), or Heads of post-16 education (33%).
1 Institutions in scope of the study were state-funded institutions providing post-16 education. This included colleges (including specialist colleges), sixth form colleges, schools with sixth forms (including maintained, academies, free schools and special schools), studio schools and university technical colleges. 2 This is equivalent to 54% of the eligible sample.

6
Figure 1.1: key findings infographic for A levels, AS levels and Core Maths
Post-16 Institution Omnibus Wave 5 Findings
were very or fairly confident in teaching the second wave of
new AS and A level qualifications. 8% were not
confident
71%
A levels, AS levels, Mathematics and Core Maths
34% of institutions offering level 3 qualifications were teaching Core Maths and planned to continue to do so
7% planned to offer Core Maths in 2017/18
11% planned to offer Core Maths in future years but not in 2017/18
44%
51%
75%
AS level furthermathematics
AS levelmathematics
A level furthermathematics
97% of institutions offered A level mathematics. Institutions also offered…
7
Figure 2.2: key findings infographic for technical qualifications and careers education
Post-16 Institution Omnibus Wave 5 Findings
20% technical qualifications
67% vocational qualifications
67% offered either technical or vocational qualifications
Of these, 45% involved employers in the design and delivery
Technical qualifications and careers education
91% had an identified lead individual to oversee the careers
programme
93% offered personal careers guidance
52% offered at least one encounter with an employer each year
74% had a careers programme that is written down
66% offered students considering applying to university at least
two university visits
91% Anticipated challenges
in preparing for the delivery of the new technical education
routes
£ funding was the most commonly cited challenge
(86%)
Methods of career education delivery
12% offered apprenticeships
7% offered traineeships
37% of institutions that offered technical or vocational
qualifications planned to increase their provision
8
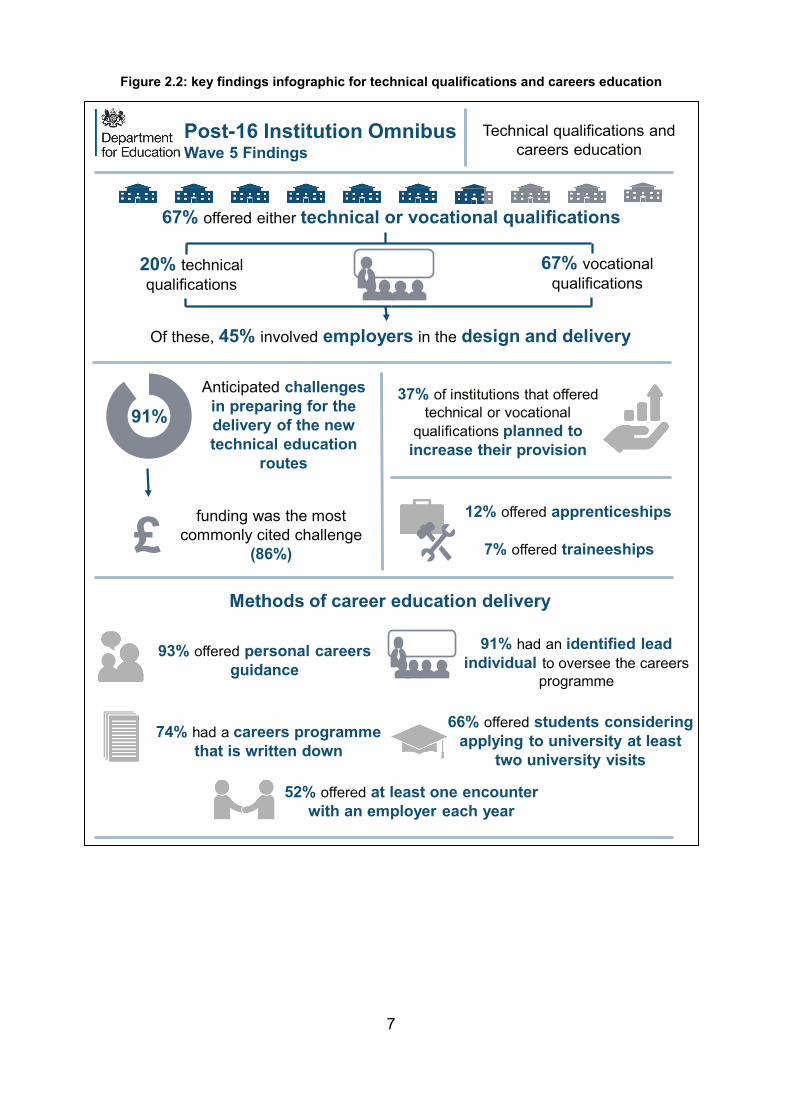
Key findings AS level and A level reform (Chapter 2)
AS level and A level qualifications in England are being reformed in four phases to ensure they better prepare learners for higher education or employment3. Ahead of the introduction of the third wave of new AS and A level qualifications, most institutions that offered A levels were confident about teaching them (71%, 8% were not confident).
Technical and vocational education (Chapter 3)
The Government has introduced technical qualifications to raise standards and to ensure that qualifications are more closely aligned to the needs of employers4. These run alongside other vocational and applied general qualifications. Two-thirds of institutions offered technical qualifications and/or vocational qualifications (67%), and these covered four-fifths (80%) of the population of post-16 learners. Around two-fifths of these institutions had plans to increase their provision (37%).
Under half of institutions that offered either technical or vocational qualifications involved employers in their design and delivery (45%). Employers were most commonly involved in technical and vocational qualifications by providing course-related work placements (94%), setting projects for learners (69%) and providing the use of their facilities (65%).
Nine in ten institutions that offered these qualifications anticipated challenges in preparing for the delivery of the new technical education routes (91%)5. The most commonly cited challenge in preparing for the new technical education routes was funding (mentioned by 86% with 44% considering it the main challenge).
Provision of other qualifications at post-16 (Chapter 4)
Around one-eighth (12%) of institutions were offering apprenticeships, covering almost half the post-16 student population (46%). Slightly fewer (7%) offered traineeships, and these institutions accounted for around a quarter (28%) of the student population.
3 Department for Education (2010). The importance of teaching: the schools white paper 2010 4 At the time of the survey, there were two types of technical qualifications for 16-19 year olds: tech levels (level 3) and technical certificates (level 2). 5 The first T levels will be taught from 2020 (See: Department for Education (2017). Education Secretary announces first new T levels) following recommendations from the Sainsbury review (See Sainsbury D. (2016). Report of the Independent Panel on Technical Education, Department for Business, Innovation & Skills and Department for Education)
9
A further one-eighth (13%) of institutions offered supported internships, covering just over a quarter (28%) of the population of post-16 learners. Half (51%) of general colleges and a quarter (24%) of special schools offered supported internships to post-16 learners.
Applied General qualifications are level 3 qualifications that were introduced alongside technical qualifications after the consultation on the reform of vocational education6. Over half of institutions were offering these qualifications (55%), covering three-quarters of the population of post-16 learners (76%).
Around four-fifths (78%) of institutions offered GCSEs to post-16 learners; 77% offered English and mathematics GCSEs and 20% offered GCSEs in other subjects.
Post-16 mathematics: level 3 qualifications (Chapter 5)
In recent years, the Government has taken steps to increase participation in level 3 mathematics qualifications among post-16 learners, leading to the introduction of Core Maths qualifications in 2014.
The majority of institutions that offered A level qualifications offered A level mathematics and A level further mathematics (97% and 75% respectively). It was less common for these institutions to offer AS level mathematics (51%) and AS level further mathematics (44%).
One-third of institutions that offered level 3 qualifications offered Core Maths in 2016-17 and planned to continue to offer it in the following academic year (34%).
Careers education (Chapter 6)
Institutions were asked about different ways they may provide careers education to post-16 learners which were informed by the Gatsby Foundation’s Benchmarks for providing good career guidance7. Most institutions were providing personal careers guidance, i.e. one-to-one careers sessions (93%) and said that they have an identified lead individual with responsibility for overseeing the institution’s careers programme (91%). They were less likely to report that the institution provided learners with at least one meaningful encounter with an employer in each academic year (52%).
Institutions provided careers education in a range of different ways. The most frequently reported methods of provision were through themed days and events (90%), one-to-one sessions (89%) and as part of tutorials (86%). Around two-thirds integrated
6 Department for Education (2013). Government proposals to reform vocational qualifications for 16- to 19-year-olds 7 Holman J. (2014). Good Career Guidance, The Gatsby Charity Foundation
10
careers education across the curriculum, or delivered it as part of the PSHE syllabus (66% and 65% respectively).
Mental health (Chapter 7)
Institutions were asked about the extent to which they agreed or disagreed with a number of statements relating to the ability of their staff to support students with mental health issues.
They were reasonably confident about supporting learners with mental health issues to use resources within the institution (90% agreed most staff knew what support the institution offers and how learners can access it and 81% agreed most staff were equipped to identify behaviour that may be linked to a mental health issue), but were less confident about accessing specialist support. Around six in ten (61%) institutions felt most staff had good access to mental health professionals if they need specialist advice on learners’ mental health (30% disagreed) and just over half (53%) reported that most staff knew how to help learners access specialist support outside of the institution (26% disagreed and 20% neither agreed nor disagreed).
SEN Support (Chapter 8)
The majority (83%) of institutions (excluding special schools) had learners who they identified as requiring special educational needs (SEN) support, i.e. those that were considered to have a special educational need and therefore did not have a statement of SEN, Learning Difficulty Assessment (LDA) or an Education, Health and Care (EHC) plan. This may have been because these learners did not require a statement of SEN, LDA, or EHC Plan, or because they were waiting for an assessment.
The vast majority of institutions with post-16 learners requiring SEN support were confident in their abilities to identify and meet their needs, with over nine in ten agreeing that: staff were equipped to identify learners who are making less than expected progress and may have SEN/a disability; staff know when to engage the SENCO or access other support, and; institutions were confident that when support is put in place, it based on evidence of what will work best and enables learners to make progress towards good outcomes.
Teacher workloads and post-16 budget management (Chapter 9)
Nearly all schools had taken some action to evaluate and reduce unnecessary teacher workload (94%). Most had used advice from Ofsted (e.g. Ofsted handbook or #OfstedMyths) to change practice in the school (81%). The next most commonly reported actions were carrying out a workload survey of staff (47%), actively addressing the recommendations for schools in DfE’s independent reports on marking, planning and
11
resources and/or data management (44%)8 and using the independent reports to review current policies (38%).
Small proportions of institutions reported that these actions had reduced teacher workloads (between 23% and 34% for the top 4 most commonly reported actions).
Schools9 were also asked about the actions they had undertaken to help the institution get the most out of their post-16 budget. Reviewing staff structures (83%) and reviewing how they buy goods and services (76%) were the two most commonly reported activities, followed by sharing resources (including staff) with other schools (65%). Reviewing staff structures and sharing resources (including staff) with other schools were the activities considered the most useful (both mentioned by 26%).
8 Since 2014, three independent teacher workload review groups have been established to offer advice on the three biggest areas that teachers say can lead to unnecessary workload: marking policy, planning and teaching resources, and data management. See Department for Education (2017). Reducing teacher workload. 9 Schools with sixth forms, special schools and studio schools.
12
1. Introduction
1.1 Introduction There has been a large-scale transformation of post-16 education in recent years resulting in reforms to AS and A level qualifications, the introduction of new technical and applied general qualifications and changes to careers education.
The purpose of this research was to gain a better understanding of post-16 institutions’ views about these changes and explore what they are doing to ensure learners are prepared for adult life.
This was the fifth survey in the Post-16 Institutions Omnibus series which has been delivered biannually since June 2015 to allow the Department for Education (DfE) to track changes over time. The fifth wave was conducted between June and July 2017.
1.2 Methodology This report presents the findings of 501 interviews conducted with post-16 institutions10 in England between June and July 201711.
The survey was conducted via telephone. The majority of interviews took place with Headteachers/Principals, Assistant Heads/Principals, or Heads of post-16 education (see Table 1.1).
Table 1.1 Respondent job title
Job title % of completed interviews
Head / Principal 18%
Assistant Head / Principal 27%
Director / Head of post-16 education 33%
Assistant Director / Head of post-16 education 6%
Curriculum Co-ordinator / student services 12%
Other teacher 4%
10 Institutions in scope of the study were state-funded institutions providing post-16 education. This included colleges (including specialist colleges), sixth form colleges, schools with sixth forms (including maintained, academies, free schools and special schools), studio schools and university technical colleges. The study excluded commercial and charitable providers, higher education providers, independent specialist providers and non-maintained special schools. 11 This is equivalent to 54% of the eligible sample (see Annex A).

13
Prior to the main fieldwork, the questionnaire went through two development phases to ensure it was relevant, engaging and consistently understood by the range of different institutions offering post-16 education:
• In the first phase, eight cognitive interviews were conducted by telephone. After running through the survey, respondents were asked follow-up questions to examine their understanding of the questions and the reasons for their responses.
• Following this, the questionnaire was piloted with 20 institutions. These telephone interviews were monitored to check the flow of the interview, that respondents understood the questions, and that the interview length was at the intended duration.
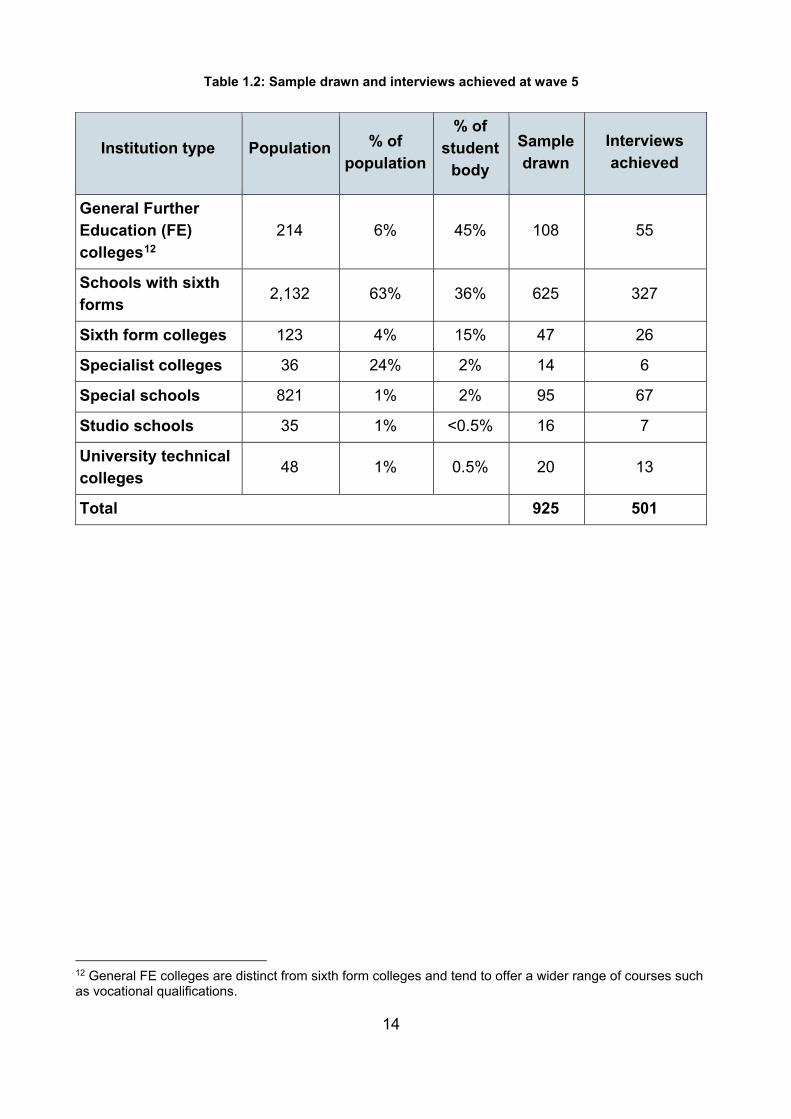
Sampling and weighting
The sample for the survey was drawn from Edubase, DfE’s register of educational establishments in England. A sample of 925 post-16 institutions was drawn, and 501 interviews were achieved from the 920 institutions that were eligible (a response rate of 54%, see Annex A for further information).
The sample was stratified to cover all of the different types of post-16 institutions, including small subgroups such as studio schools and specialist colleges (see Table 1.2).
Two different weights were applied to the final data (see Annex B for further details):
• A primary weight was applied to ensure that the results were representative of the entire population of post-16 institutions and to correct for the over-sampling of small-subgroups mentioned above (such as studio schools).
• A secondary weight was also applied to the data to make it representative of the proportion of learners attending each institution type.
Data with this secondary weight is reported on throughout the report where it changes the interpretation of the results (for example, when a low proportion of institutions may have had a practice in place but where these institutions still cover a large proportion of the student population).
Throughout the report, subgroup differences are only reported where the difference is statistically significant at the 95% confidence level.
14
Table 1.2: Sample drawn and interviews achieved at wave 5
12 General FE colleges are distinct from sixth form colleges and tend to offer a wider range of courses such as vocational qualifications.
Institution type Population % of population
% of student
body
Sample drawn
Interviews achieved
General Further Education (FE) colleges12
214 6% 45% 108 55
Schools with sixth forms 2,132 63% 36% 625 327
Sixth form colleges 123 4% 15% 47 26
Specialist colleges 36 24% 2% 14 6
Special schools 821 1% 2% 95 67
Studio schools 35 1% <0.5% 16 7
University technical colleges 48 1% 0.5% 20 13
Total 925 501
15
2. AS level and A level reform This chapter assesses the provision of A level qualifications in post-16 institutions and how confident institutions feel about teaching the third wave of new AS and A levels13.
AS level and A level qualifications in England are being reformed in four phases to ensure they better prepare learners for higher education or employment14. The first and second waves of new AS level and A level qualifications were introduced in September 2015 and September 2016 respectively. Teaching of the third wave of new AS and A level qualifications commenced in September 2017. The fourth and final wave of new AS level and A level qualifications is due to be introduced in September 201815.
As part of the reforms, AS level and A level qualifications have been decoupled. This means that an AS level no longer counts towards an A level. The new AS levels and A level qualifications will be linear with all external assessment taking place at the end of the course, and most subjects will be assessed by examination rather than coursework.
A levels were taught by three-quarters (76%) of institutions, and these institutions were attended by four-fifths (80%) of the population of post-16 learners. This figure is consistent with the results at wave 3 of the Omnibus, where 76% of institutions taught A levels covering 79% of the post-16 learner population. Nearly all schools with sixth forms offered A levels (99%), compared to three-fifths of general colleges (62%) and just 1% of special schools.
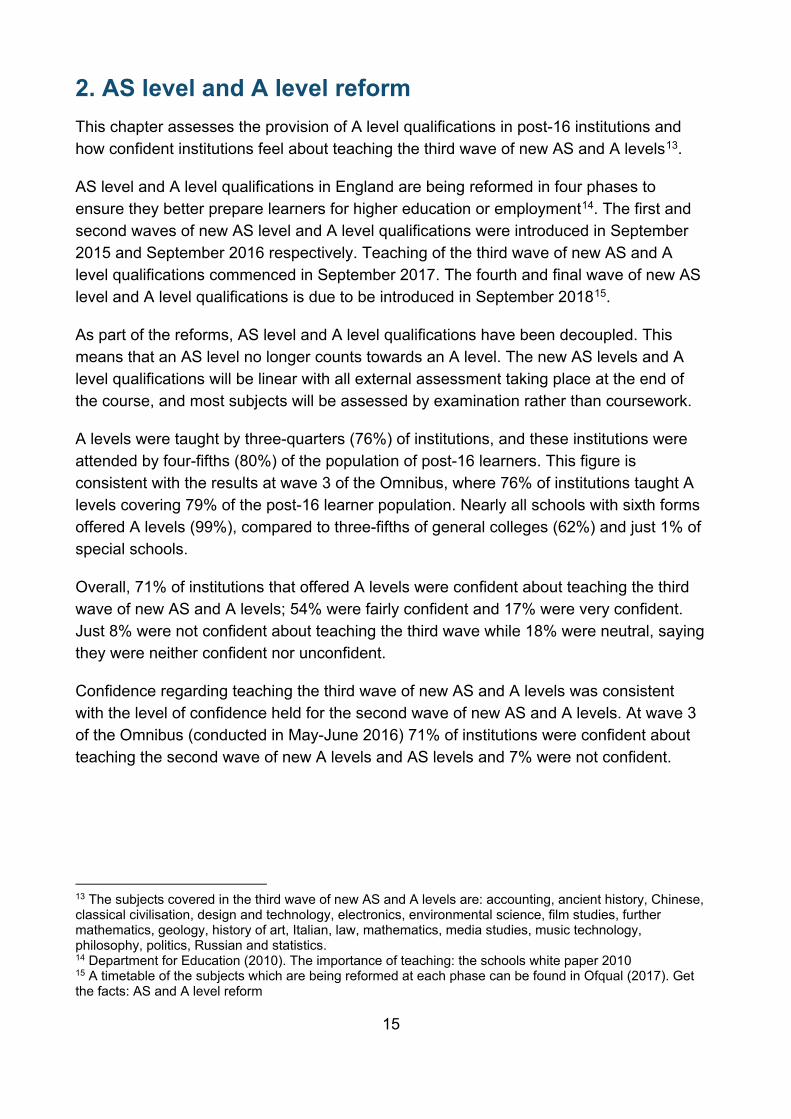
Overall, 71% of institutions that offered A levels were confident about teaching the third wave of new AS and A levels; 54% were fairly confident and 17% were very confident. Just 8% were not confident about teaching the third wave while 18% were neutral, saying they were neither confident nor unconfident.
Confidence regarding teaching the third wave of new AS and A levels was consistent with the level of confidence held for the second wave of new AS and A levels. At wave 3 of the Omnibus (conducted in May-June 2016) 71% of institutions were confident about teaching the second wave of new A levels and AS levels and 7% were not confident.
13 The subjects covered in the third wave of new AS and A levels are: accounting, ancient history, Chinese, classical civilisation, design and technology, electronics, environmental science, film studies, further mathematics, geology, history of art, Italian, law, mathematics, media studies, music technology, philosophy, politics, Russian and statistics. 14 Department for Education (2010). The importance of teaching: the schools white paper 2010 15 A timetable of the subjects which are being reformed at each phase can be found in Ofqual (2017). Get the facts: AS and A level reform

16
Figure 2.1: Extent to which the institutions were confident about teaching the third wave of new AS and A levels
Institutions that were anything less than very confident about teaching the third wave of new AS and A levels were asked whether there were any specific subjects that they felt less confident about teaching.
Most of these institutions (63%) had the same level of confidence in teaching all subjects in the third wave. Among institutions that were less confident about teaching a specific subject, one-fifth (18%) were less confident about teaching mathematics and one-tenth were less confident about teaching further mathematics (9%). Other subjects that institutions were less confident about included design and technology (6%), media studies (6%) and politics (5%).
3% 8% 18% 54% 17%
Don't know Not very confident Neither / nor Fairly confident Very confident
Base: Institutions that taught A-level qualifications (403)
71% very or quite confident
17
3. Technical and vocational education This chapter explores the provision of technical and vocational education, the ways in which employers are involved in their delivery and the perceived challenges of new technical education routes.
In 2014, the Wolf Report reported that 350,000 16 to 19 year olds were studying qualifications with ‘limited labour market value’ 16. As part of their response to this assessment, the Government introduced tech levels and technical certificates to raise standards and to make technical education more closely aligned to the needs of employers17. These are delivered alongside a range of other vocational qualifications, apprenticeships, traineeships and supported internships.
3.1 The provision of technical qualifications and vocational education Two-thirds (67%) of institutions offered technical and/or vocational qualifications, and these covered four-fifths (80%) of the population of post-16 learners. Nearly all (66%) of these institutions offered vocational qualifications and 20% offered technical qualifications. The vast majority (99%) of institutions that offered technical qualifications offered vocational qualifications as well.
General colleges (96%) were more likely to offer vocational qualifications compared to schools with sixth forms (70%) and special schools (42%). Additionally, vocational qualifications were more likely to be offered by institutions in the most deprived quintile than those in least deprived quintile (73% compared to 53%).
Of the institutions that offered technical qualifications, four-fifths (69%) offered tech levels and three-quarters (74%) offered technical certificates. One-fifth (44%) offered both tech levels and technical certificates.
Around two-fifths (37%) of institutions that offered either technical or vocational education had plans to increase their provision. General colleges (74%) were more likely than special schools (50%) and schools with sixth forms (29%) to have such plans.
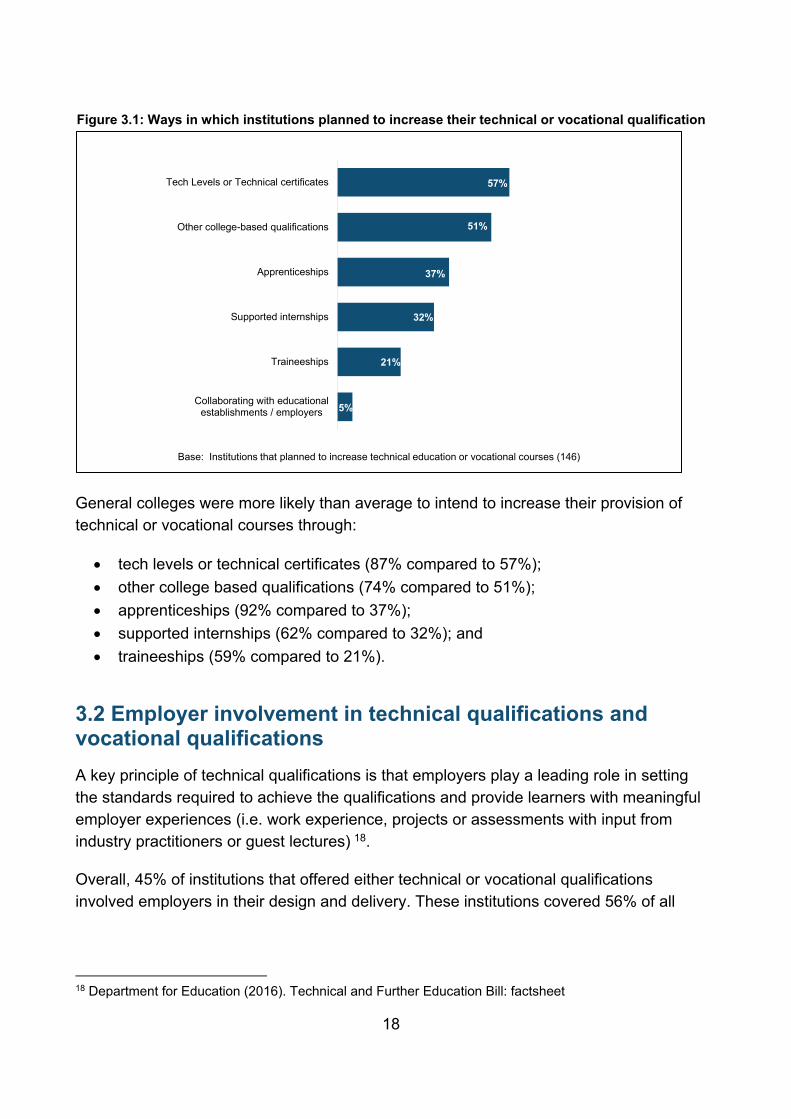
Institutions that planned to increase their provision were asked how they intended to do this. As presented in Figure 3.1, tech levels or technical certificates were the most commonly cited method (57%) followed closely by college-based approaches (51%).
16 Wolf A. (2011). Review of Vocational Education, Department for Education 17 At the time of the survey, there were two types of technical education qualifications for 16-19 year olds: tech levels (level 3) and technical certificates (level 2).
18
Figure 3.1: Ways in which institutions planned to increase their technical or vocational qualification
General colleges were more likely than average to intend to increase their provision of technical or vocational courses through:
• tech levels or technical certificates (87% compared to 57%); • other college based qualifications (74% compared to 51%); • apprenticeships (92% compared to 37%); • supported internships (62% compared to 32%); and • traineeships (59% compared to 21%).
3.2 Employer involvement in technical qualifications and vocational qualifications A key principle of technical qualifications is that employers play a leading role in setting the standards required to achieve the qualifications and provide learners with meaningful employer experiences (i.e. work experience, projects or assessments with input from industry practitioners or guest lectures) 18.
Overall, 45% of institutions that offered either technical or vocational qualifications involved employers in their design and delivery. These institutions covered 56% of all
18 Department for Education (2016). Technical and Further Education Bill: factsheet
5%
21%
32%
37%
51%
57%
Collaborating with educationalestablishments / employers
Traineeships
Supported internships
Apprenticeships
Other college-based qualifications
Tech Levels or Technical certificates
Base: Institutions that planned to increase technical education or vocational courses (146)

19
post-16 learners. Among institutions that specifically offered technical qualifications courses, the proportion of institutions that involved employers increased to 62%.
General colleges (85%) that offered technical or vocational qualifications were more likely to involve employers in design and delivery of courses than schools with sixth forms (38%) and special schools (33%).
Figure 3.2 presents the specific ways employers are involved in technical and vocational qualifications. Nearly all institutions (94%) reported that employers provide course-related work placements and around two-thirds with employer involvement said these employers set projects for learners (69%), provide the use of their facilities (65%) or deliver course content (61%).
General colleges were more likely than average to report involving employers in setting projects for learners (96% compared to 69%), designing curriculum (82% compared to 54%) and assessments (69% compared to 37%).
Figure 3.2: Employer involvement in the design and delivery of technical qualifications and vocational qualifications
There was some variation in employer involvement depending on whether institutions offered technical or vocational qualifications. Institutions that offered the former were more likely to have employers set projects for learners (78% compared to 69%) and design the curriculum (69% compared to 53%).
2%
3%
14%
37%
54%
61%
65%
69%
94%
* Involved in events
* Involved in focus groups or forums
* Offer mentoring and advice
Involved in assessment
Involved in curriculum design
Deliver course content (e.g. lectures,seminars)
Provide the use of their facilities
Set projects for students
Provide course-related work placementsfor our students
Base: Institutions that involve employers in the design and delivery of their technical education or vocational courses (185)Note: At this question respondents were asked to select all options that applied from a pre-coded list. An asterisk has been used to
indicate unprompted other responses’
20
3.3 Technical education routes Following the recommendation of the Sainsbury Panel, the government has announced its intention to replace current technical/vocational qualifications with 15 technical routes into skilled employment, based on standards set by employers 19 20. These routes will cover both apprenticeships and new T level programmes21. The first teaching of T levels will begin in September 2020.
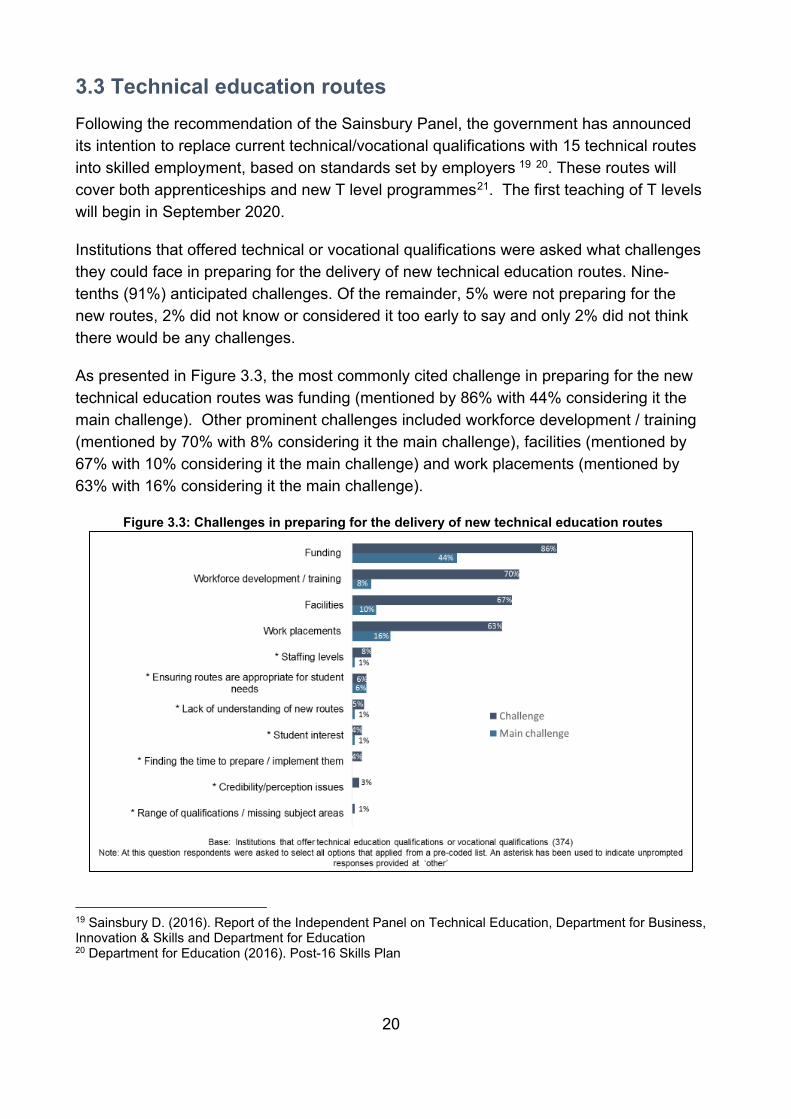
Institutions that offered technical or vocational qualifications were asked what challenges they could face in preparing for the delivery of new technical education routes. Nine-tenths (91%) anticipated challenges. Of the remainder, 5% were not preparing for the new routes, 2% did not know or considered it too early to say and only 2% did not think there would be any challenges.
As presented in Figure 3.3, the most commonly cited challenge in preparing for the new technical education routes was funding (mentioned by 86% with 44% considering it the main challenge). Other prominent challenges included workforce development / training (mentioned by 70% with 8% considering it the main challenge), facilities (mentioned by 67% with 10% considering it the main challenge) and work placements (mentioned by 63% with 16% considering it the main challenge).
Figure 3.3: Challenges in preparing for the delivery of new technical education routes
19 Sainsbury D. (2016). Report of the Independent Panel on Technical Education, Department for Business, Innovation & Skills and Department for Education 20 Department for Education (2016). Post-16 Skills Plan
21
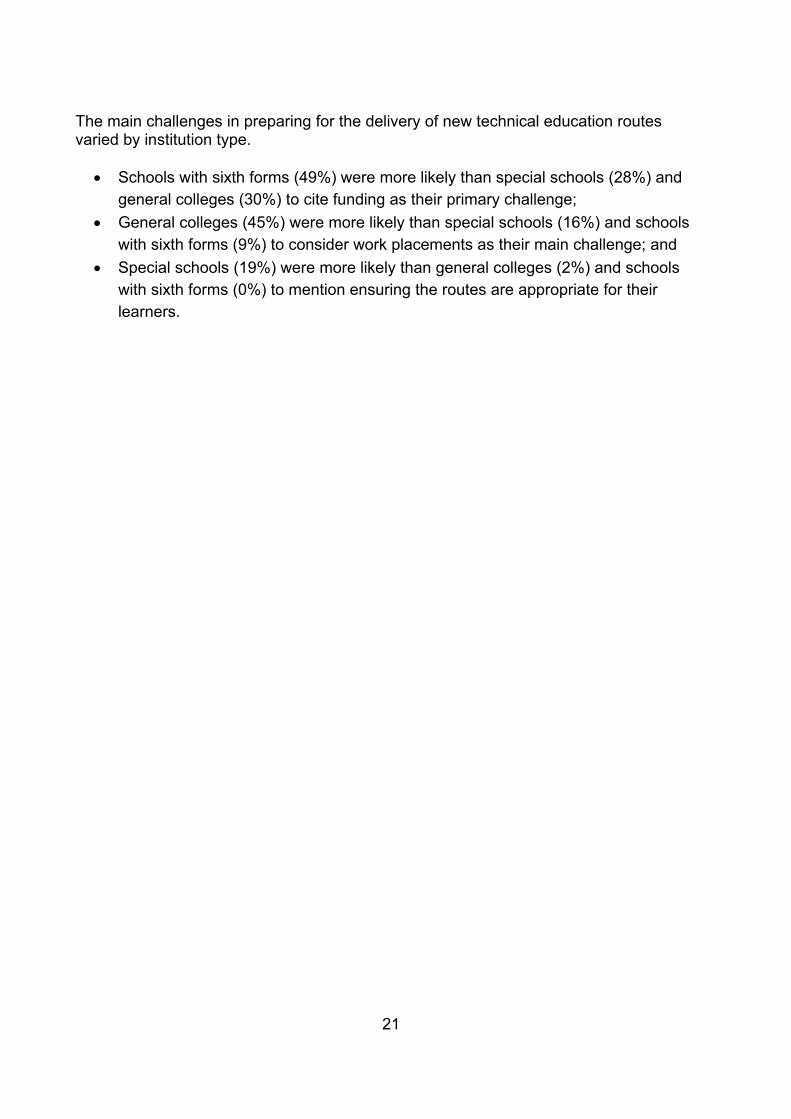
The main challenges in preparing for the delivery of new technical education routes varied by institution type.
• Schools with sixth forms (49%) were more likely than special schools (28%) and general colleges (30%) to cite funding as their primary challenge;
• General colleges (45%) were more likely than special schools (16%) and schools with sixth forms (9%) to consider work placements as their main challenge; and
• Special schools (19%) were more likely than general colleges (2%) and schools with sixth forms (0%) to mention ensuring the routes are appropriate for their learners.

22
4. Provision of other qualifications at post-16 This chapter explores the provision of apprenticeships and traineeships, supported internships, Applied General qualifications and GCSEs.
4.1 Apprenticeships and traineeships Apprenticeships combine practical training in the workplace with study and last between one and four years. Since the publication of the Richard Review, apprenticeships have been subject to a programme of reform to raise their quality and widen participation 22 23.
Traineeships were introduced in August 2013 and are designed to help young people develop the skills needed for an apprenticeship and/or employment. Traineeships last between six weeks and six months and include: a work experience placement with an employer; work preparation training; and English and mathematics provision where required24.
Around one-eighth (12%) of institutions were offering apprenticeships, covering almost half the post-16 student population (46%). Slightly fewer (7%) offered traineeships, and these institutions accounted for around a quarter (28%) of the student population. The proportion of institutions that offered apprenticeships and traineeships was consistent with wave 4 of the Omnibus (12% and 8% respectively).
General colleges were more likely to be offering either apprenticeships (89%) or traineeships (53%) compared to less than one-tenth of schools with sixth forms and special schools (see table 4.1).
Table 4.1: Provision of apprenticeships and traineeships, by institution
Institution type Proportion offering apprenticeships
Proportion offering traineeships
General colleges 89% 53%
Special schools 6% 3%
Schools with sixth forms 5% 2%
All institutions 12% 7% Base: all institutions (501)
22 Department for Business, Innovation & Skills (2012). The Richard Review of Apprenticeships 23 Department for Education (2017). Apprenticeships Reform Programme: Benefits Realisation 24 Fitzpatrick A., Coleman E., Shanahan M., Coleman N., & Cordes-Kantar A. (2017). Traineeships: Year Two Process Evaluation, Department for Education
23
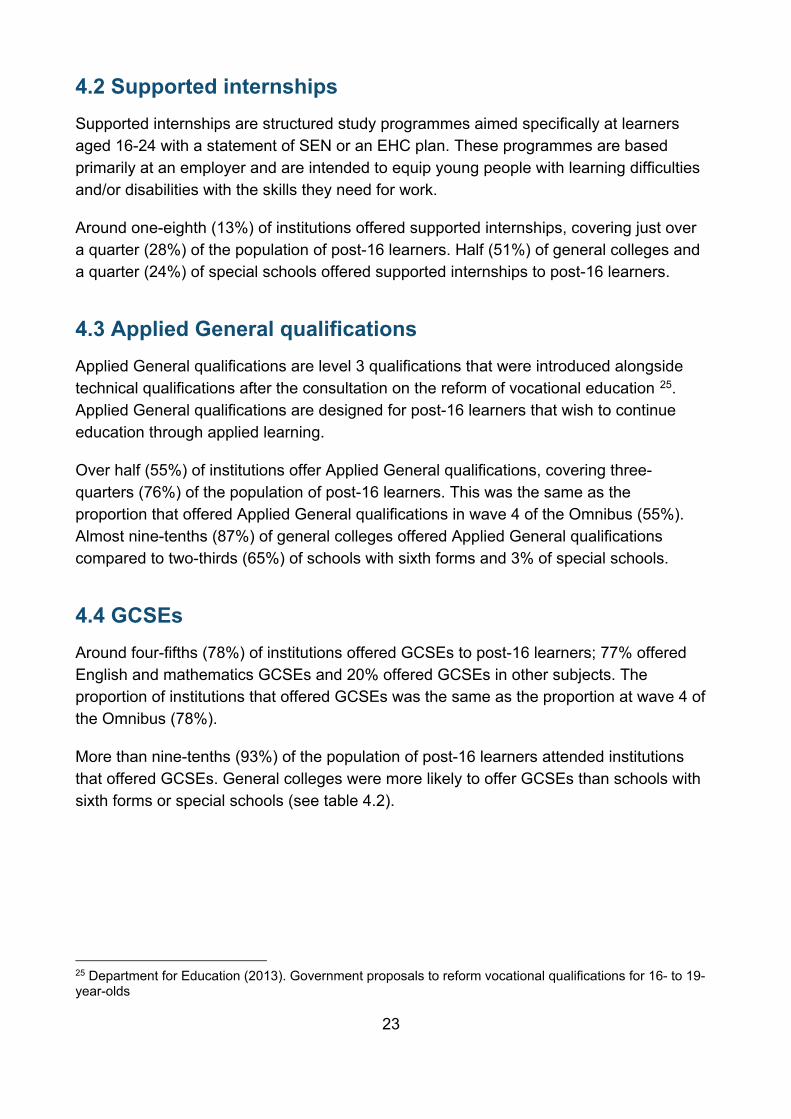
4.2 Supported internships Supported internships are structured study programmes aimed specifically at learners aged 16-24 with a statement of SEN or an EHC plan. These programmes are based primarily at an employer and are intended to equip young people with learning difficulties and/or disabilities with the skills they need for work.
Around one-eighth (13%) of institutions offered supported internships, covering just over a quarter (28%) of the population of post-16 learners. Half (51%) of general colleges and a quarter (24%) of special schools offered supported internships to post-16 learners.
4.3 Applied General qualifications Applied General qualifications are level 3 qualifications that were introduced alongside technical qualifications after the consultation on the reform of vocational education 25.
Applied General qualifications are designed for post-16 learners that wish to continue education through applied learning.
Over half (55%) of institutions offer Applied General qualifications, covering three-quarters (76%) of the population of post-16 learners. This was the same as the proportion that offered Applied General qualifications in wave 4 of the Omnibus (55%). Almost nine-tenths (87%) of general colleges offered Applied General qualifications compared to two-thirds (65%) of schools with sixth forms and 3% of special schools.
4.4 GCSEs Around four-fifths (78%) of institutions offered GCSEs to post-16 learners; 77% offered English and mathematics GCSEs and 20% offered GCSEs in other subjects. The proportion of institutions that offered GCSEs was the same as the proportion at wave 4 of the Omnibus (78%).
More than nine-tenths (93%) of the population of post-16 learners attended institutions that offered GCSEs. General colleges were more likely to offer GCSEs than schools with sixth forms or special schools (see table 4.2).
25 Department for Education (2013). Government proposals to reform vocational qualifications for 16- to 19-year-olds

24
Table 4.2: Provision of GCSEs, by institution
Institution type Proportion offering
English and mathematics
Proportion offering subjects other than
English and mathematics
General colleges 98% 60%
Schools with sixth forms 90% 17%
Special schools 21% 12%
All institutions 77% 20% Base: all institutions (501)

25
5. Post-16 mathematics: level 3 qualifications This chapter examines the provision of AS level and A level mathematics qualifications and Core Maths in post-16 institutions.
In recent years, the Government has taken steps to increase participation in level 3 mathematics qualifications among post-16 learners. As part of this, Core Maths qualifications were introduced in 2014. These qualifications are designed to encourage those that achieve a C or above in GCSE mathematics, but choose not to study the subject at AS level or A level, to study mathematics at level 3.
Participation in A level mathematics increased between 2010 and 2016 by 17%26. However, despite an increase in take up the proportion of post-16 learners studying AS and A level mathematics is still low compared to other developed economies27. Following the publication of the Smith Review of post-16 mathematics, the Government has launched the Level 3 Mathematics Support Programme to enhance the capacity of institutions to deliver level 3 qualifications in mathematics.
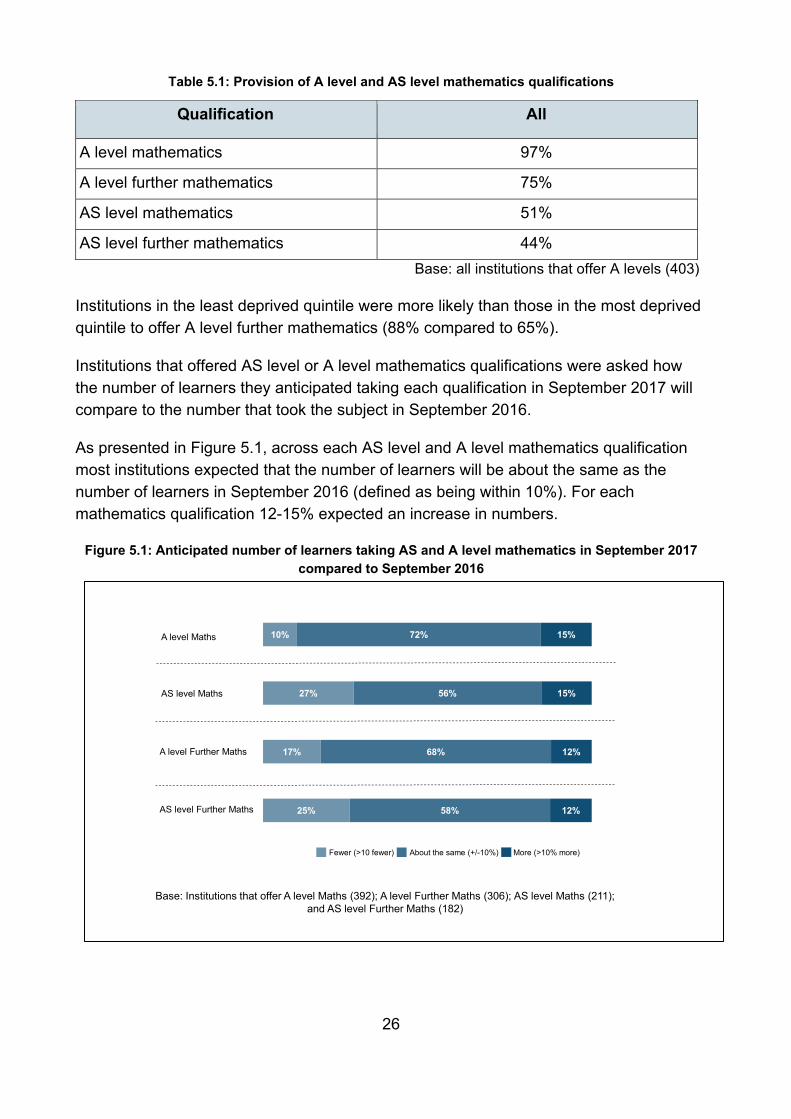
5.1 AS level and A level mathematics and further mathematics Ninety-eight percent of institutions that offered A levels offered AS level or A level mathematics qualifications. Almost all institutions that offered A level qualifications offered A level mathematics (97%), while half (51%) offered AS level mathematics. Three-quarters (75%) of institutions offered A level further mathematics, while two-fifths (44%) offered AS level further mathematics.
Schools with sixth forms offering A levels were more likely than other types of post-16 institutions to offer A level mathematics (98% compared to 92%), but were less likely than other institutions to offer mathematics courses at AS level (see Table 5.1).
26 Department for Education (2017). Statistics: 16 to 19 attainment 27 Smith A. (2017). Report of Professor Sir Adrian Smith’s review of post-16 mathematics, Department for Education
26
Table 5.1: Provision of A level and AS level mathematics qualifications
Qualification All
A level mathematics 97%
A level further mathematics 75%
AS level mathematics 51%
AS level further mathematics 44% Base: all institutions that offer A levels (403)
Institutions in the least deprived quintile were more likely than those in the most deprived quintile to offer A level further mathematics (88% compared to 65%).
Institutions that offered AS level or A level mathematics qualifications were asked how the number of learners they anticipated taking each qualification in September 2017 will compare to the number that took the subject in September 2016.
As presented in Figure 5.1, across each AS level and A level mathematics qualification most institutions expected that the number of learners will be about the same as the number of learners in September 2016 (defined as being within 10%). For each mathematics qualification 12-15% expected an increase in numbers.
Figure 5.1: Anticipated number of learners taking AS and A level mathematics in September 2017 compared to September 2016
25%
17%
27%
10%
58%
68%
56%
72%
12%
12%
15%
15%A level Maths
A level Further Maths
AS level Maths
AS level Further Maths
Base: Institutions that offer A level Maths (392); A level Further Maths (306); AS level Maths (211); and AS level Further Maths (182)
Fewer (>10 fewer) About the same (+/-10%) More (>10% more)
27
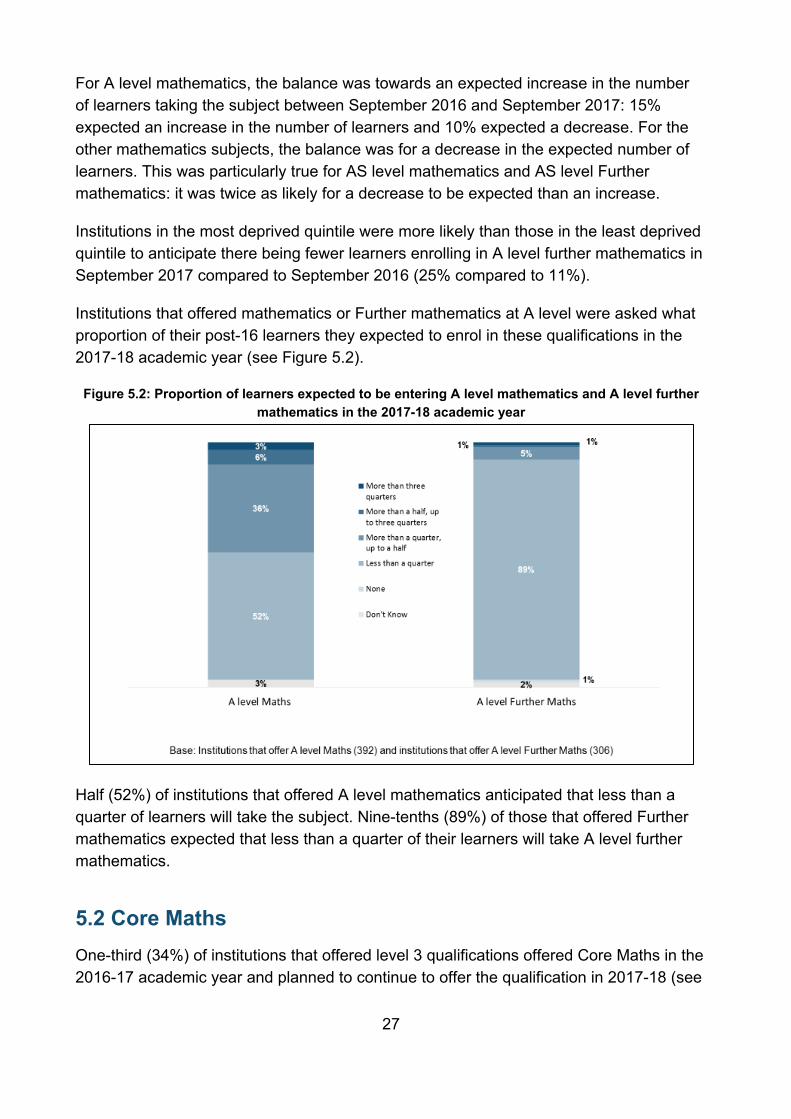
For A level mathematics, the balance was towards an expected increase in the number of learners taking the subject between September 2016 and September 2017: 15% expected an increase in the number of learners and 10% expected a decrease. For the other mathematics subjects, the balance was for a decrease in the expected number of learners. This was particularly true for AS level mathematics and AS level Further mathematics: it was twice as likely for a decrease to be expected than an increase.
Institutions in the most deprived quintile were more likely than those in the least deprived quintile to anticipate there being fewer learners enrolling in A level further mathematics in September 2017 compared to September 2016 (25% compared to 11%).
Institutions that offered mathematics or Further mathematics at A level were asked what proportion of their post-16 learners they expected to enrol in these qualifications in the 2017-18 academic year (see Figure 5.2).
Figure 5.2: Proportion of learners expected to be entering A level mathematics and A level further mathematics in the 2017-18 academic year
Half (52%) of institutions that offered A level mathematics anticipated that less than a quarter of learners will take the subject. Nine-tenths (89%) of those that offered Further mathematics expected that less than a quarter of their learners will take A level further mathematics.
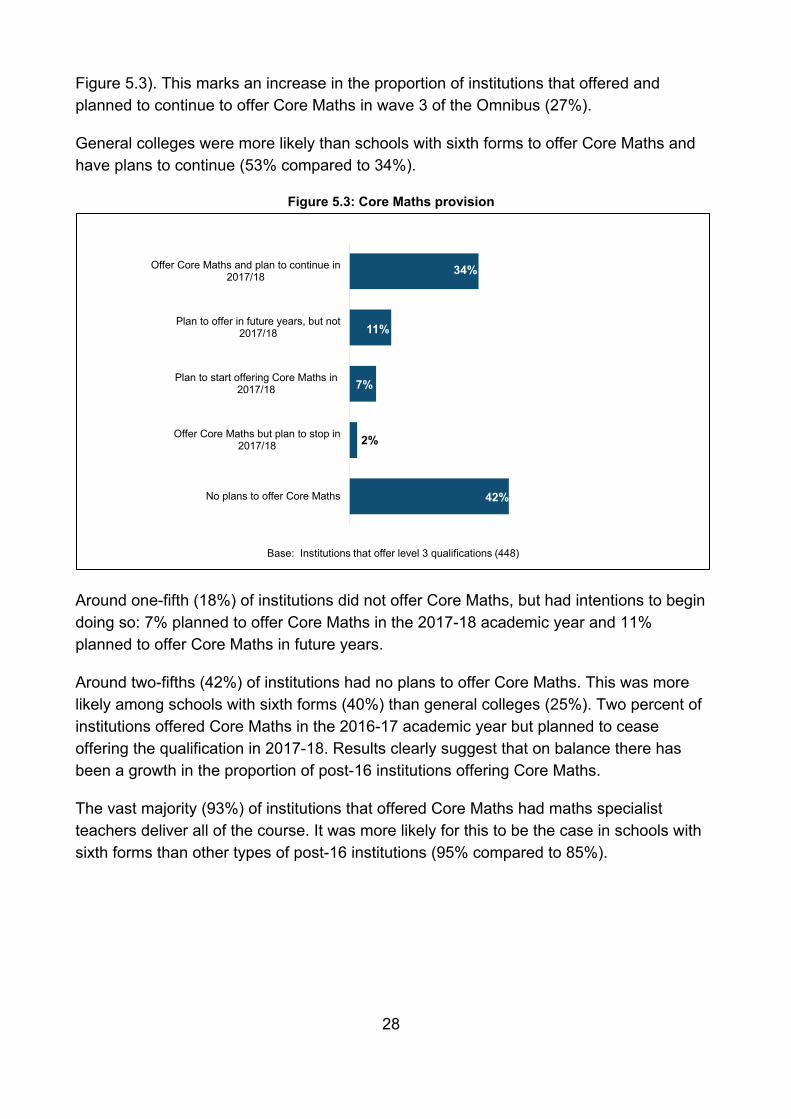
5.2 Core Maths One-third (34%) of institutions that offered level 3 qualifications offered Core Maths in the 2016-17 academic year and planned to continue to offer the qualification in 2017-18 (see
28
Figure 5.3). This marks an increase in the proportion of institutions that offered and planned to continue to offer Core Maths in wave 3 of the Omnibus (27%).
General colleges were more likely than schools with sixth forms to offer Core Maths and have plans to continue (53% compared to 34%).
Figure 5.3: Core Maths provision
Around one-fifth (18%) of institutions did not offer Core Maths, but had intentions to begin doing so: 7% planned to offer Core Maths in the 2017-18 academic year and 11% planned to offer Core Maths in future years.
Around two-fifths (42%) of institutions had no plans to offer Core Maths. This was more likely among schools with sixth forms (40%) than general colleges (25%). Two percent of institutions offered Core Maths in the 2016-17 academic year but planned to cease offering the qualification in 2017-18. Results clearly suggest that on balance there has been a growth in the proportion of post-16 institutions offering Core Maths.
The vast majority (93%) of institutions that offered Core Maths had maths specialist teachers deliver all of the course. It was more likely for this to be the case in schools with sixth forms than other types of post-16 institutions (95% compared to 85%).
42%
2%
7%
11%
34%
No plans to offer Core Maths
Offer Core Maths but plan to stop in2017/18
Plan to start offering Core Maths in2017/18
Plan to offer in future years, but not2017/18
Offer Core Maths and plan to continue in2017/18
Base: Institutions that offer level 3 qualifications (448)
29
6. Careers education This chapter focuses on the activities being undertaken by institutions to prepare their post-16 learners for employment and higher education. It explores how careers education is provided, who it is provided by and ways in which institutions work with employers.
In recent years, there has been an increased emphasis on the need to deliver high quality careers education. The Post-16 Skills Plan, published in 2016, set out a series of reforms to careers education and guidance to ensure that it is embedded in the curriculum and involves collaboration with employers and other partners28. Additionally, the Careers and Enterprise Company was established in 2014 to link employers with schools and colleges and improve opportunities for young people to learn about the world of work.
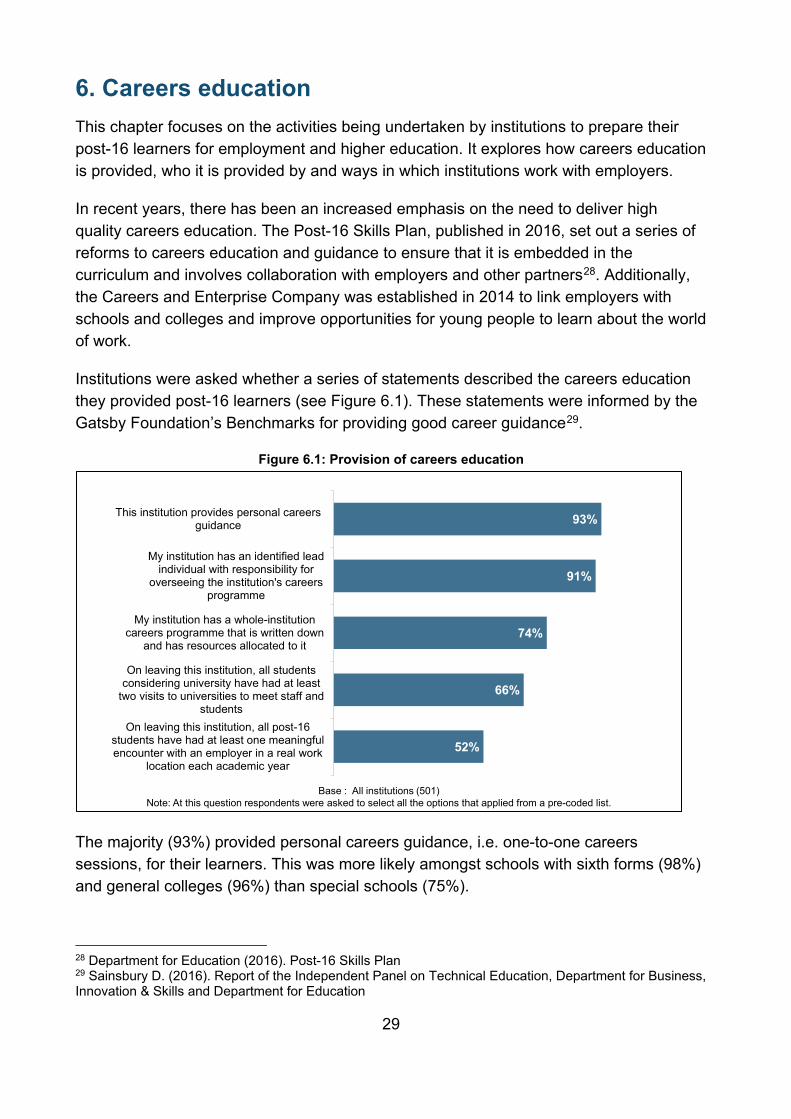
Institutions were asked whether a series of statements described the careers education they provided post-16 learners (see Figure 6.1). These statements were informed by the Gatsby Foundation’s Benchmarks for providing good career guidance29.
Figure 6.1: Provision of careers education
The majority (93%) provided personal careers guidance, i.e. one-to-one careers sessions, for their learners. This was more likely amongst schools with sixth forms (98%) and general colleges (96%) than special schools (75%).
28 Department for Education (2016). Post-16 Skills Plan 29 Sainsbury D. (2016). Report of the Independent Panel on Technical Education, Department for Business, Innovation & Skills and Department for Education
52%
66%
74%
91%
93%
On leaving this institution, all post-16students have had at least one meaningfulencounter with an employer in a real work
location each academic year
On leaving this institution, all studentsconsidering university have had at least
two visits to universities to meet staff andstudents
My institution has a whole-institutioncareers programme that is written down
and has resources allocated to it
My institution has an identified leadindividual with responsibility for
overseeing the institution's careersprogramme
This institution provides personal careersguidance
Base : All institutions (501)Note: At this question respondents were asked to select all the options that applied from a pre-coded list.
30
Two-thirds (66%) of institutions provided at least two university visits for all learners considering applying for university. Schools with sixth forms (86%) were again more likely than general colleges (47%) and special schools (6%) to offer this.
Around half (52%) provided learners with at least one meaningful encounter with an employer in each academic year, rising to three-fifths (60%) amongst general colleges, and more than half (55%) amongst schools with sixth forms, this was higher than in special schools (39%).
Most institutions (91%) said that they have an identified lead individual with responsibility for overseeing the institution’s careers programme; this was more likely at schools with sixth forms (95%) than general colleges (84%) and special schools (78%).
Schools with sixth forms and general colleges were also more likely (81% and 76%) to have a whole-institution careers programme that is written down and has resources allocated to it, compared to just over half of special schools (51%).
Since wave four of the survey, there has been a decrease in the proportion of institutions reporting that they provide personal careers guidance (from 96% in wave four to 93% in wave five), and a decrease in the proportion of institutions that have a whole-institution careers programme that is written down and has resources allocated to it (from 81% to 74%).
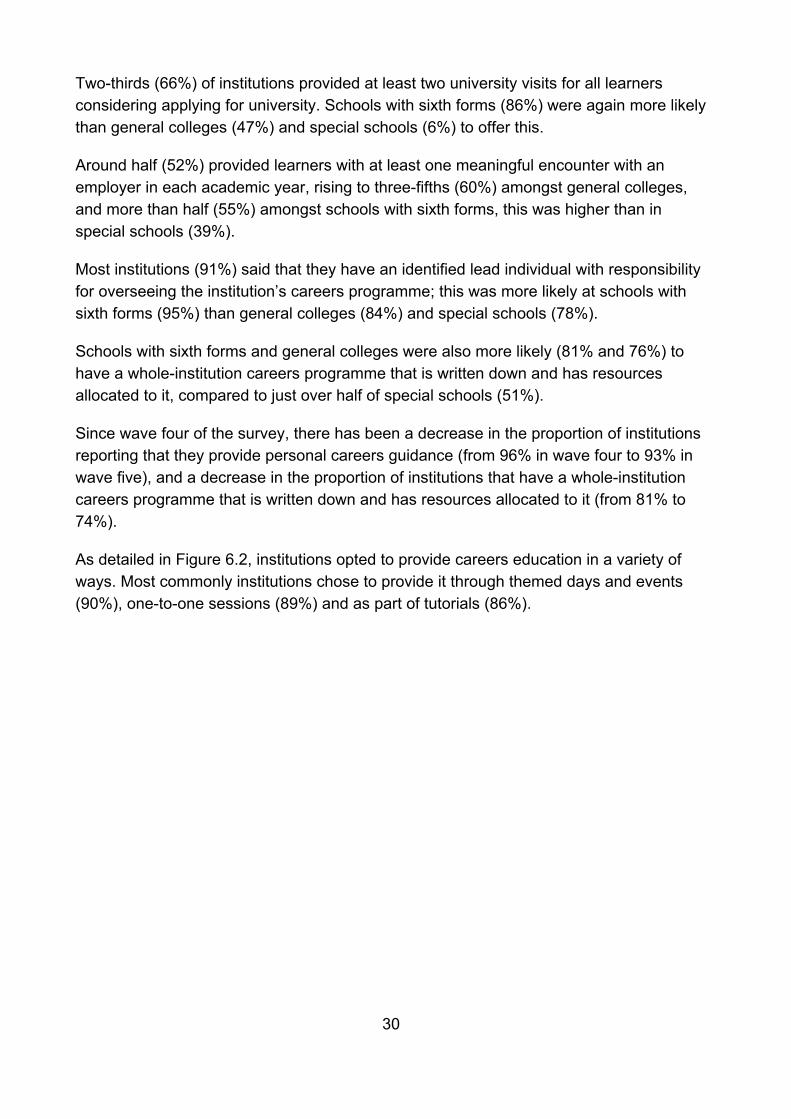
As detailed in Figure 6.2, institutions opted to provide careers education in a variety of ways. Most commonly institutions chose to provide it through themed days and events (90%), one-to-one sessions (89%) and as part of tutorials (86%).
31
Figure 6.2: Methods of careers provision
The proportion of institutions offering one-to-one sessions was lower at wave 5 of the Omnibus than at wave 3 (89% vs 93%).
Two-thirds (66%) integrated careers education across the curriculum and a similar proportion (65%) delivered it as part of the PSHE syllabus.
Schools with sixth forms were more likely than average to offer careers education through themed days and events (95%), one-to-one sessions (91%), as part of tutorials (92%) and as part of the PSHE syllabus (71%).
General colleges were more likely than average to offer careers education as part of tutorials (98%) and to have it integrated across the curriculum (93%). Special schools were more likely to work with external organisations (15%) than schools with sixth forms (5%) and general colleges (0%).
Institutions were asked which was the main way they provided careers education. The majority said that this was as part of tutorials (21%), one-to-one sessions (18%) or as part of the PSHE syllabus (18%). Although themed days and events was the most commonly mentioned method, only 11% said that this was the main way they provided careers education.
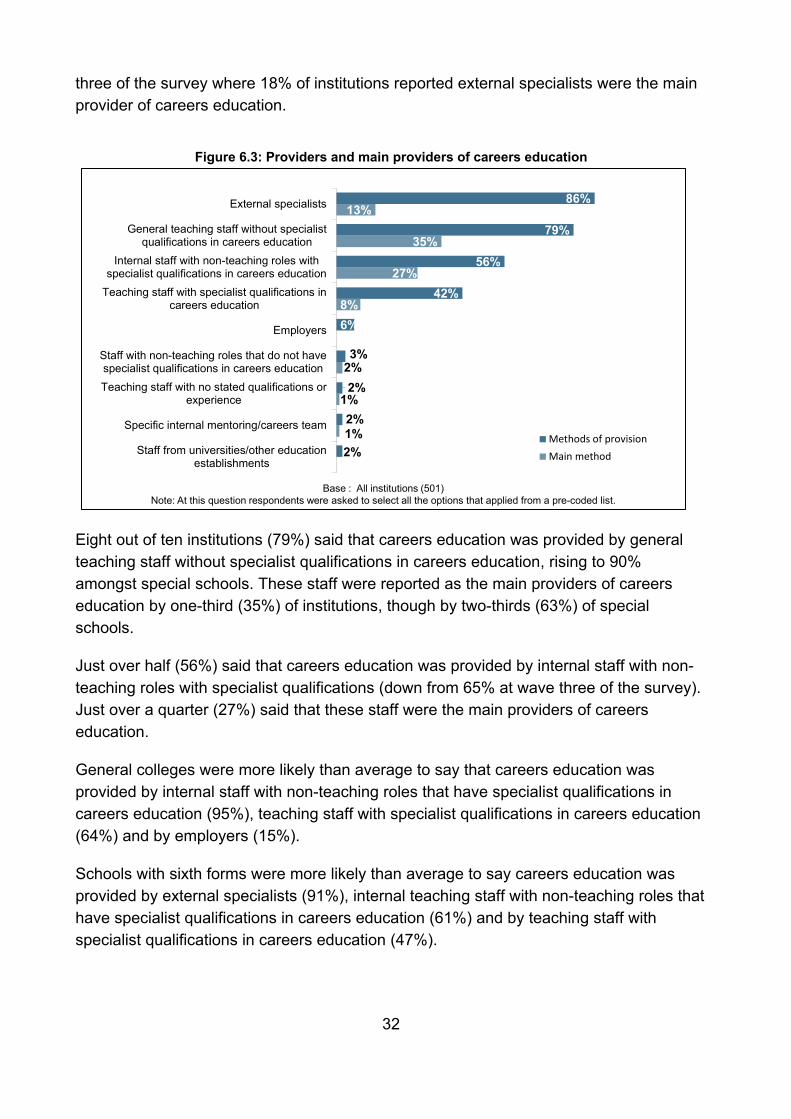
Careers education was provided by a variety of different people/organisations (see Figure 6.3). The majority (86%) of institutions said that external specialists provided careers education. However, external specialists were reported as the main provider of careers education by only 13% of institutions. This represents a decrease from wave
1%
6%
18%
7%
21%
18%
11%
7%
33%
65%
66%
86%
89%
90%
Work with external organisation
An element timetables in its own right
Part of the PSHE syllabus
Integrated across the curriculum
Part of tutorials
One-to-one sessions
Themed days and events
Methods of provisionMain method
Base : All institutions (501)Note: At this question respondents were asked to select all the options that applied from a pre-coded list.
32
three of the survey where 18% of institutions reported external specialists were the main provider of careers education.
Figure 6.3: Providers and main providers of careers education
Eight out of ten institutions (79%) said that careers education was provided by general teaching staff without specialist qualifications in careers education, rising to 90% amongst special schools. These staff were reported as the main providers of careers education by one-third (35%) of institutions, though by two-thirds (63%) of special schools.
Just over half (56%) said that careers education was provided by internal staff with non-teaching roles with specialist qualifications (down from 65% at wave three of the survey). Just over a quarter (27%) said that these staff were the main providers of careers education.
General colleges were more likely than average to say that careers education was provided by internal staff with non-teaching roles that have specialist qualifications in careers education (95%), teaching staff with specialist qualifications in careers education (64%) and by employers (15%).
Schools with sixth forms were more likely than average to say careers education was provided by external specialists (91%), internal teaching staff with non-teaching roles that have specialist qualifications in careers education (61%) and by teaching staff with specialist qualifications in careers education (47%).
1%
1%
2%
8%
27%
35%
13%
2%
2%
2%
3%
6%
42%
56%
79%
86%
Staff from universities/other educationestablishments
Specific internal mentoring/careers team
Teaching staff with no stated qualifications orexperience
Staff with non-teaching roles that do not havespecialist qualifications in careers education
Employers
Teaching staff with specialist qualifications incareers education
Internal staff with non-teaching roles withspecialist qualifications in careers education
General teaching staff without specialistqualifications in careers education
External specialists
Methods of provisionMain method
Base : All institutions (501)Note: At this question respondents were asked to select all the options that applied from a pre-coded list.
33
Special schools were more likely than average to say that careers education was provided by general teaching staff without specialist qualifications in careers education (90%).
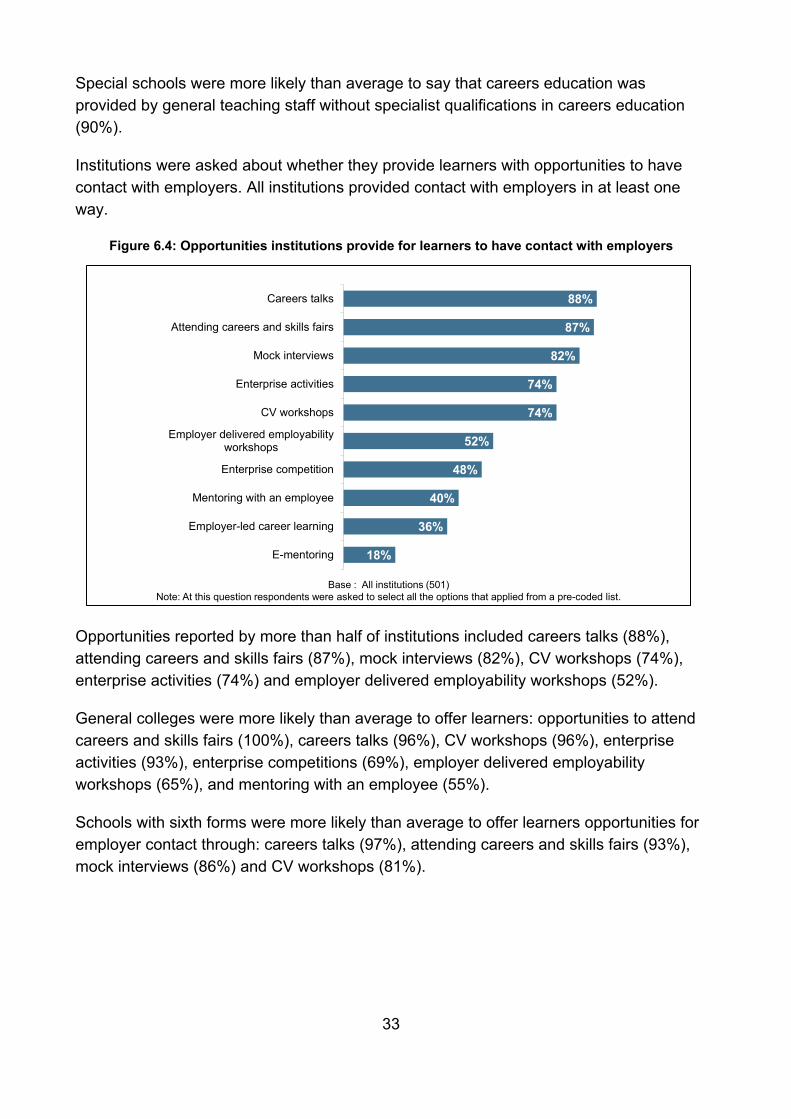
Institutions were asked about whether they provide learners with opportunities to have contact with employers. All institutions provided contact with employers in at least one way.
Figure 6.4: Opportunities institutions provide for learners to have contact with employers
Opportunities reported by more than half of institutions included careers talks (88%), attending careers and skills fairs (87%), mock interviews (82%), CV workshops (74%), enterprise activities (74%) and employer delivered employability workshops (52%).
General colleges were more likely than average to offer learners: opportunities to attend careers and skills fairs (100%), careers talks (96%), CV workshops (96%), enterprise activities (93%), enterprise competitions (69%), employer delivered employability workshops (65%), and mentoring with an employee (55%).
Schools with sixth forms were more likely than average to offer learners opportunities for employer contact through: careers talks (97%), attending careers and skills fairs (93%), mock interviews (86%) and CV workshops (81%).
18%
36%
40%
48%
52%
74%
74%
82%
87%
88%
E-mentoring
Employer-led career learning
Mentoring with an employee
Enterprise competition
Employer delivered employabilityworkshops
CV workshops
Enterprise activities
Mock interviews
Attending careers and skills fairs
Careers talks
Base : All institutions (501)Note: At this question respondents were asked to select all the options that applied from a pre-coded list.
34
7. Mental health Supporting and protecting young people and children is an explicit feature of the DfE’s strategic priorities for 2015-20 30. Improving children and young people’s mental health and wellbeing is a high priority, referenced in the Prime Minister’s January 2017 speech setting out her vision for the ‘shared society’, the Government’s role within it, and how to transform mental health support 31. DfE has committed to supporting schools and colleges ‘to promote good mental wellbeing in children, to provide a supportive environment for those experiencing problems, and to secure access to more specialist help for those who need it’32.
It is important that schools and colleges are able to establish processes to support the mental health of young people as well as to form partnerships with other service providers to enable children and young people to access appropriate specialist support. Such structures will only be effective if practitioners understand their responsibilities, have the necessary knowledge to be able to initiate support, and know how and when to refer learners to more specialist services.
Institutions were asked whether they agreed or disagreed with a number of statements relating to the ability of their staff to support students with mental health issues33. Figure 7.1 shows that institutions were generally reasonably confident in supporting students with mental health issues using resources within their institution, but were less confident about accessing specialist support.
30 Department for Education (2016). DfE strategy 2015-2020: World-class education and care 31 HM Government (2017). The shared society: Prime Minister's speech at the Charity Commission annual meeting 32 Department for Education (2016). Mental health and behaviour in schools: Departmental advice for school staff 33 These questions were asked about all learners in the institution and did not just focus on post-16 students specifically.
35
Figure 7.1: Extent to which institutions agree or disagree with statements about their ability to support students with mental health issues
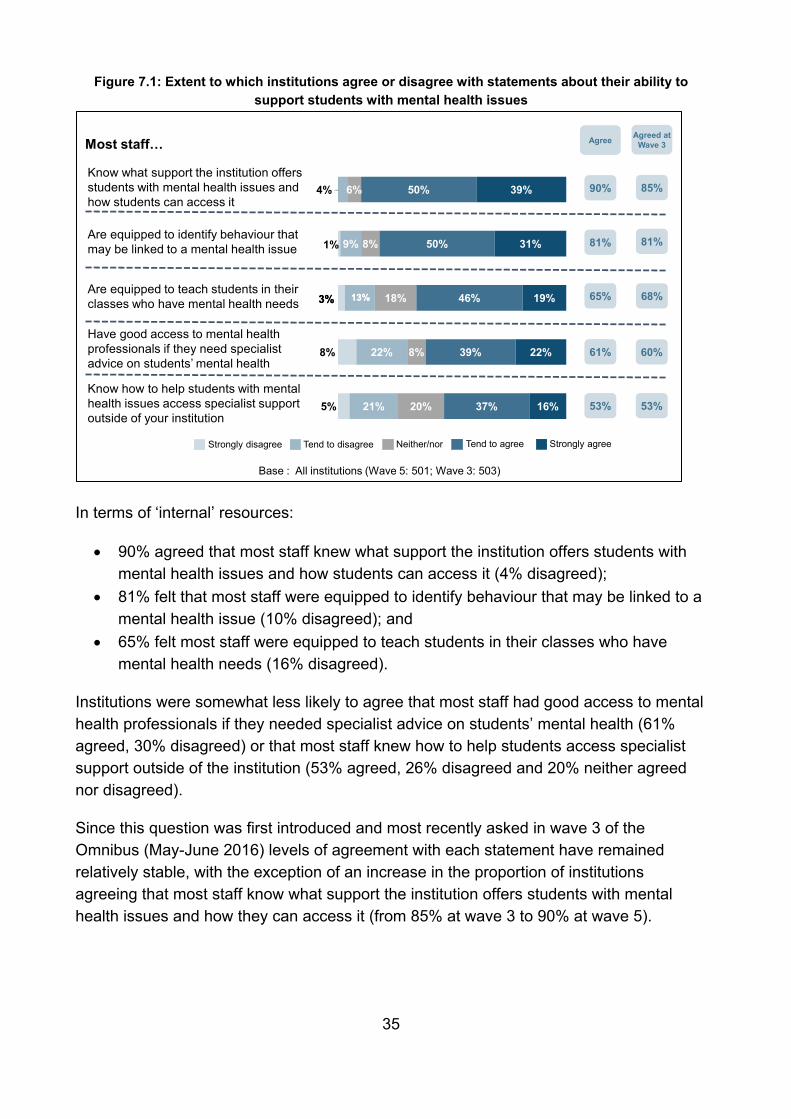
In terms of ‘internal’ resources:
• 90% agreed that most staff knew what support the institution offers students with mental health issues and how students can access it (4% disagreed);
• 81% felt that most staff were equipped to identify behaviour that may be linked to a mental health issue (10% disagreed); and
• 65% felt most staff were equipped to teach students in their classes who have mental health needs (16% disagreed).
Institutions were somewhat less likely to agree that most staff had good access to mental health professionals if they needed specialist advice on students’ mental health (61% agreed, 30% disagreed) or that most staff knew how to help students access specialist support outside of the institution (53% agreed, 26% disagreed and 20% neither agreed nor disagreed).
Since this question was first introduced and most recently asked in wave 3 of the Omnibus (May-June 2016) levels of agreement with each statement have remained relatively stable, with the exception of an increase in the proportion of institutions agreeing that most staff know what support the institution offers students with mental health issues and how they can access it (from 85% at wave 3 to 90% at wave 5).
39%
31%
19%
22%
16%
50%
50%
46%
39%
37%
6%
8%
18%
8%
20%
13%
9%
13%
22%
21%
3%
1%
3%
8%
5%
Are equipped to identify behaviour that may be linked to a mental health issue
Know what support the institution offers students with mental health issues and how students can access it
Are equipped to teach students in their classes who have mental health needs
Have good access to mental health professionals if they need specialist advice on students’ mental health
Agreed at Wave 3Agree
60%
68%
85%
81%
61%
65%
90%
81%
Base : All institutions (Wave 5: 501; Wave 3: 503)
Strongly disagree Tend to disagree Neither/nor
Most staff…
Tend to agree Strongly agree
53%Know how to help students with mental health issues access specialist support outside of your institution
53%
4%

36
In comparison to sixth forms and general colleges special schools were more likely to agree with all the statements:
• The vast majority of special schools agreed that most staff were equipped to identify behaviour that may be linked to a mental health issue (94%), compared to 79% of schools with sixth forms and 67% of general colleges;
• Over four in five (84%) special schools agreed that most staff were equipped to teach students in their classes who have mental health needs, compared to 62% of general colleges and 60% of schools with sixth forms; and
• Nearly three-quarters (72%) of special schools agreed that most staff knew how to help students with mental health issues access specialist support outside of the institution, compared with 53% of general colleges and 48% of schools with sixth forms.
37
8. SEN Support The SEN Support category was introduced in the Children and Families Act 2014 as a means of supporting children and young people that have Special Educational Needs (SEN) but do not have a Statement of SEN, a Learning Difficulty Assessment (LDA) or an Education, Health and Care (EHC) plan.
This chapter explores the SEN Support offered to post-16 learners. SEN support is where extra or different help is given from that provided as part of the institution’s usual curriculum. Teachers, the SEN Coordinator (SENCO) or Additional Learning Support Manager (ALSM) may receive advice or support from outside specialists. Note, this chapter excludes special schools as the vast majority of learners in these schools have a Statement of SEN, LDA or EHC plan.
The majority (83%) of institutions (excluding special schools) had learners who they identified as requiring SEN support, i.e. those that were considered to have a special educational need but did not have a statement of SEN, Learning LDA or an Education, Health and Care (EHC) plan. This may have been because these learners did not require a statement of SEN, LDA, or EHC Plan, or because they were waiting for an assessment.
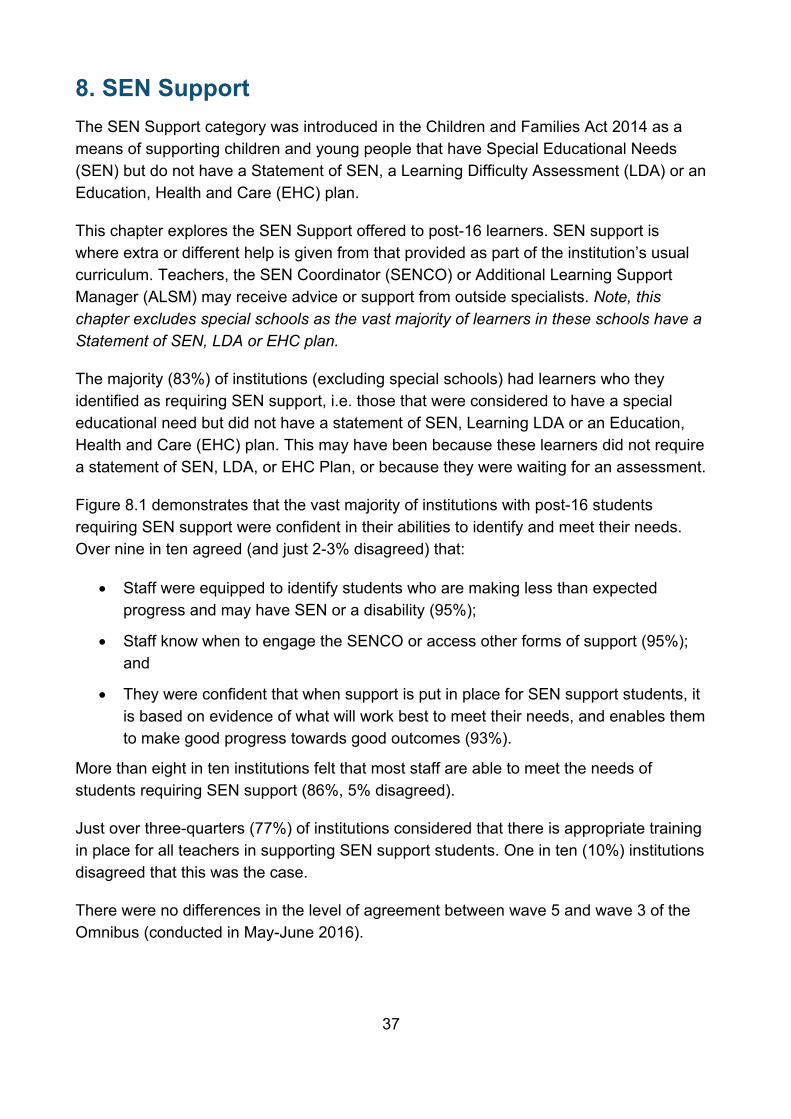
Figure 8.1 demonstrates that the vast majority of institutions with post-16 students requiring SEN support were confident in their abilities to identify and meet their needs. Over nine in ten agreed (and just 2-3% disagreed) that:
• Staff were equipped to identify students who are making less than expected progress and may have SEN or a disability (95%);
• Staff know when to engage the SENCO or access other forms of support (95%); and
• They were confident that when support is put in place for SEN support students, it is based on evidence of what will work best to meet their needs, and enables them to make good progress towards good outcomes (93%).
More than eight in ten institutions felt that most staff are able to meet the needs of students requiring SEN support (86%, 5% disagreed).
Just over three-quarters (77%) of institutions considered that there is appropriate training in place for all teachers in supporting SEN support students. One in ten (10%) institutions disagreed that this was the case.
There were no differences in the level of agreement between wave 5 and wave 3 of the Omnibus (conducted in May-June 2016).
38
Figure 8.1: Institutions’ views on their ability to support and meet the needs of post-16 students requiring SEN support
1%
1%
2%
2%
3%
4%
9%
3%
3%
3%
8%
12%
38%
49%
52%
52%
50%
57%
45%
42%
34%
27%
Most staff are equipped to identify students who are making less than expected progress and may have SEN/a disability
Most staff are able to meet the needs of students on SEN support
There is appropriate training in place for all teachers in supporting SEN support students
Staff know when to engage the SENCOor access other forms of support
I am confident that when support is put in place, it is based on evidence of what will work best and enables students to make progress towards good outcomes
Agreed at Wave 3Agree
87%
94%
94%
92%
86%
93%
95%
95%
77% 72%
Base : All institutions with students requiring SEN support (Wave 5: 363; Wave 3: 361)
Strongly disagree Tend to disagree Neither/nor Tend to agree Strongly agree
39
9. Teacher workloads and post-16 budget management In February 2017 DfE published the results of the first teacher workload survey which found that teachers had worked an average of 54.4 hours per week (in the week prior to their interview) 34 35. The survey was introduced as a result of a commitment made following DfE’s Workload Challenge in 2014 which asked teachers for their views on how to reduce unnecessary workload and generated more than 44,000 responses36. Since 2014, three independent teacher workload review groups have been established to offer advice on the three biggest areas that teachers say can lead to unnecessary workload: marking policy, planning and teaching resources, and data management.
This chapter focuses on what actions institutions have taken to evaluate and reduce teacher workload, the extent to which this has had an impact, and what actions have been the most useful in terms of helping institutions get the most out of their post-16 budget. Note, this chapter focuses only on schools with sixth forms, special schools and studio schools.
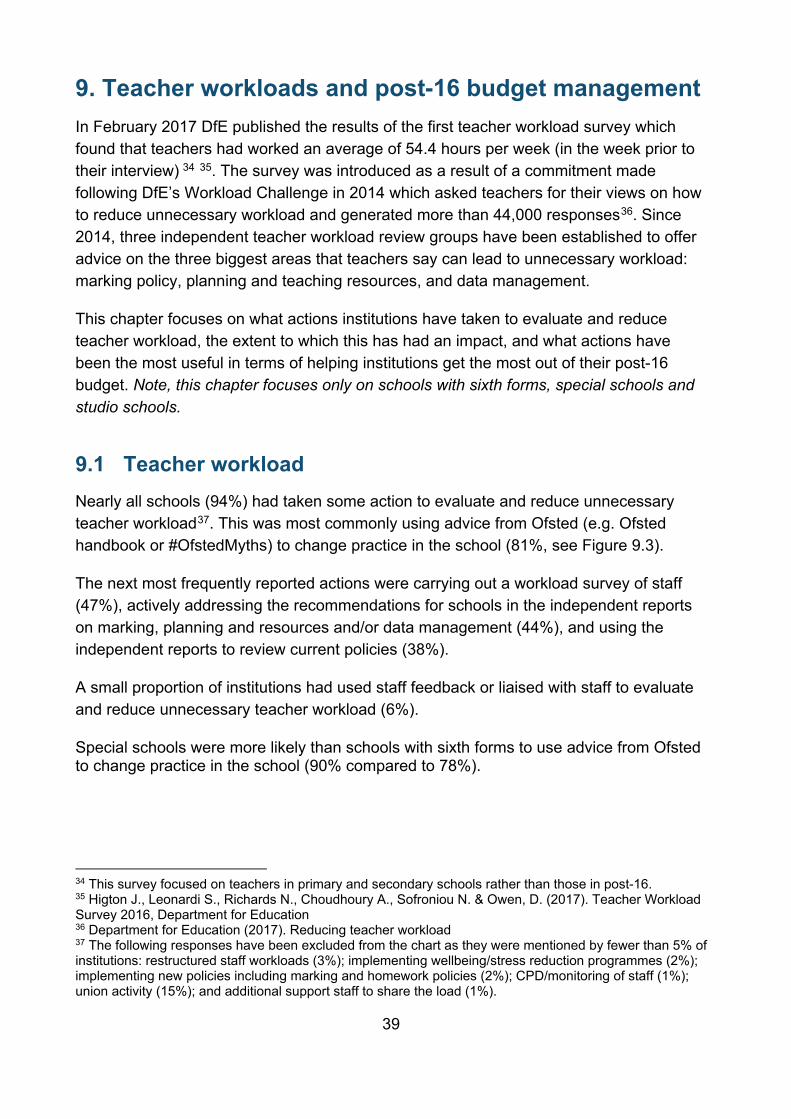
9.1 Teacher workload Nearly all schools (94%) had taken some action to evaluate and reduce unnecessary teacher workload37. This was most commonly using advice from Ofsted (e.g. Ofsted handbook or #OfstedMyths) to change practice in the school (81%, see Figure 9.3).
The next most frequently reported actions were carrying out a workload survey of staff (47%), actively addressing the recommendations for schools in the independent reports on marking, planning and resources and/or data management (44%), and using the independent reports to review current policies (38%).
A small proportion of institutions had used staff feedback or liaised with staff to evaluate and reduce unnecessary teacher workload (6%).
Special schools were more likely than schools with sixth forms to use advice from Ofsted to change practice in the school (90% compared to 78%).
34 This survey focused on teachers in primary and secondary schools rather than those in post-16. 35 Higton J., Leonardi S., Richards N., Choudhoury A., Sofroniou N. & Owen, D. (2017). Teacher Workload Survey 2016, Department for Education 36 Department for Education (2017). Reducing teacher workload 37 The following responses have been excluded from the chart as they were mentioned by fewer than 5% of institutions: restructured staff workloads (3%); implementing wellbeing/stress reduction programmes (2%); implementing new policies including marking and homework policies (2%); CPD/monitoring of staff (1%); union activity (15%); and additional support staff to share the load (1%).
40
Figure 9.3: Actions taken by institutions to evaluate and reduce unnecessary teacher workload (mentioned by at least 5%)
Institutions were asked about how many hours per week their actions had reduced teacher workload on average. Just over half (51%) that had taken actions reported that it had not changed workload at all and exactly a quarter did not know or felt it was too early to tell. Almost one in five (19%) reported their actions had reduced workload by up to two hours per week, per teacher, and 4% felt it had reduced workload by 2-5 hours a week.
Where employed, using the independent reports on marking, planning and/or data management to review current policies and actively addressing the recommendations for schools in the independent reports were more likely to reduce teacher workloads (34% and 33%) than either carrying out a teacher workload survey (29%) or using advice from Ofsted to change practice in the school (23%). For all measures, around a quarter said they did not know, or it was too early to tell, if these activities had reduced teacher workload and between 41% and 52% said it had no effect.
81%
47%
44%
38%
6%
6%
Used advice from Ofsted to change practice in theschool
Carried out a workload survey of staff
Actively addressed the recommendations forschools in the independent reports on marking,
planning and/or data management
Used the independent reports as a basis to reviewcurrent policies
Staff feedback/liaising with staff
Nothing
Base : All schools with sixth forms, special schools and studio schools (401)

41
Figure 9.4: Extent to which actions taken to evaluate and reduce unnecessary workload had reduced workload on average
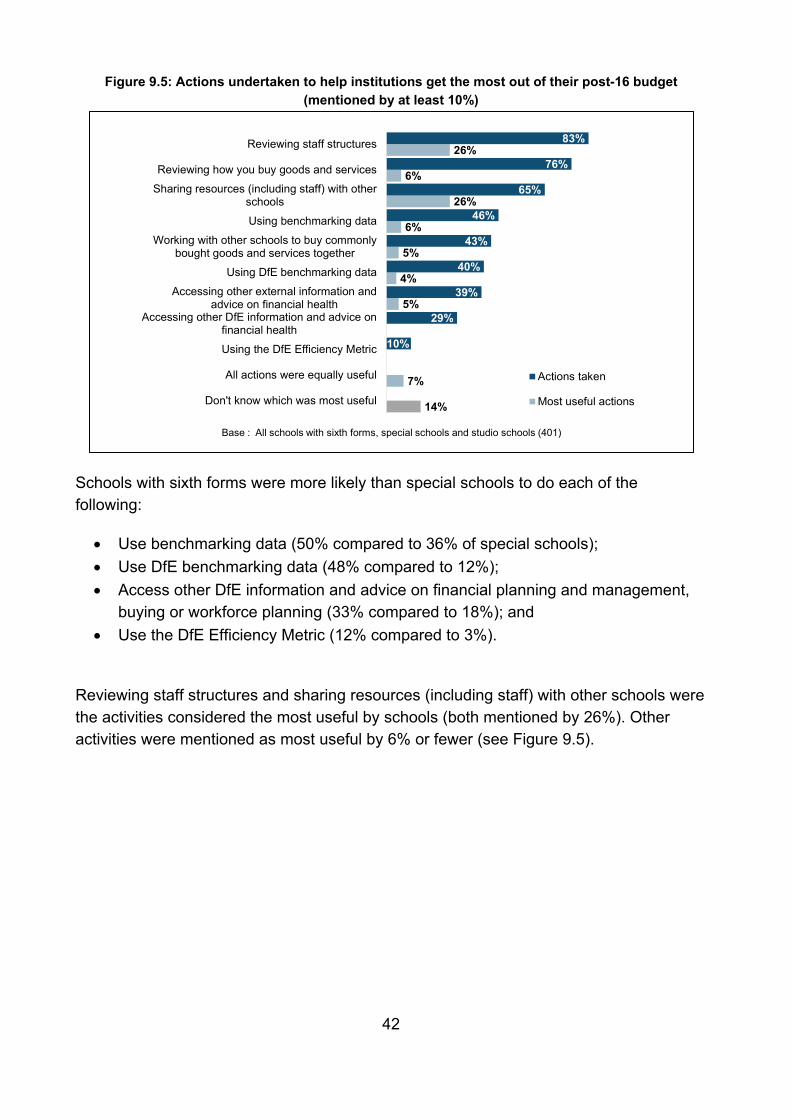
9.2 Post-16 budget Figure 9.5 details the most commonly undertaken actions by schools with sixth forms, special schools and studio schools to help get the most out of their post-16 budget. Reviewing staff structures (83%) and reviewing how they buy goods and services (76%) were the two most commonly reported activities, followed by sharing resources (including staff) with other schools (65%).
Just under half used benchmarking data (46%) and around two in five institutions worked with other schools to buy commonly bought goods and services together (43%), used DfE benchmarking data (40%) or accessed other external information and advice on their financial health (39%). Smaller proportions accessed other DfE information and advice on financial planning and management, buying or workforce planning (29%) or used the DfE Efficiency Metric (10%).
25%
26%
27%
25%
41%
41%
44%
52%
25%
25%
22%
18%
8%
8%
6%
4%
1%
1%
1%
1%
Used the independent reports on marking, planning and/or data management as a basis to review current policies
Used advice from Ofsted to change practice in the school
Actively addressed the recommendations for schools in the independent reports
Carried out a workload survey of staff
Base : All schools that used the independent reports on marking (154); actively addressed the recommendations for schools in the independent reports (181); carried out a workload survey (190); and used advice from Ofsted (321)
Don’t know/ too early to tell Not at all Up to 2 hours 2-5 hours More than 5 hours
Action reduced teacher workload
23%
29%
34%
33%
42
Figure 9.5: Actions undertaken to help institutions get the most out of their post-16 budget (mentioned by at least 10%)
Schools with sixth forms were more likely than special schools to do each of the following:
• Use benchmarking data (50% compared to 36% of special schools); • Use DfE benchmarking data (48% compared to 12%); • Access other DfE information and advice on financial planning and management,
buying or workforce planning (33% compared to 18%); and • Use the DfE Efficiency Metric (12% compared to 3%).
Reviewing staff structures and sharing resources (including staff) with other schools were the activities considered the most useful by schools (both mentioned by 26%). Other activities were mentioned as most useful by 6% or fewer (see Figure 9.5).
14%
7%
5%
4%
5%
6%
26%
6%
26%
10%
29%
39%
40%
43%
46%
65%
76%
83%
Don't know which was most useful
All actions were equally useful
Using the DfE Efficiency Metric
Accessing other DfE information and advice onfinancial health
Accessing other external information andadvice on financial health
Using DfE benchmarking data
Working with other schools to buy commonlybought goods and services together
Using benchmarking data
Sharing resources (including staff) with otherschools
Reviewing how you buy goods and services
Reviewing staff structures
Actions taken
Most useful actions
Base : All schools with sixth forms, special schools and studio schools (401)

43
Annex A: Response rate Table A1 presents the response rate achieved from the eligible sample of post-16 institutions at wave 5. A small proportion (1%) of the sample proved to be ineligible due to some institutions having closed or no longer offering post-16 education.
In Table A1, ‘other’ shows those where it was not possible to achieve an interview with the institution by the end of fieldwork, though they had not refused to take part.
Table A1: Response rate achieved from eligible sample by institution
Institution type
Total sample
Ineligible sample
Eligible sample
Interviews achieved
Refused Other % of eligible sample
interviewed
General FE colleges
108 1 107 55 3 49 51%
Specialist colleges
14 0 14 6 1 7 43%
Sixth form colleges
47 0 47 26 2 19 55%
Schools with Sixth Forms
625 3 622 327 32 263 53%
Special schools
95 0 95 67 2 26 71%
Studio Schools
16 1 15 7 1 7 47%
University technical colleges
20 0 20 13 2 5 65%
Total 925 5 920 501 43 376 54%
44
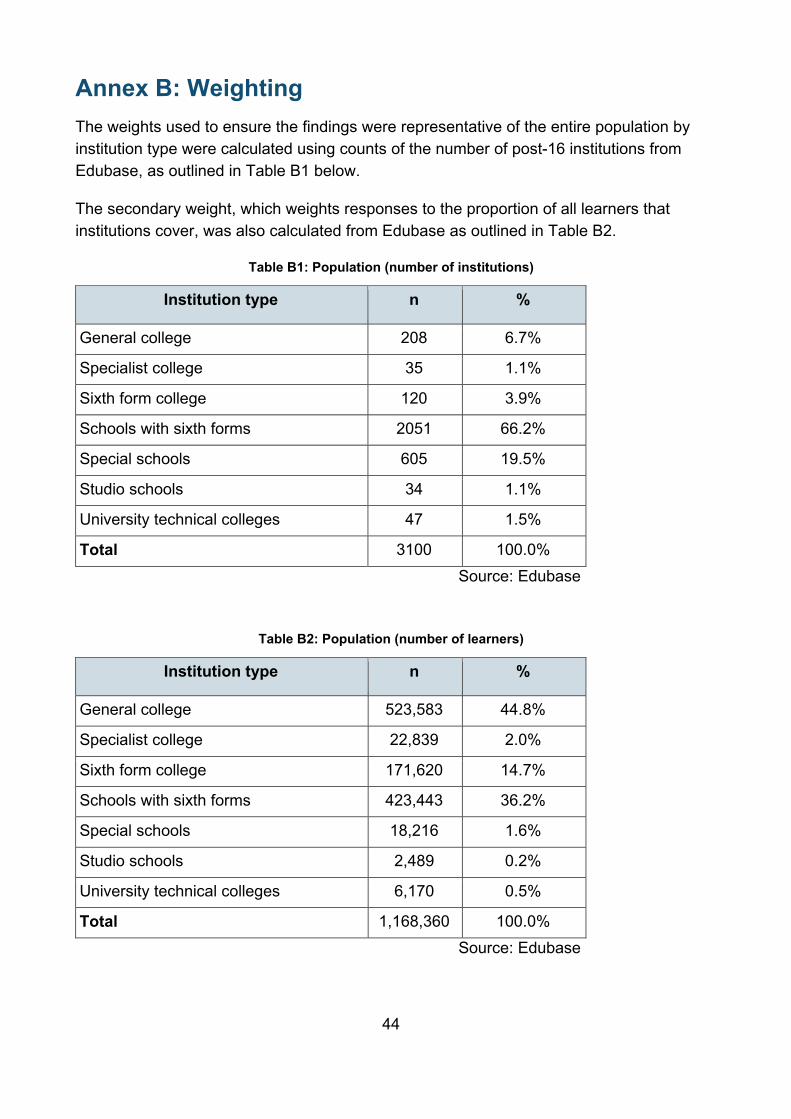
Annex B: Weighting The weights used to ensure the findings were representative of the entire population by institution type were calculated using counts of the number of post-16 institutions from Edubase, as outlined in Table B1 below.
The secondary weight, which weights responses to the proportion of all learners that institutions cover, was also calculated from Edubase as outlined in Table B2.
Table B1: Population (number of institutions)
Institution type n %
General college 208 6.7%
Specialist college 35 1.1%
Sixth form college 120 3.9%
Schools with sixth forms 2051 66.2%
Special schools 605 19.5%
Studio schools 34 1.1%
University technical colleges 47 1.5%
Total 3100 100.0% Source: Edubase
Table B2: Population (number of learners)
Institution type n %
General college 523,583 44.8%
Specialist college 22,839 2.0%
Sixth form college 171,620 14.7%
Schools with sixth forms 423,443 36.2%
Special schools 18,216 1.6%
Studio schools 2,489 0.2%
University technical colleges 6,170 0.5%
Total 1,168,360 100.0% Source: Edubase

45
© IFF Research 2017
Reference: DFE-RR670
ISBN: 978-1-78105-734-6
The views expressed in this report are the authors’ and do not necessarily reflect those of the Department for Education.
Any enquiries regarding this publication should be sent to us at: [email protected] or www.education.gov.uk/contactus
This document is available for download at www.gov.uk/government/publications