Embed Size (px)
Citation preview
RESEARCH ARTICLE
The influence of volcanological and sedimentologicalprocesses on diamond grade distribution in kimberlites:examples from the EKATI Diamond Mine, NWT, Canada
Lucy A. Porritt & R. A. F. Cas & L. Ailleres & P. Oshust
Received: 26 February 2010 /Accepted: 5 June 2011# Springer-Verlag 2011
Abstract The distribution of diamonds within individualkimberlite pipes is poorly documented in the public domaindue to the proprietary nature of the data. The study of thediamond distribution within two pipes, Fox and Koala,from the EKATI Diamond Mine, NWT, Canada, inconjunction with detailed facies models has shown severaldistinct relationships of deposit type and grade distribution.In both pipes, the lithological facies represent grade unitswhich can be distinguished from each other in terms ofrelative size and abundance of diamonds. A positiverelationship between olivine grain size and abundance withdiamond size and abundance is observed, indicating thatsorting of fragmental kimberlites influences diamonddistribution. Though surface geological processes do notcontrol the diamond potential of the erupting magma, theycan be responsible for concentrating diamonds into eco-
nomically significant proportions. A good understanding ofthe eruption, transport and depositional processes responsi-ble for the individual lithological units and the diamonddistribution within them is important for successfulresource estimation. This may lead to recognition of areassuitable for selective mining, making a marginal depositeconomic.
Keywords Kimberlite . Diamond . Grade distribution .
Volcanology. Sedimentology
Introduction
Diamonds form at depths of over 150 km in the subcontinen-tal lithospheric mantle, in the diamond stability field wherethe pressures and temperatures are favourable for carbon toexist as diamond (Meyer 1987; Harris 1992). The mainmantle lithologies in which diamonds form are peridotite(dunite, harzburgite, lherzolite), websterite and eclogite.Diamonds and other mantle minerals are transported to thesurface by kimberlite and lamproite magmas, which ran-domly entrain xenolithic and xenocrystic mantle and crustalmaterial en route. Where present, diamonds are found invery low abundances (<3 ppm, Gurney et al. 2005), which,depending on the value of the diamonds, may or may not beconsidered sufficient to be economically mined. Globally, themajority of known kimberlite bodies are in fact considered tobe non-diamondiferous or contain sub-economic grades,with only as few as 1% eventually becoming diamondmines (Rombouts 1999).
There are several factors which influence the diamondcarrying potential of the magmas before they reach the nearsurface. If the kimberlite magma does not rise throughdiamondiferous mantle, then it cannot entrain diamonds.
Editorial responsibility: R.S.J. Sparks
This paper constitutes part of a special issue:
Cas RAF, Russell JK, Sparks RSJ (eds) Advances in KimberliteVolcanology and Geology.
L. A. Porritt (*) :R. A. F. Cas : L. AilleresSchool of Geosciences, Monash University,Clayton 3800, VIC, Australiae-mail: [email protected]
L. A. PorrittDepartment of Earth and Ocean Sciences,University of British Columbia,6339 Stores Road,Vancouver V6T 1Z4, BC, Canada
P. OshustAMEC Americas Ltd,111 Dunsmuir St,Vancouver V6B 5W3, BC, Canada
Bull VolcanolDOI 10.1007/s00445-011-0515-7

Even if the magma rises through a fertile zone, it will notnecessarily entrain diamonds in sufficient quantities to formeconomic deposits. If diamonds are entrained by the magma,they must also survive the transport to the surface. Thetemperature and oxygen fugacity (ƒO2) of the host magmainfluences diamond dissolution with a high-T, high-ƒO2
magma being less favourable for diamond preservation(Fedortchouk et al. 2005). The degree of interaction withthe kimberlite melt also controls dissolution, and diamondsresiding within xenoliths are better protected than thoseliberated during transport to the surface. The nature, as wellas the abundance, of the diamonds within any diamondifer-ous mantle may also affect the economic potential of themagma-batch, with stone value affected by size, clarity,shape and colour of the stones. The abundance and value ofthe diamonds that each individual magma or magma pulsecarries to the surface can be inconsistent, and gradevariations within individual intrusions have been docu-mented e.g. W3 kimberlite at Wesselton and in the De Beerspipe (Clement et al. 1986). Diamond type (value) andabundance typically varies widely between pipes of the samekimberlite field, though it may show similarities within atemporally and spatially related cluster (Gurney et al. 2005).
At the surface, volcanological processes operate with theresult that the diamond abundance within the deposits maybe modified compared to the initial proportion carried withinthe magma. Subsequent sedimentary processes may alsooccur, which can further redistribute the diamonds andinfluence their concentration in any given deposit. Diamondabundance commonly varies within individual pipes, due inpart to their low overall abundance and to the varied relativeabundance of other components of the deposits. Severalauthors have described grade variation between lithofacieswith a distinct geological control on diamond grade, theyattribute it to sorting and country rock dilution (e.g. at theMwadui kimberlite, Tanzania, Stiefenhofer and Farrow2004), and difference in grade of individual eruptingmagma pulses (e.g. several southern African occurrences,Clement 1982; and the Victor kimberlite, Canada, Webb etal. 2004). Grade variations within individual lithofacieshave also been described where diamond grade is elevatedin the coarse basal portion of a ‘mega-graded’ bed at the140/141 kimberlite, Canada (Berryman et al. 2004).
Diamond has a high specific gravity (3.52) with respectto common silicate minerals such as quartz; thus, diamonds(and other mantle minerals such as olivine and pyrope) areeasily sorted by particle size and density contrasts undertractional sedimentary conditions. Sorting due to size anddensity is apparent in sedimentary diamond deposits wherediamonds have been eroded from the kimberlite source anddeposited within alluvial and marine gravels (and in Brazil,Svisero 1995; e.g. in southern Africa, de Wit 1999). Thephysical processes affecting the distribution of diamonds
within kimberlite pipes are not well documented, due to theproprietary nature of such data, the poor understanding ofintra-vent processes and products and the inherent difficultiesinvolved in diamond sampling at a scale that can be related todepositional features. Kimberlite pipe-filling deposits aredominated by pyroclastic and resedimented volcaniclasticlithofacies. Avariety of volcanic fragmentation and transportprocesses has been recognised from the deposits withinkimberlite pipes, which show a range of lithofacies withdifferent textural characteristics such as particle sorting andinternal structure. For the most part, transport distances areshort with the pipe being the source vent as well as the site ofdeposition; however, pyroclastic flow deposits from othersource vents are now being recognised (Moss et al. 2008;Gernon et al. 2009a).
Here, we assess the volcanic and sedimentary processesresulting in the deposits within two kimberlite pipes on theEKATI property, Fox and Koala, and how those processesmay have influenced the internal grade distribution. TheKoala kimberlite is smaller in volume but carries a highergrade than the Fox kimberlite, with a total measured,indicated and inferred resource of 18.5 Mt at 0.95 ct/t inKoala and 28.7 Mt at 0.4 ct/t in Fox (based on a 2002inventory, Dyck et al. 2004). The effects of grade dilutionby country rock lithic fragments and disaggregated sedi-ment, elutriation both within the eruption column andduring subsequent transport and deposition and depositgrain size and sorting are discussed. Absolute diamondgrades are not presented due to the proprietary nature of thedata; however, normalised data are presented (normalised tovolume), analysed and interpreted.
Methods and data
Diamond distribution data, stones and carats per cubicmeter, have been provided by BHP Billiton Canada Inc. forthe Fox and Koala kimberlites, two of the pipes currentlyexploited as part of the EKATI Diamond Mine™, NWT,Canada. Large diameter reverse circulation drill holes wereused to sample the lithologies within the pipes for diamondgrade (using methods outlined by Dyck et al. 2004); 3Dgeological models of each pipe have been compiled byBHP Billiton Canada Inc., in Vulcan software, and havebeen used throughout the grade sampling and determinationprocess providing a framework for resource evaluation.These models have been built on the basis of lithologicaldata from >70 diamond drill holes per pipe, plus thelogging of chips from the reverse circulation drill holes.Previous work included detailed logging of 23 diamonddrill cores from Fox and 17 from Koala which enabledfacies and emplacement models to be determined for eachof the lithological units (Porritt 2008; Porritt and Cas 2009,
Bull Volcanol

2011). Factors such as grain size distribution and extent ofdilution by country rock lithic fragments are considered asimportant in predicting grade variations between and withinfacies (Field et al. 2009; Scott Smith and Smith 2009).Olivine abundances were determined using visual percent-age comparison charts for reference (based on Terry andChilingar 1955). Average and maximum olivine grain sizewas also visually determined during core logging to give acontinuous estimate of down-hole grain size variation. Bothvisual estimates and lithic fragment counts of grains >2 mmwere used to track changes in abundance and proportion ofcountry rock dilution within the Fox drill core. Moredetailed crystal size distribution methods (e.g. Holden et al.2009; Jerram et al. 2009; Moss et al. 2010) were notutilized here due to their limited frequency of observations:detailed analysis of representative samples, rather thancontinuous logging.
The Koala database consists of 301 samples and the Foxdatabase consists of 947 samples; of which all but ten arelarge diameter reverse circulation (RC) drill hole samples,the remaining ten are sampled from underground driftrounds from the Koala pipe. The geological affiliation ofeach sample has, for the most part, been characterised byEkati geologists based on the logging of the reversecirculation drill chips; however, in a few cases (<15 perpipe), the samples have straddled lithological boundariesand have been reassigned to the relevant units based on the3D geological model. At Fox, one of the lithologies (F3)has been recognised by detailed core logging only and wasnot determined during grade sampling; the samples withinthis unit have been assigned based on their location withinthe 3D model alone. The average length of samples from
Koala is 14 m and from Fox 16 m, though shorter sampleintervals down to 6 m and larger sample intervals up to30 m in length are also included. RC samples were takenover a period of 7 to 8 years using different size equipment,boring a range of hole sizes (~27–71 cm diameter) with themajority between 31 and 35 cm (Dyck et al. 2004). Thevolume of the in situ sample was determined from drill holedata using down-hole calliper measurements and samplingintervals. Despite the apparently wide variation in samplelengths and hole diameter over time, the mass of thesamples remained relatively constant at approximately 7 tvarying between 5 and 9 t; samples less than 4 t wereexcluded from the dataset. The diamonds obtained from therecovery circuit, giving an effective diamond cut-off size of1 mm (Dyck et al. 2004), were counted and weighed andthen normalised by sample volume to give comparable dataas carats per cubic metre and stones per cubic metre (seeTable 1 for some basic statistics). The 1-mm bottom screenslot size was consistently used during the processing of allsamples used in this study. Average stone weight (ct/st) andsize in millimetre of derived equivalent mean diameter ofspheres with the same volume is also presented on Table 1.The location of each sample within the pipe was assignedan x-, y-, z-coordinate based on the mid-point of eachsample interval to enable 3D visualisation and modelling.
Based on these data, a comparison between the distribu-tion of diamond size (given as weight measured in carats)and abundance (number of stones) in relation to thetransport and depositional processes involved in theformation of each of the individual lithofacies within thepipes is presented. The differences in diamond distributionbetween pipes are also considered, and the influences of
Table 1 Basic statistics describing the diamond size distribution within each pipe and within the individual facies
Averagect m−3
Averagest m−3
Correlation coefficient(ct m−3 : st m−3)
Average ct/st Spherical diameterequivalent (mm)
Standarddeviation (ct/st)
Kurtosis(ct/st)
No. samples
Koala
All 2.33 19.59 0.87 0.12 2.3 0.06 1.77 301
P1 2.18 24.72 0.89 0.07 1.9 0.06 3.67 67
P3 1.98 13.59 0.80 0.10 2.4 0.06 0.67 42
P4 0.75 6.36 0.96 0.11 2.2 0.05 1.12 15
P5a 0.77 7.19 0.72 0.11 2.2 0.07 2.73 74
P5b 1.61 12.32 0.90 0.12 2.3 0.04 0.74 13
P6 4.25 32.01 0.72 0.13 2.5 0.04 0.38 79
P7 2.17 20.91 0.82 0.10 2.2 0.03 -0.38 11
Fox
All 0.58 5.55 0.72 0.10 2.1 0.07 1.53 947
UFA 0.23 2.38 0.70 0.09 1.9 0.07 1.39 305
F3 0.87 7.33 0.59 0.12 2.3 0.07 1.61 339
F1 0.63 6.74 0.69 0.09 2.1 0.06 1.81 303
Diamond data has been normalised by volume to give values as carats per m3 and stones per m3
Bull Volcanol
primary diamond content of the magma and eruption styleare discussed.
Limitations on geological grade prediction
One of the intrinsic problems related to predicting diamondgrade from diamond data is the low abundance of diamondsand the inherent high nugget effect. The nugget effect is anindication of the variability over short distances, less thanthe sampling interval (Davis 1986), and in kimberlitedeposits, this is high mainly due to the stone size variance(Rombouts 2003). The low abundance of diamonds meansthat the size of the samples plays a role in influencing theobserved grade. The absolute grade of a deposit is onlyknown once it has been completely mined and all therecoverable diamonds removed.
Feasible grade prediction relies on achieving a balancebetween an adequate amount of samples of sufficientsizes to produce a reliable estimate of the grade and thecost of sampling. Large sample sizes, commonly fromlarge-diameter RC drill holes, are required to providerepresentative assay data, with samples at EKATI typi-cally ranging from 5 to 9 tonnes (Dyck et al. 2004).Verification of sample assays by analysing duplicatesamples, as is common for metal deposits, is not possiblewith such large sample sizes. Due to the cost and logisticaldifficulties of increasing the diameter of RC drilling,sample lengths have to be relatively large (>6 m but morecommonly ~15–30 m at EKATI) providing low resolutioncompared to observed geological variations. The RCsampling method therefore has only limited selectivity,especially where thin beds or rapid facies variations occur.Realistically, for mining, this sample resolution is suffi-cient due to the scale of the bulk mining methodsemployed at EKATI; however, a finer resolution wouldprovide more detail when assessing the geological controlson diamond distribution.
Resource evaluation for diamond deposits is notstraightforward as it is not only the total carats but alsothe number, size and value of the stones that influences theeconomic potential of the ore. There is the potential for thediamond size distributions to have been modified bybreakage and losses during RC drilling and processing.The sample collection and diamond recovery processesemployed at EKATI were designed to provide reliable,representative data for use in resource modelling, asoutlined by Dyck et al. (2004). Evaluation of diamondpopulations from RC drilling and mine production hasshown minimal additional stone damage associated withdrilling (Dyck et al. 2004). Losses during sampling are hardto quantify; however, the efficiency of the processing plantwas closely monitored and diamond recovery maximised(Dyck et al. 2004).
The normalised data for this study were provided byBHP Billiton Canada Inc. as carats per cubic metre andstones per cubic metre, and no validation or statisticalanalysis of the original stone counts and sizes was possibleby the authors. However, these data have been used inresource evaluation, and it can be assumed that they havebeen validated for this purpose and a satisfactory control onthe data obtained. See Dyck et al. (2004) and Harrison et al.(2009) for more details on the resource modelling methodsused at EKATI.
Pipe geology and volcanology
The Koala and Fox pipes are part of the Ekati DiamondMine, which is part of the Lac de Gras Kimberlite Field,located within the Contwoyto Terrane of the Central SlaveProvince, Canada (Fig. 1). The dominant country rocks inthe area are Archean granitoids which have intruded intothe metasediments of the Yellowknife Supergroup. Bothpipes are hosted by the granodioritic Koala Batholith, in thesouth-central portion of the Ekati Property. This compositebatholith has an age of 2.6 Ga (Kjarsgaard et al. 2002).Fossil evidence from sedimentary xenoliths, mainly com-prising silts, muds and quartz sands, indicates that thebedrock was covered by Cretaceous marine and Palaeocenelacustrine strata (Nassichuk and Dyck 1998) during thetime of kimberlite volcanic activity. The fluidal forms ofmudstone xenoliths within both pipes indicate that at leastsome of the cover sequence sediments were partiallyconsolidated or unconsolidated at the time of kimberliteeruption. The Koala kimberlite has been dated using Rb–Srgiving an age of ~53 Ma (Creaser et al. 2004), the Foxkimberlite has not been successfully dated, though thesedimentary xenoliths found within the Fox deposits wouldplace it within a similar age range to other kimberlites onthe property (75–45 Ma, Creaser et al. 2004). Currentestimates are that the surface at the time of eruption wasperhaps only a few hundred metres above that of thepresent day (Nowicki et al. 2004).
Fox pipe
The Fox pipe has been divided into four facies and twosub-facies (F1 to F4 and sub-facies F1a and F4a, Porrittand Cas 2009). F2 is a granodiorite boulder breccia withonly a minor kimberlite component, and the sub-facies arevolumetrically unimportant, so for simplicity here, wefocus on the three main kimberlite facies (F1, F3 and F4)which are easily distinguished from each other by differ-ences in grain size, olivine content, presence or absence ofaccretionary lapilli and granodiorite country rock abun-dance (Fig. 2, Table 2). The lowermost facies (F1) is a
Bull Volcanol
massive, poorly sorted, matrix supported, granodiorite-lithic-rich lapilli-tuff, containing 10–30% strongly alteredolivine grains. F1 is considered to be the result of thecollapse of a large eruption column early in the eruption,before complete vent clearing had occurred, indicated bythe high abundance of granodiorite lithic fragments
(>40%). Column collapse was most probably triggeredby vent over-widening leading to overloading of theeruption column with cold dense country rock lithicfragments (Porritt et al. 2008a, b; Porritt and Cas 2009).The dynamics of kimberlite column collapse are not wellconstrained, and an alternative model involving waning-
P1
P7
P6
P5b
P5a
P4
P3
UFA
F1
F3
KOALA FOX
100 m
E
F2
F2
F2
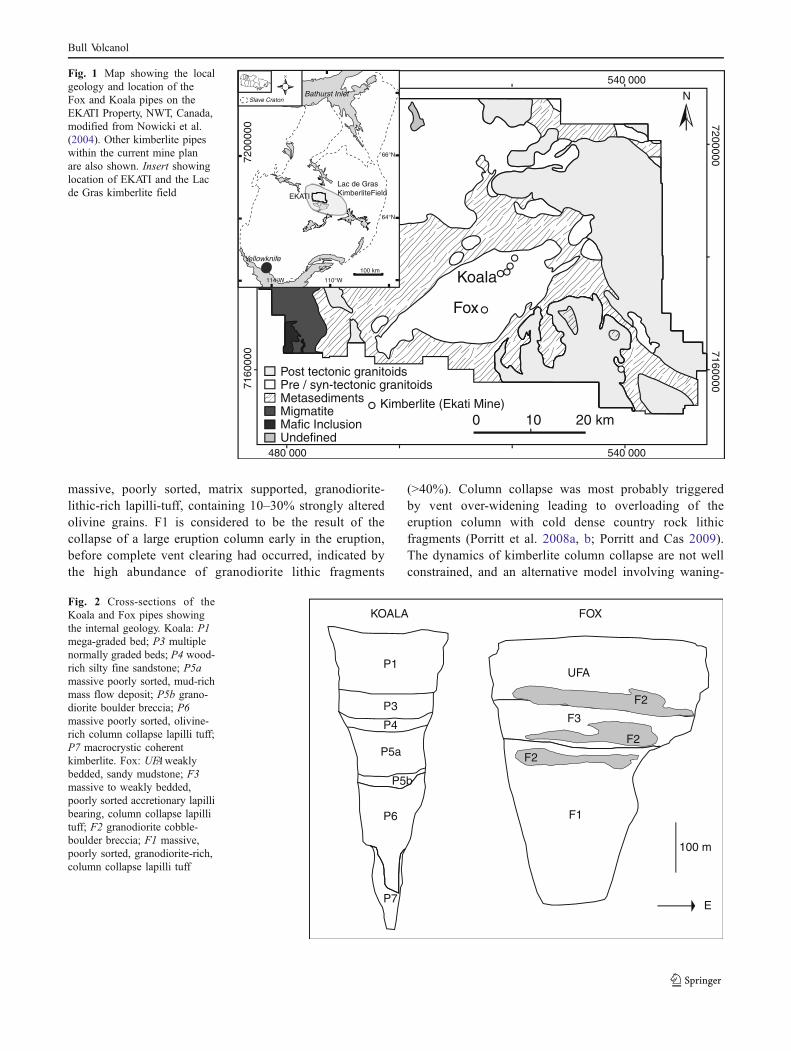
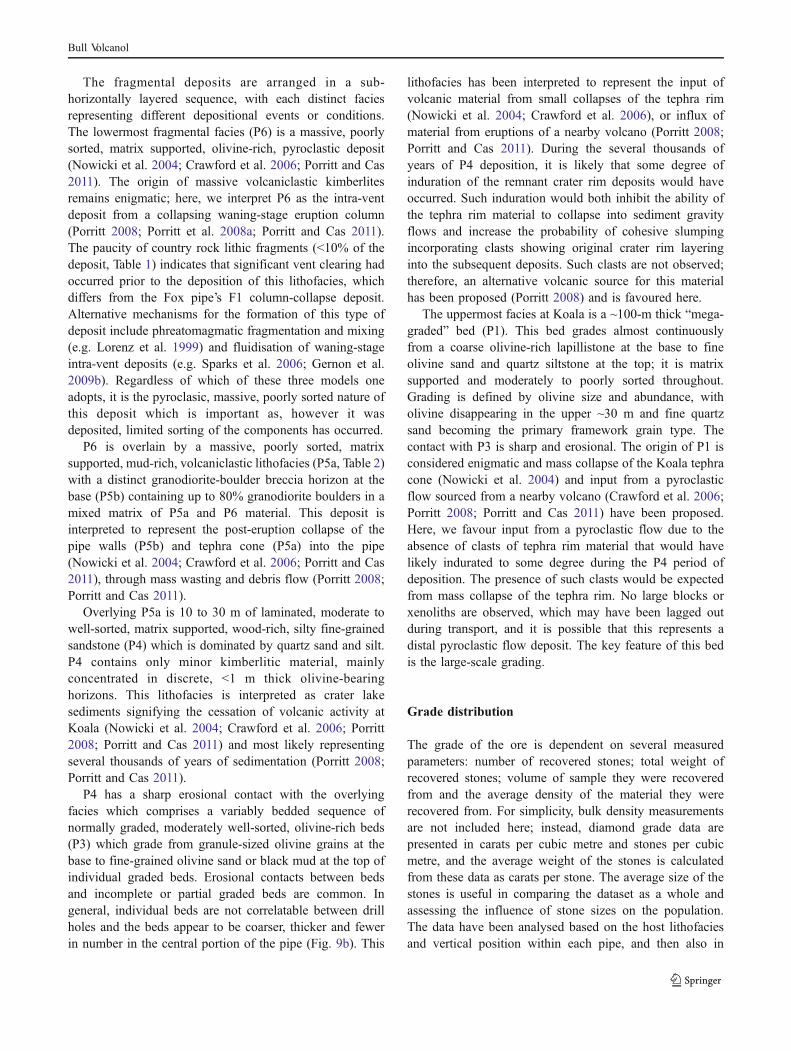
Fig. 2 Cross-sections of theKoala and Fox pipes showingthe internal geology. Koala: P1mega-graded bed; P3 multiplenormally graded beds; P4 wood-rich silty fine sandstone; P5amassive poorly sorted, mud-richmass flow deposit; P5b grano-diorite boulder breccia; P6massive poorly sorted, olivine-rich column collapse lapilli tuff;P7 macrocrystic coherentkimberlite. Fox: UFAweaklybedded, sandy mudstone; F3massive to weakly bedded,poorly sorted accretionary lapillibearing, column collapse lapillituff; F2 granodiorite cobble-boulder breccia; F1 massive,poorly sorted, granodiorite-rich,column collapse lapilli tuff
Post tectonic granitoidsPre / syn-tectonic granitoidsMetasedimentsMigmatiteMafic InclusionUndefined
0 20 km
N
Kimberlite (Ekati Mine)
Fox
Koala
10
540 000
480 000 540 000
7160
000
7200
000 7200000
7160000
Lac de Gras KimberliteField
100 km
110°W
66°N
64°N
114°W
Yellowknife
Slave CratonBathurst Inlet
EKATI
Fig. 1 Map showing the localgeology and location of theFox and Koala pipes on theEKATI Property, NWT, Canada,modified from Nowicki et al.(2004). Other kimberlite pipeswithin the current mine planare also shown. Insert showinglocation of EKATI and the Lacde Gras kimberlite field
Bull Volcanol

stage in-vent deposition and large-scale fluidization ofpyroclasts has been proposed (Sparks et al. 2006; Brownet al. 2008). Though we favour the column collapse modelhere, both processes could result in a massive poorlysorted pyroclastic deposit where limited internal grain-sizesorting is invoked.
F1 is overlain by a massive to weakly bedded, poorlysorted, matrix supported, accretionary lapilli-bearing (<1%)and granodiorite-lithic-rich lapilli tuff (F3). The twofacies are very similar in appearance to each other, withthe presence of accretionary lapilli being the distinguish-ing feature. The contact between the two facies variesbetween drill holes from gradational to sharp, with a 10–20-cm thick horizon of accretionary lapilli and/or agranodiorite boulder breccia horizon marking the sharpcontact. F3 is considered to be the result of themodification of the column collapse material by phrea-tomagmatic interaction of magma or hot pyroclasts withinfluxing water (Porritt and Cas 2009).
The uppermost facies (F4) comprises a package ofmassive to weakly bedded, moderately sorted, matrixsupported, olivine-poor, accretionary lapilli-bearing (<5%),kimberlitic mud and fine sand. A granodiorite lithic-rich
sub-facies (F4a) occurs at the base of F4, and together,these lithofacies are termed the Upper Facies Association(UFA, Fig. 2, Porritt and Cas 2009). The UFA is consideredto represent the products of a late phreatomagmatic stage oferuption at Fox, continuous from the F3-forming event,which were deposited onto the crater rim. This material wassubsequently resedimented into the vent during a period ofpost-eruption stabilization and incremental wasting of thetephra rim (Porritt and Cas 2009).
Koala pipe
The Koala pipe is divided into seven distinct geologicalfacies all distinguished by internal textural characteristics,olivine grain size and abundance and detrital materialabundance (Fig. 2, Table 2). The pipe is dominantly filledby fragmental deposits, with a small volume coherentkimberlite body (P7) occupying the base of the pipe(Crawford et al. 2006; Porritt 2008; Porritt and Cas 2011).Based on the morphology, the contacts with the surroundingfragmental deposits and its coherent appearance P7 isconsidered to be a late-stage intrusion (Crawford et al.2006; Porritt 2008; Porritt and Cas 2011).
Table 2 Textural and petrographic characteristics of the individual facies from both Fox and Koala kimberlites
Pipeand unit
Bedding Sorting Texture Olivinemacrocryst content
Avg grainsize
Non-kimberlitematerial
Interpretation
Fox UFA(F4 and F4a)
Minor Moderate Mudstone 0–10% Medium ash Minor granodiorite(up to 10% in F4a)
Resedimentedphreatomagmaticcrater-rim material
Fox F3 Massive Poor Matrixsupported
20–25% Lapilli >30% granodioriteof all sizes
Pyroclastic columncollapse lapilli tuff withphreatomagmatic input
Fox F1 Massive Poor Matrixsupported
20–25% Lapilli >40% granodioriteof all sizes
Pyroclastic columncollapse lapilli tuff
Koala P1 Single normallygraded bed~100 m
Moderate Clast to matrixsupported
35–40% at thebase, to 0%at the top
Fine ash - Lapilli < 5% lithic clasts inbase to abundant10–15% quartzsand grains in top
Pyroclastic flow depositmodified by depositioninto crater lake
Koala P3 Normallygraded
Moderate Clast to matrixsupported
30–35% (up to80% in coarsebases)
Coarse ash – lapilli(fine ash topsto some beds)
Minor granodiorite Pyroclastic flow depositsmodified by depositioninto crater lake
Koala P4 Laminated Well Mudstone <10% (though upto 20% in fewdiscrete horizons)
Medium-ash/fine-sand
Abundant quartzsand, silt, woodfragments
Crater-lake sediment
Koala P5a Massive Poor Matrixsupported
10–20% Coarse ash-lapilli Abundant mudstone,wood and minorgranodiorite
En masse crater rim-collapse resedimentedvolcaniclastic deposit
Koala P5b Massive Poor Undeterminedin drill core
10–20% inmatrix toboulders only
Block/boulder Granodioriteboulders >40%
Pipe wall collapseboulder breccia
Koala P6 Massive Poor Matrixsupported
25–65% (oftenwith narrow rims)
Lapilli <10% granodioriteand mudstone clasts
Pyroclastic columncollapse lapilli tuff
Koala P7 None Inequigranular Macrocrystic,minor flowalignment
0–30% Fine-grainedgroundmass,coarsemacrocrysts(up to ~10 mm)
Minor granodioritealong pipe walls
Coherent kimberliteintrusion
Bull Volcanol
The fragmental deposits are arranged in a sub-horizontally layered sequence, with each distinct faciesrepresenting different depositional events or conditions.The lowermost fragmental facies (P6) is a massive, poorlysorted, matrix supported, olivine-rich, pyroclastic deposit(Nowicki et al. 2004; Crawford et al. 2006; Porritt and Cas2011). The origin of massive volcaniclastic kimberlitesremains enigmatic; here, we interpret P6 as the intra-ventdeposit from a collapsing waning-stage eruption column(Porritt 2008; Porritt et al. 2008a; Porritt and Cas 2011).The paucity of country rock lithic fragments (<10% of thedeposit, Table 1) indicates that significant vent clearing hadoccurred prior to the deposition of this lithofacies, whichdiffers from the Fox pipe’s F1 column-collapse deposit.Alternative mechanisms for the formation of this type ofdeposit include phreatomagmatic fragmentation and mixing(e.g. Lorenz et al. 1999) and fluidisation of waning-stageintra-vent deposits (e.g. Sparks et al. 2006; Gernon et al.2009b). Regardless of which of these three models oneadopts, it is the pyroclasic, massive, poorly sorted nature ofthis deposit which is important as, however it wasdeposited, limited sorting of the components has occurred.
P6 is overlain by a massive, poorly sorted, matrixsupported, mud-rich, volcaniclastic lithofacies (P5a, Table 2)with a distinct granodiorite-boulder breccia horizon at thebase (P5b) containing up to 80% granodiorite boulders in amixed matrix of P5a and P6 material. This deposit isinterpreted to represent the post-eruption collapse of thepipe walls (P5b) and tephra cone (P5a) into the pipe(Nowicki et al. 2004; Crawford et al. 2006; Porritt and Cas2011), through mass wasting and debris flow (Porritt 2008;Porritt and Cas 2011).
Overlying P5a is 10 to 30 m of laminated, moderate towell-sorted, matrix supported, wood-rich, silty fine-grainedsandstone (P4) which is dominated by quartz sand and silt.P4 contains only minor kimberlitic material, mainlyconcentrated in discrete, <1 m thick olivine-bearinghorizons. This lithofacies is interpreted as crater lakesediments signifying the cessation of volcanic activity atKoala (Nowicki et al. 2004; Crawford et al. 2006; Porritt2008; Porritt and Cas 2011) and most likely representingseveral thousands of years of sedimentation (Porritt 2008;Porritt and Cas 2011).
P4 has a sharp erosional contact with the overlyingfacies which comprises a variably bedded sequence ofnormally graded, moderately well-sorted, olivine-rich beds(P3) which grade from granule-sized olivine grains at thebase to fine-grained olivine sand or black mud at the top ofindividual graded beds. Erosional contacts between bedsand incomplete or partial graded beds are common. Ingeneral, individual beds are not correlatable between drillholes and the beds appear to be coarser, thicker and fewerin number in the central portion of the pipe (Fig. 9b). This
lithofacies has been interpreted to represent the input ofvolcanic material from small collapses of the tephra rim(Nowicki et al. 2004; Crawford et al. 2006), or influx ofmaterial from eruptions of a nearby volcano (Porritt 2008;Porritt and Cas 2011). During the several thousands ofyears of P4 deposition, it is likely that some degree ofinduration of the remnant crater rim deposits would haveoccurred. Such induration would both inhibit the ability ofthe tephra rim material to collapse into sediment gravityflows and increase the probability of cohesive slumpingincorporating clasts showing original crater rim layeringinto the subsequent deposits. Such clasts are not observed;therefore, an alternative volcanic source for this materialhas been proposed (Porritt 2008) and is favoured here.
The uppermost facies at Koala is a ~100-m thick “mega-graded” bed (P1). This bed grades almost continuouslyfrom a coarse olivine-rich lapillistone at the base to fineolivine sand and quartz siltstone at the top; it is matrixsupported and moderately to poorly sorted throughout.Grading is defined by olivine size and abundance, witholivine disappearing in the upper ~30 m and fine quartzsand becoming the primary framework grain type. Thecontact with P3 is sharp and erosional. The origin of P1 isconsidered enigmatic and mass collapse of the Koala tephracone (Nowicki et al. 2004) and input from a pyroclasticflow sourced from a nearby volcano (Crawford et al. 2006;Porritt 2008; Porritt and Cas 2011) have been proposed.Here, we favour input from a pyroclastic flow due to theabsence of clasts of tephra rim material that would havelikely indurated to some degree during the P4 period ofdeposition. The presence of such clasts would be expectedfrom mass collapse of the tephra rim. No large blocks orxenoliths are observed, which may have been lagged outduring transport, and it is possible that this represents adistal pyroclastic flow deposit. The key feature of this bedis the large-scale grading.
Grade distribution
The grade of the ore is dependent on several measuredparameters: number of recovered stones; total weight ofrecovered stones; volume of sample they were recoveredfrom and the average density of the material they wererecovered from. For simplicity, bulk density measurementsare not included here; instead, diamond grade data arepresented in carats per cubic metre and stones per cubicmetre, and the average weight of the stones is calculatedfrom these data as carats per stone. The average size of thestones is useful in comparing the dataset as a whole andassessing the influence of stone sizes on the population.The data have been analysed based on the host lithofaciesand vertical position within each pipe, and then also in
Bull Volcanol

three dimensions using the GoCAD modelling software.The data and data analysis presented here are not intendedas an example of resource estimation; good descriptions ofthe resource estimation methods employed at EKATI arepresented in Dyck et al. (2004) and Harrison et al. (2009).
Data analysis
Histogram plots of average stone size (ct/st) show that thedata from both pipes have a positively skewed distributionwith an abundance of smaller diamond grain sizes (Fig. 3).The stone size populations approximate a log-normaldistribution, which is not unexpected (Rombouts 1995).The Fox dataset shows an apparent single sample popula-tion (mono-modal) which is also evident in the histogramsof samples from the individual facies. However, F3 exhibitsa mode value slightly higher than UFA and F1. The Koaladataset is apparently polymodal and shows a largervariance, which may relate to the presence of smaller sub-populations than at Fox. This may indicate that more thanone population exists when considering small samplepopulations. The presence of different sample populationsis supported by the histograms of samples from the
individual Koala facies, which show the following distri-butions: P1 shows a mono-modal log-normal distribution;P3 has a main log-normal distribution with one to two othermodes perhaps indicating the presence of other populations;P5a shows a mono-modal normal distribution and P6appears to show a distribution similar to P5a mixed in witha log-normal population (Fig. 3).
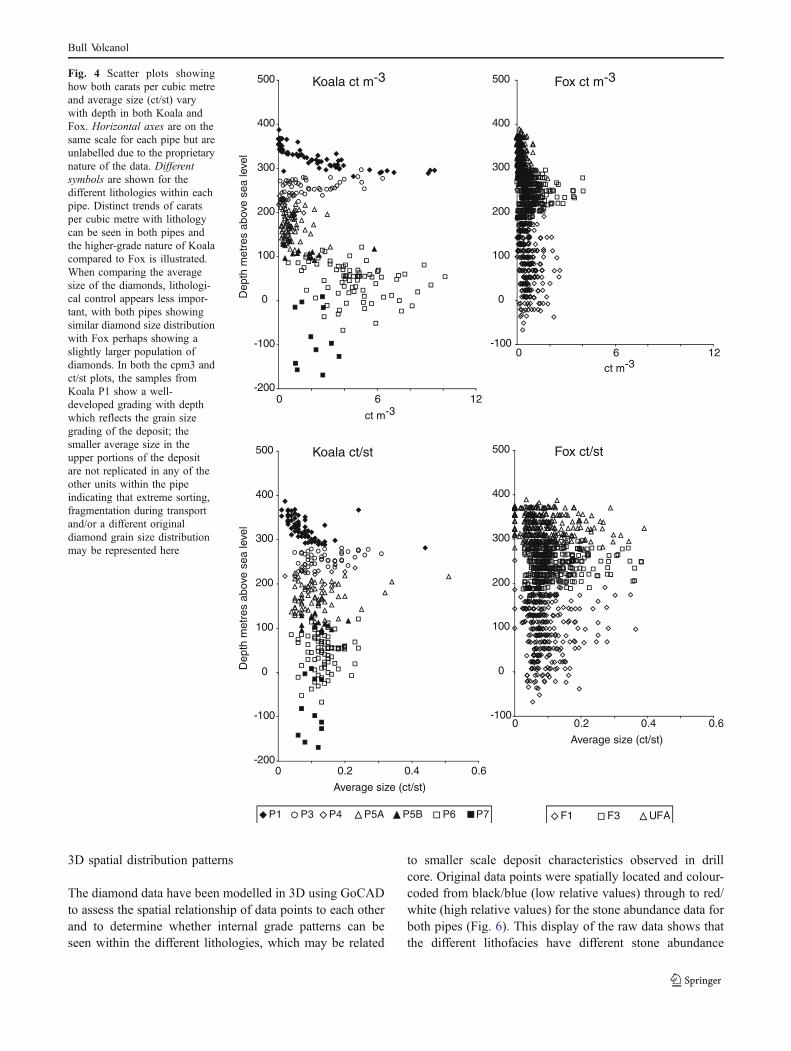
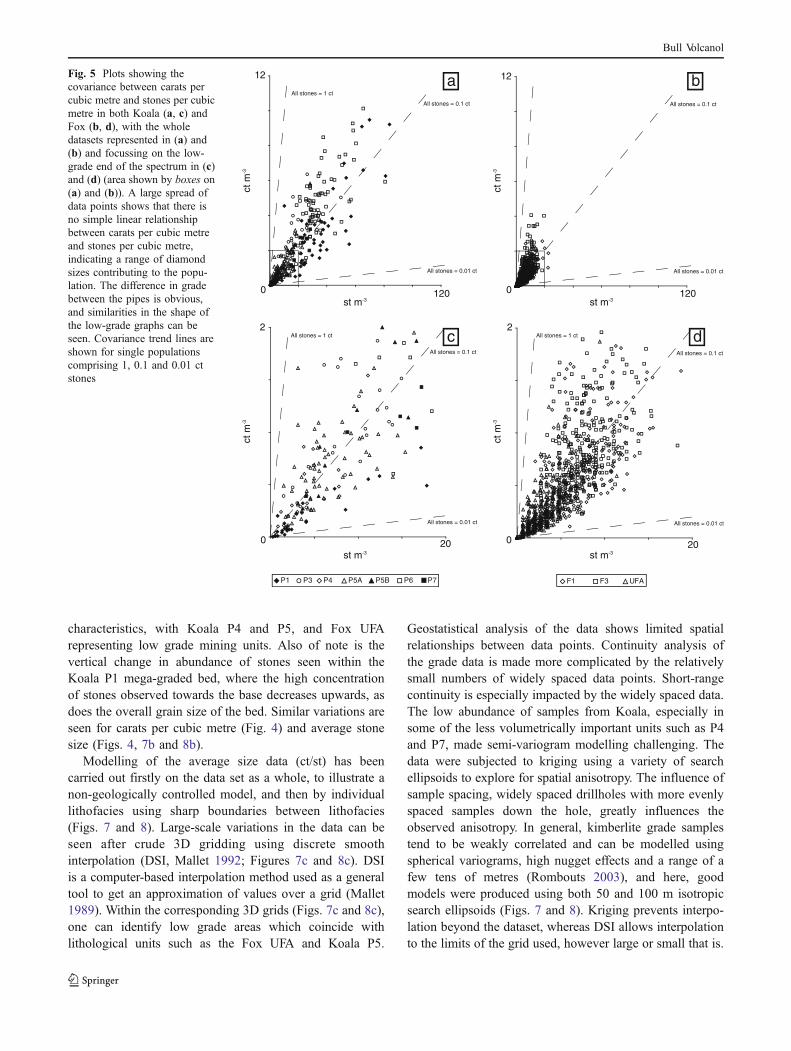
Within both pipes, carats per cubic metre and average sizevary with depth (Fig. 4), showing associations with theindividual geological units, stones per cubic metre alsofollows similar trends. The relationship between carats andstones per cubic metre in both pipes is not strictly linear,with a large spread of data showing that there are variationsin individual stone sizes which contribute to the total gradein any individual sample (Fig. 5). The correlation coefficientbetween carats and stones per cubic metre varies betweenpipes as well as between the facies within each pipe with avalue of 0.87 for all samples at Koala and 0.72 at Fox(Table 1). Higher correlation coefficients indicate either abetter sorted diamond population in which the stonescontribute evenly to the diamond grade or a poorly sortedpopulation where abundance and contribution to total gradeof the different size fractions increases proportionally.
P1
P3
P5a
P6
Koala all
Ct/st
Fre
quen
cy
n = 301n = 67
n = 42
n = 74
n = 79
st dev = 0.063
0 0.1 0.50.2 0.3 0.4
50
25
0
20
0
0
0
0
9
14
18
0.5
0.50.5
0.5
st dev = 0.065
F1
F3
UFA
Ct/st
Fre
quen
cy
Fox all
n = 947
n = 305
n = 339
n = 303
0 0.1 0.50.2 0.3 0.40
100
200
0.5
0.5
0.5
80
60
80
Fig. 3 Histograms showing thedistribution of average size data(ct/st) for all samples from bothFox and Koala. The data fromthe individual lithofacies at Fox(F1, F3 and UFA) show similardistributions to each other and tothe whole sample set plottedtogether, showing a singlepopulation (shown by curve).Histograms for the individuallithofacies at Koala are alsoshown, with P1, P3, P5a andP6 showing different distribu-tion to each other. When com-bined, the data show a morecomplicated size distributionthan at Fox, with three possiblepopulations (highlighted bycurves)
Bull Volcanol
3D spatial distribution patterns
The diamond data have been modelled in 3D using GoCADto assess the spatial relationship of data points to each otherand to determine whether internal grade patterns can beseen within the different lithologies, which may be related
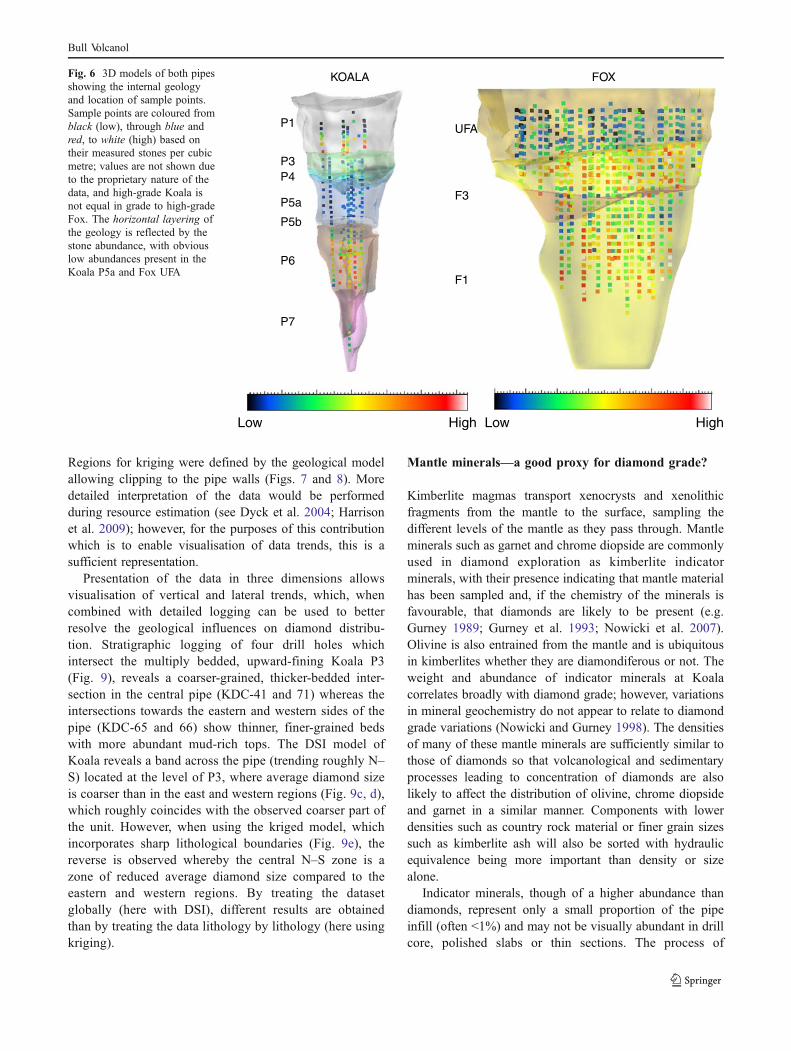
to smaller scale deposit characteristics observed in drillcore. Original data points were spatially located and colour-coded from black/blue (low relative values) through to red/white (high relative values) for the stone abundance data forboth pipes (Fig. 6). This display of the raw data shows thatthe different lithofacies have different stone abundance
-100
0
100
200
300
400
500 Fox ct/st
-200
-100
0
100
200
300
400
500 Koala ct m-3
-100
0
100
200
300
400
500 Fox ct m-3
F1 F3 UFAP1 P3 P4 P5A P5B P6 P7
-200
-100
0
100
200
300
400
500 Koala ct/st
0.2 0.4 0.6
0.2 0.4 0.6
12
126
6
Dep
th m
etre
s ab
ove
sea
leve
l
Average size (ct/st)
Average size (ct/st)
0ct m-3
0
Dep
th m
etre
s ab
ove
sea
leve
l
ct m-3
0
0
Fig. 4 Scatter plots showinghow both carats per cubic metreand average size (ct/st) varywith depth in both Koala andFox. Horizontal axes are on thesame scale for each pipe but areunlabelled due to the proprietarynature of the data. Differentsymbols are shown for thedifferent lithologies within eachpipe. Distinct trends of caratsper cubic metre with lithologycan be seen in both pipes andthe higher-grade nature of Koalacompared to Fox is illustrated.When comparing the averagesize of the diamonds, lithologi-cal control appears less impor-tant, with both pipes showingsimilar diamond size distributionwith Fox perhaps showing aslightly larger population ofdiamonds. In both the cpm3 andct/st plots, the samples fromKoala P1 show a well-developed grading with depthwhich reflects the grain sizegrading of the deposit; thesmaller average size in theupper portions of the depositare not replicated in any of theother units within the pipeindicating that extreme sorting,fragmentation during transportand/or a different originaldiamond grain size distributionmay be represented here
Bull Volcanol
characteristics, with Koala P4 and P5, and Fox UFArepresenting low grade mining units. Also of note is thevertical change in abundance of stones seen within theKoala P1 mega-graded bed, where the high concentrationof stones observed towards the base decreases upwards, asdoes the overall grain size of the bed. Similar variations areseen for carats per cubic metre (Fig. 4) and average stonesize (Figs. 4, 7b and 8b).
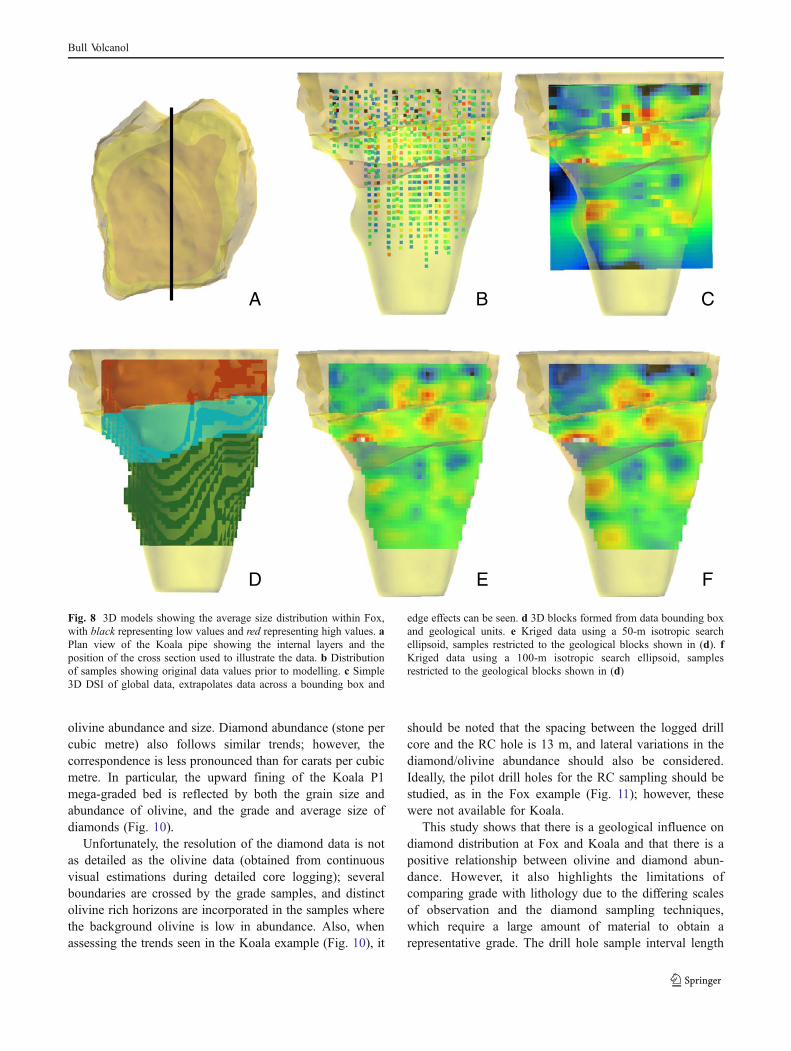
Modelling of the average size data (ct/st) has beencarried out firstly on the data set as a whole, to illustrate anon-geologically controlled model, and then by individuallithofacies using sharp boundaries between lithofacies(Figs. 7 and 8). Large-scale variations in the data can beseen after crude 3D gridding using discrete smoothinterpolation (DSI, Mallet 1992; Figures 7c and 8c). DSIis a computer-based interpolation method used as a generaltool to get an approximation of values over a grid (Mallet1989). Within the corresponding 3D grids (Figs. 7c and 8c),one can identify low grade areas which coincide withlithological units such as the Fox UFA and Koala P5.
Geostatistical analysis of the data shows limited spatialrelationships between data points. Continuity analysis ofthe grade data is made more complicated by the relativelysmall numbers of widely spaced data points. Short-rangecontinuity is especially impacted by the widely spaced data.The low abundance of samples from Koala, especially insome of the less volumetrically important units such as P4and P7, made semi-variogram modelling challenging. Thedata were subjected to kriging using a variety of searchellipsoids to explore for spatial anisotropy. The influence ofsample spacing, widely spaced drillholes with more evenlyspaced samples down the hole, greatly influences theobserved anisotropy. In general, kimberlite grade samplestend to be weakly correlated and can be modelled usingspherical variograms, high nugget effects and a range of afew tens of metres (Rombouts 2003), and here, goodmodels were produced using both 50 and 100 m isotropicsearch ellipsoids (Figs. 7 and 8). Kriging prevents interpo-lation beyond the dataset, whereas DSI allows interpolationto the limits of the grid used, however large or small that is.
12 12
2 2
120 1200 0
00 20 20
All stones = 1 ct
All stones = 0.1 ct
All stones = 0.01 ct
All stones = 0.1 ct
All stones = 0.01 ct
a b
dcAll stones = 1 ct
All stones = 0.1 ct
All stones = 0.01 ct
All stones = 1 ct
All stones = 0.1 ct
All stones = 0.01 ct
P1 P3 P4 P5A P5B P6 P7 F1 F3 UFA
st m-3
ct m
-3
st m-3
ct m
-3
st m-3
ct m
-3
st m-3
ct m
-3
Fig. 5 Plots showing thecovariance between carats percubic metre and stones per cubicmetre in both Koala (a, c) andFox (b, d), with the wholedatasets represented in (a) and(b) and focussing on the low-grade end of the spectrum in (c)and (d) (area shown by boxes on(a) and (b)). A large spread ofdata points shows that there isno simple linear relationshipbetween carats per cubic metreand stones per cubic metre,indicating a range of diamondsizes contributing to the popu-lation. The difference in gradebetween the pipes is obvious,and similarities in the shape ofthe low-grade graphs can beseen. Covariance trend lines areshown for single populationscomprising 1, 0.1 and 0.01 ctstones
Bull Volcanol
Regions for kriging were defined by the geological modelallowing clipping to the pipe walls (Figs. 7 and 8). Moredetailed interpretation of the data would be performedduring resource estimation (see Dyck et al. 2004; Harrisonet al. 2009); however, for the purposes of this contributionwhich is to enable visualisation of data trends, this is asufficient representation.
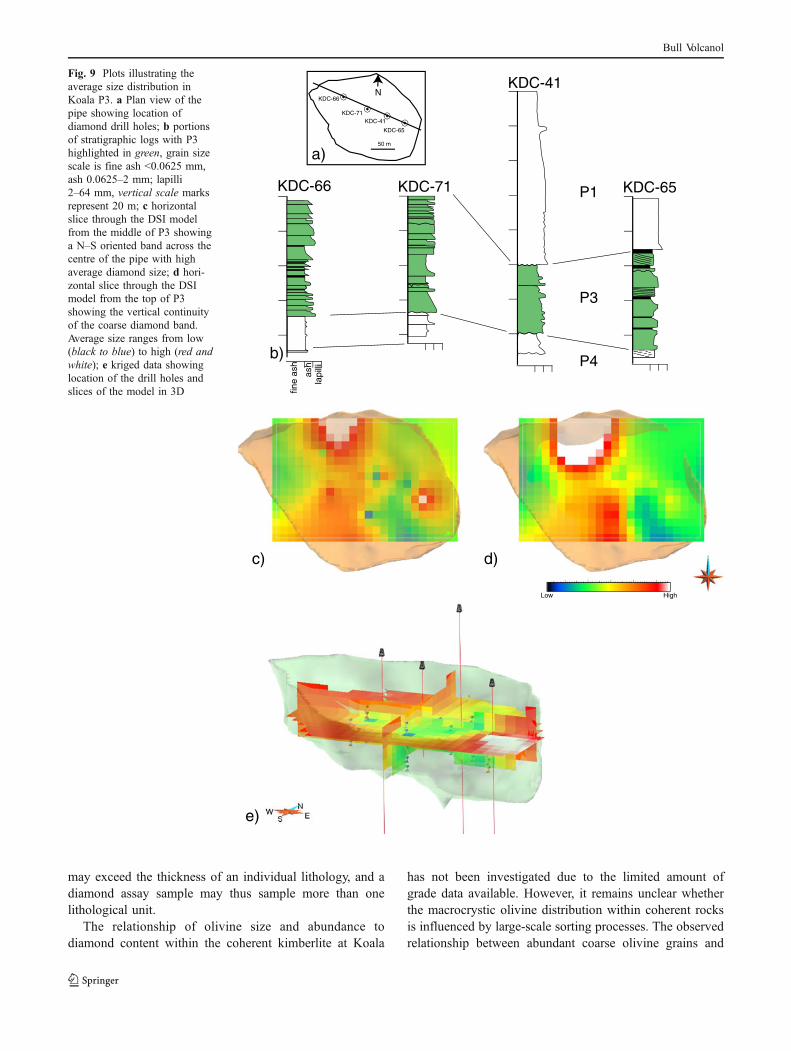
Presentation of the data in three dimensions allowsvisualisation of vertical and lateral trends, which, whencombined with detailed logging can be used to betterresolve the geological influences on diamond distribu-tion. Stratigraphic logging of four drill holes whichintersect the multiply bedded, upward-fining Koala P3(Fig. 9), reveals a coarser-grained, thicker-bedded inter-section in the central pipe (KDC-41 and 71) whereas theintersections towards the eastern and western sides of thepipe (KDC-65 and 66) show thinner, finer-grained bedswith more abundant mud-rich tops. The DSI model ofKoala reveals a band across the pipe (trending roughly N–S) located at the level of P3, where average diamond sizeis coarser than in the east and western regions (Fig. 9c, d),which roughly coincides with the observed coarser part ofthe unit. However, when using the kriged model, whichincorporates sharp lithological boundaries (Fig. 9e), thereverse is observed whereby the central N–S zone is azone of reduced average diamond size compared to theeastern and western regions. By treating the datasetglobally (here with DSI), different results are obtainedthan by treating the data lithology by lithology (here usingkriging).
Mantle minerals—a good proxy for diamond grade?
Kimberlite magmas transport xenocrysts and xenolithicfragments from the mantle to the surface, sampling thedifferent levels of the mantle as they pass through. Mantleminerals such as garnet and chrome diopside are commonlyused in diamond exploration as kimberlite indicatorminerals, with their presence indicating that mantle materialhas been sampled and, if the chemistry of the minerals isfavourable, that diamonds are likely to be present (e.g.Gurney 1989; Gurney et al. 1993; Nowicki et al. 2007).Olivine is also entrained from the mantle and is ubiquitousin kimberlites whether they are diamondiferous or not. Theweight and abundance of indicator minerals at Koalacorrelates broadly with diamond grade; however, variationsin mineral geochemistry do not appear to relate to diamondgrade variations (Nowicki and Gurney 1998). The densitiesof many of these mantle minerals are sufficiently similar tothose of diamonds so that volcanological and sedimentaryprocesses leading to concentration of diamonds are alsolikely to affect the distribution of olivine, chrome diopsideand garnet in a similar manner. Components with lowerdensities such as country rock material or finer grain sizessuch as kimberlite ash will also be sorted with hydraulicequivalence being more important than density or sizealone.
Indicator minerals, though of a higher abundance thandiamonds, represent only a small proportion of the pipeinfill (often <1%) and may not be visually abundant in drillcore, polished slabs or thin sections. The process of
Low High Low High
P1
P7
P6
P5b
P5a
P4P3
UFA
F1
F3
KOALA FOXFig. 6 3D models of both pipesshowing the internal geologyand location of sample points.Sample points are coloured fromblack (low), through blue andred, to white (high) based ontheir measured stones per cubicmetre; values are not shown dueto the proprietary nature of thedata, and high-grade Koala isnot equal in grade to high-gradeFox. The horizontal layering ofthe geology is reflected by thestone abundance, with obviouslow abundances present in theKoala P5a and Fox UFA
Bull Volcanol

collecting indicator mineral data is similar in expense andeffort to collecting diamond data itself, requiring both rockcrushing and heavy mineral separation. Macrocrysticolivine, however, often comprises the dominant mineralphase in kimberlites and is generally easily distinguishedfrom other components in drill core and has been proposedas a tool for predicting diamond grade (Field et al. 2009;Scott Smith and Smith 2009). It is apparent from thedistribution of diamond data between the differentlithological units discussed above that there is a general
relationship between olivine abundance and diamondgrade with low grade units such as Fox UFA and KoalaP5 also containing relatively low olivine abundanceswhen compared to the other units in the pipes (Table 2,Figs. 10 and 11).
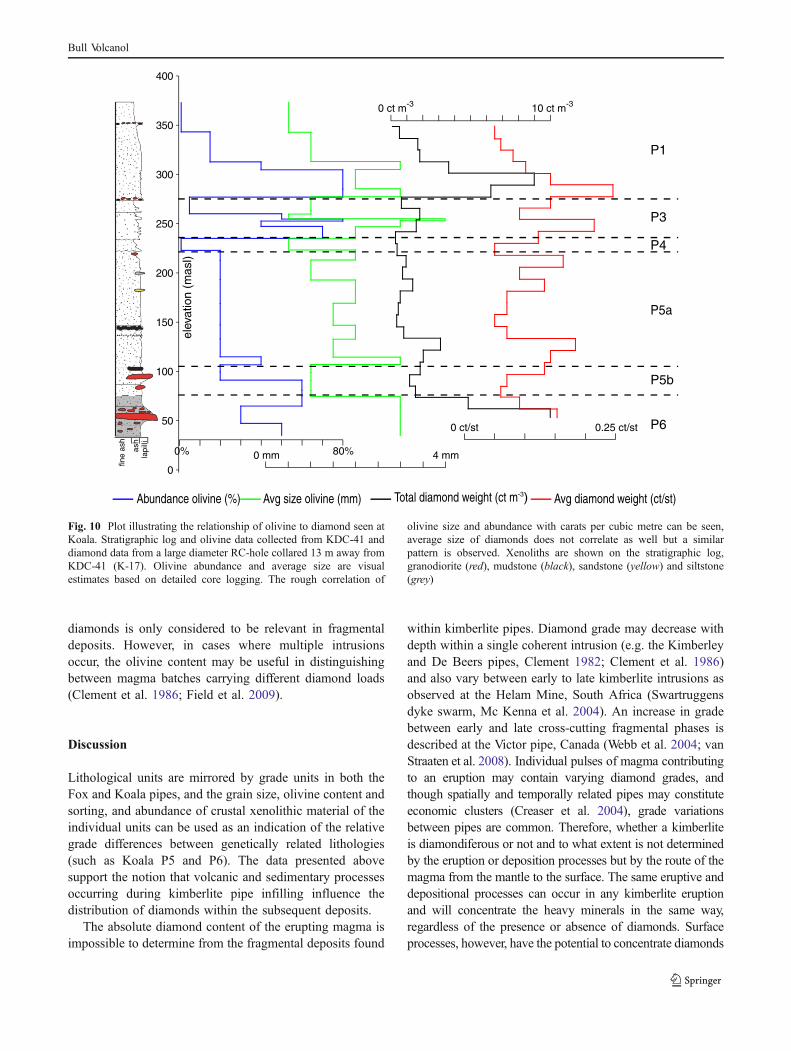
By comparing olivine grain size and abundance fromlogged diamond drill cores, with carats per cubic metre andaverage size of diamonds from nearby RC holes in bothKoala and Fox (Figs. 10 and 11) a similar correspondencecan be seen where diamond grade increases with increasing
A B C
D E F
Fig. 7 3D models showing theaverage size distribution withinKoala, with black representinglow values and red representinghigh values. a Plan view of theKoala pipe showing the internallayers and the position of thecross section used to illustratethe data. b Distribution ofsamples showing original datavalues prior to modelling. cSimple 3D DSI of global data,extrapolates data across abounding box and edge effectscan be seen. d 3D blocks formedfrom data bounding box andgeological units. e Kriged datausing a 50-m isotropic searchellipsoid, samples restricted tothe geological blocks shown in(d). f Kriged data using a 100-misotropic search ellipsoid,samples restricted to the geo-logical blocks shown in (d)
Bull Volcanol
olivine abundance and size. Diamond abundance (stone percubic metre) also follows similar trends; however, thecorrespondence is less pronounced than for carats per cubicmetre. In particular, the upward fining of the Koala P1mega-graded bed is reflected by both the grain size andabundance of olivine, and the grade and average size ofdiamonds (Fig. 10).
Unfortunately, the resolution of the diamond data is notas detailed as the olivine data (obtained from continuousvisual estimations during detailed core logging); severalboundaries are crossed by the grade samples, and distinctolivine rich horizons are incorporated in the samples wherethe background olivine is low in abundance. Also, whenassessing the trends seen in the Koala example (Fig. 10), it
should be noted that the spacing between the logged drillcore and the RC hole is 13 m, and lateral variations in thediamond/olivine abundance should also be considered.Ideally, the pilot drill holes for the RC sampling should bestudied, as in the Fox example (Fig. 11); however, thesewere not available for Koala.
This study shows that there is a geological influence ondiamond distribution at Fox and Koala and that there is apositive relationship between olivine and diamond abun-dance. However, it also highlights the limitations ofcomparing grade with lithology due to the differing scalesof observation and the diamond sampling techniques,which require a large amount of material to obtain arepresentative grade. The drill hole sample interval length
A B C
D E F
Fig. 8 3D models showing the average size distribution within Fox,with black representing low values and red representing high values. aPlan view of the Koala pipe showing the internal layers and theposition of the cross section used to illustrate the data. b Distributionof samples showing original data values prior to modelling. c Simple3D DSI of global data, extrapolates data across a bounding box and
edge effects can be seen. d 3D blocks formed from data bounding boxand geological units. e Kriged data using a 50-m isotropic searchellipsoid, samples restricted to the geological blocks shown in (d). fKriged data using a 100-m isotropic search ellipsoid, samplesrestricted to the geological blocks shown in (d)
Bull Volcanol
may exceed the thickness of an individual lithology, and adiamond assay sample may thus sample more than onelithological unit.
The relationship of olivine size and abundance todiamond content within the coherent kimberlite at Koala
has not been investigated due to the limited amount ofgrade data available. However, it remains unclear whetherthe macrocrystic olivine distribution within coherent rocksis influenced by large-scale sorting processes. The observedrelationship between abundant coarse olivine grains and
50 m
NKDC-66
KDC-65
KDC-41KDC-71
a)
b)
c) d)
fine
ash
ash
lapi
lli
P1
P4
P3
KDC-66 KDC-71
KDC-41
KDC-65
e)
Low High
Fig. 9 Plots illustrating theaverage size distribution inKoala P3. a Plan view of thepipe showing location ofdiamond drill holes; b portionsof stratigraphic logs with P3highlighted in green, grain sizescale is fine ash <0.0625 mm,ash 0.0625–2 mm; lapilli2–64 mm, vertical scale marksrepresent 20 m; c horizontalslice through the DSI modelfrom the middle of P3 showinga N–S oriented band across thecentre of the pipe with highaverage diamond size; d hori-zontal slice through the DSImodel from the top of P3showing the vertical continuityof the coarse diamond band.Average size ranges from low(black to blue) to high (red andwhite); e kriged data showinglocation of the drill holes andslices of the model in 3D
Bull Volcanol
diamonds is only considered to be relevant in fragmentaldeposits. However, in cases where multiple intrusionsoccur, the olivine content may be useful in distinguishingbetween magma batches carrying different diamond loads(Clement et al. 1986; Field et al. 2009).
Discussion
Lithological units are mirrored by grade units in both theFox and Koala pipes, and the grain size, olivine content andsorting, and abundance of crustal xenolithic material of theindividual units can be used as an indication of the relativegrade differences between genetically related lithologies(such as Koala P5 and P6). The data presented abovesupport the notion that volcanic and sedimentary processesoccurring during kimberlite pipe infilling influence thedistribution of diamonds within the subsequent deposits.
The absolute diamond content of the erupting magma isimpossible to determine from the fragmental deposits found
within kimberlite pipes. Diamond grade may decrease withdepth within a single coherent intrusion (e.g. the Kimberleyand De Beers pipes, Clement 1982; Clement et al. 1986)and also vary between early to late kimberlite intrusions asobserved at the Helam Mine, South Africa (Swartruggensdyke swarm, Mc Kenna et al. 2004). An increase in gradebetween early and late cross-cutting fragmental phases isdescribed at the Victor pipe, Canada (Webb et al. 2004; vanStraaten et al. 2008). Individual pulses of magma contributingto an eruption may contain varying diamond grades, andthough spatially and temporally related pipes may constituteeconomic clusters (Creaser et al. 2004), grade variationsbetween pipes are common. Therefore, whether a kimberliteis diamondiferous or not and to what extent is not determinedby the eruption or deposition processes but by the route of themagma from the mantle to the surface. The same eruptive anddepositional processes can occur in any kimberlite eruptionand will concentrate the heavy minerals in the same way,regardless of the presence or absence of diamonds. Surfaceprocesses, however, have the potential to concentrate diamonds
Avg diamond weight (ct/st)Abundance olivine (%) Avg size olivine (mm) Total diamond weight (ct m-3)
0
50
100
150
200
250
300
350
400
elev
atio
n (m
asl)
P1
P3
P4
P5a
P5b
P6
fine
ash
ash
lapi
lli
0% 80%0 mm 4 mm
0 ct m-3 10 ct m-3
0 ct/st 0.25 ct/st
Fig. 10 Plot illustrating the relationship of olivine to diamond seen atKoala. Stratigraphic log and olivine data collected from KDC-41 anddiamond data from a large diameter RC-hole collared 13 m away fromKDC-41 (K-17). Olivine abundance and average size are visualestimates based on detailed core logging. The rough correlation of
olivine size and abundance with carats per cubic metre can be seen,average size of diamonds does not correlate as well but a similarpattern is observed. Xenoliths are shown on the stratigraphic log,granodiorite (red), mudstone (black), sandstone (yellow) and siltstone(grey)
Bull Volcanol

from sub-economic magmas into economic abundances withinthe pipes. Therefore, simply identifying a pyroclastic flowdeposit, for instance, will not enable prediction of the grade ofthat unit without first having determined the presence ofdiamonds.
Sorting of diamonds during sedimentary transport anddeposition is well known from detrital diamond placerdeposits, where diamonds generally decrease in size awayfrom the source and are often found concentrated inbedrock traps (Gurney 1989). Sedimentary transport alsoaffects the quality of the diamonds due to preferentialbreakage of low-quality diamonds (boart) and diamondswith flaws or inclusions due to attrition (Gurney 1989;
Censier and Tourenq 1995). However, the influences ofvolcanic processes on diamond size distribution in primaryand resedimented kimberlitic volcaniclastic deposits havenot often been documented.
The liberation of diamonds from the host magma/xenoliths will influence the physical sorting process. Ifthey are not liberated, then the size/density of the enclosinghost clast will be the important factor in sorting.Understanding the location of diamonds either as freecrystals or inclusions in larger clasts is thereforeimportant. Unfortunately, whether they are containedwithin larger clasts or not is difficult to assess due tothe scarcity of diamonds seen in drill core.
0 ct m-3 2.5 ct m-3
0 ct/st 0.3 ct/st
-200
-100
0
100
200
300
400
elev
atio
n (m
asl)
UFA
F3
F1
Abundance olivine (%)
Avg size olivine (mm)
Total diamond weight (ct m-3)
Avg diamond weight (ct/st)
0% 70%0 mm 2.5 mmfin
e as
h
ash
lapi
lli
Fig. 11 Plot illustrating the relationship of olivine to diamond seen atFox. Stratigraphic log and olivine data collected from FDC-22 drilledas a pilot hole to a large diameter RC hole from which the diamonddata is taken (F-32). Olivine abundance and average size are visualestimates based on detailed core logging. The rough correlation ofolivine size and abundance with carats per cubic metre can be seen,average size of diamonds does not correlate as well but a similarpattern of low size in the UFA, elevated size in F3 and then slightly
reduced again in F1 is observed. The distinction between the UFA andF1 and F3 is obvious in all plots. An increased abundance ofgranodiorite (red), dolerite (blue) and mantle xenoliths (green) withdepth is shown on the stratigraphic log and this increased dilution mayaccount for the apparent decrease in diamond size and grade in the F1with depth, though grade sampling did not cover the full depth ofFDC-22
Bull Volcanol
The degree of physical sorting during eruption, transportand deposition can lead to an increase in relative diamondgrade by elutriation/removal of fine material and concen-tration of the coarser denser components. In particular, thefree crystal distribution of a pyroclastic deposit, which islikely to have more uniform initial size and densityproperties when compared to lithic fragments and juvenileclasts, can be used to interpret the transport system andemplacement process (Taddeucci and Palladino 2002). Inkimberlites, the main crystal phase is olivine; however,olivine is dominantly xenocrystic and the initial crystal sizedistribution in the erupting kimberlite magma is likely to bemore variable (Field et al. 2009; Jerram et al. 2009).
Enhancement of the grade
Nothing is known about the initial diamond (or olivine)distribution in the erupting magma at either Fox or Koala,though they were likely to have been different. At Koala,the late-stage intrusion (P7) suggests early pulses of magmamay have carried different grades (e.g. Mc Kenna et al.2004). Assuming the P6 erupting magma carried similargrades to P7 (~2 ct m−3), then significant enhancement ofthe grade (see Table 2) has occurred during the formation ofP6 (~4 ct m−3). Magma fragmentation during explosiveeruptions generates fine ash. Removal of ash by elutriationwithin an eruption column or during fluidisation would actto enhance the diamond grade in the subsequent depositrelative to that of the erupting magma. For Koala, P6removal of 50% of the ash (original fluid component of themagma) would be required to produce the observeddoubling of the diamond grade. Geochemical studies ofpyroclastic kimberlites at Ekati, including the Koala P6, byNowicki et al. (2008) suggest that up to 75% of thegroundmass component may actually be removed byelutriation of ash.
Grain size sorting also influences the diamond distribu-tion, though not necessarily the bulk grade of the deposit.The Koala P1 lithofacies shows a distinct grain size sortingwith coarse lapilli sized material, dominated by olivine, atthe base grading upwards to medium to fine ash at the topof the 100-m thick bed (Fig. 11). The diamond distributionalso follows a similar trend with more abundant and largerdiamonds at the base grading upwards to low-gradematerial at the top (Figs. 4, 7 and 11). Comparable olivinegrain-size grading is observed in the P3 lithofacies, thoughthe graded beds are much smaller and of a scale thatdiamond distribution cannot be determined. A similardistribution of diamonds within a mega-graded bed hasalso been described at the 140/141 kimberlite in the Fort ála Corné area (Berryman et al. 2004).
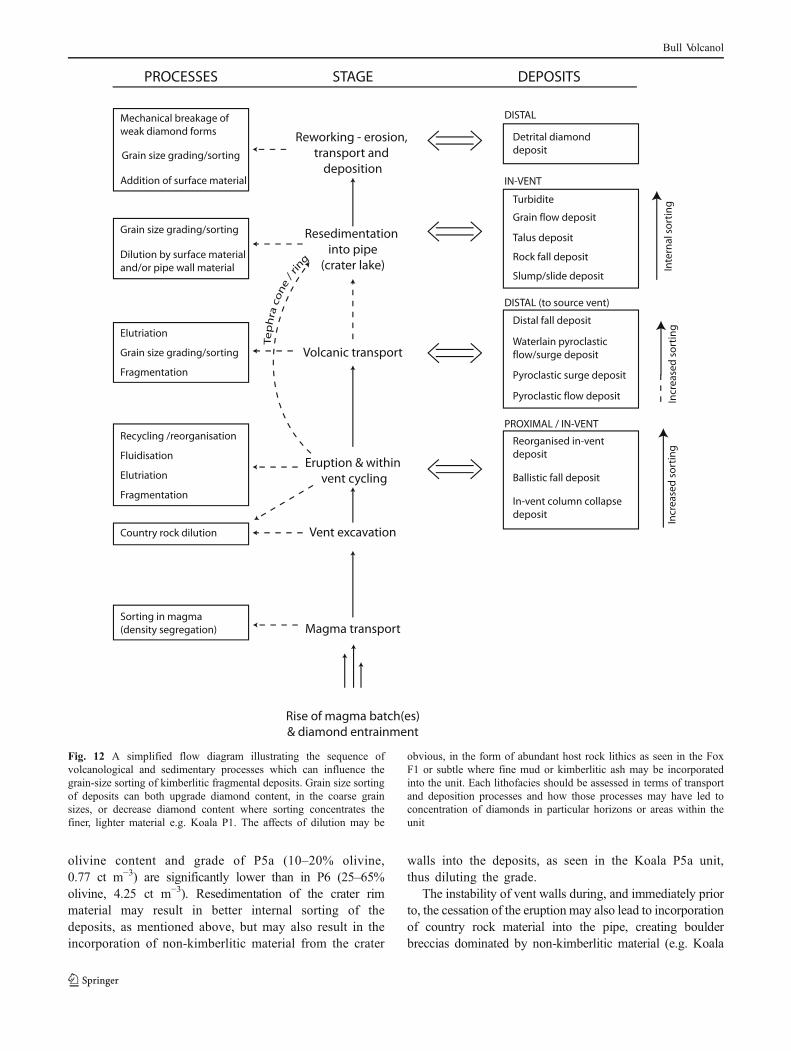
Processes such as large-scale sorting and removal of finematerial from the system (e.g. elutriation in an eruption
column or during fluidisation) causes grade enhancement(Fig. 12); smaller-scale sorting (e.g. in density currentsproducing graded beds such as P3 and P1) also enhancesgrade in the coarser portions of the deposit and alsoeffectively reduces the grade in the finer portions of thedeposit. Depending on the scale of the graded beds relatedto mining method (typical open pit bench heights at Ekatiare 10 m) and level of detailed geology, this sorting ofdiamonds within the deposit may be able to be exploitedduring mining.
Resedimentation of material from the crater rim backinto the vent may lead to further grain-size sorting intodiscrete coarse and fine horizons if sediment gravity flowsrather than slumping occurs. This may not influence theoverall grade of a mineable unit as the fine grain sizes willnot be removed from the material as it is deposited withinthe vent but simply segregated from the coarser grain-sizes,as the vent acts like a closed system. Rapid, large-scaledebris flows, such as the Koala P5, are not likely toimprove the overall sorting, as the matrix sediment hassome degree of cohesion, preventing settling of largerparticles (Boggs 2006).
Lowering the grade
A similar deposition mechanism is inferred for F1 as for P6;however, the diamond grades are very different. Theoriginal grades of the erupting magmas are likely to havebeen different to each other; however, the influence ofdilution by xenolithic crustal material on diamond grade isapparent. P6 contains <10% country rock lithic fragmentswhereas F1 contains >40% (Table 1), dilution of P6 by 40%would result in lowering of the grade to 2.55 ct m−3.Likewise, if we calculate the grade of the F1 depositwithout the 40% dilution, a grade of 1.05 ct m−3 isobtained. Dilution clearly adversely influences the diamondgrade of any deposit. Transient events leading to vent-widening during eruption can increase the abundance oflithic fragments (Cas and Wright 1987). Deposits resultingfrom early-stage column collapse (e.g. Fox F1, Porritt et al.2008a; Porritt and Cas 2009), occurring before ventclearing was complete are likely to contain higher abun-dances of country rock lithics than column collapsedeposits from the waning phase of an eruption (e.g. KoalaP6, Porritt 2008; Porritt and Cas 2011).
The affects of dilution can also be seen when comparing theolivine content and diamond grade of the lowermost fragmen-tal deposits in the Koala pipe, P6 and P5a (Tables 1, 2). Thesedeposits are genetically related in that they are the pyroclasticand volcaniclastic (resedimented from the tuff rim) depositsof the Koala eruption. Theoretically, they should havecomparable olivine and diamond contents if they are theproducts of the same erupting magma. However, both the
Bull Volcanol
olivine content and grade of P5a (10–20% olivine,0.77 ct m−3) are significantly lower than in P6 (25–65%olivine, 4.25 ct m−3). Resedimentation of the crater rimmaterial may result in better internal sorting of thedeposits, as mentioned above, but may also result in theincorporation of non-kimberlitic material from the crater
walls into the deposits, as seen in the Koala P5a unit,thus diluting the grade.
The instability of vent walls during, and immediately priorto, the cessation of the eruption may also lead to incorporationof country rock material into the pipe, creating boulderbreccias dominated by non-kimberlitic material (e.g. Koala
Fig. 12 A simplified flow diagram illustrating the sequence ofvolcanological and sedimentary processes which can influence thegrain-size sorting of kimberlitic fragmental deposits. Grain size sortingof deposits can both upgrade diamond content, in the coarse grainsizes, or decrease diamond content where sorting concentrates thefiner, lighter material e.g. Koala P1. The affects of dilution may be
obvious, in the form of abundant host rock lithics as seen in the FoxF1 or subtle where fine mud or kimberlitic ash may be incorporatedinto the unit. Each lithofacies should be assessed in terms of transportand deposition processes and how those processes may have led toconcentration of diamonds in particular horizons or areas within theunit
Bull Volcanol
P5b, Nowicki et al. 2004; Crawford et al. 2006; Porritt andCas 2011), and the distribution of large boulders within sucha unit influences the distribution of diamond grade. P5b isslightly anomalous in that although it is a boulder breccia,dominated by large granodiorite boulders; it returns a highergrade than the overlying P5a lithofacies. This is most likelydue to the presence of some P6 material in the brecciamatrix, the small sample population, and also the difficultiesin defining the boundaries of this irregular zone during RCdrilling and grade sampling.
The dilution factor for any kimberlite may be hard toquantify due to the physical nature of the rocks. A visualestimation of the abundance of country rock lithic fragmentshas been used in this study, supplemented by point counting ofclasts >2 mm. In some instances, the non-kimberlitic materialis not readily apparent, either due to fine grain sizes, alterationoverprints or incorporation of disaggregated material into thematrix. In these cases, whole rock geochemical analysis maybe used to quantify the degree of dilution (Nowicki et al.2008; Porritt and Cas 2009).
The varieties of eruption and depositional processes thatcan have an influence on sorting/diluting the kimberlitematerial are shown in Fig. 12. Detailed geologicalassessment of the lithofacies within each pipe and theirgenetic relationships to each other lead to a betterunderstanding of the grade distribution and can help torefine grade models.
Conclusions
At both the Fox and Koala kimberlite pipes, the individuallithological units are mirrored by the grade units, indicatingthat geological processes are important in distributingdiamonds both between and within the individual units. Apositive relationship between diamond grade and macrocrysticolivine size and abundance is seen, showing that sortingprocesses are involved in the distribution of these mineralsthroughout fragmental deposits. There is also a negativerelationship between diamond grade and dilution (commonlyin the form of granodiorite clast abundance) which is especiallyobvious when comparing overall grade between the P6 and F1pyroclastic deposits. The overall grade of F1 is significantlylower than that in P6; however, when recalculated to removethe effects of significant dilution by crustal xenolithic debris,the grades become more comparable. When predicting thegrade potential of different lithofacies, those with abundantcoarse olivine grains, few lithic fragments and low proportionsof fine-grained material are expected to yield the highestdiamond grades.
The influence of eruption, transport, deposition andresedimentation processes on the distribution of diamondswithin kimberlite pipes has been poorly documented, in
part due to the limited understanding of the geologicalprocesses, which have resulted in the deposits, and also inpart due to the proprietary nature of diamond data. Withoutknowing the original diamond content of the eruptingmagma, it is impossible to quantify the relative increase ordecrease of diamond grade within any unit due to thegeological processes occurring at the surface. However,based on an understanding of the grain size sorting, dilutionand olivine abundance, we can predict which lithofacies arelikely to carry the significant diamond grade and possiblywhere within these lithofacies higher grade zones might belocated. Processes such as elutriation in the eruptioncolumn, through large-scale fluidisation of deposits andwithin pyroclastic flows all help to upgrade the diamondcontent by removing fine ash from the final deposit. Furthersorting of material could occur if the vent was filled withwater at the time of deposition; however, the fines are notremoved from the system altogether. Facies developed inthis manner may have concentrated layers of coarsediamond bearing material, interbedded with, or overlainby, the finer material segregated by the water column. Inthese cases, concentration of diamonds may have occurredon a scale too fine to be exploited by conventional bulkmining methods, but which might be recovered by moreselective methods such as free digging.
Recognising depositional units from a different sourcevent, which most likely contain different diamond types aswell as abundances, is crucial in diamond grade modellingwhere the value of the diamonds, not just the abundance,becomes important. A good understanding of the eruption anddeposition processes may lead to recognition of areas forselective mining perhaps enhancing a sub-economic deposit.
Acknowledgements This research comprises part of a PhD thesis byLAP on the volcanology of the Ekati kimberlites. The authors wouldlike to thank BHP Billiton Canada Inc. for their financial support forthis research project. In particular, we would like to thank Jon Carlsonand the geologists and other staff members for their continued supportand valuable knowledge. We would like to thank Tom Nowicki, PatHayman and Stephen Moss for their invaluable insight and intellectualdiscussions. LAP would also like to acknowledge the current financialsupport of CBIE. This manuscript has benefitted greatly from reviewsby P. Kokelaar, one anonymous reviewer, and the editor RSJ Sparks.
References
Berryman AK, Scott Smith BH, Jellicoe BC (2004) Geology anddiamond distribution of the 140/141 kimberlite, Fort a la Corne,central Saskatchewan, Canada. Lithos 76(1–4):99–114
Boggs S (2006) Principles of sedimentology and stratigraphy. PearsonPrentice Hall, Upper Saddle River, p 662
Brown RJ, Field M, Gernon T, Gilbertson MA, Sparks RSJ (2008)Problems with an in-vent column collapse model for theemplacement of massive volcaniclastic kimberlite. J VolcanolGeotherm Res 178(4):847–850
Bull Volcanol
Cas RAF, Wright JV (1987) Volcanic Successions. Chapman and Hall,New York, p 528
Censier C, Tourenq J (1995) Crystal forms and surface textures ofalluvial diamonds from the western region of the Central-African-Republic. Mineral Deposita 30(3–4):314–322
Clement CR (1982) A comparative geological study of some majorkimberlite pipes in the Northern Cape and Orange Free State.University of Cape Town, Cape Town, p 2 vols
Clement CR, Harris JW, Robinson DN, Hawthorne JB (1986) The DeBeers kimberlite pipe - a historic South African diamond mine.In: Anhaeusser CR, Maske S (eds) Mineral Deposits of SouthernAfrica. Geological Society of South Africa, Johannesburg, pp2193–2214
Crawford B, Porritt LA, Nowicki TE et al (2006) Key geologicalcharacteristics of the Koala kimberlite, Ekati Diamond Mine,Canada. In: 2006 Kimberlite Emplacement Workshop. LongAbstracts, Saskatoon, Canada
Creaser RA, Grutter H, Carlson J, Crawford B (2004) Macrocrystalphlogopite Rb-Sr dates for the Ekati property kimberlites, SlaveProvince, Canada: evidence for multiple intrusive episodes in thePaleocene and Eocene. Lithos 76(1–4):399–414
Davis JC (1986) Statistics and data analysis in geology, 2nd edn.Wiley, Chichester, p 646
de Wit MCJ (1999) Post-Gondwana drainage and the developmentof diamond placers in western South Africa. Econ Geol 94(5):721–740
Dyck DR, Oshust PA, Carlson JA, Nowicki TE, Mullins MP(2004) Effective resource estimates for primary diamonddeposits from the EKATI Diamond Mine(TM), Canada. Lithos76(1–4):317–335
Fedortchouk Y, Canil D, Carlson JA (2005) Dissolution forms in Lacde Gras diamonds and their relationship to the temperature andredox state of kimberlite magma. Contrib Mineral Petrol 150(1):54–69
Field M, Gernon T, Mock A, Walters A, Sparks RSJ, Jerram DA (2009)Variations of olivine abundance and grain size in the snap lakekimberlite intrusion, Northwest Territories, Canada: a possibleproxy for diamonds. Lithos 112(1):23–35, 9th International Kim-berlite Conference Proceedings
Gernon T, Fontana G, Field M, Sparks RSJ, Brown RJ, Mac NiocaillC (2009a) Pyroclastic flow deposits from a kimberlite eruption:the Orapa South Crater, Botswana. Lithos 112(Supplement1):566–578
Gernon T, Gilbertson MA, Sparks RSJ, Field M (2009b) The role ofgas-fluidisation in the formation of massive volcaniclastickimberlite. Lithos 112(Supplement 1):439–451
Gurney JJ (1989) Diamonds. In: Ross J, Jaques AL, Ferguson J, GreenDH, Reilly SY O, Danchin RV, Janse AJA (eds) Kimberlites andRelated Rocks, Proceedings of the Fourth InternationalKimberlite Conference, Perth 1986, Geological Society ofAustralia Special Publication No. 14. Blackwell, Oxford, pp935–965
Gurney JJ, Helmstaedt HH, Moore RO (1993) A review of the use andapplication of mantle mineral geochemistry in diamond explora-tion. Pure and Applied Chemistry 65:2423–2442
Gurney JJ, Helmstaedt HH, Le Roex AP et al (2005) Diamonds:Crustal Distribution and Formation Processes in Time and Spaceand an Integrated Deposit Model. Econ Geol 100th AnniversaryVolume:143–177
Harris JW (1992) Diamond geology. In: Field JE (ed) TheProperties of Natural and Synthetic Diamonds. Academic,London, pp 345–393
Harrison S, Leuangthong O, Crawford BB, Oshust PA (2009)Uncertainty-based grade modelling of kimberlite: a case studyof the Jay kimberlite pipe, EKATI Diamond Mine, Canada.Lithos 112(Supplement 1):73–82
Holden E, Moss S, Russell JK, Dentith M (2009) An image analysismethod to determine crystal size distributions of olivine inkimberlite. Comput Geosci 13:255–268
Jerram DA, Mock A, Davis GR, Field M, Brown RJ (2009) 3DCrystal size distributions: a case study on quantifying olivinepopulations in kimberlites. Lithos 112(Supplement 1):223–235
Kjarsgaard BA,Wilkinson L, Armstrong JP (2002) Geology, Lac de Graskimberlite field, Central Slave Province, Northwest Territories-Nunavut. In: Open File 3228. Geological Survey of Canada,
Lorenz V, Zimanowski B, Buettner R (1999) Discussion on theformation of kimberlite pipes: the phreatomagmatic model. CEVNewsletter, IAVCEI:11–17
Mallet JL (1989) Discrete smooth interpolation. ACM Trans Graph 8(2):121–144
Mallet JL (1992) Discrete smooth interpolation in geometric modelling. JComp Aid Des 24(4):177–191
Mc Kenna N, Gurney JJ, Klump J, Davidson JM (2004) Aspects ofdiamond mineralisation and distribution at the Helam Mine,South Africa. Lithos 77(1–4):193–208
Meyer HOA (1987) Inclusions in diamond. In: Nixon PH (ed) MantleXenoliths. Wiley, Chichester, pp 501–523
Moss S, Russell JK, Andrews GDM (2008) Progressive infilling of akimberlite pipe at Diavik, Northwest Territories, Canada: insightsfrom volcanic facies architecture, textures, and granulometry. JVolcanol Geotherm Res 174(1–3):103–116
Moss S, Russell JK, Scott Smith BH, Brett RC (2010) Olivine crystalsize distribution in kimberlite. Am Mineral 95:527–536
Nassichuk WW, Dyck DR (1998) Fossils recovered from KimberlitePipes in the Lac de Gras Field, Slave Province, NorthwestCanada; Geological Implications. In: Extended Abstracts 7thInternational Kimberlite Conference. Cape Town, pp 612–614
Nowicki TE, Gurney JJ (1998) The relationship between indicatorminerals and diamond grade in samples from the Panda andKoala kimberlites: a test study. In: Mineral Services (Pty) Ltd,unpublished company report, p 10
Nowicki T, Crawford B, Dyck D, Carlson J, McElroy R, Oshust P,Helmstaedt H (2004) The geology of kimberlite pipes of theEkati property, Northwest Territories, Canada. Lithos 76(1–4):1–27
Nowicki TE, Moore RO, Gurney JJ et al (2007) Chapter 46 Diamondsand Associated Heavy Minerals in Kimberlite: A Review of KeyConcepts and Applications. Developments in Sedimentology.Elsevier, Amsterdam, p 1235
Nowicki T, Porritt L, Crawford B, Kjarsgaard B (2008) Geochemicaltrends in kimberlites of the Ekati property, Northwest Territories,Canada: insights on volcanic and resedimentation processes. JVolcanol Geotherm Res 174(1–3):117–127
Porritt LA (2008) The volcanology and sedimentology of the Ekatikimberlites, NWT, Canada, with consideration of the implicationsfor diamond grade. In: School of Geosciences. Monash University,Clayton, Australia
Porritt LA, Cas RAF (2009) Reconstruction of a kimberlite eruption,using an integrated volcanological, geochemical and numericalapproach: a case study of the Fox Kimberlite, NWT, Canada. JVolcanol Geotherm Res 179(3–4):241–264
Porritt LA, Cas RAF (2011) The influence of complex intra- andextra-vent processes on the deposit characteristics of the KoalaKimberlite, NWT, Canada: volcanology, sedimentology and rootzone processes. Bull Volcanol. doi:10.1007/s00445-011-0452-5
Porritt LA, Cas RAF, Crawford BB (2008a) In-vent column collapseas an alternative model for massive volcaniclastic kimberliteemplacement: an example from the Fox Kimberlite, EkatiDiamond Mine, NWT, Canada. J Volcanol Geotherm Res 174(1–3):90–102
Porritt LA, Cas RAF, Crawford BB (2008b) Reply to: Discussion byBrown et al. on “In-vent column collapse as an alternative modelfor massive volcaniclastic kimberlite emplacement: An example
Bull Volcanol
from the Fox kimberlite, Ekati Diamond Mine, NWT, Canada”. JVolcanol Geotherm Res 178(4):851–854
Rombouts L (1995) Sampling and statistical evaluation of diamonddeposits. J Geochem Explor 53(1–3):351–367
Rombouts L (1999) Extreme value analysis of diamond sizes andvalues. In: Gurney JJ, Gurney JL, Pascoe MD, Richardson SH(eds) Proceedings of the VIIth International Kimberlite Conference.Red Roof Design, Cape Town, pp 721–727
Rombouts L (2003) Assessing the diamond potential of kimberlitesfrom discovery to evaluation bulk sampling. Mineral Deposita 38(4):496–504
Scott Smith BH, Smith SCS (2009) The economic implications ofkimberlite emplacement. Lithos 112(Supplement 1 (9th Interna-tional Kimberlite Conference Proceedings)):10–22
Sparks RSJ, Baker L, Brown RJ, Field M, Schumacher J, Stripp G,Walters A (2006) Dynamical constraints on kimberlite volcanism.J Volcanol Geotherm Res 155(1–2):18
Stiefenhofer J, Farrow DJ (2004) Geology of the Mwadui kimberlite,Shinyanga district, Tanzania. Lithos 76(1–4):139–160
Svisero DP (1995) Distribution and origin of diamonds in Brazil: anoverview. J Geodyn 20(4):493–514
Taddeucci J, Palladino DM (2002) Particle size-density relationshipsin pyroclastic deposits: inferences for emplacement processes.Bull Volcanol 64(3–4):273–284
Terry RD, Chilingar GV (1955) Summary of ‘Concerning someadditional aids in studying sedimentary formations’ by M.S.Shretsor. J Sediment Petrol 25:229–234
van Straaten BI, Kopylova MG, Russell JK, Webb KJ, Scott Smith BH(2008) Discrimination of diamond resource and non-resourcedomains in the Victor North pyroclastic kimberlite, Canada. JVolcanol Geotherm Res 174(1–3):128–138
Webb KJ, Scott Smith BH, Paul JL, Hetman CM (2004) Geology ofthe Victor Kimberlite, Attawapiskat, Northern Ontario, Canada:cross-cutting and nested craters. Lithos 76(1–4):29–50
Bull Volcanol