Embed Size (px)
Citation preview

Population Ageing in Zambia:
Magnitude, Challenges and Determinants
BY
Christopher Chabila Mapoma
Thesis submitted to the University of Zambia for the
fulfillment of the degree of Doctor of Philosophy in:
POPULATION STUDIES
THE UNIVERSITY OF ZAMBIA LUSAKA
2013
i
DECLARATION
I Christopher Chabila Mapoma hereby declare that this Thesis represents my
work, has not previously been submitted for any degree at this or any other
University and does not incorporate any published work or material from
another thesis or dissertation.
_________________________________
Christopher Chabila Mapoma

ii
All rights reserved. No part of this thesis maybe reproduced or stored in
any form or by any means without prior permission in writing from the
author or the University of Zambia.

iii
APPROVAL
This Thesis of Christopher Chabila Mapoma is approved as fulfilling the
requirements for the award of the degree of Doctor of Philosophy in
Population Studies by The University of Zambia.
Signed: Date:
___________________________ ______________________
___________________________ ______________________
___________________________ ______________________

iv
ABSTRACT
This Study investigated the magnitude, challenges and determinants of
population ageing in Zambia. Specifically, the study investigated past and
future trends of population ageing; challenges older people face, determinants
of active ageing and the existence and adequacy of policies for older people. The
study has demonstrated that Zambia's population, like the rest of Africa is also
ageing; older people are faced with several challenges occurring at individual or
micro level as well as those determined by the socio-economic and
demographic environment or macro level. However, the most prominent of
them all is low self-esteem. Others which directly contribute to low self-esteem
include health problems, functional limitations, lack of care and support – both
by family and institutions, including government – constrained living
arrangements and lack of opportunities for both work and income generating
activities. This study has also shown that income accessibility (Economic
Determinant), functional limitations (Health Determinants), low self esteem and
loneliness (Personal/Behavioural Determinants), low family and peer
interactions (Social Determinants) and HIV/AIDS determine active ageing in
Zambia. With regard to policies, the study has demonstrated that although the
draft policy on ageing is currently in place, it falls short of addressing many
aspects and challenges of ageing. In view of these findings, the study
recommends a paradigm shift where the family is strengthened and
encouraged to continue playing its traditional, but significant role of looking
after, caring for and supporting older generations. The study also recommends
that the policy on ageing should be structured to reflect main determinants of
active ageing in the context of Zambia.

v
DEDICATION
To my children:
I thank The Lord Jesus Christ for you little angels; to me, you will forever be
my babies no matter how big or old you become; but I challenge you to excel
beyond and above this piece of work; remember no obstacle is insurmountable;
faith in GOD and hard work does the trick.
vi
ACKNOWLEDGEMENTS
I am greatly indebted to my supervisor, Dr. Augustus Kasumpa Kapungwe
whose efforts, patience and parental approach to academics made this work
come to a fruitful conclusion.
I thank the United Nations Population Fund (UNFPA) and the University of
Zambia – Staff Development Office, for monetary support especially for field
work activities;
I am very thankful to late Yorum Banda (MHSRIP) and the team for the actual
collection of data; Andrew Banda, Million Phiri and Elizabeth Nyirenda for their
support on data entry screen design, data entry and cleaning;
Lastly, I pay homage to colleagues and staff in the Social Development Studies
Department and the new Department of Population Studies for their support.

vii
TABLE OF CONTENTS
DECLARATION .............................................................................................. I
CERTIFICATE OF APPROVAL ........................................................................ II
ABSTRACT ............................................................................................ IV
DEDICATION ............................................................................................. V
ACKNOWLEDGEMENTS ................................................................................ VI
CHAPTER 1: INTRODUCTION .................................................................... 1
1.1 What is Population Ageing? ............................................................................. 1
1.2 Determinants of Population Ageing ................................................................. 1
1.3 Magnitude and Speed of Population Ageing ..................................................... 5
1.4 Challenges of Ageing in the African Context .................................................... 9
1.5 Statement of the Problem .............................................................................. 11
1.6 Objectives ..................................................................................................... 12
1.7 Research Questions ................................................................................ 12
1.8 Significance of the Study ............................................................................... 13
1.9 Conceptual Framework ................................................................................. 13
1.9.1 Active Ageing Policy Framework .............................................................. 14
1.9.2 Culture and Gender ................................................................................ 15
1.9.3 Behavioural and Psychological Factors ................................................... 16
1.9.4 Social and Environmental Factors .......................................................... 16
1.9.5 Economic Factors ................................................................................... 17
1.9.6 United Nations Principles for Older People .............................................. 18
1.9.7 HIV/AIDS as a Determinant .................................................................. 20
CHAPTER 2: LITERATURE REVIEW ......................................................... 22
2.1 Poverty: A Serious Challenge in Old age ........................................................ 22
2.2 Family Relationships and Ageing ................................................................... 24
2.3 Living Arrangements, Social Contacts and Networks ..................................... 26
2.4 Health and Functional Limitations in Old Age ............................................... 28
2.5 Self Esteem and Loneliness in Old Age .......................................................... 31
2.6 HIV/AIDS and Ageing ................................................................................... 33
2.7 Policies and Programmes: Historical Review .................................................. 38
viii
2.7.1 Early Policies and Programmes on Ageing .............................................. 39
2.7.2 National Health Programme ................................................................... 39
2.7.3 Housing and Environment ..................................................................... 40
2.7.4 Social Welfare Services .......................................................................... 40
2.7.5 Education .............................................................................................. 41
2.7.6 Employment .......................................................................................... 41
2.7.7 Social Security ....................................................................................... 41
2.7.8 Other Interventions on Ageing by the UNIP Government ......................... 42
2.8 Recent/Current Policies and Programmes on Ageing .................................... 44
2.8.1 Public Welfare Assistance Scheme (PWAS) ............................................. 45
2.8.2 Social Cash Transfer Scheme (SCTS) ..................................................... 46
2.8.3 Institutional Care Programme ................................................................ 48
2.8.4 The Population Policy............................................................................. 48
2.8.5 Health Policy .......................................................................................... 51
2.8.6 National Employment and Labour Market Policy.................................... 54
2.8.7 Other Long-Term Policies ....................................................................... 57
2.9 Summary of the Literature .................................................................... 59
CHAPTER 3: METHODOLOGY ................................................................. 61
3.1 Research Design ........................................................................................... 61
3.2 Target Population and Study Areas ............................................................... 61
3.2.1 Working Definition of an ‗Old Person‘ ..................................................... 61
3.2.2 Study Areas ........................................................................................... 62
3.2.3 Study Area Details ................................................................................. 62
3.2.4 Sampling, Selection of Respondents and Sample Size ............................ 64
3.3 Data Collection Instruments and Techniques ................................................ 66
3.3.1 Instruments ........................................................................................... 66
3.3.2a Quantitative Data ................................................................................ 66
3.3.2b Qualitative Data .................................................................................. 67
3.4 Data Analysis ................................................................................................ 68
3.5 Ethical Considerations .................................................................................. 68
3.6 Challenges of Data Collection ........................................................................ 69
3.7 SPECTRUM Model Methodology .................................................................... 69
ix
3.7.2 Projections Assumptions ........................................................................ 71
3.7.3 Data Input and Justification .................................................................. 73
3.7.4 Other Input Assumptions ...................................................................... 73
CHAPTER 4: FINDINGS ........................................................................... 75
PART I PROJECTIONS ..................................................................... 75
4.1 Projecting the Older Population- Zambia: 1950 To 2050................................ 75
4.1.1 Patterns and Trends of Ageing Differentials by Projection Periods – 1950 to
2000 and 2000 To 2050 .......................................................................... 77
SUMMARY – PART I .................................................................................... 80
PART II CHARACTERISTICS AND CHALLENGES ................................. 81
4.2 Social, Demographic and Economic Characteristics of Respondents ............. 81
4.2.1 Background Characteristics - Sample and Respondents ........................ 81
4.2.2 Other Socio-demographic Characteristics .............................................. 83
4.3 Challenges Faced by Older People ................................................................. 85
4.3.1 Individual Level Challenges .................................................................... 86
4.3.2 Self-esteem and Loneliness .................................................................... 86
4.3.3 Self-esteem, Loneliness and Selected Characteristics .............................. 89
4.3.4 Health Status ........................................................................................ 92
4.3.5 Functional Limitations ........................................................................... 94
4.4 Challenges due to the Socio-economic Environment ..................................... 96
4.4.1 Sanitary Facilities .................................................................................. 96
4.4.2 Housing Quality ..................................................................................... 98
4.4.3 Work and Sources of Income ................................................................. 99
4.4.4 Care, Living Arrangements, Social Contacts and Coping Strategies ....... 105
4.4.5 Care for the Aged ................................................................................. 105
4.4.6 Living Arrangements ............................................................................ 108
4.4.7 Social Interactions ............................................................................... 111
4.4.8 Material and Other Forms of Support .................................................. 115
4.4.9 Social, Emotional and Spiritual Support .............................................. 117
4.4.9a Orphan and Dependent Child Care .................................................... 118
4.4.9b Community Perceptions on Ageing..................................................... 120
SUMMARY PART II ................................................................................... 125
PART III DETERMINANTS OF ACTIVE AGEING .................................. 125

x
4.4.9c Active Ageing in Zambia ..................................................................... 125
4.4.9c.1 Model for Determinants of Active Ageing ............................................ 127
4.4.9c.2 Influence of Determinants on Active Ageing ....................................... 130
SUMMARY – PART III ................................................................................ 138
PART IV POLICIES AND PROGRAMS ................................................. 138
4.5 Adequacy of the Draft Policy on Ageing in Zambia ....................................... 138
4.6.5 Objectives, Measures and Implementation Strategy for the Policy on
Ageing ................................................................................................... 142
SUMMARY OF PART IV ............................................................................. 147
CHAPTER 5: SUMMARY, DISCUSSION AND CONCLUSION ......................... 148
5.1 Summary of Main Findings ......................................................................... 148
5.1.1 Demographic Estimates and Projections .............................................. 148
5.1.2 Challenges and Determinants of Ageing ................................................ 149
5.1.3 Policies and Programmes on Ageing ..................................................... 150
5.2 Discussion .................................................................................................. 150
5.2.1 Lessons from Challenges on Ageing ..................................................... 158
5.2.2 What Really Determines Active Ageing in Zambia? ............................... 161
5.3 Active Ageing and the Family – The Zambian Context ................................. 163
5.4 Conclusion .................................................................................................. 170
5.5 Future Research Areas ................................................................................ 172
REFERENCES ......................................................................................... 173
APPENDICES ......................................................................................... 185
Appendix 1: Individual Questionnaire ................................................................... 185
Appendix 2: Focus group discussion guide ........................................................... 193
xi
LIST OF FIGURES
Figure 1: Total Fertility Rate and Life Expectancy at Birth, 1950-2050……13
Figure 2: Total Fertility Rate: World and Development Regions,
1950-2050 ………………………………………………………………………14
Figure 3: Life Expectancy at Birth: World and Development Regions,
1950-2050 ………………………………………………………………………16
Figure 4: Population Aged 60 and above: World and Development
Regions, 1950-2050 …………………………………………………………. 17
Figure 5: Average Annual Growth rate of Population Aged 60 and
Above: World and Development Regions, 1950-2050 ………………...19
Figure 6: Distribution of the World‘s Population Aged 60 and above
by World and Development Regions, 1950-2050 ……………………… 20
Figure 7: Determinants of Active Ageing ……………………………………….. 26
Figure 7a: Determinants of Active Ageing: Modified with HIV/AIDS……… 31
Figure 8: Population of Zambia 60+, 1950 - 2000…………………..……….. 87
Figure 10: Projected Total Population of Zambia 60+, 2000 – 2050 ……… 88
Figure 12: Percentage of Older Population 60+ Against the Total
Population 1950 – 2000 ……………………………………………………. 89
Figure 13: Projected Proportions of the Population 60+ for Zambia,
2000 – 2050 …………………………………………………………………… 90
Figure 15: Projected Proportions –Rural/Urban Population Age
60+, 2000 – 2050 ……………………………………………………………. 91
xii
LIST OF TABLES
Table 1.1: Background Characteristics of Respondents ………………….93
Table 1.2: Marital Status, Living Children and Education Attainment
by Age, Gender, Residence and Current Place of Stay……….94
Table 1.3: Self-Esteem and Loneliness by Age, Gender
and Residence …………………………… ………..…………………98
Table 1.4: Self-Esteem, Loneliness and Selected Characteristics………101
Table 1.5: Reported Illnesses by Age, Gender and Residence …………..104
Table 1.6: Functional Limitations by Age, Gender and Residence …….106
Table 1.7: Sanitary Facilities by Age, Sex ……………………………………107
Table 1.7.1 Main Sources of Water……………………………………………..108
Table 1.7.2 Main Materials for the Housing Units ………………………….109
Table 1.8: Work related Activities and Sources of Income
by Age, Gender and Residence ………………..………………..112
Table 1.9: Care-giving by Age, Gender and Residence …………………..117
Table 2.0: Living Arrangements by Age, Sex and Residence ……………120
Table 2.1: Social Interactions with Relatives and Peers …………………123
Table 2.2: Material, Monetary and Other Forms of Support ……………127
Table 2.3: Orphan Care ………………………..……………………………….131
Table 2.4: Percent Distribution of Determinants of Active Ageing and
Selected Indicators of Active Ageing ….. ………………………138
Table 2.5: Influence of Determinants of Active Ageing and on Active
Active Ageing Indicators……………..….. ………………………140
Table 2.6: Influence of Determinants of Active Ageing on
Active Ageing …………………………..….. ………………………147
LIST OF TABLES

1
__________________________________________________________________________
CHAPTER 1: INTRODUCTION
“…It is not by muscle, speed or physical dexterity that great things are achieved, but by
reflection, force of character, and judgment; and in these qualities old age is usually not
poorer, but is even richer” (Marcus Tullius Cicero, Roman Senator (106-43 B.C)).
This chapter contextualizes the problem as well as giving the background to
ageing at global and regional levels. The chapter also discusses the statement
of the problem, rationale, objectives and the conceptual framework.
1.1 What is Population Ageing?
When the question ‗what is population ageing?‘ is asked, different answers
emerge. While the question is simple, it however, yields several uncomplicated
but differing answers. The commonest response is that ‗there is change in age
structure where older people become more prominent‘. Another response is ‗the
increase in the proportion of older people compared to younger ages‘; similarly,
others say it is the ‗increase in the old age dependency ratios‘ (Kucera, 2010;
Weeks, 2004; Medicare Board of Trustees, 2003; US Census Bureau, 2000;
ILO/EASMAT, 1997). The common part of all these answers to this question is
that when the population is ageing, there is also change in the age structure
with an increasing proportion of older people in the population. According to
the United Nations World Population Ageing (2009), population ageing is simply
‗the process whereby older individuals account for a proportionally larger share
of the population‘.
1.2 Determinants of Population Ageing
Population ageing has been linked to ‗demographic transition‘. The reason for
this linkage is because the underlying processes have been similar to the
demographic transition (United Nations, 2007a). Decreasing fertility, along with
increasing life expectancy, has reshaped the age structure of the population in
most regions of the planet by shifting the relative weight of the population from

2
younger to older groups (Lesthaeghe, 2004). Figure 1 presents Total Fertility
Rate (TFR) reductions experienced at global level since 1950 projected through
to 2050 and life expectancy for the same period.
Figure 1: Total Fertility Rate and Life Expectancy at Birth, 1950-2050
Source: United Nations – World Population Ageing, 2009
One of the prominently cited reasons contributing to population ageing in the
world is fertility reduction. Decreasing fertility has been the primary cause of
population ageing. As fertility moves steadily to lower levels, people of
reproductive age have fewer children relative to those of older generations.
Sustained fertility reductions eventually lead to a reduction of the proportion of
children and young persons in a population and a corresponding increase of
the proportions in older groups (United Nations, 2009). The reduction of
fertility has been dramatic since 1950. At the world level, total fertility has
dropped almost by half, from 4.9 children per woman in 1950-1955 to 2.6 in
2005-2010, and it is expected to keep on declining to reach 2.0 children per
woman in 2045-2050 (United Nations, 2009).

3
Due to the continuous decrease in fertility, many countries of the world,
especially the more developed regions, have been affected by having a fertility
level considered below replacement. For example, total fertility in the more
developed regions has dropped from an already low level of 2.8 children per
woman in 1950-1955, to an extremely low level of 1.6 children per woman in
2005-2010. This level is well below that needed to ensure replacement of
generations (about 2.1 children per woman). In fact, practically all developed
countries are currently experiencing below-replacement fertility (Ibid, 2009). In
less developed countries, the situation is similar. The United Nations (2007a)
reports that major fertility reductions in the less developed regions occurred, in
general, during the last three decades of the twentieth century. From 1950-
1955 to 2005-2010, total fertility in the developing world dropped by over half
from 6.0 to 2.7 children per woman (Figure 2).
Figure 2: Total Fertility Rate: World and Development Regions, 1950-2050
Source: United Nations – World Population Ageing 2009
4
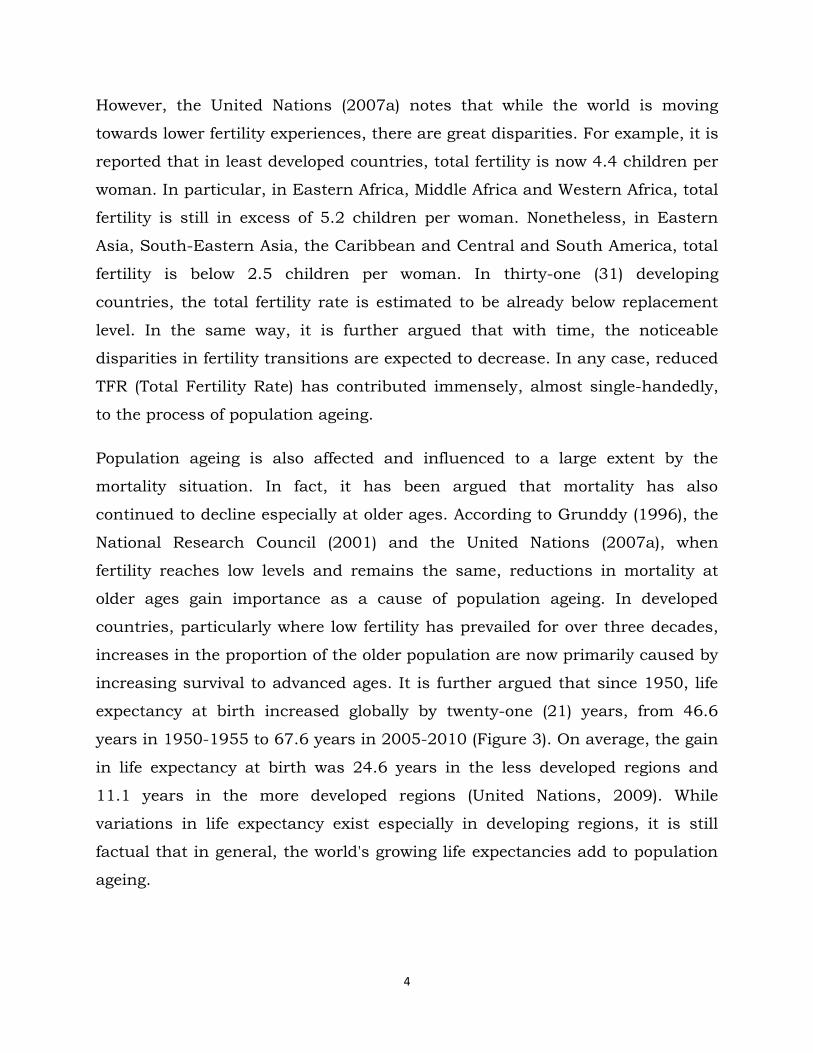
However, the United Nations (2007a) notes that while the world is moving
towards lower fertility experiences, there are great disparities. For example, it is
reported that in least developed countries, total fertility is now 4.4 children per
woman. In particular, in Eastern Africa, Middle Africa and Western Africa, total
fertility is still in excess of 5.2 children per woman. Nonetheless, in Eastern
Asia, South-Eastern Asia, the Caribbean and Central and South America, total
fertility is below 2.5 children per woman. In thirty-one (31) developing
countries, the total fertility rate is estimated to be already below replacement
level. In the same way, it is further argued that with time, the noticeable
disparities in fertility transitions are expected to decrease. In any case, reduced
TFR (Total Fertility Rate) has contributed immensely, almost single-handedly,
to the process of population ageing.
Population ageing is also affected and influenced to a large extent by the
mortality situation. In fact, it has been argued that mortality has also
continued to decline especially at older ages. According to Grunddy (1996), the
National Research Council (2001) and the United Nations (2007a), when
fertility reaches low levels and remains the same, reductions in mortality at
older ages gain importance as a cause of population ageing. In developed
countries, particularly where low fertility has prevailed for over three decades,
increases in the proportion of the older population are now primarily caused by
increasing survival to advanced ages. It is further argued that since 1950, life
expectancy at birth increased globally by twenty-one (21) years, from 46.6
years in 1950-1955 to 67.6 years in 2005-2010 (Figure 3). On average, the gain
in life expectancy at birth was 24.6 years in the less developed regions and
11.1 years in the more developed regions (United Nations, 2009). While
variations in life expectancy exist especially in developing regions, it is still
factual that in general, the world's growing life expectancies add to population
ageing.

5
Figure 3: Life Expectancy at Birth: World and Development Regions, 1950-2050
Source: United Nations – World Population Ageing, 2009
1.3 Magnitude and Speed of Population Ageing
According to the World Population Ageing Report (2009), the number of older
persons has more than tripled since 1950 and it is expected to almost triple by
2050. In 1950, there were 205 million persons aged sixty (60) and above
throughout the world. At that time, only three countries had more than 10
million people aged sixty (60) and above; China (41 million), India (20 million),
and the United States (20 million). By 2009, the number of persons aged sixty
(60) and above had increased three and a half times to 737 million, with twelve
countries harbouring more than 10 million people aged sixty (60) and above,
including China (160 million), India (89 million), the United States (56 million),
Japan (38 million), the Russian Federation (25 million) and Germany (21
million). By 2050, the population aged sixty (60) and above is projected to
increase to 2 billion (Figure 4).

6
Figure 4: Population Aged Sixty (60) and Above: World and Development Regions,
1950-2050
Source: United Nations – World Population Ageing, 2009
In terms of growth, the older population is in fact growing at a much faster rate
compared to the entire world population. The United Nations (2009) reports
that in 1950-1955, the average annual growth rate of the number of persons
aged sixty (60) years and above (1.7 per cent) was similar to the rate of growth
for the total population (1.8 per cent, Figure 5). Since 2000, the situation has
even become more intense. Between 2005 and 2010, the growth rate of the
older population, at 2.6 per cent annually, was more than twice that of the
total population (1.2 per cent). Over the mid-term future, the difference
between those two growth rates is expected to increase as the baby boom
generation reaches age sixty in several parts of the world. By 2025-2030, the
population aged 60 or over will be growing about four times as rapidly as the
total population, at an annual growth rate of 2.8 per cent compared to 0.7 per
cent for the total population (Figure 5). Although the growth rate of the
population aged sixty (60) and above is expected to decline to 1.8 per cent in
2045-2050, it will still be more than five times the growth rate of the total
population at that time (0.3 per cent).
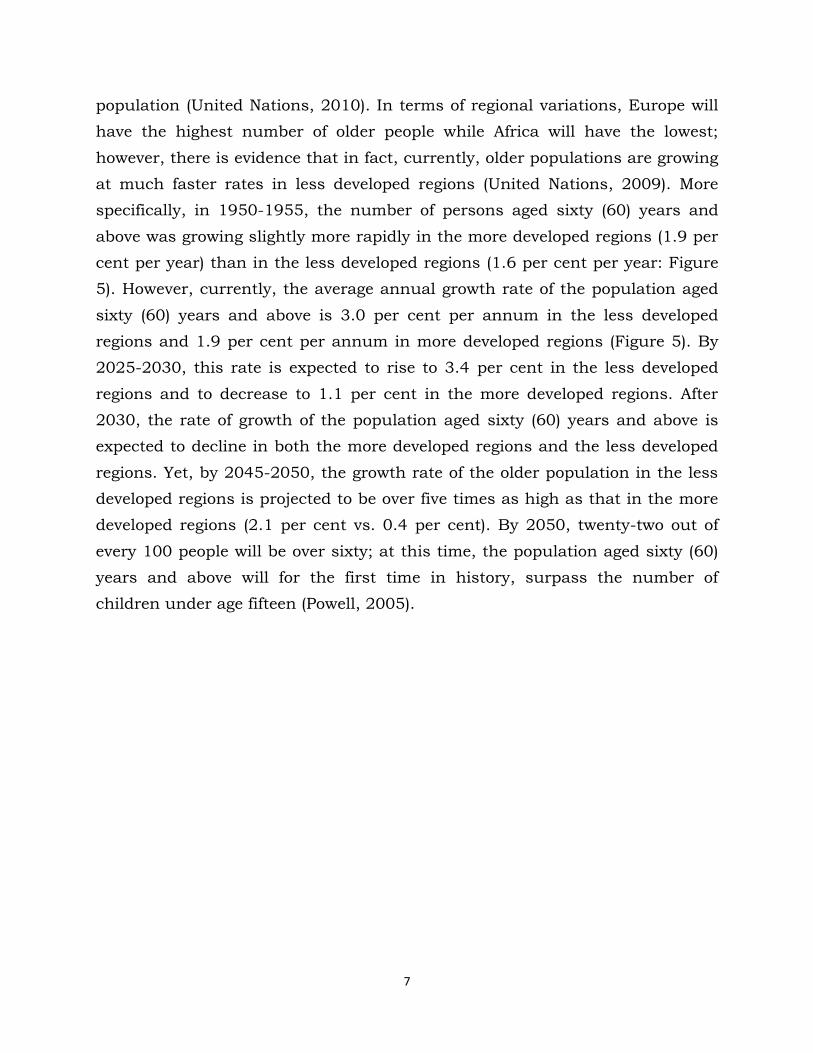
In the same way, by 2050, the proportion of older people will double, with
developed nations contributing a large percentage of the overall aged
7
population (United Nations, 2010). In terms of regional variations, Europe will
have the highest number of older people while Africa will have the lowest;
however, there is evidence that in fact, currently, older populations are growing
at much faster rates in less developed regions (United Nations, 2009). More
specifically, in 1950-1955, the number of persons aged sixty (60) years and
above was growing slightly more rapidly in the more developed regions (1.9 per
cent per year) than in the less developed regions (1.6 per cent per year: Figure
5). However, currently, the average annual growth rate of the population aged
sixty (60) years and above is 3.0 per cent per annum in the less developed
regions and 1.9 per cent per annum in more developed regions (Figure 5). By
2025-2030, this rate is expected to rise to 3.4 per cent in the less developed
regions and to decrease to 1.1 per cent in the more developed regions. After
2030, the rate of growth of the population aged sixty (60) years and above is
expected to decline in both the more developed regions and the less developed
regions. Yet, by 2045-2050, the growth rate of the older population in the less
developed regions is projected to be over five times as high as that in the more
developed regions (2.1 per cent vs. 0.4 per cent). By 2050, twenty-two out of
every 100 people will be over sixty; at this time, the population aged sixty (60)
years and above will for the first time in history, surpass the number of
children under age fifteen (Powell, 2005).

8
Figure 5: Average Annual Growth Rate of Population Sixty and Above: World and
Development Regions, 1950-2050
Source: United Nations – World Population Ageing, 2009
Consequently, if the status quo continues (where the speed of growth of older
people is predominantly more pronounced in less developed regions compared
to more developed regions), it is expected that there will be more older people
living in less developed regions in the future than is currently the case. In fact
the UN (2010) states that although the proportion of older persons is higher in
more developed regions, the number is increasingly larger in the less developed
regions. Over the next four decades, the concentration of older persons in less
developed regions will intensify. The number of people aged sixty years or older
living in less developed regions is expected to increase more than threefold,
passing from 473 million in 2009 to 1.6 billion by 2050. In contrast, the
number of older persons in the more developed regions is projected to increase
by about 60 per cent, from 264 million in 2009 to 416 million in 2050. As a
result, by 2050, nearly 80 per cent of the world‘s older population is expected
to live in developing countries (Figure 6).
Africa has not been spared from global population ageing. Africa will experience
a faster growth in the number of older people by 2050 compared to other
regions of the world (United Nations, 2007). The number of people aged sixty

9
(60) years and above in Africa is projected to increase from 50.5 million in 2007
to 64.5 million in 2015, and reach 205 million by 2050. This represents a rate
of increase of double the annual population growth, with the number of older
people in the population increasing at an annual rate of 3.1 per cent between
2001 and 2015, and 3.3 per cent between 2015 and 2050 (Ibid, 2007)
Figure 6: Distribution of the World’s Population Aged Sixty (60) Years and Above by
Development Regions, 1950-2050
1.4 Challenges of Ageing in the African Context
Ageing populations present a challenge to all regions of the world. However, the
challenge is particularly significant in Africa, heightened by the concurrent
issues of the highest global levels of poverty and the HIV/AIDS pandemic,
which affect the quality of life of millions of individuals and particularly impact
older people (Economic Commission for Africa (ECA), 2007). Given the unique
position Africa holds, highly impoverished and heavily stricken by HIV,
governments within have come to recognise the global call for action on ageing
and the challenges it is posing or likely to pose. The ECA (2007) reports that
many countries in Africa have adopted a range of international and regional
policy instruments to guide and support national policies and programmes to
address the needs and challenges of people aged 60 and over.
Source: United Nations – World Population Ageing, 2009

10
It is indeed true that governments in Africa are currently cognisant of ageing
and the challenges thereof. However, due to the underestimation of the
problem at hand, it is also true that many of the interventions, compared to
developed regions of the world, are still in their infancy and may be coming too
late. One of the reasons this may be so is simply that Africa still has a relatively
young age structure and effects of an ageing population as currently being
experienced by countries in more developed regions have not really dawned
(ECA, 2007). For example, Kalasa (2005) states that although Africa will remain
relatively young for some time, it is clear that its old age dependency burden
will increase by about 93 per cent by 2050. Further, while the ratio of the
population aged 60 years and above to the population aged 0-14 years was
0.169 in 1950 and 0.212 in 1995 (a change of 25 per cent), the ratio will be
0.914 in the year 2050 (a change of 441 per cent from 1950 and 331 per cent
from 1995). The change in dependency ratios between 1995 and 2050 is the
highest among all the world regions. In essence, therefore, the ‗window of hope‘
may not be as permanent as most people would like to think, and this signals
the need for African countries to seriously start planning for the elderly
population at policy and other levels (Ibid, 2005).
Africa has another unique challenge. Countries experiencing population ageing
have developed government-supported welfare systems that cushion some of
the effects of ageing populations; this approach is not strictly widespread in
Africa. Few countries in Africa have introduced welfare systems, however, most
of them are donor-dependent and also based on contributory pension systems
of which a majority of people in Africa are excluded. In other words,
governments in developed countries have taken centre-stage measures to help
address challenges of ageing. Low (2002/3) reports that the state/government
has become the traditional provider of last resort old age security even when
individuals are mandated to provide maintenance and welfare protection.
11
This ‗welfare state‘ (as it is commonly called) incorporates universal social
insurance to provide a minimum of social security as a constitutional right and
inalienable component of citizenship, redistributing wealth and helping those
in need (Zijderveld, 1999). The American system, for example, is said to take
responsibility for general welfare, including old age security in situations where
the market and/or families have failed. European welfare is said to be
universalistic (Low, 2002/2003). It assumes responsibility for a broad
spectrum of social services, to which, in principle, all citizens are entitled. The
Scandinavian system, on the other hand, is thought to be the most
comprehensive, intensive and extensive, as it aspires to ensure maximum
equality of the highest standard (Ibid, 2002/3).
Despite evidence of population ageing at global as well as regional levels, and
despite strides made by developed nations on ageing, there is little or
inadequate intervention on ageing in many developing countries, Zambia
included. It was, therefore, important to conduct a study which would
necessarily highlight population ageing in the Zambian context, illustrate and
discuss challenges older people were/are facing, as well as examine the
existence and adequacy of policies and programmes on ageing in Zambia.
1.5 Statement of the Problem
The subject of population ageing has never received attention and has been
under studied in Zambia. The Magnitude of population ageing is understudied
and to some extent, little is known; some or most of the challenges older people
face are only known based on speculation and ―common sense‖; and finally,
there are no known determinants of active ageing applicable to the Zambian
context. However, while it is true that ageing has been understudied, it is
equally important to acknowledge that some writings by eminent scholars like
Colson (1975), Kamwengo (2001 and 2004), Phiri (2004), Cliggert (2005) and
Toner (2007) have been done. However, it is also cardinal to recognise that not
only have these writings been few, but they have also not provided impeccable

12
evidence or answers to the challenges and determinants of active ageing. In
addition, the writings in question have also largely been based on qualitative
methods with very little or no quantitative data derived from extensive and
systematic investigation of ageing. In view of these weaknesses, this study,
therefore, aimed at addressing and answering not only questions on ageing but
also apply and use scientific data collection methodologies to articulate the
magnitude, challenges and determinants of active ageing as well as critically
examine current policies and programmes on ageing in Zambia.
1.6 Objectives
This study investigated the magnitude of, and examined challenges and
determinants of population ageing in Zambia. The study had three main
specific objectives, namely to:
1. Investigate past and future trends in population ageing in Zambia;
2. Examine challenges and determinants of active ageing; and
3. Examine the draft policy on ageing and the adequacy of the same in
addressing ageing and older people.
1.7 Research Questions
This study addressed the following questions:
i. Is Zambia experiencing population ageing? What regional and/or gender
disparities exist given the ageing status of the population?
ii. What socio-economic challenges do older people face? What aspects,
issues, questions etc. determine active ageing in Zambia?
iii. Does the draft policy on ageing address issues of ageing in Zambia
today? How adequate is it in meeting challenges of older people?
Answering these research questions helped address secondary as well as
subsidiary questions raised in this study and therefore provided responses on
challenges and determinants of ageing as well as providing evidence on the
current policies and programs of ageing in Zambia.
13
1.8 Significance of the Study
The current study brings into perspective two critical significant additions to
population studies and demography in Zambia. Firstly, owing to the fact that,
so far, population studies in Zambia have tended to investigate almost all
topics but ageing, this study is a valuable addition to the existing literature on
population studies, as well as demography in general. It has given an
opportunity for scholars to understand population ageing and some of the
determinants in the Zambian context thereby prompting further questions and
research on the topic and inevitably adding more to the body of literature in
general and population studies in particular.
Secondly, the body of literature this study has generated is also intended to
bring to the attention of policymakers the need to appreciate population ageing
as a relevant topic, and to recognise older people as individuals in need of
concerted and well-planned attention and intervention. Further, using data
and information from this study, it will be possible to promote policies and
programmes commensurate with specific needs of people of all ages, and older
people in particular. Currently, ageing, like gender, health, youths, etc., is
recognised as a development agenda and results of this study are important in
providing evidence based planning for older people as well as determinants of
active and healthy ageing.
1.9 Conceptual Framework
The study was guided by two conceptual frameworks, namely the World Health
Organisation‘s Active Ageing Policy Framework of 2002, and the United
Nations‘ Principles on Ageing. The UN Principles on Ageing have been fully
operationalised through the 2002 Madrid Plan of Action Report. These
documents were, therefore, interchangeably used, especially in the examination
of the adequacy of policies and programmes available in Zambia. Note however
that the two frameworks aim at promoting active ageing in general.
14
1.9.1 Active Ageing Policy Framework
The World Health Organisation‘s (WHO) Active Ageing Policy Framework (2002)
defines ‗active ageing‘ as a process of optimising opportunities for health,
participation and security in order to enhance the quality of life as people age.
The framework proposes that if ageing is to be a positive experience, longer life
must be accompanied by continuing opportunities for health, participation and
security. Active ageing, therefore, applies to both individuals and population
groups. The concept of ‗active ageing‘ allows people to realise their potential for
physical, social, and mental well-being throughout life and to participate in
society according to their needs, desires and capacities, while providing them
with adequate protection, security and care when they require assistance. The
word ‗active‘, according to this framework, refers to continuing participation in
social, economic, cultural, spiritual and civic affairs, not just the ability to be
physically active or to participate in the labour force. For example, older people
who retire from work, and those who are ill or live with disabilities, can remain
active contributors to their families, peers, communities and nations.
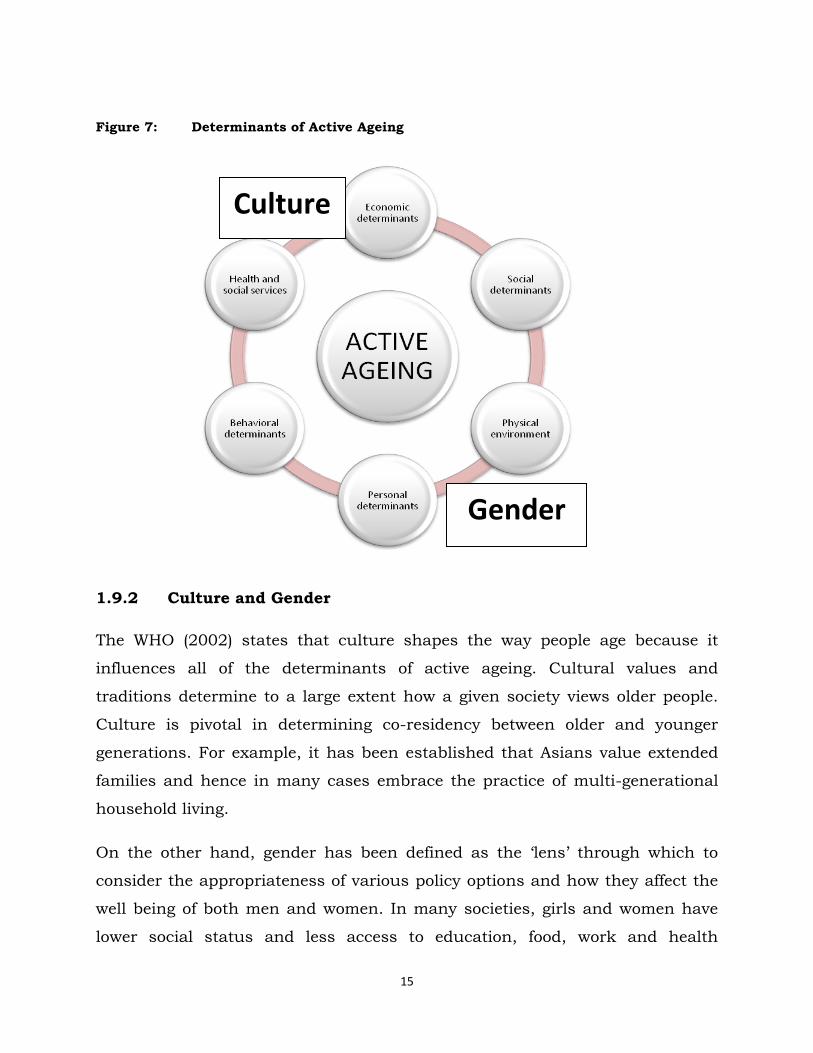
The ‗active ageing‘ process is determined by several factors. The WHO
Framework states that active ageing is a function of, but not limited to the
following determinants: gender and culture, economic, health and social
services, social, physical environment, personal and behavioural. Figure 7
below details linkages of these determinants with the active ageing process:
15
Figure 7: Determinants of Active Ageing
1.9.2 Culture and Gender
The WHO (2002) states that culture shapes the way people age because it
influences all of the determinants of active ageing. Cultural values and
traditions determine to a large extent how a given society views older people.
Culture is pivotal in determining co-residency between older and younger
generations. For example, it has been established that Asians value extended
families and hence in many cases embrace the practice of multi-generational
household living.
On the other hand, gender has been defined as the ‗lens‘ through which to
consider the appropriateness of various policy options and how they affect the
well being of both men and women. In many societies, girls and women have
lower social status and less access to education, food, work and health
Gender
Culture

16
services. At the same time, the status of boys and men is considered more
‗risky‘ in that they are more likely to engage in behaviour such as smoking,
alcohol consumption and violence. These aspects affect the way men and
women age and further determine active ageing.
1.9.3 Behavioural and Psychological Factors
Adoption of healthy lifestyles, engaging in appropriate physical activity, eating
healthy food, adopting a non-smoking and non-alcohol consumption
behaviour, will in turn affect one‘s ageing process and determine how they age.
Personal behaviour affects individuals differently and this also applies to the
ageing process. Similarly, psychological factors including intelligence and
cognitive capacity are strong predictors of active ageing and longevity (Smits et.
al.,., 1999). Sometimes ageing is said to be an individual experience rather
than a collective force, and hence one‘s psychological status can influence the
way they age.
1.9.4 Social and Environmental Factors
One's physical environment plays a significant role in the ageing process.
Physical environments that are ‗age friendly‘ can make a difference between
dependence and independence. It has been propagated that special attention
needs to be paid to old people in rural areas where disease patterns are
different due to environmental conditions and where there are no support
services. On the other hand, social factors have profound effects on the ageing
process. Inadequate social support is associated not only with an increase in
mortality, morbidity and psychological distress but a decrease in overall
general health and well-being. Disruption of personal ties, loneliness and
conflicting interactions are major sources of stress, while supportive social
connections and intimate relations are vital sources of emotional strength
(Gironda et al. In Press). In Japan, for example, older people who reported lack
of social contact were 1.5 times more likely to die in the following three years
than those with higher social support (Sugiswawa et. al., 1994).

17
1.9.5 Economic Factors
Three factors relating to the economic environment have particularly significant
effects on active ageing: income, work and social protection. Policies on ageing
need to intersect with broader schemes to reduce poverty at all ages. Access to
income by the aged will enhance active ageing. On the other hand, dependency
on relatives and government for handouts is unsustainable in the long run. It
is, therefore, important to structure work policies that accommodate the aged.
The world is slowly recognising and supporting the active and productive
contribution that older people can and do make in formal work, informal work,
unpaid activities in the home and in voluntary occupations. Similarly, social
protection is a significant ingredient of active ageing in particular and ageing in
general. In all countries of the world, families provide the majority support for
older people. However, as societies develop, and the traditions of generations
living together begins to decline, governments are increasingly called in to
develop mechanisms that provide social protection for older people who are
unable to earn a living on their own.
In view of the foregoing, it is, therefore, true and in order for us to claim that
the active ageing policy framework is/was particularly central to this study,
because concepts and the rationale, as well as particulars relating to
determinants of active ageing, resonate(d) well with objectives of this study. On
one hand, this study investigated and documented socio-economic as well as
individual challenges older people face in Zambia; it also assumed to
understand some of the determinants of active ageing in Zambia. The socio-
economic perspectives were also examined by investigating community
perceptions towards older people and ageing – in essence explaining some of
the challenges through the Zambian cultural context and finally also
examining policies and programmes on ageing and their adequacy as well as
linking them to challenges older people face. On the other hand, the active
ageing framework aims to reduce difficulties faced by older people and to offer

18
practical policy solutions to enhance active and healthy ageing at individual,
community and population sub groups. The two – this study and the active
ageing framework – were and are in tandem with each other, hence the
adoption of the active ageing policy framework for our study.
1.9.6 United Nations Principles for Older People
In December 1991, the United Nations General Assembly adopted resolution
46/9 on principles for older people. The resolution was adopted to make known
the important contributions older people make to their society. The background
to these principles is based on the following resolutions:
(a) Recognising that, in the Charter of the United Nations, the peoples of the
United Nations declare, inter alia, their determination to reaffirm faith in
fundamental human rights, in the dignity and worth of the human
person, in the equal rights of men and women and of nations large and
small and to promote social progress and better standards of life in larger
freedom.
(b) Noting the elaboration of those rights in the Universal Declaration of
Human Rights, the International Covenant on Economic, Social and
Cultural Rights and the International Covenant on Civil and Political
Rights and other declarations to ensure the application of universal
standards to particular groups.
(c) Pursuance of the International Plan of Action on Ageing adopted by the
World Assembly on Ageing and endorsed by the General Assembly in its
resolution 37/51 of 3 December 1982.
(d) Appreciating the tremendous diversity in the situation of older persons,
not only between countries but within countries and between
individuals, that requires a variety of policy responses.

19
(e) Awareness that in all countries, individuals are reaching an advanced
age in greater numbers and in better health than ever before.
(f) Awareness of the scientific research disproving many stereotypes about
inevitable and irreversible declines with age.
(g) Convincing evidence that in a world characterised by an increasing
number and proportion of older persons, opportunities must be provided
for willing and capable older persons to participate in and contribute to
the ongoing activities of society.
(h) Being mindful that the strains on family life in both developed and
developing countries require support for those providing care to frail
older persons.
(i) Bearing in mind the standards already set by the International Plan of
Action on Ageing and the conventions, recommendations and resolutions
of the International Labour Organisation, the World Health Organisation
and other United Nations entities.
(j) Encouraging Governments to incorporate the following principles into
their national programmes whenever possible:
1. Independence
2. Participation
3. Care
4. Self fulfillment
5. Dignity
The UN Principles for older people are based on the recognition of older people‘s
rights as individuals and shifts strategic planning away from a ‗needs-based‘
approach (which assumes that older people are passive targets) to a ‗rights-

20
based‘ approach that recognises the rights of people to equality of opportunity
and treatment in all aspects of life as they grow older. These principles support
their responsibility to exercise their participation in the political process and
other aspects of community life (United Nations, 1991).
1.9.7 HIV/AIDS as a Determinant
Currently, it is not plausible to discuss ageing or indeed any other issue
relating to population without factoring in the presence of HIV/AIDS. Our
study therefore proposed to include, as one of the determinants of active
ageing, HIV/AIDS so as to assess its effects as well on active ageing. In this
respect therefore, our study proposed a simple modification of the WHO
Framework to include HIV/AIDS in the following manner:
Figure 7a: Determinants of Active Ageing – Modified with HIV/AIDS
Gender
Culture
HIV/AIDS

21
In making a summary of the conceptualization process of this study, we took
cognisant of recommendations in the framework to national governments and
individuals on the role/s and importance of older people to development. As a
result, it is clear that investigating challenges older people face in any context
is actually a human rights issue and no other framework could best explain
these than the United Nations principles on ageing. The United Nations also
implores governments to include these principles in their policies and
programmes as well. Owing to the fact that this study also investigated the
draft policy on ageing, UN principles were ‗lenses‘ to help measure whether it
is adequate by way of reflecting all or most of the principles on ageing.
It should be noted, however, that while it is clear that the WHO active ageing
framework is a policy framework, the contents and approach is also inclusive of
both population and individual experiences. In this regard, it is suited to
explain not only policy aspects of ageing, but also the roles of both population
sub-groups affected by ageing as well as individuals themselves. For example,
the policy framework states that active ageing is determined, among other
factors, by psychological and individual behaviour factors. In this example, the
framework is cognisant of the important role of individuals in the process of
ageing. It also has both the depth and breadth investigated in this study. As a
result, considering the purpose, objectives and aims of our study – especially
on challenges older people face and policy options in Zambia – this framework
is therefore, appropriate.

22
CHAPTER 2: LITERATURE REVIEW
This chapter gathered information through the review of literature on what
other studies have highlighted as challenges facing the elderly as well as
determinants of active ageing in general. Some of the challenges highlighted
include the problem of poverty, health, functional limitations, self-esteem, etc.
Other issues looked at were old age care, living arrangements, social contacts,
and generally how older people cope with ageing, given problems and
challenges they faced or face as a result of HIV/AIDS, and orphan and
vulnerable child care. The literature review also focused on discussing both
historical and current policy documents and pronouncements on ageing which
have or maybe influential in determining active ageing in general. Some of the
policy documents in this case include: health, education, social cash transfer
schemes, population policy etc.
2.1 Poverty: A Serious Challenge in Old age
Poverty has been sighted to be one of the most daunting challenges facing older
people especially in developing countries. In fact, there is a high correlation
between poverty and ageing in many developing countries (UNFPA, 2001). In
this respect, the presence of inadequate living conditions, lack of access to
social services, intergenerational violence and abuse, low levels of literacy,
income, health and lack of awareness and access to valuable information
depict a vicious cycle of social exclusion reinforced by the dependency status
among older people (Ibid, 2001). Sometimes, actually, the poverty experienced
by older people is a result of the alleged loss of social capital (Duffo, 2009).
Accordingly, ‗poverty rates‘ for older people are almost always estimated to be 5
to 15 percentage points higher than national averages (Ibid, 2009).
In old age (or later life), people become particularly vulnerable to changes to
their income situation as well as lessened participation in income or economic

23
activities. For example, studies in Britain, the United States of America and
much of Europe have indicated that there is a long standing correlation
between poverty on one hand and old age on the other. Old age pensioners are
more likely to be affected by poverty than paid workers (Ogg, 2005). In a study
entitled ‗Wealth of the Nation 2005‘, Godfield (2005) shows that both poverty
and wealth correlate with a specific age structure. Whereas wealthy areas are
characterised by high proportions of middle-aged families and ‗empty-nesters‘,
poor neighbourhoods have a high proportion of children and older persons
(Ibid, 2005).
In some circles, the picture depicted by Godfield (2005) has received
controversy. The British Department of Work and Pension (DWP) argues that
there has been remarkable reduction in pension and income poverty in the last
decade (DWP, 2005). Within the Eurozone, Germany has been singled out as
an exception. Contrary to the overall trend all across Europe of increasing
inequalities and poverty risks, the risk of income poverty among older Germans
(65+) has declined from 13.3 in1998 to 11.4 per cent in 2002 (BMGS, 2005). In
addition, the introduction of the social-insurance based on Long-Term Care
Insurance Scheme has taken a lot of the previous financial pressure off families
caring for older family members. The previous dependency of older people in
need of professional care on Social Assistance has significantly reduced (Szivos
et al, 2004).
While the British and European case is somewhat different from the Germany
case, the situation is even more fragmented in developing countries. It is a fact
that the Germany example has shown some significant differences because of
deliberate measures to enhance income as well as reduce social exclusion of
the elderly in society and inevitably reduce poverty experiences. This may not
be so for many less developed countries. While the causes of poverty may be
similar for both regions, interventions are or may be different. In any case, it
stands as a fact that old age is sometimes synonymous with poverty, whether
developed or less developed countries. Similarly, income and non-involvement

24
in economic activities, as well as social exclusion, explain to some degree why
older people are poor.
In a similar manner, older people tend to be excluded from social structures
that can help in the area of income as well as economic activities —factors that
may enhance self-reliance for ageing individuals – which eventually exacerbate
poverty amongst them and influences how active they age. Exclusion of older
people from social structures has sometimes been referred to as ‗social
exclusion,‘ which has over time been defined to mean ‗a dynamic process of
being shut out, fully or partially, from any of the social, economic, cultural or
political system which determine the social integration of a person in society‘
(Walker et al, 1997: 8). In addition, it also introduces a dynamic perspective
towards understanding processes that lead to the non-realisation of civil,
political and social citizenship rights (Room, 1995; Tsakloglou et al, 2002).
2.2 Family Relationships and Ageing
Poverty is also a function of family relationships. This is true at least in Africa.
For a long time, families in developing countries have taken care of aged
relatives and, therefore, helping manage their poverty levels. In Africa, Asia
and Latin America, most of the elderly population lived in multi-generational
households with their children. In Thailand for example, 77 per cent of older
people lived and were cared for by their children and spouses (Jitapunkul et al,
2002). According to the UN report on population ageing in Asia-Pacific Regions,
there was an overwhelming majority of elderly men and women who continued
living with their children as well; similarly, over 65 per cent of families in The
Republic of Korea kept an elderly relative in the 1990s (Ibid, 2002).
While the forgoing has always been the case, there is evidence that this was no
longer widespread or the same. For example, Burgess (1954) noted that in
many countries, there was a moral and legal obligation for adult children and
families to support needy parents and relatives. However, even in countries like

25
Kenya where it is a constitutional mandate to look after older relatives,
Sokolovsky (1985) reports that there are signs of neglect. India, which
maintains one of the highest levels of elderly co-residence in the world, Martin
(1990) notes that as early as the ninth century, the Hindu philosopher
Shankaracharya spoke of the harsh dilemma of late adulthood life. In stressing
the need for material detachment during the last phase of adult life,
Shankaracharya said: ‗Your family is attached to you as long as you can earn‘ –
with frail body and no income, no one in the house will care for you‘ (Martin,
1990). Burgess (1960) again observes that the tendency for adult children to
live, support and care for their ageing parents has declined tremendously.
Aboderin (2004) found that material support for older people in Ghana has
declined in recent years and this has inevitably exposed elderly citizens to
destitution and poverty. Akungba et al (2003) found that there is a declining
process of traditional care and support systems for the aged in Nigeria. Recent
demographic indicators further show an increasing proportion of childless
women, changes in divorce and marriage patterns, and the overall much
smaller number of children of future cohorts of older people, all contributing to
a shrinking pool of family support (Wolf, 2001). In essence therefore, this
situation has not only inevitably exacerbated high poverty levels among the
elderly people, but also influenced greatly their isolation and added greatly to
most of the challenges they face and as such influence greatly the active ageing
process.
Diminishing family support systems inevitably affected the living arrangements
for the elderly; this again affects their social contacts with peers and family as
well. These factors are intertwined with intergenerational living and support
systems and are challenges to the elderly. Living arrangements, for example,
play an important role in the well-being of older people, and if harnessed
properly, improves their ageing process as well. In Africa and other developing
societies, living with or near adult children has been a predominant feature,
however, due to uncertainties surrounding ‗living arrangements‘ at the
26
moment, it has turned out to be a real source of concern and problems for the
elderly (UNFPA, 2007). The term ‗living arrangements‘ is not very clear. While
household composition has been used as one indicator, implications of
particular configurations defined by such information can be ambiguous. One
limitation is that these measures do not encompass information about others
who live next door or very nearby, and who may still play an important role in
the lives of the elderly (Knodel et al, 1999). Another difficulty arises because the
meaning of ‗living arrangements‘ cannot be inferred with certainty simply from
their form (Hermalin, 1997). Thus, measures of composition of households in
which the elderly reside can be suggestive, but they need to be interpreted
cautiously. With that said, it is still true that co-residence with one or more
adult children, typically in a stem family configuration, is a long standing
tradition in many African countries and is viewed as essential for families to
meet the needs of older dependent members (Knodel, 2007). However, it is
clear that these provisions are slowly changing; this change is not only
detrimental to older people but affecting active ageing in general.
2.3 Living Arrangements, Social Contacts and Networks
Another instrumental factor to old age but related a little to ‗living
arrangements‘ is social contact. Some challenges in old age are due to
constraints in social contacts and networks. Older people are affected positively
or negatively by the social networks or contacts and support they have with
their relatives and/or the community at large. This inevitably affects whether
or not they age actively or otherwise.
Several theoretical explanations try to give meaning and thereby address the
influence of social networks on the well-being of older people. Some of these
constructs have their origins from studies that aim at explaining the role of
social networks on ageing and the ageing process in general. For example,
Cohen et al (1985); Ell (1984) and Wenger (1984) stated that support networks
really imply family and friendship ties, but may also include other role

27
relationships such as neighbours, colleagues and service personnel. In
addition, social support networks can elicit behaviour detrimental to one‘s well-
being, and this fact has been well underscored, particularly in old age
(Baldassare, Rosenfield et al, 1984; Gallo, 1984; Kaye et al, 1991; LaGory et al,
1992). The absence of social contacts and networks affects active ageing, and
is, therefore, a serious challenge to the elderly.
Support and social contacts networks are also a subset of larger fields of
inquiry known as ‗social network analyses‘, which systematically consider
aggregate interpersonal contacts and their interrelationships (Mitchell, 1969;
Wellman et al, 1988). Social network analysis provides the framework for
consideration in terms of support-giving, such as the structure and function of
the support network (Litwin, 1998). In explaining the structural aspect of
support networks, House et al (1985) state that such networks typically include
such variables as network size, composition, density and intensity; however,
the functional aspect on the other hand is measured by interaction patterns
such as contact frequency, direction and other substantive factors including
types of assistance exchanged (Ibid, 1985).
In the same vein, while social networks and contacts are a big problem for the
aged and a challenge in themselves, there is evidence relating social support
(networks) to the physical, psychological health status, risk of
institutionalisation, and mortality amongst older people (Bowling, 1991).
Inadequate social support for older people is associated not only with an
increase in mortality, morbidity and psychological distress, but a decrease in
overall general health and well-being. Disruption of personal ties, loneliness
and conflicting interactions are major sources of stress, while supportive social
connections and intimate relations are vital sources of emotional strength
(Gironda et al, In Press).

28
2.4 Health and Functional Limitations in Old Age
While it is clear that intergenerational support and social networks play pivotal
roles in the well-being of older people, their (social networks) absence inevitably
proposes other challenges bordering on both the physical health and general
well-being of older people and thereby inevitably affecting whether they age
actively or not. Note, however, that old age brings about its own health
problems; nonetheless, these are exaggerated if or when social contacts and
networks are absent or constrained.
While the concept of well-being incorporates different dimensions, none
perhaps, is of more central concern to older persons than their actual physical
health (Knodel et. al., 2009). In all populations, biological processes ensure not
only that the risk of mortality increases steadily with increasing age, but so do
physical limitations and certain illnesses – some chronic, while others are
common and frequent problems. These functional limitations are sometimes
necessitated by older people themselves or the environment they find
themselves in; thus, such situations or occurrences pose considerable
differences in terms of mortality and morbidity for the aged (Ibid 2009).
Ageing, it has been argued, is sometimes synonymous with being unhealthy
and is usually coupled with a lot of illnesses. It is not uncommon for people of
a certain age to suffer from certain illnesses. The World Health Organisation
(2003), reports that there are basic diseases which afflict older men and
women. They include cardiovascular diseases, cancers, musculoskeletal
problems, diabetes, mental illnesses, sensory impairments, incontinence, and –
especially in poorer parts of the world – infectious diseases and their sequelae.
While it is true that these diseases become more pronounced as people age, it
is argued that they present themselves much earlier in life and are sometimes
functions of certain lifestyles (Ibid, 2003). For example, experiences of smoking,
alcohol abuse, infectious disease, under nutrition and over nutrition, poverty,
lack of access to education, dangerous work conditions, violence, poor health

29
care, injuries, etc. early in life and throughout the life course can lead to poor
health in later years (Ibid, 2003).
In addition, and perhaps more importantly, the gender picture of a given
society – the complex pattern of roles, responsibilities, norms, values,
freedoms, and limitations that define what is thought of a ‗masculine‘ and
‗feminine‘ in a given place and time – has a great bearing on the health of the
aged (Ibid, 2003). As a result, it is no wonder that in societies where gender
issues are balanced, health problems facing older people seem to be almost
similar in nature – a situation quite different from developing countries, where
gender is still unbalanced.
However, health in old age has not only to do with the presence or absence of
disease; in fact, it is argued that availability and quality of care is very
important. Nonetheless, care for older people especially in developing countries,
is in a general sense dwindling; and, without properly developed institutional
care systems supported by the state, health conditions for older people will
become even more challenging, and may lead to other problems. WHO (2005),
reports that older people, even those in generally good health, will eventually
need more care than they did earlier in their lives. The ways societies provide
or fail to provide this care will determine older people‘s quality of life. The
questions, therefore, are: Does care allow for independence and dignity, but
also social connectedness? Is it equitably accessible to all? Who provides it?
How is it remunerated? Are the physical and psychological abuses of older
people, or other exploitations of their vulnerability, prevented? These questions
require detailed reflection, especially for state policy making organs; the
questions at hand merit more than a simple ‗yes‘ or ‗no‘.
A serious consequence of declining health and increased frailty associated with
ageing is the difficulty of physical movement and of independently being able to
carry out basic activities of daily living (UNFPA, 2008). Inability to carry out
basic activities of daily living, or what is normally referred to as ‗functional

30
limitations‘, may not entirely be determined by one‘s health; however, health
status is pivotal in the determination of functional ability or limitation in old
age at least. Functional limitation is a big challenge and a pertinent
determinant of active ageing and is mostly exacerbated by lack of or inadequate
formal or informal care systems.
There are many definitions of ‗functional limitation‘. According to a popular
theoretical conceptualisation, functional limitation (sometimes referred to as
disability) is defined as the loss of capacity to carry out usual and necessary
functional tasks that allow individuals to maintain themselves within a given
environment, such as rising from bed or shopping for food (Deeg et all, 2003;
Verbrugge et al 1994; World Health Organisation, 1990). Verbrugge et al (1994)
further suggest that the functional status of an individual refers to that
individual‘s ability to perform tasks that are necessary within a particular
environment, and a functional limitation can be considered as a gap between
physical ability and the demands of the environment. For instance, in order to
rise from bed, an individual must have a certain physical capacity, but the type
of bed one sleeps in may influence performance. An individual in a poor
country who sleeps on a mat on a hard floor may be more functionally limited
than an individual in a developed country who sleeps on a raised bed.
Subsequently, the individual sleeping on a mat on the floor may have a greater
need for assistance than does another individual with similar physical abilities.
Functional tasks such as shopping for food may involve a larger array of
environmental circumstances, such as the location of a market and the
condition of infrastructure like transportation and road conditions (Zimmer,
2005). Because functional status refers to the ability to perform necessary
tasks, it is a principal indicator of well-being, and accordingly is an excellent
pointer of the general health status of older people.
In the same way, WHO (2011) defines functional limitations or disability as an
umbrella term for impairments, activity limitations and participation
restrictions. Disability is the interaction between individuals with a health

31
condition (e.g. cerebral palsy, Down syndrome and depression) and personal
and environmental factors (e.g. negative attitudes, inaccessible transportation
and public buildings, and limited social supports). Unlike the earlier definition
by Zimmer (2005), WHO factors into focus the fact that disability is not just an
individual‘s experience but also their social and economic environment.
Functional limitations in old age are also becoming prominent in developing
countries as well. Even with such a situation, there seems to be little or no
evidence of studies specifically undertaken in Africa to investigate this growing
phenomenon. Nonetheless, there have been studies in other developing
countries. For example, Knodel et al (2008) found that for the studied
functional limitations in Thailand, (eating, dressing, bathing or going to the
toilet), women were more likely to report any of the listed functional limitations
compared to men; they also found that for both men and women, the likelihood
of a disability or limitation increases substantially with age. They noted that
such cases or situations called for concerted efforts in caring for older people.
Further, WHO (2005) found that while disability is affecting all people (from
developed and less developed regions), it is becoming more prominent in less
developed regions due to little or no intervention at all. The WHO (Ibid) argues
that it is possible to delay the onset of disability as was the case in the United
States of America, England and Sweden where there has been a significant
decline in the past twenty years. This, therefore, is a litmus test for developing
countries to suggest and put in place policies that may help curb effects of
disability due to ageing populations and thereby promote active ageing.
2.5 Self Esteem and Loneliness in Old Age
Older people are not only affected by possibilities of being disabled, having little
or no social contacts, poor quality living and environment situation, care, etc.,
but all these experiences also brood low self-esteem and, to some extent,
loneliness in old age. And low self-esteem, it should be noted, is one of the
challenges older people face and serious determinant of active ageing.
32
Sometimes, low self-esteem is a function of social isolation; however, several
factors could be influencing such experiences.
By definition, self-esteem is the term used to describe how one feels about
one's self. It is based on feelings of being valued, useful, and competent
(uihealthcare.com 2005). As people age, lots of changes occur, which may affect
their roles, activities and lifestyles, potentially leading to low self-esteem. It is
argued that if people feel valued and useful, their self-esteem is high, while the
opposite is also true: where people undervalue and underutilise others, self-
esteem is inevitably lower. It is a fact also that sometimes societies undervalue
and regard older people as less useful compared to those of other ages. This
may result in low self-esteem and negatively affect their ageing process.
Low self-esteem could be a function of the negative attitudes and perceptions
people have towards a certain grouping of individuals, in our case, the aged. To
many people, ageing and the aged are a very distant topic. In some instances,
segments of society rarely hold any particular attitude towards the aged.
However, the negative side is sometimes prominent. Literature suggests that
negative attitudes towards the ageing process and older adults themselves
adversely affect their care and support, and to some extent, affects the way
they view themselves. A few commonly used terms that reinforce the negative
attitudes and beliefs that influence feelings and behaviours regarding older
people include:
Gerontophobia - refers to ‗unreasonable fear and/or irrational hatred of
older people.‘ (Palmore, 1972).
Aging Anxiety - refers to a ‗combination of people's concerns or fears of
getting older.‘ (Lynch, 2000).
According to Cummings (2000), ageing anxiety as well as esteem is related to
negative stereotypes of older adults and perceptions of younger adults that

33
these problems are likely to happen in their own future. Indicators of ageing
anxiety include worrying about:
Declining health, physical function, social losses and connectedness.
Changing physical appearance including wrinkles, receding hair lines
and grey hair.
Declining cognitive ability.
Depleting financial resources, etc.
It is further argued that if people hold negative views about ageing and
undervalue the aged, such attitudes are likely to influence interactions with
older people, and that may inevitably allow proliferation of low self-esteem
(Fitzwater, 2008). Holding other factors constant (especially individual factors),
mostly interrelations with peers, family, colleagues, spouses, etc., help in one
way or another to maintain or even rekindle self-esteem in old age. However, it
has been argued that there seems to be a general ‗decline‘ of the much-needed
familial (as well as peer) relations in many societies, and this is a challenge to
the active ageing process.
2.6 HIV/AIDS and Ageing
Another challenge facing older people in Africa and active ageing in general, is
the HIV/AIDS pandemic. While it is evidently clear that some older people have
the virus that causes AIDS, the two biggest challenges they face as a result of
the pandemic are firstly, the loss of their able-bodied children, and secondly,
caring for orphans and vulnerable children as a result.
Overall, the HIV/AIDS pandemic has devastating health, economic, social and
psychological impact on older people, especially women (Ferreira, 2002). The
deaths of young adults are shifting the responsibility of care of orphaned and
vulnerable children, as well as People Living with HIV/AIDS (PLWHAs) to older
persons (Busolo et al, 2009). In addition, HIV/AIDS has brought about
additional care burdens and defined new roles for the aged, who are

34
increasingly being called upon to act as carers and supporters for younger
generation kin. Such care-giving, often rendered at great personal cost, has
been shown to affect older people‘s material, psychological and physical well-
being (Ferreira, 2006; Knodel, et al 2003). The loss of children, grandchildren
or other younger generation kin impacts not only older people‘s emotional and
mental well-being, but erodes the material or other intergenerational family
support which they require for their livelihoods (Aboderin, 2009). In view of
these impacts, recent years have seen mounting calls for policy responses to
address the impacts of HIV/AIDS on older people.
The direct consequences of the HIV/AIDS pandemic portray themselves by
affecting older people in many ways, including care giving during illness,
paying for medical and living expenses, reduced or foregone economic activity,
funeral expenses, loss of current and future support from the AIDS-infected
adult child, and fostering orphaned grandchildren (Knodel, 2006: 3). Similarly,
older people have to cope with community stigmatisation and isolation that is
often associated with caring for an AIDS-affected family member (Belsey, 2005).
The challenge of older people caring for people living with HIV/AIDS is further
exacerbated by lack of health insurance, inadequate health care facilities, as
well as the lack of individual or household finances (UNDP, 2007).
Apart from caring for PLWHA, older people are also actively looking after
orphans and vulnerable children. It should be noted that from time
inmemorial, many African traditional set-ups entertained situations where
grandparents could keep their grandchildren while their children were
somewhere else. Such care was usually supported through cash transfers to
the child-minders – in this case, the grandparents. With the advent of
HIV/AIDS, the situation is different. Whereas in the past it was not mandated
for grandparents to look after their grandchildren, the care landscape has
changed dramatically. It has become commonplace for old grandparents to take
care of grandchildren because their parents have died, and there lays a double-

35
burden on the elderly – one of taking care of their sick children, and another of
looking after uneconomically independent grandchildren.
As such, caring for grandchildren has presented a special challenge to the
limited resources of older carers. It is a fact that due to this burden, older
people struggle to ensure that the orphans attend school, are well fed and are
not marginalised and discriminated against. Because of their age, many
grandparents die before the children reach the age of eighteen, which results in
further separation, loss and uncertainty for the children (UNICEF, 2006).
Knodel et. al. (2002: 4) also notes that how much these potential impacts
actually occur remains largely for systematic empirical research to determine.
They are all likely to be context-sensitive and thus vary across different
settings. While comprehensive statistical data surrounding these phenomena
do not currently exist, case-study material, anecdotal information and local
fact-finding activities suggest that significant numbers of older people currently
deal with these diverse impacts at a time when they themselves are expecting
to receive old age support. In circumstances of existing poverty and age-related
health issues, the extra burdens, particularly the financial impact and
diversion of activities away from food production, can deplete the health of
older people through poor nutrition, fatigue and worry (State of Old People in
Africa Review, 2007).
Given such daunting challenges, which include limited social and material
support, challenging living conditions and arrangements, care for orphans and
sick children, as well as older people‘s own care and survival, many African
countries and governments, societies and communities have come to the aid of
older people, happening with full donor support.
At the community and household level, it is documented that there are a range
of small-scale, effective practices and interventions that relieve the impact of
HIV/AIDS on the aged even when it is in isolated areas. Although poorly
documented, these interventions deserve more attention because they offer

36
governments and other stakeholders the possibility of practice-based evidence
of effectiveness, and the opportunity to strengthen existing programmes and
scale up successful strategies (Binswanger, 2000; Mutangadura et. al., 1999).
There have been attempts, for example, to increase HIV/AIDS-related
treatment and care so as to help shoulder the burden of care borne by older
people. In the same way, some communities have established ‗community
kitchens‘ where children can eat or receive aid from caregivers; they are also
sometimes provided with seeds and other necessary inputs for growing food, so
as to benefit households where the elderly are the main breadwinners (ECA,
2007).
In addition, some rural households have employed other community-initiated
strategies to enhance food production in households where there are older
caregivers and also where adults are suffering from HIV/AIDS. These include
labour pooling, intra-household reallocation of labour and responsibilities,
reconfiguration of time-use patterns, promotion of non-labour-intensive crops,
and promotion of crops and farming systems that reduce vulnerability to
ecological and social factors (ECA, 2007). Some of the projects initiated in
various African countries to enhance these strategies include the following:
Junior field schools in Eastern and Southern Africa targeting HIV/AIDS-
affected households (FAO, 2004).
In Zimbabwe, AIDS widows are being trained how to grow cotton by
experienced farmers through farmer field schools (White and Robinson,
2000).
In Malawi, junior farmer field schools for AIDS orphans and vulnerable
children are also targeting fishing communities (FAO, 2004).
In other parts of Southern Africa, HIV/AIDS issues have also been
incorporated into agricultural services provision through integrated pest
management training programmes (Haddad et al, 2001).
Subsistence crop to diversification to low maintenance alternatives
including cassava, sorghum and millet. This mitigation measure has
37
been recorded in Zimbabwe (FASAZ, 2003) and Cote D‘Ivoire (Black-
Michaud, 1997).
Still at community level, some initiatives have bordered on introducing
‗community safety nets‘ which target women, children and orphans. These are
involved in programmes such as support to HIV/AIDS sufferers at community
level and also training of survivors and other household members new skills
such as carpentry, tailoring, poultry farming, etc. (Mutangadura et. al., 1999;
FAO, 2004).
At government level, there have been interventions as well, but not as sufficient
as one would expect. To emphasise this point, Turner (2001) alludes to the fact
that in many African countries, universal social protection systems capable of
absorbing the increasing numbers of older people do not exist. Most of the
contributory social security schemes on the continent only benefit civil
servants and formal sector employees. Currently, social security programmes
cover less than 10 per cent of Africa‘s workforce. As a result, governments in
Africa have continued exploiting and relying on traditional support systems
such as families to provide care for older adults (Barrientos et al 2002;
Caldwell, 1976; De Lancey, 1990; Case et al, 1998; Duflo, 2000). However, as
previously established, family care has recently become undependable and
unreliable. This has also brought into effect alternatives to family care
commonly referred to as informal care systems, which inevitably go beyond
family care. For example, Olivier et al. (2004) states that informal support
systems go beyond the extended family and also include benefits in cash and
kind from membership of traditional solidarity networks, co-operative or social
associations such as burial societies, self-help groups and rotating savings and
credit clubs, as well as from cultural associations.

38
2.7 Policies and Programmes: Historical Review
The earliest known intervention on ageing in Zambia (then Northern Rhodesia)
took place after the Second World War when the country was under colonial
(British) administration (1945 to 1963). The ‗white‘ masters put up some homes
for the aged to provide services to older white citizens who had no families or
were recommended to such places by families (Kamwengo, 2004). After
independence from Britain, most of these homes either became Zambian
(black) government property and started serving other purposes or were
adopted by church organisations to serve similar purposes.
From independence in1964 through to 1979, the government of Zambia had no
clear documentation of policies and programmes on ageing. However, there is
evidence suggesting that the earliest possible post-independence era response
to ageing in Zambia was through the establishment of the social welfare system
between 1966 and 1979 (Country Report for World Assembly on Ageing, 1982).
The welfare system was established to help provide amenities such as food,
clothing, house rent and rates as well as residential care to people who were
either old or classified as ‗destitute‘ (Ibid, 1982). In 1980, Zambia, and all
countries in the world were expected to submit reports to the 1982 Vienna
World Assembly on Ageing to give details on the ageing situation in their
respective countries.
The 1980 report reflected the country‘s active concern for the potential
consequences of population ageing in particular and also highlighted what the
country intended to achieve with population and development in general. There
were numerous dimensions to the country‘s propositions on the mediation of
ageing, nonetheless, most proposed interventions were temporal and
‗reactionary‘ instead of being proactive and long term. For example, government
committed itself to provide food and clothes to older people in dire need of such
services; it also provided temporal shelter to older people before repatriation to
villages etc. (Ibid, 1982).
39
2.7.1 Early Policies and Programmes on Ageing
Even at the time when the very first report on ageing was written in 1980, there
was no definite policy on ageing in Zambia. It was generally felt that older
people, just like other interest groups, would also directly or indirectly benefit
from a diversity of services offered by government (Zambia Report to Vienna
World Assembly on Ageing, 1982). The government emphasised the need to
recognise the elderly as people who were part of society and should not be
isolated from either families or the general public. It was also declared that the
elderly needed to be involved and be beneficiaries of services provided for the
community as a whole (Ibid, 1982). Some of the services included health,
housing and environment, social welfare and security, education, employment
and helping to strengthen the family. Each of these is discussed below in some
detail.
2.7.2 National Health Programme
From independence to the 1990s, the United National Independence Party
(UNIP) government had a policy where health services were to be provided free
of charge to all Zambians. By the end of 1983, all districts in Zambia had a
district hospital (Ibid, 1982). The health programme was expected to satisfy all
health needs of the Zambian populace. Government was of the view that
provision of free medical services was vital in preparing younger people for a
healthy future old age.
In order to enhance the provision of free health services to the population and
more especially to the aged, communities in Zambia were encouraged to select
representatives called Community Health Workers who were later trained to
provide health services to the community (Zambia Report to Vienna World
Assembly on Ageing, 1982). In this programme, however, particular attention
was given to elderly people defined as destitute. Accordingly, these were
considered more problematic for the government and communities than
perhaps those who had homes or who were kept by families (Ibid, 1982).
40
2.7.3 Housing and Environment
According to the 1982 Report on Ageing for Zambia, housing, especially urban
housing, was a major problem for many Zambians, and even more so for the
elderly. Urban housing was tied to employment and it was government policy to
encourage home ownership through special schemes where people, including
those without formal employment like the elderly, could also benefit. These
schemes were meant to help curb destitution. In view of this, the government
established the National Committee of the International Year for Ageing, which
was mandated, among other things, to educate and carry out mass campaigns
to sensitise the citizenry (especially employees through their employers) of the
need to own houses while they were still young and in active employment.
Such a mechanism would then help serve them better in old age (Ibid, 1982).
2.7.4 Social Welfare Services
Social Welfare services were introduced in Zambia during the period 1971 and
1980. Services under this system were incorporated to enable the government
offer assistance to destitute elderly persons.
The government, through the Department of Social Welfare (now the Ministry of
Community Development Mother and Child Health) introduced a Public
Assistance Scheme under which destitute persons were assisted on both short
and long-term basis. Much of the assistance was in kind and included
provision of food rations, clothing, payment of rentals and rates, provision of
orthopaedic appliances and, in some cases, repatriation expenses. In this
example, the largest beneficiary group was the elderly people.
The Department of Social Welfare was also mandated to provide assistance to
older people through institutional structures. Institutional care was restricted
to special needs only; for example, once it was proved that the elderly person
with a problem was a destitute, institutional care was provided. In view of this,
the government maintained three homes for the aged and one Geriatric Centre

41
for all chronically ill older persons. However, government was not particularly
supportive of institutional care; it instead favoured family and community care.
Institutional care was only optional in some deserving circumstances, and as a
last resort (Zambia Report to Vienna World Assembly on Ageing, 1982).
2.7.5 Education
Education was also one of the interventions to the ageing problem. To some
degree, interventions in education were merely proxy measures. For example,
the government established the Department of Adult Education at the
University of Zambia to serve people who were thought to have missed out on
being educated during their youth. It was in fact government policy to provide
free education from primary to university levels, and the elderly were
encouraged to enroll. The government also intended to provide opportunities
for retraining elderly persons in new fields to help replace obsolete skills (Ibid,
1982).
2.7.6 Employment
Creation of employment was another measure used to intervene on ageing.
Apparently, government was of the view that if many people were in
employment and were availed employment opportunities, it would then be
possible to secure their future when and if they reached old age. Employment
opportunities for the entire population meant also that government policy to
encourage families and communities to take care of their old relatives would be
attained, since many people would also have the means to support them
(Zambia Report to Vienna World Assembly on Ageing, 1982).
2.7.7 Social Security
Social Security Schemes were introduced for persons employed formerly by the
government (as civil servants), parastatals or the private sector. Three
categories of social security schemes were introduced and these were: The
42
Government Pension Scheme, The Zambia National Provident Fund and The
Workmen‘s Compensation Fund (Ibid, 1982).
(a) Government Pension Scheme: This scheme served civil servants; it was
a contributory system based on calculated percentage deductions from
the worker‘s salary every month. The state or government added another
percentage contribution. Benefits in form of a pension were then paid
upon reaching age sixty for males or fifty-five for females. In situations
where an employee resigned before attaining retirement age, pension was
paid promptly as a lump sum. Ideally, this scheme was meant to help
retired civil servants live honourably even without being in formal or full
time employment (Department of Social Welfare, 1990).
(b) Zambia National Provident fund (ZNPF): ZNPF was established as a
contributory scheme for workers in parastatals and the private sector. It
was also open to self-employed workers and those in the informal sector.
Unlike the civil service pension scheme, ZNPF contributors were entitled
to claim benefits when they reached fifty or fifty-five years. ZNPF also
made payments called ‗old age retirement‘ and ‗emigration payments‘.
This meant that upon retirement, people became entitled to old age
retirement benefits and where repatriation to their home villages was
needed, payments were made to facilitate their movement (Ibid, 1990).
(c) The Workmen’s Compensation Fund (WCF): The WCF was not
established as an old age scheme. It was intended to serve persons
injured during the course of work or duties. The scheme would then be
used to help them throughout their life span (Ibid, 1990).
2.7.8 Other Interventions on Ageing by the UNIP Government
In 1982, government formed a National Committee on Ageing which was
represented in all provinces through Provincial Committees. The national
committee came up with practical steps, functions and activities to respond to
challenges of ageing at that time. The following were some of the functions:

43
(i) Promote and assist programmes aimed at strengthening the family as the
primary unit for care of the aged, and educating families and
communities to care for elderly members in order to fulfill the national
philosophy of Humanism. This would in turn obviate or minimise as
much as possible, pressure on institutional care;
(ii) Develop meaningful activities within the widest range of civic, cultural,
recreational and educational programmes; promote vocational and
occupational programmes for the elderly to prepare them for their future
lives so that they remain economically productive as long as possible;
(iii)Request and encourage voluntary agencies to include programmes for
the aged in their plans in order to assist in the identification and
establishment of volunteer services where the knowledge and skills of the
retired elderly persons could be utilised to promote efficient community
services;
(iv) Establish an Old Age Pension Scheme covering all people above age fifty-
five who have no income so as to cater for majority elderly people
especially in rural areas where income is scarce. In addition, introduce
legislation to exempt elderly persons above fifty-five years from paying;
(v) Expose the elderly to primary health care services and influence the
creation of pre-retirement services, such as counseling, so that people
could retire in good health, in honor and dignity after years of
contributing to the social and economic development of the country;
(vi) Conduct series of national and local seminars in all parts of the country;
promote and encourage research on ageing; mount public campaigns to
help understand and change certain negative attitudes towards the

44
elderly and, through the mass media, keep all agencies and
organisations serving the elderly well informed; and
(vii) Assist relevant voluntary organisations in supplementing government
efforts to improve conditions in institutions providing accommodation
and care for the aged.
As a way forward, government prioritised the following programmes and
projects for immediate implementation:
(a) Improve the quality of services offered by institutions catering for older
persons;
(b) Establish Day-Care Centres where older people could gather to exchange
ideas or engage in meaningful activities; such centres would also act as
temporary shelters for stranded elderly persons or for those awaiting
repatriation to their home villages;
(c) Encourage the involvement of elderly persons in village industries where
they could engage in useful pursuits such as crafts, which would not
only keep these senior citizens occupied but would also assist in the
preservation of the nation‘s cultural heritage; and
(d) Involve the elderly in traditional cultural activities such as traditional
ceremonies etc.
2.8 Recent/Current Policies and Programmes on Ageing
The Ministry of Community Development and Social Services (MCDSS), now
The Ministry of Community Development Mother and Child Health (MCDMCH)
is mandated through an Act of Parliament to produce and implement
programmes that provide and facilitate social support services to the
vulnerable persons in Zambia. MCDMCH is also responsible for Zambia‘s Policy

45
on Ageing. However, currently, Zambia does not have an approved policy on
ageing. Much of what is discussed here are other ratified pieces of policies
under the MCDMCH and other line ministries such as health and labour.
2.8.1 Public Welfare Assistance Scheme (PWAS)
The Public Welfare Assistance Scheme (PWAS) is amongst major safety nets
government has continued administering. The PWAS has been revised twice, in
1996 and 2000. PWAS is not a scheme for the aged only, but for other
categories of vulnerable individuals as well, including the disabled, chronically
ill persons, people in homes headed by single parents, orphans/vulnerable
children, and people displaced by disasters such as floods (Social Welfare
Policy, 2000). For any person to be considered under PWAS, one has to meet
certain conditions, which include:
- Evidence of no support from relatives;
- Inability to work;
- No known assets used in production;
- Evidence of having insufficient food availability; and
- Having a below-standard housing unit.
The Public Welfare Assistance Scheme is currently operational in all districts of
Zambia and is mandated to provide the following services:
- Cash and non cash provisions (goods and services). This service targets
at least 200 000 beneficiaries every year. However, this goal is mostly not
reached;
- Bursary schemes for orphans and vulnerable children;
- Health care cost scheme especially for OVCs; and
- Provision of food security packs through the Programme Against
Malnutrition to vulnerable groups such as women, children and the
elderly.
46
According to the MCDSS ministerial briefs (2010), the Department of Social
Welfare is currently reviewing PWAS guidelines to strengthen its supervision
and implementation.
2.8.2 Social Cash Transfer Scheme (SCTS)
The Social Cash Transfer Scheme (SCTS) was introduced in 2004 as a Pilot
Scheme to Siavonga and Kazungula districts of Southern Province. Initiators of
this scheme were the MCDMCH and the Germany Technical Corporation.
Prior to the implementation of the scheme, a National Household Survey was
conducted and results of this survey suggested that about 10 per cent of the
households or 6.9 per cent of the population was found to be ‗destitute‘ in
these districts (Schubet et al, 2004). The term ‗destitute‘ in this respect was
defined to include those individuals who were unable to access adequate
livelihoods without external support and who were incapable of withstanding
shocks. They had no assets, had limited productive capacity due to their
circumstances, normally suffered from socio-political exclusion - that is, did
not have any credibility, voice or platform in their communities due partly to
low self-confidence - and were dependent on public and/or private transfer of
resources (Ibid, 2004).
The Social Cash Transfer Scheme is a constituent of a more broad approach to
enable poor households to better manage key risks associated with food
security, destitution, and HIV/AIDS. The scheme has three specific objectives:
(i) Reduce extreme poverty, hunger and starvation in the 10 per cent most
destitute and incapacitated households in the target districts (Siavonga
and Kazungula);
(ii) Focus mainly (but not exclusively) on households that are headed by the
elderly and are caring for OVCs because the breadwinners are

47
chronically sick or have died due to HIV/AIDS or due to other reasons;
and,
(iii)Strengthen community-driven social protection strategies
Target groups are households (not individuals) that meet the following criteria:
(a) They are critically poor and being poor in this respect was defined to
mean people who only afforded one meal per day, were most of the times
begging from neighbours, children were malnourished and were not
going to school, had very poor shelter and clothing, were unable to afford
medical treatment etc.; and
(b) They have no adult household member able to work or for big
households had a dependency ratio of more than 300.
The Scheme was designed to work through the PWAS structure consisting of
community welfare assistants that help identify households meeting the
targeted criteria.
Currently, the Social Cash Transfer Scheme pilot has been expanded to include
more districts such as Kazungula, Monze, Chipata and Katete.
Originally, the SCTS was designed to target poor households which met the
criteria described above; however, the scheme in Katete was planned to target
households where the head of the household was at least sixty years and
above. As a result, while the SCTS incorporates all vulnerable groups, it has a
mechanism to also respond to ageing (Schubet et al, 2004).
According to the Ministry of Community Development and Social Services
(Mother and Child Health) ministerial briefs (2010) the Social Cash Transfer
Scheme has also uplifted standards of living of beneficiary groups. The

48
criterion used to include older people has also indirectly helped them look after
themselves and their dependents with less difficult.
2.8.3 Institutional Care
The government has continued running homes for the aged. Institutional care
is, however, still the last resort. The number of old people‘s homes is still small
in Zambia. This maybe a result of very little resource allocation towards their
expansion, or it may mean simply that ageing is still a non-pressing and non-
priority area.
There are eight homes for the aged in Zambia. Two are entirely run by
government while the rest are under churches. Government‘s role has largely
been the provision of grants to these institutions to help in caring for the
elderly. In addition, government also runs shelters called ‗Places of Safety‘.
These are institutions providing temporary shelter, food and care to stranded
and destitute persons. They include Bwacha in Kabwe and Matero in Lusaka
(Kamwengo, 2004).
2.8.4 The Population Policy
The first attempt to recognise the importance of population in the development
process came through the adoption of the 1989 Population Policy. The policy
tried to affirm government‘s commitment to adopting and implementing
appropriate strategies to manage population resources in a manner consistent
with Zambia‘s ultimate objective of accelerating the rate of economic
development (Population Policy, 1989). Since then, there have been several fora
where population issues have been discussed, assessed and incorporated in
development agendas.
The population policy of 1989 was the main population document providing
policy guidance on population issues until it became clear that the policy was
not up to date with emerging contemporary issues such as urbanisation,
gender concerns, brain drain and HIV/AIDS. As a result, since 1998 through to
49
2006, the Ministry of Finance, UNFPA, donor agencies and the University of
Zambia were involved in several consultative meetings that finally saw the
drafting and adoption of the 2007 Policy on Population for Zambia.
Like any other policy, the Zambia Population Policy is premised on a defined
vision, rationale, guiding principles, objectives, targets and strategies. Ideally,
the population policy should incorporate ageing either directly (emphatically) or
obliquely (passively) through categorised vulnerable groups. While the focus
here is to relate ageing to the population policy, it is also important to highlight
what the vision and rationale of the population policy are so as to make
informed conclusions on whether the policy in question does indeed reflect
ageing as the case should be. The 2007 National Population Policy‘s vision
states as follows:
To improve the quality of life of the people through the achievement of population
trends commensurate with socio-economic development.
The rationale is as follows:
Population is a primary determinant for any development; the interplay between
and among population characteristics such as fertility, mortality and migration
affect and are in turn affected by development, as such, they are critical,
therefore, in the formulation and implementation of policies and plans which
accelerate socio-economic development. As such, population policy should be
viewed as an important element in the formulation and implementation of other
sector policies and programmes.
The major thrust or focus in this rationale is the significance of population
issues in development and also the role that these factors play in the
formulation of other policies. Analyses of aspects affecting the population in
general are sometimes used as precursors for other policy pronouncements
and/or documents. However, it is not clear to what extent population issues
are reflected in other policies. Needless to say, topics in the population policy
such as gender, youth, reproductive health, etc., have been incorporated in
other policies both within and outside government (including non-

50
governmental organisations). Gender, for example, has its own gender policy.
Reproductive Health issues are also reflected as stand-alone policies, or
incorporated in the health policy as well.
The 2007 National Policy on Population has five main guiding principles and
seven objectives. The following are the guiding principles:
(i) The government, stakeholders and individuals have a responsibility to
have well-managed population for sustainable development and
improved quality of life for all;
(ii) All groups in society and individuals should have access to
appropriate and accurate information on population and development
issues;
(iii) All individuals should have access to basic services such as
education, health, housing, water and sanitation;
(iv) All couples and individuals should decide freely and responsibly on
the timing, number and spacing of their children for manageable
family size; and
(v) Government has a responsibility to facilitate people‘s ability to make
informed choices and to create an enabling environment in which they
can effectively manage their lives.
These principles document issues that benefit all interest population groups. It
is actually clear that all people have to have access to information on
population, education, health, housing and water sanitation. These principles
also recognise the role government plays in the creation of environments where
all people can effectively manage their lives. However, they seem not to address
ageing.

51
As stated earlier, the seven main objectives in the population policy address
distinct subjects. Each of these objectives has other themes of interest; some of
them include reproductive health, HIV/AIDS, morbidity and mortality,
adolescent fertility, creation of a national population database and the need to
evenly distribute the population between urban and rural areas (National
Population Policy, 2007: 13). The policy advocates for a reduction in morbidity
and mortality, especially maternal mortality, infant and child mortality and
adolescent fertility. In general, it could be stated that the policy touches
indirectly on ageing because the approach it takes is general. For example,
there is emphasis on ‗all people‘ having access to reproductive services,
meaning that even older people have such access.
2.8.5 Health Policy
National Health Policy was drafted to guide the development and
implementation of health activities in the country. It is a subject of discussion
in this study because health is one of the programmes upon which ageing is
extolling insurmountable effects. At the world level, attempts are being made to
document effects of ageing societies on health, especially health expenditure
and financing. For example, Kinsella (2005) reports that an important aspect of
older people‘s standards of living is on their health care and the costs involved.
The 2002 WHO World Health Report was devoted to identifying, quantifying
and reducing disease risk factors associated with ageing. Data from the
European Community Household Panel Surveys (since 1990) has also begun to
show the intricate interplay between ageing and health and the effects of the
former to the latter. Studies within Africa also suggest that, as populations age
and undergo certain health and economic transitions, their disease patterns
change and, therefore, responsive health policies are cardinal (Kahn et. al.,
1999; Kahn et al, 1999a).
The Health Policy is the umbrella document upon which health sector sub-
policies were formulated. After 1991, the health reform policy framework was

52
designed and in 1994, the national health strategy framework was also
developed, followed by revisions in 1997 and subsequently between 2001 and
2005. In 2006, another national health strategic plan was launched for the
period 2006 to 2010. This plan was designed to, among other things, respond
to the UN MDGs. Its vision is:
„… Towards Attainment of the Millennium Development Goals and National Health
Priorities…‟
Originally, the health policy stipulated that all citizens in Zambia should have
equal access to healthcare services regardless of their location, gender, age,
race, social, economic, cultural and political status (National Health Strategic
Plan, 2006-2010). While the vision of the first policy on health stipulated
‗equity to health access‘ and all services provided free of charge, the 1991/2
health reforms led to the reformulation of equity and ‗all able-bodied‘ Zambians
with capacity to earn income were now expected to contribute to the cost of
health care (Kalumba, 1997). In essence, what this meant was that
compulsory/private health insurance schemes were now put in place. User
fees/charges were also introduced, and community financing became an
important component of health financing (Ibid, 1997: 29). It is in line with
health financing reforms that issues of ageing were also considered.
In 1996, government came up with the ‗Second Agenda‘ in health where health
security was a consequence of ‗healthy public policy‘ and not merely the effect
of medical services (Ibid, 1997). As such, the government‘s second agenda on
health reforms tried to address four key areas, namely:
(i) Integrated community health development under a reformed district
health system;
(ii) National essential health packages of care for sustainable health;

53
(iii) The quality of life and health security of specific population groups;
and
(iv) Accountability for health in public policy.
‗Second agenda‘ policy parameters identified population groups such as
women, children and the elderly as special interest sectors in need of special
attention, and it became clear that certain groups, though able bodied, were
not capable of paying hospital user fees. The suggestion to set an agenda to
accommodate groups such as women, infants, the aged, etc., was premised on
the need to reduce maternal and infant mortality, as well as to develop services
that would help improve the quality of life, especially in old age (Ibid, 1997: 32).
The Health Policy is by no means expected to guarantee expressly issues of
ageing in totality. It is a policy whose aim is to improve the health status of all
citizens irrespective of the socio-economic standing. As stated already, the
policy initially stipulated that all able-bodied persons should be able to
contribute to the cost of their health. However, in its current form, exceptions
were included, and the following statement shifted the paradigm:
„Every able-bodied Zambian with an income should contribute to the cost of his or
her health‟. However, the following groups are exempted: children under five and
adults over sixty-five; those with diseases such as TB, HIV/AIDS, STDs, Cholera
and dysentery; safe motherhood and family planning services; immunisation; and
chronic problems such as hypertension and diabetes and other related factors‟
(Kalumba, 1997).
Since 1991, the health policy has remained the same. What the Ministry of
Health (MoH) has adopted has been the development of strategies to
operationlise its implementation. Even with this approach, what is clear is that
issues of ageing are not as distinct as other interest groupings like child health,
reproductive health etc. For example, the 2006-2010 National Strategic Plan
currently being implemented by the MoH has the following vision:

54
„Equity of access to assured quality, cost-effective and affordable health services
as close to the family as possible‟
It should be stated that while the National Health Policy is not expected to
outline all aspects of ageing in detail, it is in any case expected to respond to
basic ones. As a way of summarising, it is clear that both the 1991 health
reforms and subsequent strategic plans have not transformed significantly to
respond to ageing adequately. Further, it is also true that while the health
policy recognises ageing and the aged in general, this is only so at the point of
service delivery, in this case, health centres.
2.8.6 National Employment and Labour Market Policy
Current debates and arguments on the need to ensure older persons are
integrated back into society hinge on many essential aspects, among them
‗labour‘. The National Employment and Labour Market Policy, or simply the
Labour Policy, is a very important instrument which should guide processes
and procedures on how elderly persons would be provided opportunities to
participate on the Zambian labour market front. The main committee of the
2002 World Assembly on Ageing (Madrid Plan of Action) adopted several
resolutions. Pertinent among them were Articles 6 and 12 (Report of the
Second World Assembly on Ageing; Madrid, 8-12 April 2002). The two articles
stress commitments world leaders made to ensure integration of older persons
into all aspects of development including opportunities to participate in the
labour force. Article 6 for example provides for the full inclusion and
participation of older persons in society. It states:
The modern world has unprecedented wealth and technological capacity and has
presented extraordinary opportunities: to empower men and women to reach old
age in better health and with more fully realised well-being; to seek the full
inclusion and participation of older persons in societies; to enable older persons to
contribute more effectively to their communities and to the development of their
societies; and to steadily improve care and support for older persons as they need

55
it. We recognise that concerted action is required to transform the opportunities
and the quality of life of men and women as they age and to ensure the
sustainability of their support systems, thus building the foundation for a society
for all ages. When ageing is embraced as an achievement, the reliance on human
skills, experiences and resources of the higher age groups is naturally recognised
as an asset in the growth of mature, fully integrated, humane societies.
Article 12 stipulates that older persons should have opportunities to work as
long as they wish and are able to, and should also continue to have access to
education and training opportunities. Article 12 states that:
The expectations of older persons and the economic needs of society demand that
older persons be able to participate in the economic, political, social and cultural
life of their societies. Older persons should have the opportunity to work for as
long as they wish and are able to, in satisfying and productive work, continuing to
have access to education and training programmes. The empowerment of older
persons and the promotion of their full participation are essential elements for
active ageing. For older persons, appropriate sustainable social support should be
provided.
Articles 6 and 12 articulated in the 2002 Madrid Plan of Action Report targets
both the Policy on Ageing as well as the Labour Policy.
Since 2003, the Labour Policy has been undergoing major transformations.
These transformations have resulted in the production of what is referred to as
Parts I and II of the Labour Act (Labour Policy, 2004). The current Labour
Policy‘s main objective is to:
„Create adequate and quality jobs under conditions that ensure income, protection
of workers and basic human rights‟.
From independence to 1991, Zambia had not been operating with well
documented and coordinated employment and labour market policies. It was
decided that such a situation, which manifested itself through problems
perpetrated by falling levels of employment, effects of HIV/AIDS on

56
productivity, and an unreliable social security system, required a statutory
instrument to guide government in terms of roadmaps, programmes and
projects whose main thrust would be to salvage problems mentioned above
(Ibid, 2004).
The Labour Policy is guided by a set of seven principles and ten sector
employment and labour market policies. There are three critical areas:
Employment Creation, Social Protection/Security provision and Mainstreaming
Special Interests and Vulnerable Groups.
Under the sub policy, Employment Creation, the policy subjects itself to the
International Labour Organisation (ILO) Convention, which binds member
countries like Zambia to pursue an active employment policy designed to
promote the goal of full, productive and freely chosen employment (ILO
Charter, Convention 122). All possible areas of employment are categorised in
this section and the policy seeks to ensure that they respond to challenges
Zambia was facing especially on the economic front.
Most of the strategies on employment creation aim at strengthening these
specific areas so that it is possible to among others, absorb youths out of
employment and, thereby, foster economic growth. However, there is nothing
specific on the need to provide employment opportunities to older people as
well.
The goal of the Social Protection/Security sub policy is to enhance the
efficiency and comprehensiveness of the social security system in the country.
It aims at improving on the levels of benefits, coverage and delivery of the social
security system. This sub policy basically targets individuals who are in formal
employment, but also aims at mobilising the informal sector so that it forms
what is referred to as ‗mutual aid societies‘, which would collect contributions
from members to be accessed if and when need arose. Whether these mutual
aid societies are operational is a different subject altogether; in any case, the

57
social protection advocated for here does meet some requirements to
incorporate ageing, especially after retirement and for the ‗out of work‘ people.
Another critical component the labour policy addresses is to mainstream
special interest and vulnerable groups. The policy identifies five groups of
persons classified either as special or vulnerable. These groups include:
Gender, Youths, Retrenches, those with Disability and People Living with
HIV/AIDS (PLWA). Gender in this case is synonymous with women because the
policy discusses gender with women in focus, and not necessarily as it is
defined in the real sense (Gender is a socially defined concept which applies to
both males and females).
For each of the groups identified, specific strategies have been developed to
meet their needs. For example, in order to address problems of the youth, the
policy proposes to provide micro-financing for youth self-employment (Labour
Policy, pp.52). Consequently, this policy has further been operationalised
through the Youth Empowerment Project where government identifies and
provides soft loans to deserving youths so they become self reliant. Similarly,
women have also been brought to the limelight through advocacy to
employment opportunities, especially formal employment. In fact, all
government ministries have ‗a gender focal person‘ to help promote women
employment in government. Certain legal barriers which clearly or
inadvertently discriminate against women have also been removed and
replaced with those that are gender sensitive. However, the sub policy does not
address ageing at all. It is devoid of specific reflections addressing ageing as a
special interest area and older people as a special group as well.
2.8.7 Other Long-Term Policies – Vision 2030
Zambia has several policies which seek to address both the social and
economic concerns the country is currently facing. In order to articulate long-
term development objectives, Zambia has in place a document called ‗Vision
2030‘, which states:

58
„Zambia to become a prosperous middle income country by the year 2030‟.
The 2030 vision inevitably calls for policies that would help accelerate and
sustain economic growth so that the poor may also be accorded opportunities
to participate and benefit from the growth process of the country (FNDP;
MFND, 2006).
To achieve Vision 2030, government re-introduced five-year development plans
with the first being the Fifth National Development Plan or FNDP and currently
the Sixth National Development Plan - SNDP.
The World Assembly on Ageing (2002) recommended that ageing should be
placed in all development agendas particularly, Article 7 of the 2002 Report of
the Second World Assembly on Ageing says:
At the same time, considerable obstacles to further integration and full
participation in the global economy remain for developing countries, in particular
the least developed countries, as well as for some countries with economies in
transition. Unless the benefits of social and economic development are extended to
all countries, a growing number of people, particularly older persons in all
countries and even entire regions, will remain marginalised from the global
economy. For this reason, we recognise the importance of placing ageing in
development agendas, as well as in strategies for the eradication of poverty and
in seeking to achieve full participation in the global economy of all developing
countries (Second World Assembly, 2002).
Vision 2030 is guided by embodying values of socio-economic justice
underpinned by principles of gender-responsive sustainable development,
democracy, respect for human rights, good traditional and family values,
positive attitudes towards work, peaceful co-existence and private-public
partnerships. It highlights three scenarios outlining development options,
namely the baseline, the preferred and the optimistic.

59
Examination of the FNDP, SNDP and Vision 2030 shows that these long-term
development agendas do not also clearly respond to ageing. While it is true that
the subsection on Social Investment and Human Development of Vision 2030
(Annex II, pp.32) attempts to include some aspects of ageing under the food
and nutrition sector, provisions are not specific. For example, one of the targets
of the Food and Nutrition Sector is to strengthen nutrition care practices for
vulnerable groups, including young children, adolescents, women of
reproductive age, PLWA and those affected by non-communicable diseases
such as diabetes, hypertension, coronary heart diseases, and cancer. Similarly,
under the social protection sector, an attempt again is made to include the
aged alongside those classified as vulnerable groups. The social protection
sector has three targets, one of which aims at strengthening contributions
towards the social security of all vulnerable Zambians by ensuring that
incapacitated and low capacity households have sufficient livelihood security to
meet basic needs and are protected from the worst impacts of risks and shocks
(Ibid, pp. 32). These two examples are the closest the vision comes to in
addressing ageing.
2.9 Summary of the Literature
Critical interrogation of the literature reviewed here shows that very little or no
information is directly discussing studies conducted on Zambia in particular.
Similarly, while there are examples where studies have been conducted to
produce the literature in reference, it is also true that majority of what has
been reviewed is more theoretical rather than actual empirical studies on
ageing. In other words, there is very little evidence to support most or all of the
theoretical as well as conceptual ‗claims‘ made here. In the same way, a review
of several policy documents discussed above shows that they lack adherence to
tenets and principles of active ageing both as prescribed by the United Nations
and the WHO. This, therefore, also goes on to show why it was important to
conduct this study. This research therefore helped to provide or enhance both

60
literature in theoretical terms as well as evidence on the actual determinants of
active ageing as well and the challenges facing older people in an African
setting and Zambia in particular.
61
__________________________________________________________________________
CHAPTER 3: METHODOLOGY
The purpose of this chapter is to describe the methods that were selected and
used for this study. The chapter includes descriptions of the research design,
target population, sampling and sample size, data collection techniques and
analysis, ethical considerations and limitations.
3.1 Research Design
In undertaking this study, a cross-sectional, non-experimental survey design
was used. The study used triangulation to generate the required data. It should
be noted that in the social sciences fraternity, triangulation is often used to
indicate that more than two methods are used in a study with a view to double
(or triple) check results. This is also called ‗cross examination‘ (Cheng, 2005).
The use of ‗cross examination‘ in the real sense is farfetched, but was used to
collate data that was generated using different methods. Most importantly,
methods used can be defined in terms of qualitative and quantitative
procedures.
3.2 Target Population and Study Areas
3.2.1 Working Definition of an ‘Old Person’
Defining old age or an old person is not easy. Although there are commonly
used definitions, the World Health Organisation (WHO) states that there is no
general agreement at which age a person becomes old. In fact, as far back as
1875, in Britain, the Friendly Societies Act voiced the definition of old age as
‗any age after 50‘; yet pension schemes mostly used 60 or 65 for eligibility
(Roeback, 1979). The United Nations (UN) states that even up to now, there is
no standard numerical criterion for the definition of old age; however, the UN
has agreed to use 60-years plus as the cut-off year to refer to older population.
In the same way, this study adopted the UN agreed criterion where an old
62
person is simply anyone who has attained at least age 60. In view of this
definition, the target population was all individuals in the selected study sites
who were 60 years or over.
3.2.2 Study Areas
The study was conducted in five districts representing four provinces out of the
nine in Zambia, namely Western, Southern, Lusaka and the Copperbelt. The
districts are Sesheke, Livingstone, Lusaka, Ndola and Mufulira. These
represented a rural-urban mix although only Sesheke is predominantly rural.
These districts were purposefully chosen. One very distinct factor influential in
the choice of these provinces and districts is that they all have homes for the
aged; and since the study‘s target audience included both institutionalised and
non-institutionalised older people, it was, therefore, logical to make a selection
of sample areas that have these homes and were also relatively easy to access.
Currently, there are seven government and private-run homes for the aged in
Zambia. These are Maramba in Livingstone (Government), Mitanda in Ndola
(Salvation Army), Chibolya in Mufulira (Government), Devine Providence House
in Lusaka (Government), Kandiana in Sesheke (Mwandi Mission), Matero
Transit Home in Lusaka (Government) and Sepo and John Chulu in Mongu
(the Catholic church). For this study, Kandiana, Maramba, Matero Transit,
Mitanda and Chibolya were selected. These homes for the aged were selected
because they are situated in the sample districts where the study was
undertaken.
3.2.3 Study Area Details
Sesheke – Kandiana Home for the Aged: Sesheke is a border town in the
Western province of Zambia. It lies on the northern bank of the Zambezi river
which forms the border with Namibia's Caprivi Strip at that point. According to
the 2010 census of population preliminary results, Sesheke has a population of

63
about 94 600. Kandiana Home for the Aged is a privately-run home situated at
Mwandi Mission. It has a capacity of housing up to sixteen residents. Sesheke
provided a sample from the community as well as from the home for the aged.
Livingstone – Maramba Home for the Aged: Livingstone is a historic colonial
city and present capital of the Southern province of Zambia, a tourism centre
for Victoria Falls (Mosi-oa-Tunya), lying 10 km north of the Zambezi river. It is
a border town with road and rail connections to Zimbabwe on the other side of
the Falls. Its population is estimated to be 142 000 (2010 Census of Population
and Housing Preliminary Report). Maramba Home for the Aged was established
in March, 1963. It has a maximum capacity of forty and is run by the
government.
Lusaka – Matero Transit Home: Lusaka is the capital and largest city of
Zambia. It is located in the southern part of the central plateau of the country,
at an elevation of 1279 m. It has a population of 1.7 million (Ibid, 2010). It is a
commercial centre as well as a centre of government. Matero Transit Home is
not necessarily a home for the aged; it is a halfway house where stranded old
people and destitutes are kept before repatriation to other homes. However, it
is due to a large number of old-age-residents that has earned it classification
as a home for the aged. Although the transit home has a capacity of forty
residents, it usually houses over 100 people per month. Lusaka, like Sesheke,
provided a sample for interviews from the community as well as from the home
itself.
Ndola – Mitanda Home for the Aged: Ndola is the third-largest city in Zambia,
with a population of 455 000 (Ibid, 2010). It is the industrial and commercial
centre on the Copperbelt, Zambia's copper-mining region and capital of the
Copperbelt province. Ndola lies just 10 km from the border with DR Congo.
Mitanda was the first home for the aged to be established in Zambia. Its
current location was an army mess during the Second World War, but was
later turned into a government hostel after the war. In 1948, the hostel was

64
transformed into Mitanda Home for the Aged. It is being run by the Salvation
Army Church.
Mufulira – Chibolya Home for the Aged: Mufulira is a city (population 161,600)
on the Copperbelt province of Zambia. It began in the 1930s around the site of
the Mufulira Copper Mine on its north-western edge. The city is sixteen km
from the border with the Democratic Republic of the Congo and is the start of
the Congo Pedicle road connecting the Copperbelt to Luapula province. A
tarred highway to the south-west connects Mufulira to Kitwe (40 km) and
Chingola (55 km), and another to the south-east connects to Ndola (60 km).
Chibolya Home for the Aged was established in September 1963. It was opened
to care for elderly people who had no relatives. Currently, Chibolya is being run
by the Department of Social Welfare under the Ministry of Community
Development, Mother and Child Health (MCDMCH). Mufulira was included to
provide a sample for the institutionalised old people.
3.2.4 Sampling, Selection of Respondents and Sample Size
Purposive as well as snow-ball sampling techniques were employed in
identifying respondents. Purposively, all residents in existing old people‘s
homes in the selected districts were targeted for inclusion in the study. Older
people, herein defined as anyone aged 60 years and above were selected
through snow-ball sampling (Goodman, 1961; Salganik and Heckathorn,
2004). Snow-ball sampling was employed because the target population has no
known sampling frame. This technique is also used for ‗hard to reach‘ or a ‗not
readily available groups‘ such as nomads or sex workers. The Snow-Balling
technique involved identifying households with older people and interviewing
them. After interviews, respondents (older people) were asked to indicate or
show the research team where else other older people resided within their
community. Once such households were identified, interviews were held and
the process took through the same approach until the desired sample size was
reached.

65
Establishing whether or not a respondent was indeed at least 60 years old
involved firstly asking the respondent if they were 60 years and above and then
writing down the response and going ahead with the interview. However, in
situations where the respondent could not state with certainty their age, a
calendar method was used; this involved asking respondents to mention any
historical event associated with their birth. For example, some respondents
stated that they were born at the time the First or Second World War started or
ended. If some historical calendar event could not be recalled, estimates were
used; for some difficult and isolated instances where age of a respondent could
not be established, consultations were made with either relatives or close
neighbours to help estimate their ages.
In this respect, therefore, the study aimed at achieving a sample size of at least
700 respondents. This sample size had enough cases from which to establish
meaningful analysis. Fraenkel et al (2003) argue that a minimum of 100 is
recommended for descriptive studies, while for correlational studies, a
minimum of 500 is recommended. In all these examples, and using the
minimum of 500 as a yardstick, our sample was representative of the older
people in Zambia and was therefore large enough to perform some statistical
inferences.
In order to collect community perceptions on ageing, focus group discussions
(FGDs) were held with some of the members of the same community. Selection
of FGD participants was done with the help of Neighbourhood Health
Committees. One Focus Group Discussion was held in each of the three study
areas and the number of participants was: Sesheke (n=9), Lusaka (n=12) and
Ndola (n=10). While the groups were heterogeneous in terms of age and sex,
homogeneity was achieved in that all participants knew and were looking after
an old person in their household. It is also important to note that
confidentiality in a FGD is almost never guaranteed especially by the

66
researcher; however, discussants were encouraged not to divulge any or part of
the discussions as their views were strictly confidential.
3.3 Data Collection Instruments and Techniques
3.3.1 Instruments
A questionnaire with closed- and open-ended questions was designed and used
to collect quantitative data on challenges experienced by older people. As Borg
et al (2003) note, questionnaires are excellent instruments to help gather data
on facts, attitudes and sometimes perceptions. Secondly, a discussion guide
was also developed and used to collect qualitative data by soliciting for views
and perceptions about older people and ageing in particular. In terms of data-
collection techniques, quantitative and qualitative data collection methods were
used and details of the same are outlined below:
3.3.2a Quantitative Data
Quantitative data was generated in two ways. Firstly, in order to understand
the magnitude, growth rates and proportions of the aged in Zambia, both
backward- and forward-projections were performed. Projections for the period
1950 to 2000 were modelled on UN data using reverse projections based on the
1969 Zambia Population Census. Projections for the period 2000 to 2050 were
based on the 1990 census. All projections were modelled in SPECTRUM.
Secondly, a semi-structured questionnaire was developed to gather quantitative
data for individual respondents. This instrument contained both open- and
close-ended questions. Open-ended questions in the questionnaire were
included to yield qualitative data as well. The instrument was administered to
institutionalised (those found in old people‘s homes) as well as non-
institutionalised older people living in study areas. The purpose of this
instrument was to gather information on issues related to socio-economic living

67
conditions of the elderly in order to determine the challenges of ageing and the
aged in Zambia.
3.3.2b Qualitative Data
Qualitative data was collected in two ways:
1. Firstly, Focus Group Discussions (FGDs) were conducted in all three
districts. They were composed of people living within target areas but
were by definition not classified as old. The FGD guide and method were
designed to gather information on perceptions and attitudes towards
ageing and the aged by members of the community who themselves were
not old (as defined in this study), but were assumed to have information
on the situation of the aged or in some cases were themselves looking
after old persons.
2. Secondly, a detailed review of the draft policy on ageing was also. The
purpose of conducting a detailed ageing policy review was to examine its
adequacy in terms of responsiveness to both the UN Pricnciples on
Ageing and the 2002 WHO Active Ageing Framework.
3.3.2c Data Collection Procedure
A group of 10 interviewers was recruited and trained for this study. Two were
selected as supervisors. It comprised of six males and four females. The tools
(both the questionnaire and the FGD guide) were never translated. However, all
interviewers were recruited on the basis of being able to speak languages
spoken in sampled areas. During training and pre-test, interviews were held in
the local languages spoken in study areas. This was done to ensure
standardization is maintained and the questions asked in the local language
maintained the same meaning as those in English.
Focus Group Discussions were conducted by the supervisor and another
member of the team. The supervisor was actually the lead interviewer while

68
another member of the team was a note taker. Data collection using the
questionnaire was based on a one-on-one interview. In some cases, interviews
were held in-doors while in others, in the open. However, in all these
situations, confidentiality was upheld and maintained.
3.4 Data Analysis
In order to analyse quantitative data, univariate, bivariate and multivariate
analyses were performed using STATA. The draft policy on ageing was
examined by comparing its consistency with UN principles on ageing, WHO
Active Ageing Framework and the 2002 Madrid Plan of Action and how it
resonates with provisions of these documents. Analysis of Focus Group
Discussions (FGDs) was based on key thematic areas and their application to
the WHO Active Ageing Framework. FGD data were transcribed, typed and
arranged by key thematic areas commensurate with specific objectives of this
study.
3.5 Ethical Considerations
Ethical clearance was sought from The University of Zambia Ethics Committee.
Before visiting homes for the aged, clearance was also sought from institutions
in charge of such homes. Most importantly, however, a written consent from
participants was solicited.
For those that could not read or write, a verbal consent based on the written
consent was sought and research assistants signed on the form after
permission was granted. This was done to ensure that persons interviewed
were fully aware of the aims of the research, and that confidentiality was
maintained and assured, and that information solicited was to be treated
anonymously (Bowling, 2002). This consent also gave participants information
about their freedom to withdraw at anytime if they felt so. This approach was
included to ensure freedom of participants to choose to participate in the
69
research or not, and also safeguard against possible future legal liabilities (Ibid,
2002).
3.6 Challenges of Data Collection
Several challenges were experienced during the data collection process which
started on 23 August 2009 and ended on 10 September 2009. These included
language barriers, slow pace of interviews, slow process of getting permission
to conduct interviews especially in areas where chiefs had to consent, delays in
getting access to homes for the aged, etc.
While it is recognizable that frames to capture older people exist through the
Census and also from studies conducted on large scales such as Demographic
and Health Survey and Sexual Behaviour Survey, the process of selecting the
sample for our study was difficult because older people are classified as ―hard
to reach‖. This is due to their low proportions in the population (Bless et al,
1995; de Vaus, 2002). Funding was also inadequate, thereby limiting the
number of study districts as well as the sample size.
Further, in spite of detailed explanations about the purpose of the study and
assurances about confidentiality, some participants refused to take part in the
study. Despite all these challenges and limitations there was only about 1
percent non-response rate and as such, the study gathered useful information
on the magnitude, challenges and determinants of population ageing in
Zambia.
3.7 SPECTRUM Model Methodology1
DemProj (the main projections software in SEPCTRUM) calculations are based
on the standard cohort component projection modified to produce a single year
projection. The inputs to the demographic projection are:
1 Adopted as presented in the Demoproj Spectrum System Policy Manual prepared by John
Stover and Sharon Kirmeyer (2009)

70
• Pop5 (a, s): Population by five year age groups (a) and sex (s) in the base
year
• TFR (t): Total fertility rate by year
• ASFR (a, t): Distribution of fertility by age by year
• SRB (t): Sex ratio at birth by year
• LEB (s, t): Life expectancy at birth with AIDS by sex and year
• Model life table
• Migration (a, s, t): Net in-migrants by age, sex and time
The assumption here is that the base population is a mid-year estimate and
that the rates (TFR, life expectancy and migration) are calendar year averages.
The first step in building the model is to split the base year population, which
is in five-year age groups, into single ages. This is accomplished by using the
Beers procedure (Beers, 1945). This procedure uses a series of polynomial
equations to divide the population in five-year age groups into single year age
groups while maintaining the population total and providing a smooth
transition from one age to the next. This produces a base year population by
single age: Pop (a, s, to).
The age distribution of migration is also specified in five-year age groups.
Migration is also split into single age groups using the Beers procedure.
Mortality is specified as life expectancy at birth by sex, and is shown on a
model life table. The life tables provide survival rates by single year of age for
certain values of life expectancy, such as 20, 25, 30, 35, and so on. DemProj
interpolates between these index values to find the age specific survival rates
for the exact life expectancy specified for each year.
Model life tables are provided in five-year age groups. These are split into single
age survival rates, S(a, a+1), using the life table indicators for nLx (the number
of person years lived between ages x and x+n by an initial cohort of 100 000
people) and lx (the number of survivors at age x out of an original cohort of 100
000 people). The following are some of the equations in the model:

71
1. Spop(0) = 1L0
2. Spop(1) = (l1 + l2) / 2
3. Spop(2) = (l2 +l3) / 2
4. Spop(3) = (l3 +l4) / 2
5. Spop(4) = (l4 +l5) / 2
6. Spop(5..80+) calculated by applying Beers procedure to nLx values
7. Calculate S (a,a+1) = Spop (a+1) / Spop(a)
The number of deaths from midyear to midyear is calculated as:
Deaths (a,s,t1,1) = (Pop(a1,s,t1) + [migration(a1,s,t1) +migration
(a1,s,t))/2] * ( 1 – [S(a1,a,t1) + S (a1,a,t))/2] )
The number of deaths during the calendar year t is:
[Deaths(a,s,t1) + Deaths(a,s,t)]/2
The population is projected by age and sex for ages 0 to 79 as:
Pop(a,s,t) = Pop(a1,s,t1) + [migration(a1,s,t1) + migration(a1,s,t)]/2 –
deaths(a,s,t1,t)
The number of births from midyear to midyear is:
Births (t1,1) = Σa=15,49 [Pop(a,female,t1) + Pop (a,female,t)]/ 2 * [TFR(t1)
+ TFR(t)] / 2 * [ASFD (a,t1) + ASFD(a,t)] / 2
The number of births during the calendar year is:
[Births(s,t1) + Births(st)]/2
The population of age 0 is:
Pop(0,s,t) = (Births(s,t1) + Births(s,t))/2) * Spop(0)
3.7.2 Projections Assumptions
Before these projections were finally done, there were few assumptions taken
into account. These assumptions are based on local conditions in Zambia, but
more also using the United Nations assumptions for making future population
72
projections. To project the population for some desired time in the future, the
United Nations uses assumptions regarding future trends in fertility, mortality
and international migration. Because future trends cannot be known with
certainty, a number of projection variants are produced. The following are a
summary of the variants commonly used by the UN:
A. Fertility assumptions: convergence towards total fertility below
replacement level. These fertility assumptions are described in terms of
the following groups of countries:
- High-fertility countries: Countries that until 2010 (previous UN
projections) had no fertility reduction or only incipient decline;
- Medium-fertility countries: Countries where fertility has been
declining but whose level was still above 2.1 children per woman in
2005-2010; and
- Low-fertility countries: Countries with a total fertility at or below 2.1
children per women in 2005-2010.
Projections in this study were based on the medium variant assumption where
Zambia has shown some decline in TFR from about seven children per woman
to about five (mostly in urban areas), but above a TFR of 2.1.
B. Mortality assumptions: increasing life expectancy except when affected
by HIV/AIDS – this assumption was critical in making projections on
Zambia since the country has an HIV prevalence greater than one per
cent and, therefore, life expectancy and adult mortality are heavily
affected;
C. International migration assumptions: Zambia‘s international migration
data is very difficult to derive due to poor data on the subject; as a result,
the assumption on migration is presumed to be zero migration.
73
3.7.3 Data Input and Justification
Projections were based on the 1990 Zambian census of population and
housing. The justification to project the population of Zambia using the 1990
census is that the re-analysis report with details of the extent of census errors
is or was readily available. For example, the Post Enumeration Survey (PES)
undertaken in December 1990 showed that the undercount of the national
population was about 5.5 per cent (Wotela, 2008). In addition, the Central
Statistical Office used both the Myers Index and the United Nations age-
accuracy index to evaluate the quality and accuracy of age reporting. The
Myers Index for males was 6.8 and 7.0 for females. From these analyses, it was
concluded that for the 1990 census, the most preferred digits were zero, two
and eight (ibid, 2008).
3.7.4 Other Input Assumptions
Projections were disaggregated by sex, age and residence. Reverse projections
for the period 1950 to 2000 were also based on the 1990 census data. This is
so because there is no complete data for Zambia for 1950 until 1969 when a
complete census was undertaken which included all people residing in Zambia.
Population indicators such as Total Fertility Rates (TFR), Life Expectancy (LE)
etc. are all based on the 1990 census of population results.
Individual population indicators adopted based on the 1990 census findings
included the following (medium variant):
Total fertility rate: 6.7
Age Specific fertility rate: 1990 Census Adjusted Estimates
Sex Ratio at Birth: 103.0
Life Expectancy (Males): 46.1
Life Expectancy (Females): 47.6

74
Model Life Table: Coale-Demeny-North; the North Model was
used since in 1990, Zambia‘s IMR was
about 147/1000
International Migration: 0.00
Note that the current data on international migration is not usable and the
collection of this data is very unreliable. Currently, some international
migrations data are being collected at points of entry and exit. However, the
process is inconsistent and much of the data collected has never been
processed.

75
CHAPTER 4: FINDINGS
This chapter presents findings of the study. They are divided in four broad
sections. The first part (I) highlights results from projections showing both past
and future population ageing trends; the second and third parts (II and III)
dwell on findings relating to background characteristics of respondents as well
as challenges they face. This chapter also highlights determinants of active
ageing based on actual statistical tests and outcomes (multiple regression), and
lastly, the fourth part (IV) concentrates on the Draft Policy on Ageing.
PART I PROJECTIONS
4.1 Projecting the Older Population- Zambia: 1950 To 20502
Projections were performed for two periods. The first period contains
projections for the years 1950 to 2000, while the second runs from 2000 to
2050. Subsequently, comparisons in terms of differences and similarities
between these two periods were also made.
Figure 8 shows projections for people aged 60 years and over (60+) using the
medium variant. In 1950, the total population of Zambia was about 2.3 million;
the population aged 60+ was about 50 000; by 1970, the total population of
Zambia was 4.2 million, however, the population of people aged 60+ more than
doubled to around 100 000; this took just about twenty years. From 1970 to
the year 2000, the population of people aged 60+ in Zambia more than
quadrupled, from around 100 000 to over 330 000, representing a percentage
increase of over 300 per cent. By gender desegregation, from 1950 to 1965, the
growth of male and female populations aged 60+ was almost the same; after
2 Projections in this section were conducted using actual 1990 census data – the methods and processes
are in the Methodology Chapter (3)
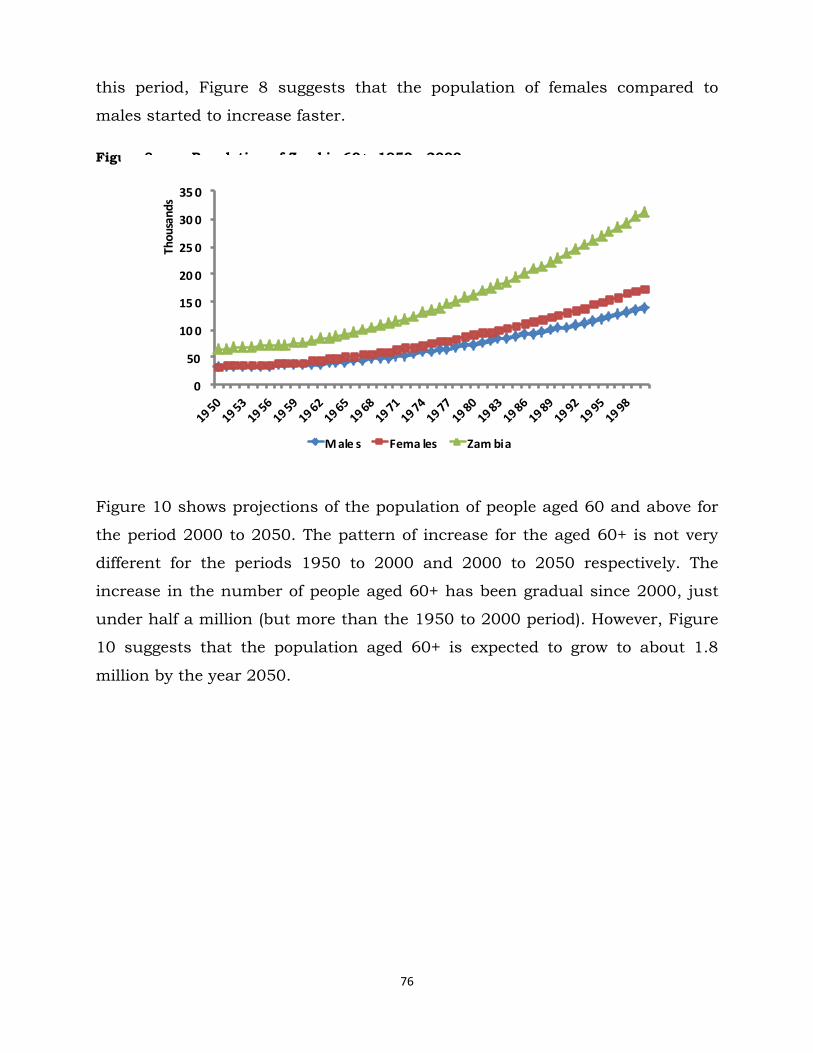
76
this period, Figure 8 suggests that the population of females compared to
males started to increase faster.
Figure 8: Population of Zambia 60+, 1950 - 2000
0
50
10 0
15 0
20 0
25 0
30 0
35 0
Thou
sand
s
M ale s Fema les Zam bia
Figure 10 shows projections of the population of people aged 60 and above for
the period 2000 to 2050. The pattern of increase for the aged 60+ is not very
different for the periods 1950 to 2000 and 2000 to 2050 respectively. The
increase in the number of people aged 60+ has been gradual since 2000, just
under half a million (but more than the 1950 to 2000 period). However, Figure
10 suggests that the population aged 60+ is expected to grow to about 1.8
million by the year 2050.

77
Figure 10: Projected Total Population 60+; 2000-2050
0
500,000
1,000,000
1,500,000
2,000,000
2,500,000
19
90
19
92
19
94
19
96
19
98
20
00
20
02
20
04
20
06
20
08
20
10
20
12
20
14
20
16
20
18
20
20
20
22
20
24
20
26
20
28
20
30
20
32
20
34
20
36
20
38
20
40
20
42
20
44
20
46
20
48
20
50
Males Females Zambia
In terms of growth rates for the period 2000 to 2050, the population aged 60
years and over is expected to grow between 2 and 5.1 per cent per annum.
Overall, the growth will oscillate around 3 per cent. The peak growth will be
realised around 2035 and progressively settle around 2.5 per cent per annum
by 2050, which is relatively higher than the overall actual population growth to
be experienced for the same period (UN, 2007b)
4.1.1 Patterns and Trends of Ageing Differentials by Projection
Periods – 1950 to 2000 and 2000 To 2050
Figures 12 and 13 show percentage contributions of people aged 60 and over
against the entire population of Zambia for the periods 1950 to 2000 and 2000
to 2050. For the period 1950 to 2000, approximately 2 to 3.1 per cent of
Zambia‘s population was aged 60 and above with females having a higher
share compared to males (3.1 against 2.5 per cent). Figure 12 also suggests
that for the period 2000 to 2050, the trend is likely to be similar to that of the
period 1950 to 2000. For example, between 2008 and 2020, the percentage
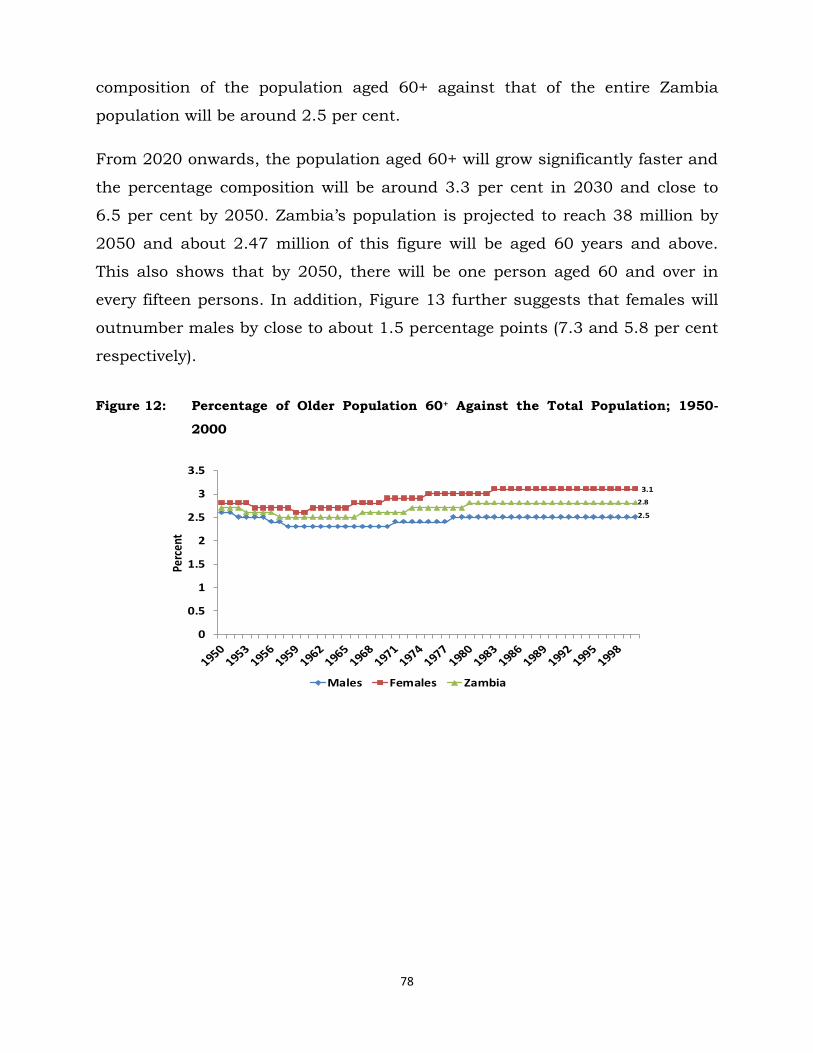
78
composition of the population aged 60+ against that of the entire Zambia
population will be around 2.5 per cent.
From 2020 onwards, the population aged 60+ will grow significantly faster and
the percentage composition will be around 3.3 per cent in 2030 and close to
6.5 per cent by 2050. Zambia‘s population is projected to reach 38 million by
2050 and about 2.47 million of this figure will be aged 60 years and above.
This also shows that by 2050, there will be one person aged 60 and over in
every fifteen persons. In addition, Figure 13 further suggests that females will
outnumber males by close to about 1.5 percentage points (7.3 and 5.8 per cent
respectively).
Figure 12: Percentage of Older Population 60+ Against the Total Population; 1950-
2000
2.5
3.1
2.8
0
0.5
1
1.5
2
2.5
3
3.5
Perc
ent
Males Females Zambia

79
Figure 13: Projected Proportions of the Population 60+ for Zambia 2000-2050
0.0
1.0
2.0
3.0
4.0
5.0
6.0
7.0
8.0
19
90
19
93
19
96
19
99
20
02
20
05
20
08
20
11
20
14
20
17
20
20
20
23
20
26
20
29
20
32
20
35
20
38
20
41
20
44
20
47
20
50
Male Female Zambia
There are also different growth rates and percentage compositions for rural and
urban areas. Between 2000 and 2030, the urban population aged 60+ will grow
more than the rural population. Projected growth rates for urban areas will be
around 7.1 per cent per annum from 2000 to about 5.8 per cent per annum by
2030. During the same period, the rural population aged 60+ will grow from
2.5 per cent per annum to about 5.7 per cent per annum. From 2035,
population aged 60+ in rural areas will surpass that of urban areas. Projections
indicate that on average, the rural population aged 60 and above will be
growing by at least 6 per cent per annum but later drop to about 3.8 per cent
per annum by 2050. For the same period, the urban older population will grow
by about 5.1 per cent per annum and later drop to about 2.8 per cent. In terms
of percentage composition, Figure 15 confirms further that much of the
population aged 60+ will be found in rural areas. The same pattern is expected
to continue up to the year 2050; in fact, the number of older people aged 60+
in rural areas is expected to be double the current figure.

80
Figure 14: Projected Proportions Rural/Urban Population 60+; 2000-2050
SUMMARY of PART I
The forgoing sections have shown that Zambia, like many other countries in
the developing regions of the world, is also undergoing rapid population ageing.
Despite uncertainties that necessarily underlie population estimates and
particularly projections for the future, there is no doubt that population ageing
in Zambia is becoming a demographic reality. As observed earlier, this pace of
population ageing is many times faster than experienced historically by the
more developed countries and therefore requires serious attention. While
bearing in mind that proportions of people aged 60+ could be low even until
2050 (6.5 percent), in absolute terms, this figure is quite insurmountable; as
such, the need to discuss and analyse ageing in view of the challenges and
determinants of active ageing as well as investigate policy measures in place to
look at ageing cannot be over-emphasised.
0.0
1.0
2.0
3.0
4.0
5.0
6.0
7.0
1990
1992
1994
1996
1998
2000
2002
2004
2006
2008
2010
2012
2014
2016
2018
2020
2022
2024
2026
2028
2030
2032
2034
2036
2038
2040
2042
2044
2046
2048
2050
Rural Urban

81
PART II CHARACTERISTICS AND CHALLENGES
4.2 Social, Demographic and Economic Characteristics of Respondents
This section describes demographic, social and economic characteristics of the
aged. Background characteristics are foundational aspects influencing analysis
and interpretation of other variables. Some of the background information
contained in this section include among others, age and sex of respondents,
marital status, education and residence.
4.2.1 Background Characteristics - Sample and Respondents
In total, there were 700 respondents. However, ten were dropped from the
analysis due to missing information on sex and age. Of the 690 in the data set,
284 were males while 406 were females (41.2 and 58.8 per cent respectively).
The majority of respondents were from urban areas (81 per cent) while the rest
were from rural areas (18 per cent). Lusaka contributed the largest (42 per
cent) to the sample, followed by Ndola and Sesheke respectively. Other towns
represented were Livingstone (3.5 per cent) and Mufulira (7.3 per cent).
Summaries of these characteristics are in Table 1.1.

82
Table 1.1: Background Characteristics of Respondents
Males
(n) Females
(n) Males
(%) Females
(%) Total
Residence
Urban 245 319 86.3 78.6 564 (81.7)
Rural 39 87 13.7 21.4 126 (18.3)
Town of interview
Livingstone 18 6 6.3 1.5 24 (3.5)
Lusaka 131 165 46.1 40.6 296 (42.9)
Mufulira 23 27 8.1 6.6 50 (7.3)
Ndola 74 121 26.1 29.8 195 (28.3)
Sesheke 38 87 13.4 21.4 125 (18.1)
Length of stay at current location
<5 years 40 38 14.4 9.5 78 (11.5)
between 5-9 years 15 23 5.4 5.8 38 (5.6)
>10 years 223 338 80.2 84.7 561 (82.9)
Age
60-69 106 193 37.3 47.5 299 (43.3)
70-79 102 151 35.9 37.2 253 (36.6)
80-89 66 47 23.2 11.6 113 (16.3)
90-99 9 14 3.2 3.4 23 (3.3)
100-108 1 1 0.4 0.4 2 (0.2)
Total 284 406 41.2 58.8 690
Majority (43 per cent) of respondents were aged between 60 and 69 years,
followed by those between 70 and 79 years (37 per cent); and the rest (19.8 per
cent) were aged 80 years and over. The sample also shows that there were
slightly more females in the age category 90 to 99 years than males; on the
other hand, there were slightly more males (23 per cent) than females (11 per
cent) in the age group 80-89.

83
4.2.2 Other Socio-demographic Characteristics
Table 1.2: Marital Status, Living Children and Education Attainment by Age, Gender, Residence and Current Place of Stay
Age Sex Residence Place of stay Total
60-69 70-79 80+ Males Females Urban Rural *Comm *OPH (%, n)
Marital status
Married 43.1 34.3 22.4 56.3 21.4 37.4 28.6 15.2 39.3 35.8 (247)
Widowed 40.1 53.7 59.4 26.4 64.7 49.1 48.4 53.5 48.2 48.9 (338)
Divorced 12.7 6.7 12.3 11.9 9.3 9.4 15.1 22.2 8.5 10.4 (72)
Separated 1.0 1.1 0.7 1 0.9 0.7 2.4 3.0 0.7 1.0 (7)
Never married 3.0 3.9 5.0 4.2 3.4 3.4 5.6 6.1 3.4 3.7 (26)
Total 299 253 138 284 406 564 126 99 591 100 (690)
Education attainment
Primary 56.2 51.8 43.5 55.6 49.5 51.1 56.4 34.3 55.0 52.0(359)
Secondary 21.1 8.3 7.3 22.5 7.4 15.3 6.4 9.1 14.4 13.6(94)
Tertiary 3.0 1.2 2.2 3.2 1.5 2.0 3.2 3.0 2.0 2.1(15)
No education 19.7 38.7 47.1 18.7 41.6 31.7 34.1 53.5 28.6 32.1(222)
Total 299 253 138 284 406 564 126 99 591 100 (690)
Number of living Children
No children 1.2 1.5 8.2 2.2 2.8 2.8 1.2 4.9 2.4 2.5(14)
1-5 children 67.3 70.1 71.4 60.2 75.2 66.2 84.7 87.8 67.5 69.0(379)
6-9 children 29.1 23.4 17.4 31.0 20.7 27.4 11.8 7.3 26.4 24.9(137)
10+ children 2.4 5.1 3.1 6.6 1.2 3.7 2.4 0.0 3.7 3.5(19)
Total 254 197 98 226 323 464 85 41 508 (100)549
Mean Number of Children Reported: 4.2
*Comm = Residing in community *OPH = Residing in old people’s home
Marital status has important socio-economic implications that contribute
significantly to the well-being of older people. In some respects, spouses can be
primary sources of material, social and emotional support and can also provide
personal care during times of illness and frailty (UNFPA, 2008). Thus, living
with a spouse typically has advantages (Ibid, 2008). Table 1.2 shows that less
than one in ten (3.7 per cent) respondents reported never having been married
before. Close to half (48.9 per cent) were widowed and close to two in five (35.8
per cent) were married. One in ten (10.4 per cent) were divorced and about 1
per cent reported that they were separated. Amongst those who were married,
the proportion reduces with increasing age; in the same way, widowhood also
increases with age.
84
In terms of gender, more males (56.3 per cent) compared to females (21.4 per
cent) reported being married. Females were more likely to report being widowed
(64.7 per cent) than males (26.4 per cent). This is also true with regard to the
place of residence. Similarly, while over 60 per cent of females were widowed,
only about a fifth of males reported the same. Table 1.2 further shows that
there were more (37.4 per cent) elderly people in urban areas who were married
compared to rural areas (28.6 per cent). The percentage of respondents who
were widowed is almost the same for both urban and rural areas (49.1 and
48.4 per cent respectively); in addition, there were slightly more (15.1 per cent)
respondents in rural areas who were divorced compared to those in urban
areas (9.4 per cent). Generally, over half (61.2 per cent) indicated that they had
been in their current marital status for more than twenty years.
With regards to educational attainment, majority (52.0 per cent) had primary
school education. About 13.6 and 2.1 per cent reported having attained
secondary and tertiary level education respectively. About 32.1 per cent of
respondents reported that they had no formal education. There were variations
in education attainment by age, sex and residence. In terms of age, about one
in five (19.7 per cent) aged between 60-69 had never attained formal schooling
while amongst those aged 80 and above, close to half (47.1 per cent) had no
formal education; in general, education attainment is inversely related to age;
at all levels – primary, secondary and tertiary – the older the respondent was,
the lower the level of education attainment.
Gender differences in education were also pronounced especially at higher
levels. Overall, Table 1.2 shows that while the difference between males and
females at primary level were marginal (55.6 per cent vs 49.5 per cent) there
were noticeable differences at secondary level. Males were three times (22.5 per
cent) more likely to have attained secondary level education compared to
females (7.3 per cent). Similarly, there were more females (41.6 per cent)
reporting no schooling compared to males (18.7 per cent).

85
Respondents from rural areas and those living in homes for the aged were
slightly more likely to report having attained primary level education compared
to urban respondents and those living in communities respectively (56.4 and
55.0 per cent compared to 51.1 and 34.3 per cent respectively). While
differences in the proportion of respondents reporting no education were
relatively minimal between urban and rural areas (31 and 34 per cent), urban
respondents were substantially more likely (15.3 per cent) than their rural
counterparts (6.4 per cent) to have attained secondary level education.
Similarly, those living in old people‘s homes were more likely to report having
attained higher education than those in communities. Over half (55 per cent) of
elderly persons residing in Old People‘s Homes (OPH) had primary level
education compared to those living in communities (34.3 per cent). There are
also more respondents reporting having attained secondary education in OPH
(14.4 per cent) compared to those living in communities (9.1 per cent).
Conversely, respondents living in communities were more likely (53.5 per cent)
to report ‗no education‘ compared to those in OPH (28 per cent).
As for the number of children, Table 1.2 shows that the mean number of
children per elderly person was 4.2. Overall, 2.5 and 3.5 per cent of
respondents respectively reported that they had no living children or had more
than ten children. Majority (69 per cent) had at least one child while about 24.9
per cent had at least six children respectively. Generally, the number of
children reported reduced with increases in the respondent‘s age. Further,
results in Table 1.2 show that male respondents and those in rural areas
reported having more children than female and urban respondents
respectively.
4.3 Challenges Faced by Older People Data on challenges were in form of self-reports using a questionnaire
administered to older persons aged 60 years and above. This was triangulated
with Focus Group Discussions (FGDs) with members of the community.

86
Challenges were indentified at both individual and socio-economic or
environmental levels.
4.3.1 Individual Level Challenges
The main individual level challenge amongst older people is or was ‗low self
esteem and loneliness‘. In fact, throughout this discourse, it is clear that
almost all other challenges both at micro and macro levels feed into the
exacerbation of ‗low self esteem and loneliness‘. Other individual or micro level
challenges investigated include reported ‗health problems‘ and ‗functional
limitations‘. Sections 4.3.2 to 4.3.5 discuss details of these challenges.
4.3.2 Self-esteem and Loneliness
The psychological state of older people is cardinal to measure active life. Active
life is a significant contributor to the physical, emotional and spiritual well-
being of the elderly and is sometimes determined by one‘s self-esteem (WHO
2002 – Active Ageing Framework). Self-esteem is not only critical in
understanding ageing but is also central to the many challenges older people
face. Low self-esteem also precipitates loneliness; if one‘s self-esteem is low, it
is possible that one has fewer interactions with friends and colleagues, and
therefore, are lonelier compared to those that do interact. In fact, literature
suggests that loneliness accelerates and contributes to age-related decreases in
physiological resilience, influencing health behaviours, stress exposure,
psychological and physiological stress responses, and restorative processes
that replenish physiological reserves and fortifies against future stress (Palmore
1972; Lynch et al 2000).
In this study, the main indicators used to measure self-esteem were feeling
hopeless and useless. Others, which largely depend on these two and are
considered to be consequences rather than actual indicators of self esteem, are
loneliness and unhappiness.

87
Table 1.3: Self-esteem and Loneliness by Age, Gender and Residence
Age Sex Place of stay Residence Total
60-69
70-79 80+ Males Females OPH* Comm* Urban Rural %, n
Self-esteem indicators
and loneliness
Hopeless 27.1 31.2 34.1 27.1 32.0 33.3 29.4 26.4 46.0 30.0 (207)
Useless 22.7 26.9 37.7 23.9 29.5 36.4 25.7 23.7 42.9 27.2(188)
Unhappy 39.8 45.4 54.3 40.1 48.0 49.4 43.9 41.4 59.5 44.7(309)
Lonely 43.1 54.9 67.4 47.5 55.6 55.6 51.7 47.7 73.0 52.3(361)
Total 299 253 138 284 406 99 591 564 126 690**
**Note: while the row (n) total add up to the total sample (n=690), the column totals (per cent and n) do not
because only the ‘yes’ answer category was considered
It is evident from data in Table 1.3 that about 30 and 27 per cent of
respondents felt hopelessness and uselessness, respectively. It is also clear
that the older the respondent was, the higher the likelihood of reporting
hopelessness and feeling useless. For example, about 34.1 and 37.7 per cent of
respondents aged 80+ reported that they felt hopeless and useless compared to
about 27.1 and 22.7 per cent of those aged 70-79 and 60-69, respectively. In
the same way, feeling hopeless and useless was also more pronounced among
female respondents (32 and 29.5 per cent) than among male respondents (27
and 23.9 per cent respectively). Respondents in old people‘s homes and those
in rural areas were also more likely (33.3 and 46; 36.4 and 42.9 per cent) to
report feeling hopeless and useless compared to those in communities and
those in urban areas (29.4 and 26.4; 25.7 and 23.7 per cent respectively).
While it is clear that the prevalence of feeling hopeless and useless is quite high
among older people, unfortunately how these indicators are prevalent in the
general population is difficult to determine due to lack of data. In addition, due
to reported cases of feeling hopelessness and uselessness, respondents also
reported that they were lonely (52.3 per cent) and unhappy (44.7 per cent).
Being unhappy and lonely varied by selected socio- economic and demographic
characteristics. For example, at least three in five (67.4 per cent) of those aged
80+ reported that they were lonely; this is different from those aged between 60

88
and 79. Specifically, those aged 70-79 were also more likely (54.9 per cent) to
report being lonely compared to those aged 60-69 (43.1 per cent). In this
example, although the 70-79 group reported high experiences of loneliness, it
is not as pronounced as that reported by those aged 80 and above. Similarly,
over half of female respondents (55.6 per cent) reported that they were lonely.
This of course is higher than what males reported (47.5 per cent). This
disparity could be due to the fact that more males are still married compared to
females.
People in old people‘s homes reported experiencing more loneliness (55.6 per
cent) compared to those in communities (51.7 per cent). This, however, is not
out of the ordinary since majority of people in homes for the aged are restricted
or less free compared to their counterparts in communities. Additionally, data
in Table 1.3 suggests that residence is pivotal in determining loneliness. Close
to three-quarters (73 per cent) of respondents in rural areas reported that they
were lonely compared to about 47.7 per cent in urban areas. What is clear in
this case is the fact that irrespective of residence, sex or even age, older people
in general are faced with the challenge of feeling lonely. This was confirmed by
focus group discussions (FGDs) as the following typical excerpts illustrate:
‗Yes, old people are lonely. In fact, they spend a lot of their time crying and
complaining; even those that have children still feel lonely‟ (FGD, Mwandi -
Sesheke)
„Those who live alone are lonely, but those who live with other people are not
lonely at all‟ (FGD, Matero - Lusaka)
Other self-esteem indicators do not depart extensively from the pattern
observed above. They are affected by age, sex and residence disproportionately
as well. For example, slightly over half (54 percent) of respondents aged 80+
reported that they were unhappy; close to half (48 per cent) of those reporting
being unhappy were female. In addition, majority (59.5 per cent) of respondents
reporting being unhappy were from rural areas. Older respondents (80+),
mostly females and those residing in rural areas reported that they felt more
89
useless (37.7, 29.5 and 42.9 per cent respectively) and more hopeless (34.1,
32.0 and 46 per cent respectively) compared to other ages, being male and
residing in urban areas, respectively.
Low self-esteem, feeling lonely and unhappy amongst older people are
attributed to many factors including the way society looks at and ‗treats‘ old
people. Discussants in the FGD also confirmed that old people are humiliated,
laughed at, accused of witchcraft and are also viewed generally as difficult
people to be with:
„Humiliation is one other big problem these people face every day. Most people
think all old people practice witchcraft, and this depresses these people a lot.
Some people even go to an extent of just laughing at old people‟ (FGD – Masala,
Ndola)
„People laugh at them, especially those who are very old; Like my brother said
earlier on, people like accusing old people of practicing witchcraft‟ (FGD – Matero,
Lusaka)
„The other thing is that matters of the aged are mostly linked to witchcraft, which
is not fair, because it is not all old people who are involved in witch craft; there
are even young ones who are involved in this vice‟ (FGD, Masala – Ndola)
„Even when we would want to keep such people, their life style is very difficult;
they are very choosy, especially with food. You can imagine, there are times when
my wife prepares nshima with vegetables only, the old person I keep at my home
says her teeth hurt when she eats vegetables, but she is the first one to start
eating when meat is prepared. They are very difficult people to keep‟ (FGD,
Masala – Ndola)
4.3.3 Self-esteem, Loneliness and Selected Characteristics
Table 1.4 presents data showing the relationship between selected respondent
characteristics and measures or indicators of self-esteem. These characteristics
include marital status, presence of or having children and the frequency of
interactions of respondent with their peers. Studies have shown that marital
status, having children, and frequent interactions have some effect on the self-

90
esteem of older people (Hawkley et. al., 2007; Seeman, 2001; Namakando,
2004).
Table 1.4: Self-esteem and Loneliness and selected Characteristics
How they feel Total
Hopeless Useless Unhappy Lonely %, n
Marital status
Married 28.0 23.4 27.8 24.4 35.8(247)
Widowed 52.7 56.4 56.3 60.1 48.9(338)
Divorced 11.6 10.6 9.7 9.7 10.4(72)
Separated 2.4 2.7 1.3 0.8 1.0(7)
Never been married 5.3 6.9 4.9 5.0 3.7(26)
Total 207 188 309 361 (100)690
Has children
same community 39.2 41.4 35.2 37.9 33.7(161)
same town, different comm. 25.3 25.2 28.1 27.8 29.8(142)
different town, diff.comm 54.6 49.6 56.6 57.4 63.1(301
Frequency of interaction with peers
Everyday 40.7 40 34.1 37.2 35.9(212)
At least once weekly 32.5 31.3 36.8 36.2 42.6(251)
At least once monthly 4.1 5.3 3.1 3.2 2.7(16)
Never interact 22.6 23.3 25.9 23.4 18.7(110)
Total 172 150 258 304 100(589)**
**Note: Only the answer ‘yes’ was considered, as such rows as well as columns may not add up to
the total (n)
It is clear from results in Table 1.4 that there is some interplay between one‘s
marital status and self-esteem. However, variations were visible amongst
marital status categories. Respondents who reported being married (35.8 per
cent), widowed (48.9 per cent) and divorced (10.4 per cent) were also more
likely to report that they experienced at least all or most of the indicators of low
self-esteem and loneliness compared to those who were either separated (1 per
cent) and those who reported that they have never been married before (3.7 per
cent). In the same way, respondents who were divorced were more likely (60.1
per cent) to report that they were lonely compared to other marital statuses. In
fact, respondents who reported that they were divorced also seemed to
experience more of the investigated self-esteem indicators compared to other
marital statuses.
In the same way, there also seems to be connections between having children
and self-esteem indicators. However, there were variations, especially on

91
account of whether the child lives in the same community or same town but
different community, or a different town and community from the respondent‘s.
Respondents reporting that they had children living in a different town and
different community were more likely (63.1 per cent) to report low self-esteem
in the form of being hopeless, useless, unhappy and lonely compared to those
who reported that they lived in the same town but different community (29.8
per cent) and those who lived in the same community (33.7 per cent) with their
children respectively. Normally, it would be expected that respondents who
were living with children in the same community would also report ―little‖ low
self-esteem, nonetheless, data in Table 1.4 shows that it was not the case with
respondents in this study. This, however, depends on the relationship children
had with their parents and not necessarily where they stay.
Table 1.4 also shows that while interactions amongst peers are important in
determining self-esteem, the frequency of these interactions is actually what
makes the difference. Respondents who reported that they interacted once a
month with peers were also far much less likely (2.7 per cent) to report
experiencing feeling hopeless and unhappy compared to those who interacted
everyday (35.9 per cent), once a week (42.6 per cent) and those who never
interact at all (18.7 per cent). Whereas it is expected that daily interactions
could have higher positive effects on one‘s self-esteem rating, the data suggests
otherwise, meaning, therefore, that daily interactions do not necessarily help
alleviate feelings of hopelessness, uselessness, unhappiness and loneliness. In
any case, it is possible that the frequency of interactions may not really be a
factor in determining self-esteem but rather the relationship between the
elderly person and their children or relative.
In sections above, it has been mentioned that low self esteem and loneliness
are caused not only by individual factors (micro level) but are also functions of
the socio-economic, demographic and environmental factors (macro level). In
subsequent sections, we discuss factors that directly or indirectly affect self

92
esteem and loneliness amongst older people, both at individual as well as at
macro levels.
4.3.4 Health Status
While the concept of well-being incorporates many different dimensions,
perhaps none is of more central concern to older persons than their physical
health (Knodel et al, 2009). In all populations, biological processes ensure not
only that the risk of mortality increases steadily with increasing age but so do
physical limitations and certain illnesses (Ibid 2009). These health problems
are sometimes necessitated by older people themselves, or the environment
they find themselves in. Such situations or occurrences pose considerable
challenges for the aged.
A number of questions were asked to determine self-assessments of health
status of respondents using indicators like ailments or illnesses experienced in
the twelve months preceding the study and whether or not these had increased
since they turned 60 years old. Table 1.5 is a summary of the responses:
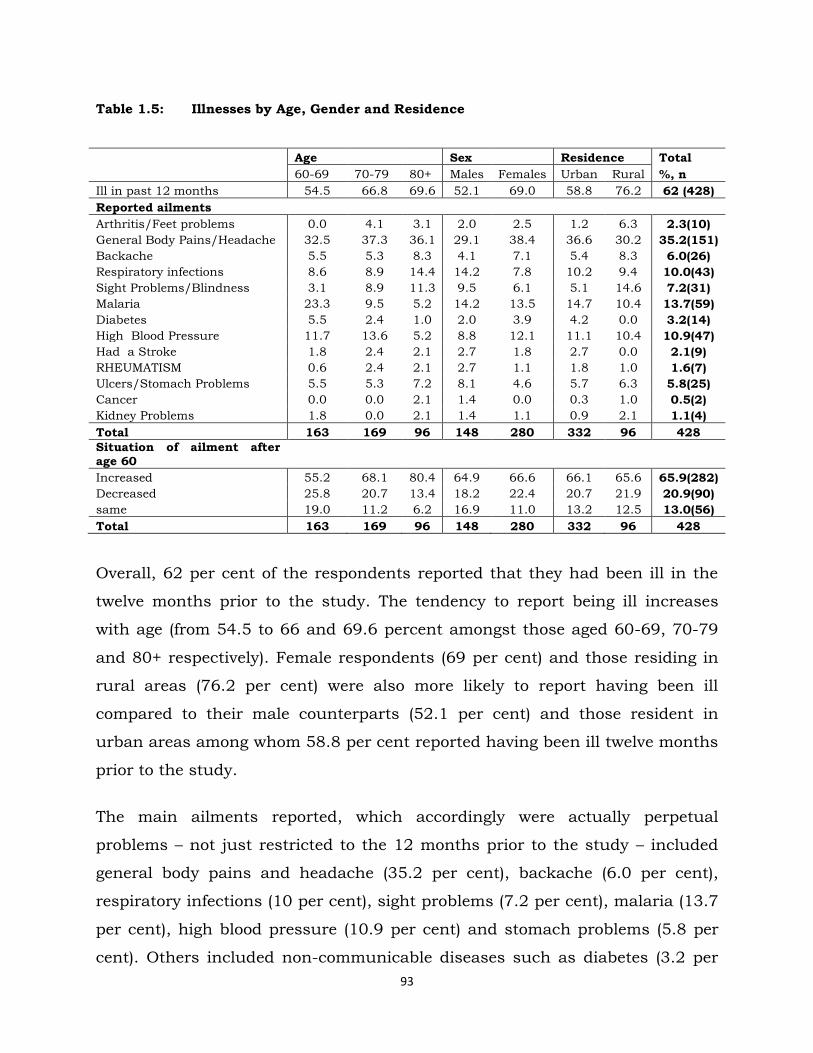
93
Table 1.5: Illnesses by Age, Gender and Residence
Age Sex Residence Total
60-69 70-79 80+ Males Females Urban Rural %, n
Ill in past 12 months 54.5 66.8 69.6 52.1 69.0 58.8 76.2 62 (428)
Reported ailments
Arthritis/Feet problems 0.0 4.1 3.1 2.0 2.5 1.2 6.3 2.3(10)
General Body Pains/Headache 32.5 37.3 36.1 29.1 38.4 36.6 30.2 35.2(151)
Backache 5.5 5.3 8.3 4.1 7.1 5.4 8.3 6.0(26)
Respiratory infections 8.6 8.9 14.4 14.2 7.8 10.2 9.4 10.0(43)
Sight Problems/Blindness 3.1 8.9 11.3 9.5 6.1 5.1 14.6 7.2(31)
Malaria 23.3 9.5 5.2 14.2 13.5 14.7 10.4 13.7(59)
Diabetes 5.5 2.4 1.0 2.0 3.9 4.2 0.0 3.2(14)
High Blood Pressure 11.7 13.6 5.2 8.8 12.1 11.1 10.4 10.9(47)
Had a Stroke 1.8 2.4 2.1 2.7 1.8 2.7 0.0 2.1(9)
RHEUMATISM 0.6 2.4 2.1 2.7 1.1 1.8 1.0 1.6(7)
Ulcers/Stomach Problems 5.5 5.3 7.2 8.1 4.6 5.7 6.3 5.8(25)
Cancer 0.0 0.0 2.1 1.4 0.0 0.3 1.0 0.5(2)
Kidney Problems 1.8 0.0 2.1 1.4 1.1 0.9 2.1 1.1(4)
Total 163 169 96 148 280 332 96 428
Situation of ailment after age 60
Increased 55.2 68.1 80.4 64.9 66.6 66.1 65.6 65.9(282)
Decreased 25.8 20.7 13.4 18.2 22.4 20.7 21.9 20.9(90)
same 19.0 11.2 6.2 16.9 11.0 13.2 12.5 13.0(56)
Total 163 169 96 148 280 332 96 428
Overall, 62 per cent of the respondents reported that they had been ill in the
twelve months prior to the study. The tendency to report being ill increases
with age (from 54.5 to 66 and 69.6 percent amongst those aged 60-69, 70-79
and 80+ respectively). Female respondents (69 per cent) and those residing in
rural areas (76.2 per cent) were also more likely to report having been ill
compared to their male counterparts (52.1 per cent) and those resident in
urban areas among whom 58.8 per cent reported having been ill twelve months
prior to the study.
The main ailments reported, which accordingly were actually perpetual
problems – not just restricted to the 12 months prior to the study – included
general body pains and headache (35.2 per cent), backache (6.0 per cent),
respiratory infections (10 per cent), sight problems (7.2 per cent), malaria (13.7
per cent), high blood pressure (10.9 per cent) and stomach problems (5.8 per
cent). Others included non-communicable diseases such as diabetes (3.2 per
94
cent) and stroke (2.1 per cent). Some of the problems reported herein could be
a result of old age or simply what maybe obtaining in communities; however,
due to lack of data to compare with, it is highly possible that such ailments
maybe more common and more prominent among older people. If these
findings are a reflection of reality, it is, therefore, possible that health problems
become more prominent in old age and are major challenges.
In response to the question on whether the frequency of the ailment or illness
they had reported, irrespective of the type had increased, decreased or
remained the same since the age of 60 years, more than six in ten (65.9 per
cent) indicated that the frequency of the problem or ailment they reported had
increased. About 20.9 and 13 per cent respectively thought that the ailment
they had experienced decreased and remained the same respectively.
Generally, those aged 80+ were more likely (80.4 per cent) than those aged 60-
69 (55.2 per cent) and 70-79 (68.1 per cent) to state that the ailment they had
reported had increased since age 60. Further, although the difference is quite
minimal, females were more likely (66.6 per cent) to report an increase in the
experience of reported ailments since turning age 60 compared to males (64.9
per cent). In the same way, rural respondents were slightly more likely to report
that the frequency of reported ailments had increased since turning age 60
compared to respondents in urban areas. It is clear that over half (65.9
percent) of respondents who reported that they had health problems of one sort
or another indicated that the health problems had actually increased since
they turned 60 years; inevitably, being ill and experiencing increases of such
problems in old age could also be linked to the low self esteem experienced by
older people in general.
4.3.5 Functional Limitations
Another notable challenge older people face is their ability to perform certain
functions considered important in day-to-day living. It should be mentioned
that functional limitations are mostly a consequence of declining health.
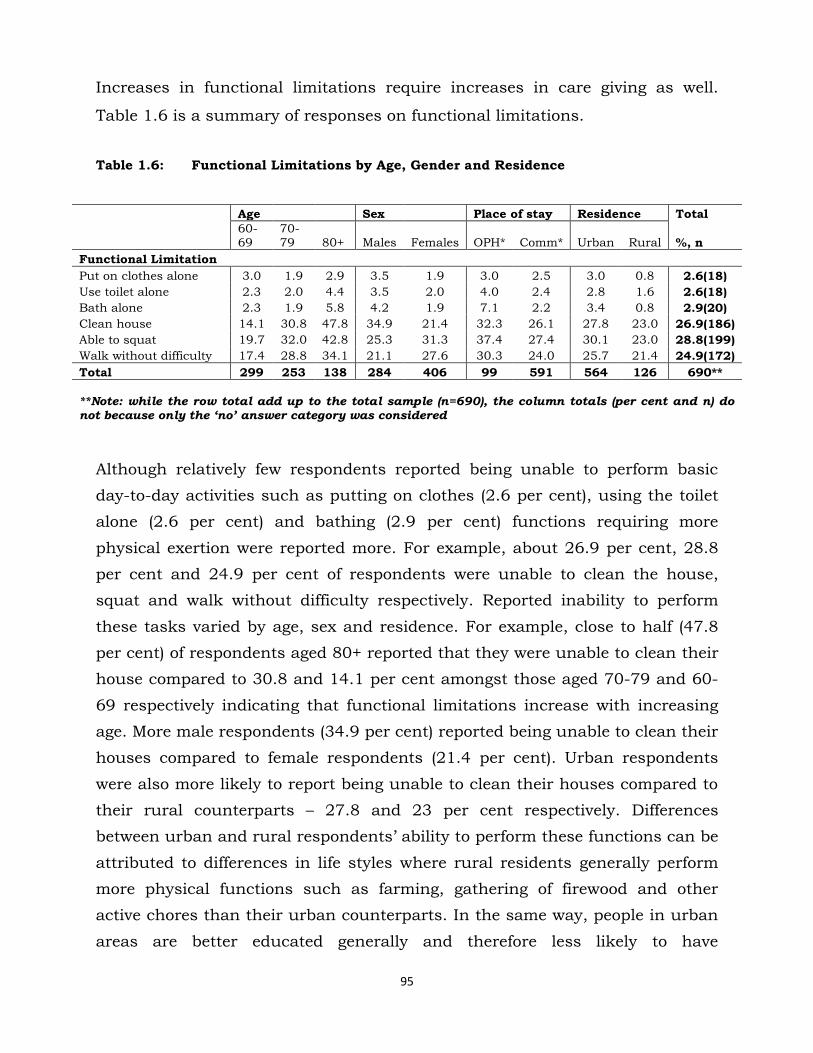
95
Increases in functional limitations require increases in care giving as well.
Table 1.6 is a summary of responses on functional limitations.
Table 1.6: Functional Limitations by Age, Gender and Residence
Age Sex Place of stay Residence Total
60-69
70-79 80+ Males Females OPH* Comm* Urban Rural %, n
Functional Limitation
Put on clothes alone 3.0 1.9 2.9 3.5 1.9 3.0 2.5 3.0 0.8 2.6(18)
Use toilet alone 2.3 2.0 4.4 3.5 2.0 4.0 2.4 2.8 1.6 2.6(18)
Bath alone 2.3 1.9 5.8 4.2 1.9 7.1 2.2 3.4 0.8 2.9(20)
Clean house 14.1 30.8 47.8 34.9 21.4 32.3 26.1 27.8 23.0 26.9(186)
Able to squat 19.7 32.0 42.8 25.3 31.3 37.4 27.4 30.1 23.0 28.8(199)
Walk without difficulty 17.4 28.8 34.1 21.1 27.6 30.3 24.0 25.7 21.4 24.9(172)
Total 299 253 138 284 406 99 591 564 126 690**
**Note: while the row total add up to the total sample (n=690), the column totals (per cent and n) do not because only the ‘no’ answer category was considered
Although relatively few respondents reported being unable to perform basic
day-to-day activities such as putting on clothes (2.6 per cent), using the toilet
alone (2.6 per cent) and bathing (2.9 per cent) functions requiring more
physical exertion were reported more. For example, about 26.9 per cent, 28.8
per cent and 24.9 per cent of respondents were unable to clean the house,
squat and walk without difficulty respectively. Reported inability to perform
these tasks varied by age, sex and residence. For example, close to half (47.8
per cent) of respondents aged 80+ reported that they were unable to clean their
house compared to 30.8 and 14.1 per cent amongst those aged 70-79 and 60-
69 respectively indicating that functional limitations increase with increasing
age. More male respondents (34.9 per cent) reported being unable to clean their
houses compared to female respondents (21.4 per cent). Urban respondents
were also more likely to report being unable to clean their houses compared to
their rural counterparts – 27.8 and 23 per cent respectively. Differences
between urban and rural respondents‘ ability to perform these functions can be
attributed to differences in life styles where rural residents generally perform
more physical functions such as farming, gathering of firewood and other
active chores than their urban counterparts. In the same way, people in urban
areas are better educated generally and therefore less likely to have

96
occupations that require a lot of physical exertion. In any case, functional
limitations, whether more prominent in urban or rural areas, or more
pronounced in females than males can also result in low self esteem for older
people. This is because in many instances, they have to depend on other people
to perform such functions some of which are very basic.
4.4 Challenges due to the Socio-economic Environment
Apart from individual challenges, older people also experience challenges which
come as a result of their socio-economic as well as demographic environments.
It should be emphasised also that challenges due to the environment, to some
extent, also affect individual challenges especially self esteem. Several
questions were asked to determine most of the challenges which could be
attributed to one‘s environment. We began this section by asking respondents
to give simple descriptions of their housing units. It is argued that the quality
of one‘s house or dwelling unit is important for measuring one‘s socio-economic
status as well as the quality of life itself (ZDHS, 2007). Tables 1.7, 1.7.1 and
1.7.2 present information on sanitary facilities, sources of water and main
materials used to construct housing units for older people in the study.
Table 1.7: Sanitary Facilities by Age, Sex and Residence
Age Sex Residence Total
60-69 70-79 80+ Male Female Urban Rural %, n
Type of sanitary facility
Flush/Pour Flash 45.2 44.0 37.9 45.9 42.3 54.0 1.7 43.6(258)
Pit latrine 52.0 52.9 56.3 52.7 53.1 45.6 82.9 52.9(313)
No facility 2.9 3.1 5.8 1.4 4.6 0.4 15.4 3.3(20)
Total 281 223 87 220 371 474 117 591
4.4.1 Sanitary Facilities
Good sanitary facilities as well as good and reliable sources of drinking water
are good markers of health not only to the community but to elderly persons as
well and can be a source of health challenges if not available. Over half (52.9
per cent) of respondents reported that they used pit latrines as toilet facilities.
While it is recognized that this finding is consistent with findings from the 2007
Zambia Demographic and Health Survey (ZDHS), where the commonest
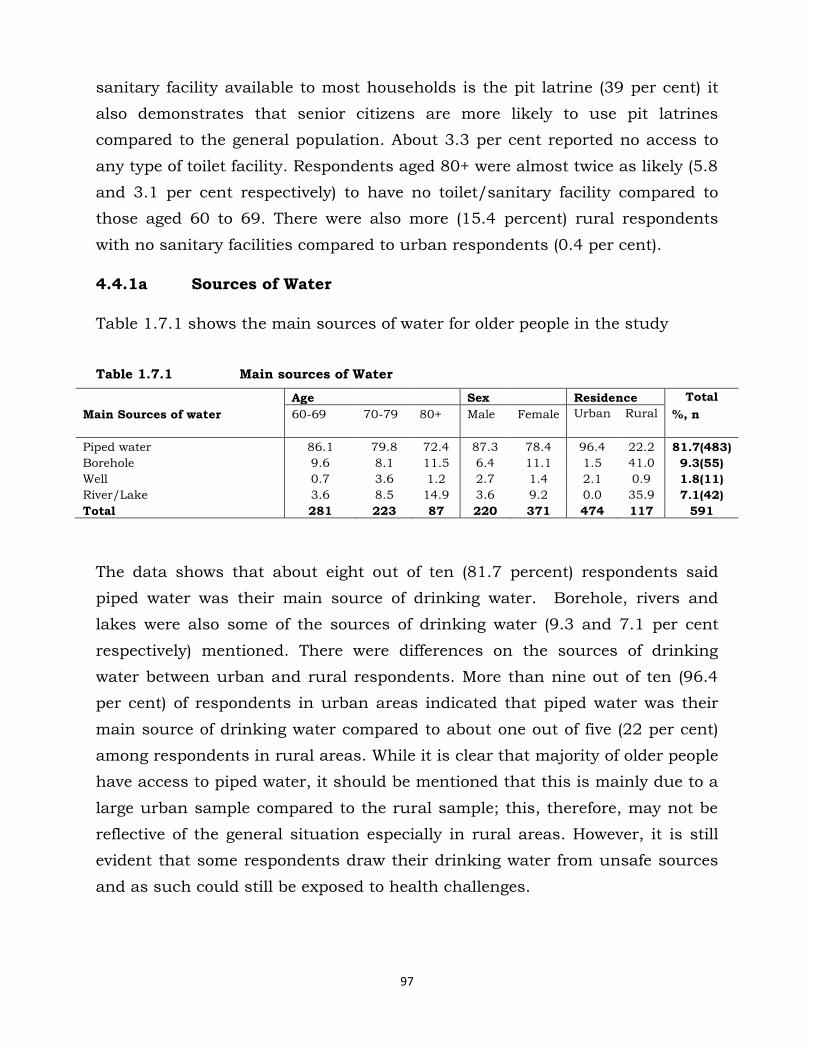
97
sanitary facility available to most households is the pit latrine (39 per cent) it
also demonstrates that senior citizens are more likely to use pit latrines
compared to the general population. About 3.3 per cent reported no access to
any type of toilet facility. Respondents aged 80+ were almost twice as likely (5.8
and 3.1 per cent respectively) to have no toilet/sanitary facility compared to
those aged 60 to 69. There were also more (15.4 percent) rural respondents
with no sanitary facilities compared to urban respondents (0.4 per cent).
4.4.1a Sources of Water
Table 1.7.1 shows the main sources of water for older people in the study
Table 1.7.1 Main sources of Water
Age Sex Residence Total
Main Sources of water 60-69 70-79 80+ Male Female Urban Rural %, n
Piped water 86.1 79.8 72.4 87.3 78.4 96.4 22.2 81.7(483)
Borehole 9.6 8.1 11.5 6.4 11.1 1.5 41.0 9.3(55)
Well 0.7 3.6 1.2 2.7 1.4 2.1 0.9 1.8(11)
River/Lake 3.6 8.5 14.9 3.6 9.2 0.0 35.9 7.1(42)
Total 281 223 87 220 371 474 117 591
The data shows that about eight out of ten (81.7 percent) respondents said
piped water was their main source of drinking water. Borehole, rivers and
lakes were also some of the sources of drinking water (9.3 and 7.1 per cent
respectively) mentioned. There were differences on the sources of drinking
water between urban and rural respondents. More than nine out of ten (96.4
per cent) of respondents in urban areas indicated that piped water was their
main source of drinking water compared to about one out of five (22 per cent)
among respondents in rural areas. While it is clear that majority of older people
have access to piped water, it should be mentioned that this is mainly due to a
large urban sample compared to the rural sample; this, therefore, may not be
reflective of the general situation especially in rural areas. However, it is still
evident that some respondents draw their drinking water from unsafe sources
and as such could still be exposed to health challenges.
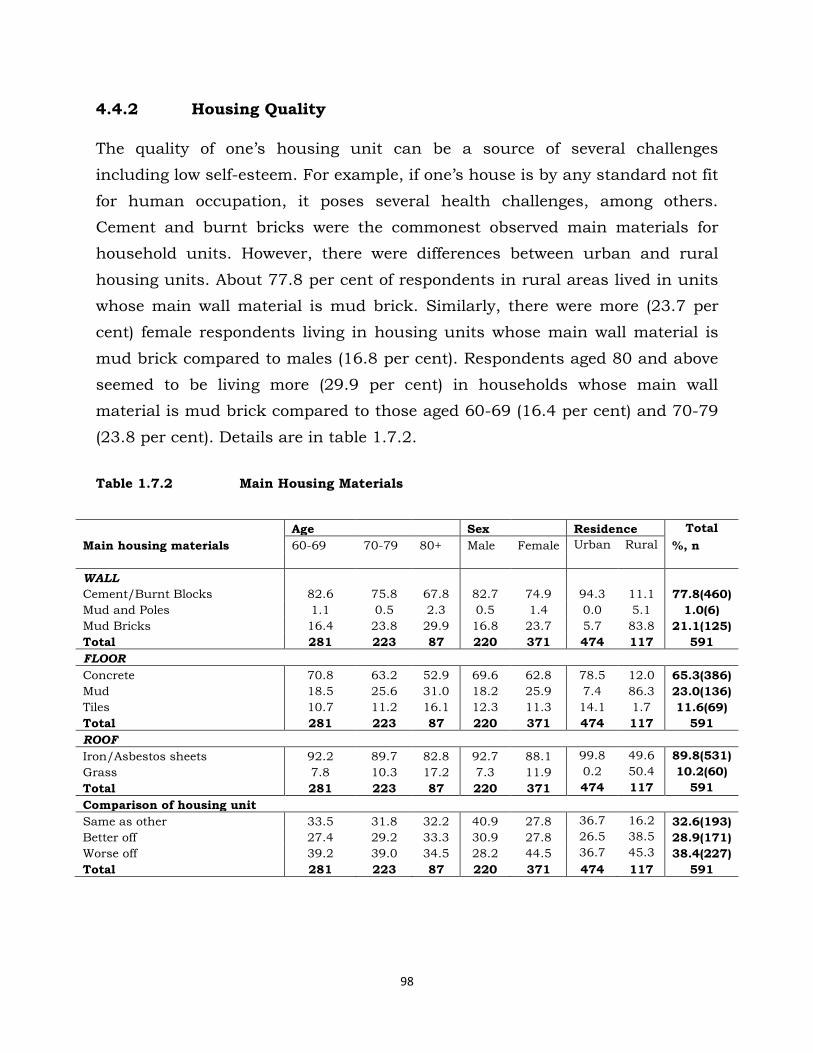
98
4.4.2 Housing Quality
The quality of one‘s housing unit can be a source of several challenges
including low self-esteem. For example, if one‘s house is by any standard not fit
for human occupation, it poses several health challenges, among others.
Cement and burnt bricks were the commonest observed main materials for
household units. However, there were differences between urban and rural
housing units. About 77.8 per cent of respondents in rural areas lived in units
whose main wall material is mud brick. Similarly, there were more (23.7 per
cent) female respondents living in housing units whose main wall material is
mud brick compared to males (16.8 per cent). Respondents aged 80 and above
seemed to be living more (29.9 per cent) in households whose main wall
material is mud brick compared to those aged 60-69 (16.4 per cent) and 70-79
(23.8 per cent). Details are in table 1.7.2.
Table 1.7.2 Main Housing Materials
Age Sex Residence Total
Main housing materials 60-69 70-79 80+ Male Female Urban Rural %, n
WALL
Cement/Burnt Blocks 82.6 75.8 67.8 82.7 74.9 94.3 11.1 77.8(460)
Mud and Poles 1.1 0.5 2.3 0.5 1.4 0.0 5.1 1.0(6)
Mud Bricks 16.4 23.8 29.9 16.8 23.7 5.7 83.8 21.1(125)
Total 281 223 87 220 371 474 117 591
FLOOR
Concrete 70.8 63.2 52.9 69.6 62.8 78.5 12.0 65.3(386)
Mud 18.5 25.6 31.0 18.2 25.9 7.4 86.3 23.0(136)
Tiles 10.7 11.2 16.1 12.3 11.3 14.1 1.7 11.6(69)
Total 281 223 87 220 371 474 117 591
ROOF
Iron/Asbestos sheets 92.2 89.7 82.8 92.7 88.1 99.8 49.6 89.8(531)
Grass 7.8 10.3 17.2 7.3 11.9 0.2 50.4 10.2(60)
Total 281 223 87 220 371 474 117 591
Comparison of housing unit
Same as other 33.5 31.8 32.2 40.9 27.8 36.7 16.2 32.6(193)
Better off 27.4 29.2 33.3 30.9 27.8 26.5 38.5 28.9(171)
Worse off 39.2 39.0 34.5 28.2 44.5 36.7 45.3 38.4(227)
Total 281 223 87 220 371 474 117 591

99
As for the main material for the floor, majority (65.3 per cent) reported
concrete, followed by mud (23 per cent) and the least reported were tiles (11.6
per cent). However, the main flooring material for majority of rural respondents
was mud (86.3 per cent). Similarly, whereas the main material for the roof in
urban areas was either iron or asbestos (99.8 per cent), close to half (50.4 per
cent) of roof material in rural household units was grass. This again shows
differences in terms of development between urban and rural Zambia as well as
different challenges faced by older people from rural compared to urban areas.
In the same way, respondents were asked to state how they perceived their
housing unit in relation to others within the community. In fact, the question
was phrased in this manner: Do you think your housing unit is: Better off,
Worse off or Same as other in this community? Results suggest that
respondents in rural areas were of the view that their housing unit was better
off (38.5 per cent) compared to their urban counterparts (26.5 per cent).
Overall, more respondents (38.4 per cent) reported that their housing units
were worse off compared to those who reported that they were either better off
(28.9 per cent) or same as others (32.6 per cent) respectively.
4.4.3 Work and Sources of Income
The terms ―work‖ and ―employment‖ were used interchangeably and the work
solicited for here was both formal and informal. Respondents were asked
whether they worked at the time of the study and if not, whether they had been
employed in the 12 months preceding the study. Accurate assessment of
employment status can be difficult because some work, especially on family
farms, family businesses, or in the informal sector, is often not perceived as
employment and hence not reported as such (ZDHS, 2007). To avoid
underestimating a respondent‘s employment status, the study asked
respondents questions to probe for their employment status and to ensure
complete coverage of employment in both the formal or informal sectors.
Employed individuals are those who reported that they were currently working
(i.e., had worked in the past 7 days) and those who had worked at any time
during the 12 months preceding the survey. In terms of work and sources of

100
income, results in Table 1.8 indicate that about 12.5 per cent of respondents
worked twelve months prior to the study and only about 6.2 per cent reported
that they were working at the time of the survey (past 7 days). Two patterns
were also evident. Firstly, proportion of respondents who worked in the last
twelve months prior to the study declined as age increased. Overall, close to
one in five (15.7 per cent) of those aged 60-69 worked in the twelve months
prior to the study compared to about 12.2 per cent of those aged 70-79, and
about 5.8 per cent of those aged 80+ respectively. It should be mentioned,
however, that due to the mandatory statutory requirement where people are
expected to retire from formal employment, it is not surprising that majority of
respondents in our study were actually not working.
Males were more likely to report having worked twelve months prior to the
study compared to females (16.9 and 9.4 per cent respectively). Similarly, there
were differences between rural and urban areas in this respect. Among urban
respondents, about 13.5 per cent compared to 7.9 per cent in rural areas
worked in the twelve months prior to the study. Respondents aged between 60
and 69, mostly male and those residing in urban areas, were more likely to
report that they were working compared to females and those in rural areas.

101
Table 1.8: Work Related Activities and Sources of Income by Age, Gender and
Residence
Age Sex Residence Total
60-69 70-79 80+ Males Females Urban Rural %, n
Worked during past 12 months 15.7 12.2 5.8 16.9 9.4 13.5 7.9 12.5(86)
Currently working 8.4 4.4 5.1 8.4 4.7 6.5 4.7 6.2(43)
Reasons for not working
Health problems 8.8 17.4 13.0 13.5 12.4 12.5 14.2 12.8(83)
Old age 66.8 74.8 83.2 75.8 71.3 74.6 66.7 73.1(473)
Can‘t find a job 24.5 7.9 3.8 10.8 16.3 12.9 19.2 14.1(91)
Total 274 242 131 260 387 527 120 647
Opportunities for work 37.5 17.8 12.3 25.3 25.1 26.8 18.2 25.2(174)
Access to income 29.8 21.7 9.4 29.9 17.7 25.2 11.9 22.7(157)
Sources of income
Selling 41.6 38.2 30.8 32.9 47.2 36.6 66.7 39.4(62)
Relatives/Children 4.5 12.7 7.7 8.2 6.9 8.5 0.0 7.6(12)
Rentals 33.7 36.4 23.1 29.4 38.9 37.3 0.0 33.7(53)
Pension 6.7 5.5 15.4 10.6 2.8 7.0 6.7 7.0(11)
Work 13.5 7.3 23.1 18.8 4.2 10.6 26.7 12.1(19)
Total 89 55 13 85 72 142 15 157
Brewing ‗kachasu‘ (illicit beer)
Begging/well wishers
18.2
47.9
23.8
52.5
17.6
50.0
19.0
53.7
21.0
47.9
20.7
52.0
18.5 20.2(105)
42.6 50.0(254)
Farming
Total
33.9
242
23.8
202
32.4
74
27.4
190
31.1
328
27.3
410
38.9
108 29.7(154)
518
Adequacy of income 35.2 40.0 38.5 34.1 40.9 39.0 20.0 37.2(58)
Total 88 55 13 85 71 141 15 156
Respondents who were not working at the time of the study were asked to state
why they were not working. Majority (73.1 per cent) stated that ‗old age‘ was
the main reason they could not work. This is also true by gender and
residence. In the same way, respondents were asked to state opportunities they
thought they had to get a job or work, or simply, what chances they stood to
find work. Only a quarter (25.2 per cent) indicated that they had opportunities
to work in their communities. Respondents aged 60-69 had more or better
opportunities to work compared to other age groups. Participants in the FGDs
also confirmed that older people have no opportunities for employment and
they generally do not work. To some extent, this situation also explains why
they have quite low self esteem and are generally lonely:
„They do not get any employment opportunities. This has resulted in many of their
children turning to the streets to look for food‟ (FGD, Masala - Ndola)
102
In terms of income accessibility, respondents were again asked to state
whether they had or could at least access income irrespective of the source.
About one in five (22.7 per cent) stated that they could at least access income.
It is also evident from the data that income accessibility diminishes with
increasing age in such a way that those aged between 60-69 were more likely to
report access to income than other age groups (Table 1.8).
Sources of income were also varied. Majority of respondents reported ‗begging‘
(50 percent), ‗selling‘ (39 percent), ‗rentals‘ (33 percent) and ‗farming‘ (29.7
percent) as their main sources of income. Other sources were ‗kachasu‟ 3
brewing‘ (20.2 percent), ‗work‘ (12.1 percent), ‗pension‘ (7 percent) and ‗relatives
or children‘ (7.6 percent).
In terms of selling, persons aged 70 and above were less likely to report selling
as a source of income compared to those aged 60 to 69. In addition, small
differences exist between male and female respondents in relation to income
sources. For example, there were more men (18.8 per cent) compared to
women (4.2 per cent) citing work as a source of income. In the same way, more
male respondents (10.6 per cent) indicated pension as their source of income
compared to females (2.8 per cent). However, more female respondents (38.9
per cent) reported rentals as sources of income compared to males (29.4 per
cent). This is an interesting result but suffice to say that it may relate to the
fact that since more females reported to be widowed, it is therefore possible
that they assume responsibility of their late husbands‘ properties. However,
this may require more interrogation and further research.
As indicated above, about half of respondents reported begging and receiving
donations from well-wishers as one of their main sources of income. While it is
expected for people especially in rural areas to engage in farming for their
livelihoods, it is however out of the ordinary for older people to rely on begging
and ‗kachsu‘ brewing as sources of income. This is so because ‗begging‘ and
3 ‗Kachasu‘ is a locally brewed illicit alcohol brand common in high density areas or shanty
compounds. It is brewed from maize and has high ethanol content.
103
‗kachasu brewing‘ are unconventional methods of income generation; further,
not only are these means unconventional but illegal, painstaking and
embarrassing as well. Inadvertently, this also explains why older people have
quite low self esteem. However, it should be noted that due to lack of data to
make comparisons in terms of what maybe obtaining in the general population,
this result maybe synonymous with old age and ageing in general. ‗Farming,
‗begging‘ and ‗brewing kachasu‘ were also reported to be some of the main
sources of income for older people by participants in the focus group
discussions. The following excerpts illustrate these sentiments:
„There are those who do piece works; and also through farming for those old
people who still have the strength to farm‟ (FGD, Mwandi – Sesheke)
„But there are also some who just involve themselves in kachasu brewing and
begging, and that is how they make their money‟ (FGD, Matero – Lusaka)
Other details, reflecting differential in terms of age, sex and residence in
relation to the sources of income were also observed. Giving „kachasu‟ brewing
as an example, it is evident from the data that those aged 70-79 were more
likely (23.8 per cent) to report brewing „kachasu‟ as a source of income
compared to those who were 60-69 (18.2 per cent) and the 80+ (17.6 per cent).
As for begging or receiving donations from well-wishers, there were extremely
minimal differences especially by age. For example, about 50 per cent of those
aged 80+ reported that their income depended on begging while about 47.9 per
cent of those aged 60-69 and 50.5 per cent of those aged 70-79 also reported
begging as a source of income. In the same way, the age group 70-79 was less
likely (23.8 per cent) to report farming as a source of income compared to those
aged 60-69 (33.9 per cent) and those aged 80+ (32.4 per cent).
In terms of sex differentials, female respondents were more likely to report
illicit beer brewing (21 per cent) and farming (31.1 per cent) as income sources
compared to their male counterparts (19 and 27.4 per cent respectively).
104
However, male respondents were more likely (53.7 per cent) to engage in
begging or getting handouts from well-wishers compared to their female
counterparts (47.9 per cent). In the same way, except for farming where more
rural respondents seem to engage in (38.9 per cent vs 27.3 per cent), urban
respondents were more likely to report illicit beer brewing (20.7 per cent) and
begging/donations from well-wishers (52 per cent) compared to their rural
counterparts.
For almost all sources of income, it is clear that respondents in rural areas
were less likely or not at all able to report any income source compared to their
urban counterparts. For example, no rural respondent indicated rentals,
children or relatives as sources of income. Nonetheless, and interestingly so,
rural respondents were considerably more likely (26.7 per cent) to report work
as their source of income. However, the context of this work should be
understood to mean engagement in agricultural activities which inevitably
helps to secure some income for rural communities. This also reflects the
tendency for rural people to remain economically active longer in life especially
in agriculture where retirement is more likely to be a gradual process and not
subject to a prescribed retirement age (Knodel et. al., 2008).
It should be stressed that begging is quite high amongst older people and
therefore a cause for concern. In particular, there is no normalcy and dignity
for senior citizens to survive through begging. This finding shows also that not
only are societies failing to help and look after older people but also the
dysfunction of some or most of the policies aimed at addressing older people. In
fact, this finding could only be compared to challenges that confront people
with disability. For example, it is not uncommon for people who are blind, lame
etc to be begging on the street; however, old age is not ―disability‖ and under
normal active ageing, older people should be able to fend for themselves (WHO,
2002).

105
4.4.4 Care, Living Arrangements, Social Contacts and Coping
Strategies
This section presents information based on the examination of care for the
elderly, their living arrangements and social contacts with family, relatives and
society at large. It also details challenges experienced by elderly persons living
with orphans.
Care and living arrangements are also important aspects contributing to the
challenges of people who are ageing. For example, it is said that if and when
older people feel not cared for, this is a source of concern and weighs negatively
on their self-esteem.
Traditionally, in Africa, the aged were cared for by both close relatives and the
community. They drew both material and social support from social networks
within community structures (Namakando 2004). They lived with and were
cared for by families and always occupied a defined high status in society. In
fact, in Zambia as well as Africa and the developing world in general, informal
systems of social and economic exchanges play a crucial role in determining
the well-being of older people (World Bank, 1994). Of particular importance are
the intergenerational exchanges of services and material and social support
between elderly parents and their adult children, as well as the living
arrangements with which they are inextricably entwined (UNFPA, 2007).
4.4.5 Care for the Aged
Table 1.9 is a summary of the care elderly people receive from various sources,
including family, homes for the aged, distant relatives, and in some cases,
spouses. Information in the table further highlights the type of care received
and the actual relationship existing between the caregiver and the receiver.

106
Table 1.9: Care-giving by Age, Gender and Residence
Age Sex Place of stay Residence Total
60-69
70-79 80+ Males Females OPH* Comm* Urban Rural %,n
Caregiver availability, type of caregiver and relationship to care caregiver
Caregiver available 48.4 64.4 78.2 59.5 60.8 81.8 56.7 58.5 68.2 60.2(416)
who is care giving
Family member 88.2 81.0 56.3 64.3 85.6 0.0 99.1 73.5 89.8 76.7(337)
other (no relation) 0.0 1.2 0.8 0.6 0.8 0.0 0.8 0.9 0.0 0.6(3)
Total 152 168 119 182 257 99 340 351 88 439
relationship with caregiver
Spouse 34.3 19.9 9.7 42.7 13.0 6.7 24.1 26.3 13.6 23.3(83)
Son 12.4 14.4 8.3 15.3 10.8 0.0 12.9 13.1 9.9 12.3(44)
Daughter 25.6 37.0 50.0 21.0 42.9 13.3 36.2 34.7 37.0 35.2(125)
Child-in-law 0.7 0.0 0.0 0.8 0.0 0.0 0.3 0.4 0.0 0.2(1)
Other relative 27.0 28.8 31.9 20.2 33.3 80.0 26.5 25.6 39.5 28.7(102)
Total 137 146 72 124 231 15 340 274 81 355
Type of care or assistance rendered
Cooking 75.4 81.2 89.7 89.0 76.1 0.0 80.5 78.9 86.1 80.5(274)
Washing 72.4 79.0 88.2 36.3 40.2 0.0 78.2 77.0 82.3 78.2(266)
Drawing water 72.4 78.3 83.8 89.0 70.7 0.0 77.1 74.7 84.8 77.0(262)
Cleaning house/room 73.9 76.8 83.8 88.1 71.2 0.0 77.1 75.5 82.3 77.0(262)
Total 134 138 68 118 222 0 340 261 79 340**
**Note: multiple response question where only ‘yes’ answers were
considered, rows and columns may not add up to n and 100 per cent respectively
Three in five (60.2 per cent) respondents stated that they had a caregiver.
Those aged 80+ were more likely to report being cared for (78.2 per cent)
compared to the other age categories. There were no major differences by sex of
respondent in terms of care. People in rural areas reported having more
caregivers (68.2 per cent) compared to urban areas (58.5 per cent).
Family members were the largest providers of care (76.7 per cent). From this
proportion, it is clear that the family is still an important source of care-giving
in Zambia. People in communities sometimes assume this role as well.
Nonetheless, very few people would take care of older people they are not
related to. In fact, participants in the FGDs indicated that while they could
keep an old person, it was not possible given the socio-economic situation in
Zambia. Some of them had this to say:
107
„To tell you the truth, the cost of living has become very expensive. A long time
ago, life was affordable, but not now. Very few of us can stay with old people who
are not our relatives‟ (FGD, Mwandi – Sesheke)
„Life now is very expensive, who can manage to keep someone who is not even
their relative? For me, I can only stay with my relative‟ (FGD, Matero – Lusaka)
For those respondents who reported that their caregiver was a family member,
a follow up question was asked to establish the actual relationship.
Daughters were the most (35.2 per cent) frequently mentioned caregivers,
followed by ‗other relatives‘ (28.7 per cent) and spouses (23.3 per cent)
respectively. Data in Table 1.9 also show that sons (12.3 per cent) and
children in-law (0.2 per cent) also provide care, but this is quite minimal
comparatively.
In terms of age groups, those aged 60-69 were more likely to report spouses
(34.3 per cent) as caregivers compared to those aged 70-79 (19.9 per cent) and
80+ (9.7 per cent) respectively. Male respondents reported being cared for more
by their spouses (42.7 per cent) compared to female respondents (13 per cent).
Low spousal care reported by female respondents could be due to many
reasons, but some studies have shown that females bear the brunt of care-
giving compared to males. For example, a study on elderly care in Nigeria
established that majority caregivers were women (Abidemi, 2005). Care-giving
is also looked at as ‗a traditional role‘ for women (Namakando, 2004). It is also
assumed that women remain unmarried in their old age and are, therefore,
unlikely to have spouses to take care of them. In the section on socio-
demographic characteristics of respondents, it is discussed that there were
more female respondents who reported being widowed compared to males.
Respondents were also asked to state the type of care they were mainly given.
Much of the care or assistance reported was in kind and included such
activities as helping with cooking (80 per cent), washing (78.2 per cent),
drawing water and house or room cleaning (77 per cent).
108
In terms of age, the data show that the help given or care rendered increases
with age, with those aged 80+ generally indicating that they were receiving
more help in the aforementioned activities (cooking, washing, drawing of water
and house/room cleaning) compared to those aged 60-69 and 70-79
respectively. The differences, especially between the 70-79 and the 80+ groups,
were minimal.
Except for washing, males were generally more likely to report receiving help in
terms of cooking, drawing of water and house/room cleaning compared to
females. Further, respondents in rural areas were also more likely (86.1 per
cent) to receive help in these areas compared to respondents in urban areas
(78.9 per cent). This disparity could be due to the perceived strong ties and
bonds between residents in rural areas compared to urban areas. It is argued
that urban areas have become polarized with such influences as secularlisation
and nuclear family bonds, a situation not so prevalent in rural areas (Havens,
1989).
The proportions presented in Table 1.9 may look like ‗good‘ news to people
reading them. For example, when one observes proportions on the type of care
rendered, one may conclude that actually, older people receive meaningful
assistance in as far as their daily chores are concerned. However, these
proportions may show the extent of incapacitation amongst older people in the
study. Basic chores like cooking, washing etc should under normal
circumstances be performed by older people themselves, nonetheless, it is clear
that this is not so in our study. In fact, inability to perform these basic
functions could also result in low self-esteem amongst the elderly
4.4.6 Living Arrangements
Recently, living alone has become synonymous with ageing (Knodel, 2008).
Many reasons are given for this situation. Participants in the focus group
discussions said people are afraid to keep older people because older people are
generally not respected and people think that they tend to practice witchcraft.
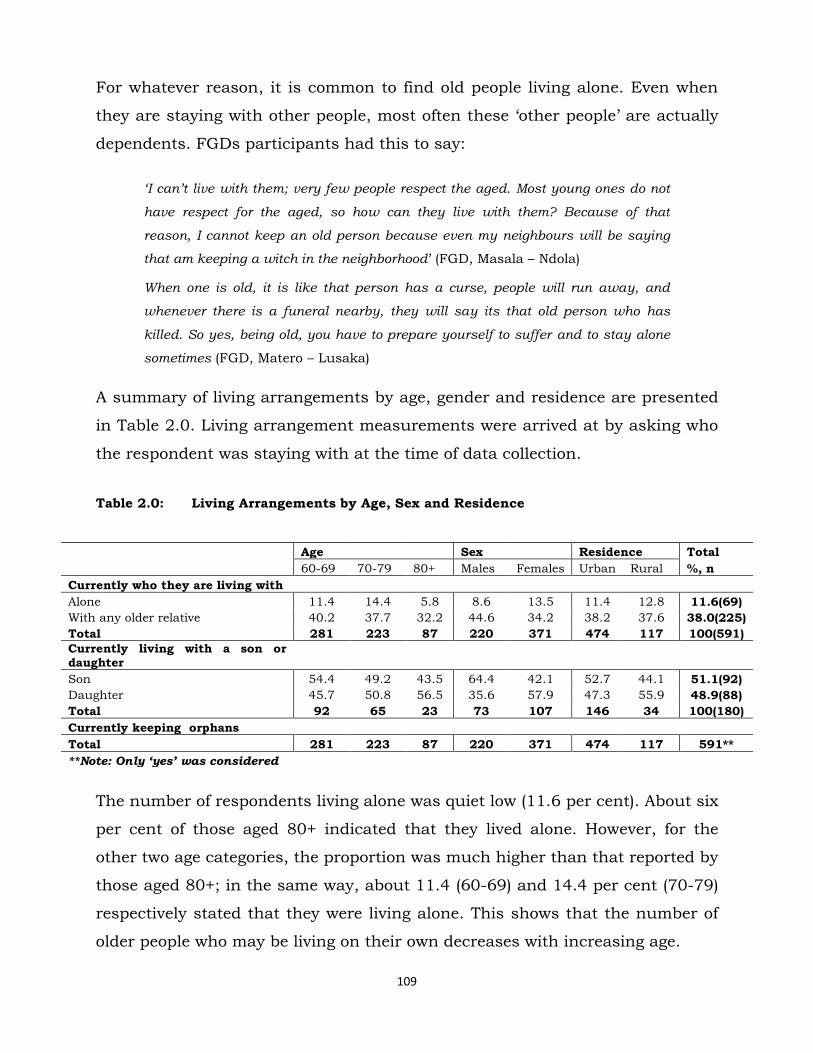
109
For whatever reason, it is common to find old people living alone. Even when
they are staying with other people, most often these ‗other people‘ are actually
dependents. FGDs participants had this to say:
„I can‟t live with them; very few people respect the aged. Most young ones do not
have respect for the aged, so how can they live with them? Because of that
reason, I cannot keep an old person because even my neighbours will be saying
that am keeping a witch in the neighborhood‘ (FGD, Masala – Ndola)
When one is old, it is like that person has a curse, people will run away, and
whenever there is a funeral nearby, they will say its that old person who has
killed. So yes, being old, you have to prepare yourself to suffer and to stay alone
sometimes (FGD, Matero – Lusaka)
A summary of living arrangements by age, gender and residence are presented
in Table 2.0. Living arrangement measurements were arrived at by asking who
the respondent was staying with at the time of data collection.
Table 2.0: Living Arrangements by Age, Sex and Residence
Age Sex Residence Total
60-69 70-79 80+ Males Females Urban Rural %, n
Currently who they are living with
Alone 11.4 14.4 5.8 8.6 13.5 11.4 12.8 11.6(69)
With any older relative 40.2 37.7 32.2 44.6 34.2 38.2 37.6 38.0(225)
Total 281 223 87 220 371 474 117 100(591)
Currently living with a son or daughter
Son 54.4 49.2 43.5 64.4 42.1 52.7 44.1 51.1(92)
Daughter 45.7 50.8 56.5 35.6 57.9 47.3 55.9 48.9(88)
Total 92 65 23 73 107 146 34 100(180)
Currently keeping orphans
Total 281 223 87 220 371 474 117 591**
**Note: Only ‘yes’ was considered
The number of respondents living alone was quiet low (11.6 per cent). About six
per cent of those aged 80+ indicated that they lived alone. However, for the
other two age categories, the proportion was much higher than that reported by
those aged 80+; in the same way, about 11.4 (60-69) and 14.4 per cent (70-79)
respectively stated that they were living alone. This shows that the number of
older people who may be living on their own decreases with increasing age.

110
Female respondents were more likely (13.5 per cent) to report staying alone
compared to male respondents (8.6 per cent). This could mostly be attributable
to the fact that majority of older women in this study were widowed. In the
same way, while respondents in rural areas were more likely (12.8 per cent) to
report staying alone compared to those in urban areas (11.4 per cent), the
difference was actually minimal.
There were also differences on the response category of staying ‗with any older
relative‘ by age, gender and residence. Those aged 80+ were less likely to report
staying with any older relative (32.2 per cent) compared to those aged 60-69
(40.2 per cent) and those aged 70-79 (37.7 per cent).
Respondents who reported that they had adult children were asked to state
whether they were staying with them at the time of data collection.
Co-residence between sons or daughters in our study was about average.
Overall, about 51.1 and 48.9 per cent of respondents reported that they were
living with a son or a daughter. To some extent, this finding challenges the
common view that co-residence with adult children is most common in least
developed societies (Asis et. al., 1995). In our study, while there is evidence of
co-residence, it is just about average.
In terms of age, the proportion of respondents reporting co-residence with sons
diminishes with increasing age. However, the opposite is true with daughters.
For example, about 54.4 per cent of respondents aged 60 to 69 reported that
they were residing with their sons while about 43.5 per cent of those aged 80+
reported similar living arrangements. On the other hand, about 45.7 per cent of
respondents aged 60-69 reported that they were co-residing with daughters
with those aged 80+ reporting more of this living arrangement (56.5 per cent)
compared to other age categories.
Clearly, care for the aged and co-residence with adult children are determined
to some extent by gender. From these results as well as data from other

111
studies, it could be suggested that not only do women carry most of the
responsibilities to look after children, husbands and other relatives, but they
also seem to have an upper hand in providing care to older people. To support
this line of thought, a study on family care-giving of the elderly in Botswana by
Shaibu, et. al. (2002) concluded that care-giving was mostly a woman
phenomenon; men are just dragged in the process because of the
circumstances. One man stated as follows:
„The only thing is that I am a man; if I were a woman, there would not be much of
a problem. You see, a man cannot take care like a woman. You see, we usually
leave care giving to women, but seeing we are doing this together, we do it the
female way‟ (Shaibu et. al., 2002).
While it may be recommendable that majority of older people in our study seem
to be staying with their sons or daughters, it should be borne in mind that this
situation may not encourage independence and self-reliance amongst the
elderly. In this example, it may not be quite expected for older people in their
sixties to be staying with their children unless under special circumstances for
example where the older person is sick, lame or incapacitated in a way or
another and requires some special care. Our study shows that currently
however, this is not the case and one can only speculate the physical and
psychological impact that this situation may have on older people themselves –
explaining further why most of them seem to have quite low self-esteem.
4.4.7 Social Interactions
Some of the challenges identified with old age are due to limitations in social
interactions and networks; older people are either affected positively or
negatively depending on their social contacts, especially with relatives and/or
the community at large. Several theoretical explanations also try to address the
influence of social networks on the well-being of the aged. In any case, social
contacts are also highly determined by the socio-economic environment.

112
In relation to the social network analysis framework research (Mitchell 1969,
Wellman et al 1988), this study focused on the functionality of social networks
where social contacts were examined in terms of frequency of physical contacts
or visits to the respondent by their adult child who was not living with them at
the time of the survey as well as interactions between and among the elderly
themselves. Proximate measures translated into daily, weekly, monthly or
yearly contacts with children and also frequency of interactions with peers.
Daily or almost daily interactions may signify high social contact with family
members or children; a ‗once a year contact‘ or ‗never‘ response may also show
little or no social interactions. However, this may not be as straightforward as
put here. This is because social contacts and interactions depend on the
relationships between the relatives and the older persons. It should be noted
further that the question on interactions was restricted to those respondents
who reported that they were not residing together with either their relatives or
their children; in the same way, those who reported that they were living with
their relatives, the same question was asked on social contacts with their
friends or peers. The results are presented in Table 2.1.
Table 2.1: Social Interactions with Relatives and Peers
Age Sex Residence Total
60-69 70-79 80+ Males Females Urban Rural %, n
Interactions with relatives
Daily or almost daily 11.2 9.3 3.7 11.0 8.5 8.4 14.3 9.4(39)
Weekly 7.3 5.3 3.7 4.3 7.3 7.2 1.3 6.0(25)
Monthly 42.2 37.8 27.8 41.1 37.1 42.2 23.4 38.6(159)
Once a year 24.3 34.4 46.3 32.5 29.8 28.4 41.6 30.9(127)
Never 15.1 13.3 18.5 11.0 17.3 13.8 19.5 14.8(61)
Total 206 151 54 163 248 334 77 411
Interactions with peers
Daily 39.8 35.9 24.1 36.7 35.6 35.5 37.9 35.9(212)
Weekly 43.4 42.6 40.2 45.9 40.7 44.4 35.3 42.6(251)
Monthly 2.2 3.1 3.5 2.3 3.0 3.0 1.7 2.7(16)
Never 14.7 18.4 32.2 15.1 20.8 17.1 25.0 18.7(110)
Total 279 223 87 218 371 473 116 589
The most reported interactions to respondents occur monthly (38.6 per cent);
yearly interactions were reported by about 30.9 per cent of respondents
113
signifying the next most frequent contact period or time. About 14.8 per cent of
respondents who had adult children or relatives living elsewhere reported that
their children never visited them at all. This view was also expressed by
participants in the FGDs; some mentioned that there were cases of neglect of
older people not only by their own relatives, but also society as whole, saying:
They have families quite alright, but at some point, children neglect their parents,
especially if they get married to a wrong person (FGD, Masala – Ndola)
Old people are also abandoned by society; they are not valued. (FGD, Mwandi –
Sesheke)
Table 2.1 further shows that about 9.4 and 6 per cent of respondents reported
that they were visited by their children/relatives on a weekly and daily or
almost daily basis respectively. Again, this may indicate the fact that while
children may have moved physically out of their parents‘ homes, they could
still be in the same neighbourhoods or somewhere near.
In terms of age, except for those respondents who reported that they were
visited once a year or ‗never at all‘, the frequency of visits reported reduces with
increasing age. Of those respondents who reported that they were visited on a
daily basis, those aged 60-69 were visited more (11.2 per cent) compared to
those aged 70-79 (9.3 per cent) and those aged 80+ (3.7 per cent). This pattern
is also similar to respondents who indicated that they were visited weekly with
the age group 80+ reporting the least of such visits (3.7 per cent). Respondents
aged 60-69 were more likely (42.2 per cent) to report being visited by
children/relatives compared to those aged 70-79 (37.8 per cent) and 80+ (27.8
per cent) respectively. On the other hand, respondents aged 80+ reported being
visited more (46.3 per cent) on a yearly basis compared to those aged 60-69
(24.3 per cent) and those aged 70-79 (34.4 per cent). Amongst those who
reported that they were never visited, majority were the 80+ (18.5 per cent).
Social contacts by sex and residence seemed to have no consistent pattern
either. For example, male respondents were more likely (11 per cent) to report
114
that they were visited more by children/relatives on a daily basis compared to
females. They were also likely to report being visited more on a monthly (41.1
per cent) and yearly basis (32.5 per cent) by their children or relatives
compared to females (37.1 and 29.8 per cent respectively). However, female
respondents were more likely to report receiving weekly (7.3 per cent) visits
compared to males (4.3 per cent). Similarly, more female (17.3 per cent)
respondents reported that they were never visited by their children or relatives
compared to males (11 per cent).
Besides social contacts within families the study also examined the existence
and frequency of contacts among peers and friends. This was also guided by
assertions in literature of the importance of social contacts amongst the elderly
persons themselves. The other argument is that friend or peer interactions
have other value additions not feasible in other social interactions, especially
those of a family nature. It is argued that friendships foster feelings of
attachment that are based on equalitarianism, consensus and sharing of good
times (Crohan et. al., 1989).
In general, Table 2.1 shows that majority (42.6 per cent) of respondents
interacted weekly with peers or friends. About 35.9 per cent reported that they
interacted daily while close to one in five (18.7 per cent) reported that they
never interact. Amongst those reporting that they never interact with peers or
friends, majority (32.2 per cent) are those aged 80+. In addition, females (20.8
per cent) and respondents from rural areas (25 per cent) had a higher
proportion of respondents who never interact with peers or friends. It is clear
that interactions or social contacts with peers or friends especially for
respondents aged 80+, females and those in rural areas are quite minimal and
may be a source of unhappiness and low self-esteem among senior citizens
generally.

115
4.4.8 Material and Other Forms of Support
Children and relatives can be important sources of economic support to elderly
parents through providing money, food and goods (Knodel et. al., 2007).
However, support to older people, including those with children is one of the
most challenging experiences of old age because lack of food especially and
other life supporting amenities seem to be more pronounced in old age than
other age groups. Participants in the FGDs highlighted at least two major
challenges old people face: lack of food and generally lack of support. These
aspects contribute greatly to the sum of issues that may lead to low self-esteem
amongst the elderly. Some of the discussants had this to say:
They cannot even afford mealie-meal; it is very expensive for most of them; they
lack basics, like food; this is the biggest problem they have (FGD, Masala – Ndola)
„They cannot support themselves adequately; they also do not have support from
other people; that‟s one other problem they face‟. (FGD, Masala - Ndola)
In this study, support was operationlised using a set of questions asking
respondents to state whether or not they were receiving any ―materials‖
including food, clothes, blankets and/or money. Any ―Yes‖ response meant that
they were in general receiving some form of support of one kind or another; a
―no‖ meant the opposite. Similarly, other forms of support were classified to be
―Spiritual‖ – any form of encouragement from religious groupings; ―Social‖ –
any help they received in the form being helped to clean the house, washing
clothes etc., and ―Emotional‖ – any psycho-social support to help with their
emotional state. This information is presented in Table 2.2.

116
Table 2.2: Material, Monetary and Other Forms of Support
Age Sex Residence Total
60-69 70-79 80+ Male Female Urban Rural %, n
Support from sons/daughter and other relatives
Sons/Daughters (own children) 68.8 75.0 0.0 73.7 64.0 64.8 73.3 66.6(46)
other relatives 24.7 32.7 39.1 29.8 29.9 28.8 34.5 29.8(176)**
government and institutional
Government 3.3 5.5 15.2 9.9 4.2 6.4 7.1 6.5(45)
Non-governmental organization 2.7 7.5 13.8 9.9 4.4 7.3 4.0 6.6(46)
Church 12.4 19.4 38.4 25.7 16.3 21.5 14.3 20.1(139)
MCDSS 2.3 3.2 20.3 11.6 2.5 6.7 4.0 6.2(43)
Community Group 6.0 8.7 22.5 14.1 7.6 11.0 7.1 10.2(71)
Total 299 253 138 284 406 564 126 690***
social, emotional and spiritual support
Social 29.0 32.9 38.2 43.1 26.1 24.3 60.0 32.4(57)
Emotional 27.5 34.3 44.1 38.5 30.6 27.2 55.0 33.5(59)
Spiritual 79.7 64.4 58.8 76.9 64.9 71.3 62.5 69.3(122)
Total 69 73 34 65 111 136 40 176***
**Note: the two variables were independent questions and hence have no common total ***Note: multiple response questions independent of each other's totals; and only ‘yes’ was considered
About 66.6 per cent (n=46) of respondents reported that they received support
from their children and also from relatives (29.8 per cent). Support rendered
increases marginally with age except for those aged 80+ who reported ‗no
support‘ from own children. Male respondents and those in rural areas were
more likely (73.7 and 73.3 per cent) to be supported by their children compared
to females (64 per cent) and those in urban areas (64.8 per cent) respectively.
Those aged 80+ were more likely (39.1 per cent) to receive support from
relatives than those aged 60-69 (24.7 per cent) and 70-79 (32.1 per cent). In
addition, there seems to be little or no difference between male and female
respondents reporting being supported or getting support from relatives.
Nonetheless, it is clear that respondents from rural areas were also more likely
(34.5 per cent) to report getting support from relatives compared to those in
urban areas (28.8 per cent). Generally, while 66 percent may seem high, one
needs to pay attention to the sample or the absolute number of those
represented by these proportions. It is clear that monetary and material

117
support to older people from either children or relatives is quite low and a
source of concern.
In terms of institutional support, data in Table 2.2 shows that the church (20.1
per cent) and community groups (10.2 per cent) provide more support
compared to other institutions. Government in general and the Ministry of
Community Development and Social Services (MCDSS, now MCDMC) provide
just about 6.5 and 6.2 per cent support to older people respectively. Focus
group discussants also confirmed that the church was a little more active in
supporting old people in communities compared to other institutions:
„But the church here (UCZ) helps them a lot with things like shelter and
food‟ (FGD, Mwandi – Sesheke)
Overall, institutional support is minimal and is mainly concentrated on those
aged 80 years and above, mostly males and respondents from urban areas. In
fact, FGDs participants even alleged that institutions that provided support to
older people were very selective. This may explain why few older people seem to
be receiving support from institutions. One FGD participant had this to say:
„The organisations that help are very selective and some older people remain
complaining every day. Maybe this is due to the fact that support systems are not
many, if at all any‟ (FGD, Mwandi – Sesheke)
4.4.9 Social, Emotional and Spiritual Support
Social, emotional and spiritual support were other forms of support
investigated in this study. Majority (69.3 per cent) of respondents were
receiving spiritual support. In terms of age, those aged 60-69 were more likely
(79.7 per cent) to report being supported spiritually compared to other age
groups. Also, about 33.5 and 32.4 per cent of respondents reported that they
were being supported emotionally and socially respectively. Both social and
emotional support seems to increase with age and was reported more by males
and respondents in rural areas. For example, those aged 80+ were more likely

118
to report that they were supported socially (38.2 per cent) and emotionally
(44.1 per cent) compared to those aged 60-69 (29 and 27.5 per cent
respectively) and those aged 70-79 (32.9 and 34.3 per cent respectively).
Similarly, male respondents were more likely (43.1 per cent) to report being
supported socially compared to female respondents (26.1 per cent).
This section has demonstrated that whatever form of support – be it from
children, relatives, institutional, social, emotional and spiritual – rendered to
the elderly is quite insignificant to say the least and probably a source of low
self-esteem and unhappiness.
4.4.9a Orphan and Dependent Child Care
Older people have a huge challenge of taking care of orphans. This is one of the
most difficult challenges faced by older people in the 21st century especially in
Africa and quite frankly a source of low self-esteem and unhappiness. Looking
at orphans for example, there are strong indications that they have come about
mainly due to effects or deaths by parents attributed to HIV/AIDS. While it is
argued that the phenomenon of orphanhood has been in existence for a long
time, it is also true that the advent of the HIV/AIDS pandemic has exacerbated
the problem and old people have been caught up at the receiving end. A study
in Iringa, Tanzania, conducted by HelpAge international (2004), found that
older people‘s role in caring for these groups (orphans and sick adult children)
has a variety of economic costs and effects on their livelihoods. In the first
instance, the old are forced to redirect their resources from their own needs to
those of people under their care, especially to pay for health care and food.
This development was taking place under the backdrop of already challenged
people in caring and providing for themselves. In the same way, not only has
HIV/AIDS brought about challenges of orphan care, but also predisposing
older people to infections as well. In the hope of seeking resources to support

119
vulnerable children, some older people have also been infected by the HIV
virus4. One discussant in the FGD had this to say:
„Sometimes, because of having many problems like looking after orphans, some
old people sleep around for money so that they can buy food, soap and so on and
hence contract the virus and eventually get sick‟ (FGD – Mwandi, Sesheke)
Participants in the FGD also stated that due to HIV/AIDS, some roles for older
people have changed; they were now seriously and actively involved in
providing for orphaned children as well as themselves. This is due to the fact
that most of their breadwinners (their children) have died. Some participants
had this to say:
„I do believe that AIDS has changed the roles of the aged in societies. Previously,
they just used to sit at home waiting for their children to provide for them; but
now, their children are dead because of AIDS; so if they just sit at home they will
die from hunger; they are now actively looking for food‟ (FGD – Masala , Ndola).
„To some extent, they have been kept busy in that they have to look for food in
order to feed the orphans they look after‟ (FGD – Masala, Ndola)
Table 2.3 presents data on respondents who said they were keeping orphans; it
shows also whether these children were going to school and if not, why they
were not in school.
4 This is a controversial statement especially considering the age of respondents; however, in January 2012 MUVI TV carried a story of an older lady (64 years) caught having ―sex‖ with a 25 year old man.
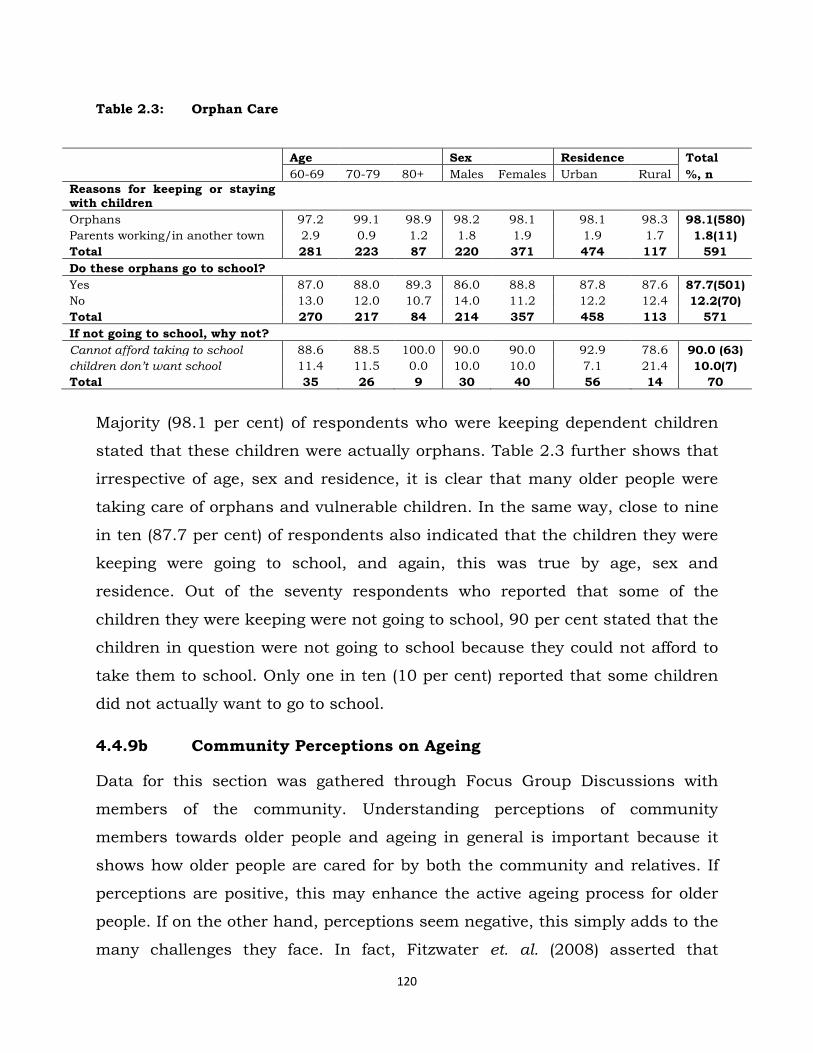
120
Table 2.3: Orphan Care
Age Sex Residence Total
60-69 70-79 80+ Males Females Urban Rural %, n
Reasons for keeping or staying with children
Orphans 97.2 99.1 98.9 98.2 98.1 98.1 98.3 98.1(580)
Parents working/in another town 2.9 0.9 1.2 1.8 1.9 1.9 1.7 1.8(11)
Total 281 223 87 220 371 474 117 591
Do these orphans go to school?
Yes 87.0 88.0 89.3 86.0 88.8 87.8 87.6 87.7(501)
No 13.0 12.0 10.7 14.0 11.2 12.2 12.4 12.2(70)
Total 270 217 84 214 357 458 113 571
If not going to school, why not?
Cannot afford taking to school 88.6 88.5 100.0 90.0 90.0 92.9 78.6 90.0 (63)
children don‟t want school 11.4 11.5 0.0 10.0 10.0 7.1 21.4 10.0(7)
Total 35 26 9 30 40 56 14 70
Majority (98.1 per cent) of respondents who were keeping dependent children
stated that these children were actually orphans. Table 2.3 further shows that
irrespective of age, sex and residence, it is clear that many older people were
taking care of orphans and vulnerable children. In the same way, close to nine
in ten (87.7 per cent) of respondents also indicated that the children they were
keeping were going to school, and again, this was true by age, sex and
residence. Out of the seventy respondents who reported that some of the
children they were keeping were not going to school, 90 per cent stated that the
children in question were not going to school because they could not afford to
take them to school. Only one in ten (10 per cent) reported that some children
did not actually want to go to school.
4.4.9b Community Perceptions on Ageing
Data for this section was gathered through Focus Group Discussions with
members of the community. Understanding perceptions of community
members towards older people and ageing in general is important because it
shows how older people are cared for by both the community and relatives. If
perceptions are positive, this may enhance the active ageing process for older
people. If on the other hand, perceptions seem negative, this simply adds to the
many challenges they face. In fact, Fitzwater et. al. (2008) asserted that

121
perspective is a powerful influence on attitudes and behavior; ―If we hold
mostly negative views about ageing, this perspective will influence our
interactions with older people as well and may be a huge source of the many
challenges they face‖ (Ibid 2008). Community views, convictions, perceptions
and attitudes towards ageing and the aged are critical in appreciating and
understanding how the aged are living in society in general and what
challenges they may be facing in terms of achieving the active ageing process.
In the same way, low self-esteem and unhappiness are more likely to be visible
amongst older people if communities exhibit negative perceptions towards
them.
To start with, discussants were asked to express their views on what they
thought about the topic of ageing and what interests them on discussions
around ageing. Their views were more on the negative than the positive side.
The FGD revealed that very few people in these communities discussed or even
talked about ageing. They contended that ageing was not an interesting topic
compared to others. One participant said:
„For me, I see that as a topic that most people are not interested in, people would
rather talk about other things, like taking children for under five clinics and so on‟
(FGD, Masala - Ndola)
Discussants also revealed that people generally think ageing was a time to
suffer and that old people were into witchcraft. To some extent, these views
inform perceptions and hence explain why old people are sometimes not
supported by society, or why they seem to have low self-esteem. Some
discussants said:
„Because of the problems these people go through every day, yes, ageing is now
seen as a time of suffering. It is a time of suffering and old people are not
respected since they are also accused of being witches‟. (FGD, Mwandi –
Sesheke)

122
However, not all discussions indicated that all or most of the people were not
really interested in matters affecting the aged. On the contrary, some said that
they were interested in discussing issues of ageing and wanted to participate in
solving problems affecting older people; they indicated that although they were
interested in these matters, they had no means to address them adequately:
„We are interested, but we don‟t know where to take our grievances about the
aged. We were once asked to write down names of all the aged in this
constituency, but up to today nothing has been done. This community has over
400 old people (FGD, Mwandi – Sesheke)
In the same way, discussants were asked to make some comparison between
the manner older people were addressed by society in the past and the current
times. They highlighted that old people and issues of the aged drew special
interest and attention in the past compared to current times. In the past, older
people were respected by both their children and society; they were also cared
for better:
Old people were kept very well a long time ago compared to nowadays, (FGD,
Mwandi, Sesheke)
People have just lost respect. A long time ago, people would even move off the
road so that an old person could pass, not now, you can even find a young
expecting an old person to leave the road for them; morals in societies have really
gone down (FGD, Masala, Ndola)
They further highlighted that in the past, children were expected to house their
old parents, a different scenario compared to current times, where older people
are considered a burden. However, discussants felt that in current times, there
were many reasons driving such negative attitudes towards older people,
including lack of employment for children and western cultural influences. On
the other hand, FGDs participants reported that wealthy older people were or
are respected by society. This again is a source of low self-esteem especially for
the majority older people who may not be rich or wealthy:
123
„Old people are suffering regardless of whether they have children or not. This is
because their (children) are unemployed, [and] they are also suffering‟ (FGD,
Mwandi – Sesheke)
„Old people are not respected or supported because of this western culture that
has come in. When they see an old person in dirty clothes, they don‟t even want to
go near that person‟ (FGD, Mwandi – Sesheke)
„And nowadays, for you to be respected in society, you need to have wealth. If you
don‟t have, you are considered to be nothing; rich people, even if they are old are
respected‟ (FGD, Matero – Lusaka)
Discussants were also asked to indicate whether they were, at the time of the
discussion, keeping an old person at their home and whether or not they could
keep or look after any older person who was not a relation. Some indicated that
they were keeping older people, most of whom were actually relatives.
While some stated that they could keep or look after an old person, they also
said it was not easy with the prevailing conditions in the economy. They
reported that the cost of living was high and this made it difficult to look after
older people, especially non-relatives.
They noted further that keeping or looking after older people was a big
challenge because older people are generally considered difficult. For example,
some indicated that not only were older people very choosy with food and other
such things, but they are also perceived to be extremely demanding. Given this
background, only few people would be willing to keep or look after them and as
a result, older people live quite unhappy and sometimes lonely lives.
Discussants also felt that not only were older people difficult, choosy and
demanding, they were also generally stressed; they complain, worry and cry
most of the times. Some discussants went on to state that older people were
full of themselves and did not care much about problems faced by others:

124
„For me I do not keep any. These people think a lot about their problems, they are
stressed, and they are always complaining and worrying. Others cry a lot. They
just want to die‟ (FGD, Mwandi – Sesheke)
Because of these and many other complaints, discussants were of the view that
it was no wonder older people had so many challenges, including living alone,
loneliness, low self-esteem and generally lacking support:
‗Yes, old people are lonely. In fact, they spend a lot of their time crying and
complaining, even those that have children still feel lonely because of lack of
support. When you visit them, they all complain of the same things, they have no
clothes, blankets and so on‟ (FGD, Mwandi - Sesheke)
In addition, discussants said that few people were willing to keep or look after
older persons because of witchcraft accusations from other members of the
community. Accusations of witchcraft further exacerbate the lack of respect old
people go through:
„On my own, I can keep an old person even though they are not my relation, but
the thing is that most people think that when one is old, then they are witches and
also disrespect them‟ (FGD, Masala – Ndola)
On the other hand, while many people consider the elderly difficult and choosy,
others think that they were helpful in certain circumstances. For example,
some discussants felt that staying with an old person was a blessing while
others said that older people helped in taking care of the children, and in some
cases they even helped to educate young people through story-telling and
advise:
„Yes, me I can stay with them. Keeping someone like that can be a blessing‟ (FGD,
Mwandi – Sesheke)
„Without old people there can never be youths; these people are important because
they give advice to young people. For instance, if you take our first president
Kenneth David Kaunda, he should not be put aside because he‟s old; he can still
125
advise these other presidents who have come in. They also tell a lot of good
stories to young ones‟ (FGD, Mwandi – Sesheke)
SUMMARY PART II
Clearly, these FGDs indicate that while there are few exceptions where older
people are respected, cared for, supported and valued, it is, however, notable
that society‘s perceptions of older people and ageing in general is skewed
towards the negative. To some extent, this also explains some of the challenges
older people experience at individual level especially on low self esteem
exhibited by being ‗unhappy, feeling ‗hopeless‘, ‗useless‘ and ‗lonely‘. This
situation does not encourage active ageing and definitely not in tandem with
the United Nations Principles on Ageing.
PART III DETERMINANTS OF ACTIVE AGEING
4.4.9c Active Ageing in Zambia
Discussions on the challenges as well as perceptions of ageing have given
indirect insights on some of the determinants of active ageing in the Zambian
context. These revelations are in themselves inconclusive and may not help
much in terms of explaining with confidence what the determinants of active
ageing in Zambia really are. In view of this challenge, and also in older to link
these findings to the Active Ageing Framework, our study aimed at using
indirect determinants of active ageing – hereafter called challenges – to
construct variables that would help measure directly the most influential
determinants of active ageing in Zambia. However, it should be noted that so
far, there are no studies that have categorically pointed out the extent of
influence of the named determinants in the active ageing framework on active
ageing itself. In fact, it is assumed that the body of evidence available only
suggests that these are the most likely determinants of active ageing in the
world and among older people (WHO, 2001).

126
According to the Active Ageing Framework, active ageing depends on a variety
of influences or ―determinants‖ that surround individuals, families and the
nation (Ibid, 2001). These determinants are broad based and are known to
affect active ageing differently. They include Gender and Culture as
overarching; others are Economic, Health, Social, Physical Environment,
Psychological or Behavioral and Personal Determinants. We also added
HIV/AIDS due to its significant influences on the lives of older people not just
in Zambia, but much of Africa as a whole. We excluded ―physical environment‖
determinant because the context in which it is used in developed countries is
very different from what could be referred to as physical environment in an
African setting. For example, the determinant in question proposes that for
people to age actively, there is need for buildings – houses, places of work etc -
to take into account their physical limitations; for example, all buildings should
have ―escalators‖ and not just stairs. This accordingly may promote
accessibility and active ageing
It should also be borne in mind that Active Ageing is not a concept measurable
using a single variable - it is a complex concept to measure and understand
fully. Using the definition of the concept itself, active ageing should include:
Independence, Participation, Self-fulfillment, Dignity and Care. Out of these,
four – independence, participation, self-fulfillment and dignity – were
operationalised in the data collection process. Independence for example was
operationalised by asking the respondent to state whether they were free to
make their own decisions without being coerced or forced; participation was
also measured by asking respondents to state whether they were free and
allowed to participate in community activities such as church gatherings,
community meetings etc. Any ―Yes‖ response to these questions meant that
they were participating in community activities and therefore fulfilling partly
the active ageing process. Care however is more inclined towards determinants
of active ageing rather than an indicator. In fact, care falls under social
determinants of active ageing.
127
4.4.9c.1 Model for Determinants of Active Ageing
Determinants of active ageing were measured using proxy indicators based on
challenges discussed already in this chapter. Gender on one of the overarching
determinants was measured by sex (male or female) while Culture was
measured by residence (rural or urban).
In order to measure Behavioural and Personal Determinants, respondents were
required to say either ―yes‖ or ―no‖ to the statements as follows: Do you feel:
Hopeless, Useless, Unhappy or Lonely? (q206d, q206e, q206f and q206g).
Health and Functional Determinants were measured using the question on
whether or not they had been ill in the past 12 months prior to the study
(q204) as well as to say either ―yes‖ or ―no‖ to statements such as: Can you
squat? Can you walk freely? And can you clean your house by yourself? (q201j,
q201k and q201g)
Economic Determinants were measured using questions on whether or not the
respondent had worked in the past 12 months (q106), whether or not they have
opportunities for work (q107b) and whether or not they have a steady flow of
income (q108)
Social Determinants (which include care as well) were measured using
questions such as: do you have someone who takes care of you? (q301), who
are you living with? (q331), how often do you interact with peers? (q414) and do
you receive any support – monetary or otherwise? (q406).
Finally, HIV/AIDS as a Determinant, unique to Zambia and Southern Africa in
general, but not reflected in the Active Ageing Framework (WHO, 2002) was
measured using the question on whether or not the respondent was keeping
dependents and how many of these are or were orphans? (q335).
In this model, as well as the Active Ageing Framework, these determinants were
or are treated as ―Independent variables‖ while Active ageing (measured by
participation, self fulfillment, independence and dignity) was treated as a
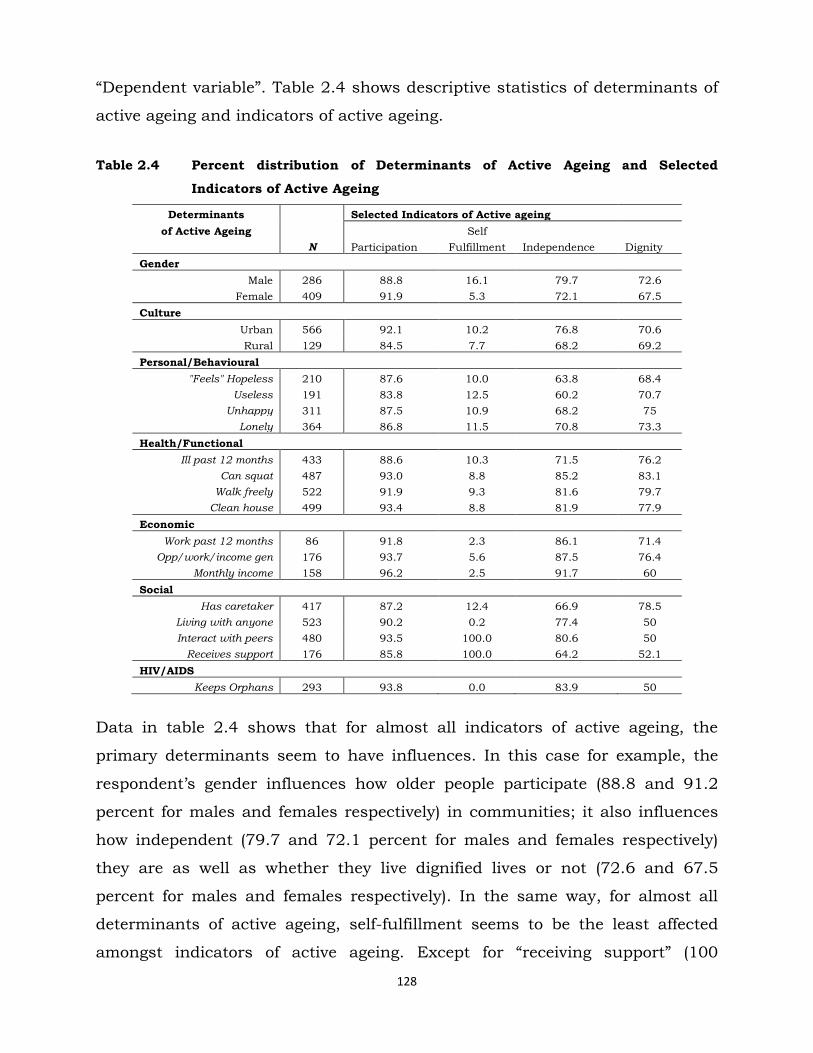
128
―Dependent variable‖. Table 2.4 shows descriptive statistics of determinants of
active ageing and indicators of active ageing.
Table 2.4 Percent distribution of Determinants of Active Ageing and Selected
Indicators of Active Ageing
Determinants Selected Indicators of Active ageing
of Active Ageing Self
N Participation Fulfillment Independence Dignity
Gender
Male 286 88.8 16.1 79.7 72.6
Female 409 91.9 5.3 72.1 67.5
Culture
Urban 566 92.1 10.2 76.8 70.6
Rural 129 84.5 7.7 68.2 69.2
Personal/Behavioural
"Feels" Hopeless 210 87.6 10.0 63.8 68.4
Useless 191 83.8 12.5 60.2 70.7
Unhappy 311 87.5 10.9 68.2 75
Lonely 364 86.8 11.5 70.8 73.3
Health/Functional
Ill past 12 months 433 88.6 10.3 71.5 76.2
Can squat 487 93.0 8.8 85.2 83.1
Walk freely 522 91.9 9.3 81.6 79.7
Clean house 499 93.4 8.8 81.9 77.9
Economic
Work past 12 months 86 91.8 2.3 86.1 71.4
Opp/work/income gen 176 93.7 5.6 87.5 76.4
Monthly income 158 96.2 2.5 91.7 60
Social
Has caretaker 417 87.2 12.4 66.9 78.5
Living with anyone 523 90.2 0.2 77.4 50
Interact with peers 480 93.5 100.0 80.6 50
Receives support 176 85.8 100.0 64.2 52.1
HIV/AIDS
Keeps Orphans 293 93.8 0.0 83.9 50
Data in table 2.4 shows that for almost all indicators of active ageing, the
primary determinants seem to have influences. In this case for example, the
respondent‘s gender influences how older people participate (88.8 and 91.2
percent for males and females respectively) in communities; it also influences
how independent (79.7 and 72.1 percent for males and females respectively)
they are as well as whether they live dignified lives or not (72.6 and 67.5
percent for males and females respectively). In the same way, for almost all
determinants of active ageing, self-fulfillment seems to be the least affected
amongst indicators of active ageing. Except for ―receiving support‖ (100

129
percent), and ―interacting with peers‖ (100 percent), other influences are all
under 16.1 percent reported by the male gender.
In the same way, except for participation where the female gender seems to be
more (91.9 per cent), males seem to be more self-fulfilled (16.1 percent), more
independent (79.7 percent) and more dignified (72.6 percent).
In terms of culture, the table shows that residents in urban areas participate
more in community activities (92.1 against 84.5 percent), are a little more self-
fulfilled (10.2 against 7.7 percent) and more independent (76.8 against 68.2
percent) compared to their rural counterparts respectively. However, in terms
of dignity, older people in both rural and urban areas seem to enjoy similar
treatment (70.6 and 69.2 percent respectively).
Other determinants play quite important roles as well in terms of influencing
active ageing. While data shows that their influences are quite high, there are
few or exceptional variations amongst and between them.
In terms of behavioural and personal determinants, at least four out of every
five respondents demonstrate that these determinants affect the way they
participate. Being unhappy and reporting loneliness for example are highly
associated with the respondent‘s independence (68.2 and 70.8 percent
respectively) and dignity (75 and 73.3 percent respectively).
Health Determinants also show indications of associations with active ageing
indicators relating especially to participation, independence and dignity. For
example, about 88.6 percent of respondents stated that while they were ill in
the past 12 months prior to the study, they however also reported that they
were free to participate in the affairs of society.
Economic determinants, especially having a monthly income is highly
associated with active ageing indicators of participation (96.2 percent) and
independence (91.7 percent). In the same way, social determinants also affect
active ageing indicators differently. However, this association is more visible
with participation and independence.

130
HIV/AIDS (93.8 percent) seem to affect participation more compared to other
determinants. The data also shows that HIV/AIDS has no influence on the
active ageing indicator of self-fulfillment. In other words, one‘s report that they
are affected by HIV/AIDS or are taking care of HIV/AIDS orphans does not in
any way affect whether they would live self-fulfilled lives.
Much of what has been discussed here is not conclusive and the following
section gives statistical tests of the influence of each of the proxy measures of
determinants of active ageing on indicators of active ageing.
4.4.9c.2 Influence of Determinants on Active Ageing
In order to measure the influence of each of the determinants on indicators of
active ageing, a multiple regression model was used. All outcome and
Independent variables remained as they appear in the descriptive table above
(table 2.4). Details of these relationships are shown in table 2.5.

131
Table 2.5 Multiple regression results showing the influence of determinants of active
ageing on active ageing indicators
Determinants Selected Indicators of Active ageing
of Active Ageing Self
N Participation Fulfillment Independence Dignity
Gender 690 -0.0312 ***0.1070 *0.0759 0.0497
Culture 690 **0.0755 0.0250 *0.0863 0.0794
Personal/Behavioural
"Feels" Hopeless 210 *0.0762 -0.0664 -0.0101 -0.1470
Useless 191 *+-0.1305 *0.0793 **-0.1727 0.0317
Unhappy 311 -0.0062 -0.0030 -0.0751 0.0481
Lonely 364 *-0.0601 0.0340 0.0048 -0.0566
Health/Functional
Ill past 12 months 433 -0.0204 0.0077 0.0086 0.0382
Can squat 487 0.0392 -0.0326 ***0.2559 0.1806
Walk freely 522 -0.0274 0.0161 0.0486 0.0384
Clean house 499 ***0.1163 -0.0098 *+0.1246 0.0043
Economic
Work past 12 months 86 -0.0186 -0.0530 0.0237 -0.0265
Opp/work/income gen 176 0.0172 -0.0082 *0.0860 0.0974
Monthly income 158 *0.0681 **-0.0781 ***0.1690 -0.2300
Social
Has caretaker 417 ***-0.0938 ,- ***-0.2081 ,-
Living with anyone 523 0.0358 ,- **0.1600 ,-
Interact with peers 480 ***0.1499 ,- ***0.1732 ,-
Receives support 176 -0.0325 ,- **-0.1113 ,-
HIV/AIDS
Keeps Orphans 293 **0.0690 -0.0033 ***0.1405 ,-
***P< 0.0001 *P<0.05 **P<0.01 *+P<0.001
Opp/work/income gen >= opportunity for work or income generating activity
Associations in the table show that gender determines active ageing indicators
of independence (p<0.05) and self-fulfillment (p<0.0001). However, there is no
statistical association between one‘s gender and active ageing indicators of
participation and dignity. Reasons for this finding are unclear; but most likely,
it is possible that in the Zambian for anyone to participate in any activity –
going to church for example and also for one to enjoy dignity, one‘s gender is
not a factor. On the other hand, culture has no bearing on older people‘s
dignity and self-fulfillment, but is statistically associated with both
participation (p<0.01) and independence (p<0.05). Reasons for this finding can
only be speculative, but suffice to say that for anyone older person to enjoy
132
dignity or even feel self-fulfilled, they do not have to be of certain cultural
orientation; in other words, culture could inevitably engender both dignity as
well as self-fulfillment.
Personal/Behavioral determinants of active ageing are statistically related to
active ageing indicators of participation, self-fulfillment and independence. In
this example, almost all measures of personal/behavioural determinants are
related statistically to the active ageing indicator of participation (hopeless =
p<0.05; useless = p<0.001; lonely = p<0.05) except for that of ―being unhappy‖.
In other words, there is no relationship between being unhappy and being able
to participate in community or society‘s activities. In the same way, the
relationship between the personal/behavioural determinant indicator of ―feeling
useless‖ is statistically significant with both the active ageing indicators of self-
fulfilment (p<0.05) and independence (p<0.01). Given these results, it is clear
that the main problem in as far as older people are concerned is low self-
esteem. This low self-esteem inhibits their full participation in several activities
happening at either community or society level.
The active ageing framework proposes that health and functional abilities have
substantial effects on ageing in general. Results in table 2.5 show that the
there is no relationship between the respondent‘s report of being ―ill in last 12
months prior to the study‖ and any other indicator of active ageing. This
finding is quite contrary to propositions in the active ageing framework, where
health is a key determinant. However, this may mean that ill health may only
affect active ageing if and when it is experienced over a long period of time.
Functional ability of being able to ―clean the house‖ is statistically related to
the active ageing indicator of ―participation‖ (p<0.0001) and independence
(p<0.001); while the functional ability of ―being able to squat‖ is only significant
with the active ageing indicator of ―independence‖ (p<0.0001). In other words,
while health affects how older people age, this relationship can best be
measured by a life course approach and is more factual when it relates to
actual physical abilities where older people have to perform functions requiring
more physical exertion, rather than just the report of being ill for certain

133
periods. As a result, while it could be argued that health is a significant
challenge in old age, the effects it has on the actual active ageing process is
minimal except where one has lifelong or chronic health challenges such as
hypertension, diabetes etc.
Economic determinants are also said to have a bearing on the active ageing
process. However, the economic determinant indicator of whether or not
someone ―worked in the last 12 months prior to the study‖ has, according to
results in table 2.5, no statistical relationship with any of the active ageing
indicators associated with active ageing. In the same way, the economic
determinant indicator of ―having opportunities for work or income generating
activities‖ has no bearing on almost all active ageing indicators except that of
independence (p<0.05). This result suggests that respondents‘ report on having
or not having opportunities for work and/or income generating activities affects
mostly their independence. The main economic determinant indicator
influencing participation, self-fulfillment and independence significantly is
―monthly income‖. In fact, respondents‘ report of having a steady ―monthly
income‖ affects their participation (p<0.05), self-fulfillment (p<0.01) and also
their independence (p<0.0001). While the relationship between income and
active ageing indicators of participation and independence is positive, the
relationship between income and self-fulfillment is actually negative (coef = -
0.0781) meaning therefore that lower income is associated with low self-
fulfillment in our context.
Apart from the forgoing, table 2.5 also shows relationships between social
indicators of determinants of active ageing and active ageing indicators. Data in
this example suggests that self-fulfillment and dignity are not in any way
affected by social determinants in the active ageing framework. However, all,
except for two of the measured indicators of social determinants of active
ageing (living with anyone and receiving support) seem to affect significantly
the active ageing indicators of participation and independence. Participation is
statistically affected by whether or not a respondent has a caretaker (p<0.0001)
and whether or not a respondent interacts with peers (p<0.0001); these

134
relationships are quite strong. In the same way, the active ageing indicator of
independence is significantly related to all social determinants of active ageing
with ―having a caretaker‖ (p<0.01) and ―receiving support‖ (p<0.0001) having a
negative relationship.
Lastly but not least, our study looked also at the effect HIV/AIDS is having on
active ageing. This situation is not proposed through the active ageing
framework but thought through to have a significant effect on active ageing.
The main indicator for the presence of HIV/AIDS amongst the study group was
a question on whether or not they were keeping orphans. Data in table 2.5
shows that HIV/AIDS is statistically related to the active ageing indicator of
participation (p<0.01) and independence (p<0.0001). However, the data
suggests that HIV/AIDS has no bearing on one‘s self-fulfillment and dignity. In
other words, old people‘s report that they keep orphans affects how they
participate in community activities as well as their independence. What this
clearly shows is that older people keeping orphans are not as independent to
be able to do what they want and whenever they want because they have to
take care and look after orphans. This, as we have seen already, is a serious
and daunting challenge affecting older people in Zambia and other African
countries where the HIV/AIDS pandemic is highly pronounced.
In summary, data in table 2.5 suggests that indeed, active ageing is a function
of most of the determinants proposed in the active ageing framework or model.
Even with the presence of HIV/AIDS, the relationship with indicators of
determinants of active ageing and indicators of active ageing itself is quite
strong and in many instances statistically significant.
Discussions above may not be conclusive. As a result, for the study to
accurately establish which of the determinants of active ageing are more
significant, and also to establish ―pathways‖ affecting active ageing
significantly, we generated a composite variable compressing all indicators of
active ageing into a variable called ―Active Ageing‖.

135
The input variables for all or most of the indicators of active ageing were
generated by ―Yes‖ and ―No‖ responses. For example, for us to investigate
whether any respondent was ―participating‖ in community activities, we asked
them to confirm (yes) or disapprove (no) whether they were given chances to
participate in community activities such as going to church; being given
positions of authority; being considered to heard community groupings etc.
Any ―Yes‖ response to such a statement meant that a respondent was
participating while a negative outcome meant the opposite. This process was
followed through for other indicators of active ageing - self-fulfillment,
independence and dignity. In order to finally come up with the outcome
variable of ―Active Ageing‖, all ―Yes‖ responses to the preceding conditions or
questions meant a respondent was enjoying active ageing while ―No‖ responses
meant the opposite. This process, we believe gave us a demonstration of
determinants of active ageing and their pathways with significance influences
on active ageing relating to Zambia. Table 2.6 shows multiple regression results
of indicators (or pathways) of determinants of active ageing and active ageing
as a single outcome variable.

136
Table 2.6 Multiple Regression Results showing the influence of determinants of
active ageing on active ageing
Determinants of Active Ageing Active Beta R
N Ageing Coef. Squared
Gender 690 -0.0070 -0.0173
Culture 690 ***0.0923 0.1796 0.0320
Personal/Behavioural
"Feels" Hopeless 210 *0.0517 0.1189
Useless 191 ***0.0965 -0.2156 0.0389
Unhappy 311 -0.0307 -0.0765 Lonely 364 -0.0137 -0.0343
Health/Functional Ill past 12 months 433 -0.0194 -0.0474
Can squat 487 *0.0438 0.1005 0.0415
Walk freely 522 -0.0054 -0.0116 Clean house 499 **0.0564 0.1263
Economic Work past 12 months 86 -0.0156 -0.0257
Opp/work/income gen 176 0.0199 0.0432 0.0109
Monthly income 158 *0.0402 0.0843
Social
Has caretaker 417 **-0.0614 -0.1409
Living with anyone 523 0.0413 0.0615 Interact with peers 480 *+0.0754 0.1359 0.0499
Receives support 176 -0.0303 -0.0641
HIV/AIDS Keeps Orphans 293 **0.0496 0.1151 0.0132
***P< 0.0001 *P<0.05 **P<0.01 *+P<0.001
Opp/work/income gen >= opportunity for work or income generating activity
Table 2.6 shows that gender does not influence active ageing, even if it does
influence some individual indicators of active ageing (table 2.5). This finding
defies propositions given in the Active Ageing Framework where gender is an
overarching variable influencing active ageing in general. While this finding
may be unique to Zambia and possibly difficult to explain why, this could be an
avenue for further research. Culture, however influences active ageing
significantly (p<0.0001; Beta=179); confirming also what the active ageing
framework proposes; It should also be noted that actually, even after
controlling gender against culture and vice versa, the relationships between
gender and active ageing on one side and culture and active ageing on the

137
other, remained the same – gender does not influence active ageing while
culture does significantly. However, the Pseudo R2 is not very strong (32
percent). Simply meaning that, while it is true that culture influences active
ageing, this association is not very strong. To some extent, this revelation
marries well with the Active Ageing Framework assumption stating the
uncertainty with which one can predict or point out direct causation of anyone
determinant on active ageing (Active Ageing Framework pp. 19). It is also
suggested that more research is needed to clarify and specify the role of each
determinant, as well as the interactions between determinants in the active
ageing process. In fact, the framework proposes that for such studies, a life
course approach is required so as to take advantage of transitions and ―window
of opportunity‖ for enhancing health, participation and security at different
stages (Ibid pp. 19-20).
Results in table 2.6 also show that amongst personal/behavioural
determinants of active ageing, only feelings of ―hopelessness‖ (p<0.05) and that
of ―uselessness‖ (p<0.0001) explain variations on the outcome variable of active
ageing. Actually, this model predicts that feeling useless is negatively related to
active ageing (Beta=-215). Other indicators of personal/behavioural
determinants of active ageing have no bearing on the process of ageing in
general.
In the same way, health and some functional disabilities do not affect active
ageing. However, ability to squat (p<0.05) and clean the house (p<0.01) affect
older people substantially and this relationship is statistically significant. In
terms of economic determinants, the model suggests that only ―having a steady
monthly income‖ (p<0.05) affects active ageing and this relationship is
statistically significant. Other measures or indicators of economic determinants
have completely no bearing on active ageing.
Our model also suggests that the major social (determinants) contributors to
active ageing, which are statistically significant are ―having a caretaker‖
(p<0.01) and ―interacting with peers‖ (p<0.001). Others, such as ―living with
138
other adult children‖ and ―receiving any form of support‖ do not affect active
ageing as far as the Zambian context is concerned. In the same way,
HIV/AIDS, a special situation prominent in Africa and Zambia in particular, is
significantly associated with active ageing (p<0.01). Even after controlling for
other determinants (already discussed), the relationship between HIV/AIDS
and active ageing still remained statistically significant. This is a confirmation
that HIV/AIDS is a serious challenge in old age and has significant bearing on
the active ageing process in Zambia.
SUMMARY OF PART III
Using data derived from this extensive investigation of challenges and
determinants of active ageing, it is clear that in the Zambian context, culture,
personal/behavioural determinants relating to ―feeling hopeless and useless‖,
health/functional determinants relating to ability ―to squat and cleaning one‘s
house‖, economic determinants relating to ―whether one has a monthly income
or not‖, social determinants relating to ―having a caretaker and interacting with
friends or peers‖ as well as HIV/AIDS, influence the active ageing process
significantly. What is clearly different in these findings is that unlike the active
ageing framework, our study confirms that in the Zambian context and also in
countries with a generalized HIV/AIDS pandemic, active ageing will for a long
time be affected by HIV/AIDS; this we believe is not categorical in the active
ageing framework.
PART IV PUBLIC POLICY
4.5 Adequacy of the Draft Policy on Ageing in Zambia
Zambia, like most countries in Africa, has recognised the need to make
practical interventions on ageing. This is evidenced by a variety of international
and regional policy instruments that have been ratified, domesticated and used
to guide and support Zambia‘s policies and programmes addressing needs or
challenges for the elderly people. These have included, among others, The

139
United Nations Principles on Ageing, The Madrid International Plan of Action,
African Union Policy Framework, and the Plan of Action on Ageing.
This section focused on the draft policy on ageing in Zambia and how adequate
it is in terms of reflecting UN principles on ageing (1991) and the WHO Active
Ageing Framework (2002).
While it is true that the Government of Zambia has drafted a policy on ageing,
the policy has not yet been ratified by Cabinet and, therefore, is still non-
functional. However, it was subjected to analysis in our study because it is a
substantive pre-curser of the policy to be ratified and later implemented by
government through the Ministry of Community Development, Mother and
Child Health (MCDMCH).
In 1991, the United Nations came up with eighteen principles on ageing which
were meant to facilitate the ‗addition of life to the years that had been added to
life‟. These principles became the modus operandus and mirror for any policy
formulation at global, regional and national level. In order to make these
principles workable, the World Assembly on Ageing of 2002 re-emphasised the
need for National Governments to operationalise and domesticate them
through the Madrid Plan of Action.
The eighteen UN Principles on Ageing have been broadly categorised to include
the following: Independence, Participation, Care, Self-fulfillment and Dignity.
According to both the Minister and Permanent Secretary at MCDMCH
(Ministerial Briefs, 2010), a number of processes were followed and
consultations made before the final draft on ageing was written. The Permanent
Secretary stated that:
„The preparation of the National Policy on Ageing was preceded by a series of
consultative workshops with stakeholders to put together all the views and
identified gaps to be addressed by this policy. The spirit of consultation was very
useful in the finalisation of the policy‟ (Draft policy, 2008)

140
Stakeholders involved and consulted during the drafting of the policy included
among others, the following: Government line Ministries, Non-Governmental
Organisations and Cabinet Office (PAC); others are the Retirees Welfare Bureau
of Zambia, Senior Citizens Association of Zambia, Zambia Aged People‘s
Association and HelpAge International.
The Government of Zambia saw the need to come up with a National Policy on
Ageing as urgent because absolute numbers for older people at global and
regional levels were increasing (Second World Assembly on Ageing, 2002). What
became eminent, therefore, was to link ageing to social and economic
development, as well as human rights (Draft Policy on Ageing, 2009).
In view of the foregoing, the National Policy on Ageing was seen as a reflection
of Government‘s intention to uplift the standard of living of its ageing
population in general and life in old age particularly. It was a tool for providing
guidelines for changing, maintaining and creating living conditions that were
conducive to the ageing population so that Zambians would be able to age with
dignity and honour (Ibid, 2009).
The Draft National Policy on Ageing is based on Vision 2030 objectives (Zambia
should be a middle income country by 2030), where government would want to
see „People Ageing with Dignity by 2030‘. The policy is also anchored on
evidence from studies conducted by government and non-government agencies
such as the Central Statistical Office, Ministry of Finance and HelpAge
International. The rationale is premised on the following assumption:
„Older persons of today are faced with conditions of extreme poverty, added
burdens of being care givers and bread winners due to the effects of HIV and
AIDS, abuse, stigma as being advents of witchcraft and misfortune and generally
as a nuisance to society. In addition, older persons have been marginalised from
many developmental interventions and access to means of production. As such the
lives of older persons have been difficult at the stage in life when they are
supposed to be enjoying old age. Furthermore, the lack of programmes to prepare
citizens for life in old age has contributed to the difficulties being faced by older
persons of today‟ (Ageing Policy Draft – Zambia, 2009).
141
Given this assumption, the rationale for the National Policy on Ageing was
based on ensuring that:
(i) Government addresses challenges faced by elderly persons;
(ii) there is a regulatory framework to guide both government and non-
governmental organisations in addressing issues of the aged;
(iii) the policy would be the legal justification to allocate more resources to
issues of ageing and finally; and
(iv) International conventions on ageing are or will be domesticated.
In order to pursue this rationale, government came up with ‗Guiding Principles‘
to help in the drafting of the policy. While there is a great deal of democracy in
policy development, it is always important that countries have a point of
reference, especially in terms of domestication of policies and programmes.
Ideally, it is expected that the UN Principles on Ageing and the Madrid Plan of
Action should basically be the ‗guiding principles‘ for all policies on ageing,
however, in some cases, countries choose to adopt what is relevant to their
situation and Zambia is not an exception. The following principles have been
adopted in the draft policy on ageing:
Participation: Older persons have the right and duty to actively participate in
the economic, social, cultural and political affairs of the nation as well as in the
formulation of policies affecting them.
Dignity, Security and Freedom from Exploitation: All Zambian citizens are
born free, equal in dignity and rights. They are entitled to all the rights and
freedoms contained in the Bill of Rights as enshrined in the Republican
Constitution.

142
Family and community care: Older persons should benefit from the care,
support and protection provided by the family, community and government.
Partnership: As the provision of care and support to older persons is an
enormous task that requires the involvement of all key stakeholders,
Government should further embrace partnerships and collaborate closely with
the private sector, civil society, cooperating partners and older persons
themselves in addressing the needs of the ageing population.
Availability and Accessibility to Basic Needs: Older Persons should have
access to food, water and sanitation, proper shelter, clothing, health care, work
and other income generating activities, education and training and life in safe
environment.
4.6.5 Objectives, Measures and Implementation Strategy for the
Policy on Ageing
The draft Policy on Ageing has one major objective and several other specific
objectives stated as themes. It also provides measures to operationalise these
objectives, including specific roles to be undertaken by all line ministries as
well as Cabinet. The policy highlights roles of civic and non-governmental
organisations in the implementation of policy objectives. The main objective
states:
To promote, protect and fulfill the rights of persons in order to ensure that they
lead a productive, fulfilled and dignified life in old age.
The following specific objectives, also referred to as sub-themes, take or took
precedence:
- Poverty eradication;
- Employment and Income Security;
- Health, Food and Nutrition;
- Housing, Transport and living Environment;
- Gender;

143
- Rights;
- Research, Information, Education and Training;
- Family; and
- Social Welfare
Each of the stated specific sub-themes (objectives) has other sub objectives and
measures for implementation. Clearly, some objectives reflect
recommendations suggested by the UN Principles on Ageing and the 2002
Madrid Plan of Action report. For example, fighting poverty and advocating for
the rights of the elderly are some of the objectives appearing in both the
Zambian draft Policy on Ageing and the 2002 Madrid Plan of Action on Ageing.
Under the Poverty sub-theme, the draft policy seeks to ensure that poverty
among the people of Zambia reduces dramatically and more especially among
elderly persons. It is also intended to show that policies on poverty reduction
are cognisant of needs of older people, which may require different strategic
efforts.
While this sub-theme aims at fighting poverty, especially among older people,
some of the objectives and the proposed measures are not clearly stated. For
example, objective (c) states: to ensure [that] socio-economic reforms which
result in people being separated from employment [do] not cause mass
destitution; and the measure to achieve this objective states: engage older
people in consultative processes on issues that affect them (draft policy on
ageing, 2008: 17). In this form, therefore, it is difficult to point with clarity the
relationship between the expressed objective and the measures proposed to
achieve it.
The sub-theme on Employment and Income Security has three objectives and
four measures. According to the draft policy, employment and income are
closely related to poverty – the assumption being that when one is not
employed and has no income, one may most likely experience poverty or may
be poor. The two objectives resonate with the intended measures. Under the

144
same sub-theme, the policy advocates for a deliberate policy to create jobs
specifically for older people.
Health, food and nutrition are presented under one sub-theme whose main
objective is to establish a national health insurance for all citizens, but
particularly health services that are open to specific requirements of older
persons. It further states that government would develop curricular to improve
nutrition and health for older people. This would be achieved through
formation of partnerships with interested organisations and by ensuring that
older people have access to health insurance. The policy does not provide
practical examples and mechanisms of how such a system would work. While it
may not be possible to outline all procedures in one policy document, the mere
statement of intent without a clear description of how the scheme would work
is not very helpful.
The draft policy documents intent by government to help elderly people access
housing, transportation and also to live in an environment that is responsive to
their needs and requirements. This aspect is also clearly lucid in the Madrid
Plan of Action on ageing (2002).
Other objectives include the recognition of the family in the care of the elderly,
strengthening the social welfare system and promotion of research,
information, education and training.
Discussions above clearly show that the draft policy on ageing is quite
comprehensive. However, a few observations may suffice. Any policy, as
expected, should aim at providing guidance in the formation of other more
specific programmes and projects to facilitate quick and focused
implementation. Frankly, while the objective of this study is not to discuss
implementation of policies and programmes, it is important to highlight that
this policy will take even longer to fulfill. This is so because there is no strategic
plan in place.

145
Similarly, observations on some of the objectives in the draft policy suggest
that there is no clear relationship with measures intended to achieve them.
Consequently, this may prove difficult to implement as a result. For example,
the draft policy advocates for the creation of employment for older people.
While this sounds good, it may not be possible, let alone adequate. The policy
does not highlight, for example, categories of jobs to be created which would
specifically serve the aged alone – in fact, technically, it is very difficult and
almost impossible to have jobs which can only be done by people of a certain
age group. In addition, the objective in question falls short of current debates
and interrogations on ageing at the international scene level. The 2002 Madrid
Plan of Action Report states that older people should be re-integrated in society
– not necessarily creating a separate empire for them. The objective in question
is also problematic, to say the least; firstly, creating jobs specifically for older
people may interpreted to mean that older people are incapable of doing what
other age groups are capable of doing - thus receiving special ―handicapped‖
treatment; secondly, creation of jobs should be for all citizens as long as they
are willing and able to offer the needed labour. This will and can help
integration and blending of the old and the young – engendering an ideal
society accommodating all ages.
The policy also suggests that elderly people should have access to health
insurance schemes. This objective is very critical because some ailments
afflicting the elderly require specialised interventions. However, it is a known
fact that health insurance is based on monetary contributory terms. In any
case, some of the objectives under the health thematic area are also outlined in
the health policy where people aged sixty-five years and above access medical
services free of charge. The challenge is that some of the services being
accessed may not provide specialised geriatric services for older people; this is
because currently, training in medicine is concentrated on Primary Health Care
and not so much special areas like geriatrics.

146
Another aspect the policy addresses is housing. The policy proposes the need
to provide housing to the elderly. It emphasises prioritisation of housing
provision for the elderly. While this objective is well intended, it may be a
challenge to achieve and implement because it will be exigent to convince
stakeholders in housing schemes to give priority to older persons while there
are other interest groups which could be needier than the group in question.
The youth, for example, would argue that they actually need more
opportunities to have access to housing than the elderly do. In this respect
therefore, housing should be viewed as a national problem, which requires a
holistic approach.
Given the fact that much of ageing in Zambia should be explained and
implemented through the Draft Policy on Ageing, it is imperative that it also
addresses all or most of the issues which could be missing even when clearly, it
is apt in so far as ageing is concerned. For example the draft policy should be
―allowed‖ to incorporate other policies which in this case seem to be replicas of
what the draft policy proposes. For example, policies such as the Social Cash
Transfer Scheme and the Public Welfare Assistance Program should be merged
into the policy on ageing.
In the same way, the draft policy on ageing is silent on the role of the family on
ageing. In view of this, the policy on ageing should be re-cast to provide
avenues to propel a paradigm shift advocating the placement of the family as a
powerful alternative to government interventions on ageing. This, we believe
will help promote active ageing through family unions and re-unions and
inevitably improve self-esteem through peer and family interactions (significant
social determinant/s). In this example, the family should be strengthened,
encouraged and empowered to continue playing its known traditional role of
taking care of vulnerable groups including the elderly by both government and
other interested institutions such as the church and NGOs. This could be done
through sensitizations, workshops, media programmes etc to spring messages
147
that enable the family realize this important role of taking care of their older
relatives. This will inevitably strengthen the (draft) policy on ageing in Zambia.
SUMMARY OF PART IV
In summary, the Draft Policy on Ageing is the sole model document addressing
almost all concerns on ageing; this is so because it has been aligned to both
the UN Principles on Ageing and also the 2002 Madrid Plan of Action. What the
draft has attempted to achieve is basically document all or at least most of the
recommendations in the two international protocols and relate them to the
Zambia situation or simply, domestication. It is also important to point out that
the draft policy on ageing is a detailed and comprehensive document which, if
implemented, would not only be adequate in representing issues of ageing but
also help solve or address most of the challenges of ageing in Zambia. Whether
or not the policy can be implemented is not subject to discussion in the current
study as this may prove ambitious and presumptive. What is critical to
acknowledge, however, is that in the current format, the draft policy, if
actualised is adequate in fulfilling requirements of the UN principles on ageing.
However, much of this will be more profound if or when it takes cognisant of
the role of the family on active ageing in general. This is the proposition based
on findings in this study.

148
CHAPTER 5: SUMMARY, DISCUSSION AND CONCLUSION
The main objective of the present study was to investigate demographic trends
of population ageing as well as challenges of ageing in Zambia. Specifically, the
study investigated past and future trends in population ageing; examined
challenges faced by older people as well as determinants of active ageing
proposed through the active ageing framework; and lastly, examined the draft
policy on ageing in Zambia.
5.1 Summary of Main Findings
5.1.1 Demographic Estimates and Projections
Developing regions will experience rapid population ageing in the near future.
While the number of older people, 60 years and above will remain static
proportionally, the absolute growth will be significant (Kinsella et. al., 2005). In
the same way, Zambia is also currently experiencing population ageing.
Projections in our study have shown that the growth rate of people aged 60+ is
ranging between 2.5 and 3.3 per cent per annum for the period 2000 to 2015.
From 2020 to 2050, the population of older people will grow between 2.5 and 5
per cent per annum respectively. By 2050, there will be approximately 38
million people in Zambia and about 8 per cent or 3,040,000 of these will be
aged 60 and above. In general terms, although Zambia‘s population will remain
predominantly young, the number of older people will continue growing.

149
5.1.2 Challenges and Determinants of Ageing
The study has highlighted the many challenges older people are facing. At
individual or micro level, the main challenges older people reported include:
health problems and increases in the number and frequency of health related
ailments; increases in functional limitations with female respondents reporting
more compared to males. One of the main findings at individual level was that
of low self-esteem and loneliness.
There were also a number of challenges reported classified as ‗macro level
challenges‘ or problems older people face due to the socio-economic as well as
demographic environments. For example, very few respondents reported that
they were working. In fact, results show that they have very few opportunities
for work. In terms of care, the family plays a major role although there were
cases of respondents who live alone. Respondents also reported very few social
interactions amongst themselves, their relatives and also with community
members. In terms of material and monetary support, the situation was the
same. Older people reported low support from relatives, community,
government and other interest organisations such as the church. Lastly, older
people are also faced with challenges of looking after or caring for orphans and
other dependent children.
In terms of determinants of active ageing – as proposed by the Active Ageing
Framework – our study found that in Zambia, Culture, personal/behavioural
determinants, health/functional determinants, economic determinants and
HIV/AIDS as a determinant have significant influences on Active Ageing in
general.
150
5.1.3 Policies and Programmes on Ageing
Basically, several policies and programmes exist in Zambia. Through literature
review, we looked at a few and they include: population policy, health policy
and the labour and national employment policy. We also looked at long-term
policies such as the fifth and sixth national development plan and vision 2030.
In addition, the study also reviewed other programmes currently being
implemented by government. These include the Public Welfare Assistance
Scheme and the Social Cash Transfer Scheme. However, the main focus was to
examine the draft policy on ageing and how it reflects UN Principles on ageing
in general.
5.2 Discussion
Given the findings in this study, what, therefore, are the implications? Findings
in this study have several implications. Some of them may require a paradigm
shift in the manner ageing and older people are currently looked at.
Information or data on projections has indicated that the number of older
people will continue rising. This situation is prevalent in most developing
countries of which Zambia is also part (UN Population Division, 2000; National
Research Council, 2000). Consequently, the need to plan for older people
especially in the near future cannot be overemphasised. This situation calls for
measures to ensure older people live lives far from ridicule and are guaranteed
optimisation of opportunities for health, participation and security, to enhance
quality and active ageing (WHO, 2002).
Several challenges, classified as individual or micro level, were reported by
respondents. As people age, they come face to face with health problems,
functional limitations and they generally have quite low self-esteem. This
situation has been revealed not only by our study but by other studies as well
(Gorman, 2002; National Research Council, 2001; Palloni, et al 2002; Restrepo
et al 1994). This situation, therefore, calls for intervention in terms of health

151
services provision to help mitigate or delay the onset of health problems in old
age. In fact, one of the United Nations principles on ageing states that:
Older persons should have access to health care to help them to maintain or
regain the optimum level of physical, mental and emotional well-being and to
prevent or delay the onset of illness (WHO, 2002)
Health problems – such as high blood pressure and general body pains - and
functional limitations – such as inability to walk properly and squat - in older
people are more prominent and more pronounced amongst females compared
to males. These results are consistent with other studies as well. For example,
in a study on interactions between socio-economic status and living
arrangements in predicting gender specific health status among the elderly in
Cameroon, Kuate-Defo (2006) found that significantly higher proportions of
female respondents reported being in poor health, having functional limitations
or both than male respondents. In the same study, results indicated that older
respondents (70+) who were not working reported significantly poor health and
functional limitations compared to those who were a little younger and in
employment. These variations could be emanating from several causes.
However, as Kuate-Defo puts it, these discrepancies, which seem to especially
disadvantage females, may be explained by certain socio-economic status
relative to males. For example, it is true the world over, and especially in
developing countries like Zambia, that males are better educated than females,
better placed to work than females, and are sometimes more exposed to better
opportunities than females. These aspects contribute significantly both to the
poor health status and functional disabilities of older people.
Apart from health problems and functional limitations, the study examined
self-esteem and loneliness as well. Self-esteem is important for active ageing
and is also one of the most important psychological/Behavioural or Personal
tenets proposed by the 2002 WHO Active Ageing Framework. Self-esteem
provides insights on people‘s psychological well-being and is important in
aiding or ailing the process of ageing. Some of the self-esteem proxy indicators
152
used in this study have also been used in other studies (Knodel, 2007). They
include self-reported feelings of hopelessness, uselessness, unhappiness and
loneliness. In general, our study found that respondents have quite low self-
esteem and are generally lonely. These findings also show that, self-esteem and
loneliness are determined by the socio-economic, demographic and regional
variables existing in communities where older people live.
The socio-economic, demographic and regional variables affecting self-esteem
and loneliness amongst respondents pose significant challenges. Suffice to say,
they indicate inherent structural, social and economic differences existing
between the social strata in question. For example, people in rural areas have
very few choices to make in terms of entertainment. In fact, there is close to
zero entertainment facilities available in rural Zambia, explaining why elderly
people in rural areas report greater loneliness compared to urban areas. By the
same token, feeling useless comes about probably due to perceived definitions
of the elderly by society. Whereas society may feel obligated to ‗spare‘ old
people from certain important activities and assign them to ‗lesser ones‘, the
old may feel resigned to very low, unimportant activities. In some instances,
their roles are confined to caring for the very young and the sick and their
importance is only recognised when needed to perform functions considered
unimportant. For example, since there is superstition associated with funerals,
they are mostly relegated to older people and it is in such instances older
people‘s roles and opinions become important. These factors may not
satisfactorily explain the negative feelings. Some explanations provided through
the FGDs, confirmed the low self-esteem of the elderly, and this definitely
affects how actively they age. Low self-esteem is also at variance with the UN
principles on ageing since such a state does not support participation and to
some extent reduces the feeling of being a dignified member of society.
Other challenges, classified as socio-economic and environmentally driven and
which manifest themselves in low self-esteem were also reported extensively by
respondents in the study; they include access to work and opportunities

153
available for older people to work, challenges associated with care, living
arrangements, social contacts, material and monetary support and the burden
of orphan care and support.
Findings concerning work show that very few respondents were working or had
worked twelve months prior to the study with majority reporting that the main
reason for not working was due to their age. In this example, it is not unusual
to find people at this age not working. In fact, most of them, by Zambian
standards, would have reached retirement age. However, there is no data for
Zambia in this area to make intelligent comparisons and analysis. In the same
way, older people have very few or no opportunities for work. Implications of
this finding can be viewed from two perspectives. Firstly, if people cannot work
or have few or no opportunities to be employed, it means they will have less
access to income and this, therefore, builds more on the challenges they
already have. Secondly, the finding shows departure from the United Nations
stipulations where older people are expected to be given opportunities to work
and should, on their own also determine when to disengage from active
employment. Clearly, this is not the case in our study and certainly infringes
on active ageing principles.
On the other hand, the study found that access to income or availability of
income is very limited amongst older people. Ideally, apart from respondents
themselves, older people are expected, under normal circumstances, to be
helped financially by family members or spouses or indeed any member of
society. This, however, is not the case. In this example, very few (7 per cent)
respondents received income from children or relatives. This situation suggests
that there is some degree of erosion of traditional support systems for older
people in Zambia as well. In the same way, whereas other studies found that
spouses are reliable sources of income, it is not so in our study. In comparison,
it was found that close to half (47 per cent) of Thai married elderly women
reported that their source of income was their spouses; for married elderly
men, at least one in three (30 per cent) stated that spouses were their sources
154
of income (UNFPA, 2008). Similarly, while vulnerable people such as the elderly
receive what is called ‗elderly allowance‘ in middle income countries, there was
no evidence of this allowance in our study. In Zambia, the Ministry of
Community Development and Social Services has policies to provide income to
people they consider vulnerable. However, these policies seem inadequate and
probably not widespread. In any case, this again is a loadable contrast to other
studies where older people have elderly allowances (Knodel, 2008).
The socio-economic challenges investigated also involved looking at the quality
of living conditions of the elderly, especially their housing conditions. Findings
indicate that at least close to four in ten of respondents feel or felt their
housing unit was worse off compared to others. The comparison in question
may not be taken in isolation and is subject to many interpretations. However,
this may show levels of dissatisfaction amongst the elderly if and when they
compare their lives to those of their neighbours. It could be deduced that a
large number of elderly people in Zambia feel that their lives and lifestyles are
worse off compared to others in the same community. Subsequently, such
feelings affect their self-esteem and as a result, they do not age actively
contrary to United Nations Principles on Ageing.
Looking further at macro level or environmentally determined challenges facing
older people, it is a fact that most of them, if not all, have more to do with how
they are cared for, how they are living, how they are materially and socially
supported by family and friends, and also how they are coping given the socio-
economic environment prevailing. These factors contribute greatly to the
process of ageing and determine whether older persons would age actively or
not.
The Active Ageing Framework (WHO, 2002) and UN Principles on Ageing (UN,
1991) propose that support, opportunities for education and lifelong learning,
peace, and protection from violence and abuse, independence, participation
and self-fulfillment are key factors that can enhance a dignified ageing process.
These features may be enhanced if the elderly are cared for properly, live in

155
supportive and conducive environments, have health and frequent social
contacts with both family and peers and are able to cope with minimum
difficulty in the absence of support from families, institutions or well-wishers.
In terms of care, our study reveals that the family is still important in taking
care of older persons. This is also consistent with some of the studies
conducted in South East Asia where care for older people is still attached to the
family (Knodel, et al 2007). However, as for most developed countries, the
situation is different – care for older people is highly institutionalised (Low,
2002/2003). In the same way, the study has established that few (one in ten)
older people still live alone and the trend shows that the older one was or is,
the more likely that they were living alone. While it could be argued that the
proportion of older people living alone in our study is quite low comparatively,
it is, however, a little out of the ordinary for the ‗very old‘ (80+) to be staying
alone. In fact, in many African traditions, Zambia inclusive, the probability of
finding older people living by themselves is almost zero. Living alone could be
due to one‘s choice or one may have no children/relatives or in some cases
they may have been suspected of practicing witchcraft and, therefore, ‗forced‘
to live alone.
Another aspect investigated in our study was how older people interacted with
their peers, the community and the family. Interactions in this respect were
aimed at measuring social contacts. It is argued in literature and also amplified
by our conceptual framework – the Active Ageing Framework – that inadequate
social support is associated not only with an increase in mortality, morbidity
and psychological distress of older people but also decreases their general
health and well-being (WHO Active Ageing Framework, 2002: 28). What the
framework does not provide, however, is the definition of ‗inadequate social
support‘. Simply put, while it is accurate that social support is indispensable in
the active ageing process, it is not clear what really amounts to ‗adequate social
support‘. Interactions with close family members were average (38.6 per cent);
however, one striking finding suggests that contact or interactions between
156
children and their parents decreases with age. There seems to be no clear
explanation as to why this is so, however, it is possible that migration may be
playing a significant role, and it is also possible that as children age, they
consider their situations to be similar to their parents. Results also show that
frequency of interactions with peers decreases with increasing ages of
respondents. This could be due to mortality experiences within similar
cohort/s, leading to more isolation. Or simply, the dying of peers from the same
cohort necessarily engenders fewer contacts in that cohort and this may foster
more isolation for surviving members. These results indicate that there is/was
minimal interactions with their peers and to some extent their relatives and
children and this, may explain the low self-esteem they experience.
Another very important component of the challenges facing older people is
material support. It has been documented in this study and others as well that
support for older people has lessened in recent years. Undoubtedly,
respondents also confirmed that despite them being recipients of forms of
support, such is actually very minimal irrespective of the source. However, it
should be noted that rarely do people consider support in ‗kind‘ as really
support in reality. In fact, people consider monetary support to be appealing,
and when rendered, people easily refer to it. Similarly, it is possible that when
the question on support was asked, respondents were biased towards monetary
support rather than other forms available as well. The aforementioned
discussions are tentative and probably not very satisfactory; in our study
however, for whatever form of support, results show that it was minimal and a
possible source of low self-esteem.
Our findings indicate further that institutional support is almost non-existent
except for such provided by either the Church (20 per cent) or Community
Groups (10.2 per cent). Male respondents benefited more from institutional
support compared to females. The reason for this disparity is unclear, suffice to
mention, however, that it is possible that males may be more active in local
organisations or community programmes than females, or organisations could
157
be working on the basis of family involvement rather than individuals, and, due
to the cultural and traditional setting, males necessarily dominate. Differences
in education levels also (between males and females) give males better
information and opportunities, thereby getting more benefits compared to
females. Whatever the case, it is obvious that support by institutions is also
quite minimal and a source of concern in old age.
Another challenge investigated was in line with older people caring for orphans
and vulnerable children. Our study findings confirm what has been written
extensively in literature on the effects of HIV/AIDS on older people as well.
What is clear also is that the burden of orphan care, if not supported by other
means such as family or institutions, mostly works against active ageing, since
most times the carer is almost always stressed due to pressure to look after the
orphans. What we have seen in our discussion above is that older people have
quite little or no support and HIV/AIDS is just one other aspect exacerbating
their problems.
The absence of support from families, institutions or well-wishers has
inevitably forced some of the older people to engage in other survival strategies.
This reaction has also been supported by studies conducted in some other
African countries (Mutangadura, et al (eds.), 1999). In our study, older people
resort to begging (50 per cent), farming (29.7 per cent) as well as brewing illicit
or illegal alcohol or kachasu (20.2 per cent). Begging is a huge source of low
self-esteem because the act or procedure is also embarrassing especially for
older people. While there is nothing sinister about farming, brewing kachasu is
illegal but is considered one of the easiest forms of coping strategies. This is so
because brewing kachasu requires little amounts of capital and has readily
available customers. While it is difficult to place illicit alcohol brew within the
active ageing framework and the UN principles on ageing, it shows that given a
little more support, older people can survive on their own, and this may
encourage independence and self-reliance. It would be valuable to encourage

158
this self-entrepreneurship strategy to help older people cope with minimum
effort.
5.2.1 Lessons from Challenges on Ageing
A careful investigation of the findings in our study seems to suggest that the
major challenge in old age is having or experiencing low self-esteem and
loneliness.
Low self-esteem and loneliness are both functions of or are determined by
socio-economic, demographic as well as environmental factors present in
communities where older people are also part. However, individual
characteristics also play a significant role. Nevertheless, the data has shown
that individual variables or challenges are driven more by nature rather than
by outside or environmental factors. For example, older people suffer from a
number of health problems. Such challenges or health problems are mostly
determined by the biological make up of individuals affected, and not
necessarily by the socio-economic and environmental factors. Similarly,
functional limitations discussed in this study are mostly driven by the
physiology of the people concerned, much less by the environment. This
however, does not mean that outside variables have no effect on individual
challenges; for example, one‘s health is not only a function of biological factors
but the state of health facilities available and how accessible they are to older
people. It may also be a function of the quality of care given at those health
facilities. In any case, the point is, does the environment, socio-economic
opportunities etc., support or recognises special needs affecting older people?
Do people in communities give special attention to problems facing older
people?
From our data, answers to these questions suggest that very little effort is
made to ensure older people live independent, self-fulfilled and dignified lives.
But why do we suggest that low self-esteem and loneliness are the main
challenges facing older people and which inevitably lessens active ageing? The

159
argument is based on the assumption that challenges of a socio-economic,
demographic and environmental nature exacerbate low self-esteem and may
engender loneliness in general.
It is clear from our study that in general terms, communities or societies have
what may be classified as ‗negative‘ perceptions of older people; according to
society‘s observations, old age is synonymous with suffering. Older people are
perceived to be very difficult and are labeled as ‗wizards‘ or ‗sorcerers‘. Such
negative attitudes engender not only isolation and low self-esteem but
loneliness as well.
Other challenges also seem to help explain why low self-esteem and loneliness
seem to be prominent. The study has shown that older people cannot work or,
have very few opportunities for work. For example, on 31st January 2012,
Finance Bank Zambia Limited ran an advert soliciting applications from
qualified Zambians to fill positions of trainee managers. One of the
qualifications was for the candidate to be less than 30 years of age (The Post,
2012). This shows practically that opportunities for work for older people are
extremely slim. In any case, it could be argued that looking at their ages, older
people have passed their working time or have attained retirement. However,
who decides when to stop work? According to the United Nations Principles on
Ageing (1991), older people should be given opportunities to decide when to
disengage from the labour force without being forced, ignored or coerced.
Whether this requirement is considered or not is not subject to discussion
here. Further, majority of respondents have little or no income to support
themselves. They get very little support whether from families, communities,
government or non-governmental organisations. This means they cannot
adequately look after themselves. Such a condition may translate in low self-
esteem and to some extent loneliness and subsequently a significant hindrance
to active ageing.

160
For older people needing care, especially from family members, our data
suggest that such is very minimal and in some situations non-existent. This
further adds to the feeling of low self-esteem. In the same way, data also show
that there is little interaction between older people and other people within the
same communities. In fact, there is also quite little interaction between older
people themselves. This suggests, therefore, that older people live very lonely
lives which do not support active ageing. Our conclusions therefore that low
self-esteem and loneliness seem to be the major challenges at individual level
are well supported.
Apart from these shortcomings and challenges, older people are also bearing
the burden of taking care of orphans and vulnerable children. They have, in
some cases been reported to be looking after other sick relatives – especially
their adult children (Mutangadura et al 1999) – some of whom have actually
died. These aspects explain why they have low self-esteem and are lonely and
hence a minus to the active ageing process.
In concluding this section, it is clear from revelations above that individual
challenges as well as those driven by the socio-economic situation explain the
low self-esteem and loneliness experienced among older people in general.
While individual factors have a lot to offer in determining low self-esteem and
loneliness, our findings also show that in fact, low self-esteem and loneliness
are highly determined by socio-economic, demographic as well as
environmental factors. In other words, external factors seem to affect older
people more negatively compared to individual factors.
As such, as long as there is no work for older people, little or no opportunities
for work, little or no care, little or no support, accusations of witchcraft and
generally negative attitudes towards older people, then older people will almost
always have very low self-esteem of themselves and will spend much of their
remaining lives lonely and even miserable in some situations; certainly, this
will not ‗add life to the years that have been added to life‟ (UN 1991; Resolution
161
no. 46/91) and will not promote active ageing (WHO, 2002) in general, contrary
to the wishes of the world as a whole and older people in particular.
5.2.2 What Really Determines Active Ageing in Zambia?
It has been observed in this discourse that while issues on challenges have
been outlined extensively, they only contribute indirectly to the Active Ageing
Framework proposed and used in this study. However, what exactly determines
active ageing in Zambia currently, notwithstanding the challenges discussed
already. Our findings have indicated that active ageing in Zambia is affected by
culture, personal or behavioural determinants, health and functional
determinants, economic determinants and also by HIV/AIDS as a determinant.
The Active Ageing Framework proposes that active ageing is affected and
determined by a wide range of factors which include – Culture and Gender,
Economic, Personal and Behavioural, Social, Physical Environment and Health.
Our study however proposed that in addition to the forgoing, Africa in general
and Zambia in particular is faced with problems of HIV/AIDS and older people
are faced with this challenge and therefore is also a potential determinant of
active ageing. In addition, it should be pointed out that we purposively selected
those determinants we thought were commensurate with the Zambian
situation; in this regard therefore, we thought that the context in which
Physical and Environmental Determinants are discussed in the Active Ageing
Framework does not reflect the Zambian context and maybe too ambitious an
adventure, otherwise everything else remained the same.
Our study has revealed that Gender is not a factor as far as active ageing is
concerned; this is a departure from several other studies as well as the active
ageing framework; it has been observed that ageing is a gendered agenda and
one‘s sex determines one‘s active ageing process. The reason for this finding is
unclear; however, it is possible that much or most of the challenges reported by
older people in our study have no significant difference whether they be
experienced by males or females. On the other hand, culture is a significant
factor on active ageing; and this also confirms propositions by the active ageing

162
framework as well as already existing literature (Knodel, 2008; Sugiswawa et al
1994; WHO, 2000).
In terms of other determinants, our data has shown that economic
determinants are only significant in terms of actual ―income‖ gained by older
people. In other words, in the Zambian context, while the presence of economic
determinants are well articulated, the relationship only exists on whether or
not older people have access to income – this is the main factor that is or was
statistically significant as far as economic determinants are concerned. This
outlook may indicate the need to promote policies that help older people have
access to income. In the same way, social determinants influence active ageing
through peer interactions as well as having a caretaker. This finding is
consistent with the active ageing framework and other studies as well. For
example, Wilkinson (1996) found that older people who interact with peers
were more likely to live longer (2.5 times as likely) compared to those who never
interact. This finding was also highlighted by Sugiswawa (1994) in Japan.
Health and functional abilities affect active ageing. In this respect, our study
found that long term health conditions may affect active ageing more as
opposed to short term health challenges. This factor is also well articulated by
the framework where it is recommended that to understand this aspect, a life
course approach is necessary to help understand with certainty effects of
health challenges on active ageing. In terms of functional abilities, only
indicators of ―ability to squat and ability to clean one‘s house‖ affect active
ageing significantly. This finding maybe unique to Zambia since so far, there
seems to be no study or studies that have found with certainty the effect of
these two functional limitations on active ageing. The closest this comes to
were results obtained by Knodel (2008) where it was found that some older
people in Thailand were unable to ―squat or clean their housing units‖.
However, there were no statistical tests to establish whether this finding was
significant and whether this relationship was linked to the active ageing
framework. On the other hand, personal and behavioural determinants were
found to be affecting active ageing significantly. These determinants manifested

163
themselves through low self-esteem; that is feeling ―hopeless and useless‖. This
finding is also consistent with already existing literature. In their press release
entitled: ―preventing loneliness and isolation in adulthood‖ Gironda et at (In
Press) found that older people reported very low self-esteem of themselves
manifested through ―feeling lonely, hopeless, useless and unhappy‖. Our
results show categorically that feeling hopeless and useless are effective
determinants of active ageing.
It has been observed consistently in this study that HIV/AIDS is not only a
challenge in old age but also a unique determinant of active ageing in Zambia
and countries with a generalized HIV/AIDS pandemic. Our study proposed that
the active ageing framework, in its current form was not sufficient to explain
problems faced by older people in countries such as Zambia. In view of this, we
proposed to add, in addition to the determinants proposed in the framework,
HIV/AIDS as a major determinant of active ageing. Results show that indeed,
HIV/AIDS is a significant factor in determining active ageing. These results are
not only consistent with literature on ageing and AIDS, but also value addition
to studying ageing. This, we believe is an additional aspect contributing to
studies on ageing in general and to the determinants of active ageing proposed
by the WHO Active Ageing Framework specifically.
5.3 Active Ageing and the Family – The Zambian Context
This study has shown that the number of older people has been increasing
steadily over the past few years and will increase much faster in the next
couple of years. It is also true that active ageing is determined by several
factors as well as several challenges, both at individual and socio-economic and
environmental levels. These challenges are taking place at a time when there is
very little care and support from families, communities and government.
Consequently, the challenge of ageing is here to stay and if no adequate
interventions are designed, older people will continue facing most of the
problems discussed here. In fact, we anticipate that challenges older people are
facing will become even more pronounced in the near future due to the fact

164
that the number of older people is likely to be double the current one. Given
this background, this study examined the draft policy on ageing and also
through literature review, discussed some of the policies and programs that
may have some inclination, directly or indirectly on ageing.
Clearly, there is a linkage between challenges faced by older people in our
study and the draft policy on ageing currently available in Zambia. However, It
is also true that a policy on ageing which will help promote or incorporate
economic determinants (such as income generating), personal and behavioural
determinants (such as those promoting self-esteem), health and social
determinants (such as those promoting health ageing as well as family and
peer interactions) will be instrumental in promoting general active ageing in
Zambia. This component in the draft policy on ageing is quite or silent. In
addition, some programmes reviewed through our literature such as Public
Welfare Assistance Schemes, Social Cash Transfer Schemes etc do provide
services aimed at promoting active ageing, however, they are limited in
application and are highly unsustainable because they depend on hand outs.
In addition, Zambia‘s economy has also not grown to a level where it can
sustain these programmes.
As a result, there is need to have a paradigm shift in as far as planning and
looking after older people is concerned. This paradigm shift will require
emphasis on the role and importance of the family in taking care of older
people – this we believe will help in the interim to promote active ageing and
alleviate most of the challenges reported by older people. The proposed
paradigm shift should also be anchored in the policy on ageing.
In light of the proposal to have a complete paradigm shift to ensure the family
takes center stage, we make deliberate efforts to analyse and interpret aspects
of ageing and the family in light of the Zambian context and as determined by
findings in this study. We take this approach because studies in Africa and
other parts of the world attribute certain challenges older people are facing to
165
changes brought about by urbanisation, secularisation, modernisation and so
on and so forth (Aboderin 2004). Nonetheless, our data gave a different
perspective. Findings from our study suggests that in fact, communities and
families in Zambia are still intertwined through natural as well as traditional
codes. This again departs from what has been established by other studies
where traditional roles of families in taking care of their older relatives is
eroding or diminishing (Abiodum et al 2003). We also take this approach
because results on determinants of active ageing can best be handled at family
level in the short term while taking cognizant of the role of government and
other stakeholders in the long term. We feel the family is cardinal in helping
older people resolve income problems, interaction challenges, helping with
household chores, helping in uplifting their self-esteem by continuous
assurances that they (older people) are ―not useless and not hopeless‖. The
family is also very instrumental in terms of looking after orphans thereby
mitigating the impact of HIV/AIDS on the active ageing process.
The current study has shown that while there are several aspects determining
the active ageing process, active ageing in Zambia could greatly be influenced
and enhanced by the socio-economic status of immediate family members,
especially if they work or have steady sources of income – which income they
may share with their older relatives (economic determinant). This contention is
premised on the understanding and also findings discussed earlier where filial
loyalty and support for the elderly are not necessarily diminishing due to
reasons outlined and debated widely in literature (urbanisation,
secularilisation, westernisation etc.). In Zambia, there are strong adages
prominent amongst almost all tribal or linguistic groupings that explain the
importance of care for older people by the family. Some of them state as
follows:
„Ngulelenu nayami nawa nanguka kulela‟ (Luvale)
„Amuniute nina nika miuta‟ (Lozi)
„Mayo mpapa naine nkakupapa‟ (Bemba)

166
Directly translated as:
„Mother or father, aunt or grandparent, “carry me now” or “take care of me” and I
will do the same one day‟.
These saying attest to the fact that filial loyalty towards the elderly, especially
close relatives like mothers and fathers is still actively present. While findings
suggest that support rendered to older people by family members is quite
minimal, this in itself suggests or is indicative of people‘s willingness to support
and care for their relatives. Suggestions that filial loyalty in Africa and several
other countries including Zambia is losing ground are only correct to a certain
extent. However, while some studies have attributed this downfall to many
factors (e.g. changes in the perceptions of ageing, western influences,
diminishing extended family ties, urbanisation, women entry into the labour
force, migration and secularisation etc) (Abiodum et al 2003), this study has
established that support for older people, especially from close relatives, is
influenced by the well-being of younger relatives such as children and also by
their ability to render such support – a view also reflected by Macwan‘gi et. al
(1997) in their study of ―consequences of rural-urban migration on support for
the elderly in Zambia‖.
In the same way, other paradigms aimed at helping older people have been
suggested. For example, the UN Principles on Ageing propose that for people to
age actively, there is need to help them continue working as well as ensuring
they continue participating in family activities (Economic Determinant). The
principles in question also advocate for older people to continue being on social
protection programmes, supported by individual governments. While ideas to
ensure older people continue working and also continue getting the necessary
training and be given more opportunities for re-training so as to support them
age actively are well intended, this aspiration may be farfetched and may prove
difficult, almost impossible to be supported by developing economies like that
of Zambia. For example, public social protection mechanisms like homes for
the aged are highly underdeveloped in most developing countries and there is

167
no evidence of improvement, at least not in the near future. As a result, these
measures may not work as expected or as efficiently as what currently obtains
in more developed economies.
While the proposal to enable older people to continue working is attainable to a
certain extent, there is a limit to which older people can work continuously.
This is because as people age – not all of them but majority – they become
constrained to perform some functions. This assertion is further exacerbated
by beliefs that older workers are less suited to demands of the modern
workforce and, therefore, discriminated against (De Vos, et al 2005).
Debate on this subject has continued; in fact several countries in the Euro
zone and the Americas have in the past decades been increasing retirement
age. These measures have of course been met with serious resistance from the
citizenry who feel retirement age should remain where it is (Low, 2002/2003).
Debates on proposals to enable older people continue working have also
spiraled towards developing countries with the government of Zambia already
proposing to increase the retirement age from the current 55 years to 65. This
again has been received with mixed feelings, with certain sections of society
expressing serious reservations.
However, for older people to continue working, they will require among other
things, training and retraining so as to have the necessary new skills
applicable to demands of modern industry. This paradigm has, however,
produced less desired results due to the fast pace at which new technologies
and labour market fundamentals have moved, rendering such training
inadequate as some or most of the target audience – older people – have not
adapted as quickly as possible to these demands and requirements. For
example, in a paper entitled ‗Workforce Ageing: Challenges for the 21st Century
Management‘, Patrickson et al (2004) state that there are new and competing
skills in demand in consequence of technological advances, and that there are
conditions under which employment for older workers could be maintained.
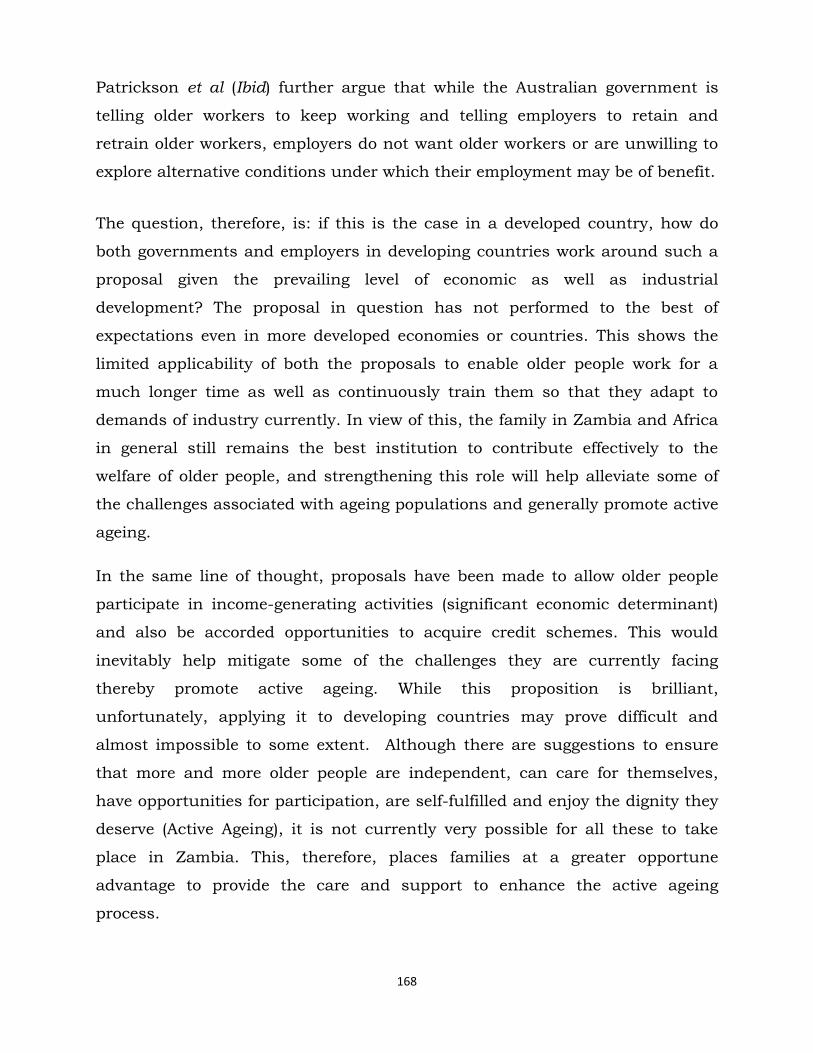
168
Patrickson et al (Ibid) further argue that while the Australian government is
telling older workers to keep working and telling employers to retain and
retrain older workers, employers do not want older workers or are unwilling to
explore alternative conditions under which their employment may be of benefit.
The question, therefore, is: if this is the case in a developed country, how do
both governments and employers in developing countries work around such a
proposal given the prevailing level of economic as well as industrial
development? The proposal in question has not performed to the best of
expectations even in more developed economies or countries. This shows the
limited applicability of both the proposals to enable older people work for a
much longer time as well as continuously train them so that they adapt to
demands of industry currently. In view of this, the family in Zambia and Africa
in general still remains the best institution to contribute effectively to the
welfare of older people, and strengthening this role will help alleviate some of
the challenges associated with ageing populations and generally promote active
ageing.
In the same line of thought, proposals have been made to allow older people
participate in income-generating activities (significant economic determinant)
and also be accorded opportunities to acquire credit schemes. This would
inevitably help mitigate some of the challenges they are currently facing
thereby promote active ageing. While this proposition is brilliant,
unfortunately, applying it to developing countries may prove difficult and
almost impossible to some extent. Although there are suggestions to ensure
that more and more older people are independent, can care for themselves,
have opportunities for participation, are self-fulfilled and enjoy the dignity they
deserve (Active Ageing), it is not currently very possible for all these to take
place in Zambia. This, therefore, places families at a greater opportune
advantage to provide the care and support to enhance the active ageing
process.

169
In view of what has been discussed so far, it is clear that the family in Africa,
and Zambia in particular will continue playing a fundamental role in as far as
active ageing is concerned. This is so in view of what has been discussed as
well as findings on the major determinants of active ageing in Zambia. While
the importance of paradigms used before and elsewhere such as allowing older
people to continue working, retraining etc. cannot be over emphasised, it is
clear from literature that they have not performed to produce expected results.
This study has demonstrated that filial loyalty in Zambia is evident and as
result, traditional support systems for older people are still intact and can be
explored for better. Moreover, even where influences of urbanisation, migration,
secularisation etc are visible, it is our view that such influences had or have
not destroyed the interconnectedness of extended family systems – especially
for close relations such as children and their parents in Zambia. Therefore,
families are failing to look after or support older people due to their constrained
socio-economic status and not that they are unwilling. In the same way, it is
also clear that relying on government or other institutions or organisations to
continuously support not only older people but other vulnerable groups is not a
sustainable approach so far since the models used have been based on
providing handouts. In fact, the first republican president of Zambia once said:
„The idea that the state or some voluntary organisation or agency should look after
older people is anathema to Africa‟ (Kaunda, 1976)
The family therefore should be encouraged and empowered to continue playing
its traditional role while governments or other institutions work on modalities
of strengthening family value systems and where possible continue providing
opportunities and an environment where the family will survive better. In this
example, the policy on ageing should have aspects of family strengthening into
account so as to encourage and empower families look after older people. For
example, opportunities for work and other income generating activities should
readily be available to families. This is a more sustainable approach to help
mitigate some or most of the problems older people are facing and in the long
run, encourage to a certain extent, the much talked about active ageing.

170
It is important to emphasise that the role of the family in Africa and Zambia in
particular will remain extremely important for a long time to come. And the
policy on ageing should reflect this important aspect. The data has also
demonstrated that no child would want to see their parents suffer if they are
able to help. As a matter of fact, Cadwell (1976) and De Lancey (1990) also
found that across generations in Africa, younger people support older
generations; this enhances further the ‗Mayo mpapa naine nkakupapa‘, or
„Ngulelenu nayami nawa nanguka kulela‟ or „Amuniute nina nika miuta‟ adage.
In view of this conclusion, it is our considered perspective that the need to
provide opportunities to both older and younger generations, as well as
ensuring families continue cultivating their noble traditional role of caring and
looking after older generations, and thereby help promote active ageing cannot
be over-emphasised.
5.4 Conclusion
The population of Zambia, like global and regional populations, is undergoing
unprecedented experiences of ageing. While Zambia may not be classified as
an ageing country due to its youthful population, the process has already been
initiated, and the absolute number of people aged 60 and above is growing
tremendously. The question is, „What should be done about this situation?‟ This
study has highlighted and provided evidence of most of the challenges older
people are facing currently in Zambia. However, this is only a ‗tip‘ of what they
may face in the absence of a decisive and active policy on ageing.
The study has also interpreted provisions of the Active Ageing Framework using
data from a developing country. While the framework provides adequate
information on the tenets of active ageing, the aspect of empowerment of people
that take care or support the elderly (especially in Zambia and Africa) should
be strengthened so that the family takes center stage.
171
In addition, while erosion of filial loyalty is attributed to influences brought
about by migration, urbanisation, secularisation, etc. to mention but a few,
this study re-enforces the fact that filial loyalty is ‗an indelible mark‘ for many
Zambians, and where resources are available, people and families would
endeavor to take care of their elderly relatives – especially those of a very close
relation. Nevertheless, erosion of filial loyalty in the Zambian context is not due
to westernisation or urbanisation or migration per say, it is instead a function
of one‘s ability to support older relatives.
This study has further demonstrated that the main determinants of active
ageing in Zambia are income accessibility (Economic Determinant), functional
limitations (Health Determinants), low self-esteem and loneliness
(Personal/Behavioural Determinants), low family and peer interactions (Social
Determinants) and HIV/AIDS. This therefore requires a thorough reflection of
these tenets in the policy on ageing to promote active ageing in general.
On the other hand, evidence from a detailed examination of the draft policy on
ageing as well as other policies and programmes shows that there is no
pragmatic commitment in addressing ageing altogether. The main challenge
has been the inadequacy of operationlisation of most of the recommendations
of aligning both UN Principles on Ageing (1991) and the Active Ageing
Framework (2002). Undeniably, there are responses to ageing in general, but
almost no strategy in place to achieve or strengthen the responses. Putting it
succinctly, the draft policy on ageing has not been put into practice to reflect
recommendations stipulated by the United Nations and also ratified by the
Government of the Republic of Zambia.
Research on ageing in Zambia is limited. What this study has brought to
demography and population studies discipline – using data from Zambia – is
evidence upon which other more focused studies could be based. The need to
promote studies that will help understand dynamics of family relations and
how they can be strengthened to support active ageing cannot be over-
emphasised. While many Zambians agree that development is cardinal, it is

172
also important to state that an agenda that emphasises the importance of one
group of individuals over others may not necessarily achieve the intended
development.
5.5 Future Research Areas
In order to study ageing comprehensively and appreciate the contribution of
each of the mentioned or studied determinants on active ageing in general, this
study proposes a few areas of concentration:
- To effectively tackle the effects of the determinants of active ageing on the
ageing process, and using the 2002 Active Ageing Framework, a
longitudinal study on ageing is required. This is so because effects of
some of the determinants may not be understood or take effect over a
short period of time. They require a longer period of observation rather
than based on a one-time-exploratory study as has been the case with
the current study; and secondly,
- Conduct a study or studies that will help understand dynamics of family
relations and how they can be strengthened to support active ageing over
a longer period;
- In the Zambian context, Gender seems to be a non-factor as far as active
ageing is concerned; studies elsewhere have demonstrated that ageing is
a gendered agenda and that it is also one of the over-arching
determinants of active ageing. It will be critical to formulate detailed
studies that may help explain why gender is not a factor on active ageing
in Zambia; and
- At National level, indicators on ageing should be part and parcel of
surveys such as DHS and other surveys; this will help document issues
on ageing and the changes that come as a result. This will undeniably
continue enriching literature on ageing and thereby contributing
routinely to both policy formulation/adjustment and/or implementation.
173
REFERENCES
United Nations. 2007a. United Nations Expert Group Meeting on Social and
Economic Implications of Changing Population Age Structures. Mexico
City: 31 August – 2 September 2005. (ESA/P/WP.201).
United Nations. 2007b. World Population Prospects: The 2006 Revision, vol. I,
Comprehensive Tables, Sales No. E.07.XIII.2; and vol. II, Sex and Age
Distribution of the World Population, Sales No. E.07.XIII.3.
United Nations. 2009a. World Marriage Data 2008, CD-ROM
(POP/DB/Marr/Rev2008).
United Nations. 2009b. World Population Prospects: The 2008 Revision. CD-
ROM Edition - Extended Dataset in Excel and ASCII.
Asghar Zaidi and Aaron Goerge. Grech. (2007). Pension Policy in EU25 and its
Impact on Pension Benefits - The Journal of Poverty and Social Justice,
15(3): 229-311.
Abiodum Fayankinnu Emmanuel, and Adunola Fayankinnu Adeyemi Adunola.
(2003). Changing pattern of care and support for the aged living in
Akungba-Akoko Nigeria. Nigeria.
Aboderin, Isabella. (2004). Decline in material family support for older people in
urban Ghana, Africa: understanding processes and causes of change. UK:
Institute of Ageing, University of Oxford.
Ann Bowling. (2002). Research methods in health: investigating health and
health services. New York: Open University Press.
Anna Toner. (2007). Grains from Grass: Aging, gender and famine in rural
Africa. Ithaca, NY and London: Cornell University Press, 2005. xvii + 224
pp.
Assis, M.M.B., Domingo, L., Knodel, J., & Mehta, K. (1995). Living
arrangements in four Asian Countries: A comparative perspective. Journal
of Cross-Cultural Gerentology, 10.

174
Barrientos, A., Gorman, M., and Heslop, A. (2002). Old age poverty in
developing countries: Contributions and dependence in later life. World
Development, 31(3), 555-570.
Belsey, Mark A. (2005). Aids and the family: policy options for a crisis in family
capital: New York; United Nations, Department of Economic and Social
Affairs; p170.
Beckett M, Weinstein M, Goldman N, Yu-Hsuan L. (2000). Do health interview
surveys yield reliable data on chronic illness among older respondents?
American Journal of Epidemiology; 151(3):315-323.
Binswanger, M (2000). Stock returns and real activity in the G-7 countries: did
the relationship change in the early 1980‘s?. University of applied sciences
of North-Western Switzerland.
Black-Michaud, A. (1997), Impact du VIH/SIDA sur le système de production
agricole et l‘environnement rural au Burkina Faso et Côte d‘Ivoire, FAO,
Rome.
Burgess, E.W. (ed). 1960. Ageing in Western Societies. Chicago: University of
Chicago Press.
Burgess, E.W. and Locke, H.J. (1954). The Family. New York: American Book
Company.
Caldwell J C .(1976a). Fertility and the household economy in Nigeria. Journal
of Comparative Family Studies 7: 193–253.
Caldwell, J.C. (1976). Toward a restatement of demographic transition theory.
Population and Development Review , 4(4), 579–616.
Case, A., and Deaton, A. (1998). Large cash transfers to the elderly in South
Africa. The Economic Journal, 108, 1330-1361.
Cliggett, Lisa, George Alter, and Mubiana Macwan'gi. (1996). ―Consequences of
Rural-Urban migrations on support for the elderly in Zambia.
Bloomington, Indiana: Population Institute for Research and Training.
Working Paper 97-1.
Cliggett, Lisa. (1997c). ―My Mother's Keeper: Changing Family Support Systems
for the Elderly in Eastern Africa, edited by D. Parkin. London: Oxford
University Press Edition. London: Macmillan Press.

175
Colson, Elizabeth, Thayer Scudder. (1975). ―New Economic Relationships
between the Gwembe Valley, Zambia‖ at the Department of Anthropology,
Bloomington, Indiana.
Cowgill, D.O. (1986). Ageing around the World. Belmont California: Wadsworth
Cowgill, D.O. and Holmes, L. (1972). Ageing and Modernisation. Appleton-
Century-Crofts. New York, Enriquez, V.G., ed -1990. Indigenous
Psychologies, Psychology Research and Training house, Quezon City.
Craib, I. (1997). Classical Social Theory. Oxford: Oxford University Press.
Crohan, S. E., & Antonucci, T. C. (1989). Friends as a source of social support
in old age. In Adams, R. G. & Blieszner, R. (Eds.), Older adult friendship:
Structure and process. Newbury Park, London: Sage Publications.
CSO, MoH, TDRC, UNZA and Macro International Inc. (2009). Zambia
Demographic and Health Survey. Calverton, Maryland, USA: CSO and
Macro International Inc.
Draft Policy on Ageing (2009)
De Vos, A, Buyens, D & Schalk, R. (2005). ‗Making Sense of the New
Employment Relationship: Psychological Contract-Related Information
Seeking and the Role of Work Values and Locus of Control‘, International
Journal of Selection and Assessment, 13, 41-52.
DeMaris, Alfred. (1995). Using and interpreting logistic regression: a guide for
teachers and students. Bowling Green State University.
Department of Work and Pensions (DWP) (2005): Older people in low-income
households.
Department of Social Welfare (1990). Ministry of Culture
Duflo, E. (2000). Grandmothers and granddaughters: Old-age pensions and
intrahousehold allocation in South Africa. World Bank Economic Review,
17(1), 1-25.
FAO (2004). State of food insecurity in the world. Monitoring progress towards
the World Food Summit and Millennium Development Goals. Food and
Agriculture Organization of the United Nations Viale delle Terme di
Caracalla, 00100 Rome, Italy.

176
FASAZ/FAO (2003); Interlinkages between HIV/AIDS, Agriculture Production
and Food Security; Baseline Report - Southern Province, Zambia.
Fifth National Development Plan (2005 -2011)
Fraenkel, J. R., & Wallen, N. E. (2003). How to design and evaluate research in
education (5th ed.). Boston: McGraw Hill.
Free Internet Encyclopedia. (2008). Ageing.
Gall, M. D., Gall, J. P., & Borg, W. R. (2003). Educational Research: An
Introduction (7th ed.). Boston: Allyn & Bacon.
George, L.K. (1990). Vulnerability and Social Factors. In Z. Harel, P.Ehrlich,
and R. Hubbards: Understanding and Serving vulnerable older Adults and
Aged. New York: Springer.
Goldfield, T. (2005): Wealth of the Nation 2005. Brighton: CACI
Goldstein, M, S. Schular and J.L. Ross. (1983). 'Social and Economic Forces
Affecting Gwembe Valley and the Line of Rail‖ Pp. 190-210 in Town and
Country in Central and Southern Africa.
Gorman, M. (2002). Global ageing: The nongovernmental organization role in
the developing world. International Journal of Epidemiology, 31, 782-785.
Grundy, Emily (1996). Population ageing in Europe. In Europe‘s Population in
the 1990s, David Coleman, ed. New York: Oxford University Press.
Haddad L. & Gillespie S. (2001). Effective food and nutrition policy responses to
HIV/AIDS: what we know and what we need to know. Journal of
international development; 13(4)4:487-511.
Health Reform Policy Framework (1991)
HelpAge International. (2000). Ageing issues in Africa: A summary. London,
England: Author.
HelpAge International. (2003). HIV/AIDS and ageing: A briefing paper. London,
England: Author. Available: 20AIDS%20position%20paper.pdf [accessed
December 2004].
HelpAge International. (1999). The Ageing & Development Report. London:
HelpAge International.

177
Hofman A, Grobbee DE, de Jong PT, van den Ouweland FA.(1991)
Determinants of disease and disability in the elderly: The Rotterdam
Elderly Study. Eur J Epidemiol ;7:403–22.
Hosmer, David. W. and Stanly Lemeshow. (1989). Applied Logistic Regression.
New York: Wiley and S. H. Preston, eds. Washington, D. C.: National
Academy Press.
ILO/EASMAT. (1997). Labour statistics based on administrative records:
Guidelines on compilation and presentation. Bangkok: ILO Publications.
Indiana University Institute for Research and Training. (2007).
Intergenerational Relations in Extended Families in a Third World
Country: A Cautionary Tale from South Asia', Journal of Gerontology,
Volume 38 (6), pp716-724.
Isabella Aboderin. (2004). Modernization and ageing theory revisited: current
explanations of recent developing world and historical Western shifts in
material family support for older people. UK: Cambridge University Press:
Ageing and Society 24, 29-50.
Japanese Organization for International Cooperation in Family Planning.
JOICFP's 4-year plan embodies spirit of Cairo. JOICFP News, 1996(266):4.
Jitapunkul, Sutthichai, Napaporn Chayovan & Jiraporn Kespichayawattana,
(2002). Chapter 6: National Policies and Long Term Care of Elderly in
Thailand. In Ageing and Long-Term Care: National Policiesin the Asia
Pacific.
David R. Phillips and Alfred C. M. Chan (2002) Singapore Institute of Southeast
Asian Studies, pp. 181-213.
John R. Weeks. (2004). Population: An Introduction to Concepts and Issues.
USA: Wadsworth, Thomson Learning, Inc.
Johnson, T.E. (1997). Genetic Influences Ageing. Experimental Gerontology,
32, 11-22
Kahn, K., and Tollman, S.M. (1999). Stroke in rural South Africa: Contributing
to the little known about a big problem. South African Medical Journal,
89(1), 63-65.

178
Kahn, K., Tollman, S.M., Garenne, M., and Gear, J.S.S. (1999). Who dies from
what? Determining cause of death in South Africa‘s rural northeast.
Tropical Medicine and International Health, 4, 433-441.
Kalasa, Benoît. (2005). Population and ageing in Africa: a Policy Dilemma?
Addis Ababa, Ethiopia: UNFPA/Country Support Team
Kamwengo, Martin. (2001). Ageing and the elderly in Zambia: Perspectives and
Issues. New Delhi, India: Sterling International.
Kamwengo, Martin. (2004). Growing old in Zambia: Old and New Perspectives.
New Delhi, India: Sterling International.
Kaunda (1976). Address to the state – State of the Nation.
Katele Kalumba (1997). Health Reforms in Zambia – A Ministry Perspective
Kevin Kinsella and David R. Phillips, ―Global Aging: The Challenge of Success,‖
Population Bulletin 60, no. 1 (Washington, DC: Population Reference
Bureau, (2005). For permission to reproduce portions from the Population
Bulletin, write to PRB, Attn: Permissions, or [email protected].
Knodel, John & Chanpen Saengtienchai. (2007). Rural Parents with Urban
Children: Social and Economic Implications of Migration on the Rural
Elderly in Thailand. Population, Space and Place 13(3):193- 210.
Knodel, John, Chanpen Saengtienchai and Walter Obiero (1995). Do small
families jeopardize old-age security? Evidence from Thailand. Bold, vol. 5,
No. 4, pp. 15-19.
Knodel, John, Napaporn Chayovan and Siriwan Siriboon. (1992b). The impact
of fertility decline on familial support for the elderly: an illustration from
Thailand. Population and Development Review 18(1): 79-102
Knodel, John and Napaporn Chayovan. (2008). Population Ageing and the Well-
Being of Older Persons in Thailand: Past Trends, Current Situation and
Future Challenges. UNFPA Thailand and Asia-Pacific Office, Bangkok.
Kohara and Ohtaka. 2004. ???
Kuate-Defo, B. (1998). Enquête sur vie familiale, sexualité et santé reproductive
au Cameroun (EFSR) 1996-1997: Collecte et exploitation des données de
Bandjoun. Yaoundé/Montreal, EFSR-FRHS Working Paper Series No. 3.

179
Kuate-Defo, B. (2005). Facteurs associés à la santé perçue et fonctionnelle des
personnes âgées d‘Afrique avec référence au Cameroun. Cahiers Québécois
de Démographie, 34(1).
Kuate-Defo, B., and Lepage, Y. (1997). Enquête sur vie familiale, sexualité et
santé reproductive au Cameroun (EFSR) 1996-1997: Méthodologie de
sondage. Yaoundé/Montreal, EFSR-FRHS Working Paper Series No. 2.
Leinonen, R., Heikkinen, E., and Jyhhä, M. (1998).
Kuate-Defo, Barthelemy. (2006). Interactions between socioeconomic status
and living arrangements in predicting gender-specific health status among
the elderly in Cameroon in National Research Council. (2006). Aging in
Sub-Saharan Africa: Recommendations for Furthering Research. Panel on
Policy Research and Data Needs to Meet the Challenge of Aging in Africa.
Barney Cohen and Jane Menken, Eds. Committee on Population, Division
of Behavioral and Social Sciences and Education. Washington, DC: The
National Academies Press.
Laslett, Peter. (1996). A Fresh Map of Life. The Emergence of the Third Age.
Lesthaeghe, Ronald (2004). Europe‘s demographic issues: fertility, household
formation and replacement migration. Population Bulletin of the United
Nations, Special Issue Nos. 44/45 (Sales No. E.02.XIII.4).
Linda Low. (2002/2003). Social protection in the ‗new‘ Economy. Singapore:
National University of Singapore.
Madrid Plan of Action Report (2002)
Margaret Patrickson and Rob Ranzijn (2004). Workforce ageing: the challenges
for 21st century Management. International Journal of Organisational
Behaviour, Volume 10 (4), 729-739
Martin, Linda (1990). The status of South Asia's growing elderly population.
Journal of Cross-Cultural Gerontology, vol. 5, No. 2, pp. 93-117.
Medicare Board of Trustees Report. (2003). Status of the social security and
Medicare Program. USA: US Gov.
Mercedes B. Concepcion. (1987). The elderly in Asia, in Population Ageing:
Review of emerging issues. Asian population studies series. Bangkok: UN
Economic and Social Commission for Asia Pacific, pp.21-32

180
Midgley, James. (1984). Social security, inequality and the third world.
Chichester: John Wiley: Migration on Support for the Elderly in Zambia.‖
Bloomington, Indiana: Population
Ministry of Community Development and Social Services (2010). Ministerial
Briefs
Mutangadura, G; Jackson, H & Mukurazita, D (eds.) (1999) AIDS and African
Smallholder Agriculture, Southern African AIDS Information
Dissemination Service (SAFAIDS), Harare
Namakando Phiri. (2004). A Phenomenological Study of Ageing amongst the
older persons in Zambia. PhD Dissertation. South Africa: University of
South Africa, Department of Health Studies.
National Health Strategic Plan – Zambia (2006-2010)
National Employment and Labour Market Policy (2004)
National Research Council. (2001). Preparing for an aging world: The case for
cross-national research. Panel on a Research Agenda and New Data for an
Aging World, Committee on Population and Committee on National
Statistics. Division of Behavioral and Social Sciences and Education.
Washington, DC: National Academy Press.
Office of Management and Budget. (1991). Old Age Insurance Report. USA. US
Government.
Ogg, J. (2005): Social exclusion and insecurity among older Europeans: the
influence of welfare regimes. Ageing & Society, vol. 25: pp. 69-90.
Ogbera, A.O. (2009). Clinical features, predictive factors and outcome of
hyperglycaemic emergencies in developing countries. BMC Endocrine
Disorders 9(9).
Olivier (2004) ???
Paul Johnson. (1997). Fiscal Implications of population ageing, in Philosophical
Transactions: Biological Sciences, Vol. 352, No. 1363, Ageing: Science,
Medicine, and Society, pp. 1895-1903
Palloni, A., Pinto-Aguirre, G., and Pelaez, M. (2002). Demographic and health
conditions of ageing in Latin America and the Caribbean. International
Journal of Epidemiology, 31, 762-771.

181
Population Policy. (2008). Revised Version. Lusaka: Government of Zambia
Population Policy. (1989). Lusaka: Government of Zambia
Population Reference Bureau. (2005). World population data sheet 2005.
Washington, DC: Author.
Powell, J.L. (2005). Social Theory and Ageing. Rowman and Littlefield: Lanham
Pullan,B. (1996). Charity and poor relief in early modern Italy. In Charity, self-
interest and welfare (ed. M. Daunton). London: University College Press.
Research Agenda on Ageing – 21st Century. 2007.
Restrepo, H., and Rozental, M. (1994). The social impact of aging populations:
Some major issues. Social Science and Medicine, 39(9), 1323-1338.
Roebuck J. (1979). When does old age begin?: the evolution of the English
definition. Journal of Social History. 12(3):416-28
Room, G. (1995): Beyond the Threshold: the Measurement and Analysis of
Social Exclusion. Bristol: Policy Press
2004; Social Cash Transfer Scheme for Destitute Households – A Zambian
Guide
Scott DeLancey (1990) Ergativity and the cognitive model of event structure in
Lhasa Tibetan. Cognitive Linguistics 1.3:289-321.
Sixth National Development (2011)
Smith, R. (1996). Charity, self-interest and welfare: Reflections from
demographic and family history. In Charity, self-interest and welfare (ed.
M. Daunton). London: University College Press.
Smits, J; Moden, C. (2009). Length of life inequality around the globe. Social
Science and Medicine 68(6): 1114-1123
Szivos, P. & Giudici, C. (2004): Demographic implications of social exclusion in
central and eastern Europe. Strasbourg: Council of Europe.
Sobiesczyk, Teresa, John Knodel and Napaporn Chayovan. (2003). Gender and
Well-Being among the Elderly: Evidence from Thailand. Ageing and Society
23(6): 701-73
Social Welfare Policy - Zambia (2000)
Schubet C. and Munatamba M (2004): Social Cash Transfer Pilot Study–The
Case of Siavonga and Kazungula. GRZ/GTZ

182
Sugiswawa S, Liang J, Liu X (1994). ―Social networks, social support and
mortality among older people in Japan‖. Journals of Gerontology
The State of Older People in Africa. (2007). Regional review and appraisal of the
Madrid International. Plan of Action on Ageing. Economic Commission for
Africa.
Treas, J. and Logue, B. (1986). Economic development and the older
population. population and development review, 12, 655-73
Tsakloglou, P. and Papadopoulos, F. (2002): Identifying Population Groups at
High Risk of Social Exclusion: Evidence from the ECHP. In: R. Muffles, P.
Tsakloglou and D. Mayes (eds.): Social Exclusion in European Welfare
States. Cheltenham: Edward Elgar.
Turner (2001) ???
Uhlenberg, Peter. (1992). Population Aging and Social Policy. Annual Review of
Sociology 18: 449-47
United Nations (UN). (2007). World population prospects. The 2006 revision
population database. http://esa.un.org/unpp/.
United Nations. (2007b). World Population Ageing 2007. New York, United
Nations.
United Nations (2007a). World Population Prospects: the 2006 Revision, New
York: United Nations
United Nations, Department of Social and Economic Affairs (2007)
United Nations. (2005). World Population Status Report. New York. United
Nations Publications.
United Nations. (2005b). The Diversity of Changing Population Age Structures
in the World (UN/POP/PD/2005/1). United Nations Expert Group Meeting
on Social and Economic Implications of Changing Population Age
Structure, Mexico City, 31 August–2 September 2005. New York:
Population Division, Department of Social and Economic Affairs, United
Nations.
US Census Bureau. (2000). United States 2000 Census. USA: US Government.

183
Vision 2030 – Zambia (2006)
Voice of America. (2007)_William Eagle
Walker, A. & Walker, C. (eds.): (1997) Britain Divided. London: CPAG
Wall, R. (1984). Residential isolation of the elderly: a comparison over time.
Ageing and Society, 4, 4, 483-503.
Wall, R. (1995). Elderly Persons and Members of Their Households in England
from Pre-industrial Times to the Present, 81-106, in Aging in the Past:
Demography, Society and Old Age, ed. by D. I. Kertzer and P. Laslett.
Berkeley: University of California Press.
Watkins, K.P. (1987). Parent Child Attachment: A Guide to Research. New
York: Garland Publishing Inc
White and Robinson (2000) ?????
WHO/IASO/IOTF. (2000/2003). Asia-Pacific perspective: Redefining obesity
and its treatment: Health communications. Australia: Australia Pty Ltd
World Health Report (1997) Conquering suffering, enriching humanity. World
Health Forum 1997;18:248–60.
Wikipedia. (2008). Ageing
Wolf D.A (2001). The Elderly and their Kin: Patterns of Availability and Access.
In Demography of Aging by Linda G. Martin and Samuel H. Preston,
Editors; Committee on Population, National Research Council.
Wolf, D.A. (1994). The Elderly and their Kin: Patterns of Availability and
Access. In Demography of Aging, L. G. Martin
World Bank (1994). Averting the Old Age Crisis. New York: Oxford University
Press
World Health Organisation – Active Ageing Framework. 2007.
World Health Organization. (2011). Men, Ageing and Health. Publication
WHO/NMH/NPH/01.2. WHO, Geneva
World Health Organization. (2002). The Impact of AIDS on Older Persons in
Africa. Geneva, Switzerland: Author.
Wotela, K. (2008). Deriving Traditional Reproductive Regimes to Explain
Subnational Fertility Differentials in Zambia. PhD Thesis; Faculty of
Commerce; University of Cape Town.

184
Zambia‘s Report to the Vienna Conversion on Ageing 1982
Zijderveld, Anton C. (1999). The Waning of the Welfare State: The End of the
Comprehensive State Succor. Brunswick, New Jersey: Transactions
Publishers.
Zulu, J. and Situmbeko, L.C. (2004). Zambia: Condemned to Debt. WDM
Publication.

185
APPENDICES
Appendix 1: Individual Questionnaire
FINAL QUESTIONNAIRE:
Population Ageing in Zambia:
Magnitude, Challenges and Determinants
BACKGROUND CHARACTERISTICS
IDENTIFICATION
NAME OF COMMUNITY: ___________________________
NAME OF TOWN: _________________________
TYPE OF RESIDENCE: 1. URBAN 2. RURAL PLACE OF INTERVIEW: 1. HOME FOR THE AGED 2. COMMUNITY
NAME OF INTERVIEWER: _________________________
LANGUAGE OF INTERVIEW: _________________________
INTRODUCTION AND CONSENT
READ OUT: Hello, my name is _______________________________. I am working with The University of Zambia, collecting information pertaining to your well being as an elderly citizen of this country. Please be assured that everything we discuss will be strictly confidential and no information will be shared or leaked. May I continue?
NO QUESTIONS AND FILTERS CODING CATEGORIES SKIP
Q101 CIRCLE SEX OF RESPONDENT MALE------------------------------1
FEMALE--------------------------2
Q102 How old are you? AGE IN YEARS [ | ]
Q102a When were you born (Year) _____________________________
Q102b When did you turn 60? _____________________________
Q103 Have you ever attended school? YES -------------------------------1 NO---------------------------------2
104a
Q104 What is the highest level of school you
attended: primary, secondary, or
higher?
PRIMARY ------------------------1
SECONDARY --------------------2
HIGHER --------------------------3
Q104a Do you ever have access to appropriate
training and educational programs in this community?
YES ------------------------1
NO -------------------------2
Q105 How long have you been living
continuously in (NAME OF
VILLAGE/TOWN/CITY)?
YEARS -----------------[ | ]
Q106 Have you done any work in the last 12
months?
YES -----------------------------1
NO------------------------------2
Q107 Are you currently working? YES -----------------------------1
NO -----------------------------2
Q107a Why are you not working? Health problems -----------1 Old age -------------------2
Cant find a job due to age ---3

186
Cant find a job --------4 Other (specify) --------------------
Q107b Do you ever have any opportunity to
work or have access to income
generating activities in this
community?
YES ------------------1
NO -------------------2
Q108 Do you have a continuous monthly
flow of income?
YES ---------------1
NO --------------2
Q110
Q108a Where do you get or who gives you this
income?
Source ______________________
Q108b Do you think this income is adequate? YES ---------------------1 NO --------------------2
Q109
What is your average monthly income?
Amount in ZMK ------------------
Q110 Have you ever been married or lived
with a woman or man as if you were
married?
YES ----------------------------1
NO -------------------------2
Q111 What is your current marital status? MARRIED -----------------1 WIDOWED ---------------2
DIVORCED ---------------3
SEPARATED ------------- 4
Q111a How long have you been in this marital
status
Years: ------------------------------
Months: ----------------------------
Q112 Do you have children? YES -----------------------1 NO -----------------------2
Q114
Q113 Have you ever had children? YES ---------------------1
NO ---------------------2
Q114 How many children do you have/have
you ever had?
NUMBER OF MALES ----[ | ]
NUMBER OF FRMALES -[ | ]
Q114a How many family members do you
have who are alive?
NO: -------------------------
If non
Q116
Q114b Where are they? Same community ---------------1
Same town but different com.-2 Different town --------3
Other (specify) ______________
Q115a How many adult children of your own
are still alive?
Number: ------------------------ If “00” Q116
Q115b Where do they live? Same community ---------------1
Same town but different com.-2 Different town --------3
Other (specify) ______________
Q116 Observe type of housing _ main
material for the wall, floor and roof
Wall ----------------
Floor ---------------
Roof ----------------
Q116a How does your house compare with
other houses in this community?
Same ----------1
Better off --------------2 Worse off -------------3
Q117 Observe type of sanitary facility (if not
sure, ask)
Flush or pour toilet -------1
Pit latrine ------------------2
No facility/bush -------3
Q118 What is the main source of your
drinking water?
Piped water -----------------1
Borehole ----------------2
Well ------------------------3
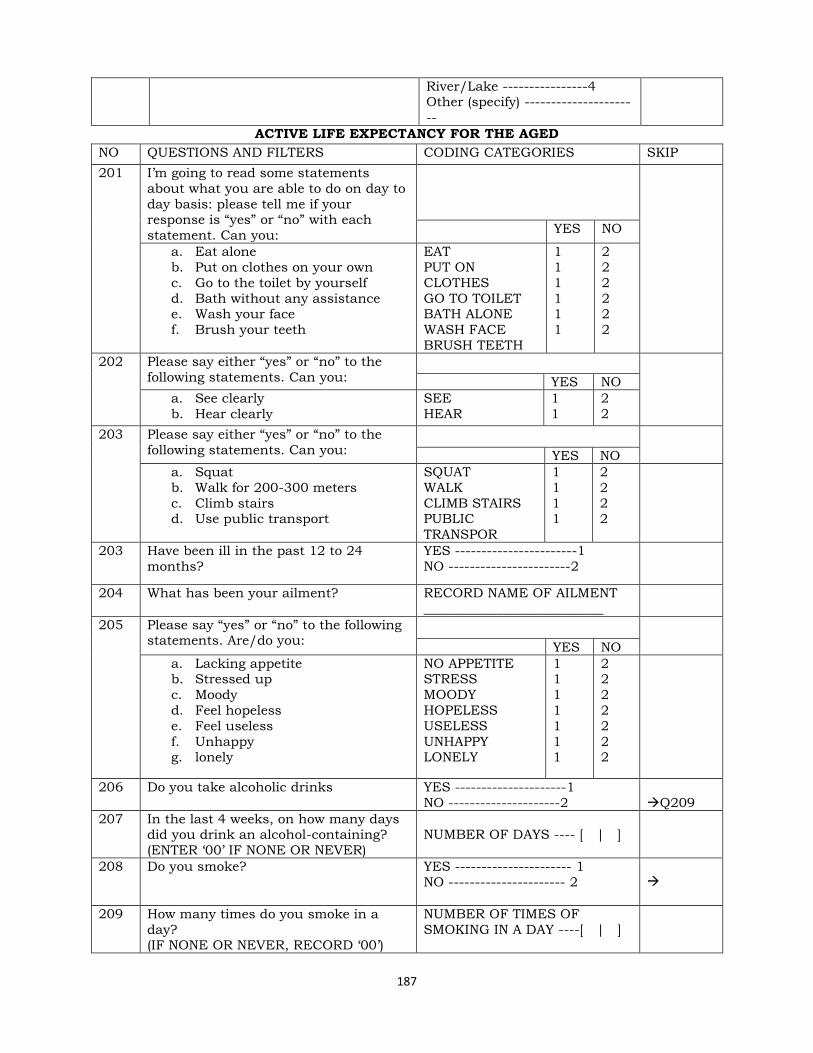
187
River/Lake ----------------4 Other (specify) --------------------
--
ACTIVE LIFE EXPECTANCY FOR THE AGED
NO QUESTIONS AND FILTERS CODING CATEGORIES SKIP
201 I‘m going to read some statements
about what you are able to do on day to
day basis: please tell me if your response is ―yes‖ or ―no‖ with each
statement. Can you:
YES NO
a. Eat alone
b. Put on clothes on your own
c. Go to the toilet by yourself
d. Bath without any assistance e. Wash your face
f. Brush your teeth
EAT
PUT ON
CLOTHES
GO TO TOILET BATH ALONE
WASH FACE
BRUSH TEETH
1
1
1
1 1
1
2
2
2
2 2
2
202 Please say either ―yes‖ or ―no‖ to the
following statements. Can you:
YES NO
a. See clearly
b. Hear clearly
SEE
HEAR
1
1
2
2
203
Please say either ―yes‖ or ―no‖ to the
following statements. Can you:
YES NO
a. Squat
b. Walk for 200-300 meters
c. Climb stairs d. Use public transport
SQUAT
WALK
CLIMB STAIRS PUBLIC
TRANSPOR
1
1
1 1
2
2
2 2
203 Have been ill in the past 12 to 24
months?
YES -----------------------1
NO -----------------------2
204 What has been your ailment? RECORD NAME OF AILMENT
___________________________
205 Please say ―yes‖ or ―no‖ to the following statements. Are/do you:
YES NO
a. Lacking appetite b. Stressed up
c. Moody
d. Feel hopeless
e. Feel useless
f. Unhappy g. lonely
NO APPETITE STRESS
MOODY
HOPELESS
USELESS
UNHAPPY LONELY
1 1
1
1
1
1 1
2 2
2
2
2
2 2
206 Do you take alcoholic drinks YES ---------------------1
NO ---------------------2
Q209
207 In the last 4 weeks, on how many days did you drink an alcohol-containing?
(ENTER ‗00‘ IF NONE OR NEVER)
NUMBER OF DAYS ---- [ | ]
208
Do you smoke? YES ---------------------- 1
NO ---------------------- 2
209 How many times do you smoke in a
day? (IF NONE OR NEVER, RECORD ‗00‘)
NUMBER OF TIMES OF
SMOKING IN A DAY ----[ | ]
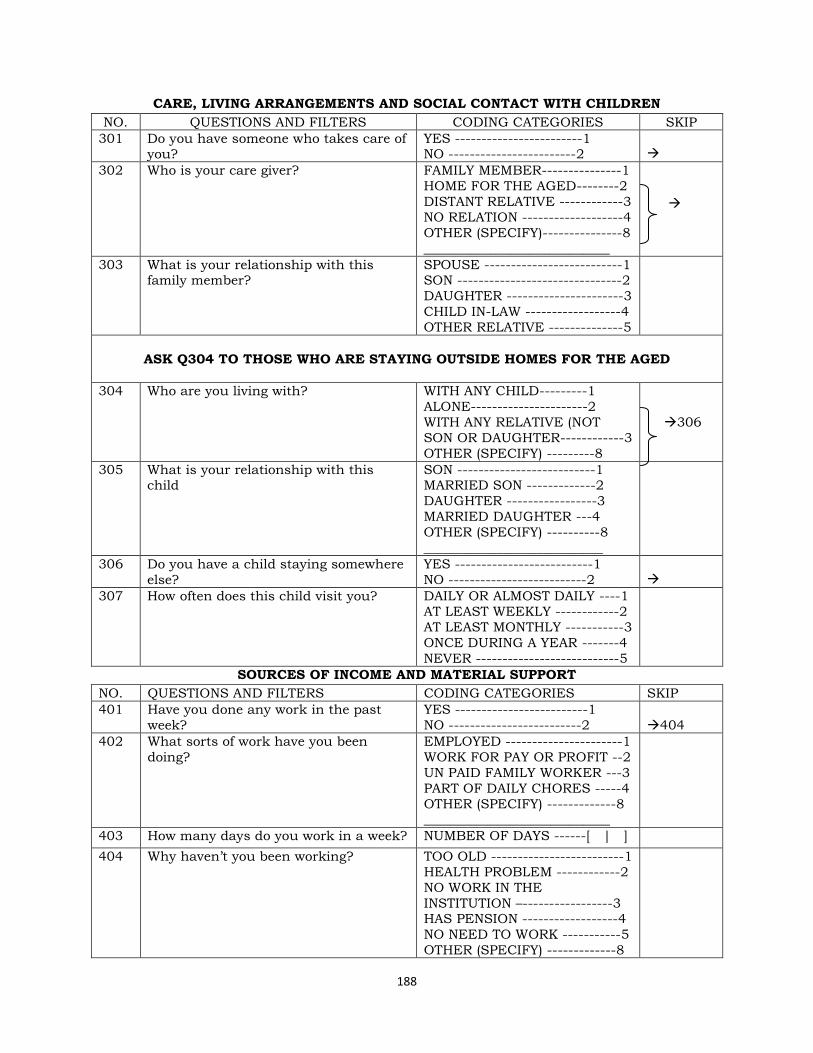
188
CARE, LIVING ARRANGEMENTS AND SOCIAL CONTACT WITH CHILDREN
NO. QUESTIONS AND FILTERS CODING CATEGORIES SKIP
301 Do you have someone who takes care of you?
YES ------------------------1 NO ------------------------2
302 Who is your care giver? FAMILY MEMBER---------------1
HOME FOR THE AGED--------2
DISTANT RELATIVE ------------3
NO RELATION -------------------4
OTHER (SPECIFY)---------------8
____________________________
303 What is your relationship with this family member?
SPOUSE --------------------------1 SON -------------------------------2
DAUGHTER ----------------------3
CHILD IN-LAW ------------------4
OTHER RELATIVE --------------5
ASK Q304 TO THOSE WHO ARE STAYING OUTSIDE HOMES FOR THE AGED
304 Who are you living with? WITH ANY CHILD---------1
ALONE----------------------2
WITH ANY RELATIVE (NOT
SON OR DAUGHTER------------3
OTHER (SPECIFY) ---------8
306
305 What is your relationship with this child
SON --------------------------1 MARRIED SON -------------2
DAUGHTER -----------------3
MARRIED DAUGHTER ---4
OTHER (SPECIFY) ----------8
___________________________
306 Do you have a child staying somewhere
else?
YES --------------------------1
NO --------------------------2
307 How often does this child visit you? DAILY OR ALMOST DAILY ----1 AT LEAST WEEKLY ------------2
AT LEAST MONTHLY -----------3
ONCE DURING A YEAR -------4
NEVER ---------------------------5
SOURCES OF INCOME AND MATERIAL SUPPORT
NO. QUESTIONS AND FILTERS CODING CATEGORIES SKIP
401 Have you done any work in the past
week?
YES -------------------------1
NO -------------------------2
404
402 What sorts of work have you been
doing?
EMPLOYED ----------------------1
WORK FOR PAY OR PROFIT --2
UN PAID FAMILY WORKER ---3
PART OF DAILY CHORES -----4
OTHER (SPECIFY) -------------8 ____________________________
403 How many days do you work in a week? NUMBER OF DAYS ------[ | ]
404 Why haven‘t you been working? TOO OLD -------------------------1
HEALTH PROBLEM ------------2
NO WORK IN THE
INSTITUTION –-----------------3 HAS PENSION ------------------4
NO NEED TO WORK -----------5
OTHER (SPECIFY) -------------8

189
____________________________
405 Do you ever get any income? YES -------------1
NO -------------2
405 Where do you get this income? Please
say either ―yes‖ or ―no‖ to the following:
YES NO
a. children
b. own work
c. elderly allowance
d. spouse
e. savings f. rent
g. other relatives
CHILDREN
WORK
ALLOWANCE
SPOUSE
SAVINGS RENT
RELATIVES
1
1
1
1
1 1
1
2
2
2
2
2 2
2
406 Do your close or distant family
members support you in any way?
YES ----------------------1
NO ----------------------2
407 What sort of support do you receive from these family members?
FOOD ----------------------------A MONEY --------------------------B
GOODS AND CLOTHES------C
OTHER (SPECIFY)
408A Can you state exactly how often this
support is:
MONEY: HOW MUCH _______
DAILY
AT LEAST
WEEKLY
AT LEAST MONTHLY
YES NO
1
1
1
2
2
2
408B FOOD:
DAILY
AT LEAST
WEEKLY
AT LEAST MONTHLY
YES NO
1
1
1
2
2
2
408C GOODS AND CLOTHES
DAILY AT LEAST
WEEKLY
AT LEAST
MONTHLY
YES NO
1
1
1
2
2
2
STATUS OF RALATIVES
NO. QUESTIONS AND FILTERS CODING CATEGORIES SKIP
501 Do you have any working relative? YES -----------------------1
NO ------------------------2
DON‘T KNOW ---------8
502 Do you any relative who stays in any
urban area?
YES ---------------------1
NO --------------------2 DON‘T KNOW ------8
503 What is your relationship to this
relative?
__________________________
504 Do you have any relative who used to YES --------------------1

190
stay with you but shifted to another town or village?
NO -------------------2 DONT
505 Do you know why they shifted?
506 During the time they were staying with
you or near where you stay, were they
helpful in terms of:
CLOTHES
FOOD MONEY
YES
NO
CLOTHES
FOOD
MONEY
1
1
1
2
2
2
507 During this time that they have been
away or stay very far, do they still
provide for you clothes, food or money?
YES ---------------------1
NO ---------------------2
508 What do they provide most? CLOTHES --------------A
FOOD -----------------B
MONEY -----------------C
OTHER (SPECIFY) -----X
509 Do they ever invite you to visit them YES -----------------1
NO ----------------2
510 How often does this happen? EVERY WEEK -----------1
ONCE A MONTH ------2
AT LEAST EVEY YEAR -3 NEVER ------------------4
511 How would you describe your
relationship with these relatives?
VERY CLOSE --------1
QUEIT CLOSE ------2
DISTANT ------------3
OTHER (SPECIFY)
512 Has your relationship remained the same since you they left?
YES ------------------1 NO ------------------2
513 Do you have any relative who used to
work but now they are not?
YES --------------1
NO ---------------2
514 During the time they were working,
were they supporting you?
YES ------------------1
NO -----------------2
515 How often was the support? VERY OFTEN ------------1
NOT SO OFTEN -------2
ERATIC ------------------3 VERY ERATIC ----------4
NEVER ----------------5
516 Are they supporting you now? YES ---------------1
NO ---------------2
517 Is there any difference between the
support they gave when they were
working and the one they give while not working?
YES-------------1
NO -------------2
518 Would you attribute this change to the
fact that they are now not working?
YES ----------1
NO ----------2
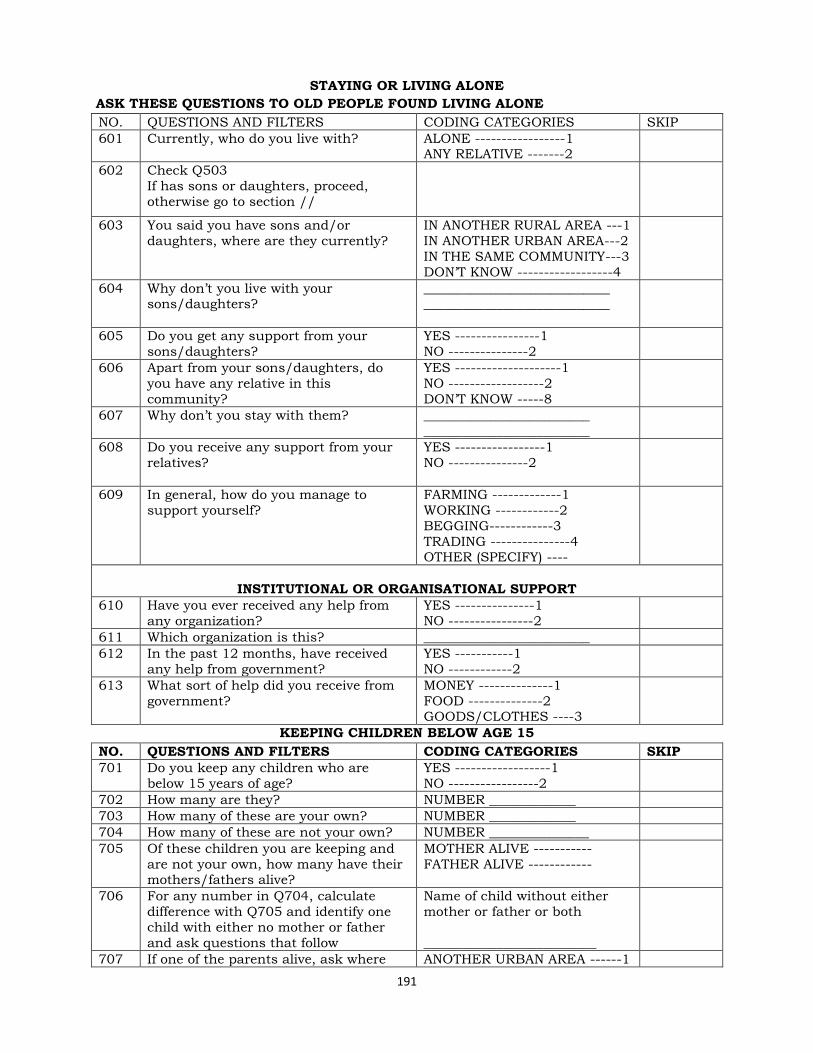
191
STAYING OR LIVING ALONE
ASK THESE QUESTIONS TO OLD PEOPLE FOUND LIVING ALONE
NO. QUESTIONS AND FILTERS CODING CATEGORIES SKIP
601 Currently, who do you live with? ALONE -----------------1 ANY RELATIVE -------2
602 Check Q503
If has sons or daughters, proceed,
otherwise go to section //
603 You said you have sons and/or
daughters, where are they currently?
IN ANOTHER RURAL AREA ---1
IN ANOTHER URBAN AREA---2
IN THE SAME COMMUNITY---3
DON‘T KNOW ------------------4
604 Why don‘t you live with your sons/daughters?
____________________________ ____________________________
605 Do you get any support from your
sons/daughters?
YES ----------------1
NO ---------------2
606 Apart from your sons/daughters, do
you have any relative in this
community?
YES --------------------1
NO ------------------2
DON‘T KNOW -----8
607 Why don‘t you stay with them? _________________________
_________________________
608 Do you receive any support from your
relatives?
YES -----------------1
NO ---------------2
609 In general, how do you manage to
support yourself?
FARMING -------------1
WORKING ------------2
BEGGING------------3
TRADING ---------------4 OTHER (SPECIFY) ----
INSTITUTIONAL OR ORGANISATIONAL SUPPORT
610 Have you ever received any help from
any organization?
YES ---------------1
NO ----------------2
611 Which organization is this? _________________________
612 In the past 12 months, have received
any help from government?
YES -----------1
NO ------------2
613 What sort of help did you receive from
government?
MONEY --------------1
FOOD --------------2 GOODS/CLOTHES ----3
KEEPING CHILDREN BELOW AGE 15
NO. QUESTIONS AND FILTERS CODING CATEGORIES SKIP
701 Do you keep any children who are
below 15 years of age?
YES ------------------1
NO -----------------2
702 How many are they? NUMBER _____________
703 How many of these are your own? NUMBER _____________
704 How many of these are not your own? NUMBER _______________
705 Of these children you are keeping and
are not your own, how many have their mothers/fathers alive?
MOTHER ALIVE -----------
FATHER ALIVE ------------
706 For any number in Q704, calculate
difference with Q705 and identify one
child with either no mother or father
and ask questions that follow
Name of child without either
mother or father or both
__________________________
707 If one of the parents alive, ask where ANOTHER URBAN AREA ------1
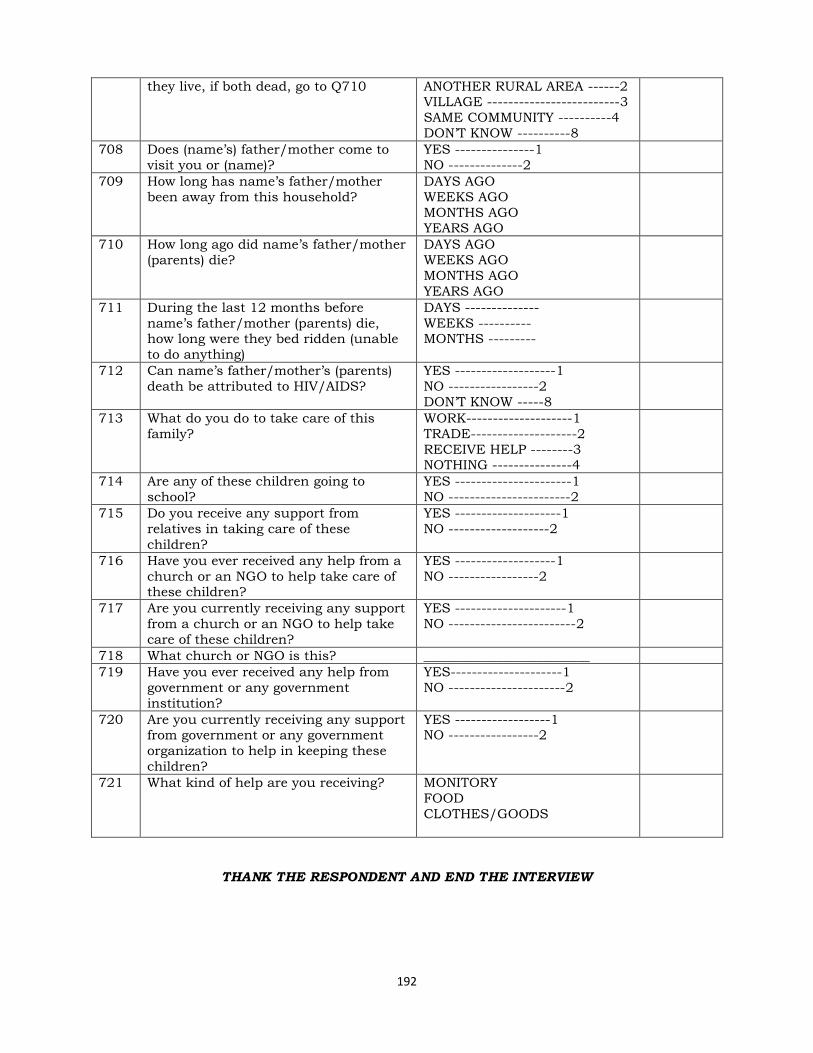
192
they live, if both dead, go to Q710 ANOTHER RURAL AREA ------2 VILLAGE -------------------------3
SAME COMMUNITY ----------4
DON‘T KNOW ----------8
708 Does (name‘s) father/mother come to
visit you or (name)?
YES ---------------1
NO --------------2
709 How long has name‘s father/mother
been away from this household?
DAYS AGO
WEEKS AGO
MONTHS AGO YEARS AGO
710 How long ago did name‘s father/mother
(parents) die?
DAYS AGO
WEEKS AGO
MONTHS AGO
YEARS AGO
711 During the last 12 months before
name‘s father/mother (parents) die, how long were they bed ridden (unable
to do anything)
DAYS --------------
WEEKS ---------- MONTHS ---------
712 Can name‘s father/mother‘s (parents)
death be attributed to HIV/AIDS?
YES -------------------1
NO -----------------2
DON‘T KNOW -----8
713 What do you do to take care of this
family?
WORK--------------------1
TRADE--------------------2
RECEIVE HELP --------3 NOTHING ---------------4
714 Are any of these children going to
school?
YES ----------------------1
NO -----------------------2
715 Do you receive any support from
relatives in taking care of these
children?
YES --------------------1
NO -------------------2
716 Have you ever received any help from a
church or an NGO to help take care of these children?
YES -------------------1
NO -----------------2
717 Are you currently receiving any support
from a church or an NGO to help take
care of these children?
YES ---------------------1
NO ------------------------2
718 What church or NGO is this? _________________________
719 Have you ever received any help from
government or any government
institution?
YES---------------------1
NO ----------------------2
720 Are you currently receiving any support from government or any government
organization to help in keeping these
children?
YES ------------------1 NO -----------------2
721 What kind of help are you receiving? MONITORY
FOOD
CLOTHES/GOODS
THANK THE RESPONDENT AND END THE INTERVIEW
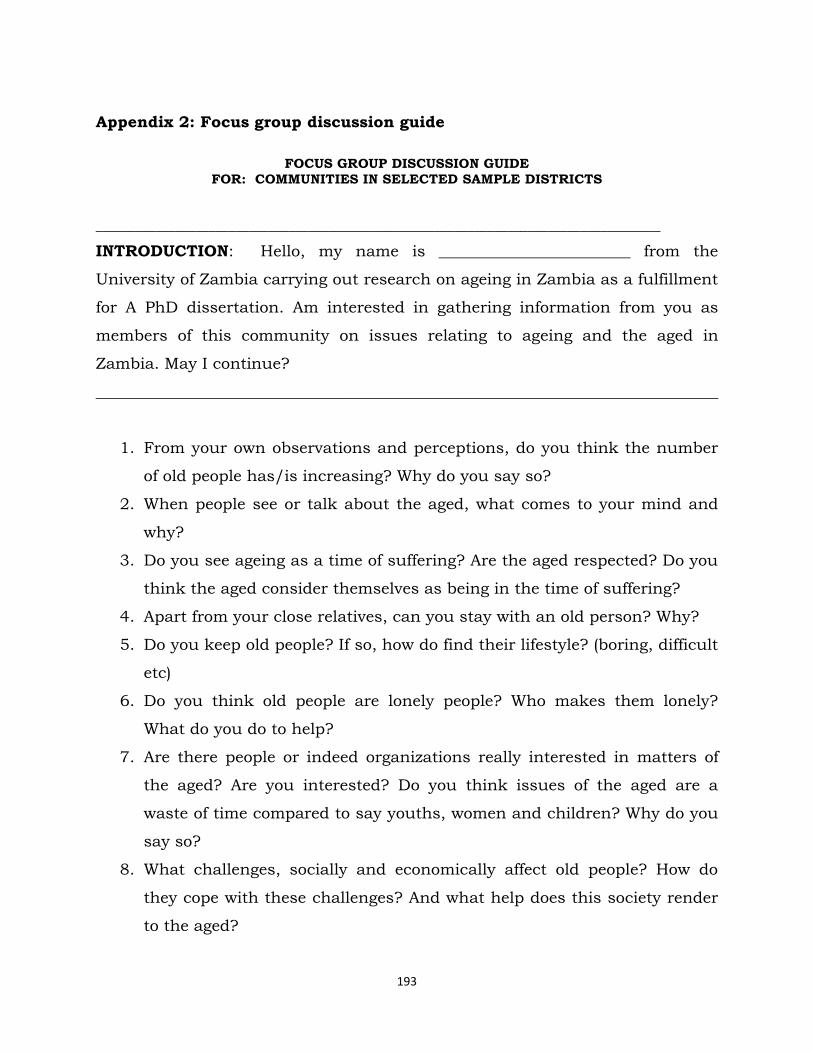
193
Appendix 2: Focus group discussion guide
FOCUS GROUP DISCUSSION GUIDE
FOR: COMMUNITIES IN SELECTED SAMPLE DISTRICTS
_____________________________________________________________________________________
INTRODUCTION: Hello, my name is ________________________ from the
University of Zambia carrying out research on ageing in Zambia as a fulfillment
for A PhD dissertation. Am interested in gathering information from you as
members of this community on issues relating to ageing and the aged in
Zambia. May I continue?
______________________________________________________________________________
1. From your own observations and perceptions, do you think the number
of old people has/is increasing? Why do you say so?
2. When people see or talk about the aged, what comes to your mind and
why?
3. Do you see ageing as a time of suffering? Are the aged respected? Do you
think the aged consider themselves as being in the time of suffering?
4. Apart from your close relatives, can you stay with an old person? Why?
5. Do you keep old people? If so, how do find their lifestyle? (boring, difficult
etc)
6. Do you think old people are lonely people? Who makes them lonely?
What do you do to help?
7. Are there people or indeed organizations really interested in matters of
the aged? Are you interested? Do you think issues of the aged are a
waste of time compared to say youths, women and children? Why do you
say so?
8. What challenges, socially and economically affect old people? How do
they cope with these challenges? And what help does this society render
to the aged?

194
9. What do you think are the major causes of the socio-economic conditions
old people find themselves in? (no family, no children, abandoned etc)
10. Do you think old people are affected by issues of HIV/AIDS? How are
they affected?
11. Old people are usually classified as tired people, do you think
HIV/AIDS has changed their roles in society? If so, what roles have
been changed?
12. Are there old people keeping children known to be orphans? Are they
HIV/AIDS orphans? How do they cope with this arrangement?
13. Do they ever receive any help and from who? Do you think the help is
enough?
14. How do you think old people could be helped since all of us will one
day age?
15. Do you know any organization dealing with issues of the aged? How
does this organization deal with the aged?
16. Do you know of any program/policy by government of any
organization dealing or addressing issues of the aged and ageing?
have you ever come across or read any document championing issues
of the aged?
17. What best can improve the living conditions of the aged, according to
your suggestions and observations?
Thank you for your participation