Embed Size (px)
Citation preview
Population ageing and skills ageingin Europe 2015-2035
Philippe Fargues
EUI Forum on Migration Demography and Citizenship4-5 February 2016
1MPC - www.migrationpolicycentre.eu
08/02/2016 MPC - www.migrationpolicycentre.eu 2
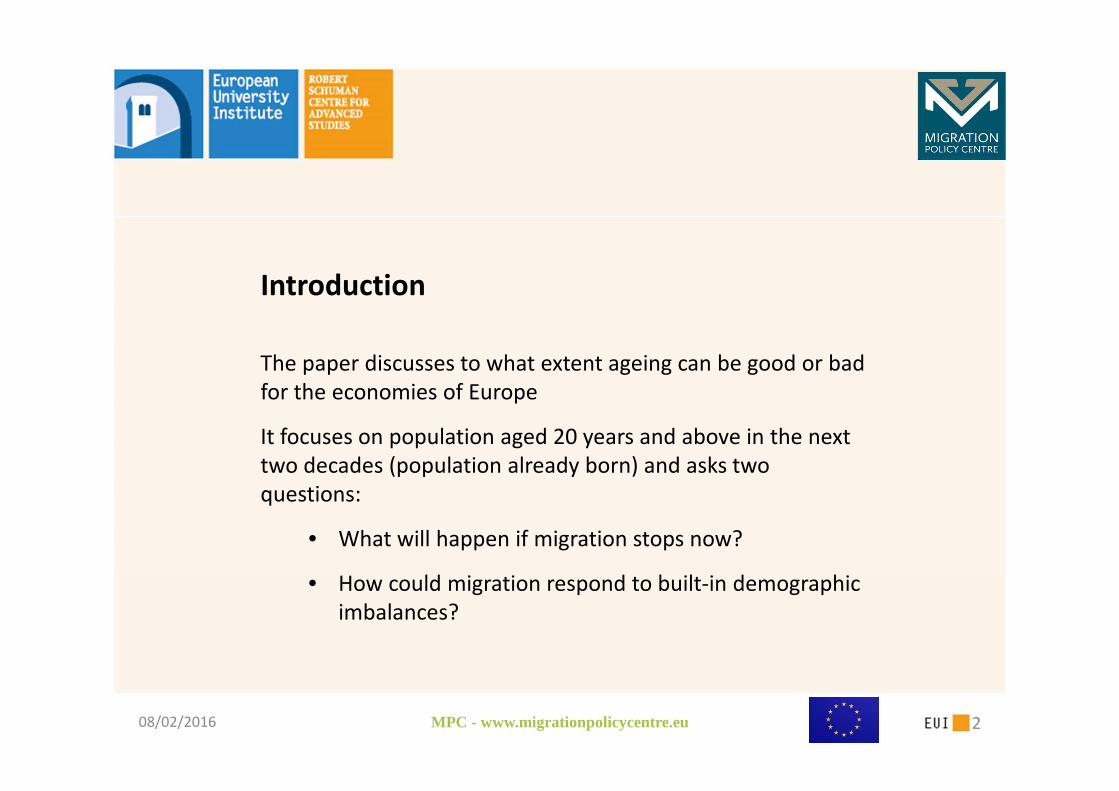
Introduction
The paper discusses to what extent ageing can be good or bad
for the economies of Europe
It focuses on population aged 20 years and above in the next
two decades (population already born) and asks two
questions:
• What will happen if migration stops now?
• How could migration respond to built-in demographic
imbalances?
MPC - www.migrationpolicycentre.eu 3
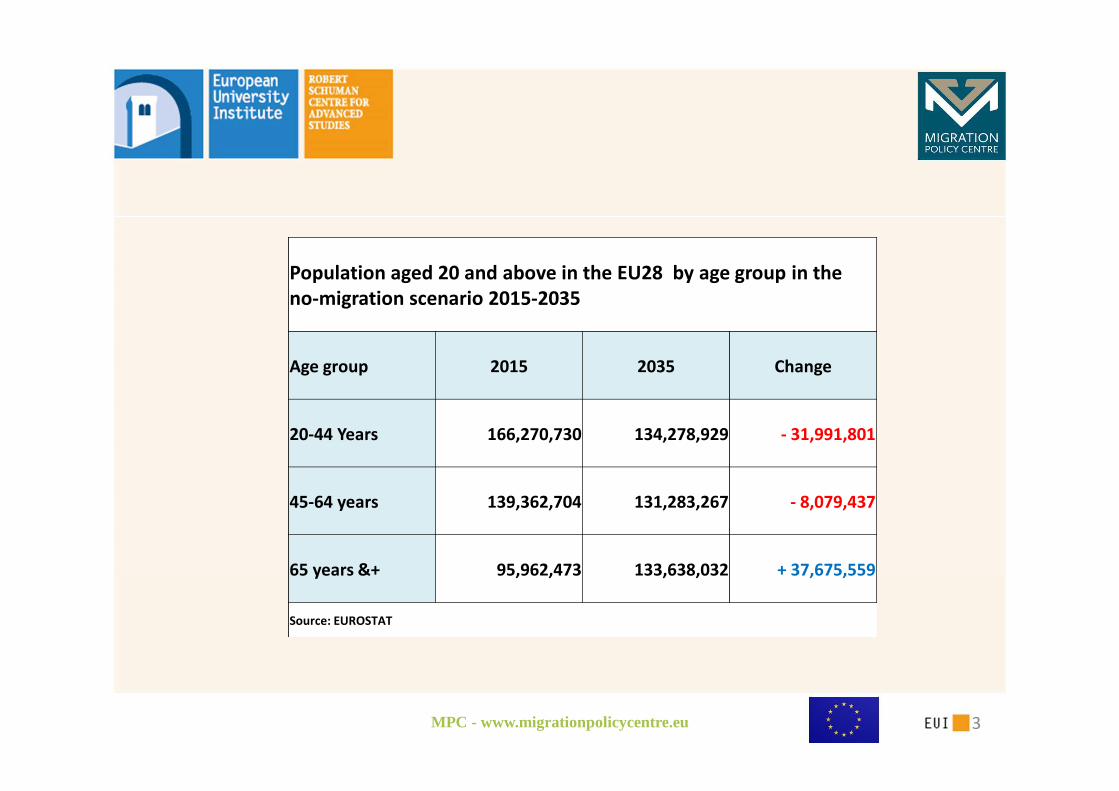
Population aged 20 and above in the EU28 by age group in the
no-migration scenario 2015-2035
Age group 2015 2035 Change
20-44 Years 166,270,730 134,278,929 - 31,991,801
45-64 years 139,362,704 131,283,267 - 8,079,437
65 years &+ 95,962,473 133,638,032 + 37,675,559
Source: EUROSTAT
08/02/2016 MPC - www.migrationpolicycentre.eu 4
0
1,000,000
2,000,000
3,000,000
4,000,000
5,000,000
6,000,000
7,000,000
8,000,000
20 30 40 50 60 70
Nu
mb
ers
by
sin
gle
ye
ar
of
ag
e
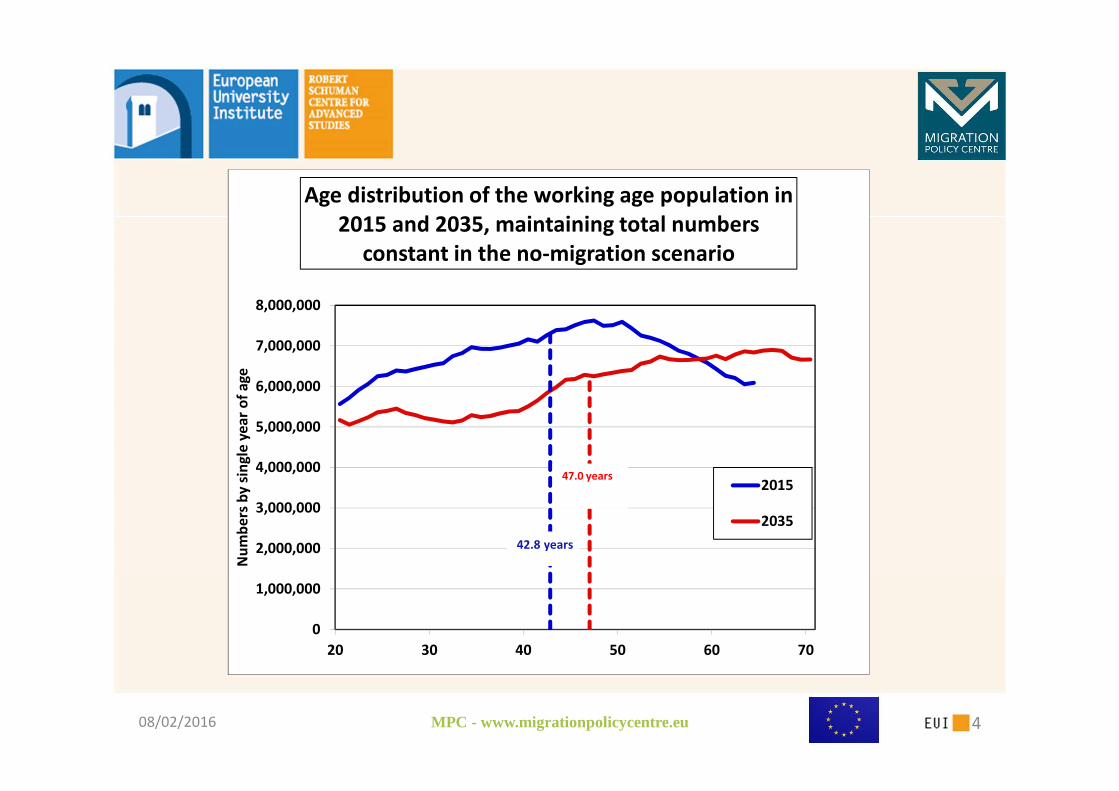
Age distribution of the working age population in
2015 and 2035, maintaining total numbers
constant in the no-migration scenario
2015
2035
42.8 years
47.0 years
08/02/2016 MPC - www.migrationpolicycentre.eu 5
I- The life cycle perspective: ageing can
bring benefits
• Experience grows with age
• Individuals resort to different skills at different ages
• High-skilled workers retire later than low-skilled
workers
Conclusion: each single cohort’s contribution to
production increases with age
MPC - www.migrationpolicycentre.eu 6
08/02/2016 MPC - www.migrationpolicycentre.eu 7
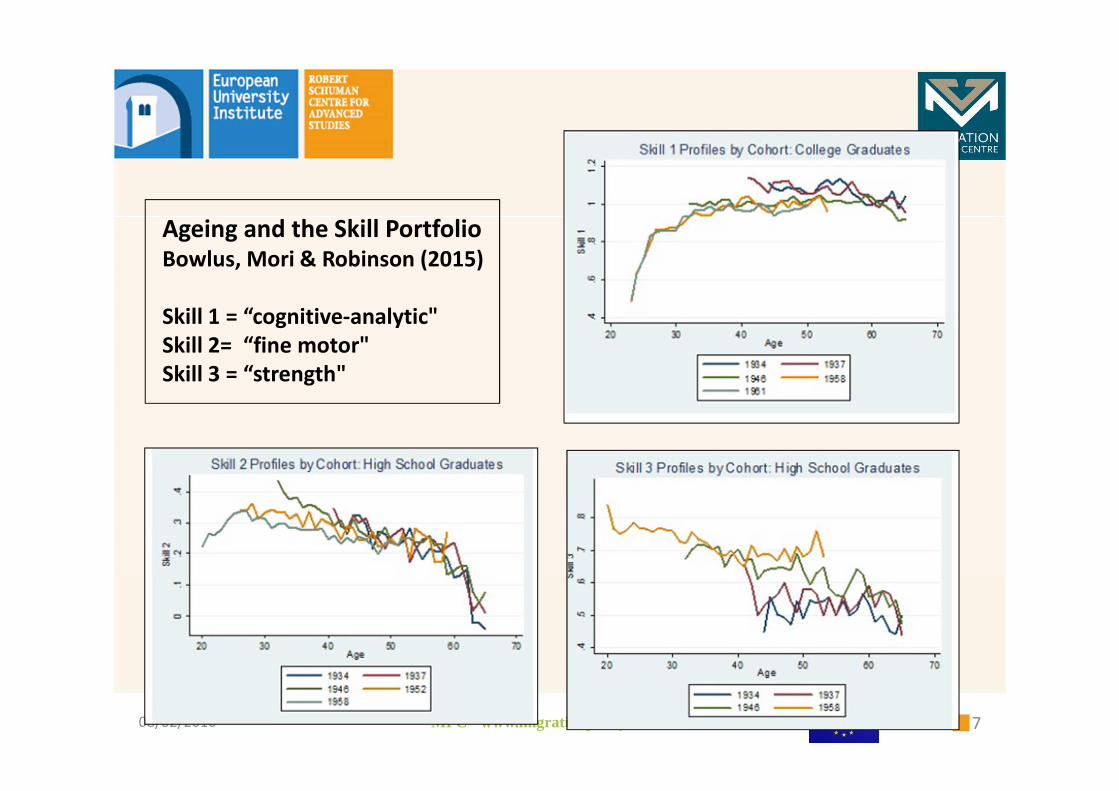
Ageing and the Skill Portfolio
Bowlus, Mori & Robinson (2015)
Skill 1 = “cognitive-analytic"
Skill 2= “fine motor"
Skill 3 = “strength"
08/02/2016 MPC - www.migrationpolicycentre.eu 8
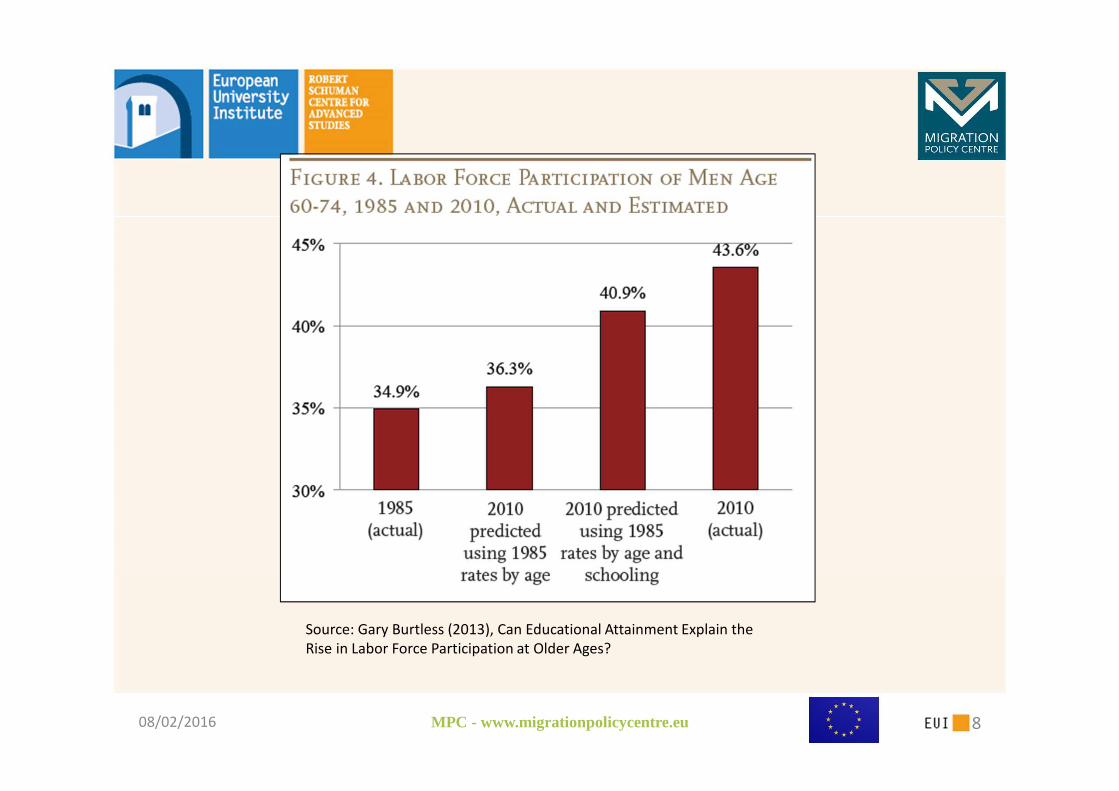
Source: Gary Burtless (2013), Can Educational Attainment Explain the
Rise in Labor Force Participation at Older Ages?
08/02/2016 MPC - www.migrationpolicycentre.eu 9
II- The population perspective: ageing may
harm
• Formal education stops at the age of 30 and gradually
becomes obsolete with the passing of time
• As a result of below-replacement fertility, the youngest
cohorts whose knowledge is the most up-to-date
represent a decreasing share of the working age
population
Conclusion: the capacity to innovate decreases with
population ageing
08/02/2016 MPC - www.migrationpolicycentre.eu 10
0
0.2
0.4
0.6
0.8
1
1.2
1.4
1.6
1.8
2
1980 1985 1990 1995 2000 2005 2010 2015 2020 2025 2030 2035
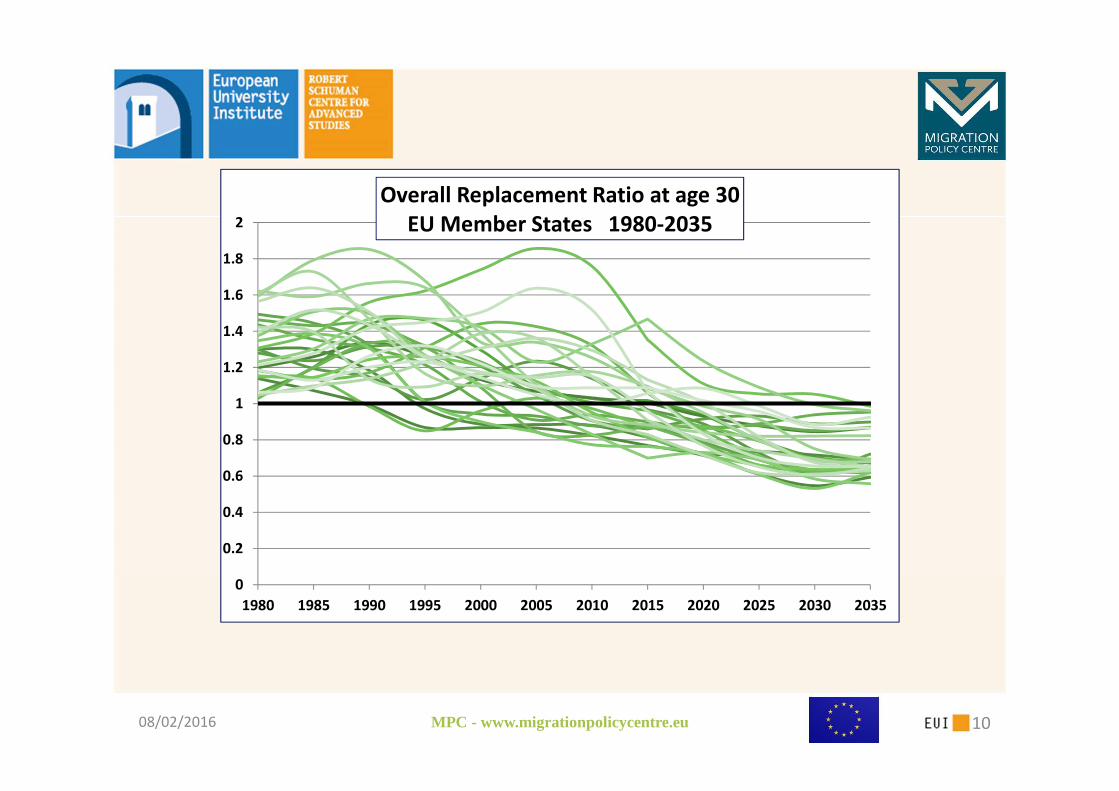
Overall Replacement Ratio at age 30
EU Member States 1980-2035
08/02/2016 MPC - www.migrationpolicycentre.eu 11
0
0.2
0.4
0.6
0.8
1
1.2
1.4
1980 1985 1990 1995 2000 2005 2010 2015 2020 2025 2030 2035
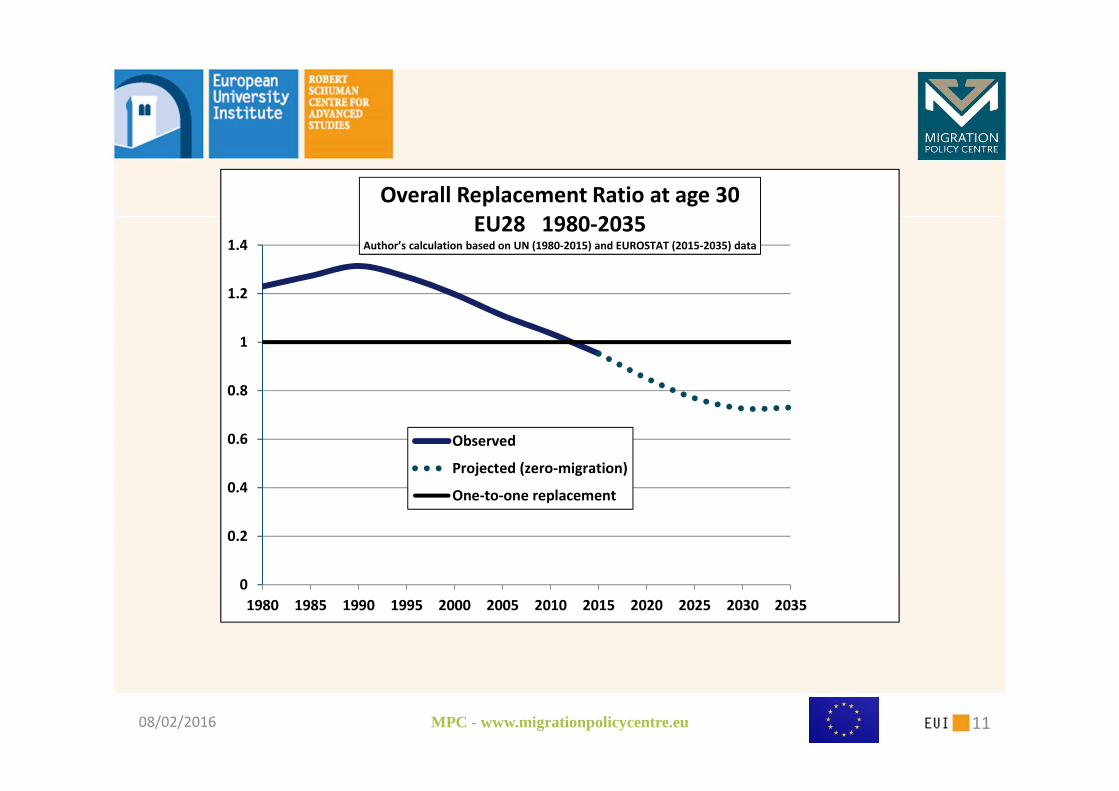
Overall Replacement Ratio at age 30
EU28 1980-2035Author’s calculation based on UN (1980-2015) and EUROSTAT (2015-2035) data
Observed
Projected (zero-migration)
One-to-one replacement
MPC - www.migrationpolicycentre.eu 12
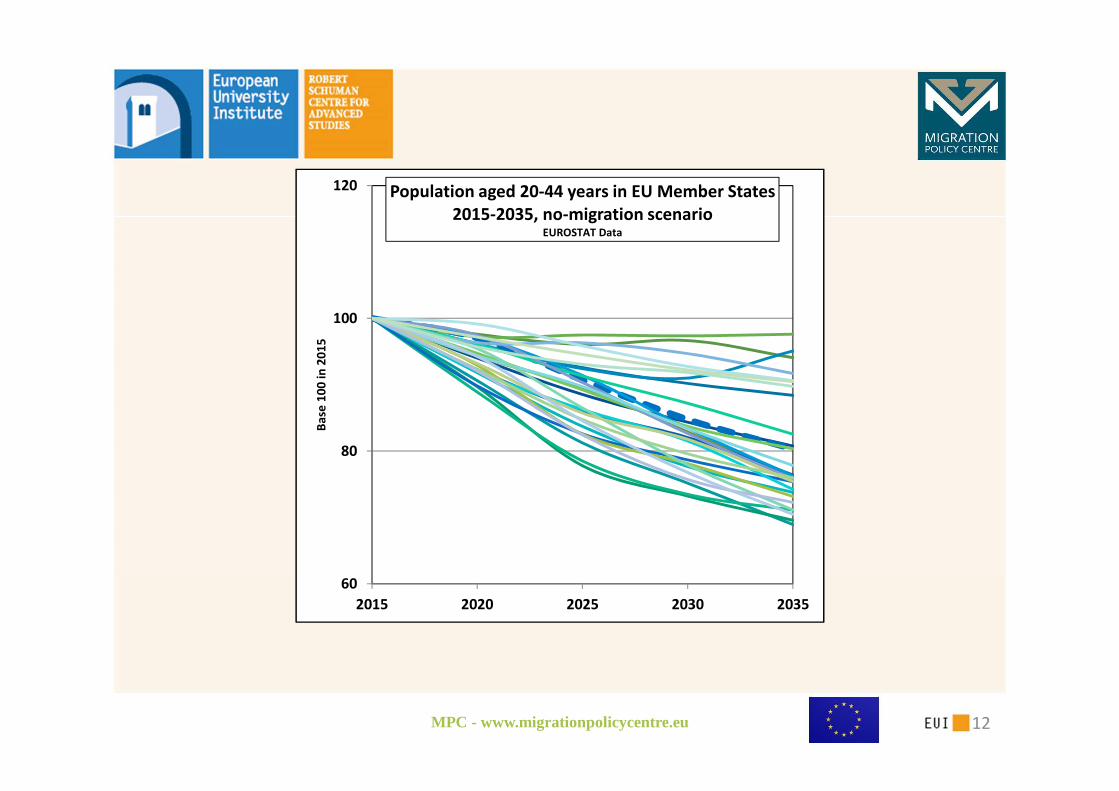
60
80
100
120
2015 2020 2025 2030 2035
Ba
se 1
00
in
20
15
Population aged 20-44 years in EU Member States
2015-2035, no-migration scenario EUROSTAT Data
08/02/2016 MPC - www.migrationpolicycentre.eu 13
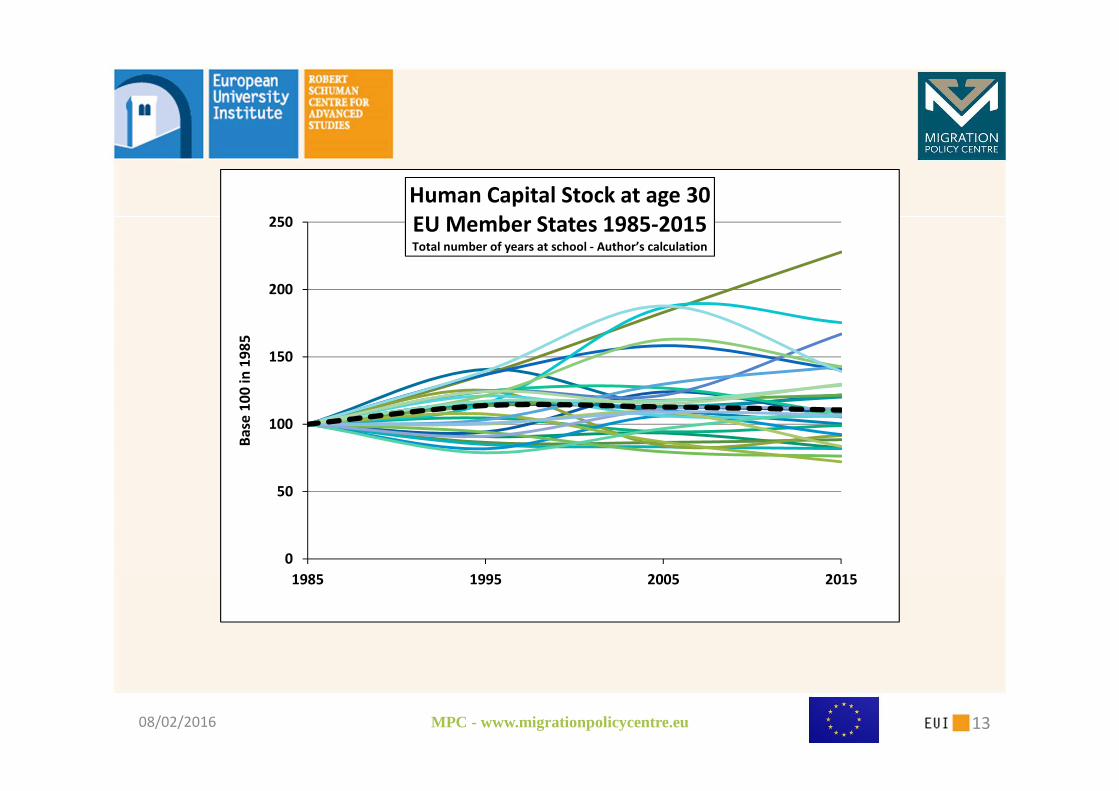
0
50
100
150
200
250
1985 1995 2005 2015
Ba
se 1
00
in
19
85
Human Capital Stock at age 30
EU Member States 1985-2015Total number of years at school - Author’s calculation
08/02/2016 MPC - www.migrationpolicycentre.eu 14
III- Rethinking replacement migration
What are the level and skills distribution of international
migration that would be needed to compensate for skills
ageing of native populations in Europe?
08/02/2016 MPC - www.migrationpolicycentre.eu 15
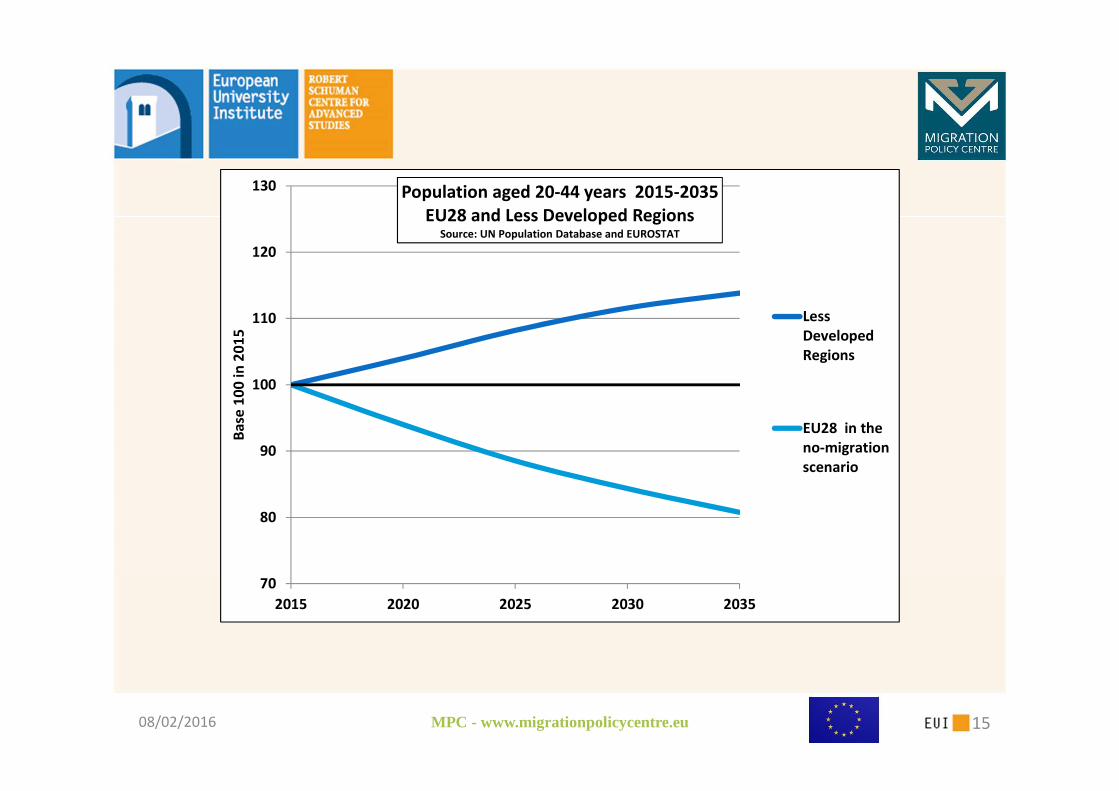
70
80
90
100
110
120
130
2015 2020 2025 2030 2035
Ba
se 1
00
in
20
15
Population aged 20-44 years 2015-2035
EU28 and Less Developed RegionsSource: UN Population Database and EUROSTAT
Less
Developed
Regions
EU28 in the
no-migration
scenario
08/02/2016 MPC - www.migrationpolicycentre.eu 16
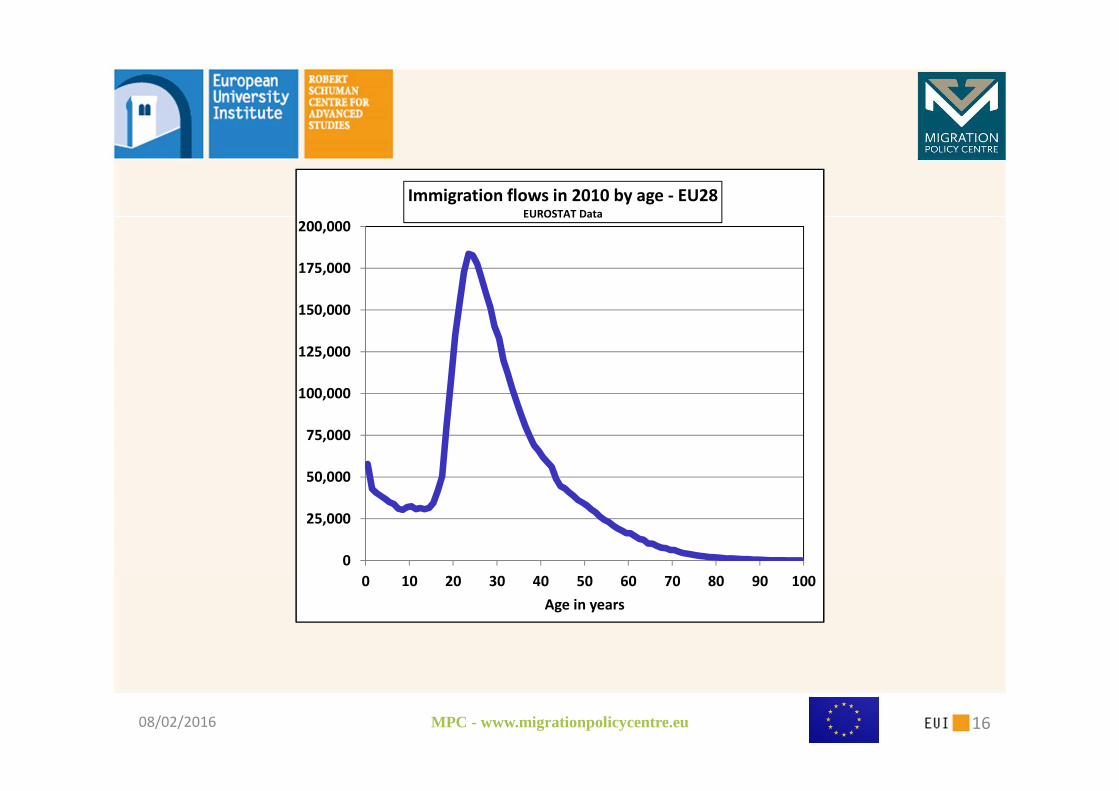
0
25,000
50,000
75,000
100,000
125,000
150,000
175,000
200,000
0 10 20 30 40 50 60 70 80 90 100
Age in years
Immigration flows in 2010 by age - EU28EUROSTAT Data
08/02/2016 MPC - www.migrationpolicycentre.eu 17
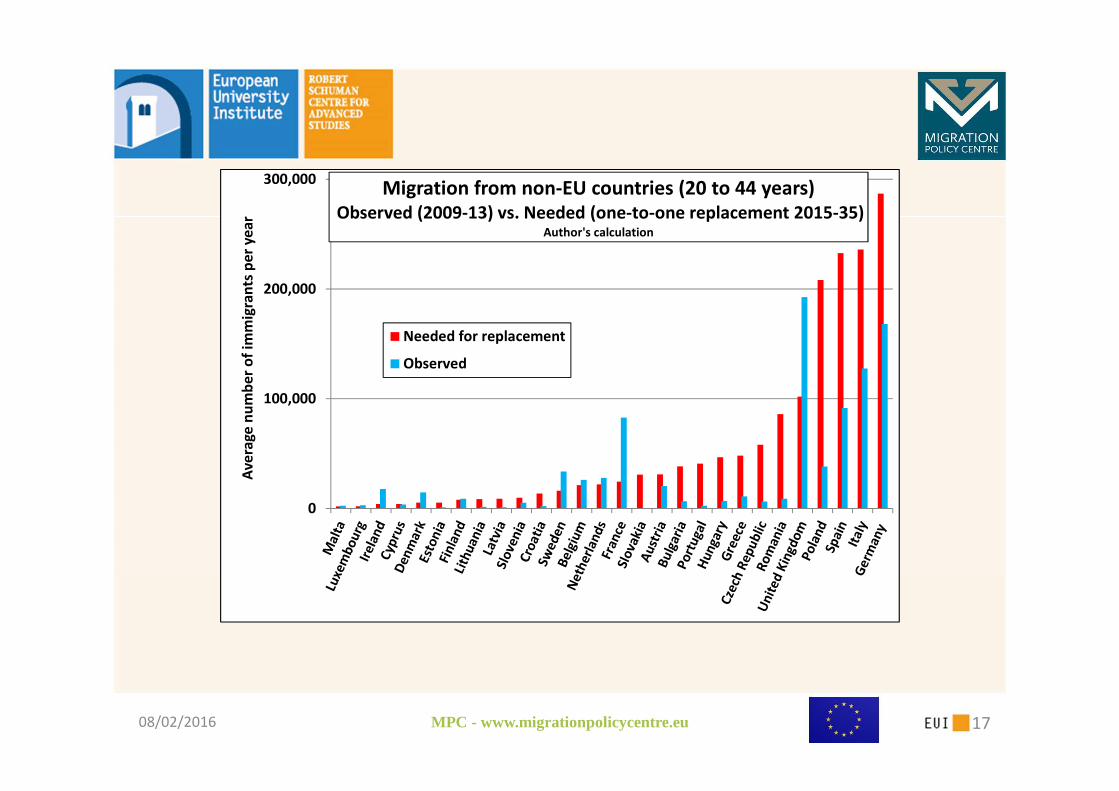
0
100,000
200,000
300,000
Av
era
ge
nu
mb
er
of
imm
igra
nts
pe
r y
ea
r
Migration from non-EU countries (20 to 44 years)
Observed (2009-13) vs. Needed (one-to-one replacement 2015-35)Author's calculation
Needed for replacement
Observed