Embed Size (px)
Citation preview
The AgeingAustralianPopulationand Future
Health Costs:1996-2051
Occasional Papers:New Series No. 7
Department of Health and Aged CareOccasional Papers: New Series No. 7
The Ageing AustralianPopulation and Future
Health Costs: 1996-2051
This paper was prepared byClive Cooper and Philip Hagan
Information and Research BranchPortfolio Strategies Division
Commonwealth Department of Health and Aged Care
August 1999
© Commonwealth of Australia 1999
ISSN 1329-4407
ISBN 0 642 39457 1
This work is copyright. Apart from any use as permitted under the Copyright Act 1968, no part
may be reproduced by any process without written permission from AusInfo. Requests and
enquiries concerning reproduction rights should be directed to the Manager, Legislative
Services, AusInfo, GPO Box 1920, Canberra ACT 2601.
Department of Health and Aged Care Occasional Papers Series
No. 1: National Leadership through Performance Assessment
No. 2: Family and Community Services: When is competition the answer?
No. 3: A Healthy Start for 0-5 Year Olds
No. 4: Compression of Morbidity, Workshop Papers
No. 5: An Overview of Health Status, Health Care and Public Health in Australia
No. 6: Access/Remoteness Index of Australia
Department of Health and Aged Care Occasional Papers: New Series
No. 1: Reforming the Australian Health Care System: The Role of Government
No. 2: Gambling: is it a health hazard?
No. 3: Hospital casemix data and the health of Aboriginal and Torres Strait Islander peoples
No. 4: Private Health Insurance
No. 5: Health Policy and Inequality
No. 6: Measuring Remoteness: Accessibility/Remoteness Index of Australia (ARIA)
No. 7: The Ageing Australian Population and Future Health Costs: 1996-2051
This paper is also available on the Department’s web site: www.health.gov.au
For further information about this paper contact:
Occasional Papers
Department of Health and Aged Care
Portfolio Strategies Division
MDP 85
GPO Box 9848
Canberra ACT 2601
Publication approval number 2585

iii
Contents
Foreword v
1 INTRODUCTION 1
2 PROJECTING HEALTH COSTS 4
3 HOSPITAL COSTS 7
4 MEDICARE COSTS 18
5 PHARMACEUTICAL COSTS 27
6 COMBINED COSTS 36
7 CONCLUSION 41
iv
Department of Health and Aged Care Occasional Papers:New Series
ACKNOWLEDGEMENTS
This seventh publication in the Occasional Papers New Series, The Ageing AustralianPopulation and Future Health Costs: 1996-2051, was written by Clive Cooper and PhilipHagan, Information and Research Branch, Portfolio Strategies Division in the Departmentof Health and Aged Care. The assistance of Richard Solon and Paula Braunstein, of theResearch and Analysis Section, in extracting the data is acknowledged.
The Department gratefully acknowledges the cooperation of the Health DepartmentWestern Australia.
v
Foreword
This paper evolved from a collaborative data-linking project between the CommonwealthDepartment of Health and Aged Care and the Health Department of Western Australia.The three health systems that are the subjects of the paper are treated separately and theanalysis does not depend on linked data. Furthermore, Western Australian hospitalmorbidity costs are not used in the paper but were imputed by the Department of Healthand Aged Care using internal cost data. Therefore, the costs in this paper do notnecessarily reflect actual hospital morbidity costs in Western Australia.
This study projects future health costs attributable to the progressive ageing of theAustralian population based on extensive administrative data on medical practitioner visits(to GPs and specialists), prescription drug consumption and hospital admissions. Scenariosbased on these cost data were applied to projections of the Australian population by ageand sex out to 2051 — by which time the transient effects of the 'baby-boom' cohort willhave worked their way through the system. The long-term nature of the projection period(more than 50 years) and the strong assumptions that have to be made in the studyconcerning the future course of health care costs (namely that today's health care costs area good guide to those likely to be apply over the long term — in real terms) mean that thecost projections reported in this paper must necessarily be heavily qualified. Nevertheless,given such a cost assumption and the future demography of Australia (which is far lessuncertain,) the study's conclusions supports the view that although the ageing of Australia'spopulation will undoubtedly be a significant cost driver of future health costs, theincreased costs attributable to ageing alone should be manageable.
The study’s key results are first that the projected annual real (i.e., inflation-adjusted)increase in health costs due to the combined effect of population growth and the ageing ofthe Australian population reaches a maximum value of about 1.6 per cent in the years2006-2018 (and thereafter the annual rate of growth decreases to about 0.5 per cent by2051) and secondly that the annual per cent increase of health costs due to ageing alonereaches its maximum value of about 1.0 per cent in the period 2012-2019 (and thereafterdecreases to about 0.3 percent by the year 2051).
The study uses a health cost model developed within the Commonwealth Department ofHealth and Aged Care whose starting point is the methodology used by the AustralianBureau of Statistics to produce projections of the population of Australia. The analysisthen applies current treatment patterns and associated costs based on Medical BenefitsScheme (MBS), Pharmaceutical Benefits Scheme (PBS) and hospital morbidity data forWestern Australians — to produce estimates of health costs into the distant future. A newset of indices is introduced. The indices are characteristic of a health system (hospital care,visits to medical practitioners and the consumption of pharmaceuticals) and are calculatedfor a cohort of people — in this case all people in a one-year age group. The indices are acombined measure of the propensity of the cohort to consume health care resources: beingthe product of the proportion of the cohort who uses a particular health care service in agiven year, the average number of such episodes per year and the average cost per episode.Projected health costs are partitioned into two components: one attributable to populationgrowth and the other to the ageing of the population.

vi
1
1 Introduction
The ageing population in Australia, as in other countries, will affect the country'seconomic and social systems. The likely of such effects are the subject of considerableconjecture, commentary, research and analysis. In the health sector, contributions to thedebate are found in the literature1,2,3,4,5 and in the proceedings of national workshops, oneof the most recent being held in March 1999.6
Researchers have adopted a variety of approaches to project part or all of future health andaged care costs. This paper focuses on projecting acute care hospital costs for public andprivate patients, and government expenditure on benefits paid for Medical BenefitsSchedule (MBS) items and Pharmaceutical Benefits Schedule (PBS) items. Althoughaccounting for a considerable proportion of total health outlays, these components of costsdo not cover all such costs: for example they do not include out-of-pocket payments tocover the ‘gaps’ between what doctors charge and what government subsides cover formedical procedures.
Although no consensus on the magnitude of the effect of the ageing population on healthcosts has emerged, there is growing evidence to suggest that the problem is not as large assome commentators have suggested. This paper leans towards the optimistic end of thespread of opinion in that it argues that, although the progressive ageing of the Australianpopulation will present significant challenges for policy makers, the problem should bemanageable to the extent that today’s cost are good guide to those that will apply over thelong term (in real terms), and that the Australian economy continues to grow (on average)over the long run at rates that is has over the last ten-to-fifteen years.
Australia’s Medical Benefits Schedule (MBS), Pharmaceutical Benefits Scheme (PBS) andHospital Morbidity Data (HMD) administrative data collections provide cost informationon health care consumption by residents. Using 1996 data for Western Australia, this studyprojects health care expenditures (excluding co-payments) for the Australian populationout to the year 2051 based on projections of the Australian population generated usingsimilar methodology to that developed by the Australian Bureau of Statistics (ABS) toproduce its population projections.
The calculations of possible future health care costs are based on likely future demand(rather than the supply of services consistent with a limited budget). The reason forpursuing a demand- rather than a supply-side approach is that health services areincreasingly coming to be regarded as an 'entitlement' (i.e., health care services willincreasingly be utilised whenever consumers demand them). Australians consult generalpractitioners (GPs) wherever they feel the need (and can get to see a doctor), and GPs refer 1Goss, J., Eckermann, S., Pinyopusarerk, M. & Wen, X. 1994, Economic Perspective on the Health Impact ofAgeing of the Australian Population in the 21st Century. Seventh National Conference Australian NationalUniversity, Canberra Australia.2Fuchs, V. 1984, The Health Sector’s Share of the Gross National Product, Science, vol 247.3Howe, A.. 1997, Health Care Costs to the Ageing Population: The Case of Australia. Reviews in ClinicalGerontology, 1997.4Evans R. G. 1984, Strained Mercy, Butterworths, Toronto.5McCallum, J., Botsman, P., Clarke, A., Pearse, W. & Keogh, S. Ensuring Quality of Later Life , South WestHealth Care Papers, No.2, University of Western Sydney, Macarthur.6Productivity Commission & Melbourne Institute of Applied Economic and Social Research, PolicyImplications of the Ageing of Australia’s Population Conference, March, 1999.
2
them on to specialists and for hospital treatment if they, in turn, judge that such servicesare needed (i.e., irrespective of supply) - although patients may need to queue to actuallyreceive the services (in particular if they are admitted to hospital as public patients andthey are not assessed as being in need of immediate treatment).
1.1 Aim
The aim of this study is to investigate the effect of the ageing of the Australian populationon the likely costs of health services. To do this it must abstract from other confoundinginfluences - such as the growth in the population over time, and the prospectiveinflationary effects on prices of the introduction of new technology (for example, newpharmaceuticals and medical procedures).
1.2 Population projections
The ABS publishes three series of population projections, which incorporate differentassumptions about future rates of fertility, mortality, overseas migration and internalmigration. 7 Each projection is 'static' in the sense that the ABS fixes populationparameters, such as the fertility rate and net immigration rate in the model for the durationof the projection period. The Department of Health and Aged Care has developed its ownin-house population projection model using the same methodology as the ABS but whichallows any of the population parameters to be varied at will, and which produces projectedpopulation numbers for one-year age groups, by sex.
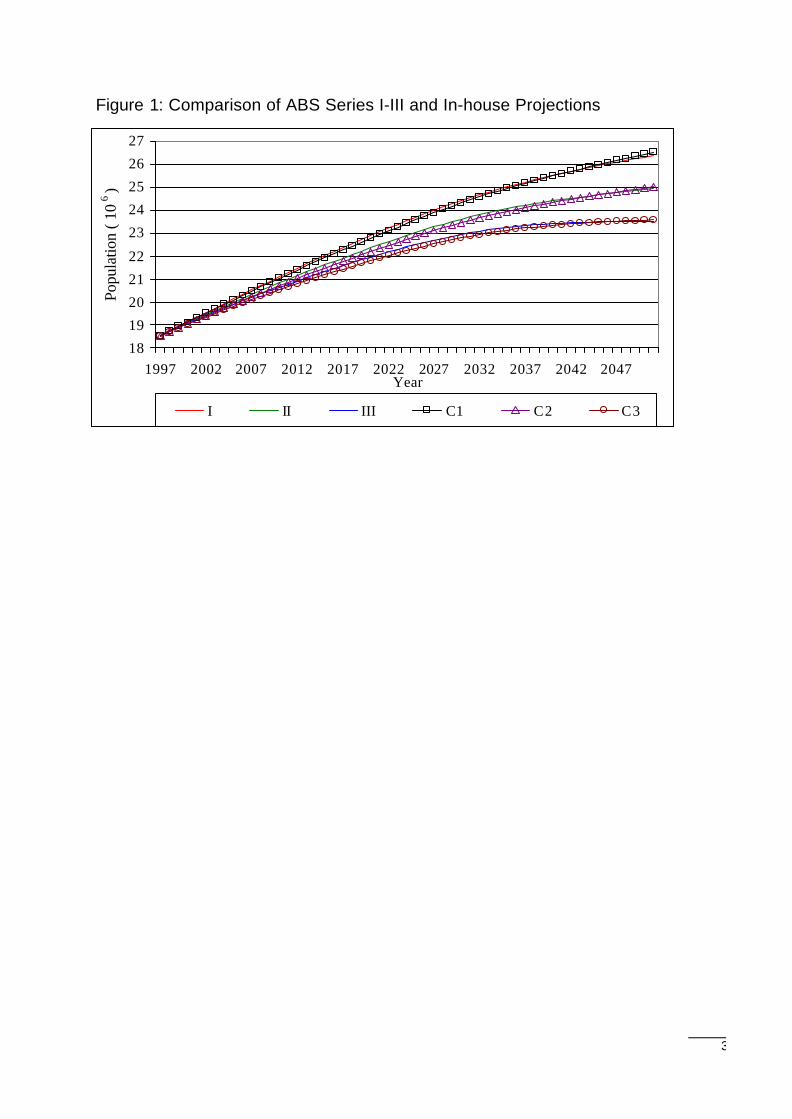
The in-house population projection facility produces very similar projections to thoseproduced by the ABS given similar assumptions about the underlying populationparameters.8 At this stage of its development, the differences between the three ABSpopulation projection series and equivalent in-house prototype series are relatively small.Absolute average differences over the period 1997 to 2051 range from 0.31 per cent (witha standard deviation of 0.15 per cent) for Series I, to 0.47 per cent (with a standarddeviation of 0.21 per cent) for Series II. Figure 1 compares the ABS series with the in-house series (the ABS projections are labelled I, II and III; the in-house projections arelabelled C1, C2 and C3).
7Australian Bureau of Statistics (ABS 1998), Population projections, 1997 to 2051, Cat. No. 3222.0, AGPS,Canberra.8It is not possible to replicate the ABS projections exactly, since the Department does not have access to allthe necessary detailed data.
3
Figure 1: Comparison of ABS Series I-III and In-house Projections
18
19
20
21
22
23
24
25
26
27
1997 2002 2007 2012 2017 2022 2027 2032 2037 2042 2047Year
Popu
latio
n ( 1
06 )
I II III C1 C2 C3
4
2 Projecting Health Costs
For convenience, an episode (of health care) is defined as utilisation of one of the healthsystems. Thus, consulting a doctor, obtaining a script from a pharmacy and being admittedto a hospital are all examples of an episode.
In general terms the method used to project future health costs, HC, is:
(1) HC = n x p x E x C
where:
n = number of people in a given cohort;p = proportion of the cohort who use a health service;E = the average number of episodes per year; andC = the average cost per episode (base year prices).
There are 101 cohorts consisting of: people aged less than one year, people aged 1 to 2years, and so on up to people aged 99 to 100 years; with the last cohort comprising peopleaged 100 years and older. Equation (1) is applied to each of the MBS, the PBS and acutecare health systems separately. An explanation of the parameters used in equation (1) isgiven in the following paragraphs.
2.1 Cohort size
The cohort sizes are produced by the population projection module of the health costmodel for each one-year age group (plus the over 100s) from 1997 to 2051.
2.2 Proportion of the population utilising a health service
The proportion, pi, of all people of a given sex who utilise a health system is defined asfollows:
pI = proportion of people of age x who utilise a health service
where i≤x<I+1 fori = 0 to 99, and
p100 = proportion of people of age 100 or older who utilise a health service
That is, the proportion of all people who utilise a health system is computed in turn foreach of 101 cohorts for each sex and these proportions are calculated for each of MBS,PBS and acute care systems (so that there are a total of 606 proportions).
2.3 Episodes per person
The number of people admitted to hospital for each age cohort, and the total number ofepisodes is extracted from the 1996 hospital morbidity data for Western Australia. The
5
average number of episodes for a given age/sex cohort is computed by dividing therelevant number of episodes by the number of people in the age/sex cohort.
2.4 Cost per episode
The cost of each Diagnosis Related Group (DRG) in the 1996 hospital morbidity data forWestern Australia was sourced from Casemix data.9 The total hospital cost for each cohortwas then arrived at by summing over all DRGs - with the average cost per episodecalculated as the total cost divided by the number of episodes. (The same approach wasused to calculate average MBS and PBS costs per episode).
2.5 Assumptions
The cost projections reported in this study are predicated on the following restrictiveassumptions – assumptions which necessarily heavily qualify the results and which shouldbe borne in mind when trying to interpret them:
• The utilisation of health services by people of a particular age in Western Australia isnot different to the utilisation by people of the same age in other parts of Australia. Putanother way, this assumption is equivalent to presuming that the health servicestypically received by Australians aged, say 25, is independent of geographic location.This is a strong assumption that needs to be tested; and while it is unlikely to be true indetail (for example, the incidence of melanoma around the country), the law of largenumbers suggests that it is probably a reasonable working assumption. 10
• The proportions, pi, of the population who utilise a health service is invariant over time(and are adequately represented by available administrative data).11 That is, it isassumed that the predisposition towards morbidity does not change over time. This isagain a strong assumption which ignores any improvement in morbidity over the next50 years due, for example, to improved population health measures. To the extent thatmorbidity continues to decline over time (and there is Australian evidence of this), theestimates presented here would overestimate future costs. 12
• The average number of times per year that Australians of a given age/sex cohort utilisehealth services is also invariant over time (and is adequately represented by availabledata from Western Australia). Again, this is a strong assumption, especiallyconsidering ongoing initiatives designed to improve the accessibility of health services(particularly in rural and remote areas of Australia), and the progressive adoption ofnew technologies (such as telemedicine) with the potential to change usage patterns
9Department of Health and Family Services 1997, Australian Casemix Report on Hospital Activity 1995-1996, AGPS, Canberra .10The analysis will be done when the data are available.11 One problem with the date is its ‘snapshot” nature. Its reliability and represtativeness for the purpose towhich it has been put would more readily be able to be established if the available data covered a longer timeperiod (so that, for example, any trends in the data could be established). This is particularly a potentialproblem with the hospital data (which cover only to a single year). A further problem with this particulardataset in terms of its representativeness for calculating morbidity patterns is that at both the beginning (andat the end of the year) some patients have already started (or not yet finished) their stay in hospital – so that aproportion of hospital episodes covered by the data are ‘truncated’.12Australian Institute of Health and Welfare (AIHW) 1998, Australia's Health 1998 , AGPS, Canberra.
6
significantly over time. Against this, Australians are becoming healthier over time -suggesting that future usage may not be as intensive.13
• The average cost per episode is also invariant over time (and is adequately representedby available administrative data from Western Australia). This is arguably thestrongest (and least defensible) assumption that has been made in order to generateprojections of future health costs, since it ignores prospective changes in the cost ofhealth services due to such things as the increase in the variety and complexity ofmedical procedures and the cost of the associated technologies. Neither does itconsider the trend towards the use of more expensive pharmaceuticals. On the otherhand, the introduction of new technologies can be expected to reduce costs (in realterms) over the long run (since that has been the experience with the vast majority ofinnovations that have enjoyed widespread adoption).
• Finally, no attempt is made to consider any productivity gains in the health careindustry (which would lower costs).
In summary, prospective health care costs reported in this paper are calculated on the basisthat patterns of morbidity and (real) costs do not change from 1996 levels (i.e., today’scosts are a good guide to those that will apply indefinitely into the future). Although thiscost assumption is the obvious one to make, it is nevertheless a certainty that it will notprove true in practice over the 50-year projection horizon contemplated by the succeedinganalysis. Whether costs per episode will prove to be higher (in real terms) that thoserecorded in the available data, or lower, is moot. Perhaps a majority of readers would optfor the view that costs are more likely to increase that to decrease real terms over the longrun given the nature of health care markets in Australia – characterised as they are byasymmetric information (where providers know a lot more about treatment options andtheir likely consequences, including costs), and third-party payment arrangements (whereindividuals do not bear all their health care costs due to the presence of government-provided and private health insurance.14
The combination of the above assumptions which have had to be made to make thecalculations possible means that the projected costs in this study will largely be driven bydemographic changes alone (which is the major intention of the study). So, although theother assumptions are highly restrictive they support the aim of the study by making itpossible to separate the effect of ageing on health costs from other (possibly moreimportant) cost drivers. Nevertheless, the conclusions of the study should be interpretedwith caution, particularly in view of the strong nature of the assumptions on which theresults are predicated.
13One way of exploring the importance of this assumption is to conduct sensitivity tests where utilisationrates are varied systematically to show the effects on aggregate costs. However, since this paper’s principalaim is to look just at the likely effects of ageing such sensitivity tests have not been pursued here - althoughit is clear that a major driver of increasing real health costs per capita has been increasing utilisation ratesover time.14 Increasing numbers medical practitioners, the emergence of new medical technologies, and expandinghealth insurance – in combination with fee-for-service payments – are a potent combination in terms of theirpotential to generate a rapidly growing demand for ever more costly tests, procedures and treatment(including a component which is purely age-related).
7
3 Hospital Costs
The projected hospital costs in this paper are for acute care episodes in public and privatehospitals. The costs are based on the average national cost per DRG taken from Table A.1(public acute hospitals) and Table A.2 (private acute hospitals) in the Australian CasemixReport 1995-96.15 Since these are national averages they do not accurately reflect the costsin Western Australia. However, in terms of public acute care separations from hospital, 17of the top 20 DRGs for Australia were in the top 20 DRGs for Western Australia and thetop six were identical. For private acute care separations there were 16 common DRGs andthe top 10 differed by three ranks or less. A similar level of agreement or better exists forbed days and cost by volume for the top 20 DRGs. In the context of the long-termprojections in this paper, this suggests, despite the differences, that Western Australia is areasonable proxy for Australia.
The health cost projection are worked up in three stages. First, the projected costs for theABS Series I population projections are calculated. This series is used because it projectsthe greatest population increases as compared with Series II and III (and might thereforebe viewed as the most pessimistic scenario in terms of likely future hospital costs). This istermed the 'Normal population projection'.
Next, a 'Constant population projection' is costed. The Constant population projection isproduced by fixing the population at its 1996 levels but constraining its age/sexcomposition to mirror the age/sex composition of the Normal population projection yearby year. The effect is to remove population growth as a factor driving estimated acute carecosts. Projected hospital costs are then due entirely to the changing ratios of the number ofpeople in each one-year age group, yielding an unadulterated view of the effect of theageing population on acute care costs.
Finally, a 'Differential population projection' is costed. In this projection, the 1996population is subtracted from the Constant population projection - so that the age groupscontributing to increased hospital costs over time, and those leading to decreased hospitalcosts are revealed.
3.1 Acute-care cost parameters
The following sections discuss the determinants of hospital costs that drive the resultsreported for acute care.
Proportion of people admitted to hospital
Figure 2 shows the proportions, by sex and age, of Western Australians admitted tohospital annually. As expected, the proportions of the very young for both sexes start atrelatively high levels and decrease to about 5 per cent by around age 10. The proportion ofwomen admitted to hospital, predominantly for childbirth, increases from 9 per cent fromabout 15 years of age to a peak of just less than 30 per cent at about 30 years, and thendeclines to 15 per cent at about 43 years of age. From about 50 years of age, the proportion
15Department of Health and Family Services, 1997, Australian Casemix Report on hospital activity for 1995-1996, AGPS, Canberra .
8
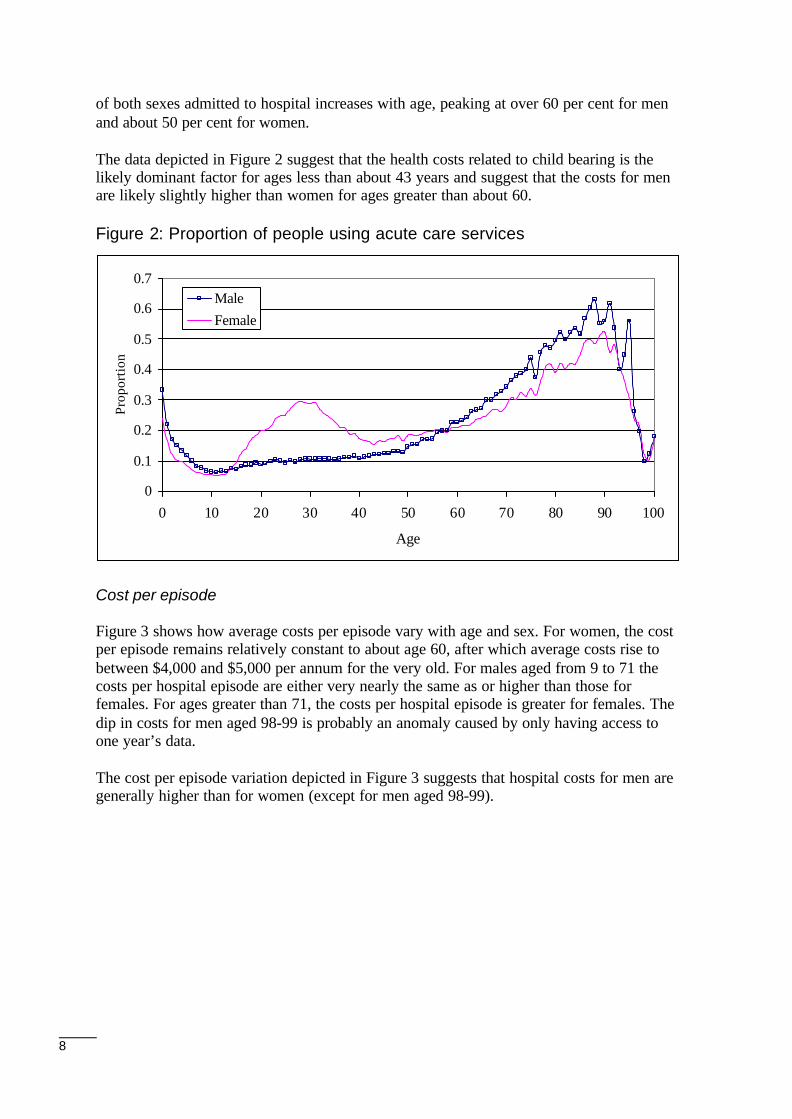
of both sexes admitted to hospital increases with age, peaking at over 60 per cent for menand about 50 per cent for women.
The data depicted in Figure 2 suggest that the health costs related to child bearing is thelikely dominant factor for ages less than about 43 years and suggest that the costs for menare likely slightly higher than women for ages greater than about 60.
Figure 2: Proportion of people using acute care services
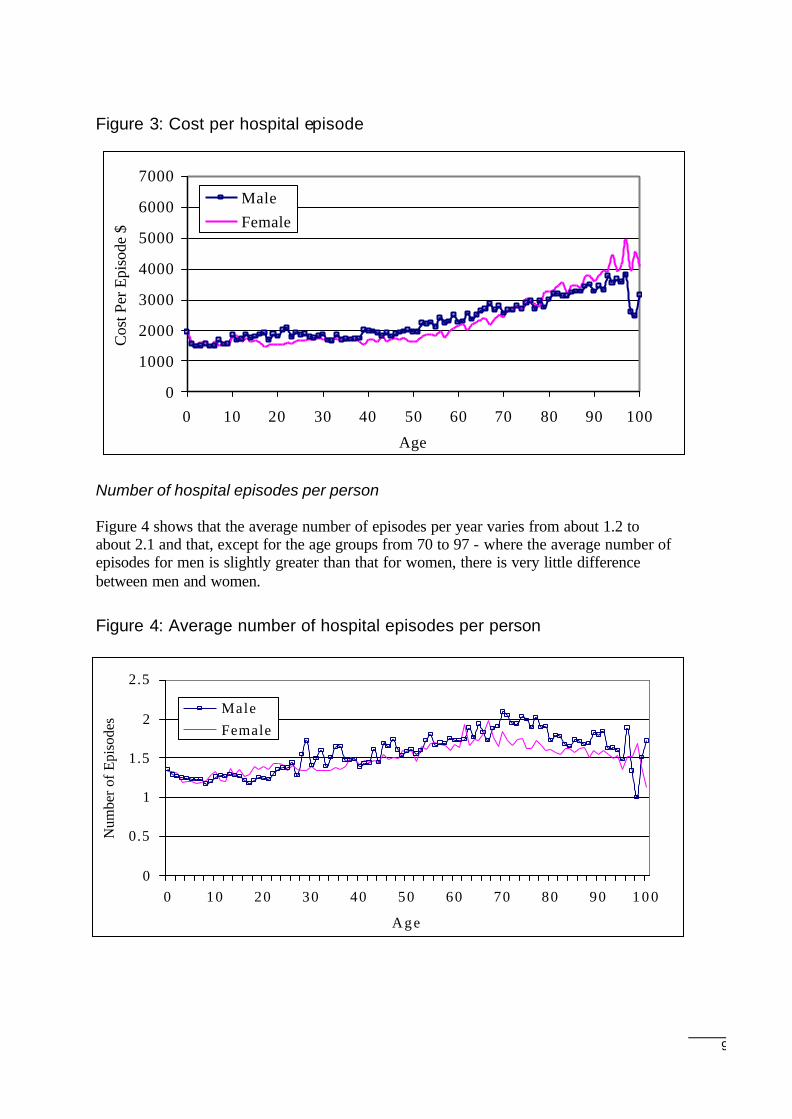
Cost per episode
Figure 3 shows how average costs per episode vary with age and sex. For women, the costper episode remains relatively constant to about age 60, after which average costs rise tobetween $4,000 and $5,000 per annum for the very old. For males aged from 9 to 71 thecosts per hospital episode are either very nearly the same as or higher than those forfemales. For ages greater than 71, the costs per hospital episode is greater for females. Thedip in costs for men aged 98-99 is probably an anomaly caused by only having access toone year’s data.
The cost per episode variation depicted in Figure 3 suggests that hospital costs for men aregenerally higher than for women (except for men aged 98-99).
0
0.1
0.2
0.3
0.4
0.5
0.6
0.7
0 10 20 30 40 50 60 70 80 90 100
Age
Prop
ortio
n
MaleFemale
9
Figure 3: Cost per hospital episode
Number of hospital episodes per person
Figure 4 shows that the average number of episodes per year varies from about 1.2 toabout 2.1 and that, except for the age groups from 70 to 97 - where the average number ofepisodes for men is slightly greater than that for women, there is very little differencebetween men and women.
Figure 4: Average number of hospital episodes per person
0
1000
2000
3000
4000
5000
6000
7000
0 10 20 30 40 50 60 70 80 90 100
Age
Cos
t Per
Epi
sode
$
MaleFemale
0
0.5
1
1.5
2
2.5
0 10 20 30 40 50 60 70 80 90 1 0 0
Age
Num
ber o
f Epi
sode
s
MaleFemale
10
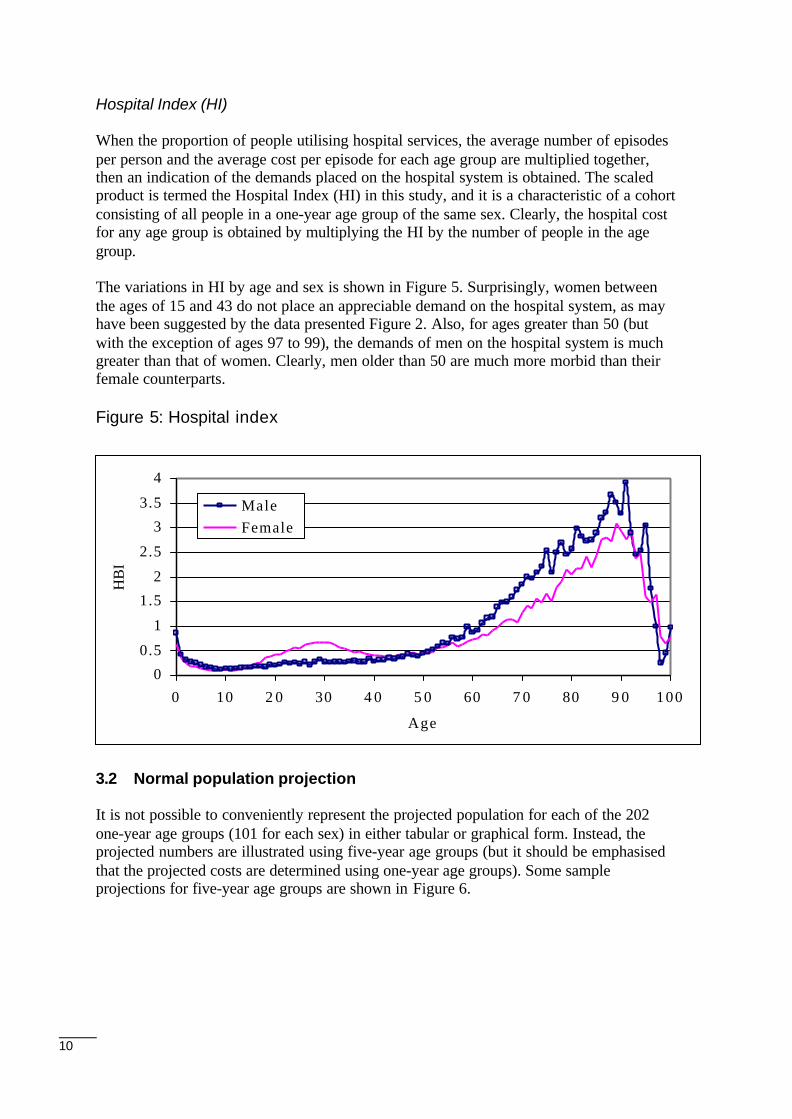
Hospital Index (HI)
When the proportion of people utilising hospital services, the average number of episodesper person and the average cost per episode for each age group are multiplied together,then an indication of the demands placed on the hospital system is obtained. The scaledproduct is termed the Hospital Index (HI) in this study, and it is a characteristic of a cohortconsisting of all people in a one-year age group of the same sex. Clearly, the hospital costfor any age group is obtained by multiplying the HI by the number of people in the agegroup.
The variations in HI by age and sex is shown in Figure 5. Surprisingly, women betweenthe ages of 15 and 43 do not place an appreciable demand on the hospital system, as mayhave been suggested by the data presented Figure 2. Also, for ages greater than 50 (butwith the exception of ages 97 to 99), the demands of men on the hospital system is muchgreater than that of women. Clearly, men older than 50 are much more morbid than theirfemale counterparts.
Figure 5: Hospital index
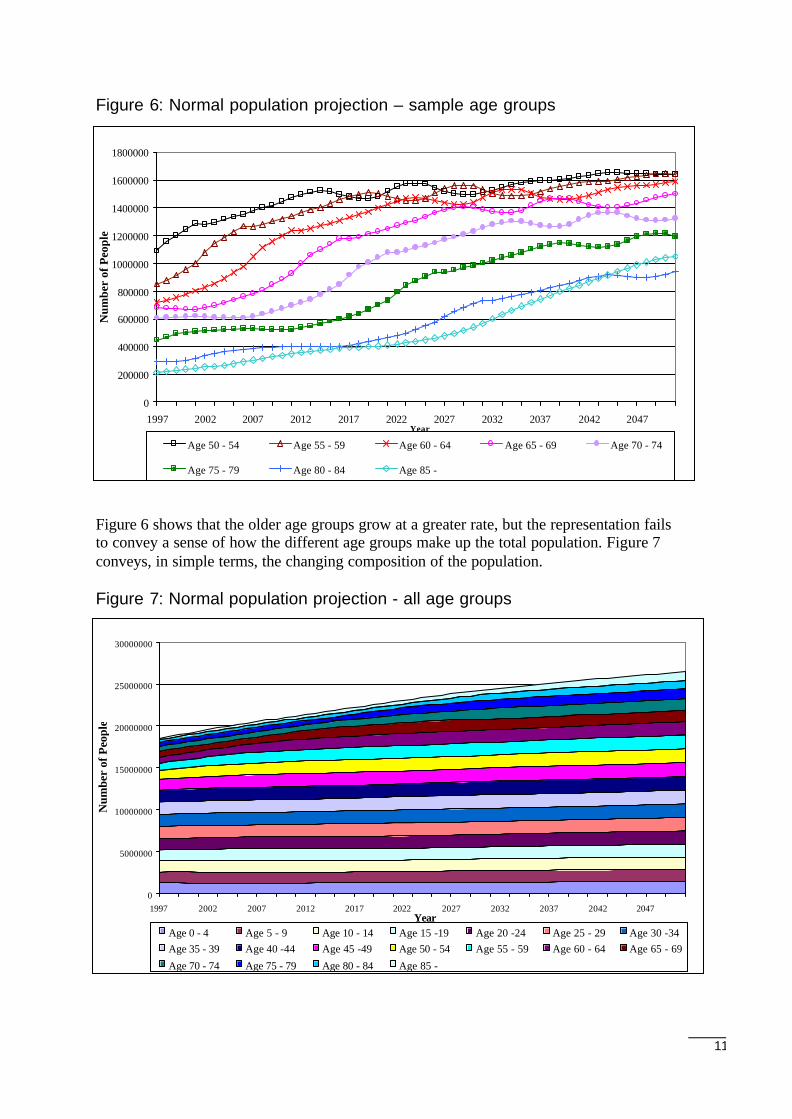
3.2 Normal population projection
It is not possible to conveniently represent the projected population for each of the 202one-year age groups (101 for each sex) in either tabular or graphical form. Instead, theprojected numbers are illustrated using five-year age groups (but it should be emphasisedthat the projected costs are determined using one-year age groups). Some sampleprojections for five-year age groups are shown in Figure 6.
0
0.5
1
1.5
2
2.5
3
3.5
4
0 10 2 0 30 4 0 5 0 60 7 0 80 9 0 100
Age
HB
I
Male Female
11
Figure 6: Normal population projection – sample age groups
Figure 6 shows that the older age groups grow at a greater rate, but the representation failsto convey a sense of how the different age groups make up the total population. Figure 7conveys, in simple terms, the changing composition of the population.
Figure 7: Normal population projection - all age groups
0
5000000
10000000
15000000
20000000
25000000
30000000
1997 2002 2007 2012 2017 2022 2027 2032 2037 2042 2047Year
Num
ber
of P
eopl
e
Age 0 - 4 Age 5 - 9 Age 10 - 14 Age 15 -19 Age 20 -24 Age 25 - 29 Age 30 -34Age 35 - 39 Age 40 -44 Age 45 -49 Age 50 - 54 Age 55 - 59 Age 60 - 64 Age 65 - 69
Age 70 - 74 Age 75 - 79 Age 80 - 84 Age 85 -
0
200000
400000
600000
800000
1000000
1200000
1400000
1600000
1800000
1997 2002 2007 2012 2017 2022 2027 2032 2037 2042 2047Year
Num
ber
of P
eopl
e
Age 50 - 54 Age 55 - 59 Age 60 - 64 Age 65 - 69 Age 70 - 74
Age 75 - 79 Age 80 - 84 Age 85 -
12
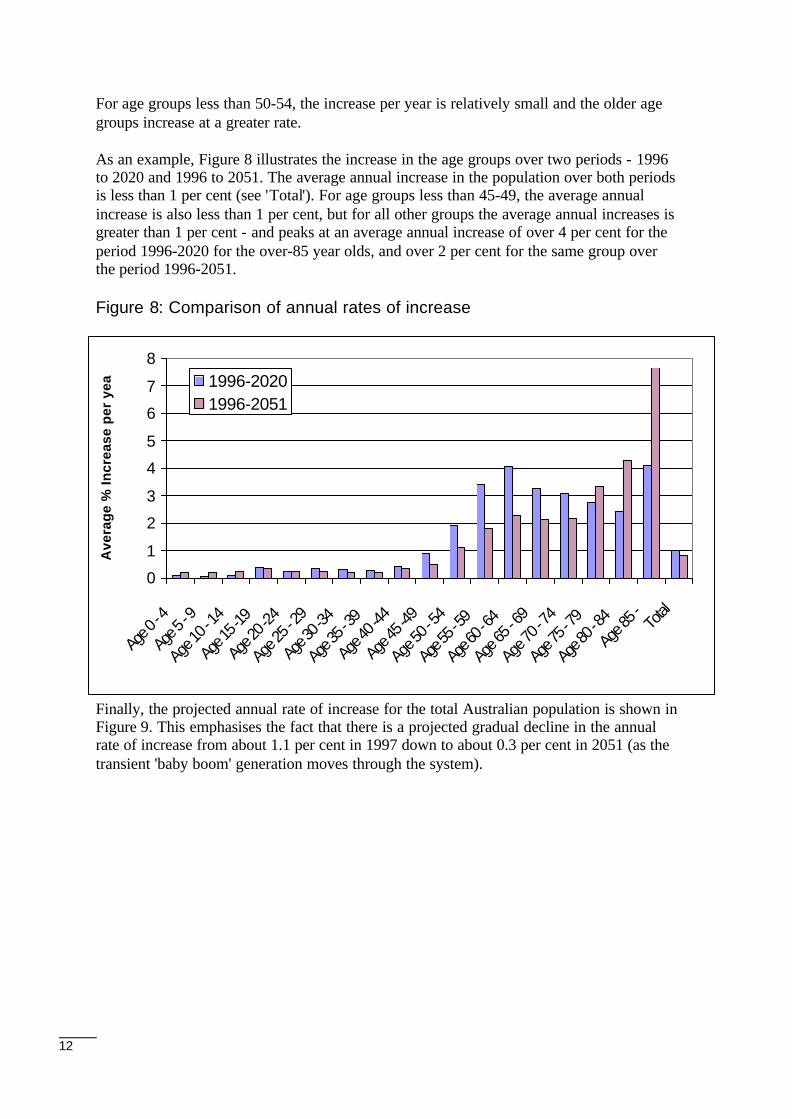
For age groups less than 50-54, the increase per year is relatively small and the older agegroups increase at a greater rate.
As an example, Figure 8 illustrates the increase in the age groups over two periods - 1996to 2020 and 1996 to 2051. The average annual increase in the population over both periodsis less than 1 per cent (see 'Total'). For age groups less than 45-49, the average annualincrease is also less than 1 per cent, but for all other groups the average annual increases isgreater than 1 per cent - and peaks at an average annual increase of over 4 per cent for theperiod 1996-2020 for the over-85 year olds, and over 2 per cent for the same group overthe period 1996-2051.
Figure 8: Comparison of annual rates of increase
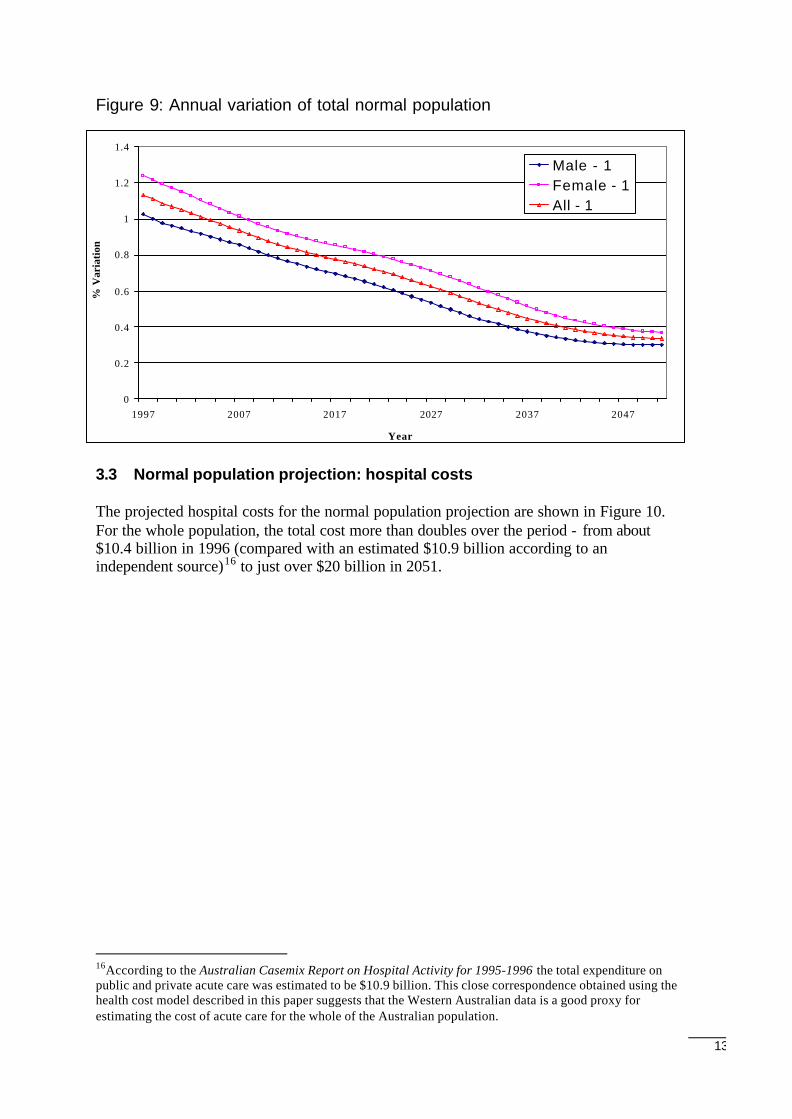
Finally, the projected annual rate of increase for the total Australian population is shown inFigure 9. This emphasises the fact that there is a projected gradual decline in the annualrate of increase from about 1.1 per cent in 1997 down to about 0.3 per cent in 2051 (as thetransient 'baby boom' generation moves through the system).
0
1
2
3
4
5
6
7
8
Age 0
- 4
Age 5
- 9
Age 10
- 14
Age 1
5 -19
Age 2
0 -24
Age 2
5 - 29
Age 3
0 -34
Age 3
5 - 39
Age 4
0 -44
Age 4
5 -49
Age 50
- 54
Age 5
5 - 59
Age 6
0 - 64
Age 6
5 - 69
Age 70
- 74
Age 7
5 - 79
Age 8
0 - 84
Age 8
5 - Total
Ave
rag
e %
Incr
ease
per
yea
r
1996-20201996-2051
13
Figure 9: Annual variation of total normal population
3.3 Normal population projection: hospital costs
The projected hospital costs for the normal population projection are shown in Figure 10.For the whole population, the total cost more than doubles over the period - from about$10.4 billion in 1996 (compared with an estimated $10.9 billion according to anindependent source)16 to just over $20 billion in 2051.
16According to the Australian Casemix Report on Hospital Activity for 1995-1996 the total expenditure onpublic and private acute care was estimated to be $10.9 billion. This close correspondence obtained using thehealth cost model described in this paper suggests that the Western Australian data is a good proxy forestimating the cost of acute care for the whole of the Australian population.
0
0.2
0.4
0.6
0.8
1
1.2
1.4
1997 2007 2017 2027 2037 2047
Year
% V
aria
tion
Male - 1Female - 1All - 1
14
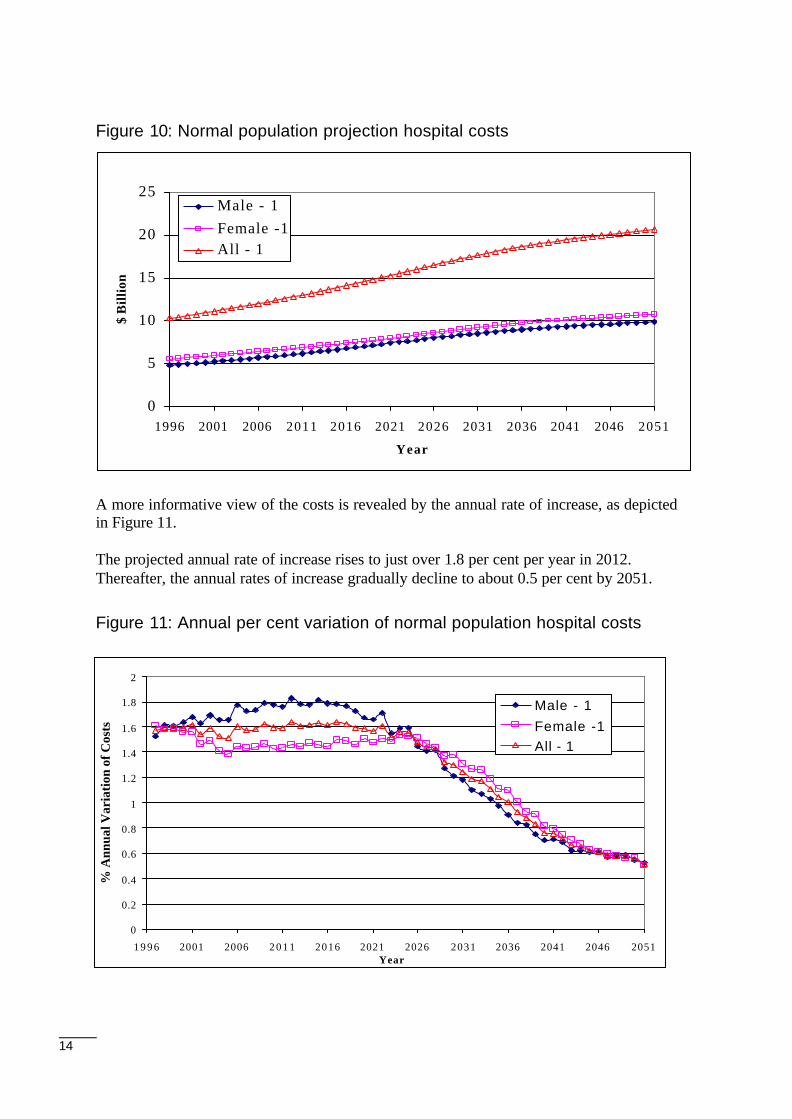
Figure 10: Normal population projection hospital costs
A more informative view of the costs is revealed by the annual rate of increase, as depictedin Figure 11.
The projected annual rate of increase rises to just over 1.8 per cent per year in 2012.Thereafter, the annual rates of increase gradually decline to about 0.5 per cent by 2051.
Figure 11: Annual per cent variation of normal population hospital costs
0
5
10
15
20
25
1996 2001 2006 2011 2016 2021 2026 2031 2036 2041 2046 2051
Year
$ B
illio
n
Male - 1Female -1All - 1
0
0.2
0.4
0.6
0.8
1
1.2
1.4
1.6
1.8
2
1 9 9 6 2001 2006 2 0 1 1 2016 2021 2026 2031 2036 2041 2046 2051Year
% A
nnua
l Var
iati
on o
f Cos
ts
Male - 1
Female -1All - 1
15
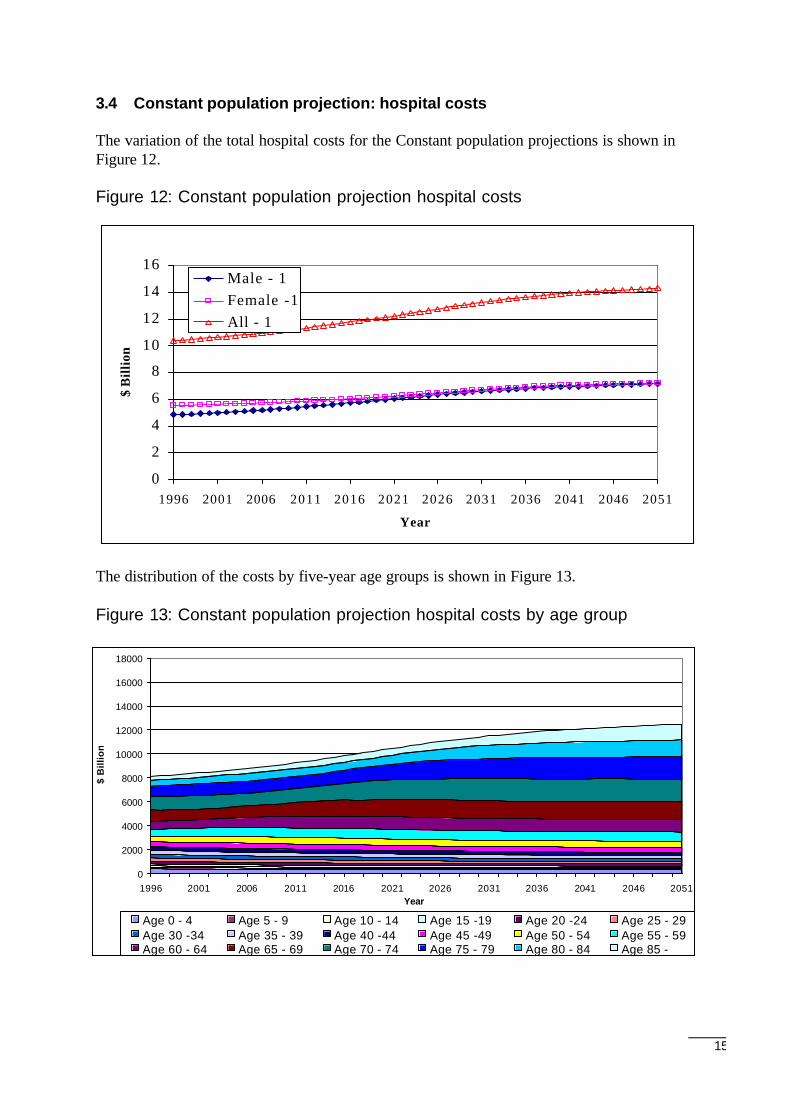
3.4 Constant population projection: hospital costs
The variation of the total hospital costs for the Constant population projections is shown inFigure 12.
Figure 12: Constant population projection hospital costs
The distribution of the costs by five-year age groups is shown in Figure 13.
Figure 13: Constant population projection hospital costs by age group
0
2
4
6
8
10
12
14
16
1996 2001 2006 2011 2016 2021 2026 2031 2036 2041 2046 2051
Year
$ B
illio
n
Male - 1Female -1All - 1
0
2000
4000
6000
8000
10000
12000
14000
16000
18000
1996 2001 2006 2011 2016 2021 2026 2031 2036 2041 2046 2051Year
$ B
illio
n
Age 0 - 4 Age 5 - 9 Age 10 - 14 Age 15 -19 Age 20 -24 Age 25 - 29Age 30 -34 Age 35 - 39 Age 40 -44 Age 45 -49 Age 50 - 54 Age 55 - 59Age 60 - 64 Age 65 - 69 Age 70 - 74 Age 75 - 79 Age 80 - 84 Age 85 -
16
Figure 13 clearly illustrates the ageing effect on prospective health care costs as the 'babyboomers' move through the system. The costs for age groups up to 50-54 either decreaseslightly or remain relatively constant. In contrast, the costs for the age groups 55-59 andolder increase.
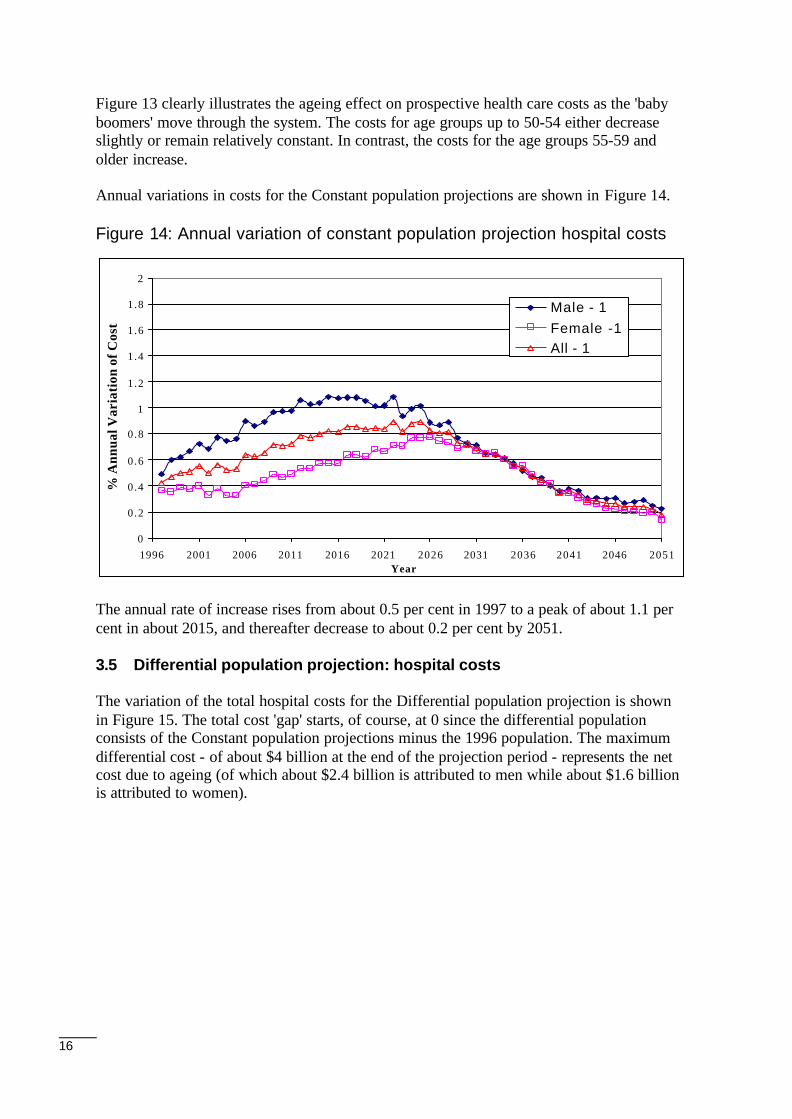
Annual variations in costs for the Constant population projections are shown in Figure 14.
Figure 14: Annual variation of constant population projection hospital costs
The annual rate of increase rises from about 0.5 per cent in 1997 to a peak of about 1.1 percent in about 2015, and thereafter decrease to about 0.2 per cent by 2051.
3.5 Differential population projection: hospital costs
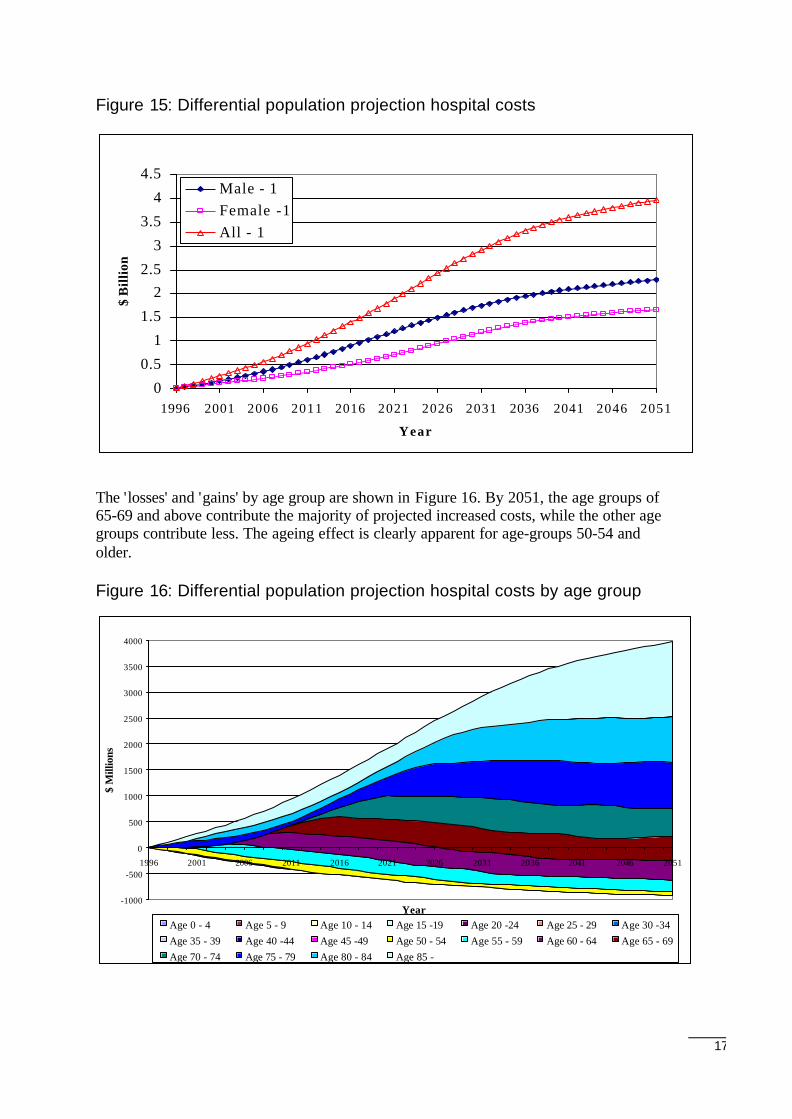
The variation of the total hospital costs for the Differential population projection is shownin Figure 15. The total cost 'gap' starts, of course, at 0 since the differential populationconsists of the Constant population projections minus the 1996 population. The maximumdifferential cost - of about $4 billion at the end of the projection period - represents the netcost due to ageing (of which about $2.4 billion is attributed to men while about $1.6 billionis attributed to women).
0
0.2
0.4
0.6
0.8
1
1.2
1.4
1.6
1.8
2
1996 2001 2006 2011 2016 2021 2026 2031 2036 2041 2046 2051Year
% A
nnua
l Var
iati
on o
f Cos
ts
Male - 1Female -1All - 1
17
Figure 15: Differential population projection hospital costs
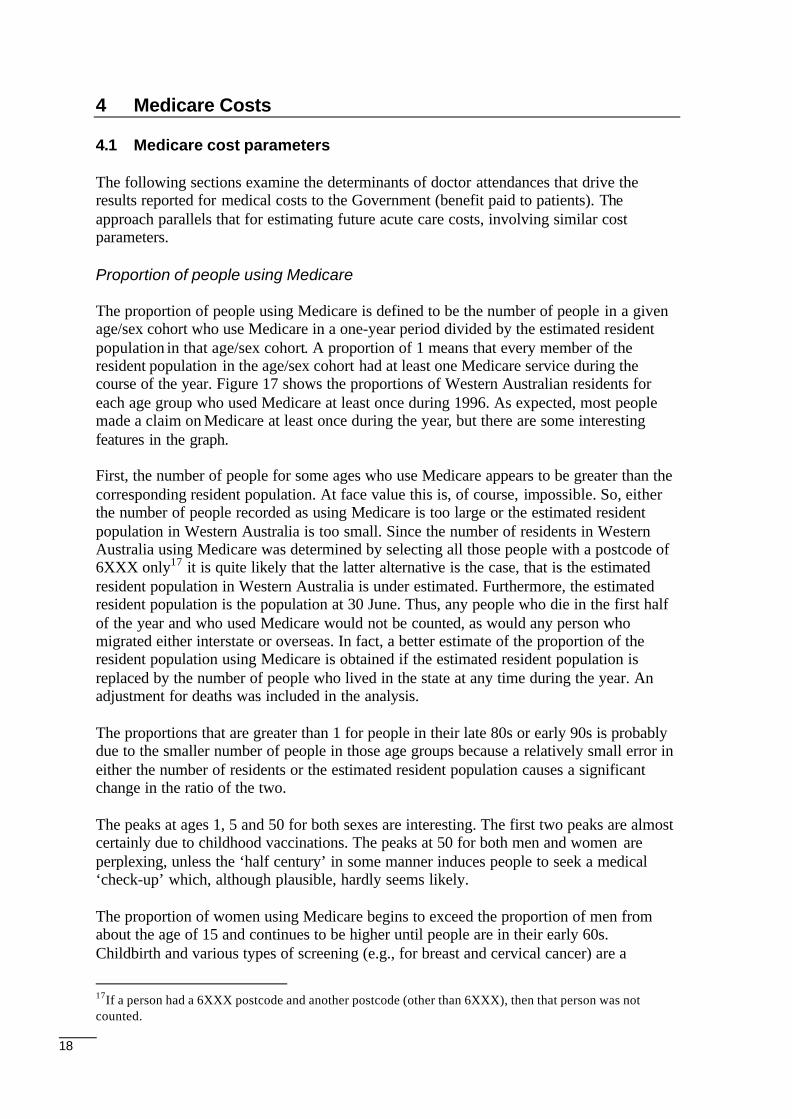
The 'losses' and 'gains' by age group are shown in Figure 16. By 2051, the age groups of65-69 and above contribute the majority of projected increased costs, while the other agegroups contribute less. The ageing effect is clearly apparent for age-groups 50-54 andolder.
Figure 16: Differential population projection hospital costs by age group
0
0.5
1
1.5
22.5
3
3.5
4
4.5
1996 2001 2006 2011 2016 2021 2026 2031 2036 2041 2046 2051
Year
$ B
illio
n
Male - 1Female -1All - 1
-1000
-500
0
500
1000
1500
2000
2500
3000
3500
4000
1996 2001 2006 2011 2016 2021 2026 2031 2036 2041 2046 2051
Year
$ M
illio
ns
Age 0 - 4 Age 5 - 9 Age 10 - 14 Age 15 -19 Age 20 -24 Age 25 - 29 Age 30 -34Age 35 - 39 Age 40 -44 Age 45 -49 Age 50 - 54 Age 55 - 59 Age 60 - 64 Age 65 - 69Age 70 - 74 Age 75 - 79 Age 80 - 84 Age 85 -
18
4 Medicare Costs
4.1 Medicare cost parameters
The following sections examine the determinants of doctor attendances that drive theresults reported for medical costs to the Government (benefit paid to patients). Theapproach parallels that for estimating future acute care costs, involving similar costparameters.
Proportion of people using Medicare
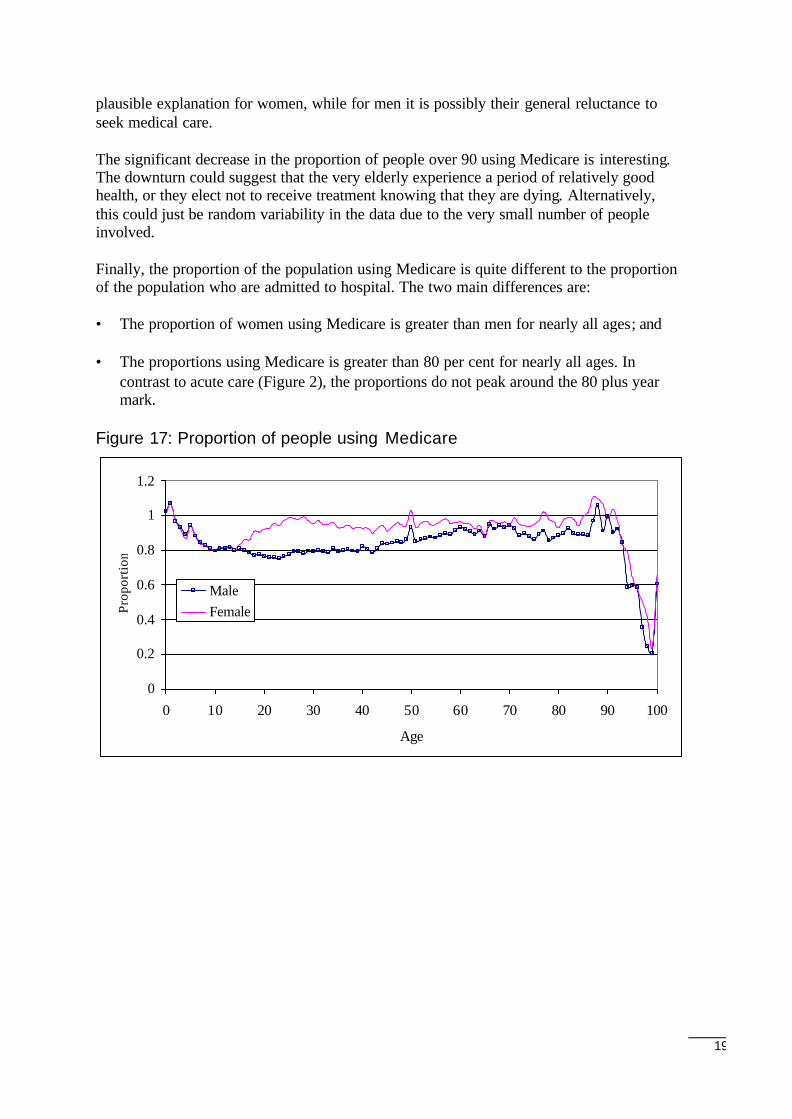
The proportion of people using Medicare is defined to be the number of people in a givenage/sex cohort who use Medicare in a one-year period divided by the estimated residentpopulation in that age/sex cohort. A proportion of 1 means that every member of theresident population in the age/sex cohort had at least one Medicare service during thecourse of the year. Figure 17 shows the proportions of Western Australian residents foreach age group who used Medicare at least once during 1996. As expected, most peoplemade a claim on Medicare at least once during the year, but there are some interestingfeatures in the graph.
First, the number of people for some ages who use Medicare appears to be greater than thecorresponding resident population. At face value this is, of course, impossible. So, eitherthe number of people recorded as using Medicare is too large or the estimated residentpopulation in Western Australia is too small. Since the number of residents in WesternAustralia using Medicare was determined by selecting all those people with a postcode of6XXX only17 it is quite likely that the latter alternative is the case, that is the estimatedresident population in Western Australia is under estimated. Furthermore, the estimatedresident population is the population at 30 June. Thus, any people who die in the first halfof the year and who used Medicare would not be counted, as would any person whomigrated either interstate or overseas. In fact, a better estimate of the proportion of theresident population using Medicare is obtained if the estimated resident population isreplaced by the number of people who lived in the state at any time during the year. Anadjustment for deaths was included in the analysis.
The proportions that are greater than 1 for people in their late 80s or early 90s is probablydue to the smaller number of people in those age groups because a relatively small error ineither the number of residents or the estimated resident population causes a significantchange in the ratio of the two.
The peaks at ages 1, 5 and 50 for both sexes are interesting. The first two peaks are almostcertainly due to childhood vaccinations. The peaks at 50 for both men and women areperplexing, unless the ‘half century’ in some manner induces people to seek a medical‘check-up’ which, although plausible, hardly seems likely.
The proportion of women using Medicare begins to exceed the proportion of men fromabout the age of 15 and continues to be higher until people are in their early 60s.Childbirth and various types of screening (e.g., for breast and cervical cancer) are a
17If a person had a 6XXX postcode and another postcode (other than 6XXX), then that person was notcounted.
19
plausible explanation for women, while for men it is possibly their general reluctance toseek medical care.
The significant decrease in the proportion of people over 90 using Medicare is interesting.The downturn could suggest that the very elderly experience a period of relatively goodhealth, or they elect not to receive treatment knowing that they are dying. Alternatively,this could just be random variability in the data due to the very small number of peopleinvolved.
Finally, the proportion of the population using Medicare is quite different to the proportionof the population who are admitted to hospital. The two main differences are:
• The proportion of women using Medicare is greater than men for nearly all ages; and
• The proportions using Medicare is greater than 80 per cent for nearly all ages. Incontrast to acute care (Figure 2), the proportions do not peak around the 80 plus yearmark.
Figure 17: Proportion of people using Medicare
0
0.2
0.4
0.6
0.8
1
1.2
0 10 20 30 40 50 60 70 80 90 100
Age
Prop
orti
on
MaleFemale
20
Cost per Medicare item
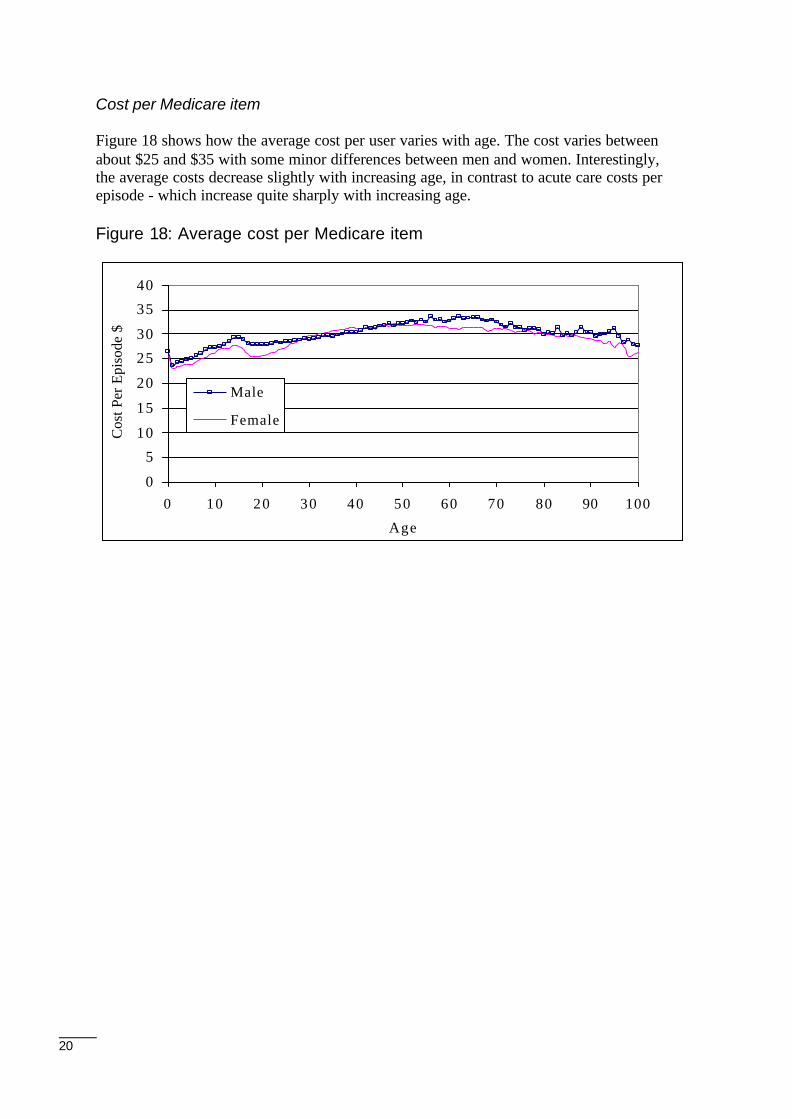
Figure 18 shows how the average cost per user varies with age. The cost varies betweenabout $25 and $35 with some minor differences between men and women. Interestingly,the average costs decrease slightly with increasing age, in contrast to acute care costs perepisode - which increase quite sharply with increasing age.
Figure 18: Average cost per Medicare item
0
5
10
15
20
25
30
35
40
0 10 20 30 40 50 60 70 80 90 100
Age
Cos
t Per
Epi
sode
$
Male
Female
21
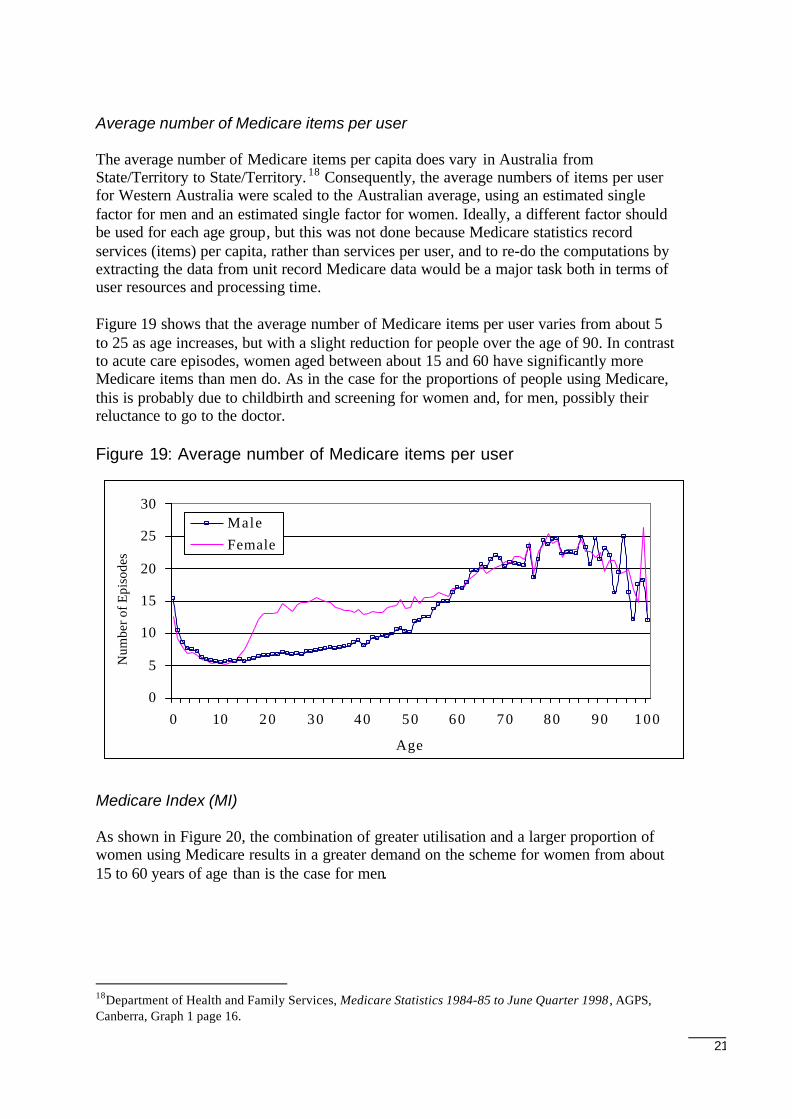
Average number of Medicare items per user
The average number of Medicare items per capita does vary in Australia fromState/Territory to State/Territory. 18 Consequently, the average numbers of items per userfor Western Australia were scaled to the Australian average, using an estimated singlefactor for men and an estimated single factor for women. Ideally, a different factor shouldbe used for each age group, but this was not done because Medicare statistics recordservices (items) per capita, rather than services per user, and to re-do the computations byextracting the data from unit record Medicare data would be a major task both in terms ofuser resources and processing time.
Figure 19 shows that the average number of Medicare items per user varies from about 5to 25 as age increases, but with a slight reduction for people over the age of 90. In contrastto acute care episodes, women aged between about 15 and 60 have significantly moreMedicare items than men do. As in the case for the proportions of people using Medicare,this is probably due to childbirth and screening for women and, for men, possibly theirreluctance to go to the doctor.
Figure 19: Average number of Medicare items per user
Medicare Index (MI)
As shown in Figure 20, the combination of greater utilisation and a larger proportion ofwomen using Medicare results in a greater demand on the scheme for women from about15 to 60 years of age than is the case for men.
18Department of Health and Family Services, Medicare Statistics 1984-85 to June Quarter 1998 , AGPS,Canberra, Graph 1 page 16.
0
5
10
15
20
25
30
0 10 20 30 40 50 60 70 80 90 100
Age
Num
ber o
f Epi
sode
s
MaleFemale
22
Figure 20: Medicare index
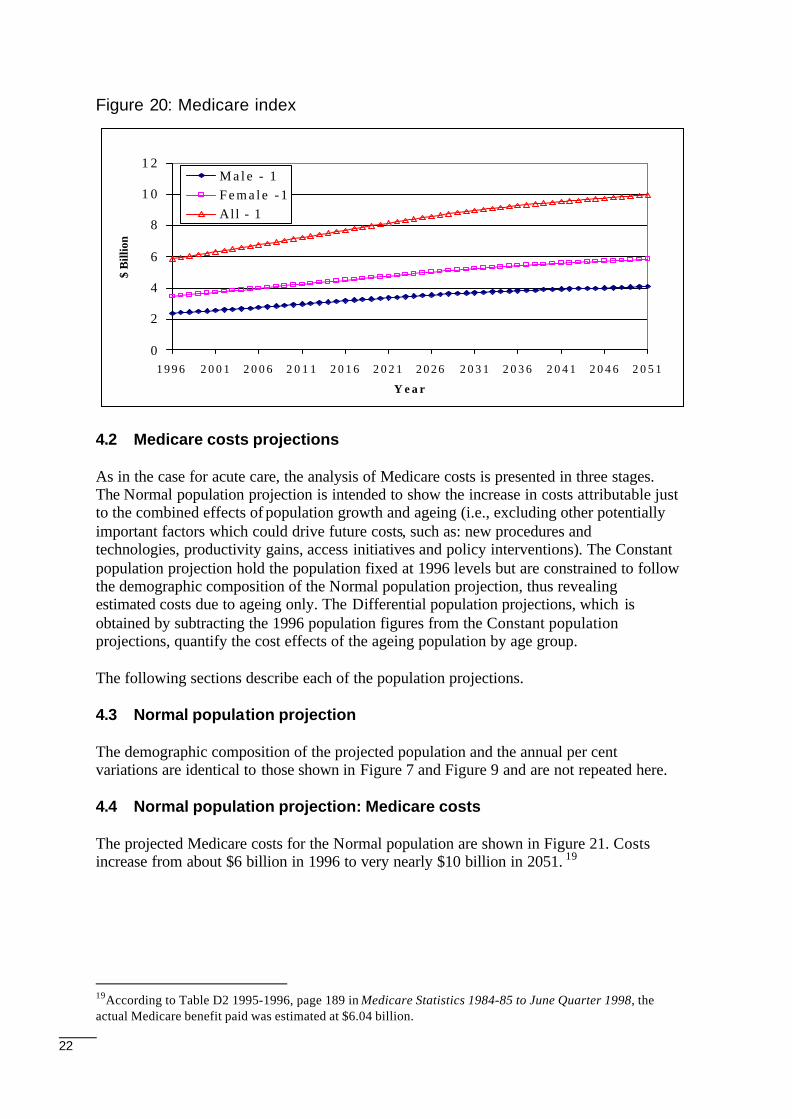
4.2 Medicare costs projections
As in the case for acute care, the analysis of Medicare costs is presented in three stages.The Normal population projection is intended to show the increase in costs attributable justto the combined effects of population growth and ageing (i.e., excluding other potentiallyimportant factors which could drive future costs, such as: new procedures andtechnologies, productivity gains, access initiatives and policy interventions). The Constantpopulation projection hold the population fixed at 1996 levels but are constrained to followthe demographic composition of the Normal population projection, thus revealingestimated costs due to ageing only. The Differential population projections, which isobtained by subtracting the 1996 population figures from the Constant populationprojections, quantify the cost effects of the ageing population by age group.
The following sections describe each of the population projections.
4.3 Normal population projection
The demographic composition of the projected population and the annual per centvariations are identical to those shown in Figure 7 and Figure 9 and are not repeated here.
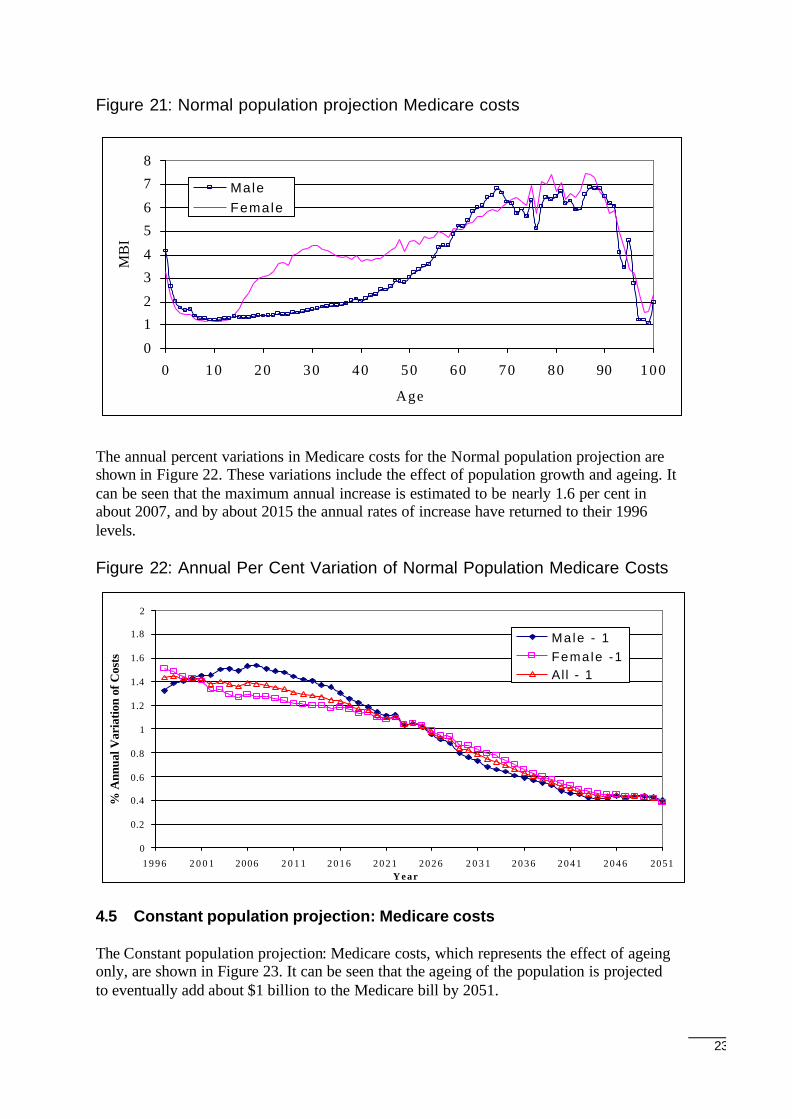
4.4 Normal population projection: Medicare costs
The projected Medicare costs for the Normal population are shown in Figure 21. Costsincrease from about $6 billion in 1996 to very nearly $10 billion in 2051. 19
19According to Table D2 1995-1996, page 189 in Medicare Statistics 1984-85 to June Quarter 1998, theactual Medicare benefit paid was estimated at $6.04 billion.
0
2
4
6
8
1 0
1 2
1 9 9 6 2 0 0 1 2 0 0 6 2 0 1 1 2 0 1 6 2 0 2 1 2 0 2 6 2 0 3 1 2 0 3 6 2 0 4 1 2 0 4 6 2 0 5 1
Y e a r
$ B
illio
n
M a l e - 1F e m a l e - 1All - 1
23
Figure 21: Normal population projection Medicare costs
The annual percent variations in Medicare costs for the Normal population projection areshown in Figure 22. These variations include the effect of population growth and ageing. Itcan be seen that the maximum annual increase is estimated to be nearly 1.6 per cent inabout 2007, and by about 2015 the annual rates of increase have returned to their 1996levels.
Figure 22: Annual Per Cent Variation of Normal Population Medicare Costs
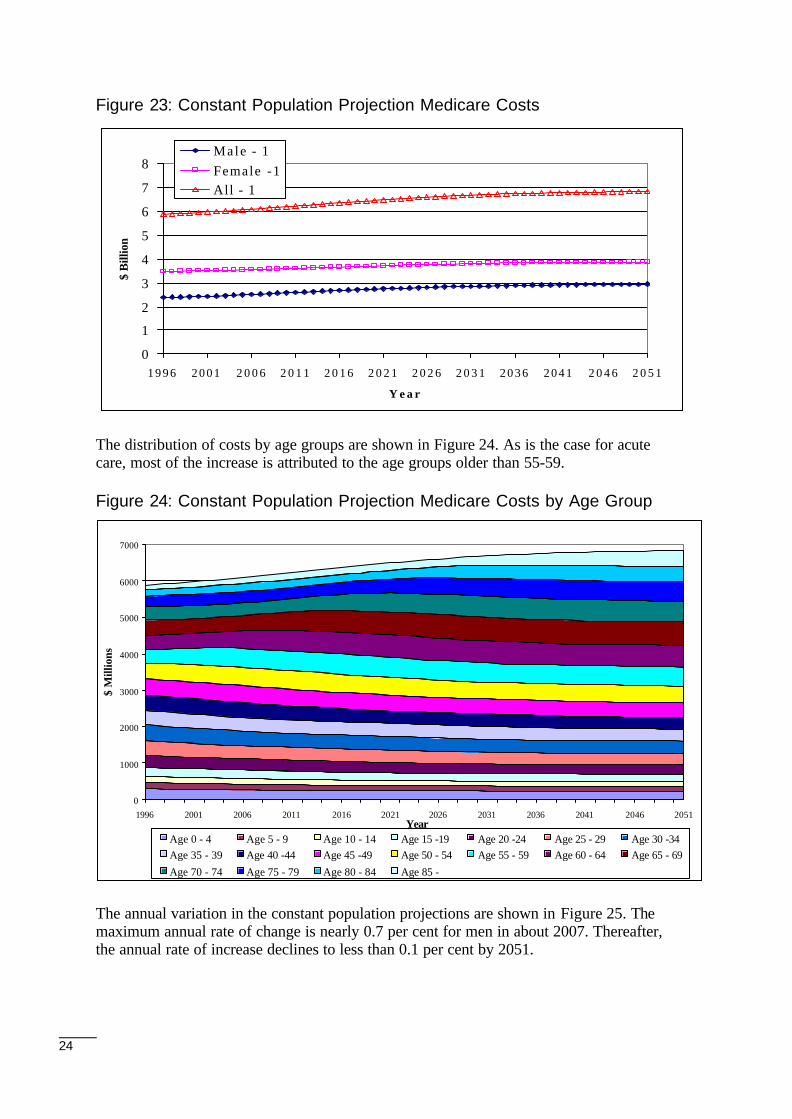
4.5 Constant population projection: Medicare costs
The Constant population projection: Medicare costs, which represents the effect of ageingonly, are shown in Figure 23. It can be seen that the ageing of the population is projectedto eventually add about $1 billion to the Medicare bill by 2051.
0
0.2
0.4
0.6
0.8
1
1.2
1.4
1.6
1.8
2
1 9 9 6 2 0 0 1 2006 2 0 1 1 2 0 1 6 2 0 2 1 2 0 2 6 2 0 3 1 2 0 3 6 2 0 4 1 2 0 4 6 2051Y e a r
% A
nnua
l Var
iatio
n of
Cos
ts
Male - 1Female -1Al l - 1
0
1
2
3
4
5
6
7
8
0 10 20 30 40 50 60 70 80 90 100
Age
MB
I
Male Female
24
Figure 23: Constant Population Projection Medicare Costs
The distribution of costs by age groups are shown in Figure 24. As is the case for acutecare, most of the increase is attributed to the age groups older than 55-59.
Figure 24: Constant Population Projection Medicare Costs by Age Group
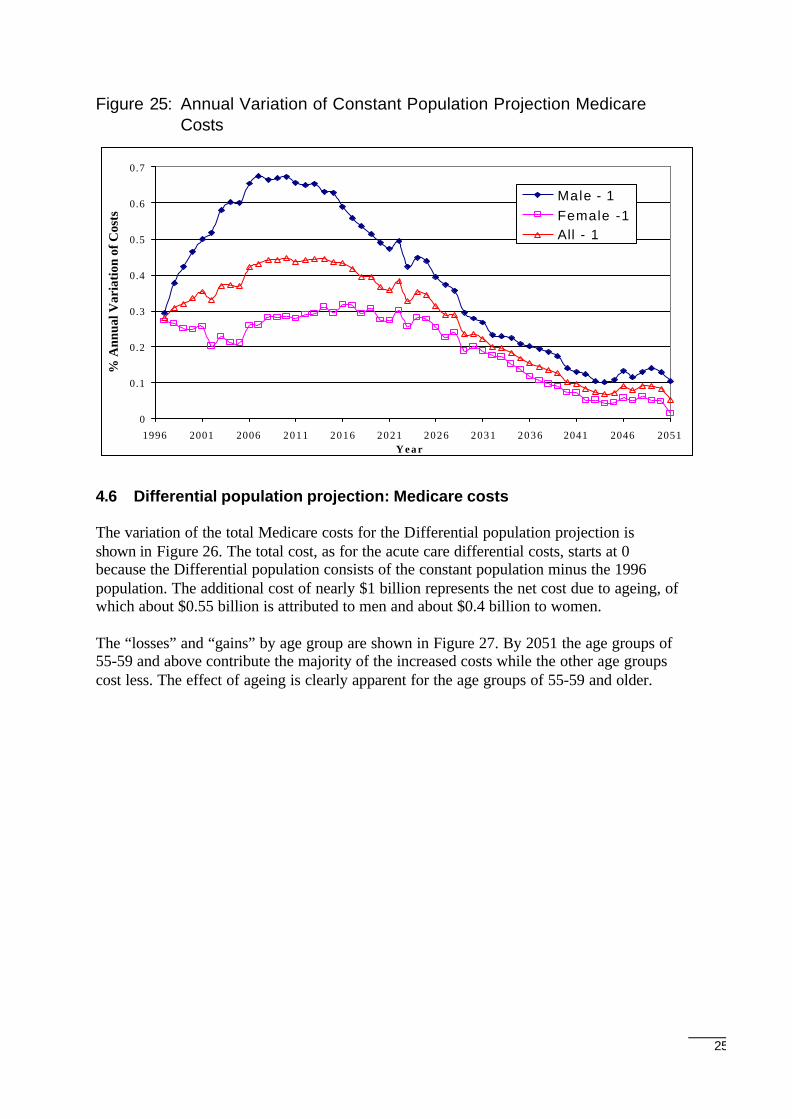
The annual variation in the constant population projections are shown in Figure 25. Themaximum annual rate of change is nearly 0.7 per cent for men in about 2007. Thereafter,the annual rate of increase declines to less than 0.1 per cent by 2051.
0
1
2
3
4
5
6
7
8
1 9 9 6 2 0 0 1 2 0 0 6 2 0 1 1 2 0 1 6 2 0 2 1 2 0 2 6 2 0 3 1 2 0 3 6 2 0 4 1 2 0 4 6 2 0 5 1
Y e a r
$ B
illio
n
Male - 1Female -1All - 1
0
1000
2000
3000
4000
5000
6000
7000
1996 2001 2006 2011 2016 2021 2026 2031 2036 2041 2046 2051Year
$ M
illio
ns
Age 0 - 4 Age 5 - 9 Age 10 - 14 Age 15 -19 Age 20 -24 Age 25 - 29 Age 30 -34Age 35 - 39 Age 40 -44 Age 45 -49 Age 50 - 54 Age 55 - 59 Age 60 - 64 Age 65 - 69
Age 70 - 74 Age 75 - 79 Age 80 - 84 Age 85 -
25
Figure 25: Annual Variation of Constant Population Projection MedicareCosts
4.6 Differential population projection: Medicare costs
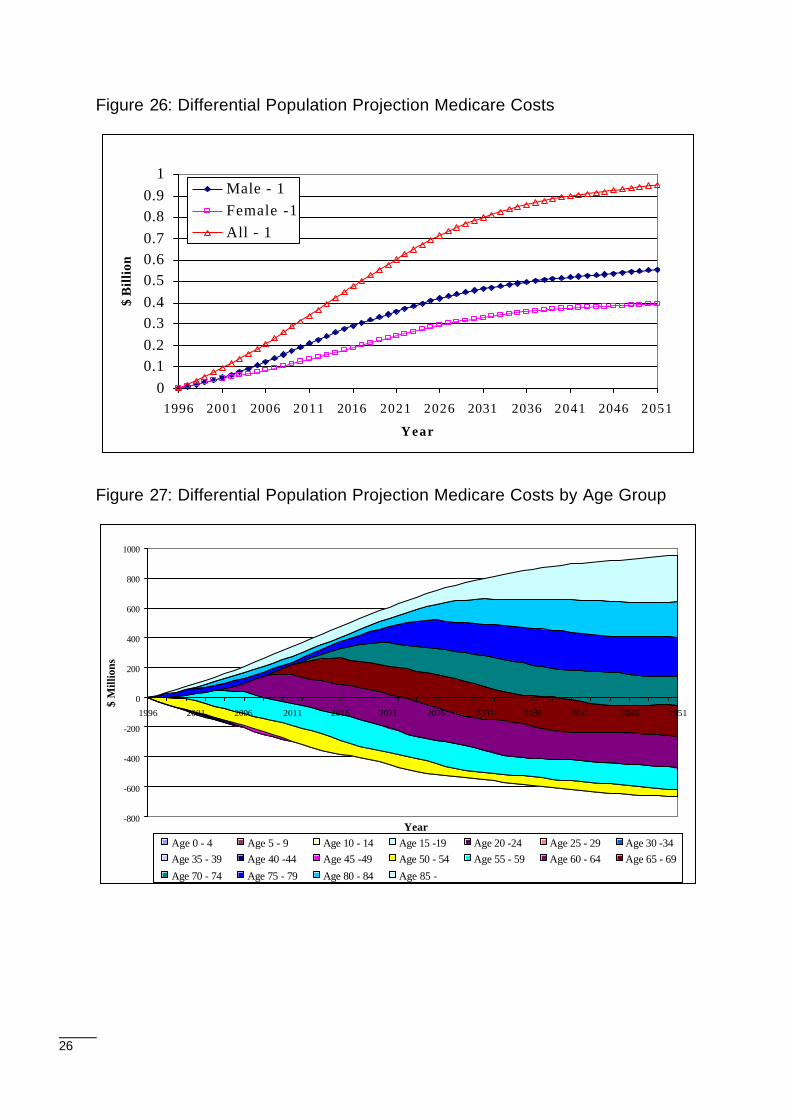
The variation of the total Medicare costs for the Differential population projection isshown in Figure 26. The total cost, as for the acute care differential costs, starts at 0because the Differential population consists of the constant population minus the 1996population. The additional cost of nearly $1 billion represents the net cost due to ageing, ofwhich about $0.55 billion is attributed to men and about $0.4 billion to women.
The “losses” and “gains” by age group are shown in Figure 27. By 2051 the age groups of55-59 and above contribute the majority of the increased costs while the other age groupscost less. The effect of ageing is clearly apparent for the age groups of 55-59 and older.
0
0.1
0.2
0.3
0.4
0.5
0.6
0.7
1996 2001 2006 2011 2016 2021 2026 2031 2036 2041 2046 2051Y e a r
% A
nnua
l Var
iati
on o
f Cos
ts
Male - 1Female -1All - 1
26
Figure 26: Differential Population Projection Medicare Costs
Figure 27: Differential Population Projection Medicare Costs by Age Group
00.10.20.30.40.50.60.70.80.9
1
1996 2001 2006 2011 2016 2021 2026 2031 2036 2041 2046 2051
Year
$ B
illio
n
Male - 1Female -1All - 1
-800
-600
-400
-200
0
200
400
600
800
1000
1996 2001 2006 2011 2016 2021 2026 2031 2036 2041 2046 2051
Year
$ M
illio
ns
Age 0 - 4 Age 5 - 9 Age 10 - 14 Age 15 -19 Age 20 -24 Age 25 - 29 Age 30 -34Age 35 - 39 Age 40 -44 Age 45 -49 Age 50 - 54 Age 55 - 59 Age 60 - 64 Age 65 - 69
Age 70 - 74 Age 75 - 79 Age 80 - 84 Age 85 -
27
5 Pharmaceutical Costs
5.1 Limitations on projecting future pharmaceutical costs
As explained in the following sections, projections of future Pharmaceutical BenefitsScheme (PBS) costs presented here must be viewed with considerable caution. Tounderstand the reasons for this it is necessary to describe the salient features of the PBS.
Australia’s Pharmaceutical Benefits Scheme
The PBS is a universal scheme that provides subsidised pharmaceuticals to Australianresidents. In addition to a general subsidy, where the patient pays a maximum co-payment(out-of-pocket contribution) of $20 per item and the government pays the rest, patientsmay also benefit from two other subsidy arrangements: one applying to individuals and theother to families.20 Concessional patients (basically those with low incomes who are inreceipt of social security payments) pay a maximum of $3.20 per PBS item. 21 Familieswith large pharmaceutical expenditures in a given year are protected by the PBS 'safetynet'. For general patients, once expenditure exceeds $612.60 per year the maximum cost isreduced to $3.20 per PBS item.22 For concessional patients, PBS items are provided free ofcharge once expenditure exceeds $166.40 per year.23
Thus, there are four categories of PBS user:
• Non-safety net and non-concessional;
• Non-safety net and concessional;
• Safety net and non-concessional; and
• Safety net and concessional.
Data limitations
The usefulness of PBS administrative data for research purposes is limited for severalreasons, including the following:
• Poor Data Quality: The 1996 PBS file for Western Australia comprises some 10 794186 scripts, of which very nearly 2 million had to be discarded because they hadinvalid patient identification numbers.24 Furthermore, date of birth, postcode andgender were often omitted or clearly in error.25
20The general concession varies from time to time. In 1996, it was $20.21The concessional rate also varies from time to time. In 1996, it was $3.20.22Figure applying in 1996.231996 figure.24It is not possible to determine the number of patients associated with invalid patient identification numbers.25However, this information was extracted from the matching MBS record if one existed.
28
• Incomplete drug utilisation history: Only scripts priced over the 1996 $20 threshold arerecorded in the PBS for general patients. Given the high proportion of drugs pricedunder $20, the scheme therefore only records a partial drug history for this group.
• Family based PBS records: Patients within families that have reached the safety netwill have confounding PBS script entries because scripts are then entered on a familybasis, not on an individual basis. It is not therefore impossible to determine whichsafety net scripts belong to which family member.
• Changes in PBS patient categories during the calendar year: The unemployed and non-aged pensioners may drift in and out of concessional eligibility during the year.Movement between the general patient category and concessional category will resultin an incomplete drug history. The accuracy of the drug history for this group willtherefore depend on the proportion of the calendar year the patient is classified as ageneral patient.
• Lack of information on script quantity and dosage: A series of script counts have beencalculated. These should be interpreted with caution, as there is no information on thedosage or quantity associated with each script. Furthermore, it is not known whetherthe drug was partially or fully consumed by the patient. The script counts are merely anindication of script volume and provide a benchmark against the dollars spent by theCommonwealth on prescription drugs via the PBS system.
A summary of the data used in this paper compared to data recorded by the PBS scheme isshown in Table 1. There are only 107 527 general scripts, representing 1.3 per cent of thesample data but in fact they should represent 11.4 per cent. Scripts for general patients areunder-represented by a factor of almost nine to one. On the other hand, patients in thesample data with a health care card and who qualify for the safety net rebate accounted for31.5 per cent of scripts in the analysis dataset (whereas they should account for only15.1 per cent of total scripts - so that they are over-represented by a factor of about 2 toone). The remaining categories are not too dissimilar. Fortunately, the largest number ofscripts, 5 471 838, has about the right level of representation, being under-represented byabout 10 per cent.
Clearly there is some bias in the sample PBS data used in this analysis. The most accuratePBS data is collected for concessional patients who were entitled to a Health Care Cardduring the entire year. In general, PBS data is skewed to the elderly (on age pensions), theunemployed, and to patients receiving other kinds of pension.
29
Table 1: Sample PBS data and PBS data
SafetyNet
Concessional Number ofScripts
% Scripts PBS % Scripts (a) % Benefit PBS %Benefit
No No 107527 1.3 11.4 1.3 15.5No Yes 5 471 838 62.0 68.5 58.5 62.0Yes No 462 028 5.2 4.4 6.4 5.4Yes Yes 2 780 022 31.5 15.1 33.8 16.3
Totals 8 821 415 100 99.4 (b)Notes:a. The percentages shown in the PBS columns are taken from "Expenditure and prescriptions twelve months to 30
June 1997" , Table 1 PBS Prescriptions Volume and Government Costs, page 2, Analysis Section, PharmaceuticalBenefits Branch, Commonwealth Department of Health and Family Services.
b. The ‘Doctor’s Bag’ of 0.6 per cent is not counted (these are scripts doctors have on hand for emergencypurposes).
5.2 PBS cost parameters
The following sections examine the parameters used to project the PBS costs to thegovernment (benefit paid to patients). They parallel the method of the two previoussections (on the MBS and acute care).
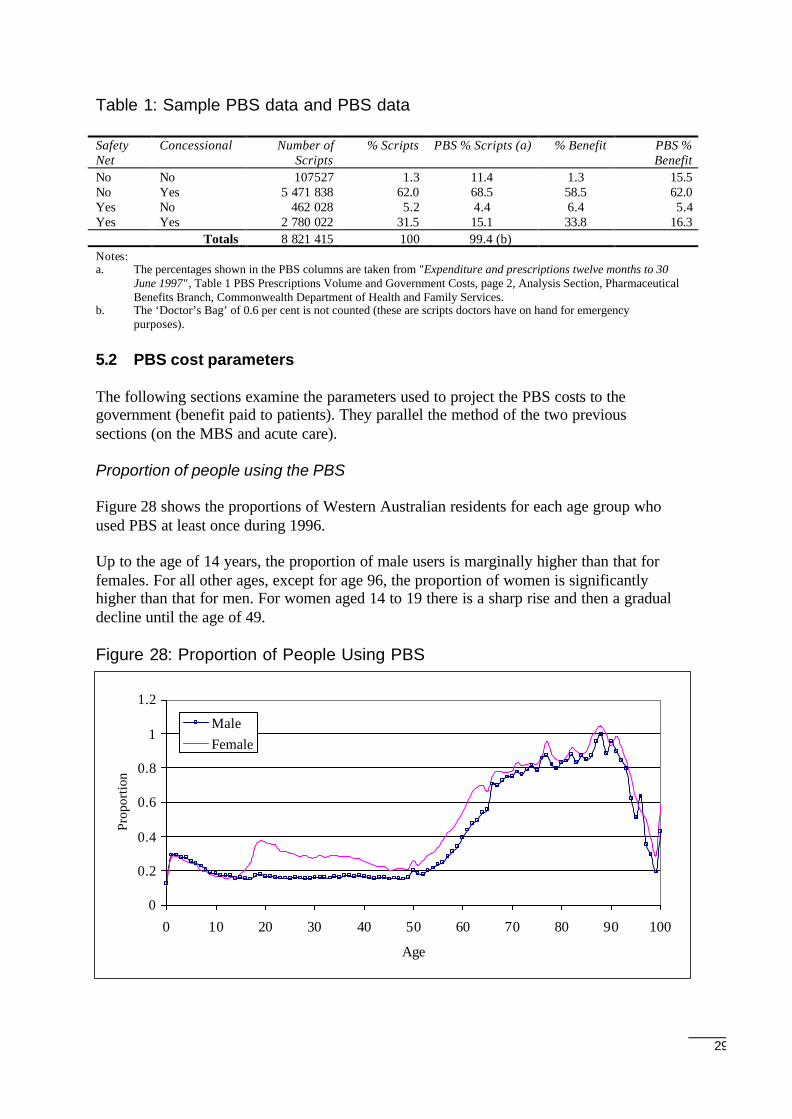
Proportion of people using the PBS
Figure 28 shows the proportions of Western Australian residents for each age group whoused PBS at least once during 1996.
Up to the age of 14 years, the proportion of male users is marginally higher than that forfemales. For all other ages, except for age 96, the proportion of women is significantlyhigher than that for men. For women aged 14 to 19 there is a sharp rise and then a gradualdecline until the age of 49.
Figure 28: Proportion of People Using PBS
0
0.2
0.4
0.6
0.8
1
1.2
0 10 20 30 40 50 60 70 80 90 100
Age
Prop
ortio
n
MaleFemale
30
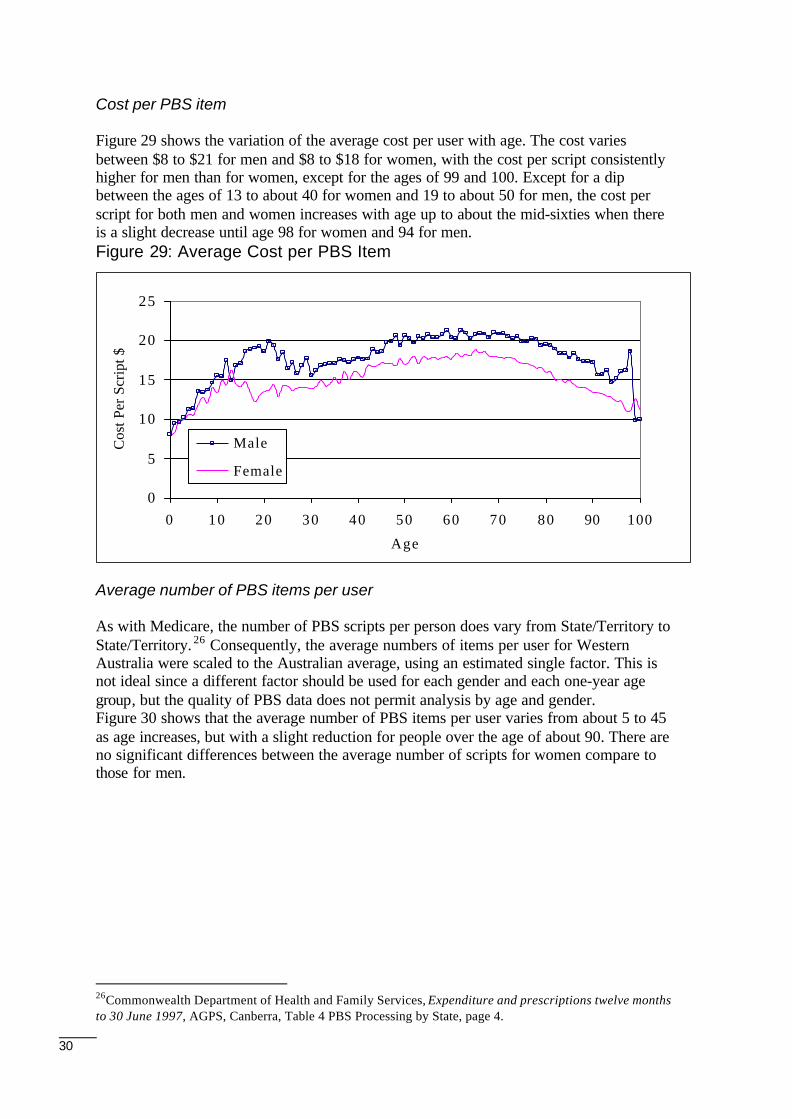
Cost per PBS item
Figure 29 shows the variation of the average cost per user with age. The cost variesbetween $8 to $21 for men and $8 to $18 for women, with the cost per script consistentlyhigher for men than for women, except for the ages of 99 and 100. Except for a dipbetween the ages of 13 to about 40 for women and 19 to about 50 for men, the cost perscript for both men and women increases with age up to about the mid-sixties when thereis a slight decrease until age 98 for women and 94 for men.Figure 29: Average Cost per PBS Item
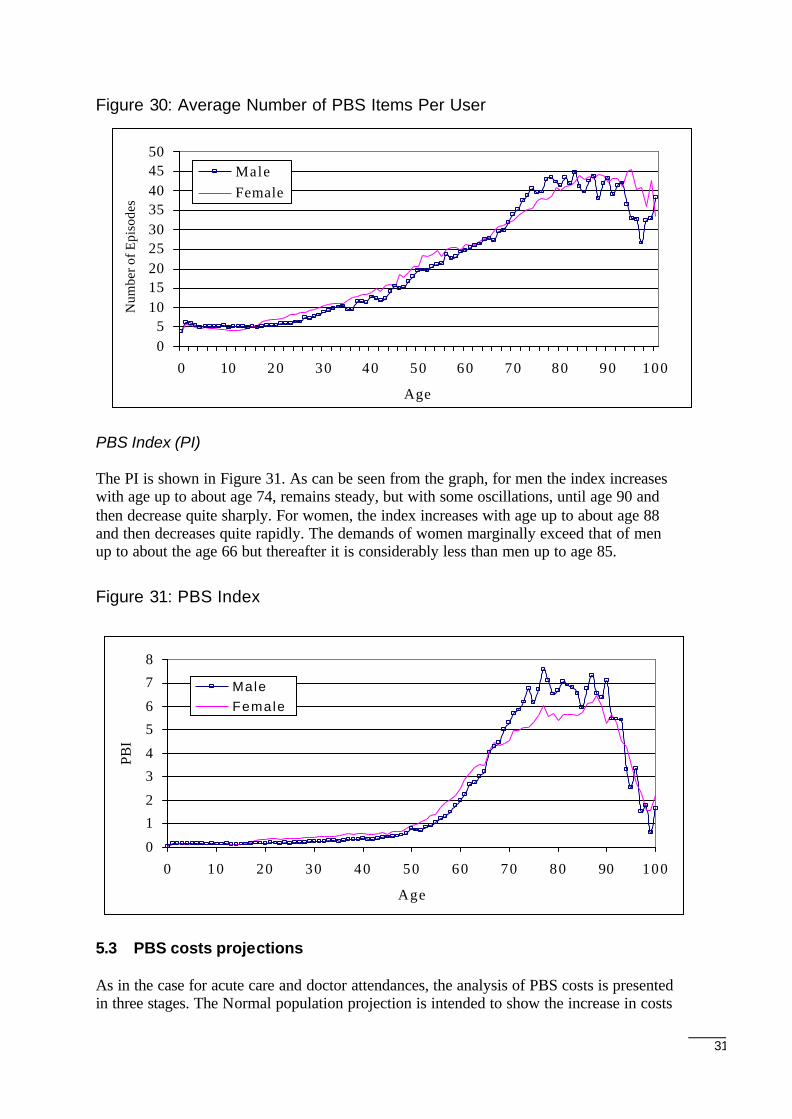
Average number of PBS items per user
As with Medicare, the number of PBS scripts per person does vary from State/Territory toState/Territory. 26 Consequently, the average numbers of items per user for WesternAustralia were scaled to the Australian average, using an estimated single factor. This isnot ideal since a different factor should be used for each gender and each one-year agegroup, but the quality of PBS data does not permit analysis by age and gender.Figure 30 shows that the average number of PBS items per user varies from about 5 to 45as age increases, but with a slight reduction for people over the age of about 90. There areno significant differences between the average number of scripts for women compare tothose for men.
26Commonwealth Department of Health and Family Services, Expenditure and prescriptions twelve monthsto 30 June 1997, AGPS, Canberra, Table 4 PBS Processing by State, page 4.
0
5
10
15
20
25
0 10 20 30 40 50 60 70 80 90 100
Age
Cos
t Per
Scr
ipt $
Male
Female
31
Figure 30: Average Number of PBS Items Per User
PBS Index (PI)
The PI is shown in Figure 31. As can be seen from the graph, for men the index increaseswith age up to about age 74, remains steady, but with some oscillations, until age 90 andthen decrease quite sharply. For women, the index increases with age up to about age 88and then decreases quite rapidly. The demands of women marginally exceed that of menup to about the age 66 but thereafter it is considerably less than men up to age 85.
Figure 31: PBS Index
5.3 PBS costs projections
As in the case for acute care and doctor attendances, the analysis of PBS costs is presentedin three stages. The Normal population projection is intended to show the increase in costs
0
1
2
3
4
5
6
7
8
0 10 20 30 40 50 60 70 80 90 100
Age
PBI
Male Female
05
101520253035404550
0 10 20 30 40 50 60 70 80 90 100
Age
Num
ber o
f Epi
sode
s
MaleFemale
32
attributable solely to population growth and ageing, (i.e., excluding other confoundingfactors which may nevertheless be important cost drivers).
5.4 Normal population projection
The demographic composition of the projected population and the annual per centvariations are identical to that shown in Figure 7 and Figure 9 and are not repeated here.
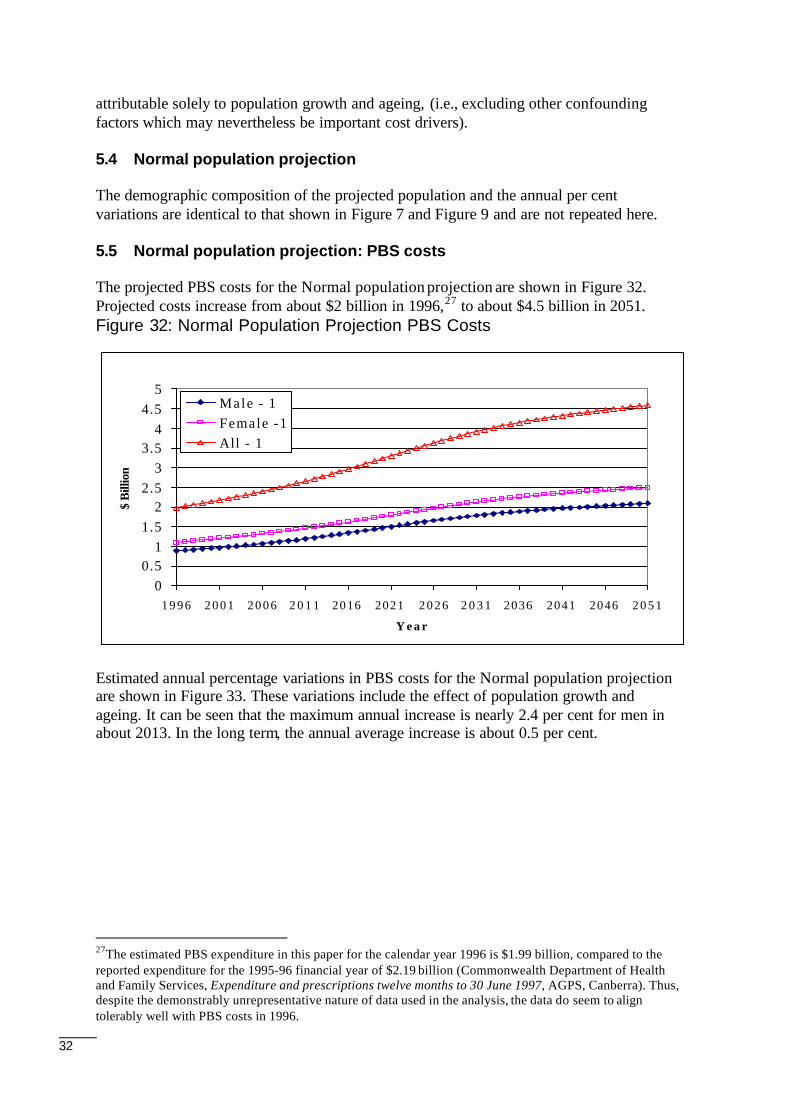
5.5 Normal population projection: PBS costs
The projected PBS costs for the Normal population projection are shown in Figure 32.Projected costs increase from about $2 billion in 1996,27 to about $4.5 billion in 2051.Figure 32: Normal Population Projection PBS Costs
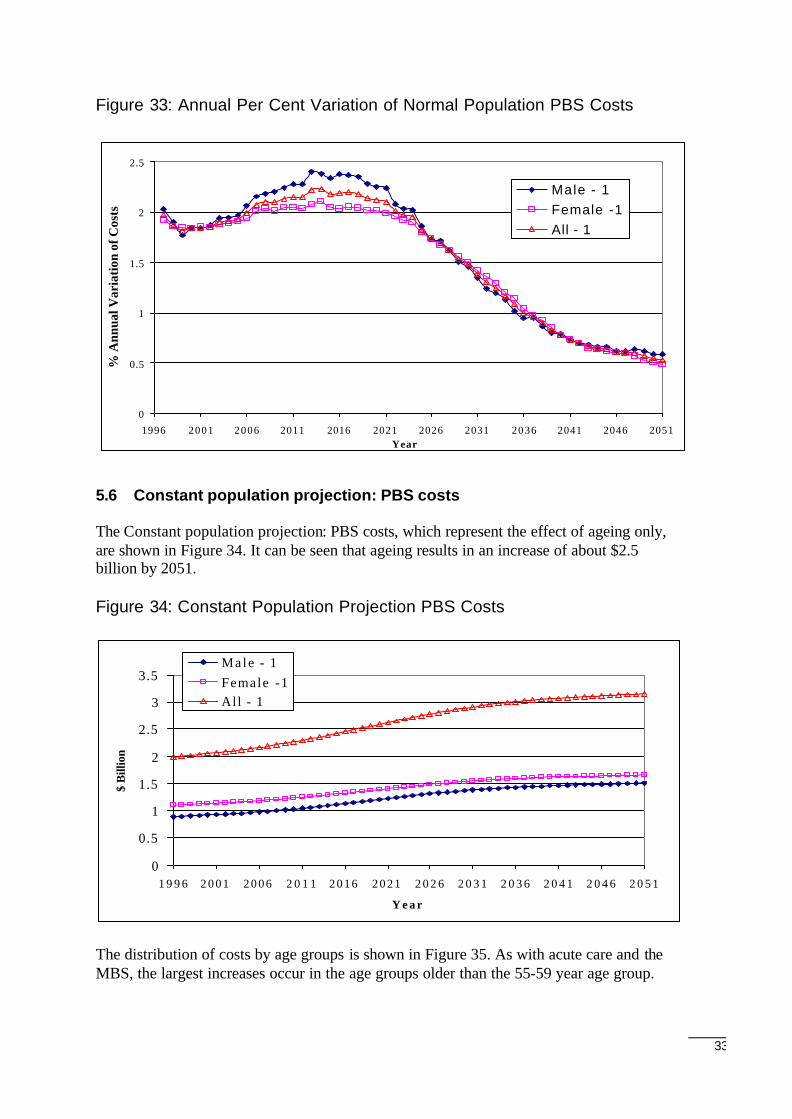
Estimated annual percentage variations in PBS costs for the Normal population projectionare shown in Figure 33. These variations include the effect of population growth andageing. It can be seen that the maximum annual increase is nearly 2.4 per cent for men inabout 2013. In the long term, the annual average increase is about 0.5 per cent.
27The estimated PBS expenditure in this paper for the calendar year 1996 is $1.99 billion, compared to thereported expenditure for the 1995-96 financial year of $2.19 billion (Commonwealth Department of Healthand Family Services, Expenditure and prescriptions twelve months to 30 June 1997, AGPS, Canberra). Thus,despite the demonstrably unrepresentative nature of data used in the analysis, the data do seem to aligntolerably well with PBS costs in 1996.
00.5
11.5
22.5
33.5
44.5
5
1 9 9 6 2 0 0 1 2 0 0 6 2 0 1 1 2016 2021 2 0 2 6 2 0 3 1 2036 2041 2046 2 0 5 1
Y e a r
$ B
illio
n
Male - 1Female -1All - 1
33
Figure 33: Annual Per Cent Variation of Normal Population PBS Costs
5.6 Constant population projection: PBS costs
The Constant population projection: PBS costs, which represent the effect of ageing only,are shown in Figure 34. It can be seen that ageing results in an increase of about $2.5billion by 2051.
Figure 34: Constant Population Projection PBS Costs
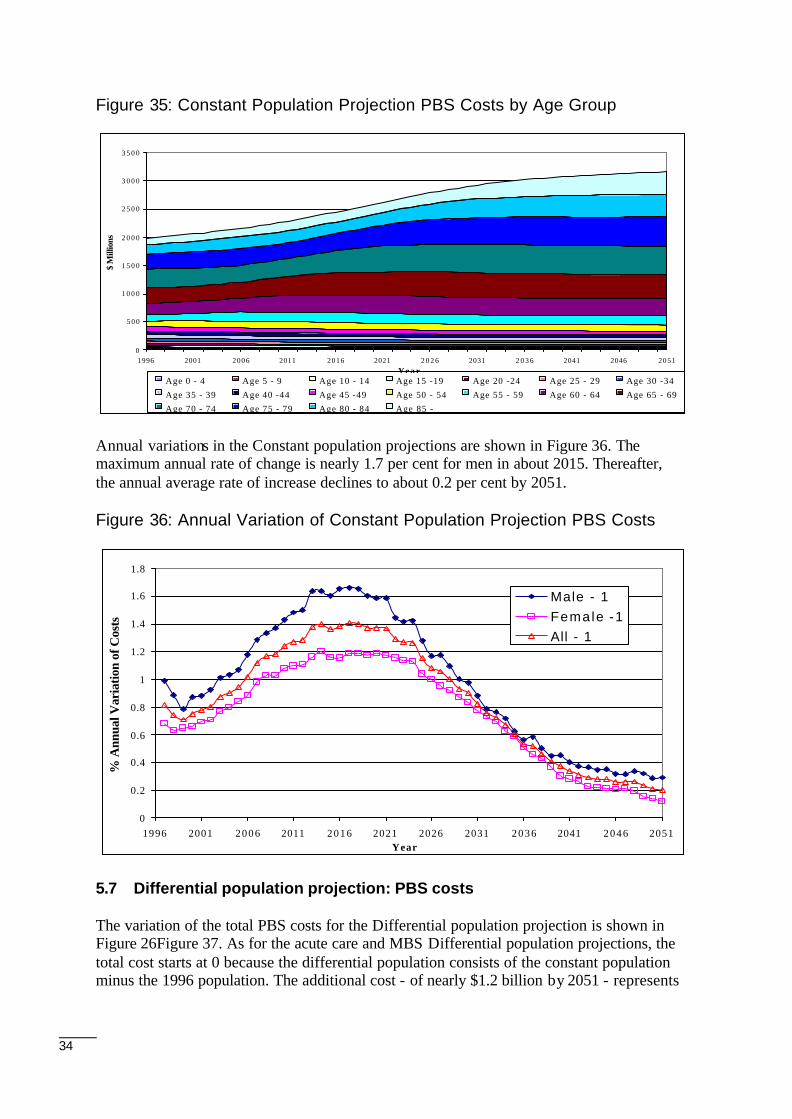
The distribution of costs by age groups is shown in Figure 35. As with acute care and theMBS, the largest increases occur in the age groups older than the 55-59 year age group.
0
0.5
1
1.5
2
2.5
1996 2001 2006 2011 2016 2021 2026 2031 2036 2041 2046 2051Year
% A
nnua
l Var
iati
on o
f Cos
ts
Male - 1Female -1All - 1
0
0.5
1
1.5
2
2.5
3
3.5
1 9 9 6 2 0 0 1 2 0 0 6 2 0 1 1 2 0 1 6 2 0 2 1 2 0 2 6 2 0 3 1 2 0 3 6 2 0 4 1 2 0 4 6 2 0 5 1
Y e a r
$ B
illio
n
Male - 1Female -1All - 1
34
Figure 35: Constant Population Projection PBS Costs by Age Group
Annual variations in the Constant population projections are shown in Figure 36. Themaximum annual rate of change is nearly 1.7 per cent for men in about 2015. Thereafter,the annual average rate of increase declines to about 0.2 per cent by 2051.
Figure 36: Annual Variation of Constant Population Projection PBS Costs
5.7 Differential population projection: PBS costs
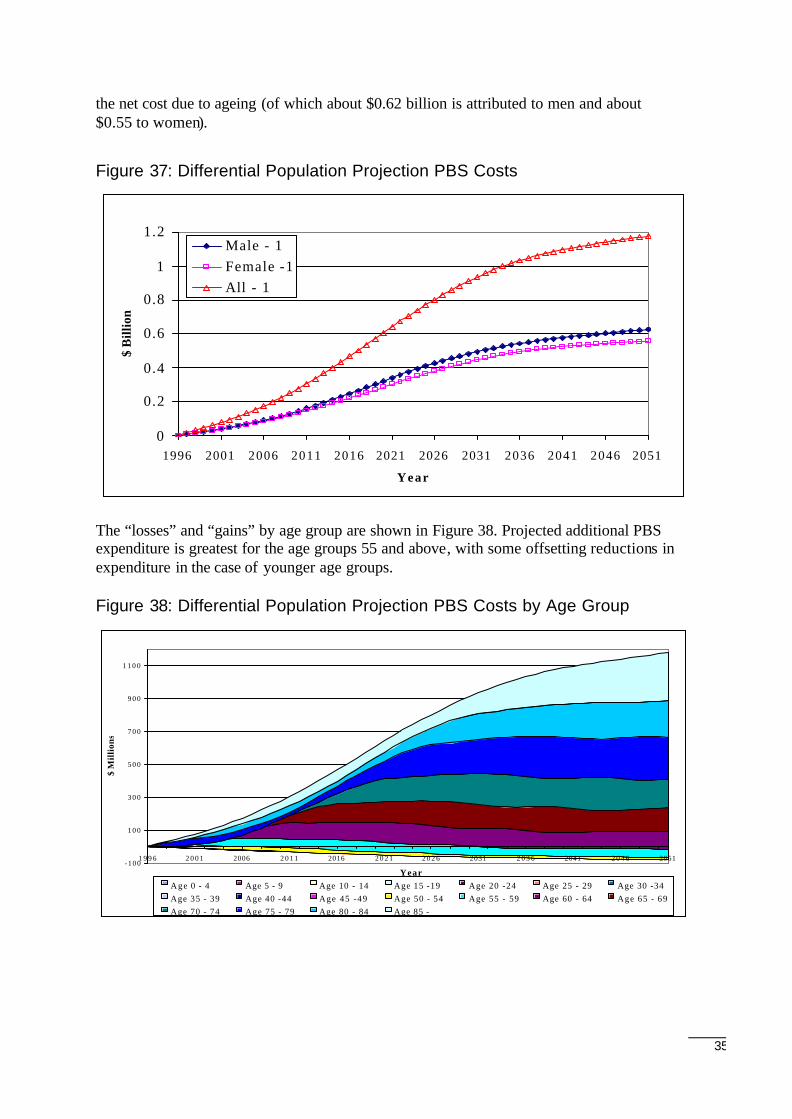
The variation of the total PBS costs for the Differential population projection is shown inFigure 26Figure 37. As for the acute care and MBS Differential population projections, thetotal cost starts at 0 because the differential population consists of the constant populationminus the 1996 population. The additional cost - of nearly $1.2 billion by 2051 - represents
0
5 0 0
1 0 0 0
1 5 0 0
2 0 0 0
2 5 0 0
3 0 0 0
3 5 0 0
1996 2001 2006 2011 2016 2021 2 0 2 6 2031 2 0 3 6 2041 2046 2051Year
$ M
illio
ns
Age 0 - 4 Age 5 - 9 Age 10 - 14 Age 15 -19 Age 20 -24 Age 25 - 29 Age 30 -34
Age 35 - 39 Age 40 -44 Age 45 -49 Age 50 - 54 Age 55 - 59 Age 60 - 64 Age 65 - 69
Age 70 - 74 Age 75 - 79 Age 80 - 84 Age 85 -
0
0.2
0.4
0.6
0.8
1
1.2
1.4
1.6
1.8
1996 2001 2006 2011 2016 2021 2026 2031 2036 2041 2046 2051Year
% A
nnua
l Var
iatio
n of
Cos
ts
Male - 1Female -1All - 1
35
the net cost due to ageing (of which about $0.62 billion is attributed to men and about$0.55 to women).
Figure 37: Differential Population Projection PBS Costs
The “losses” and “gains” by age group are shown in Figure 38. Projected additional PBSexpenditure is greatest for the age groups 55 and above, with some offsetting reductions inexpenditure in the case of younger age groups.
Figure 38: Differential Population Projection PBS Costs by Age Group
0
0.2
0.4
0.6
0.8
1
1.2
1996 2001 2006 2011 2016 2021 2026 2031 2036 2041 2046 2051
Year
$ B
illio
n
Male - 1Female -1All - 1
-100
1 0 0
3 0 0
5 0 0
7 0 0
9 0 0
1 1 0 0
1 9 9 6 2 0 0 1 2006 2 0 1 1 2016 2 0 2 1 2 0 2 6 2031 2 0 3 6 2041 2 0 4 6 2051
Year
$ M
illi
ons
Age 0 - 4 Age 5 - 9 Age 10 - 14 Age 15 -19 Age 20 -24 Age 25 - 29 Age 30 -34Age 35 - 39 Age 40 -44 Age 45 -49 Age 50 - 54 Age 55 - 59 Age 60 - 64 Age 65 - 69Age 70 - 74 Age 75 - 79 Age 80 - 84 Age 85 -
36
6 Combined Costs
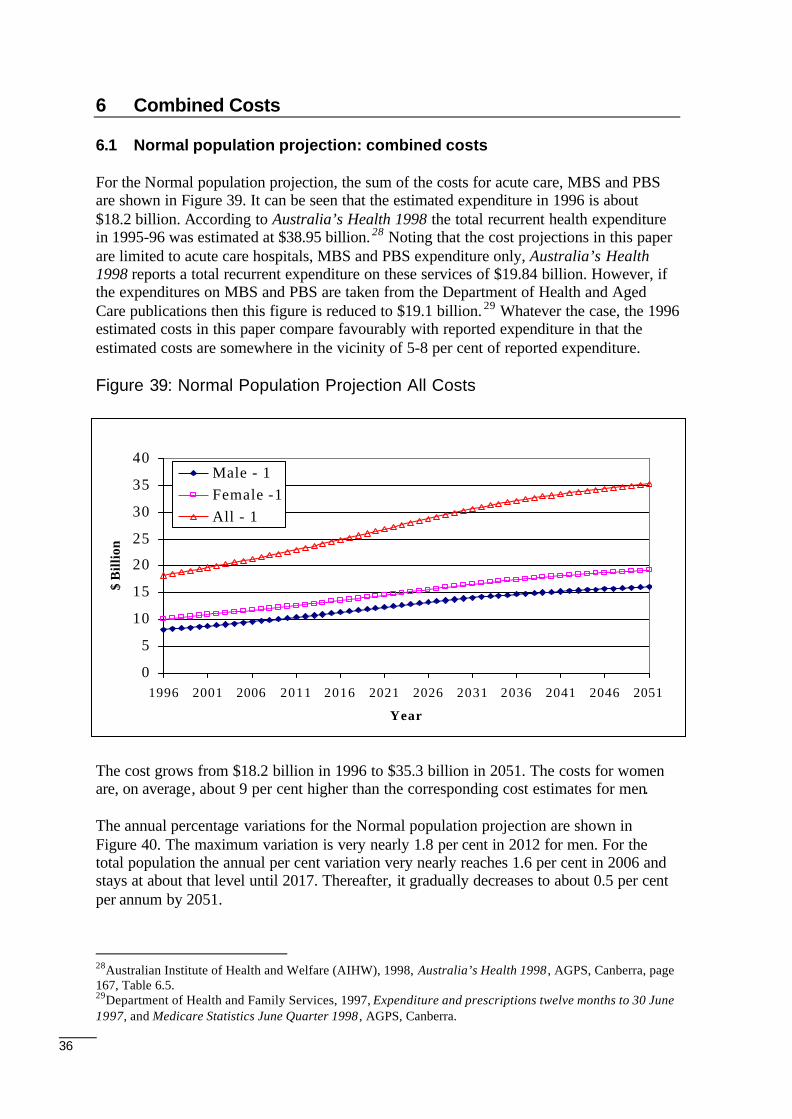
6.1 Normal population projection: combined costs
For the Normal population projection, the sum of the costs for acute care, MBS and PBSare shown in Figure 39. It can be seen that the estimated expenditure in 1996 is about$18.2 billion. According to Australia’s Health 1998 the total recurrent health expenditurein 1995-96 was estimated at $38.95 billion. 28 Noting that the cost projections in this paperare limited to acute care hospitals, MBS and PBS expenditure only, Australia’s Health1998 reports a total recurrent expenditure on these services of $19.84 billion. However, ifthe expenditures on MBS and PBS are taken from the Department of Health and AgedCare publications then this figure is reduced to $19.1 billion. 29 Whatever the case, the 1996estimated costs in this paper compare favourably with reported expenditure in that theestimated costs are somewhere in the vicinity of 5-8 per cent of reported expenditure.
Figure 39: Normal Population Projection All Costs
The cost grows from $18.2 billion in 1996 to $35.3 billion in 2051. The costs for womenare, on average, about 9 per cent higher than the corresponding cost estimates for men.
The annual percentage variations for the Normal population projection are shown inFigure 40. The maximum variation is very nearly 1.8 per cent in 2012 for men. For thetotal population the annual per cent variation very nearly reaches 1.6 per cent in 2006 andstays at about that level until 2017. Thereafter, it gradually decreases to about 0.5 per centper annum by 2051.
28Australian Institute of Health and Welfare (AIHW), 1998, Australia’s Health 1998 , AGPS, Canberra, page167, Table 6.5.29Department of Health and Family Services, 1997, Expenditure and prescriptions twelve months to 30 June1997, and Medicare Statistics June Quarter 1998 , AGPS, Canberra.
0
5
10
15
20
25
30
35
40
1996 2001 2006 2011 2016 2021 2026 2031 2036 2041 2046 2051
Year
$ B
illio
n
Male - 1Female -1All - 1
37
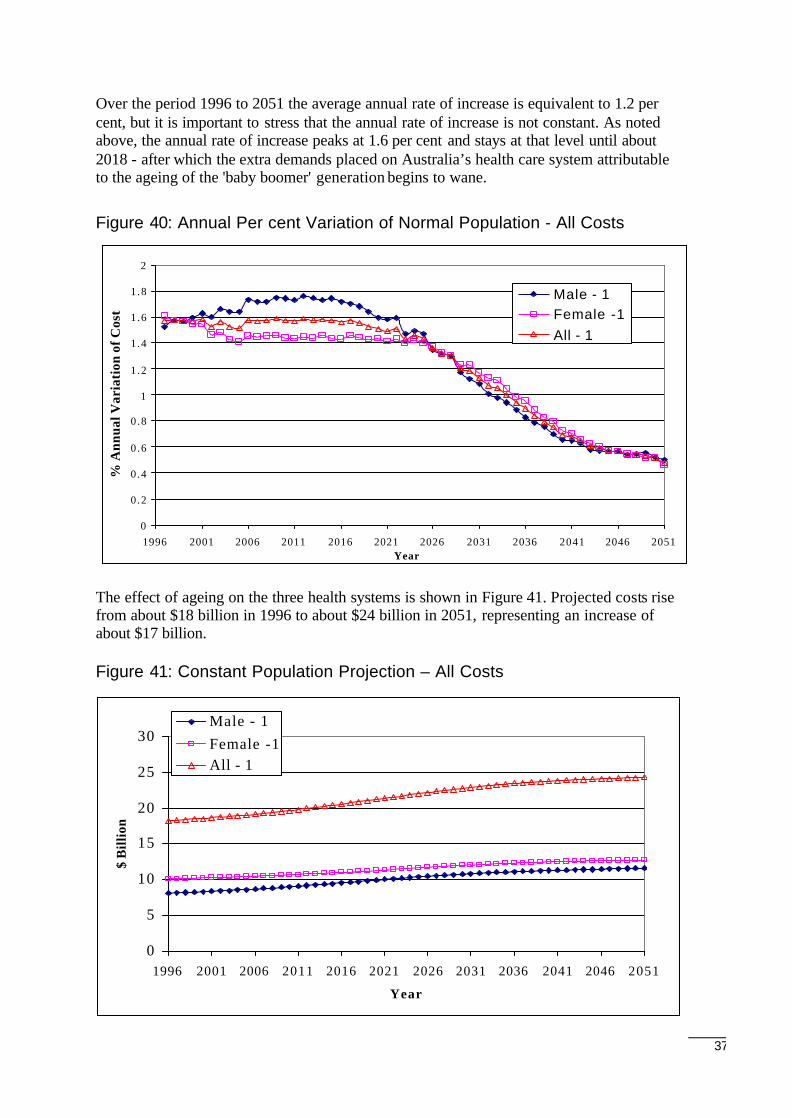
Over the period 1996 to 2051 the average annual rate of increase is equivalent to 1.2 percent, but it is important to stress that the annual rate of increase is not constant. As notedabove, the annual rate of increase peaks at 1.6 per cent and stays at that level until about2018 - after which the extra demands placed on Australia’s health care system attributableto the ageing of the 'baby boomer' generation begins to wane.
Figure 40: Annual Per cent Variation of Normal Population - All Costs
The effect of ageing on the three health systems is shown in Figure 41. Projected costs risefrom about $18 billion in 1996 to about $24 billion in 2051, representing an increase ofabout $17 billion.
Figure 41: Constant Population Projection – All Costs
0
0.2
0.4
0.6
0.8
1
1.2
1.4
1.6
1.8
2
1996 2001 2006 2011 2016 2021 2026 2031 2036 2041 2046 2051Year
% A
nnua
l Var
iati
on o
f Cos
ts
Male - 1Female -1All - 1
0
5
10
15
20
25
30
1996 2001 2006 2011 2016 2021 2026 2031 2036 2041 2046 2051
Year
$ B
illio
n
Male - 1Female -1All - 1
38
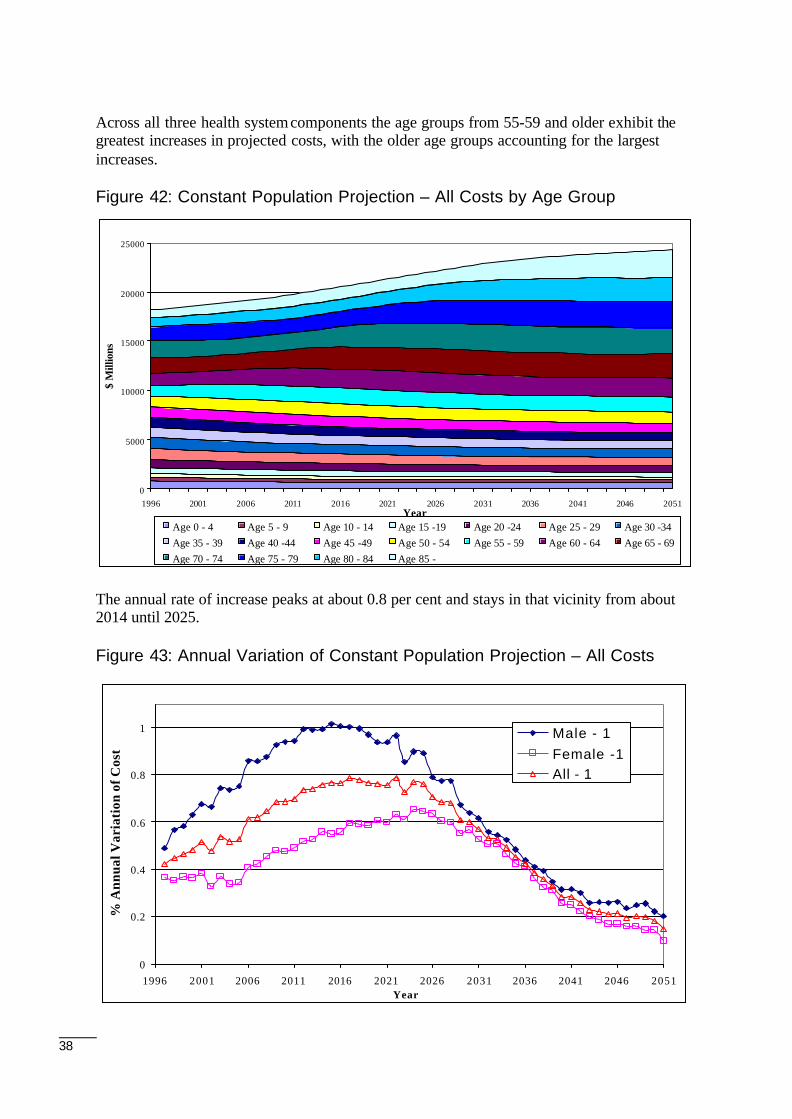
Across all three health system components the age groups from 55-59 and older exhibit thegreatest increases in projected costs, with the older age groups accounting for the largestincreases.
Figure 42: Constant Population Projection – All Costs by Age Group
The annual rate of increase peaks at about 0.8 per cent and stays in that vicinity from about2014 until 2025.
Figure 43: Annual Variation of Constant Population Projection – All Costs
0
0.2
0.4
0.6
0.8
1
1996 2001 2006 2011 2016 2021 2026 2031 2036 2041 2046 2051Year
% A
nnua
l Var
iati
on o
f Cos
ts
Male - 1Female -1All - 1
0
5000
10000
15000
20000
25000
1996 2001 2006 2011 2016 2021 2026 2031 2036 2041 2046 2051Year
$ M
illio
ns
Age 0 - 4 Age 5 - 9 Age 10 - 14 Age 15 -19 Age 20 -24 Age 25 - 29 Age 30 -34Age 35 - 39 Age 40 -44 Age 45 -49 Age 50 - 54 Age 55 - 59 Age 60 - 64 Age 65 - 69Age 70 - 74 Age 75 - 79 Age 80 - 84 Age 85 -
39
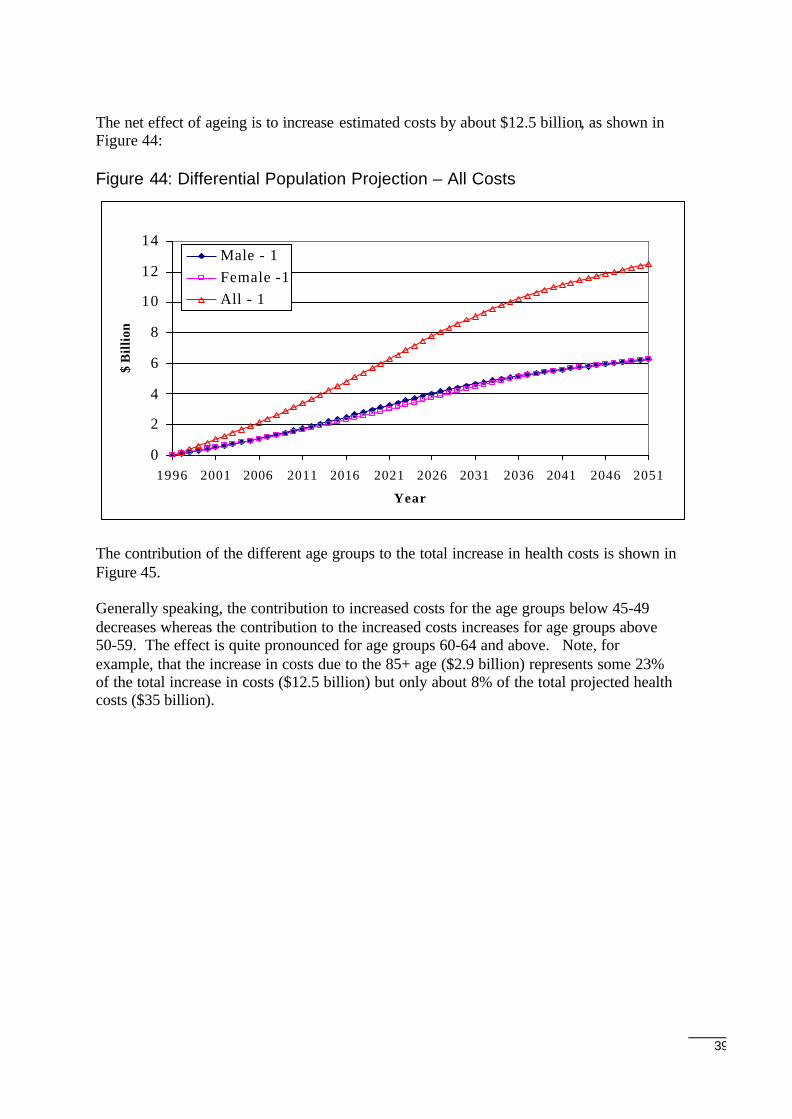
The net effect of ageing is to increase estimated costs by about $12.5 billion, as shown inFigure 44:
Figure 44: Differential Population Projection – All Costs
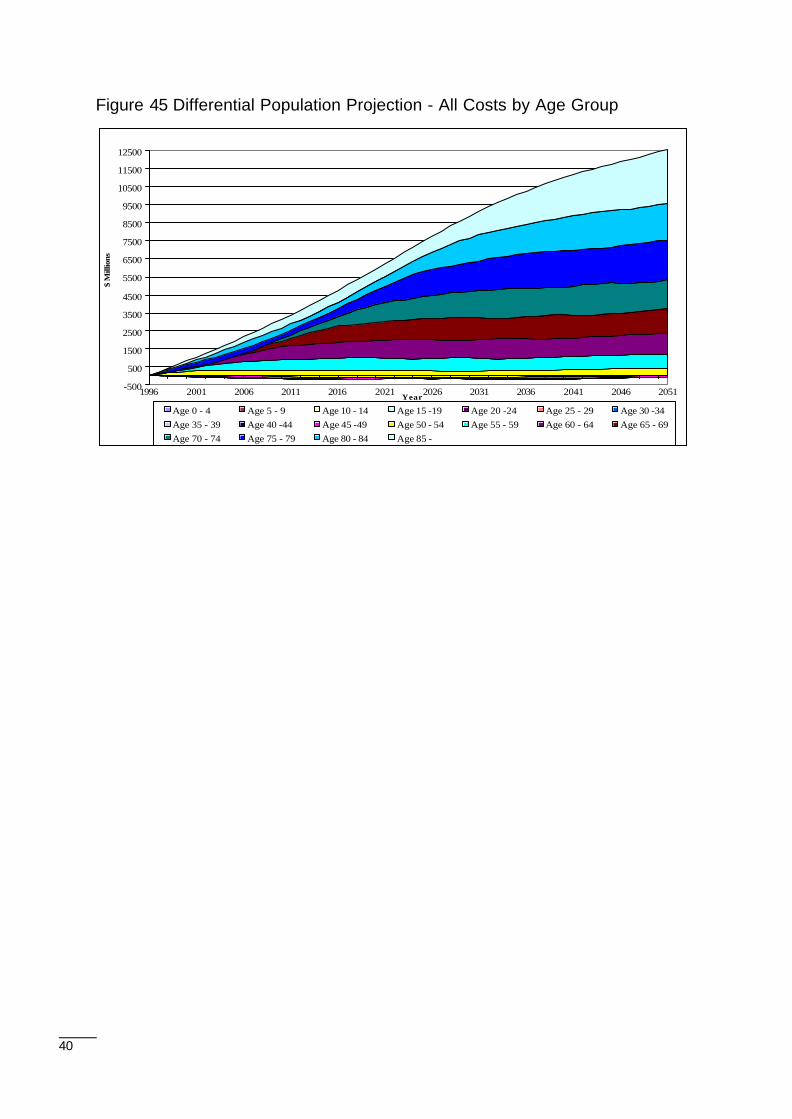
The contribution of the different age groups to the total increase in health costs is shown inFigure 45.
Generally speaking, the contribution to increased costs for the age groups below 45-49decreases whereas the contribution to the increased costs increases for age groups above50-59. The effect is quite pronounced for age groups 60-64 and above. Note, forexample, that the increase in costs due to the 85+ age ($2.9 billion) represents some 23%of the total increase in costs ($12.5 billion) but only about 8% of the total projected healthcosts ($35 billion).
0
2
4
6
8
10
12
14
1996 2001 2006 2011 2016 2021 2026 2031 2036 2041 2046 2051
Year
$ B
illio
n
Male - 1Female -1All - 1
40
Figure 45 Differential Population Projection - All Costs by Age Group
-500
500
1500
2500
3500
4500
5500
6500
7500
8500
9500
10500
11500
12500
1996 2001 2006 2011 2016 2021 2026 2031 2036 2041 2046 2051Year
$ M
illio
ns
Age 0 - 4 Age 5 - 9 Age 10 - 14 Age 15 -19 Age 20 -24 Age 25 - 29 Age 30 -34Age 35 - 39 Age 40 -44 Age 45 -49 Age 50 - 54 Age 55 - 59 Age 60 - 64 Age 65 - 69Age 70 - 74 Age 75 - 79 Age 80 - 84 Age 85 -
41
7 Conclusions
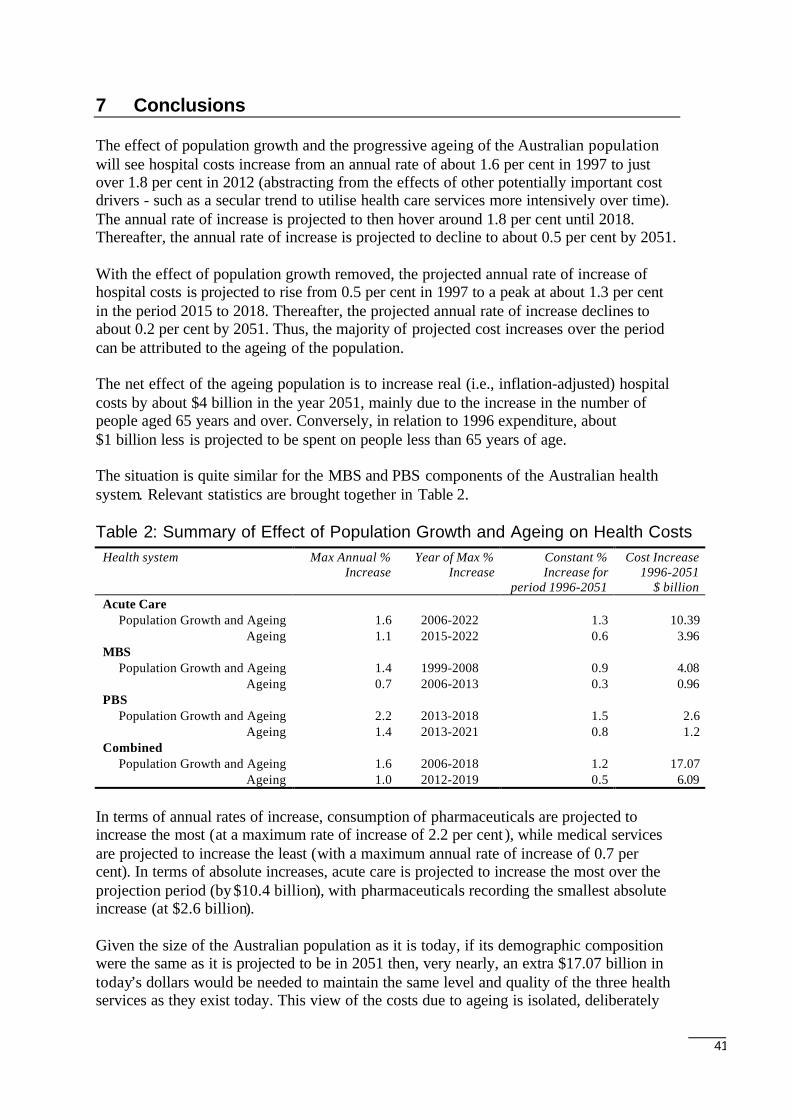
The effect of population growth and the progressive ageing of the Australian populationwill see hospital costs increase from an annual rate of about 1.6 per cent in 1997 to justover 1.8 per cent in 2012 (abstracting from the effects of other potentially important costdrivers - such as a secular trend to utilise health care services more intensively over time).The annual rate of increase is projected to then hover around 1.8 per cent until 2018.Thereafter, the annual rate of increase is projected to decline to about 0.5 per cent by 2051.
With the effect of population growth removed, the projected annual rate of increase ofhospital costs is projected to rise from 0.5 per cent in 1997 to a peak at about 1.3 per centin the period 2015 to 2018. Thereafter, the projected annual rate of increase declines toabout 0.2 per cent by 2051. Thus, the majority of projected cost increases over the periodcan be attributed to the ageing of the population.
The net effect of the ageing population is to increase real (i.e., inflation-adjusted) hospitalcosts by about $4 billion in the year 2051, mainly due to the increase in the number ofpeople aged 65 years and over. Conversely, in relation to 1996 expenditure, about$1 billion less is projected to be spent on people less than 65 years of age.
The situation is quite similar for the MBS and PBS components of the Australian healthsystem. Relevant statistics are brought together in Table 2.
Table 2: Summary of Effect of Population Growth and Ageing on Health CostsHealth system Max Annual %
IncreaseYear of Max %
IncreaseConstant %Increase for
period 1996-2051
Cost Increase1996-2051
$ billionAcute Care
Population Growth and Ageing 1.6 2006-2022 1.3 10.39Ageing 1.1 2015-2022 0.6 3.96
MBSPopulation Growth and Ageing 1.4 1999-2008 0.9 4.08
Ageing 0.7 2006-2013 0.3 0.96PBS
Population Growth and Ageing 2.2 2013-2018 1.5 2.6Ageing 1.4 2013-2021 0.8 1.2
CombinedPopulation Growth and Ageing 1.6 2006-2018 1.2 17.07
Ageing 1.0 2012-2019 0.5 6.09
In terms of annual rates of increase, consumption of pharmaceuticals are projected toincrease the most (at a maximum rate of increase of 2.2 per cent ), while medical servicesare projected to increase the least (with a maximum annual rate of increase of 0.7 percent). In terms of absolute increases, acute care is projected to increase the most over theprojection period (by $10.4 billion), with pharmaceuticals recording the smallest absoluteincrease (at $2.6 billion).
Given the size of the Australian population as it is today, if its demographic compositionwere the same as it is projected to be in 2051 then, very nearly, an extra $17.07 billion intoday’s dollars would be needed to maintain the same level and quality of the three healthservices as they exist today. This view of the costs due to ageing is isolated, deliberately
42
so, from the tricky issues that have been side-stepped by the assumptions underlying theanalysis presented in this paper, particularly those issues related to possible increases incost due to a larger number, greater variety and complexity of future procedures. Theseissues are natural candidates for further study.
The results show that the changing demographic composition of the Australian populationwill have a considerable, but arguably nevertheless manageable, effect on the projectedcost of health services. The increase in the recurrent expenditure due to populationincrease and the ageing of the population on acute care, MBS and PBS will doubtlesspresent significant challenges to health planners and policy makers, but the costs appear tobe manageable in the sense that the projected annual rates of increase are below theaverage annual rates of increase of GDP recorded in Australia over lengthy periods (so thathealth care cost should not - by virtue of the progressive ageing of the population alone -increase as a proportion of national expenditures over the longer term).