Embed Size (px)
Citation preview


POLLUTION DUE TO URBAN RUNOFF: UNIT LOADS AND ABATEMENT MEASURES
by 3. Marsalek
Enviroiiineiital Hydraulics Section Hydraulics Research Division
National Water Research Insti tute Canada Cent re for Inland Waters
Bur li ng t on, Ontario
Dctober 1978


DISCLAIMER
The study discussed in this Report was carried out as part of the effor ts of the Pollution from Land Use Activities Reference Group, an organization of the International Joint Commission, established under t h e Canada-U.S. Great Lakes Water Quality Agreement of 1972. Findings and conclusions a r e those of the author and do not necessarily ref lect the views of the Reference Group or its recommendations t o the Commission.


TABLE OF CONTENTS
Page Number
LIST OF FIGURES LIST OF TABLES 1. INTRODUCTION 2. ANNUAL POLLUTANT UNIT LOADS IN URBAN RUNOFF
2.1 PLUARG Requirements on Unit Loads 2.1.1 Land use 2.1.2 Pollutants to be studied 2.1.3 Sewer systems Li terature Survey of Urban Runoff Unit Loads 2.2.1 APWA unit loads 2.2.2 Unit loads for Ontario test catchments
2.2
2.3 Recommended Unit Loads ABATEMENT MEASURES FOR POLLUTION DUE TO URBAN RUNOFF 3. 3.1
3.2 3.3 3.4 3.5
First Level Abatement Measures 3.1.1 General description 3.1.2 3.1.3 Cost of s t r ee t sweeping Second Level Abatement Measures Third Level Abatement Measures Soil Erosion Control in Urbanizing Catchments Discuss ion 3.5.1 First level abatement measures 3.5.2 Second level abatement measures 3.5.3 Third level abatement measures 3.5.4 Soil erosion control
Removal of pollutants by s t r ee t sweeping
4 . CONCLUSIONS REFERENCES
ii iii
1 2 2 2 3 4 4 4 8
12 16 16 16 20 20 24 26
28 31 31 32 32 33 34 36
i
LIST OF FIGURES
Number
1 Observed and Calculated Annual ROD Loads
Page Number
6
ii

, Number
LIST OF TABLES
Page Number
1
1 l b )
12 13 14 15 16 17 18 19 20
Modified APWA Unit Loads [Kg/Ha/Yearl for Various Land Uses and Sewer Systems 8 Unit Loads [Kg/Ha/Yearl for Ontario lJrban Test Catchments Unit Loads [Kg/Ha/Yearl 10 Composition of Flows in Combined Sewers
9
11
11 Volume of Combined Sewer Overflows Estimated Unit Loads for Dry Weather Flow and Combined Sewer Overflows 12 Annual Unit Pollutant Loads in Kilograms/Hectare/Year 15 Efficiency of St ree t Sweepers 17 Fraction of Pollutant Associated with Each Particle Size Range 19 Pollutant Removal vs Sweeping Interval 19
Fractions of Annual Pollutant Loading Removed by Street Sweeping of Separate Sewerage Areas
Sweeping of Combined Sewerage Areas
21
Fractions of Annual Pollutant Loading Removed by Street 22
Pollutant Removals by Sweeping [ Kg/Ha/Year 1 23 Costs of S t ree t Sweeping [ $/curb kilometre 1 24 Kilometres Swept/Hectare/Year 24
Annual Costs of Sweeping [ DollardHectare 1 25 Pollutant Removals-Second Abatement Level 25 Second Abatement Level-Pollutant Removals and Associated Costs 27 Third Level Abatement Measures - Removal Rates 28 Annual Pollutant Removals [ Kg/Hectare/Year 1 29 Costs of Erosion Control Measures 28
iii

1. INTRODUCTION
One of t h e objectives of the PLUARG Modelling Task Force is to develop an overview model of outputs of land derived pollutants subject to selected management scenarios in a search for cost-effective s t ra tegies to meet ta rge t reductions. Towards this end, a pilot model has been developed. The model is based on the conceptualization of watersheds as sets of identifiable units of specified land form and land use. These units contribute pollution loads to t h e main river in series from headwaters to t h e river mouth. To evaluate t h e contribution of individual units, one needs to develop unit loads for various land forms and land uses.
The Hydraulics Research Division (HRD) of t h e National Water Research Institute has been asked by PLUARG to provide est imates of pollution loads for watershed units with urban land use and to evaluate various pollution abatement measures for urban runoff. To meet t he PLUARG deadline, t h e information requested had to be produced in a short t ime period using the existing information to a maximum possible extent. Two short reports [ 5, 61 were submitted by HRD to PLUARG to comply with the original request. Eventually, these reports were integrated into a single report which is presented here.
The terms of reference of t h e integrated report may be summarized as follows: (a) (b)
Provide est imates of annual unit loads of selected pollutants in urban runoff. Provide est imates of efficiencies and costs of selected abatement measures for pollution due to urban runoff.
- 1 -

2. ANNUAL POLLUTANT UNIT LOADS IN URBAN RUNOFF
The annual pollutant unit load in urban runoff is defined here as t h e pollutant weight which is conveyed by urban runoff from a one-hectare a r e a over a one-year period. These loads a r e presented in t h e following for various pollutants, land uses, and sewer systems.
2.1 PLUARC Requirements on Unit Loads
2.1.1 Land use
To maintain consistency with t h e previous PLUARC work, t h e annual unit loads were to be provided for a number of urban land uses. A conventional land use classification system was used originally [ 51. This classification included t h e following types of land use:
(a) (b) Commercial (c) Industrial (d) Other developed This conventional land use classification was found inappropriate for PLUARG
Residential (low, medium and high density)
modelling activities because of t h e following reasons: (1) The conventional classification was not fully compatible with t h e land use d a t a
available to t h e PLUARG researchers. The conventional classification did not fully ref lect t h e potential of various land uses to contribute to pollutant loadings in urban runoff. For example, in the conventional classif icatior., low-nuisance non-manuf acturing industrial activi- ties fall into t h e same category as hazardous or noxious industrial activities.
Consequently, a n amended classification of urban land use was adopted. Basically,
(2)
four types of land use a r e considered.
Land Use Group 1 This type of land use contributes relatively low pollutant loads. Among typical land
uses included in this group, one could name low and medium density residential land use, and limited-nuisance industrial activit ies (wholesale, warehouses).
- 2 -
Land Use Group 2 This type of land use generates intermediate pollutant loads. Typical land uses
included in this group a r e high density residential (125 people/hectare), and commercial land use.
Land Use Grouo 3 This type of land use contributes t h e highest pollutant loads.
included in this group a r e medium and high intensity industrial land use. Typical land uses
Land Use Group 4 This type of land use contributes very low pollutant loads. Typical land uses included
in this group a r e parks, playgrounds, etc. In many cases, t h e pollution contribution of this group may be neglected.
Finally, a mention should be made of newly developed urban land. This stage of land development is characterized, for all land uses, by high production of suspended solids because of soil erosion. If no erosion prevention measures a r e taken during t h e development, t h e suspended solids loads from newly developed urban land reach levels of about 1700 kg/hectare/year. I t is, therefore, necessary to differentiate between t h e established and newly developed urban land. In t h e PLUARG model, t h e urban areas are considered to be fully established one year a f t e r t h e completion of t h e development. Note t h a t this differentiation is made here only for t h e loads of suspended solids.
2.1.2 Pollutants to be studied
The selection of water quality parameters investigated in urban runoff studies varies widely. The parameters studied in this report were specified by PLUARG as follows:
Biochemical Oxygen Demand BOD Nitrogen N Phosphorus P Suspended Solids ss Cadmium Cd Chromium Cr Copper c u
Mercury Hg Nickel Ni Lead Pb Zinc Zn

2.1.3 Sewer systems
The pollution due to urban runoff has different forms depending on t h e sewer system. In t h e separate sewer system, urban runoff is conveyed by storm sewers and one is therefore interested in the loads discharged from storm sewers.
In t h e combined sewer system, t h e pollution loads can be divided into two components. The first component is t h e load which is conveyed by the combined sewer interceptors to t h e wastewater t rea tment plant. This load represents a point source and was not included in t h e te rms of reference of this study.
The second component is conveyed by combined sewer overflows. These overflows occur during the wet weather when the interceptor capacity is exceeded because of large inflows of surface runoff into the sewers. The load conveyed by overflows which is sometimes referred to as t h e wet weather load was quantified in this report.
2.2 Literature Survey of Urban Runoff Unit Loads
The main objective of the l i terature survey was to review t h e available unit loads with regard to t h e PLUARG requirements. Two types of unit loads were found in t h e l i terature - t h e loads calculated from t h e equation proposed by the American Public Works Association (APWA) [ 9 1, and t h e loads derived for several Ontario test catchments [ 81 . 2.2.1 APWA unit loads
The APWA unit loads were prepared under a contract commissioned by t h e Urban Drainage Subcommittee [ 91. Although APWA was to use the Ontario field da ta to the maximum possible extent , very l i t t le such d a t a were available in t h e early stages of the APWA project and, consequently, t h e loads were based mainly on U.S. field data. In fact, APWA used pollutant concentration data from one Canadian (Windsor) and seven American cities.
BOD effluent d a t a from 19 residential catchments were used by APWA to derive a general load equation in t h e following form:
L = a P ( b + c D ) d (1)
where L is t h e annual unit load (kg/ha), P is the annual precipitation (m), D is t h e population density (people/ha), and a, b, c, d a r e experimental parameters. By substituting proper values of these parameters in to Equation 1, it is possible to calculate t h e annual unit loads of various pollutants for both storm and combined sewers, and for various land uses.
- 4 -

The selection of the independent variables, P and D, was based on t h e following reasoning:
The annual unit loads will increase with an increasing annual precipitation. The population density then determines t h e proportion of precipitation converted into runoff and also composition of runoff. To gain a bet ter appreciation of the accuracy of loads calculated from Equation 1,
t h e derivation of Equation 1 is briefly examined below for both storm and combined sewers.
2.2.1.1 Storm water loads. Pollution loads in runoff from urban areas served by storm sewers were reported for numerous locations and could be used by APWA to compute the annual unit loads. Fairly extensive effluent da ta were available for residential areas; for other land uses, the da ta available were rather limited. The effluent da ta expressed in flow-weighted mean concentrations were multiplied by t h e annual runoff per unit area to obtain t h e annual unit loads.
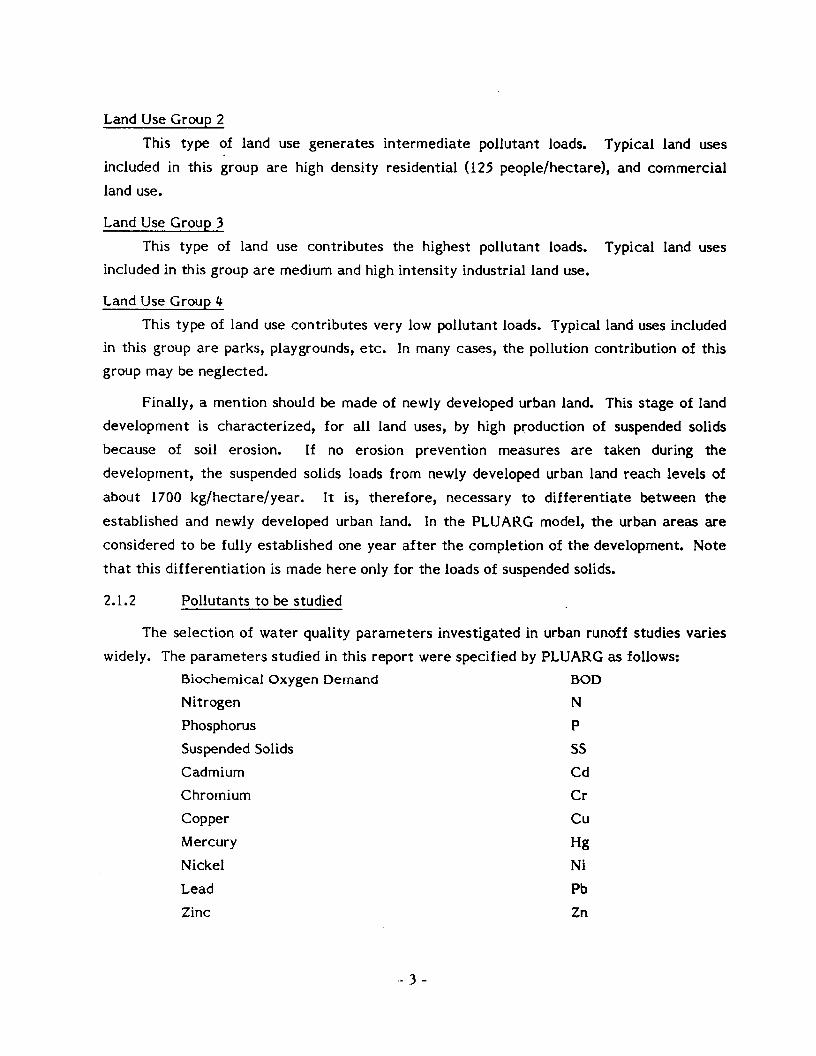
For residential areas, Equation 1 was f i t ted to annual unit BOD loads from 19 catchments. The goodness of fit deserves further attention and is examined below. For tha t purpose, Equation 1 was rearranged into t h e form
Y = a ( b + c D d )
and t h e field d a t a were rearranged accordingly. Using the method of least squares, Equation 2 was f i t ted to the field da ta as shown in Fig. 1. The goodness of lit was rather poor because of the large sca t te r in field data. Under these circumstances, one may consider approximating the field d a t a by simpler relationships than Equation 2. In particular, one could consider a linear relationship, or simply assume t h a t t h e pollutant loads are constant for various population densities (i.e. L/P=const., for a particular land use). All t h e relationships considered a r e plotted in Fig. 1. The goodness of fit for all these relationships was evaluated by calculating to ta l variations of observed loads about t h e calculated ones. The least variation was obtained for t h e linear regression equation and was only slightly smaller (by 2%) than the variation about the mean. The largest variation was obtained for Equation 2. I t is evident, therefore, tha t Equation 2 is based on intuition rather than on a statist ical analysis of the observed loads. This point is illustrated in Figure 1 in which t h e observed loads as well as t h e calculated loads a r e plotted. The accuracy of loads computed from Equation 1 will not be bet ter than plus minus several hundred percent.
For other pollutants, corresponding values of parameters a, b, c, d were derived by Knowing the daily APWA from the analysis of surface accumulations of dust and dirt.
- 5 -

accumulation ra tes and t h e composition of dust and dirt, t h e annual unit pollutant accumulations were taken as t h e annual unit loads.
Unit loads f o r other than residential land use were determined from t h e following equation:
2 s
di Gi Fi L . = L - - - dr ‘r Fr I
A OBSERVED LOADS
where d is t h e dust and dir t accumulation r a t e in weight uni tduni t curb length/day, G is t h e length of curb per unit area, F is the fraction of dust and dirt tha t is a particular pollutant, and indices i and r refer to a particular land use and t h e residential land use, respectively. The ratios di/dr and Fi/Fr were adopted froin a previous study in Chicago, and the ratios Gi/Cr were taken as averages of t h e da ta collected in Tulsa (Oklahoma) and in three cit ies in Ontario.
The use of Equation 3 for calculation of unit loads is consistent with the concept of surface accumulation and wash-off of pollutants as a main source of pollution in urban runoff. However, there a r e hardly any effluent da ta to verify the calculated loads which a r e likely to contain very large uncertainties. Some limited effluent da ta for a commercial a r e a in Burlington agreed qui te well with the APWA estimates.
0 . 3 . n
ri A
0 50 WPULAT ION DENSITY (people/ ha 1
100
FIGURE 1 OBSERVED AND CALCULATED ANNUAL BOD LOADS
- 5 -
2.2.1.2 Combined sewer overflow loads. Pollution loads in combined sewer overflows a r e difficult to quantify, because these loads depend on a large number of factors including t h e climate, interceptor capacity, sewer system maintenance and operation, and land use. Because of these difficulties, numerous assumptions had to be adopted by APWA to produce wet weather loads frorn areas served by combined sewers. Among these assumptions, t h e most important a r e t h e following:
(a) The annual volume of flow which bypasses t h e waste t reatment plant is equal to t h e annual surface runoff from t h e area. Pollutant concentrations in combined sewer flow a r e 4.12 t imes higher than those in storm water.
(b)
Consequently, t h e unit loads from areas served by combined sewers were obtained by multiplying t h e loads from separate sewerage a reas by 4.12 and Equation 1 with appropriate values of parameters a, b, c, d is again applicable.
The validity of assumptions (a) and (b) is examined here. Firstly, the volume of flow bypassing the t rea tment plant will be smaller than the volume of surface runoff, because coinbined sewer interceptors have capacit ies larger (1.5 - 3 times) than t h e dry weather flow. Consequently, not only the dry weather flow but also some runoff a r e conveyed to t h e waste t reatment plant of which capacity also exceeds t h e average daily dry weather flow.
Secondly, t h e correction factor of 4.12 was derived by APWA for Biochemical Oxygen Demand (BOD) loads and universally applied to other constituents. Because t h e BOD loads are known to be relatively low in storm water (possibly suppressed by toxic substances), t h e correction factor of 4.12 may be too large when applied t o other constituents than BOD (e.g. suspended solids) and may lead to overestimation of pollution loads from areas served by combined sewers.
Finally, Equation 2 with modified parameters was tes ted against t h e basic d a t a in t h e APWA report. Very large sca t te r of t h e observed loads about Equation 2 was found.
2.2.1.3 Example of APWA unit loads. To indicate t h e magnitude of unit loads for urban runoff, a n example of t h e loads calculated from t h e APWA equation is given in Table 1. The APWA equation was somewhat modified for this purpose by introducing a constant mean precipitation (P=0.813 m) into the equation. The error in unit loads caused by this sirnplification is less than 10% for 91% of t h e Ontario urban population and is negligible in comparison to other errors involved in t h e calculations.
- 7 -

TABLE 1 MODIFIED APWA UNIT LOADS[ KG/HA/YEAR 1 FOR VARIOUS LAND USES AND SEWER SYSTEMS
ss5
730 956 1131
645
853
11.8
1. RESIDENTIAL 1 ( a ) Low density
(b) Medium density ( c ) High density
2
3
2. COMMERCIAL
3 . INDUSTRIAL
4. OTHER
PO4 N7
1.46 5.8 1.90 7.6 2.24 9.1
2.24 8.5
2.13 8.1
.04 .27
BOD^
36
46 56
93
36
.49
7.84 9.23
9.23
8.77
.18
SEPARATE SEWERS STORM WATER
31.4 37.4
35.0
33.3
1.12
'Population density PD = 50 people/ha [ 20 people/acre 1
2Population density PD = 87 people/ha [ 35 people/acre 1
BOD
148 194 23 1
383
148
2.01
COMBINED SEWERS OVERFLOW
ss
3000 3940 4660
2658
3516
48.5
-1 p04 1 * -
6.00
3Population density PD
4Biochernical Oxygen Demand
'Total Suspended Solids
6Total Phosphate
7 ~ o t a 1 Nitrogen
= 125 people/ha [ 50 people/acre 1
_---
If s t r e e t sweeping is practiced in t h e urban area, t h e unit loads from Table 1 have to be somewhat reduced. In t h e APWA report, the effects of s t r e e t sweeping on unit loads were est imated from model simulations at a particular location. A more realistic approach was used in this report and is described in section 3.
2.2.2 Unit loads for Ontario test catchments
The quantity and quality of urban runoff have been monitored in several Ontario test catchments. These da ta were then used to derive experimental unit loads for urban runoff.
- 8 -

2.2.2.1 Separate sewers. A number of studies of drainage effluent composition have been undertaken in areas served by storm sewers. Two land uses have been studied - a residential land use and a commercial land use. Residential Areas
Effluent da ta from four catchments were available. None of t h e d a t a records spanned over the ent i re 12 month period and the da ta had to b e extrapolated by various methods. The simplest extrapolation was to determine t h e flow-weighted mean concentrations of individual pollutants and calculate t h e annual loadings by multiplying these concentrations by t h e annual runoff voluine per unit a r e a [ 8 I. In other approaches, a simulation model was used to fill gaps in the da ta [ 11 1, or the existing da ta were used to develop a simple regression model of runoff quality and this model was then run for a one year period to produce the annual loadings [ 4 1. The scmrnary of t h e annual loadings derived for several Ontario catchments appears in Table 2.
TABLE 2 UNIT LOADS [ KG/HA/YEAE?] FOR ONTARIO URBAN TEST CATCHMENTS (AFTER REF. 8)
--- 1.40 3.18 13.00
11.20
With t h e exception of SS, t h e mean values from Table 2 agree reasonably well with t h e APWA est imates (see Table 1). Modern residential areas, such as North York and Burlington, produced relatively low loads of suspended solids. Older residential areas, such as both Windsor catchments, produced SS-loads comparable to t h e APWA estimates. On
- 9 -
t h e o ther hand, t h e modern urban areas produced N and P loads which were higher than those from t h e older areas.
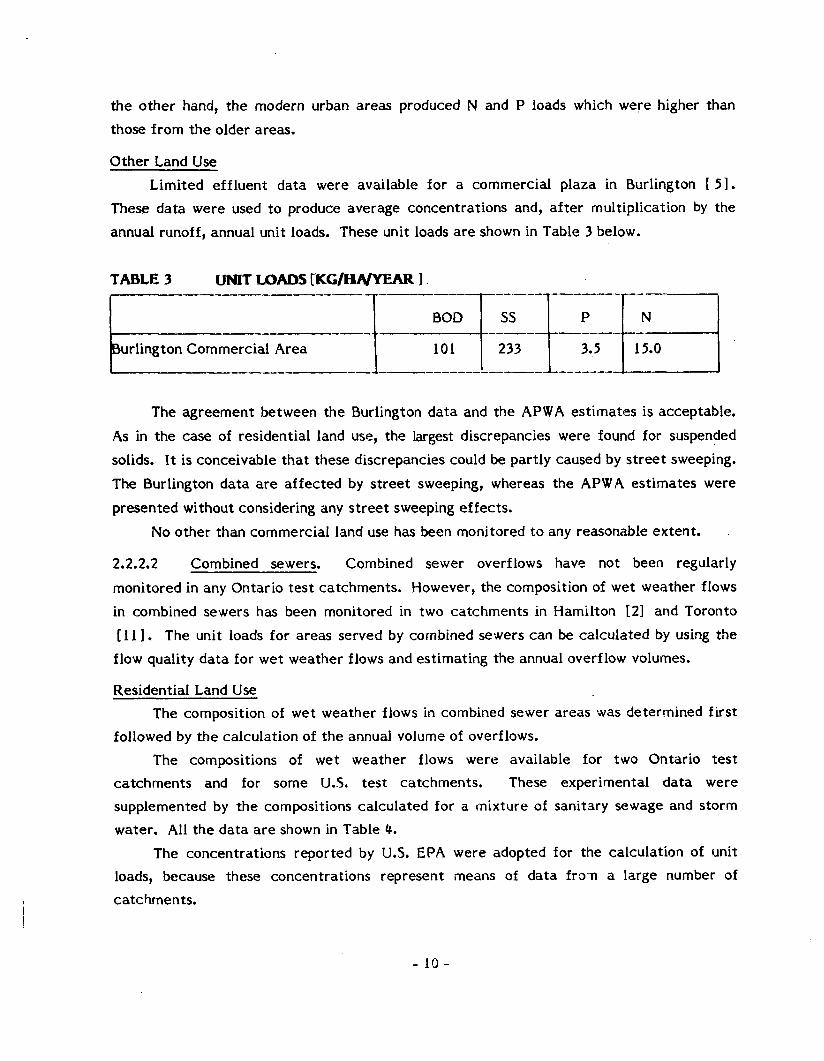
Other Land Use Limited eff luent da ta were available for a commercial plaza in Burlington [ 51.
These da ta were used to produce average concentrations and, a f t e r multiplication by the annual runoff, annual unit loads. These unit loads a r e shown in Table 3 below.
The agreement between t h e Burlington d a t a and t h e APWA est imates is acceptable. As in t h e case of residential land use, the largest discrepancies were found for suspended solids. I t is conceivable t h a t these discrepancies could be partly caused by s t r e e t sweeping. The Burlington da ta a r e affected by s t ree t sweeping, whereas the APWA est imates were presented without considering any s t r e e t sweeping effects.
No other than commercial land use has been monitored to any reasonable extent. .
2.2.2.2 Combined sewers. Combined sewer overflows have not been regularly monitored in any Ontario test catchments. However, the composition of wet weather fIows in combined sewers has been monitored in two catchments in Hamilton [21 and Toronto [11 I . The unit loads for areas served by combined sewers can be calculated by using the flow quality d a t a for wet weather flows and estimating the annual overflow volumes.
ResidentiaI Land Use The composition of wet weather flows in cornbined sewer a reas was determined first
The compositions of wet weather flows were available for two Ontario test catchments and for some U.S. test catchments. These experimental da ta were supplemented by t h e compositions calculated for a mixture of sanitary sewage and storm water. All t h e d a t a a r e shown in Table 4.
followed by t h e calculation of t h e annual volume of overflows.
The concentrations reported by US. €PA were adopted for t h e calculation of unit loads, because these concentrations represent means of d a t a from a large number of catchments.
- l o -

TABLE 4 COMPOSITION OF FLOWS IN COMBINED SEWERS
Source
Dry weather flow Storm water Combined sewage Combined sewage Combined Sewage
Mixture of sanitary sewage and s torm water
Reference
Ontario Oa ta [ 31 Malvern [ 41 Frankdale Catchment [ 11 1 Hamilton 1 2 1 Mean values reported by EPA [ 101 Calculated frorn t h e above da ta
_-__ ----- CONCENTRATION (mg/li tre)
-- BOD
130 14 40 21
119
107
-- .- ss
130 120 130 515
198
128
-----
_-- N --
35 5
10.9 5.6
16.5
28.3
_---
To es t imate the annual volume of overflows, it is assumed tha t this volume is equal to t h e annual runoff reduced by t h e volume of runoff which is conveyed by sewer interceptors during t h e wet weather. Interceptors in combined sewer systems a r e designed to convey t h e dry weather flow (DWF) plus some portion of surface runoff. For the typical interceptor capacit ies of 1.5 - 3 t imes t h e dry weather flow, t h e excess capaci ty available for urban runoff is 0.5 -2 tirnes DWF. The calculation of annual overflows from residential a reas served by combined sewers is given in Table 5. A11 t h e assumptions made in these calculations can be inferred from t h e table.
TABLE 5 VOLUME OF COMBINED SEWER OVERFLOWS
Annual Precipitation [ml
Annual Runoff [rn /ha 1 Volume of Runoff Conveyed to the Waste Treat- ment Plant (Estimated as 1000 times the hourly dry
3 weather flow) [ m /ha 1
a tchment Imperviousness [%I 3
Population Density ( People/hectare)
50
.813 35
2845
------
948
-- 1897
-- 87.5
.813 45
3658
---I_
1659
1999
125
.813 55
4471
2370
2101
- 11 -
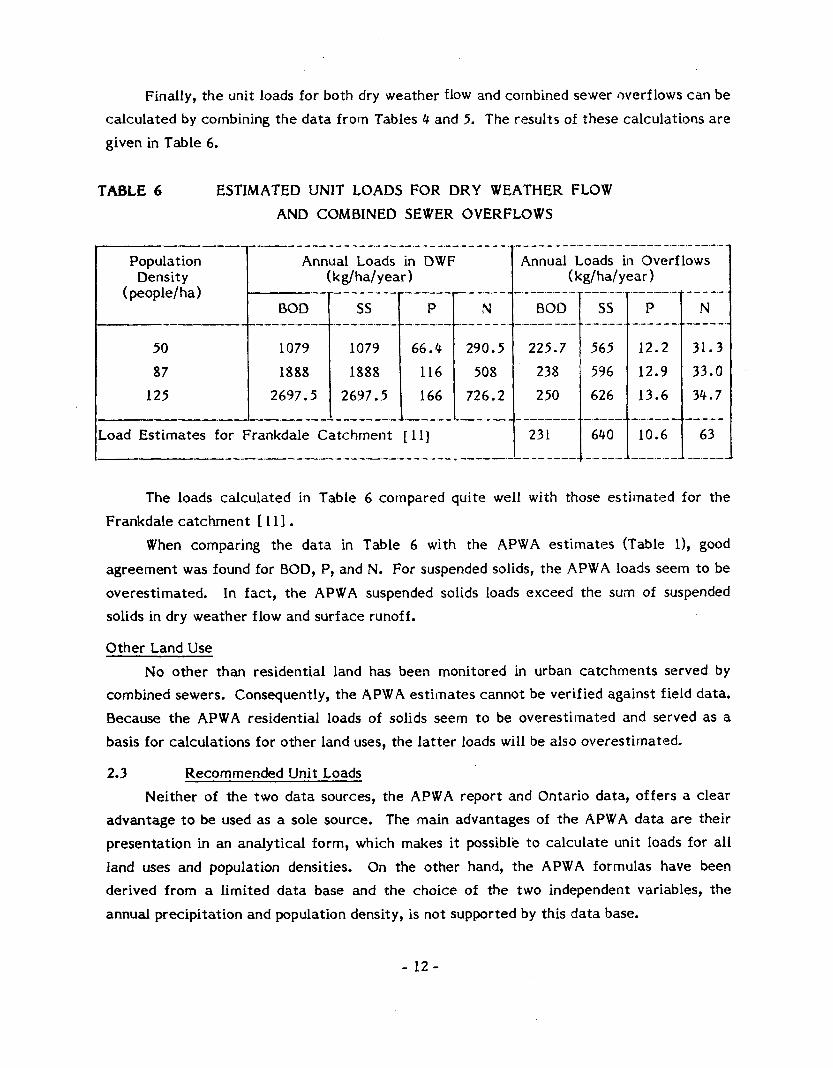
Finally, t h e unit loads for both dry weather flow and combined sewer overflows can be calculated by combining t h e d a t a from Tables 4 and 5. The results of these calculations a r e given in Table 6.
TABLE 6 ESTIMATED UNIT LOADS FOR DRY WEATHER FLOW AND COMBINED SEWER OVERFLOWS
The loads calculated in Table 6 compared quite well with those estimated for t h e
When comparing t h e da ta in Table 6 with the APWA est imates (Table l), good agreement was found for BOD, P, and N. For suspended solids, t h e APWA loads seem to be overestimated. In fact, t h e APWA suspended solids loads exceed the sum of suspended solids in dry weather flow and surface runoff.
Frankdale catchment [ I 1 1 .
Other Land Use N o other than residential land has been monitored in urban catchments served by
combined sewers. Consequently, t h e APWA est imates cannot be verified against field data. Because t h e APWA residential loads of solids seem to be overestimated and served as a basis for calculations for other land uses, t h e l a t t e r loads will be also overestimated.
2.3 Recommended Unit Loads Neither of t h e two d a t a sources, t h e APWA report and Ontario data, offers a clear
advantage to be used as a sole source. The main advantages of t h e APWA data a r e their presentation in a n analytical form, which makes it possible to calculate unit loads for all land uses and population densities. On the other hand, t h e APWA formulas have been derived from a limited data base and the choice of the two independent variables, the annual precipitation and population density, is not supported by this d a t a base.
- 1 2 -

The da ta f rom Ontario test catchments have sufficient scope only for residential areas served by separate sewers. Four such areas have been monitored. Fairly extensive da ta a r e available for t h e Burlington and Windsor catchments. About 10% of t h e annual runoff were sampled in Burlington, at a 6.5 minute interval. About 50% of t h e annual runoff were sampled in Windsor, at hourly intervals.
Some limited da ta exist for a cornmercial plaza served by separate sewers. No other
In general, t h e APWA and Ontario unit loads for s torm water agreed fairly well. Combined sewer catchments in Hamilton and Toronto produced good d a t a on t h e
composition of wet weather flows in combined sewers. As expected, the Hamilton catchment produced high loads of suspended solids caused by construction activities in t h e ca tch men t .
land uses have been monitored.
With the exception of suspended solids, fair agreement between t h e APWA and Ontario da ta was found for residential areas served by storm as well as combined sewers. I t was therefore possible to use t h e APWA as a basis for estimating t h e unit loads of BOD, N, and P in storm water and overflows from all the land uses. For suspended solids, the recommended unit loads were based on t h e Ontario data.
In addition to t h e four basic constituents dealt with previously, it was necessary to derive new unit loads for selected metals. Extensive da ta on metals in urban runoff were available for t h e Malvern and Hamilton catchments [ 5 , 2 1.
The Malvern catchment represents a modern residential a r e a which is served by storm sewers. The Malvern loads of selected metals were adopted as typical loads for s torm water and t h e land use group 1; f o r other land uses, these loads wer,e corrected by means of the coefficients analogous to those given in t h e APWA report [ 91. In particular, the following relations among unit loads for various land uses were adopted:
L2 = 1.10L1 L3 = 1.71 L1 L4 = 0.14LI
where L is the unit pollutant load (kg/ha/year), groups described earlier in this section.
subscripts 1-4 refer to t h e land use
For areas served by combined sewers, t h e da ta from the Hamilton test catchment were used [ 2 I. The Hamilton test catchment represents an older residential a r e a which is served by combined sewers. Considering combined sewage as a mixture of sanitary sewage and storm water, pollutant concentrations in combined sewage were estimated as weighted averages of concentrations observed in sanitary sewage and in storm water. Pollutant loads
- 13-

were then determined for .appropriate flow volumes and taken as the loads which correspond to t h e land use group 1. For other land uses, the APWA correction coefficients (listed above) were again applied.
All t h e annual unit pollutant loads recommended for use in t h e PLUAKG model a r e given in Table 7. Very l i t t le information is available to est imate uncertainties in the recommended loads. Judging from t h e range of values reported in t h e l i terature I5 1, these uncertainties may be in t h e order of several hundred percent.
Note tha t s t r e e t sweeping will reduce the annual unit loads. This subject is deal t with in t h e following section.
.- 1 4 -

TABLE 7 ANNUAL UNIT POLLUTANT LOADS IN KILOGRAMS/HECTARE/YEAR
Cons ti tuent
BOD N P ss Cd C r c u
Hg Ni Pb Zn
------------- Land Use
1 Group 1 -___--_--__--__
34.0 9.0 1.6
390.0 .013 .026 .045 ,038 .029 ,157 .570
134.0 31.5 10.2
773.0 .016 .028 .064
.043
.034
.162
.640
----------- Land Use
2 Group 2
90.0 11.2 3.4
560.0 .016 .028 .049 .043 .032 .174 .630
293.0 36.5 11.4
672.0 .017 .031 .071 .047 .037 .180 .703
Group 3'
34.0 7.8 2.2
672.0 .024 .044 .077 .065 .050 .269 ,980
112.0 34.5 10.9
740.0 .027 .048 . lo9 .073 .057 .277
1.088
'Land Use Group 1 - Low-to-medium density residential, light industry
Land Use 4 Group 4
1.12 .22 .04
11.2 .002 .003 .007 .006 .004 .022 .081
1.6 1.1
.34 11.2
.002
.003
.009
.006
.004
.022
.090
'Land Use Group 2 - High density residential, commercial
3Land Use Group 3 - Industrial land
40pen land - parks, etc. Note: For newly developed urban land, increase t h e SS-loads to 1700 kg/ha/year for all t h e land uses.
- 15-

3. ABATEMENT MEASURES FOR POLLUTION DUE TO URBAN RUNOFF
The abatement of pollution due to urban runoff has been extensively studied during the last t e n years. During this period, new pollution abatement measures have been developed. Such measures include source controls, collection system controls, storage, and t reatment . Quite often, various combinations of these basic techniques a r e used to achieve t h e most cost-effective abatement of urban runoff pollution.
Although many pollution abatement measures have been proposed and studied in the laboratory or a pilot plant, the actual experience with designing and building such abatement facilities is rather limited, particularly in Canada. This lack of hard da ta then contributes to relatively large uncertainties in the efficiencies and costs of the abatement nteasures discussed in this report.
As recommended by PLUARG, th ree levels of pollution a b a t e n e n t were considered. The first level, s t r e e t cleaning, belongs to the source control category. The second level includes runoff storage and basic t rea tment by sedirnentation. The third level cornbined runoff storage and advanced t reatment .
Pollutant removal efficiencies and associated costs for the first abatement level were established in this report. For the second and third levels, analogous inforination was adopted from a recent report [ 9 ] which was prepared by the American Public Works Association (APWA) for the Urban Drainage Subcomrnittee, The contribution made in this report consisted in expanding t h e original APWA analysis for additional constituents and assuming tha t pollutant removals depend on the pollutant association with solid particles of cer ta in sizes.
3.1 First Level Abatement Measures
3.1.1 General description
S t ree t cleaning was considered here as a first-level abatcinent measure for areas served by separate sewers as well as for areas served by combined sewers. While most cit ies undertake some form of s t r e e t cleaning for aesthet ic reasons, only recently has s t r e e t cleaning been recognized as a pollution control measure which reduces the pollutant loadings available for wash-off by surface runoff. There is still a relative lack of d a t a on cost effectiveness of s t r e e t cleaning and on its relation to the effectiveness of the controls
- 1 6 -

which a r e implemented at the drainage outlet. *
of s t r e e t sweeping in removal of pollutants is a function of t h e following factors [ 71: The most common form of s t r e e t cleaning is sweeping. In general, t h e effectiveness
sweeper efficiency number of passes speed of equipment pavement conditions pollutant association with particles of cer ta in sizes . frequency of sweeping frequency of rainfall, and public participation and awareness.
3.1.1.1 Sweeper efficiency. A variety of s t r e e t sweepersateavailable on t h e market. Two basic types are referred to as mechanical broom sweepers and vacuum sweepers. Mechanical broom sweepers a r e less expensive and fulfill t h e main objective of current s t r e e t cleaning practices - aesthetics. I t is well established, however, that broom sweepers a r e ineffective in removing f ine particles which may contain high concentrations of such pollutants as phosphorus o r heavy metals. Vacuum sweepers, which a r e more expensive, possess good removal efficiencies throughout t h e full range of particle sizes.
The sweeper efficiencies which were used in this report were adopted from references [ 7, 121. These efficiencies are shown in Table 8 for various particle sizes.
TABLE 8 EFFICIENCY OF STREET SWEEPERS
PARTICLE SIZE b m ]
> 2 i.84 - 2.C' 1.246 - 0.84 1.104 - 0.246 1.043 - 0.104
< 0.043
PERCENT O F PARTICLES REMOVED (By Weight) Broom Sweepers [7]
1 Pass
79% 66% 60% 48% 20%
2 Passes
95.6% 88.4% 84.0% 77 .O% 36.0%
I
Vacuum Sweeper! [12 1
80% 90%
95%
- 17-

I t can be inferred from Table 8 tha t sweeper efficiencies vary with t h e particle size and this variation is particularly large in the case of mechanical broom sweepers. The efficiency of broom sweepers c a n be as low as 15% for t h e smallest particles and one sweeping pass.
3.1.1.2 Number of passes. The removal efficiency of street sweeping can be increased by making more than one sweeping pass. This is particularly t rue for broom sweepers; the greater t h e number of passes, t h e greater t h e amount of fine particles tha t will be removed. For this reason, two passes were considered in this report for mechanical broom sweepers (see Table 8).
3.1.1.3 The majority of sweepers a r e designed to provide t h e maximum efficiency at a cer ta in operating speed. If this speed is exceeded, the sweeper efficiency will fall significantly. The efficiencies in Table. 8 correspond to the optimal operating speed (typically about 6.4- 12.8 km/hour).
Speed of equipment.
3.1.1.4 Depressions in a road surface provide hard to reach places for sweepers. In addition, further deterioration continually adds materials to the pollutant accumulations on t h e surface. Consequently, effect ive s t r e e t sweeping is possible only on adequately maintained road surfaces.
Pavernent conditions.
3.1.1.5 Pollutant association with particles of cer ta in sizes. Particle removal froin t h e street surface is a selective process which depends on t h e particle size. Because pollutants tend to b e nonuniformly associated .with particles of certain size ranges, t h e removal of pollutants will also be selective. Several sources of information on pollutant association with certain particle sizes were reviewed and reference [ 71 was found to provide t h e most complete information. The basic da ta from reference [ 7 I , which were adopted in this report, appear in Table 9.
I t c m be inferred f r o n Table 9 t h a t practically all t h e pollutants tend to be associated inore with fine particles than with coarse particles. This tendency is particularly strong in t h e case of phosphates.
3.1.1.6 Particles resting on the catchment surface a r c removed by ei ther surface runoff or sweeping. To quantify the pollutant removal by sweeping at a certain frequency, one has t o determine t h e number of dry days preceding each sweeping operation. Such information was presented in reference [ 41 for a particular rainfall record and three sweeping frequencies. The da ta frorn reference [41 which were adopted in this report a r e summarized in Table 10.
Stree t sweeping frequency and rainfall frequency.
- 18-

TABLE 9 FRACTION OF POLLUTANT ASSOCIATED WITH EACH
840+2,000 -----__--- 7.6
20.1 4 .5
6 .5 0 .9
17.5
-- Total Solids
246+840
24.6
---
15.7 13.0
7 .9 6 . 9
14.9
BOD COD
Nit t a t es Phosphates Total Heavy
Metals
PARTICLE SIZE (11)
7 .4 2.4
8.6 0
16.3
104-t 24t
27.8
15.2 12.4
16.7 6 . 4
23.5
-----
17.3 24.3 45.0 22.7
28.4 31.9 29.6 56.2
27.8 -
TABLE 10 POLLUTANT REMOVAL VS SWEEPING INTERVAL [ 41
I POLLUTANT REMOVAL [ Weight Percent ]
- II -- 0.146 e 0.296 e 0.463 e
--- - e = the efficiency of sweeping (typically varies from 0 . 6 to 0.9)
- 1 9 -

3.1.1.7 Public participation and awareness. Public participation is important from several points of view. Parked cars are major obstacles to efficient cleaning. The public should be informed on t h e need for cleaning and the need for streets to be clear of parked vehicles in order to accomplish e f fec t ive cleaning.
The public also should be informed on t h e contributions individuals can make to reduce t h e amount of material t ha t end up on a road surface.
3.1.2 Kemoval of pollutants by s t r ee t sweeping
The removal of pollutants by s t r e e t sweeping can be determined from Tables 8-10 and the pollutant loads for separa te sewerage a reas (Table 7). First, sweeper efficiencies in removing a particular pollutant were determined by applying t h e sweeper efficiency (Table 81, for a cer ta in particle size, to the weight fraction of the pollutant associated with the sarne particle size (Table 9). The resulting pollutant removal efficiencies were then substi tuted into the expressions for pollutant removals for various sweeping intervals (Table IO). The final d a t a represent pollutant removals, by sweeping at various tirne intervals, expressed in weight percent of t h e total loading. These relnovals a r e given in Table Il(a).
A f ew observations regarding the da t a in Table I 1 are of interest. Vacuum sweepers appear to be significantly mare efficient than rnechanical broom sweepers. Tbis di l ference is particularly marked for phosphates which tend to be associated with f ine particles. The annual pollutant removals increase with an increasing frequency of s t r ee t sweeping. The resulting increase in removals is not, however, linearly proportional t o the sweeping frequency. This nonlinearity is caused by the cl imat ic factors (rainfall frequency).
Finally, t h e reinoval ra tes froin Table ll(a) were applied to the annual unit loadings for separate sewerage a reas to obtain pollutant rernovals in kg/ha/year. These annual pollutant removals a r e given in Table 12 (a)-(c) for various land uses and are assumed to be valid for both separate and cornbined sewerage areas.
In t h e case of combined sewers, only t h e load component originating in surface accuqulat ions is controlled by s t r ee t sweeping. The other load component, which is contributed by the dry weather flow, is not controlled. Consequently, t h e percentage removals by s t r ee t sweeping of combined sewerage areas will be lower than those for separa te sewerage areas. The percentage reinovals for cornbined sewerage a reas were calculated by dividing the weight removals (Table 12) by the annual loads from Table 7. The results of this calculation a r e given in Table 1 l(b).
3.1.3 Cost of s t r e e t sweeping
The costs of street sweeping a r e typically reported in dollars per curb mile swept. Irl
a recent EPA report [ 7 1, these costs were found to vary as much as four times. Such a
- 20 -

TABLE 11 (a) FRACTIONS OF ANNUAL POLLUTANT LOADING
REMOVED BY STREET SWEEPING OF SEPARATE SEWERAGE AREAS
27.6 43.2
6.6 10.3 11.2 17.5 -I 13.9 28.1 44.0
---- Pollutant
BOD
N
I
P
SS
-
Heavy Metals
Type of Sweeping Operation
Fractions of Pollutant Removed [Weight Percent ]
1 =30 days 1=15 days 1=7 days 3
B.SW.'-1 Pass B.SW. -2 Pass v.sw.2-1 Pass
7 .O 9.2
13.6
12.7 18.6 27.5
19.9 29.0 43.0
B.SW. -1 Pass B.SW. -2 Pass 'V.SW. -1 Pass ---- B.SW. -1 P a s ~ B.SW. -2 Pass V.SW. -1 Pass
5.0 7.7
~~
B.SW. -1 Pass B.SW. -2 Pass V.SW. -1 Pass
8.1 11.3 13.3
~ ~~~~
16.3 22.9 27.0
25.6 35.8 42.2
B.SW. -1 Pass B.SW. -2 P ~ S S v.sw. -1 Pass
7.2 10.3 13.4
14.7 20.9 27.1
22.9 32.7 42.4
'Broom Sweeper
'Vacuum Sweeper
31 =Sweeping Interval
- 21 -

TABLE ll(b) FRACTIONS OF ANNUAL POLLUTANT LOADING
0.5 0.8 2.1
REMOVED BY STREET SWEEPING OF COMBINED SEWERAGE AREAS
1.0 1.7. 4.3
Type of Sweeping Operation
----- 1 .o 1.6 4.1
6.8 9.4
11.1
6.5 9.2
11.9
5.1 7.2 9.3
6.9 9.9
112.9
---
-- _.-
-I_--
-- ---
L---
--- B . S W . '-1 Pass B . S W . -2 Passes v.Sw.'-l Pass
----_ 2.1 3.6 9.1
23.2 32.5 38.3
20.4 29.1 42.4
-----_
__- ----
t -.-----
B.SW. -1 Pass B . S W . -2 Passes V . S W . -1 Pass
4.1 5.7 6.8
B . S W . -1 Pass B . S W . -2 Passes V.SW. -1 Pass
8.3 11.6 13.7
B . S W . -1 P ~ S S B . S W . -2 Passes V . S W . -1 Pass
6.4 9.1
11.8
5.0 7.2 9.4
7.0 9.9
13.3
-̂---.-------
---
B.SW. -1 Pass B . S W . -2 Passes v.sw. -1 Pass
B.SW. -1 Pass B . S W . -2 Passes V.SW. -1 Pass
B.SW. -1 Pass B . S W . -2 Passes V . S W . -1 Pass
--__I-p-.-
_-------
---_-----------
13.0 18.4 23.8
10.3 14.7 18.9
14.2 20.3 26.2
--- -
Fractions
23.2 42.3
22.2 31.7 42.4
-----
-- --- - 4
7.4 10.8
4.5 6.9 6.8
'
1.6 2.7 6.8
13.0 18.2 21.4
20.2 28 .? 42.1
16.1 22.8 42.3
22.2 31.7 42.5
1=30
2.2 2.8 4.2
----
8.4 .---
3.1 4.8 8 . 3
2.0 3.3 8.3
13.6 19.1 22.5
13.0 18.6 24.0
10.1 14.5 18.9
14.2 20.2 26.1
---.---
---
--_---
----- -
I__---
1=7 --.
6.1 8.9
13.1
4.9 7.5
13.0
3.0 5.2
13.0
21.3 29.8 35.2
20.2 29.1 42.4
15.9 22.7 42.1
22.1 31.6 42.2
---
-- ----
---
---I-
____---
----
------
1=30
2.1 2.8 4.1
1.1 1.7 2.9
0.7 1.1 2.9
7.4 10.3 12.1
6.4 9.2
11.9
5. I 7.3 9.5
7 .O 10.0 13.0
---
_I_-
_--__
_.----
-- -- -
--- -.--
------
-- -__ -
?ercent ;e Grot 1=15
3.8 5.7 8 .3
2.3 3.5 5.8
I .4 2.3 5.8
14.8 20.8 24.5
13.1 18.6 24.2
10.5 14.9 19.2
14.3 20.3 26.3
1-1
---
---
----- -
_-____
------
-- - --.-
- -_ --.-
- 22 -

TABLE 12
7 s - --I_-
1 =7 days
6.7 1.24
-
,231 172.0
.0054
.0100
.0177
.0149
.0115
.0616
.224 -
__----
Consti- tuent ---- BOD N P ss Cd C r c u
N i Pb Zn
Hg
. - -- -.- -- -
---- II Consti- tuent
-----I
ROD N P ss Cd C r c u Hg Ni Pb Zn ____-__
--------------- 1=30 days
2.4 _- - - - -- -
.39
.072 54.4 .0017 ,0031 .0056 .0047 .0036 .0194 .0705
.- --- - - -- Cons t i - tuent
ROD N P ss Cd Cr c u N i Pb Zn
- ---- -
%
1=15 days
4.3 -- --
.80
.148 109.5
.0035
.0064
.0114
.0096
.0074
.0395
.1439
POLLUTANT REMOVALS BY SWEEPING [ KG/HA/YEARl (These data apply to both separa te and combined areas)
( A ) MECHANICAL BROOM SWEEPERS - One Pass
. _ _ _ _ _ _ - _ _ _ _ _ _ _ _ _ _ _ _ - _ _ _ _ _ - - A
Land Use Group 1
days 4.6 days 9.3 days 14.4
----I--- - - _ _ _ - _ - - _ . I - - - - - - -
1=30 1=15 1 =7 --- - - --,
1.22 2.48 3.88 .218 .440 .690
52.2 105.8 165.4 ,0018 ,0036 ,0067 ,0034 .0070 .0119 .0060 .0121 .027 1 ,0051 .0103 .0180 .0039 .0079 .0142 .0210 .0425 .0659 .0765 .1543 .2712
- -_-
1*=30 1x15 1 =30 1=15 1=7 days
17.8 1.78
.346
days days
2.4 4.3 .45 .92 .050 .lo3 ,222
31.8 64.0 100.4 45.4 .0010 .0020 .0031 .002 1 ,0033 .0019 .0038 .0064 .0032 .0066 ,0027 .0056 .0021 .0043 .0113 .0230 .0411 .0840
(B) MECHANICAL BROOM SWEEPERS - Ta
------------------_I----
Land Use Group 2
days 12:t6, i 9 days 38.5
74.5 151.2 236.3 .0019 .0039 .0071 .0038 ,0076 .0133 .0066 .0134 .0299 .0057 .0115 .0199 .0044 .0088 ,0157 .0233 .0470 .0760 .0845 .1709 .2983
------ --__-- 1 =30 1=15 1 =7
--- ---- - - - - --------
1.52 4.84 .944 1.478
--.- Lan --
1=30 days
3.1 .---
.69
.086 4q.4 .0014 .0027 .0046 .0039 .0030 .0161 .0 585
-
1=15 days
6.4 1.40
. .176 89.8 .0025 . 00 54 .0094 .0080 .0061 :0328 .1194
I-.-- - _ _ -
_- - --- -- -
1 =7 1=30 days days
8.3 .86 .185
63.3
1=15 days 16.8
1.75 .376
128.2 ,0030 .0059 .O 103 .0089 .0068 .O 363 .1318 --- --
1 =7 days 26.1
. I I- ---
2.72 .585
200.5 .0048
.0161
.0139 ,0106 .0568 .2062
,0092 .
------I--
(C) VACUUM SWEEPERS - One Pass
I I I I
1=30 days --
.60
.123
3.1
75.9 .0024 .0045 .0080 .0067 .0052 .0277 . lo08 ------
1=15 days
6.4 1.22
--1--_
.251 153.9
.0049
.0091
.0162
.0136
.0105
.0562 .2046 __--I-
----------- Land Use Gro
1=30 1=15
.311
.003 1 .0064
.0176
1=7 d x s
9.9 1.90
- -
.392 240.6
.0077
.0143
.0253
.0212
.0165
.OS79
.3200 ---
Ip3- 1 =7 days 14.4
-
3.38 .986
283.6 .0114 .0204 .0461 .0309 .0242 .1173 .4611
*l=Sweeping Interval - 23 - -1

wide cost range was partly a t t r ibuted to varying labour ra tes and labour utilization [ 71. Equipment costs a r e also known to vary widely, with depreciation and maintenance costs varying considerably between cities. Finally, cit ies typically use different overhead rates and accounting procedures.
obtained from several municipalities and combined with updated da ta from reference The final cost da ta appear in Table 13.
For t h e purpose of this report, approximate cost estimates for s t r e e t sweeping were 121.
TABLE 13 COSTS OF STREET SWEEPING [ $/curb kilometrel
The costs in dollars per curb kilornetre have to be converted into annual costs per hectare, in order to make these costs fully compatible with the pollutant loadings and removals given previously. Towards this end, the total curb kilornetres swept per hectare per year were first determined for various land uses and sweeping intervals. The results a r e given in Table 14.
TABLE 14 KILOM ETRES SWEPT/HECTARE/Y EAR
Finally, t h e annual costs of s t r e e t sweeping per hectare were calculated from Tables 13 and 14 and are given in Table 15. These costs (Table 15) a r e to be used in conjunction with the pollutant removals which were presented in Table 12. 3.2 Second Level Abatement Measures
The second level abatement measures a r e considered here as cornbinations of watershed storage, downstream storage, and t rea tment of runoff by sedimentation. Such measures a r e consistent with those proposed by APWA for control of urban runoff pollution
- 24 -

TABLE 15 ANNUAL COSTS OF SWEEPING [DOUARS/HECTAREl
I I SWEEPING I SWEEPING LAND USE GROUP 1 ' OPERATION INTERVAL Capital
days t- Costs* Capital costs * 8.33 16.65
35.85
16.65 33.31 71.70
12.58 25.15
54.16
_l_l-.l_-
-
O&M costs
7.05 14.08
30.32
14.08 28.17 60.64
8.00 16.01
34.37
---
O&M costs
6.75 13.49
29.08
13.49 26.98 58.17
7.64 15.27
33.01
I
Total costs
15.72 31.43 67.66
31.43 62.86 135.31
21.10 42.20
90.81
--
_I-~---------
Mechanical Sweepers - 1 Pass
Mechanical Sweepers - 2 Passes
Vacuum Sweepers - 1 Pass
I-
LAND USE GROUP 2
30 8.67 15 17.35
7 37.34
30 17.35 15 34.69 7 74.67
30 13.10 15 26.19
7 56.44
--
I
6.18 12.35 26.64
Total costs
15.08 30.14
64.93
30.14 60.29 129.87
--
3.78 7.56
16.23
20.22 40.42
87.17
BOD N P ss I-
Removal R a t e Weight 25% 14.3% 0.8% 31.6% Percent
-- LAND USE GROUP 3
Heavy Metals
31.6%
7.41 14.82 31.93
14.82 29.65 63.85
9.96 19.91
42.87
* Amortized annual cos.ts
TABLE 16 POLLUTANT REMOVALS- SECOND ABATEMENT LEVEL
- 25 -

in Ontario [91 and, consequently, much information from t h e APWA report may be used in this report.
Watershed storage is understood here as runoff storage on such dual purpose sites as parking lots, roof tops, and playgrounds. As t h e retention period of storm runoff in such areas must be rather short, it has been assumed t h a t no t rea tment takes place in these s torage areas. Typically, this type of storage might be used for a maximum of several hours a f t e r t h e end of a storm event. There is a practical limitation to watershed storage - t h e total volume of storage available. This volume is likely to be limited unless it is possible to c r e a t e depressions in which water can be detained. At some point, t h e cost of creating additional watershed storage would become excessive and tha t is the point when conventional s torage ponds would become more economical than watershed storage. Such ponds were considered here also as primary t rea tment devices with average residence t imes in t h e order of a day.
To evaluate t h e effectiveness and costs of t h e f i rs t level abatement measures, d a t a from t h e APWA report [ 9 1 were used. According to this source, it was assumed tha t these abatement measures could be characterized by a 25% control of BQD and the associated minimal costs would vary from $20/hectare/year to $150/hectare/year (an area-weighted mean cost is $64/ha/year). Considering tha t particle removal by sedimentation will be governed by the particle size (for a constant specific gravity), one can use again Table 9 to es t imate pollutant removals which correspond to t h e BOD removal of 25%. The resulting removal rates a r e given in Table 16.
The removal ra tes from Table 16 were applied to t h e annual loadings presented in section 2 to obtain annual pollutant removals which a r e given in Table 17 together with t h e associated costs.
3.3 Third Level Abatement Measures
The third level abatement measures a r e considered here as combinations of watershed storage, downstream storage, and advanced t rea tment of runoff. As in the previous case, t h e main function of watershed storage is to detain runoff and therefot: increase the utilization of t h e downstream storage and t reatment facilities. These types of pollution abatement were studied by APWA, and BOD removal ra tes as well as the associated minimal costs were reported for Ontario [ 9 1.
Removal ra tes for other constituents than BOD had to be estirnated for the third level abatement. Two types of es t imates were produced. Firstly, a constant removal r a t e of 50% was assumed for all t h e constituents. Secondly, removal ra tes were assumed t o be somehow affected by t h e particle sizes with which t h e pollutants tend to be mostly associated. These assumed removal ra tes a r e given in Table 18.
- 26 -

TABLE 17
-- and Use ill
8.4 1.28
.012 123.9
.0043
.0082
.0141
.0120
.0092
.0495
.1805
SECOND ABATEMENT LEVEL - POLLUTANT REMOVALS AND ASSOCIATED COSTS
I
CONSTI- TUENT
BOD N P ss Cd C r c u
Hg N i Pb Zn
Initial Capital costs
[ $/ha1 --- Annual Capital costs
$/ha/yearl
Annual O&M cost
$/ha/year 1
Total Annual costs
$/ha/year 1
ANNUAL POLLUTANT REMOVALS [ KG/HA/YEAR] - SEPARATE SEWERS --
and Use i l 2
22.4
-- -
1.60 .027
177.0 .0046 .0088 .0156 .0134 .0103 .0549 .1992
535.00
,and Use 1.3
8.4 1.12
-
.018 212.4
.0074
.0138
.0244
.0205
.0159
.0849
.3093 -
51.40
--
12.85
64.25
-- COMBINED SEWERS
,and Use ill
33.6 4.50
.082 244.2
.0049
.0088
.0202
.0134
.0106
.0513
.2020
.and Use 112
73.4 5.22
.092 212.4
.0053
.0099
.0223
.0149
.0116
.0567
.2222
,and Use #3
28.0 4.93
.087 233.6
.0085
.0152
.0344
.0230
.0180 ,0875 .3436
1543.00
148.30
37 .OO
185.30
'Weighted-mean cost adopted from t h e APWA report [ 9 I . The annual capital costs a r e amortized.
- 27 -

TABLE 18 THIRD LEVEL ABATEMENT MEASURES - REMOVAL RATES *
C O N S T I T U E N T
BOD
Constant Removal Rates [Weight Percent I Variable Removal Rates [Weight Percent1 50% 60%
--- --- -I__----
Control Measure Seeding Chemical Stabilization iSediment Basins
Finally, t h e removal ra tes from Table 18 were applied to t h e annual pollutant loadings (see section 2) and the resulting annual removals (kg/ha/year) a r e given in Table 19 for both constant and variable removal rates. 3.4 Soil Erosion Control in Urbanizing Catchments
During the development of urban areas, t h e ra tes of soil erosion increase dramatically as a result of construction activities. The removal of natural ground cover allows immediate soil-water contact, thus increasing the sheet erosion. Newly built structures result in a n increased catchment imperviousness and increased rates of transport of eroded soil. Estimates of sediment yield for urban areas undergoing construction range from 1-400 tons/hectare/year [ 1 1 . Sediment yields froin single construction s i tes may vary from 2 to 200 times as much as from naturally vegetated a reas [ 11. Because of these large erosion rates, erosion control measures a r e of ten implemented in urbanizing catchments.
Soil erosion is controlled by various nonstructural and structural measures. The most cost-effective measure appears to be a good project planning in which the exposure of soil without ground cover is limited. On-site methods of erosion control include stabilizing t rea tments and small sediment basins. Among stabilizing treatments, the least expensive alternatives a r e seeding and chemical stabilization (see Table 20).
Small sediment basins a r e designed to serve a reas of 0.8 to 1.2 hectares. The capital and maintenance costs for these basins a r e given in Table 20.
--- 1
C O S T S
Initial Cost/ha Maintenance Costs/ha/year - -
$ 815 $500 $1,186 $500 $ 670 $500
TABLE 20 COSTS OF EROSION CONTROL MEASURES (After Ref. 1)

TABLE 19
EONSTI- WENT
--- BOD N P ss Cd Cr c u
Hg Ni Pb Zn
-- Initial Capital
costs [ $/ha1
Annual Capital
costs [ $/ha/year
-
Annual OdtM costs
$/ha/ year
Total Annual
ANNUAL POLLUTANT REMOVALS [ KG/HECTARE/YEARl ( A ) Constant Removal Rate of 50%
ANNUAL POLLUTANT REMOVALS KC/HA/YEAR
16.8 4.5
.8 196.0
.0067
.0129 ,0224 .O 190 .O 146 .0784 .2856
I
SEPARATE SEWERS - .and Use 8 2
44.8 5.6 1.7
280.0 .0073 .O 140 .0246 .0213 .O 162 .0868 .3153
1400.00
.and Use 8 3
16.8 3.9 1.1
336.0 .O 118 .0218 .0386 .0325 .0252 .1344 .4894
134.40
33.60
I
168.00 costs E $/ha/year 1
---
and Use 8 1
67.2 15.7 5.1
386.0 .0078 .0140 .0319 .0213 .O 168 .0812 .3198
COMBINED SEWERS
Land Use 7'12
146.7 18.3 5.7
336.0 .0084 .0157 .0353 .0235 .0185 .0896 .3517
4937.00
,and Use #3
56.0 17.1 5.4
370.0 .0134 .024 1 .0543 .0364 ,0286 .1383 .5438
~~~
474.40
118.60
593.00 i L
- 29 -

TABLE 19 cont ANNUAL POLLUTANT REMOVALS [ KG/HECTARE/YEARI (8) Variable Removal Rates ( see Table 18)
12.5 3.06
541 .O .0094 .0168 .0383
.0255
.0202
.0974
.3837
-.-
CONSTI- TUENT
BOD N P ss C d C r c u
Hg N i Pb Zn
Initial Capital cost
[$/ha I
Annual Capital costs
[ $/ha/yeai
Annual O&M costs
$/ha/ year
Total Annual costs
$/ha/year
134.40
.
33.60
I___-
168.00
--
.and Use #l
16.8 3.6
0 47 174.0
.0081
.0155
.0269
.228
.O 175
.094 1
.3427
- ~
474.40
. 1_1
118.60
-- I_-
593.00
- - -.
-.
Land Use /I2
44.8 4.5 1.01
390.0
.0087
.0168
.0296
.0255 ,0195 .lo42
.3783
1399.00
3.1 .67
170.0
.0141 ,0262
.0464
.0390
.0302
.1613
.5873
---
COMBINED SEWERS
ANNUAL POLLUTANT REMOVALS KG/ H A/ Y EAR
SEPARATE SEWERS --_-- ,and Use /I2
146.7 14.6
--
3.43
470.0 .0101
.0188
.0423
.0282
.0222
.lo75
.4220
-
Land Use #3 --- 56.0 13.8 3.26
517 .O .0161
.0289
.0652 ,0437 .0343 .I660
.6525
----
4937.00
Note: All the costs a r e from t h e APWA report [9 I . The annual capital costs a r e amortized.
- 30 -

3.5 Discuss ion
Because of t h e limited t ime available for writing this report, it was necessary to rely as much as possible on the relatively scarce da ta which were found in t h e literature. In some cases, t h e published data , particularly t h e costs of abatement measures, could not be verified within the constraints of this study. Consequently, the results presented in this report contain appreciable uncertainties which must be borne in mind when interpreting these results. Detailed comments on t h e accuracy and reliability of results follow.
3.5.1 First level abatement measures
Street sweeping was considered in this report as a f i rs t level abatement measure. I t was assumed tha t the amount of pollutants removed from separate sewer areas would be identical to t h a t removed from combined sewer areas.
Numerous uncertainties were involved in t h e computation of pollutant removals by s t r e e t sweeping. Among the sources of these uncertainties, one could name the efficiency of sweepers, sweeping frequency, and association of pollutants with particles of cer ta in sizes.
The efficiencies of sweepers were adopted from references 17, 121. I t would appear tha t the efficiency of mechanical broom sweepers was fairly well established. Only limited d a t a were available for vacuum sweepers and these d a t a were derived for relatively small sweepers which a r e used on sidewalks [121. I t is conceivable that the efficiency of vacuum sweepers used in s t r e e t cleaning will be somewhat smaller than tha t given in this report. Note tha t according to the da ta from references [ 7, 121, mechanical broom sweepers would have to make up to three passes to achieve t h e same efficiency as vacuum sweepers.
The frequency of s t r e e t sweeping has a pronounced effect on t h e removal of pollutants. In fact, one deals here with a joint probability distribution of the particle removal by ei ther sweeping or rain. The removal ra tes in this report were derived by studying such joint probabilities (reference [41 ) for a rainfall record from Burlington. I t is conceivable t h a t somewhat different distributions and results would be obtained at other locations. The higher the rainfall occurrence frequency, t h e lower t h e probability of particle removal by sweeping.
Since sweepers remove solid particles f rom t h e s t r e e t surf ace rather selectively, depending on t h e particle size, the pollutant removal is also selective because of highly nonuniform association of pollutants with particles of various sizes. To evaluate this selective removal, the da ta on pollutant association with certain particle sizes were
- 31 -

adopted from reference [7 I. No other source of d a t a was available for verification. I t was felt, however, tha t t h e d a t a from reference [ 71 were fairly extensive and reliable.
The costs of s t r e e t sweeping were determined by making several enquiries to local municipalities. These costs a r e known to vary widely, depending on t h e local practices. Therefore, t h e costs presented in this report should be considered as first-cut estimates.
In t h e overall assessment of s t r e e t sweeping, vacuum sweepers appeared to be more effect ive in pollution abatement than mechanical broom sweepers. This higher effective- ness more than outweighs t h e higher costs of vacuum sweepers. To achieve significant pollutant removals, s t r e e t sweeping should be done at least once every two weeks. Even more frequent s t r e e t sweeping could be considered as a higher level abatement measure.
3.5.2 Second level abatement measures
These measures consist of watershed storage, downstream storage, and runoff t rea tment by sedimentation. Both removal ra tes and costs of these measures were adopted from t h e APWA report [ 9 I.
The APWA removal ra tes were supplemented in this report by removal ra tes for additional constituents. A selective removal of pollutants by sedimentation was considered using t h e da ta in Table 9 to describe t h e pollutant association with particles of cer ta in sizes. Consequently, above average removal ra tes were obtained for suspended solids and heavy metals, below average removals were obtained for nitrogen and phosphorus. There a r e no experimental d a t a to verify these assumptions.
The costs of abatement measures were adopted from the APWA report [ 9 ] and represented minimal costs which were derived for optimum combinations of storage and t r e a t m e n t in various cities in Ontario. Limited experience with constructing such facilities prevents any thorough verification by means of actual case histories. I t would appear tha t t h e costs given by APWA and adopted here indeed represent minimal costs which would be quite of ten exceeded.
3.5.3 Third level abatement measures
The third level abatement measures a r e similar to those applied at t h e second level. To achieve a higher pollution abatement, more storage capacity has to be provided and advanced t rea tment has t o be implemented at t h e third level. BOD removal ra tes and costs were adopted from t h e APWA report [ 9 I.
Two kinds of removal ra tes were considered in this report. Firstly, identical removal rates (50%) were considered for all pollutants. Secondly, various removal ra tes were assumed for t h e individual pollutants. These l a t t e r rates were based on an assumption tha t
- 32 -

t h e removal r a t e depends on t h e pollutant association with certain particle sizes, however, not to the extent indicated earlier for sedimentation. Again, no experimental da ta were available to verify these removal rates.
The costs of abatement represent minimal costs which a r e likely to be exceeded under many circumstances.
3.5.4 Soil erosion control
As specified by PLUARC, controls of urban soil erosion were examined only very briefly. Because of lack of Canadian data, all the erosion rates and control costs given in this report were adopted from U.S. sources. Note tha t t h e unit costs given in this report refer to one hectare of the controlled a rea rather than to one hectare of the catchment. Typically, only some parts of the catchment would require t h e implementation of erosion controls.
- 33 -

4. CONCLUSIONS
Annual unit pollutant loads frorn urban runoff were established and recommended for use in the PLUARG model. The recommended loads a r e based on both t h e APWA loads and t h e selected Ontario data. The APWA loads for 130D, Nitrogen, and Phosphorus agreed fairly well with t h e loads derived from the Ontario da ta and formed a basis for the recommended loads. The loads recommended for suspended solids and selected metals were derived from the Ontario field data. As obvious from the range of unit loads reported in t h e l i terature, t h e recommended loads are likely to contain large uncertainties which could b e as high as several hundred percent.
Three levels of abatement of pollution due t o urban runoff were proposed and t h e associated costs determined. The first level is represented by s t r e e t sweeping. In terms of pollutant removal from t h e s t r e e t surface, vacuum sweepers appeared to be considerably more efficient than broom sweepers. However, the efficiency da ta available for vacuum sweepers were rather limited and were obtained foi- small sweeper units. Consequently, all t h e conclusions regarding t h e vacuum sweepers a r e tentative.
Vacuum sweepers employed once every two weeks were found effect ive in removing pollutants from the catchment surface and thus preventing their wash off by runoff. In a reas served by storm sewers, t h e annual pollutant loadings could be reduced, by s t r e e t sweeping once every two weeks, by about 27% at an average cost of about $38/hectare/- year. The same sweeping practices can be applied in t h e areas served by combined sewers. Because of pollutant loadings in the dry weather flow, the relative reduction in the total loading, due to s t r e e t sweeping, will be lower (10%). The costs would remain t h e same.
In t h e second level, abatement schemes cons s t i n g of watershed storage, downstream storage, and runoff t rea tment by sedimentation were considered. Average reductions in pollutant loadings of 20% could be achieved, for bloth storm and combined sewer areas, at the annual costs of $64/hectare/year and $185/hectare/year, respectively. These abatement schemes would be practical only for combined sewer areas, since for storm sewers, be t te r removals and economies were achieved at the first level. Under these circumstances, frequent s t r e e t sweeping could be considered as a second level abatement measure for areas served by storm sewers. Weekly sweeping could reduce the annual pollutant loadings by as much as 40% at a cost of $8l/hectare/year.
- 34 -

The third level abatement measures were proposed as combinations of watershed storage, downstream storage, and advanced treatment of runoff. About one half of annual pollutant loadings from storm and combined sewer areas could be removed at annual costs $168/hectare/year and $593/ hectarelyear, respectively.
- 35-

REFERENCES
1. Brandt, G. H. et a1 (1972). "An Economic Analysis of Erosion and Sediment Control Methods for Watersheds Undergoing Urbanization", Final Report, OW WR Contract No. 14-31-00 1-3392, Dow Chemical Co., Midland, Michigan.
Gore & Storrie, Ltd. (1977). "Hamilton Test Catchment - Progress Report", A draf t report submitted to the Hydraulics Research Division, National Water Research Institute.
2.
3. Hutchison, W. R., A. P. Galati and 2. K. Khan (1978). "Water Plant Waste Discharge in the Province of Ontario", Research Report No. 77, Canada-Ontario Agreement, Ottawa.
Marsalek J. (1977). ttMonthly Pollution Loads in Urban Runoff from t h e Malvern Test Catchment", Unpublished Report, Hydraulics Research Division, Canada Centre for Inland Waters, Burlington, September 1977.
Marsalek, J. (1978). "Overview of Annual Unit Pollutant Loads for Urban Runoff and Combined Sewer Overf lowsft, Technical Note No. 78-02, Hydraulics Research Division, National Water Research Institute, Burlington, January 1978. An addendum to this report was published as T.N. 78-02 (A), May 1978.
6. Marsalek, J. (1978). "Abatement Measures for Pollution due to Urban Runoff", Unpublished Report, Hydraulics Research Division, National Water Research Institute, Burlington, April 1978.
Sartor, J. D. and G. B. Boyd (1972). "Water Pollution Aspects of Street Surface Contaminants, Report EPA-R2-72-081, Environmental Protection Agency, Washington, D. C., November 1972.
Singer, S. N. (1977). "Preliminary Estimates of Urban Storm Water Unit Loadings for t h e Canadian Great Lakes Basin", Technical Memorandum, Water Resources Branch, Ontario Ministry of t h e Environment, Toronto, July 1977.
Sullivan, R. H., W. D. Hurst, T. M. Kipp, J. P. Heaney, W. C. Huber and S . Nix (1978). "Evaluation of t h e Magnitude and Significance of Pollution Loading from Urban Storm Water Runoff - Ontario", Research Report No. 81, Canada-Ontario Agreement, Ottawa, 1978.
4.
5.
7.
8.
9.
- 36 -

10. "Urban Storm Water Management and Technology : An Assessment", Report EPA- 670/2-74-040, Off ice of Research and Development, U. S. Environmental Protection Agency, Cincinnati, Ohio, December 1974.
Waller, D. H. and 2. Novak (1978). "Municipal Pollutant Loadings to t h e Grea t Lakes from Ontar io Communities", A draf t report submitted for publication in the Research Report Series, Canada-Ontario Agreement.
"Water Pollution Aspects of Urban Runofft1, U. S. Department of t h e Interior, Federal Water Pollution Control Administration, Report WP-20-15, January 1969.
1 1.
12.
- 37 -