Embed Size (px)
Citation preview
~
~nta Clara Valley Urban Runoff Pollution Prevention Program
February 3, 2014
Mr. Bruce H. Wolfe Executive Officer San Francisco Bay Regional Water Quality Control Board 1515 Clay Street, Suite 1400 Oakland, CA 94612
Subject: Permit Provision C.10.c: Long-Term Trash Load Reduction and Pilot Trash Assessment Strategy
Dear~~(..t!-This letter and attachment are submitted on behalf of the following Santa Clara Valley Urban Runoff Pollution Prevention Program (SCVURPPP) Permittees:
• City of Campbell • City of Mountain View
• City of Cupertino • City of Palo Alto
• City of Los Altos • City of San Jose
• Town of Los Altos Hills • City of Santa Clara
• Town of Los Gatos • City of Saratoga
• City of Milpitas • City of Sunnyvale
• City of Monte Sereno • County of Santa Clara
To satisfy Permit Provision C.10.c of the Municipal Regional Stormwater NPDES Permit (MRP), Order R220098-0074, NPDES Permit No CAS612008 issued by the San Francisco Bay Regional Water Quality Control Board, each Permittee's Long-Term Trash Load Reduction Plan has been posted a on the Water Board ftp site, as directed by Water Board staff.
Also, attached is the SCVURPPP Pilot Trash Assessment Strategy. This assessment strategy together with the methods described in the Long-Term Plans describes the approach that Permittees will use to assess progress towards trash reduction goals described in the MRP. We have posted the assessment strategy on the Water Board ftp site as well.
Please contact me at 510-832-2852 regarding any additional questions or concerns.
;;;;:o.-----~::::::::s;::----;--Adam W. Olivieri, Dr. P.H., P.E. Program Manager
cc: Dale Bowyer, San Francisco Bay Regional Water Quality Control Board Tom Mumley, San Francisco Bay Regional Water Quality Control Board Management Committee
Pilot Trash Assessment Strategy
Watershed Monitoring and Assessment Program
February 1, 2014
SCVURPPP PILOT TRASH ASSESSMENT STRATEGY 2_1_13.DOCX
Table of Contents
TABLE OF CONTENTS ...................................................................................................................................................... II
LIST OF TABLES ................................................................................................................................................................. II
LIST OF FIGURES ............................................................................................................................................................... II
INTRODUCTION .................................................................................................................................................................... 1
MONITORING QUESTIONS AND GENERAL APPROACH .................................................................................... 1
SPECIFIC APPROACH ....................................................................................................................................................... 2
INDICATORS ................................................................................................................................................................................................... 2 ASSESSMENT UNITS/FRAME ................................................................................................................................................................... 2 SAMPLE SIZE ................................................................................................................................................................................................ 3 FREQUENCY .................................................................................................................................................................................................. 3 METHODS ....................................................................................................................................................................................................... 4
On-land Visual Assessments ........................................................................................................................................................... 4 Full Capture Treatment and Maintenance Verification ...................................................................................................... 5 Control Measure Implementation Tracking and Evaluation ........................................................................................... 5 Receiving Water Condition Assessments ................................................................................................................................. 6
REPORTING METRICS AND OUTPUTS ....................................................................................................................... 6
REDUCTIONS IN TRASH LOADING ......................................................................................................................................................... 6 EFFECTIVE CONTROL MEASURE IMPLEMENTATION ....................................................................................................................... 8 IMPROVEMENTS IN RECEIVING WATER CONDITION ....................................................................................................................... 8
IMPLEMENTATION SCHEDULE ...................................................................................................................................... 9
PILOT (NEAR-TERM) IMPLEMENTATION .............................................................................................................................................. 9 Coordination with BASMAA’s “Tracking California’s Trash” Project ......................................................................... 9
LONG-TERM IMPLEMENTATION (POST-2016) ................................................................................................................................ 10
List of Tables TABLE 1. TRASH CONDITION CATEGORIES USED IN THE DRAFT ON-LAND VISUAL ASSESSMENT PROTOCOL.
TABLE 2. EXAMPLE COMPARISON OF TRASH GENERATION AND LOADING ASSOCIATED WITH LAND AREAS WITHIN
EACH TRASH CONDITION CATEGORY.
TABLE 3. EXAMPLE COMPARISON OF TRASH VOLUMES (GAL) AND PERCENT REDUCTIONS (3-YEAR ROLLING
AVERAGE) OBSERVED AT RECEIVING WATER ASSESSMENT SITES.
TABLE 4. SCVURPPP TRASH ASSESSMENT STRATEGY IMPLEMENTATION SCHEDULE.
List of Figures FIGURE 1. EXAMPLE OUTPUTS DEMONSTRATING CHANGES IN LEVELS OF TRASH AVAILABLE TO MS4S IN 2010
(TRASH GENERATION) AND A SUBSEQUENT YEAR OF INTEREST (YEAR X TRASH LOADING).
FIGURE 2. EXAMPLE OUTPUTS ILLUSTRATING THE VOLUMES OF TRASH REMOVED FROM TRASH HOTSPOTS IN 2010
COMPARED TO SUBSEQUENT YEARS.
List of Appendices
APPENDIX A - DRAFT TRASH ON-LAND VISUAL ASSESSMENT PROTOCOL
APPENDIX B - SCVURPPP HOT SPOT ASSESSMENT GUIDANCE AND FIELD DATA COLLECTION FORM
1 SCVURPPP PILOT TRASH ASSESSMENT STRATEGY 2_1_13.DOCX
Introduction
Trash (i.e., litter, floatables, gross pollutants, or solid waste) is a serious problem for watersheds where it presents an aesthetic nuisance, and a serious threat to aquatic life in creeks and the oceans. Data suggest that plastic trash in particular persists for hundreds of years in the environment and can pose a threat to wildlife through ingestion, entrapment, as well as harboring chemicals potentially harmful to the aquatic environment. Types of trash commonly observed in watersheds and water bodies include food and beverage containers (e.g., plastic bags and bottles) and packaging, cigarette butts, food waste, construction and landscaping materials, furniture, electronics, tires, and hazardous materials (e.g., paint and batteries). In response to concerns about urban trash impacts on receiving water bodies in the San Francisco Bay area, the San Francisco Bay Regional Water Quality Control Board (Water Board) included trash reduction requirements in the Municipal Regional Stormwater NPDES Permit for Phase I communities in the Bay area (Order R2-2009-0074), also known as the Municipal Regional Permit (MRP). These provisions require applicable Bay Area municipalities (Permittees) to reduce trash from their Municipal Separate Storm Sewer Systems (MS4s) by 40 percent before July 1, 2014, 70 percent by 2017, and to a point of “no adverse impacts” to water bodies by 2022. To establish a baseline, each Permittee was also required to develop an estimate of the amount of trash discharged from its stormwater conveyance system circa 2011, and develop and implement a trash load reduction tracking method that will be used to account for trash load reduction actions and to demonstrate progress and attainment of trash load reduction targets. In addition, the Water Board listed 24 tributaries to the Bay as being impaired for trash. Early into the term of the MRP, Permittees decided to work collaboratively through the Bay Area Stormwater Management Agencies Association (BASMAA) to develop trash generation rates and a trash load reduction tracking method that would be used by each Permittee. Although Water Board staff and other stakeholders assisted in developing version 1.0 of the tracking method, the method was rejected by Water Board members who asked for a more outcome-based assessment method to be developed. In response to this request, the Pilot Trash Assessment Strategy (Strategy) described in this report was developed by the Santa Clara Valley Urban Runoff Pollution Prevention Program (SCVURPPP)1 on behalf of the Permittees in the Santa Clara Valley. The Strategy is intended to serve as version 2.0 of the trash tracking method for these Permittees.
Monitoring Questions and General Approach The Strategy will be implemented by SCVURPPP on behalf of and in collaboration with, all Permittees in the Santa Clara Valley subject to requirements of the MRP. The Strategy is intended to comply with provision C.10.aii of the MRP and provide information on magnitude and extent of observable trash reductions associated with MS4s. The Strategy will be implemented at a pilot scale on a countywide basis and includes measurements and observations at multiple scales, including the individual Trash Management Areas (TMAs), City/County jurisdictional areas, and segments of receiving waters. The Strategy is intended to answer the following core management questions over time as trash control measures outlined in Permittee Long-term Trash Management Plans are implemented and refined:
Are the MS4 trash load reduction targets (i.e., 40%, 70%, and No Adverse Impacts) being achieved?
Are there trash problems in receiving waters (e.g., creeks and rivers)?
If trash problems in receiving waters exist, what are the important sources and transport pathways?
1 SCVURPPP Permittees include the Cities of Campbell, Cupertino, Los Altos, Milpitas, Monte Sereno, Mountain View, Palo Alto, San Jose, Santa Clara, Saratoga, and Sunnyvale; the Towns of Los Altos Hills and Los Gatos; Unincorporated Santa Clara County; and the Santa Clara Valley Water District.
2 SCVURPPP PILOT TRASH ASSESSMENT STRATEGY 2_1_13.DOCX
The Strategy is specific to Permittees participating in SCVURPPP and will be implemented in a pilot-scale in the near-term. As trash assessment methods are tested and refined, the Strategy will be adapted into a longer-term approach.
Specific Approach
Indicators
Permittees intend to answer the core management questions above by tracking information and collecting data via a set of key environmental indicators. Environmental indicators are simple measures that communicate what is happening in the environment. Since the levels of trash in management areas can inherently vary both spatially and temporally, indicators provide Permittees a more practical and economical way to track the state of the environment than if each attempted to record every possible variable associated with trash generation, loading and reduction. With regard to municipal stormwater trash management, indicators are intended to detect progress towards trash load reduction targets and solving trash problems in local water bodies. Ideally, indicators should be robust and able to detect progress that is attributable to multiple types of trash control measure implementation scenarios. Assessment results should also provide Permittees with an adequate level of confidence that trash load reductions from MS4s have occurred, while also assessing whether trash problems in receiving waters have been addressed. Indicators must also be cost effective, relatively easy to generate, and understandable to stakeholders. Environmental indicators selected by SCVURPPP Permittees to answer core management questions include:
1. Level of trash observed on-land and available to MS4s (primary indicator) 2. Areas effectively treated by full capture devices (primary indicator) 3. Extent and magnitude of trash control measures implementation (secondary indicator) 4. Levels of trash in receiving waters (secondary indicator)
In selecting the indicators above, SCVURPPP Permittees recognize that no one environmental indicator will provide the information necessary to effectively determine progress made in reducing trash discharged from MS4s and improvements in the level of trash in receiving waters. The ultimate goal of municipal stormwater trash reduction strategies is to reduce the impacts of trash associated with MS4s on receiving waters. Indicators selected to assess progress towards this goal should ideally measure outcomes (e.g., reductions in trash discharged). The primary indicators selected by SCVURPPP are outcome-based and include those that are directly related to MS4 discharges. Secondary indicators are outcome or output-based and are intended to provide additional perspective on and evidence of, successful trash control measure implementation and improvements in receiving water condition with regard to trash. Because trash is transported to receiving waters from pathways other than MS4s, other pathways may confound Permittee ability to observe MS4-associated reductions in creeks and shorelines. Due to this challenge of linking MS4 control measure implementation to receiving water conditions, the receiving water based indicator is currently considered a secondary indicator. Evaluations of data on the amount of trash in receiving waters that are conducted over time through the Strategy will assist the SCVURPPP Permittees in further determinations of the important sources and pathways causing problems in local creeks, rivers and shorelines.
Assessment Units/Frame
SCVURPP Permittees have identified roughly 180 primary Trash Management Areas (TMAs). These primary TMAs are presented in Permittee Long-Term Trash Load Reduction Plans, which also include trash control measure planned for each TMA and associated implementation schedules. For on-land assessments and full capture device tracking, primary TMAs will form the unit of management. This unit
3 SCVURPPP PILOT TRASH ASSESSMENT STRATEGY 2_1_13.DOCX
of management is consistent with the spatial level at which control measures implementation will also be tracked and reported. Information on each primary TMA is included in Appendix A. Over 571,000 acres of jurisdictional land area are covered by Permittee TMAs. Based on the trash generation rate development by BASMAA in 2012 and initial Permittee on-land assessments and observations, 90% (516,000 acres) of Permittee jurisdictional areas generate low levels of trash that are likely not impacting receiving waters. The vast majority of the low trash generating area is open space, forested land and high/moderate income residential areas, which are served by jurisdictional-wide trash control measures. Low trash generating areas (i.e., green areas on trash generation maps) are therefore not the focus of area-specific trash control measures implemented or planned for implementation by Permittees and subsequently are not the focus of trash assessments described in this Strategy. The remaining 55,000 acres of land that Permittees have identified as generating moderate, high or very high levels of trash form the assessment framework within which on-land visual assessments, trash full capture treatment operation and maintenance verification, and control measure implementation and tracking will be conducted to evaluate reductions in trash discharged from MS4s. During the pilot stage of the Strategy (2014-2016) on-land assessment sites will be randomly selected within primary TMAs where new or enhanced control measures have or will be implemented prior to 2017, or where additional information is needed to confirm the level of trash loading or further identify trash sources. Sites will be selected to effectively represent the level of trash available to the MS4 in all or a subarea of the primary TMA. For receiving water assessments, freshwater creeks within the urban portion of each Permittee’s jurisdiction will serve as the assessment frame. Receiving water assessments will be conducted at creek and shoreline hot spot locations identified by Permittees, consistent with MRP requirements.
Sample Size
Permittee primary TMAs range in size from less than an acre to greater than 5,000 acres. Observations of the level of on-land trash available to the MS4 are planned for roughly 200 sites within the primary TMAs. The number of assessment/observation sites within each primary TMA will vary with the size of the primary TMA and the heterogeneity in trash generation and types of sources and pathways within the management area. The number of primary TMAs where on-land observations will be observed during the pilot stage of the Strategy will be dependent upon the schedule for new/enhanced control measure implementation within each primary TMA. For full trash capture devices, the land area effectively treated by a full capture device or group of devices will be delineated and mapped for each primary TMA. Permittees will report on the area effectively treated by full capture devices in each primary TMA. Descriptions of trash control measures implemented in addition to full capture devices will also be reported by Permittees for each primary TMA. For receiving water assessments, Permittees will continue to assess a total of 73 hot spots within Santa Clara Valley creeks and shorelines during annual hot spot cleanups. Assessments will be conducted consistent with NPDES permit requirements. Trash volumes, dominant types, and sources will be tracked and reported for each site.
Frequency
Sampling frequency is a function of data variability, amount of change to detect, and desired time in which to detect the change. These three factors are best evaluated using power analysis at each site for an applicable indicator. In the absence of assessment data needed to develop a power analysis2 for each site or primary TMA, each of the roughly 200 on-land observation sites will be initially assessed four times each year during 2014-14. Permittees will identify the frequencies of assessments for subsequent years
2 A power analysis is a statistical analysis that can be used to calculate the minimum sample size required so that one can be reasonably likely to detect change at a specific level (e.g., change from very high to moderate trash conditions). Power analysis can also be used to calculate the minimum level of change that is likely to be detected in a study using a given sample size.
4 SCVURPPP PILOT TRASH ASSESSMENT STRATEGY 2_1_13.DOCX
based on lessons learned during 2014-15 and levels of temporal variability measured at each site. Assessments will occur during timeframes that adequately depict the levels of trash available to MS4s for transport to receiving waters. Assessment timing will occur in consideration of trash transport mechanisms (e.g., runoff), the extent of antecedent dry weather period prior to the assessment, and the timing of trash control measure implementation (e.g., street sweeping frequency). In addition to on-land observations, Permittees will annually calculate the total land area treated via full capture devices and track the effective implementation of trash control measures. Assessments conducted in receiving water locations will also occur (at a minimum) annually.
Methods
This section briefly summarizes the preliminary assessment methods that the Permittees will implement through the Strategy to generate metrics and outputs described in the next section.
On-land Visual Assessments
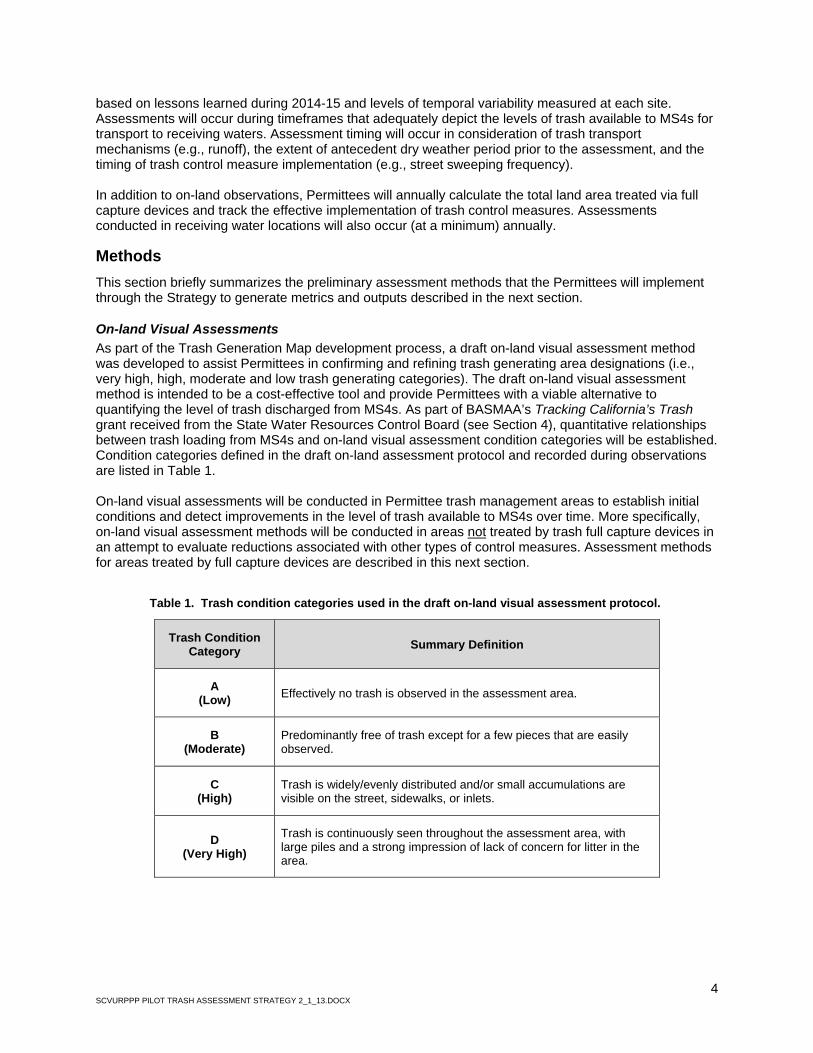
As part of the Trash Generation Map development process, a draft on-land visual assessment method was developed to assist Permittees in confirming and refining trash generating area designations (i.e., very high, high, moderate and low trash generating categories). The draft on-land visual assessment method is intended to be a cost-effective tool and provide Permittees with a viable alternative to quantifying the level of trash discharged from MS4s. As part of BASMAA’s Tracking California’s Trash grant received from the State Water Resources Control Board (see Section 4), quantitative relationships between trash loading from MS4s and on-land visual assessment condition categories will be established. Condition categories defined in the draft on-land assessment protocol and recorded during observations are listed in Table 1. On-land visual assessments will be conducted in Permittee trash management areas to establish initial conditions and detect improvements in the level of trash available to MS4s over time. More specifically, on-land visual assessment methods will be conducted in areas not treated by trash full capture devices in an attempt to evaluate reductions associated with other types of control measures. Assessment methods for areas treated by full capture devices are described in this next section.
Table 1. Trash condition categories used in the draft on-land visual assessment protocol.
Trash Condition Category
Summary Definition
A (Low)
Effectively no trash is observed in the assessment area.
B (Moderate)
Predominantly free of trash except for a few pieces that are easily observed.
C (High)
Trash is widely/evenly distributed and/or small accumulations are visible on the street, sidewalks, or inlets.
D (Very High)
Trash is continuously seen throughout the assessment area, with large piles and a strong impression of lack of concern for litter in the area.
5 SCVURPPP PILOT TRASH ASSESSMENT STRATEGY 2_1_13.DOCX
Full Capture Treatment and Maintenance Verification
Locations of full capture devices and associated treatment areas will be geo-referenced and delineated. Areas treated by each trash full capture device or group of devices will be calculated based on field observations and knowledge of the Permittee’s storm drainage system. Treatment areas will not include areas draining to private storm drain inlets (e.g., parking lots or malls) unless treated by a full capture device. Adequate inspection and maintenance of trash full capture devices is required to maintain full capture designation by the Water Board. SCVURPPP will develop an operation and maintenance verification program (Trash O&M Verification Program) to ensure that Permittee devices are operated at a level necessary to maintain their full capture designation. The Trash O&M Verification Program will likely be modeled on the current O&M verification program for stormwater treatment controls implemented consistent with the MRP new and redevelopment requirements.
Control Measure Implementation Tracking and Evaluation
In addition to on-land trash assessments and full capture operation and maintenance verification, Permittees will also conduct evaluations of trash control measures implemented within their jurisdictional area. Assessment methods will be selected based on trash sources and the type of control measure being implemented. Permittees will implement the following tracking and evaluation methods for trash control measures other than full capture devices:
Product-related Ordinances – Descriptions of outreach efforts, tracking and reporting business compliance rates, or other metrics of control measure performance.
Street Sweeping- Identification sweeping frequency and the ability to sweep to the curb by primary TMA, including any enhancements that have been implemented; and any other metrics demonstrating the enhanced performance of street sweeping.
Public/Private Trash Container Management - Descriptions of control measures implemented to prevent overflowing trash containers or promoting the more effective use of public/private bins, including any new or enhancements to existing actions; and any other metrics demonstrating the performance of the control measure.
Public Outreach and Education – Descriptions of outreach and education actions specific to trash deduction, including the number of events conducted within the municipality; descriptions of effectiveness measurements, including the results of pre- and post-implementation surveys or other metrics.
On-land Cleanups and Enforcement – Descriptions of on-land cleanup actions, including any enhancements that have been implemented; identification of whether on-land cleanup are Permittee or volunteer–led; or other metrics of control measure performance.
Storm Drain Inlet Maintenance – Descriptions of the level of maintenance, including any enhancement to maintenance frequency; the numbers of inlets where enhanced maintenance is being implemented; and any other metrics demonstrating the performance of inlet maintenance.
Anti-littering and Illegal Dumping Prevention/Enforcement - Descriptions of control measures implemented to prevent littering and illegal dumping, including any new or enhancements to existing actions; descriptions and results of enhanced enforcement actions; and any other metrics demonstrating the performance of the control measure.
Prevention of Uncovered Loads - Descriptions of control measures implemented to prevent trash dispersion from uncovered loads, including any new or enhancements to existing actions; descriptions and results of enhanced enforcement actions; and any other metrics demonstrating the performance of the control measure.
6 SCVURPPP PILOT TRASH ASSESSMENT STRATEGY 2_1_13.DOCX
Partial Capture Devices – Descriptions, numbers and types of devices implemented; maintenance frequencies by device or groups of devices; and any other metrics demonstrating the partial capture device performance.
Other Control Measures - Descriptions of control measures implemented to prevent or intercept trash before discharge to receiving waters, and any other metrics demonstrating the performance of the control measure.
Receiving Water Condition Assessments
The ultimate goal of stormwater trash management in the Bay Area is to significantly reduce the amount of trash found in receiving waters to a level where no adverse impacts are occurring. In the last decade, Permittees and volunteers have collected data on the amounts of trash removed during cleanup events in local creeks, rivers and shorelines. More recently, Permittees have conducted trash assessments in receiving waters (i.e., at creek and shoreline hotspots) using standardized assessment methods developed by SCVURPPP. In an effort to answer the core management question Are there trash problems in receiving waters?, Permittees will continue to conduct annual receiving water condition assessments using the SCVURPPP trash hot spot assessment guidance and tracking form (Appendix C).
Reporting Metrics and Outputs Permittees will use simple and transparent metrics to effectively demonstrate progress towards trash load reduction targets. The following section describes potential metrics and outputs (products) that will be used by SCVURPPP Permittees. The proposed metrics are specific to core management questions and are intended to provide stakeholders and Permittees with meaningful and easily understandable measurements of progress toward trash reduction targets.
Reductions in Trash Loading
The primary goal of Permittee trash reduction is to achieve “no adverse impacts” from trash in receiving waters attributable to discharges from MS4s. The level of trash generation3 within a Permittee’s jurisdictional boundary and each primary TMA is depicted on trash generation maps developed by Permittees, and serves as the baseline level of trash against which trash reduction will be measured. Trash levels within specific areas are symbolized on trash generation maps using four trash condition categories, each with their distinct color: low (green), moderate (yellow), high (red), and very high (purple). The level of trash generated from areas identified as low (green) trash generation is assumed to be meet the “no adverse impacts” goal described in the NPDES permit. As on-land visual assessments are conducted during the Strategy, trash generation maps will be transformed into trash loading maps4 based on the extent of trash full capture treatment and changes in the levels of trash observed (on-land) in areas where trash control measures other than full capture devices are implemented. Metrics derived from current trash loading maps (e.g., acreage treated via full capture) and associated outputs (e.g., pie charts) will provide the information needed to assess progress towards trash reduction targets. Metrics and outputs for both full capture treatment areas and on-land visual assessments are more fully described and illustrated below.
Trash Full Capture Devices – Permittees will map all areas treated by full capture devices. Areas treated by devices that are properly maintained and tracked consistent with the Operation and
3 The term “trash generation” refers to the rate at which trash is produced or generated onto the surface of the watershed and is potentially available for transport via MS4s to receiving waters. Generation rates do not explicitly take into account control measures implemented circa 2009 that intercept trash prior to transport (e.g., street sweeping). Generation rates are expressed as trash volume/acre/year and were established via the BASMAA Generation Rates Project. 4 In contrast to trash generation, the term “trash loading” refers to the rate at which trash from MS4s enters receiving waters. Trash loading rates are also expressed as trash volume/acre/year and are equal to or less than trash generation rates because they account for the effects of control measures that intercept trash generated in an area before it is discharged to a receiving water. Trash loading rates are specific to particular areas because they are dependent upon the effectiveness of control measures implemented within that area.
7 SCVURPPP PILOT TRASH ASSESSMENT STRATEGY 2_1_13.DOCX
Maintenance Verification Program will be assumed to remove trash to a level of “no adverse impact” and thus will be illustrated as low (green) on trash loading maps. Commensurate trash load reductions for those TMAs (or portions of TMAs) treated by full capture devices will be estimated.
Other Control Measure Types – For areas where trash control measures other than full capture devices are implemented, Permittees will illustrate the current trash condition categories on trash loading maps based on on-land observations using the visual assessment protocol. Commensurate trash load reductions for those TMAs (or portions of TMAs) where changes in conditions categories are observed will be estimated.
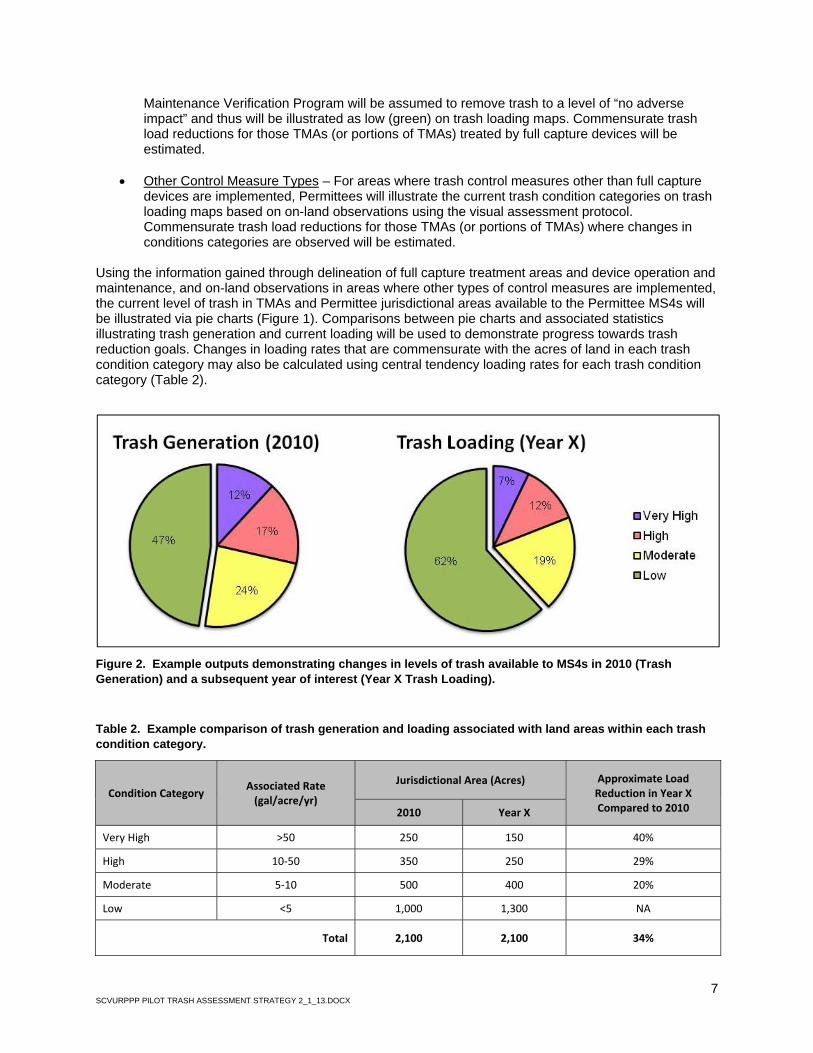
Using the information gained through delineation of full capture treatment areas and device operation and maintenance, and on-land observations in areas where other types of control measures are implemented, the current level of trash in TMAs and Permittee jurisdictional areas available to the Permittee MS4s will be illustrated via pie charts (Figure 1). Comparisons between pie charts and associated statistics illustrating trash generation and current loading will be used to demonstrate progress towards trash reduction goals. Changes in loading rates that are commensurate with the acres of land in each trash condition category may also be calculated using central tendency loading rates for each trash condition category (Table 2).
Figure 2. Example outputs demonstrating changes in levels of trash available to MS4s in 2010 (Trash Generation) and a subsequent year of interest (Year X Trash Loading).
Table 2. Example comparison of trash generation and loading associated with land areas within each trash condition category.
Condition Category Associated Rate (gal/acre/yr)
Jurisdictional Area (Acres) Approximate Load Reduction in Year X Compared to 2010 2010 Year X
Very High >50 250 150 40%
High 10‐50 350 250 29%
Moderate 5‐10 500 400 20%
Low <5 1,000 1,300 NA
Total 2,100 2,100 34%
8 SCVURPPP PILOT TRASH ASSESSMENT STRATEGY 2_1_13.DOCX
Effective Control Measure Implementation
The effective implementation of trash control measures will be tracked and reported by primary TMA in Permittee annual compliance reports. Formats used by Permittees for reporting control measure descriptions and effectiveness metrics will be developed each year in collaboration with Water Board staff and consistent with NPDES permit requirements. Reporting metrics and outputs will include descriptions and numbers of control measures implemented pre-2009 and new/enhanced actions, and the results of surveys, enforcement actions, and other effectiveness evaluations.
Improvements in Receiving Water Condition
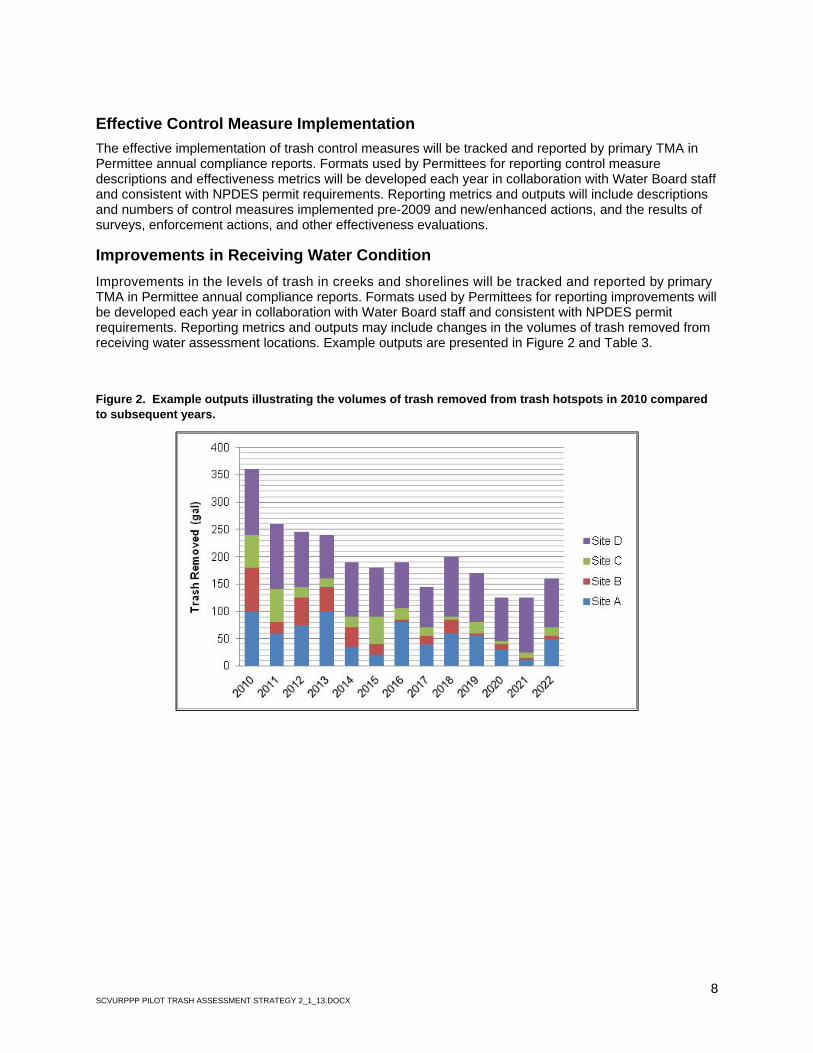
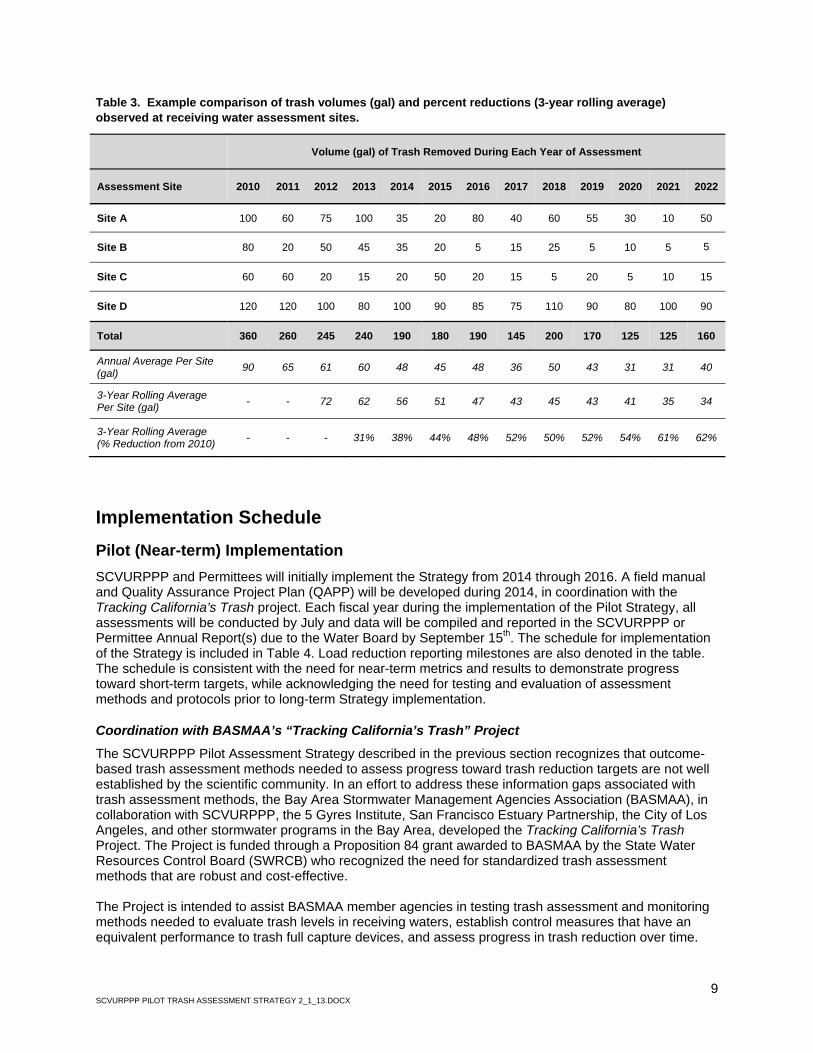
Improvements in the levels of trash in creeks and shorelines will be tracked and reported by primary TMA in Permittee annual compliance reports. Formats used by Permittees for reporting improvements will be developed each year in collaboration with Water Board staff and consistent with NPDES permit requirements. Reporting metrics and outputs may include changes in the volumes of trash removed from receiving water assessment locations. Example outputs are presented in Figure 2 and Table 3. Figure 2. Example outputs illustrating the volumes of trash removed from trash hotspots in 2010 compared to subsequent years.
9 SCVURPPP PILOT TRASH ASSESSMENT STRATEGY 2_1_13.DOCX
Table 3. Example comparison of trash volumes (gal) and percent reductions (3-year rolling average) observed at receiving water assessment sites.
Volume (gal) of Trash Removed During Each Year of Assessment
Assessment Site 2010 2011 2012 2013 2014 2015 2016 2017 2018 2019 2020 2021 2022
Site A 100 60 75 100 35 20 80 40 60 55 30 10 50
Site B 80 20 50 45 35 20 5 15 25 5 10 5 5
Site C 60 60 20 15 20 50 20 15 5 20 5 10 15
Site D 120 120 100 80 100 90 85 75 110 90 80 100 90
Total 360 260 245 240 190 180 190 145 200 170 125 125 160
Annual Average Per Site (gal)
90 65 61 60 48 45 48 36 50 43 31 31 40
3-Year Rolling Average Per Site (gal)
- - 72 62 56 51 47 43 45 43 41 35 34
3-Year Rolling Average (% Reduction from 2010)
- - - 31% 38% 44% 48% 52% 50% 52% 54% 61% 62%
Implementation Schedule
Pilot (Near-term) Implementation
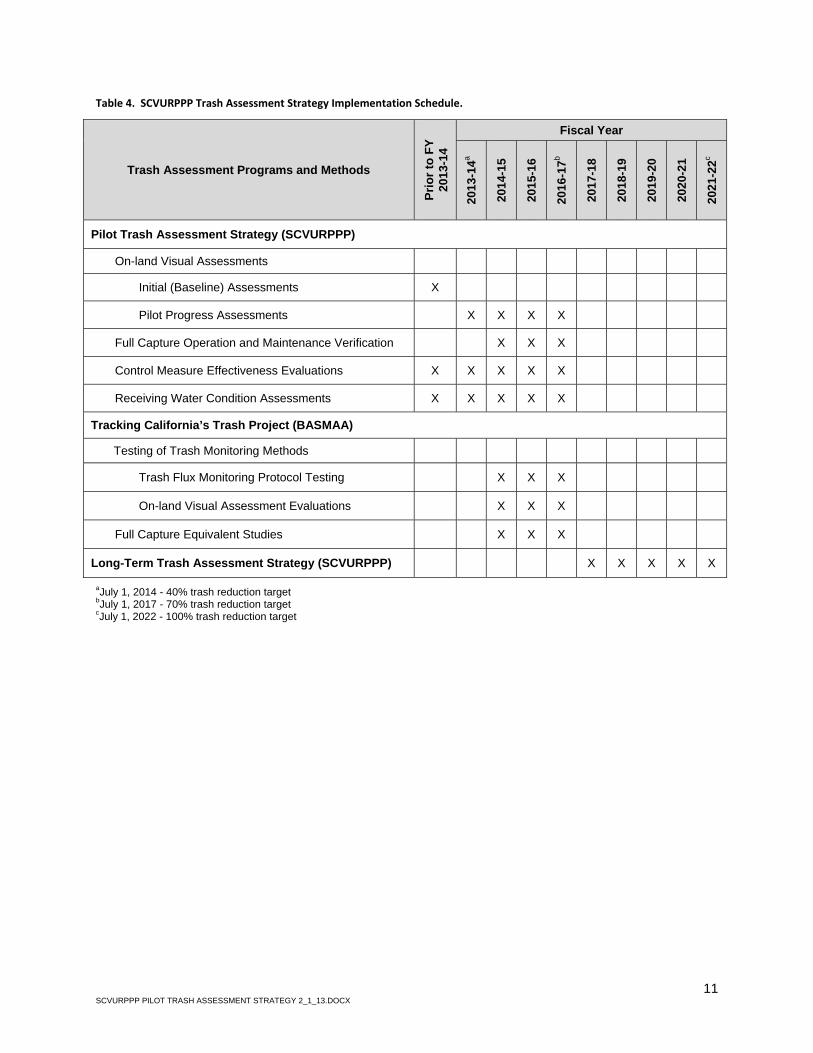
SCVURPPP and Permittees will initially implement the Strategy from 2014 through 2016. A field manual and Quality Assurance Project Plan (QAPP) will be developed during 2014, in coordination with the Tracking California’s Trash project. Each fiscal year during the implementation of the Pilot Strategy, all assessments will be conducted by July and data will be compiled and reported in the SCVURPPP or Permittee Annual Report(s) due to the Water Board by September 15th. The schedule for implementation of the Strategy is included in Table 4. Load reduction reporting milestones are also denoted in the table. The schedule is consistent with the need for near-term metrics and results to demonstrate progress toward short-term targets, while acknowledging the need for testing and evaluation of assessment methods and protocols prior to long-term Strategy implementation.
Coordination with BASMAA’s “Tracking California’s Trash” Project
The SCVURPPP Pilot Assessment Strategy described in the previous section recognizes that outcome-based trash assessment methods needed to assess progress toward trash reduction targets are not well established by the scientific community. In an effort to address these information gaps associated with trash assessment methods, the Bay Area Stormwater Management Agencies Association (BASMAA), in collaboration with SCVURPPP, the 5 Gyres Institute, San Francisco Estuary Partnership, the City of Los Angeles, and other stormwater programs in the Bay Area, developed the Tracking California’s Trash Project. The Project is funded through a Proposition 84 grant awarded to BASMAA by the State Water Resources Control Board (SWRCB) who recognized the need for standardized trash assessment methods that are robust and cost-effective. The Project is intended to assist BASMAA member agencies in testing trash assessment and monitoring methods needed to evaluate trash levels in receiving waters, establish control measures that have an equivalent performance to trash full capture devices, and assess progress in trash reduction over time.
10 SCVURPPP PILOT TRASH ASSESSMENT STRATEGY 2_1_13.DOCX
The following sections provide brief descriptions of tasks that BASMAA will conduct via the three-year Project. Full descriptions of project scopes, deliverables, and outcomes will be developed as part of the task-specific Sampling and Analysis Plans required by the SWRCB during the beginning of the Project. The Project is currently underway and will continue through 2016. BASMAA and the 5 Gyres Institute will evaluate the following two types of assessment methods as part of the Project:
Trash Flux Monitoring – Trash flux monitoring is intended to quantify the amount of trash flowing in receiving waters under varying hydrological conditions. Flux monitoring will be tested in up to four receiving water bodies in San Francisco Bay and/or the Los Angeles areas. Methods selected for evaluation and monitoring will be based on a literature review conducted during this task and through input from technical advisors and stakeholders. Monitoring is scheduled to begin in 2014 and will be completed in 2016.
On-land Visual Assessments – As part of the Project, BASMAA will also conduct an evaluation of on-land visual assessment methods that are included in the SCVURPPP Pilot Assessment Strategy. The methods are designed to determine the level of trash on streets and public right-of-ways that may be transported to receiving waters via MS4s. BASMAA plans to conduct field work associated with the evaluation of on-land visual assessment at a number of sites throughout the region. To the extent practical, sites where the on-land methods evaluations take place will be coordinated with trash flux monitoring in receiving waters. On-land assessments will occur in areas that drain to trash full capture devices, and all sites will be assessed during wet and dry weather seasons in order to evaluate on-land methods during varying hydrologic conditions. Monitoring is scheduled to begin in 2014 and will be completed in 2016.
Control Measure Performance Evaluations - Through the implementation of BASMAA’s Tracking California’s Trash grant-funded project, a small set of focused studies will also be conducted in an attempt to test the performance of specific combinations of trash control measures. Initial BMP combinations include high-frequency street sweeping, and enhanced street sweeping with auto-retractable curb inlet screens. Other combinations will also be considered. Studies are scheduled to begin in 2014 and will be completed in 2016.
Long-Term Implementation (Post-2016)
SCVURPPP Permittees are committed to implementing standardized assessment methods based on the lessons learned from pilot assessments and studies that will occur between 2014 and 2016. Assessment activities described in the previous sections will evaluate the utility of different assessment methods to demonstrate progress towards trash reduction targets and provide recommended approaches for long-term implementation. Lessons learned will be submitted to the Water Board with the FY 2015-2016 Annual Report and a revised Strategy will be developed and submitted, if necessary. The revised Strategy will include agreed upon assessment methods that will be used to demonstrate progress during the remaining term of trash reduction requirements. Reporting using the new/revised methods will begin with the FY 2016-17 Annual Report.
11 SCVURPPP PILOT TRASH ASSESSMENT STRATEGY 2_1_13.DOCX
Table 4. SCVURPPP Trash Assessment Strategy Implementation Schedule.
Trash Assessment Programs and Methods
Pri
or
to F
Y
201
3-14
Fiscal Year
201
3-14
a
201
4-15
201
5-16
201
6-17
b
201
7-18
201
8-19
201
9-20
202
0-21
202
1-22
c
Pilot Trash Assessment Strategy (SCVURPPP)
On-land Visual Assessments
Initial (Baseline) Assessments X
Pilot Progress Assessments X X X X
Full Capture Operation and Maintenance Verification X X X
Control Measure Effectiveness Evaluations X X X X X
Receiving Water Condition Assessments X X X X X
Tracking California’s Trash Project (BASMAA)
Testing of Trash Monitoring Methods
Trash Flux Monitoring Protocol Testing X X X
On-land Visual Assessment Evaluations X X X
Full Capture Equivalent Studies X X X
Long-Term Trash Assessment Strategy (SCVURPPP) X X X X X
aJuly 1, 2014 - 40% trash reduction target bJuly 1, 2017 - 70% trash reduction target cJuly 1, 2022 - 100% trash reduction target
Appendix A
Draft Trash On-land Visual Assessment Protocol
Visual On‐land Trash Assessment Protocol for Stormwater
Version 1.0
DRAFT
Prepared for:
Santa Clara Valley Urban Runoff Pollution Prevention Program
Alameda Countywide Clean Water Program
Contra Costa Clean Water Program
San Mateo Countywide Water Pollution Prevention Program
Fairfield‐Suisun Urban Runoff Management Program
Vallejo Sanitation and Flood Control District
Prepared by:
EOA, Inc. 1410 Jackson St. Oakland, CA 94612
April 30, 2013

Page Intentional Left Blank
Visual On‐land Trash Assessment Methodology –Draft
1
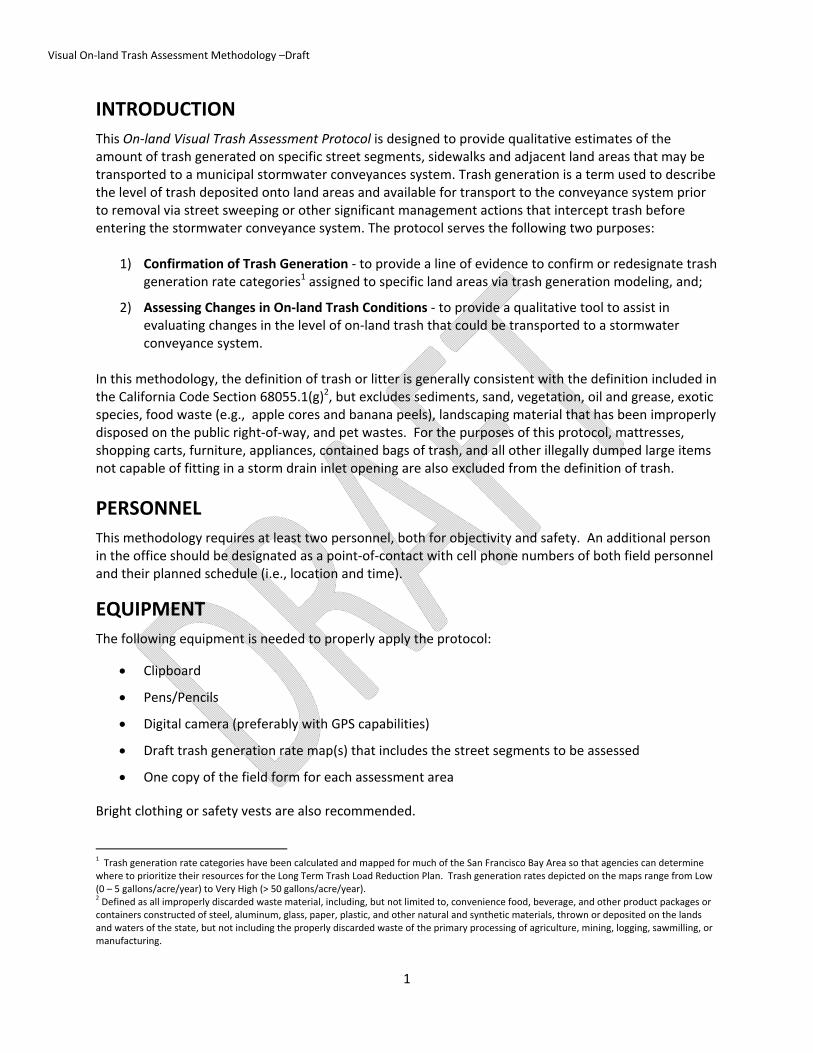
INTRODUCTION
This On‐land Visual Trash Assessment Protocol is designed to provide qualitative estimates of the amount of trash generated on specific street segments, sidewalks and adjacent land areas that may be transported to a municipal stormwater conveyances system. Trash generation is a term used to describe the level of trash deposited onto land areas and available for transport to the conveyance system prior to removal via street sweeping or other significant management actions that intercept trash before entering the stormwater conveyance system. The protocol serves the following two purposes:
1) Confirmation of Trash Generation ‐ to provide a line of evidence to confirm or redesignate trash generation rate categories1 assigned to specific land areas via trash generation modeling, and;
2) Assessing Changes in On‐land Trash Conditions ‐ to provide a qualitative tool to assist in evaluating changes in the level of on‐land trash that could be transported to a stormwater conveyance system.
In this methodology, the definition of trash or litter is generally consistent with the definition included in the California Code Section 68055.1(g)2, but excludes sediments, sand, vegetation, oil and grease, exotic species, food waste (e.g., apple cores and banana peels), landscaping material that has been improperly disposed on the public right‐of‐way, and pet wastes. For the purposes of this protocol, mattresses, shopping carts, furniture, appliances, contained bags of trash, and all other illegally dumped large items not capable of fitting in a storm drain inlet opening are also excluded from the definition of trash.
PERSONNEL
This methodology requires at least two personnel, both for objectivity and safety. An additional person in the office should be designated as a point‐of‐contact with cell phone numbers of both field personnel and their planned schedule (i.e., location and time).
EQUIPMENT
The following equipment is needed to properly apply the protocol:
Clipboard
Pens/Pencils
Digital camera (preferably with GPS capabilities)
Draft trash generation rate map(s) that includes the street segments to be assessed
One copy of the field form for each assessment area
Bright clothing or safety vests are also recommended.
1 Trash generation rate categories have been calculated and mapped for much of the San Francisco Bay Area so that agencies can determine where to prioritize their resources for the Long Term Trash Load Reduction Plan. Trash generation rates depicted on the maps range from Low (0 – 5 gallons/acre/year) to Very High (> 50 gallons/acre/year). 2 Defined as all improperly discarded waste material, including, but not limited to, convenience food, beverage, and other product packages or containers constructed of steel, aluminum, glass, paper, plastic, and other natural and synthetic materials, thrown or deposited on the lands and waters of the state, but not including the properly discarded waste of the primary processing of agriculture, mining, logging, sawmilling, or manufacturing.
Visual On‐land Trash Assessment Methodology –Draft
2
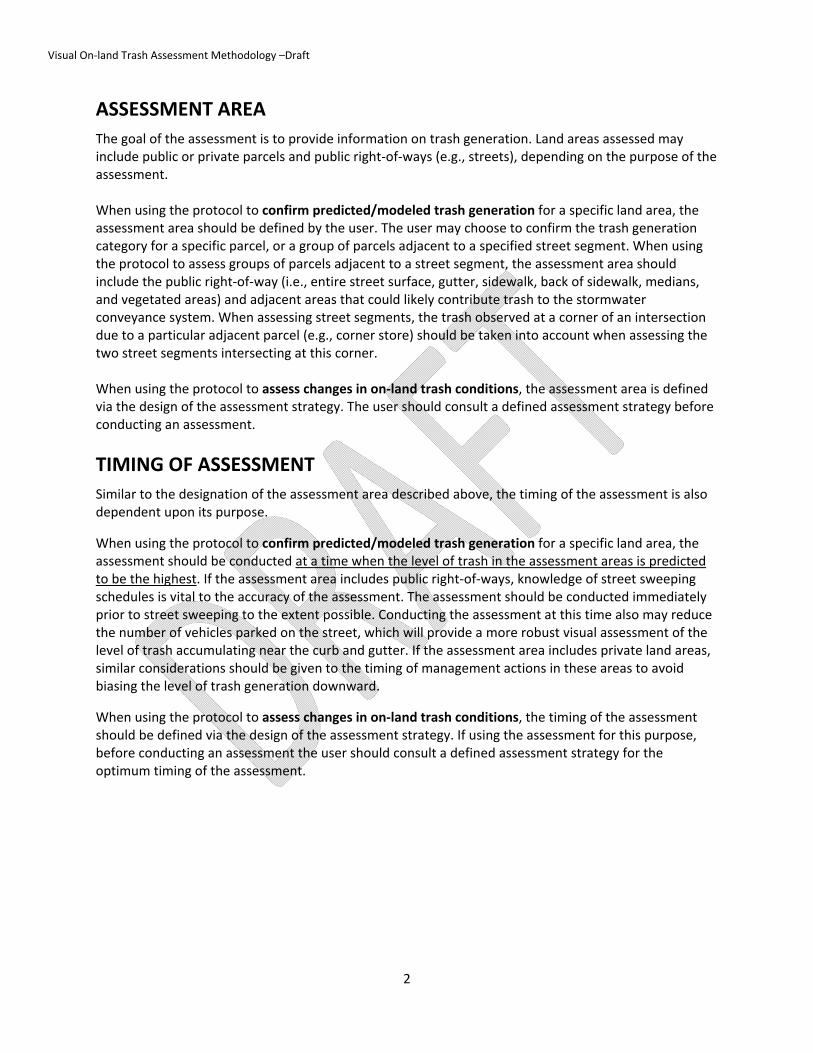
ASSESSMENT AREA
The goal of the assessment is to provide information on trash generation. Land areas assessed may include public or private parcels and public right‐of‐ways (e.g., streets), depending on the purpose of the assessment. When using the protocol to confirm predicted/modeled trash generation for a specific land area, the assessment area should be defined by the user. The user may choose to confirm the trash generation category for a specific parcel, or a group of parcels adjacent to a specified street segment. When using the protocol to assess groups of parcels adjacent to a street segment, the assessment area should include the public right‐of‐way (i.e., entire street surface, gutter, sidewalk, back of sidewalk, medians, and vegetated areas) and adjacent areas that could likely contribute trash to the stormwater conveyance system. When assessing street segments, the trash observed at a corner of an intersection due to a particular adjacent parcel (e.g., corner store) should be taken into account when assessing the two street segments intersecting at this corner. When using the protocol to assess changes in on‐land trash conditions, the assessment area is defined via the design of the assessment strategy. The user should consult a defined assessment strategy before conducting an assessment.
TIMING OF ASSESSMENT
Similar to the designation of the assessment area described above, the timing of the assessment is also dependent upon its purpose.
When using the protocol to confirm predicted/modeled trash generation for a specific land area, the assessment should be conducted at a time when the level of trash in the assessment areas is predicted to be the highest. If the assessment area includes public right‐of‐ways, knowledge of street sweeping schedules is vital to the accuracy of the assessment. The assessment should be conducted immediately prior to street sweeping to the extent possible. Conducting the assessment at this time also may reduce the number of vehicles parked on the street, which will provide a more robust visual assessment of the level of trash accumulating near the curb and gutter. If the assessment area includes private land areas, similar considerations should be given to the timing of management actions in these areas to avoid biasing the level of trash generation downward.
When using the protocol to assess changes in on‐land trash conditions, the timing of the assessment should be defined via the design of the assessment strategy. If using the assessment for this purpose, before conducting an assessment the user should consult a defined assessment strategy for the optimum timing of the assessment.
Visual On‐land Trash Assessment Methodology –Draft
3
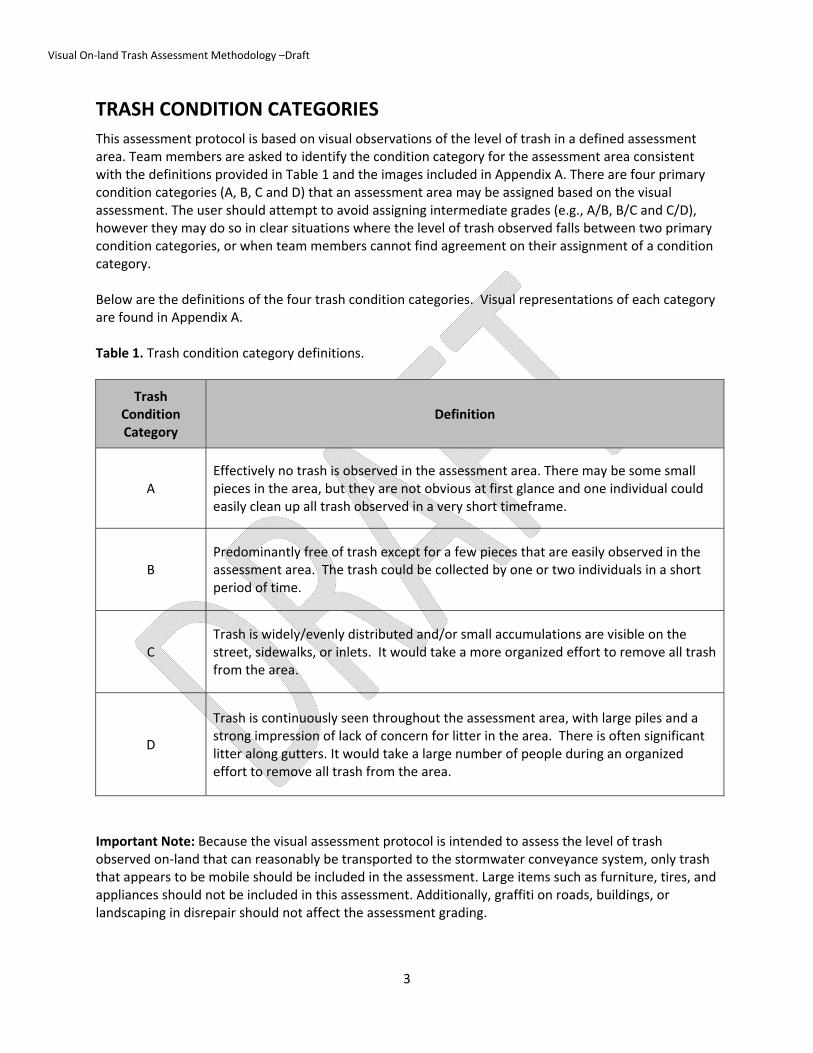
TRASH CONDITION CATEGORIES
This assessment protocol is based on visual observations of the level of trash in a defined assessment area. Team members are asked to identify the condition category for the assessment area consistent with the definitions provided in Table 1 and the images included in Appendix A. There are four primary condition categories (A, B, C and D) that an assessment area may be assigned based on the visual assessment. The user should attempt to avoid assigning intermediate grades (e.g., A/B, B/C and C/D), however they may do so in clear situations where the level of trash observed falls between two primary condition categories, or when team members cannot find agreement on their assignment of a condition category. Below are the definitions of the four trash condition categories. Visual representations of each category are found in Appendix A. Table 1. Trash condition category definitions.
Trash Condition Category
Definition
A Effectively no trash is observed in the assessment area. There may be some small pieces in the area, but they are not obvious at first glance and one individual could easily clean up all trash observed in a very short timeframe.
B Predominantly free of trash except for a few pieces that are easily observed in the assessment area. The trash could be collected by one or two individuals in a short period of time.
C Trash is widely/evenly distributed and/or small accumulations are visible on the street, sidewalks, or inlets. It would take a more organized effort to remove all trash from the area.
D
Trash is continuously seen throughout the assessment area, with large piles and a strong impression of lack of concern for litter in the area. There is often significant litter along gutters. It would take a large number of people during an organized effort to remove all trash from the area.
Important Note: Because the visual assessment protocol is intended to assess the level of trash observed on‐land that can reasonably be transported to the stormwater conveyance system, only trash that appears to be mobile should be included in the assessment. Large items such as furniture, tires, and appliances should not be included in this assessment. Additionally, graffiti on roads, buildings, or landscaping in disrepair should not affect the assessment grading.
Visual On‐land Trash Assessment Methodology –Draft
4
ASSESSMENT PROTOCOL
The following on‐land visual assessment protocol should be used when a user is attempting to Confirm Trash Generation of a specific assessment area. When assessing changes in on‐land trash conditions overtime, the steps described below may be modified to be consistent with a defined assessment strategy. The protocol should take no more than 10‐15 minutes per typical assessment area, including discussions among team members and completion of the field form.
The protocol consists of the following steps that should be conducted in sequential order:
1. Review trash condition category definitions presented in Table 1 and examples in Appendix A.
2. Assemble equipment needed to conduct the assessment.
3. Define the assessment area and delineate on assembled maps. Include both streets and adjacent parcels in assessment areas.
4. After arriving at the assessment area, team members should safely walk at a normal pace on the sidewalk or safe portion of the assessment area and carefully look for trash deposited. Team members should identify levels of trash in all portions of the public right‐of‐way, including but not limited to, the median, street, gutter, curb, sidewalk, back of sidewalk, vegetated areas. To the extent practical, team members should also identify the level of trash in land areas adjacent to the street that appear to be directly connected to the stormwater drainage system via a storm drain on the adjacent, or contribute trash to the storm drain in the public right‐of‐way.
5. Based on the observations made during the assessment it is plausible that the assessment area may need to be redefined once the assessment is completed. Team members may choose to expand or reduce the assessment area if they find that levels of trash in specific portions (e.g. parcels or street segments) of the assessment area are dissimilar from other portions. If this is the case, team members should define the assessment area on their maps, before completing the field assessment form or assigning a trash condition score.
6. Complete section I (Assessment Area) of the field assessment form.
7. Based on the observations in the assessment area, each team member should assign the area a primary condition category (A, B, C, or D) based on the definitions in Table 1 and comparing the assessment area to the images in Appendix A. Team members should then discuss and collectively agree on the appropriate condition category to assign the area. If agreement cannot be reached among team members, they may choose the appropriate secondary category (A/B, B/C, or C/D) based on their assessment results.
8. If an assessment area receives an “A” grade by team, safely look in and/or around the storm drain inlet(s) draining the assessment areas to confirm that no or very little trash is in or around the storm drain inlet. If little to no litter is present in the storm drain inlet(s), then continue to assign an “A” grade to the assessment area. If the amount of trash in the storm drain inlet(s) is inconsistent with the “A” assignment, reassign the assessment area a condition category that is more consistent with a different condition category.
9. Complete the remaining sections of the field form for the assessment area.
10. Take at least one photo of each assessment area. The photos should represent the level of trash identified in assessment area (similar to the photos in Appendix A).
APPENDIX A
EXAMPLES OF TRASH CONDITION CATEGORIES
Page Intentional Left Blank
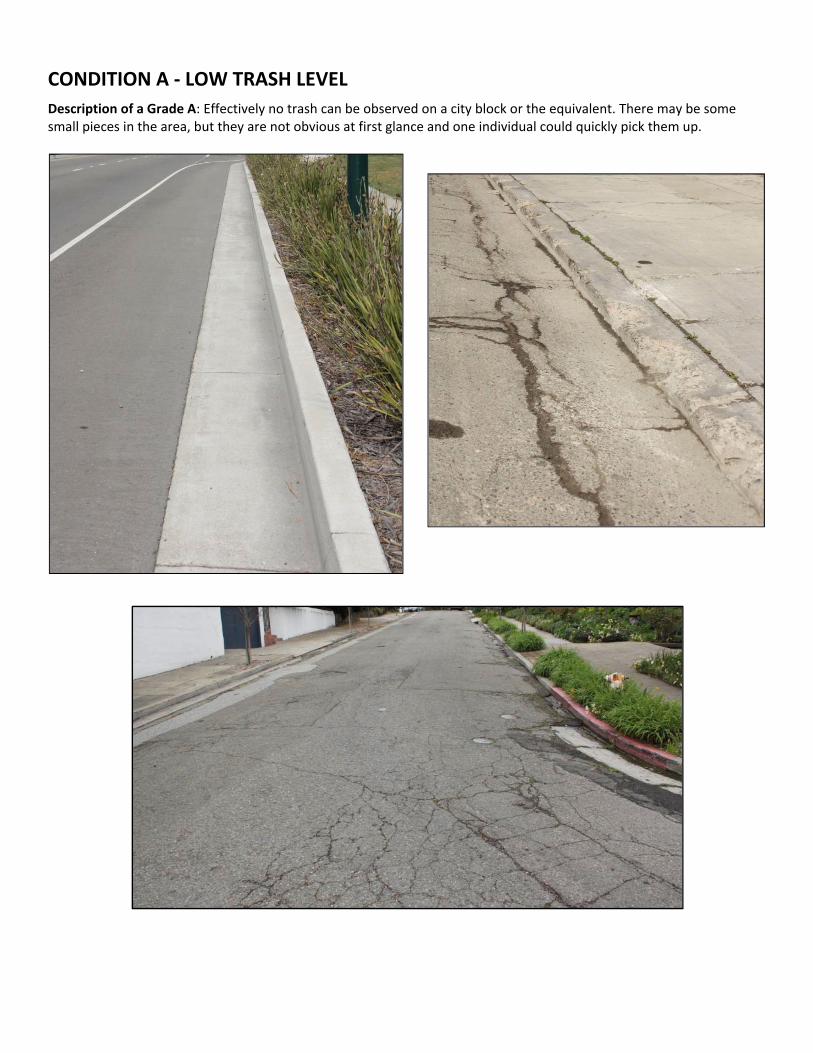
CONDITION A ‐ LOW TRASH LEVEL
Description of a Grade A: Effectively no trash can be observed on a city block or the equivalent. There may be some small pieces in the area, but they are not obvious at first glance and one individual could quickly pick them up.
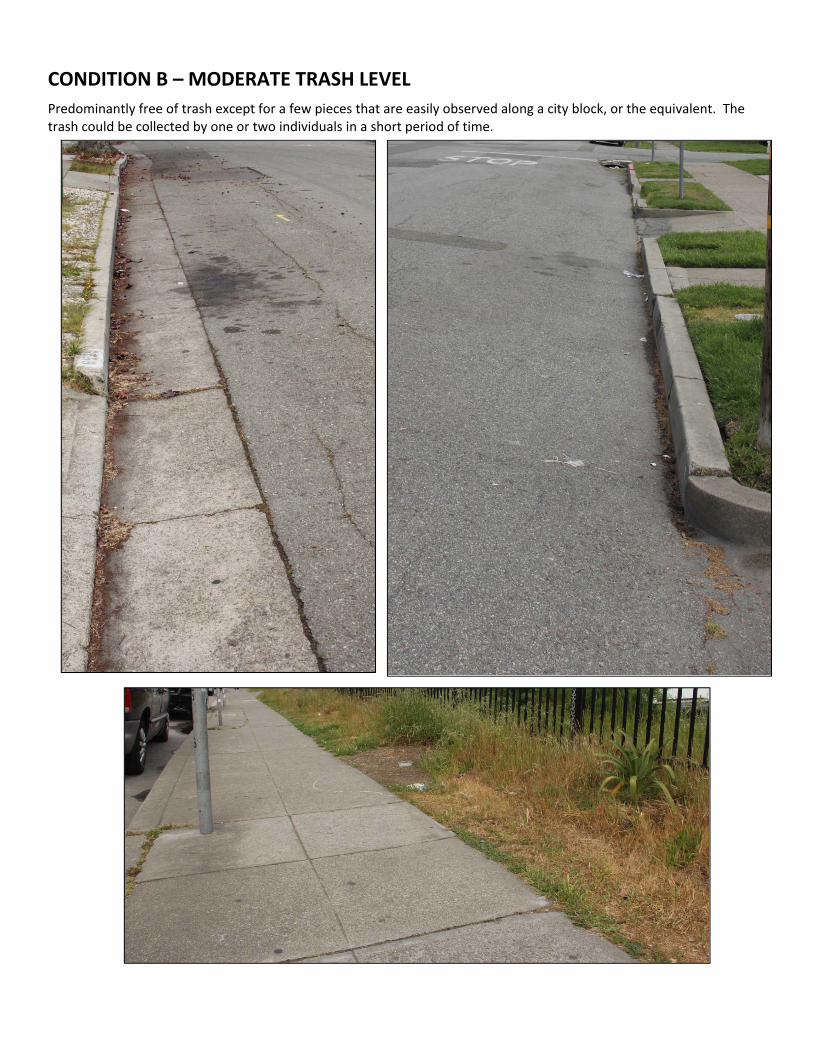
CONDITION B – MODERATE TRASH LEVEL
Predominantly free of trash except for a few pieces that are easily observed along a city block, or the equivalent. The trash could be collected by one or two individuals in a short period of time.
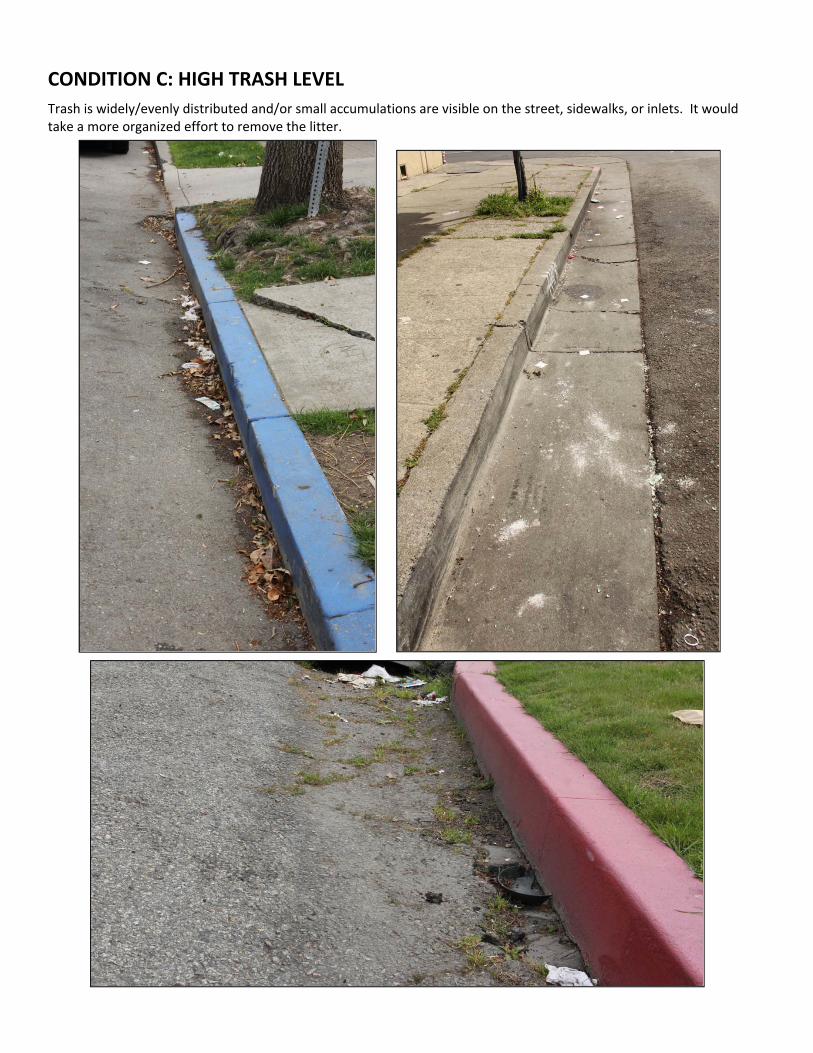
CONDITION C: HIGH TRASH LEVEL
Trash is widely/evenly distributed and/or small accumulations are visible on the street, sidewalks, or inlets. It would take a more organized effort to remove the litter.
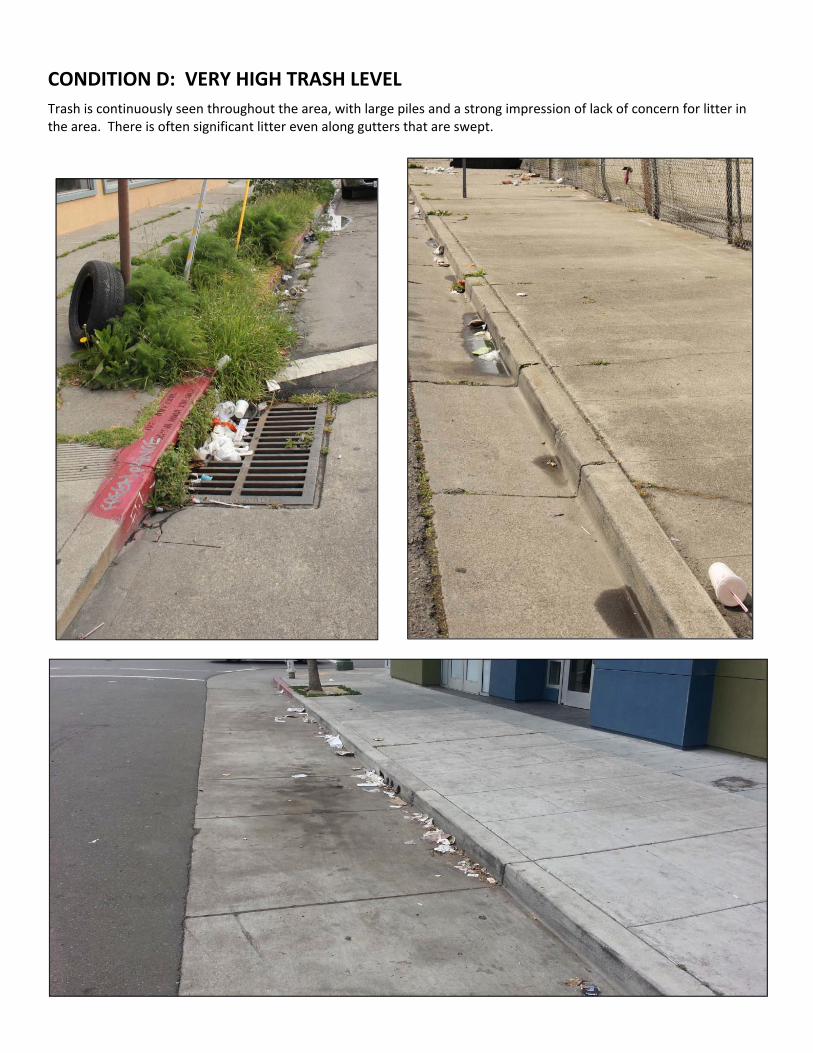
CONDITION D: VERY HIGH TRASH LEVEL
Trash is continuously seen throughout the area, with large piles and a strong impression of lack of concern for litter in the area. There is often significant litter even along gutters that are swept.
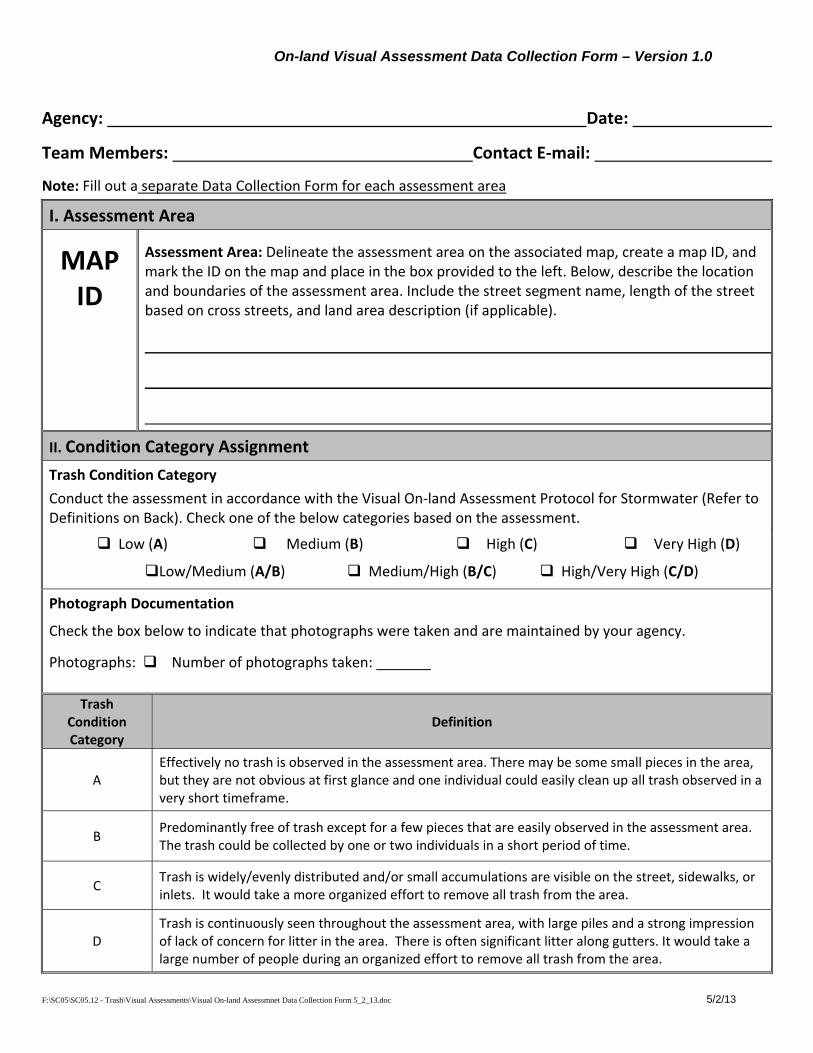
On-land Visual Assessment Data Collection Form – Version 1.0
F:\SC05\SC05.12 - Trash\Visual Assessments\Visual On-land Assessmnet Data Collection Form 5_2_13.doc 5/2/13
Agency: Date:
Team Members: Contact E‐mail:
Note: Fill out a separate Data Collection Form for each assessment area
I. Assessment Area
MAP ID
Assessment Area: Delineate the assessment area on the associated map, create a map ID, and mark the ID on the map and place in the box provided to the left. Below, describe the location and boundaries of the assessment area. Include the street segment name, length of the street based on cross streets, and land area description (if applicable).
II. Condition Category Assignment
Trash Condition Category
Conduct the assessment in accordance with the Visual On‐land Assessment Protocol for Stormwater (Refer to Definitions on Back). Check one of the below categories based on the assessment.
Low (A) Medium (B) High (C) Very High (D)
Low/Medium (A/B) Medium/High (B/C) High/Very High (C/D)
Photograph Documentation
Check the box below to indicate that photographs were taken and are maintained by your agency.
Photographs: Number of photographs taken:
Trash Condition Category
Definition
A Effectively no trash is observed in the assessment area. There may be some small pieces in the area, but they are not obvious at first glance and one individual could easily clean up all trash observed in a very short timeframe.
B Predominantly free of trash except for a few pieces that are easily observed in the assessment area. The trash could be collected by one or two individuals in a short period of time.
C Trash is widely/evenly distributed and/or small accumulations are visible on the street, sidewalks, or inlets. It would take a more organized effort to remove all trash from the area.
D Trash is continuously seen throughout the assessment area, with large piles and a strong impression of lack of concern for litter in the area. There is often significant litter along gutters. It would take a large number of people during an organized effort to remove all trash from the area.
F:\SC05\SC05.12 - Trash\Visual Assessments\Visual On-land Assessmnet Data Collection Form 5_2_13.doc 5/2/13
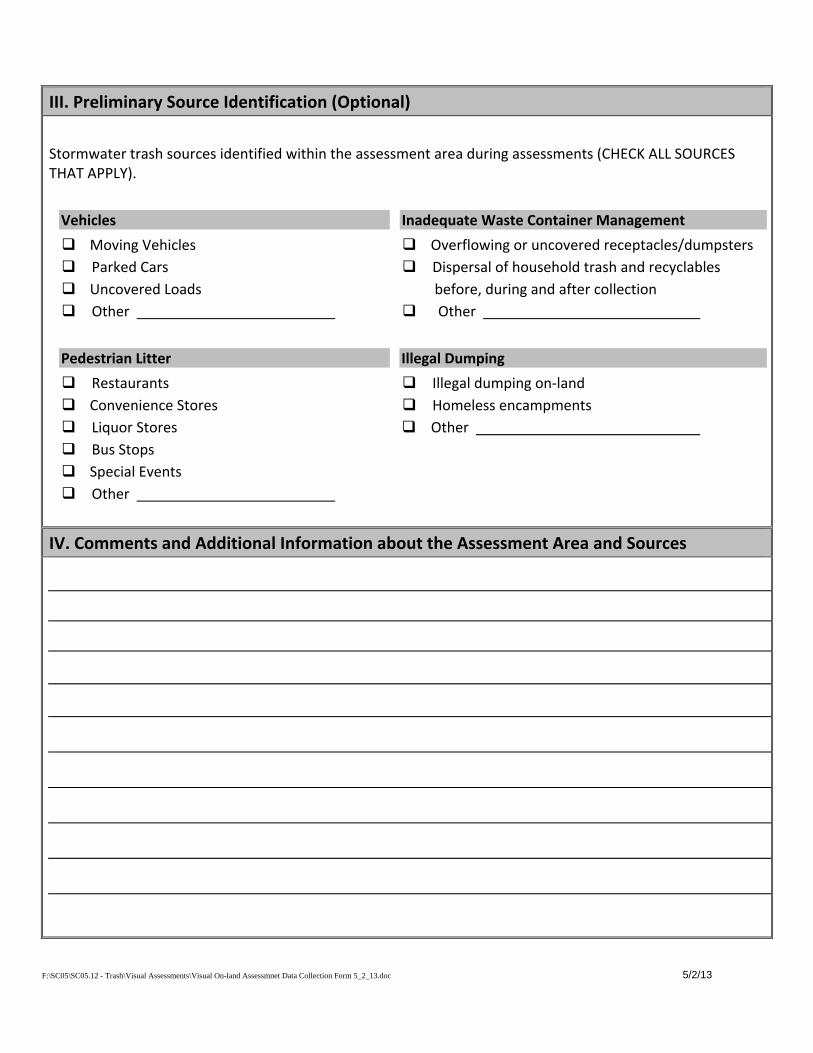
III. Preliminary Source Identification (Optional)
Stormwater trash sources identified within the assessment area during assessments (CHECK ALL SOURCES THAT APPLY).
Vehicles
Moving Vehicles
Parked Cars
Uncovered Loads
Other
Pedestrian Litter
Restaurants
Convenience Stores Liquor Stores
Bus Stops
Special Events
Other
Inadequate Waste Container Management
Overflowing or uncovered receptacles/dumpsters
Dispersal of household trash and recyclables
before, during and after collection
Other
Illegal Dumping
Illegal dumping on‐land
Homeless encampments
Other
IV. Comments and Additional Information about the Assessment Area and Sources
Appendix B
SCVURPPP Hot Spot Assessment Guidance and
Field Data Collection Form
111 West Evelyn Avenue, Suite 110 • Sunnyvale, CA 94086 • tel: (408) 720-8833 • fax: (408) 720-8812
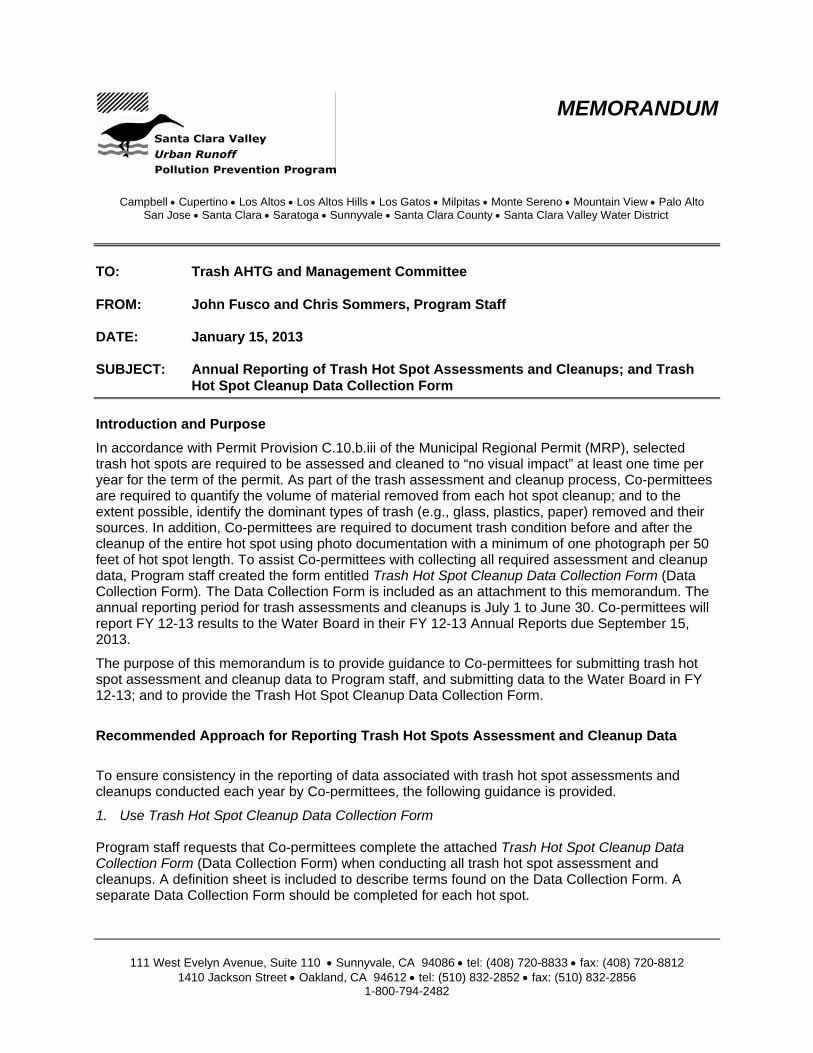
MEMORANDUM
Campbell • Cupertino • Los Altos • Los Altos Hills • Los Gatos • Milpitas • Monte Sereno • Mountain View • Palo Alto San Jose • Santa Clara • Saratoga • Sunnyvale • Santa Clara County • Santa Clara Valley Water District TO: Trash AHTG and Management Committee FROM: John Fusco and Chris Sommers, Program Staff DATE: January 15, 2013 SUBJECT: Annual Reporting of Trash Hot Spot Assessments and Cleanups; and Trash
Hot Spot Cleanup Data Collection Form
Introduction and Purpose
In accordance with Permit Provision C.10.b.iii of the Municipal Regional Permit (MRP), selected trash hot spots are required to be assessed and cleaned to “no visual impact” at least one time per year for the term of the permit. As part of the trash assessment and cleanup process, Co-permittees are required to quantify the volume of material removed from each hot spot cleanup; and to the extent possible, identify the dominant types of trash (e.g., glass, plastics, paper) removed and their sources. In addition, Co-permittees are required to document trash condition before and after the cleanup of the entire hot spot using photo documentation with a minimum of one photograph per 50 feet of hot spot length. To assist Co-permittees with collecting all required assessment and cleanup data, Program staff created the form entitled Trash Hot Spot Cleanup Data Collection Form (Data Collection Form). The Data Collection Form is included as an attachment to this memorandum. The annual reporting period for trash assessments and cleanups is July 1 to June 30. Co-permittees will report FY 12-13 results to the Water Board in their FY 12-13 Annual Reports due September 15, 2013.
The purpose of this memorandum is to provide guidance to Co-permittees for submitting trash hot spot assessment and cleanup data to Program staff, and submitting data to the Water Board in FY 12-13; and to provide the Trash Hot Spot Cleanup Data Collection Form.
Recommended Approach for Reporting Trash Hot Spots Assessment and Cleanup Data
To ensure consistency in the reporting of data associated with trash hot spot assessments and cleanups conducted each year by Co-permittees, the following guidance is provided.
1. Use Trash Hot Spot Cleanup Data Collection Form Program staff requests that Co-permittees complete the attached Trash Hot Spot Cleanup Data Collection Form (Data Collection Form) when conducting all trash hot spot assessment and cleanups. A definition sheet is included to describe terms found on the Data Collection Form. A separate Data Collection Form should be completed for each hot spot.
1410 Jackson Street • Oakland, CA 94612 • tel: (510) 832-2852 • fax: (510) 832-2856 1-800-794-2482
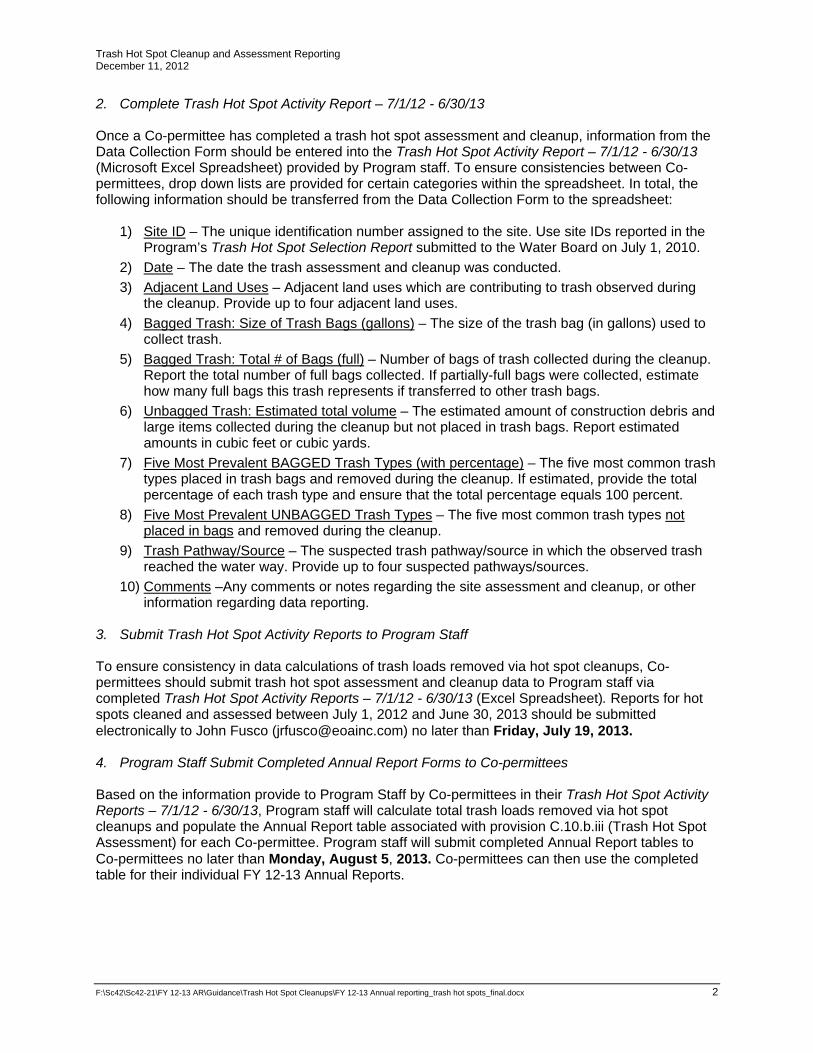
Trash Hot Spot Cleanup and Assessment Reporting December 11, 2012
2. Complete Trash Hot Spot Activity Report – 7/1/12 - 6/30/13 Once a Co-permittee has completed a trash hot spot assessment and cleanup, information from the Data Collection Form should be entered into the Trash Hot Spot Activity Report – 7/1/12 - 6/30/13 (Microsoft Excel Spreadsheet) provided by Program staff. To ensure consistencies between Co-permittees, drop down lists are provided for certain categories within the spreadsheet. In total, the following information should be transferred from the Data Collection Form to the spreadsheet:
1) Site ID – The unique identification number assigned to the site. Use site IDs reported in the Program’s Trash Hot Spot Selection Report submitted to the Water Board on July 1, 2010.
2) Date – The date the trash assessment and cleanup was conducted.
3) Adjacent Land Uses – Adjacent land uses which are contributing to trash observed during the cleanup. Provide up to four adjacent land uses.
4) Bagged Trash: Size of Trash Bags (gallons) – The size of the trash bag (in gallons) used to collect trash.
5) Bagged Trash: Total # of Bags (full) – Number of bags of trash collected during the cleanup. Report the total number of full bags collected. If partially-full bags were collected, estimate how many full bags this trash represents if transferred to other trash bags.
6) Unbagged Trash: Estimated total volume – The estimated amount of construction debris and large items collected during the cleanup but not placed in trash bags. Report estimated amounts in cubic feet or cubic yards.
7) Five Most Prevalent BAGGED Trash Types (with percentage) – The five most common trash types placed in trash bags and removed during the cleanup. If estimated, provide the total percentage of each trash type and ensure that the total percentage equals 100 percent.
8) Five Most Prevalent UNBAGGED Trash Types – The five most common trash types not placed in bags and removed during the cleanup.
9) Trash Pathway/Source – The suspected trash pathway/source in which the observed trash reached the water way. Provide up to four suspected pathways/sources.
10) Comments –Any comments or notes regarding the site assessment and cleanup, or other information regarding data reporting.
3. Submit Trash Hot Spot Activity Reports to Program Staff
To ensure consistency in data calculations of trash loads removed via hot spot cleanups, Co-permittees should submit trash hot spot assessment and cleanup data to Program staff via completed Trash Hot Spot Activity Reports – 7/1/12 - 6/30/13 (Excel Spreadsheet). Reports for hot spots cleaned and assessed between July 1, 2012 and June 30, 2013 should be submitted electronically to John Fusco ([email protected]) no later than Friday, July 19, 2013. 4. Program Staff Submit Completed Annual Report Forms to Co-permittees
Based on the information provide to Program Staff by Co-permittees in their Trash Hot Spot Activity Reports – 7/1/12 - 6/30/13, Program staff will calculate total trash loads removed via hot spot cleanups and populate the Annual Report table associated with provision C.10.b.iii (Trash Hot Spot Assessment) for each Co-permittee. Program staff will submit completed Annual Report tables to Co-permittees no later than Monday, August 5, 2013. Co-permittees can then use the completed table for their individual FY 12-13 Annual Reports.
F:\Sc42\Sc42-21\FY 12-13 AR\Guidance\Trash Hot Spot Cleanups\FY 12-13 Annual reporting_trash hot spots_final.docx 2
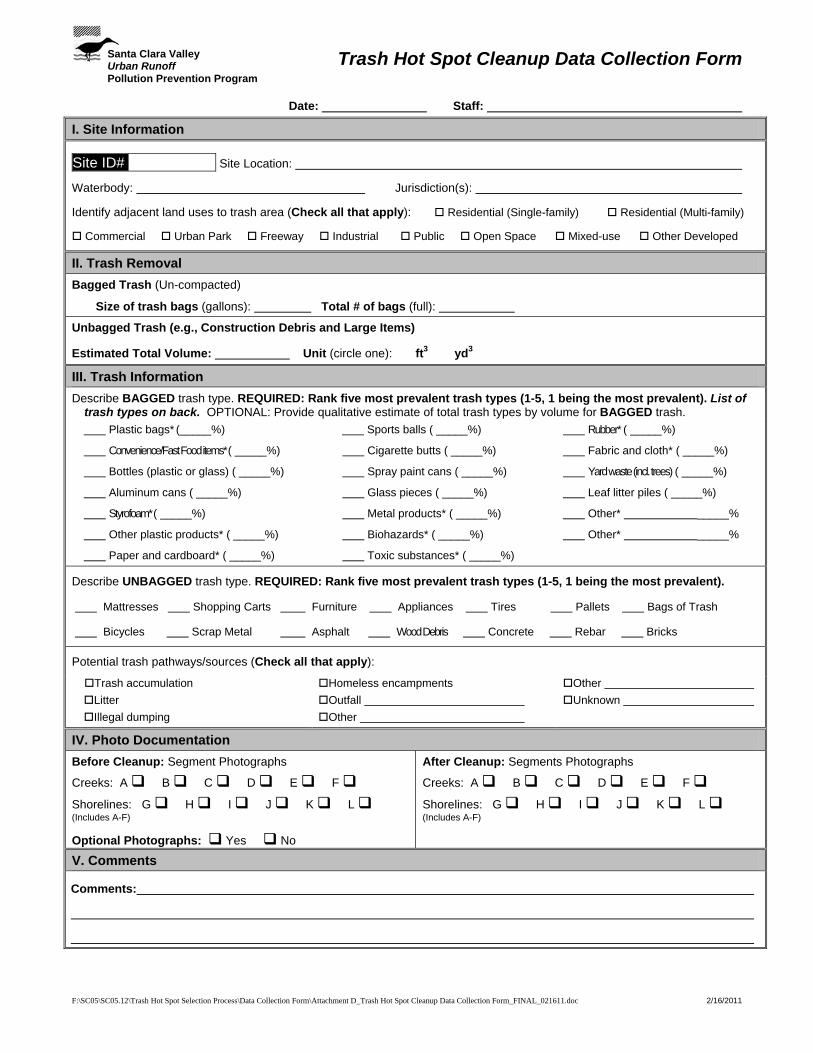
Trash Hot Spot Cleanup Data Collection Form
F:\SC05\SC05.12\Trash Hot Spot Selection Process\Data Collection Form\Attachment D_Trash Hot Spot Cleanup Data Collection Form_FINAL_021611.doc 2/16/2011
Santa Clara Valley Urban Runoff Pollution Prevention Program
Date: Staff:
I. Site Information
Site ID# Site Location:
Waterbody: Jurisdiction(s):
Identify adjacent land uses to trash area (Check all that apply): Residential (Single-family) Residential (Multi-family)
Commercial Urban Park Freeway Industrial Public Open Space Mixed-use Other Developed
II. Trash Removal
Bagged Trash (Un-compacted)
Size of trash bags (gallons): Total # of bags (full):
Unbagged Trash (e.g., Construction Debris and Large Items)
Estimated Total Volume: Unit (circle one): ft3 yd3
III. Trash Information
Describe BAGGED trash type. REQUIRED: Rank five most prevalent trash types (1-5, 1 being the most prevalent). List of trash types on back. OPTIONAL: Provide qualitative estimate of total trash types by volume for BAGGED trash.
Plastic bags* (_____%)
Convenience/Fast Food items* ( _____%)
Bottles (plastic or glass) ( _____%)
Aluminum cans ( _____%)
Styrofoam* ( _____%)
Other plastic products* ( _____%)
Paper and cardboard* ( _____%)
Sports balls ( _____%)
Cigarette butts ( _____%)
Spray paint cans ( _____%)
Glass pieces ( _____%)
Metal products* ( _____%)
Biohazards* ( _____%)
Toxic substances* ( _____%)
Rubber* ( _____%)
Fabric and cloth* ( _____%)
Yard waste (incl. trees) ( _____%)
Leaf litter piles ( _____%)
Other* _____%
Other* _____%
Describe UNBAGGED trash type. REQUIRED: Rank five most prevalent trash types (1-5, 1 being the most prevalent).
Mattresses Shopping Carts Furniture Appliances Tires Pallets Bags of Trash
Bicycles Scrap Metal Asphalt Wood Debris Concrete Rebar Bricks
Potential trash pathways/sources (Check all that apply):
Trash accumulation
Litter
Illegal dumping
Homeless encampments
Outfall
Other
Other
Unknown
IV. Photo Documentation
Before Cleanup: Segment Photographs
Creeks: A B C D E F
Shorelines: G H I J K L (Includes A-F)
Optional Photographs: Yes No
After Cleanup: Segments Photographs
Creeks: A B C D E F
Shorelines: G H I J K L (Includes A-F)
V. Comments
Comments:
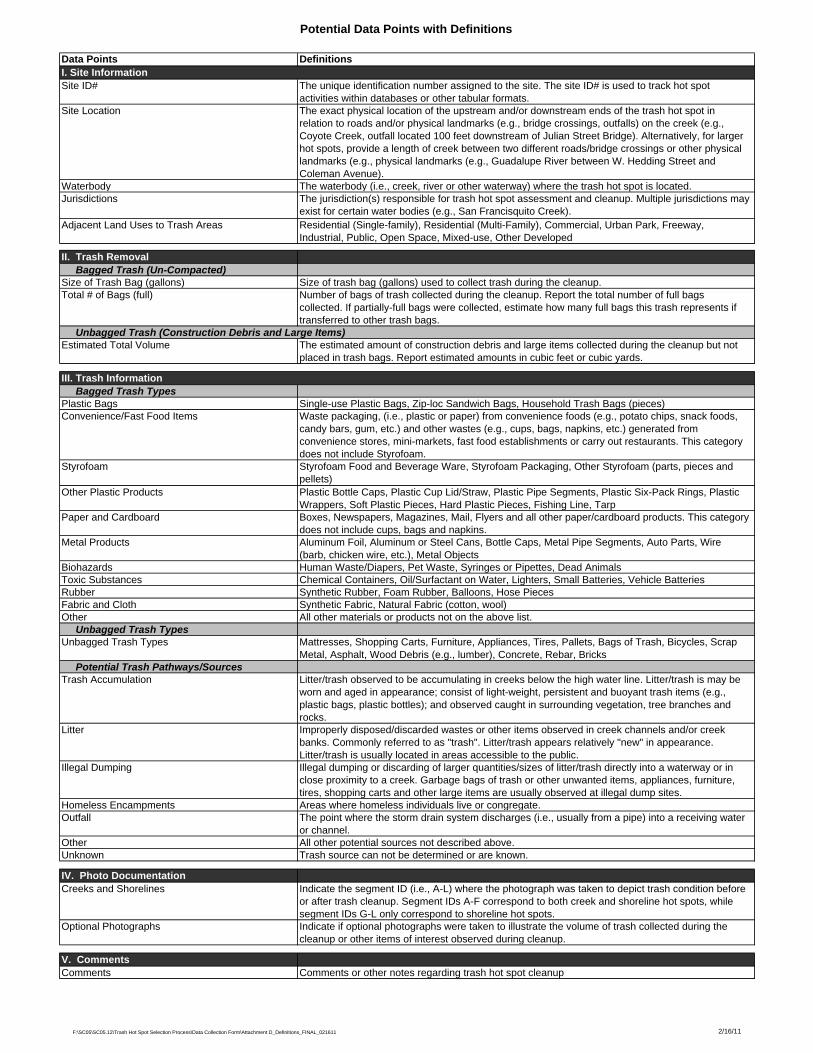
Potential Data Points with Definitions
Data Points DefinitionsI. Site InformationSite ID# The unique identification number assigned to the site. The site ID# is used to track hot spot
activities within databases or other tabular formats.Site Location The exact physical location of the upstream and/or downstream ends of the trash hot spot in
relation to roads and/or physical landmarks (e.g., bridge crossings, outfalls) on the creek (e.g., Coyote Creek, outfall located 100 feet downstream of Julian Street Bridge). Alternatively, for larger hot spots, provide a length of creek between two different roads/bridge crossings or other physical landmarks (e.g., physical landmarks (e.g., Guadalupe River between W. Hedding Street and Coleman Avenue).
Waterbody The waterbody (i.e., creek, river or other waterway) where the trash hot spot is located.Jurisdictions The jurisdiction(s) responsible for trash hot spot assessment and cleanup. Multiple jurisdictions may
exist for certain water bodies (e.g., San Francisquito Creek).Adjacent Land Uses to Trash Areas Residential (Single-family), Residential (Multi-Family), Commercial, Urban Park, Freeway,
Industrial, Public, Open Space, Mixed-use, Other Developed
II. Trash Removal Bagged Trash (Un-Compacted)Size of Trash Bag (gallons) Size of trash bag (gallons) used to collect trash during the cleanup.Total # of Bags (full) Number of bags of trash collected during the cleanup. Report the total number of full bags
collected. If partially-full bags were collected, estimate how many full bags this trash represents if transferred to other trash bags.
Unbagged Trash (Construction Debris and Large Items) Estimated Total Volume The estimated amount of construction debris and large items collected during the cleanup but not
placed in trash bags. Report estimated amounts in cubic feet or cubic yards.
III. Trash Information Bagged Trash TypesPlastic Bags Single-use Plastic Bags, Zip-loc Sandwich Bags, Household Trash Bags (pieces)Convenience/Fast Food Items Waste packaging, (i.e., plastic or paper) from convenience foods (e.g., potato chips, snack foods,
candy bars, gum, etc.) and other wastes (e.g., cups, bags, napkins, etc.) generated from convenience stores, mini-markets, fast food establishments or carry out restaurants. This category does not include Styrofoam.
Styrofoam Styrofoam Food and Beverage Ware, Styrofoam Packaging, Other Styrofoam (parts, pieces and pellets)
Other Plastic Products Plastic Bottle Caps, Plastic Cup Lid/Straw, Plastic Pipe Segments, Plastic Six-Pack Rings, Plastic Wrappers, Soft Plastic Pieces, Hard Plastic Pieces, Fishing Line, Tarp
Paper and Cardboard Boxes, Newspapers, Magazines, Mail, Flyers and all other paper/cardboard products. This category does not include cups, bags and napkins.
Metal Products Aluminum Foil, Aluminum or Steel Cans, Bottle Caps, Metal Pipe Segments, Auto Parts, Wire (barb, chicken wire, etc.), Metal Objects
Biohazards Human Waste/Diapers, Pet Waste, Syringes or Pipettes, Dead AnimalsToxic Substances Chemical Containers, Oil/Surfactant on Water, Lighters, Small Batteries, Vehicle BatteriesRubber Synthetic Rubber, Foam Rubber, Balloons, Hose PiecesFabric and Cloth Synthetic Fabric, Natural Fabric (cotton, wool)Other All other materials or products not on the above list. Unbagged Trash TypesUnbagged Trash Types Mattresses, Shopping Carts, Furniture, Appliances, Tires, Pallets, Bags of Trash, Bicycles, Scrap
Metal, Asphalt, Wood Debris (e.g., lumber), Concrete, Rebar, Bricks Potential Trash Pathways/SourcesTrash Accumulation Litter/trash observed to be accumulating in creeks below the high water line. Litter/trash is may be
worn and aged in appearance; consist of light-weight, persistent and buoyant trash items (e.g., plastic bags, plastic bottles); and observed caught in surrounding vegetation, tree branches and rocks.
Litter Improperly disposed/discarded wastes or other items observed in creek channels and/or creek banks. Commonly referred to as "trash". Litter/trash appears relatively "new" in appearance. Litter/trash is usually located in areas accessible to the public.
Illegal Dumping Illegal dumping or discarding of larger quantities/sizes of litter/trash directly into a waterway or in close proximity to a creek. Garbage bags of trash or other unwanted items, appliances, furniture, tires, shopping carts and other large items are usually observed at illegal dump sites.
Homeless Encampments Areas where homeless individuals live or congregate.Outfall The point where the storm drain system discharges (i.e., usually from a pipe) into a receiving water
or channel.Other All other potential sources not described above. Unknown Trash source can not be determined or are known.
IV. Photo DocumentationCreeks and Shorelines Indicate the segment ID (i.e., A-L) where the photograph was taken to depict trash condition before
or after trash cleanup. Segment IDs A-F correspond to both creek and shoreline hot spots, while segment IDs G-L only correspond to shoreline hot spots.
Optional Photographs Indicate if optional photographs were taken to illustrate the volume of trash collected during the cleanup or other items of interest observed during cleanup.
V. CommentsComments Comments or other notes regarding trash hot spot cleanup
F:\SC05\SC05.12\Trash Hot Spot Selection Process\Data Collection Form\Attachment D_Definitions_FINAL_021611 2/16/11