Embed Size (px)
Citation preview

C.3 Stormwater Handbook
IV. Treatment Control Sizing Criteria Page IV-1 FINAL F:\SC46\SC46.24\C.3. Guidance Manual\Final May 2004\Chapter 4\4-stormwater treatment sizing_May 2004.doc May 20, 2004
Santa Clara Valley Urban Runoff Pollution Prevention Program
IV
IV.1 INTRODUCTION
The sizing of the stormwater treatment BMPs selected as described in Chapter III must meet criteria identified in the NPDES permit’s Provision C.3.d. This chapter explains the hydraulic sizing criteria that are required by the permit. Worksheets and sizing curves to assist municipal staff and project designers in sizing various treatment systems are provided.
Volume-Based Versus Flow-Based Versus Combination BMPs
The two (2) basic stormwater treatment removal processes are volume-based and flow-based BMPs. Volume-based BMPs detain stormwater for a certain period and treat primarily through settling and infiltration. Flow-based BMPs treat pollutants from a moving stream of water through filtration, infiltration, and/or biological processes. This section does not address the sizing of a treatment system that will be used for both volume and flow control, as may be required by the Program’s Hydromodification Management Plan (HMP). The design of dual-purpose systems will be addressed in the completed HMP report and added to Chapter V of this Handbook at a future date.
Appendix F describes the development of numeric sizing criteria for stormwater treatment systems for conditions in the Santa Clara Basin, as required in the Program’s NPDES Permit Provision C.3.d. It applies the different criteria to several examples for a comparison of the results. The Program acknowledges the assistance of GeoSyntec Consultants, for the technical analyses and report (GeoSyntec Consultants, 2003) that form the basis of this section.
IV.2 HYDRAULIC SIZING CRITERIA
The following are the hydraulic sizing criteria required by Provision C.3.d. The name assigned to each criterion is consistent with the nomenclature used in the 2003 California Best Management Practice (BMP) Manual for New Development and Redevelopment (CASQA, 2003) and is given in bold in the parentheses following each criterion.
C.3.d.i. Volume Hydraulic Design Basis: Volume-based treatment BMPs are designed to treat a volume of runoff, which is detained for a certain period of time to effect settling of solids and associated pollutants. Examples of volume-
STORMWATER TREATMENT CONTROL SIZING CRITERIA
The goal of this Chapter is to provide guidance on appropriately sizing stormwater treatment BMPs to meet the requirements of Provision C.3.

Santa Clara Valley C.3 Stormwater Handbook Urban Runoff Pollution Prevention Program
IV. Treatment Control Sizing Criteria Page IV-2 FINAL F:\SC46\SC46.24\C.3. Guidance Manual\Final May 2004\Chapter 4\4-stormwater treatment sizing_May 2004.doc May 20, 2004
based controls include wet ponds, detention basins, constructed wetlands, and bioretention systems (see Attachment III-2 for additional examples). Treatment BMPs1 whose primary mode of action depends on volume capacity, such as detention/retention units or infiltration structures shall be designed to treat storm water runoff equal to:
• The maximum stormwater quality capture volume for the area, based on historical rainfall records, determined using the formula and volume capture coefficients set forth in Urban Runoff Quality Management, WEF Manual of Practice No. 23 and ASCE Manual of Practice No. 87, (1998), pages 175-178 (URQM Approach); or
• The volume of annual runoff required to achieve eighty percent (80%) or more capture, determined in accordance with the methodology set forth in Appendix D of the California Stormwater Best Management Practices Handbook, (1993) using local rainfall data. (CA Stormwater BMP Handbook Volume Approach).
C.3.d.ii. Flow Hydraulic Design Basis: Flow-based treatment BMPs treat water on a continuous flow basis. Examples include vegetated swales, media filters, hydrodynamic separators and screened systems.2 Treatment BMPs whose primary mode of action depends on flow capacity, such as swales, sand filters, or wetlands, shall be sized to treat:
• Ten percent (10%) of the 50-year peak flow rate (Factored Flood Flow Approach); or,
• The flow of runoff produced by a rain event equal to or at least two (2) times the 85th percentile hourly rainfall intensity for the applicable area, based on historical records of hourly rainfall depths (CA Stormwater BMP Handbook Flow Approach); or,
• The flow of runoff from a rain event equal to at least 0.2 inches per hour intensity (Uniform Intensity Approach).
IV.3 RECOMMENDATIONS
Stormwater treatment BMPs designed using any of the sizing methods specified in Permit Provision C.3.d., when properly applied, will be in compliance with the NPDES permit’s requirements. However, the various sizing methods have advantages and disadvantages to their use, and local agencies may wish to specify a preference for particular methods in order to standardize development project submittals. Therefore, Table IV.1 presents a summary of the advantages and disadvantages of the methods. The recommended sizing methods are also discussed following this summary.
1 For the purpose of this section, a stormwater best management practice (BMP) is the same as a stormwater treatment measure, device, or control. 2 For clarification, flow-based treatment BMPs differ from flow control BMPs, which are used to limit the volume and rate of discharge from a development site, such as may be required by the Program’s HMP (see Chapter V).

Santa Clara Valley C.3 Stormwater Handbook Urban Runoff Pollution Prevention Program
IV. Treatment Control Sizing Criteria Page IV-3 FINAL F:\SC46\SC46.24\C.3. Guidance Manual\Final May 2004\Chapter 4\4-stormwater treatment sizing_May 2004.doc May 20, 2004
Table IV.1 -- Advantages and Disadvantages of Alternative Sizing Methods
Volume Based Methods Advantages Disadvantages
1) Urban Runoff Quality Management (URQM) Method
Based on modeling and regression analysis using long-term rainfall records in six cities including San Francisco. Takes into account drain time. Easy to apply.
Does not simulate performance under local rainfall patterns, but estimates volume based on average storm event size. Does not consider soil type or slope.
2) CA Stormwater BMP Handbook Volume Method (adapted for Santa Clara Valley using SWMM Model)
More comprehensive method. Takes into account drain time, slope, and soil types. Based on continuous simulation of detention storage, outflow, and bypass using local long-term rainfall records.
More complex method of the two candidate methods. Curves are provided that should cover most applications.
Flow Based Methods
Advantages Disadvantages
1) Factored Flood Flow Approach (10% of 50-year rainfall intensity)
Intensity-duration-frequency curves are very familiar to most engineers. Takes into account local rainfall conditions.
Not based on achieving any given level of treatment of small storms. Sensitive to time of concentration estimate, which could make it more difficult for development review agency.
2) CA Stormwater BMP Handbook Flow Approach (2 times 85th percentile rainfall intensity)
Takes into account local rainfall conditions.
Some question regarding appropriateness of factor of 2.
3) Uniform Intensity Approach (0.2 inches/hr)
Simplest of methods. Does not take into account local rainfall patterns and statistics.
For volume-based controls, the adapted CA Stormwater BMP Handbook Volume Method is recommended because it takes into account rainfall characteristics, percent imperviousness, drainage time, soil infiltration conditions, and slope. All of these factors can be relatively easily determined for a site, and the design curves provided in this report (Attachment IV-1) should be sufficient for sizing basins and other volume-based controls. In addition, the method simulates the operation of a basin under realistic conditions, and it is reasonable to assume that

Santa Clara Valley C.3 Stormwater Handbook Urban Runoff Pollution Prevention Program
IV. Treatment Control Sizing Criteria Page IV-4 FINAL F:\SC46\SC46.24\C.3. Guidance Manual\Final May 2004\Chapter 4\4-stormwater treatment sizing_May 2004.doc May 20, 2004
basins designed using this method will achieve the desired percent capture specified in permit Provision C.3.d. Lastly, this method explicitly incorporates a drain time that allows an appropriate level of treatment while avoiding vector control concerns.
For flow based controls, the CA Stormwater BMP Handbook Flow Method is recommended, using the values estimated for each of the rain gages. This method is based on local rainfall data and achieving treatment of small storms consistent with the permit requirements.
Attachment IV-1 contains worksheets and sizing curves to assist municipal staff and development project proponents in sizing various treatment systems using all five (5) of the alternative sizing methods. Attachment IV-2 contains worksheets completed for an example of a single-family residential project in Santa Clara Valley.
IV.4. REFERENCES
California Stormwater Quality Association, 2003. Stormwater Best Management Practice Handbook, New Development and Redevelopment, January.
Camp Dresser & McKee, 2003. Using Site Design Techniques to Meet Development Standards for Stormwater Quality. Prepared for the Bay Area Stormwater Management Agencies Association. May.
GeoSyntec Consultants, 2003. Sizing Criteria for Stormwater Treatment. Draft Report. Prepared for the Santa Clara Valley Urban Runoff Pollution Prevention Program and the Santa Clara Valley Water District.
Water Environment Federation (WEF) Manual of Practice No. FD-20 / American Society of Civil Engineers (ASCE) Manual and Report of Engineering Practice No. 77, 1992. Design and Construction of Urban Stormwater Management Systems.
Water Environment Federation (WEF) Manual of Practice No. 23 / American Society of Civil Engineers (ASCE) Manual and Report of Engineering Practice No. 87, 1998. Urban Runoff Quality Management.
Several figures and tables are provided in Attachment IV-1 to assist in selecting and designing BMPs. Figure 1: Mean Annual Precipitation Depths and Soil Texture for the Santa Clara Basin Figures 2 and 3: Unit Basin Volumes Figure 4: Rain Intensity-Frequency-Duration Curves
C.3. Stormwater Handbook
IV. Treatment Control Sizing Criteria Attachment IV-1 FINAL F:\SC46\SC46.24\C.3. Guidance Manual\Final May 2004\Chapter 4\Attachment iv-1 FLY_May 2004.doc May 20, 2004
ATTACHMENT IV-1
Sizing Criteria Worksheets
TABLES Table 1 – Examples Of Volume-Based And Flow-Based Controls Table 2 – Precipitation Data for Four Reference Gages Table 3a – Estimated Runoff Coefficients for Various Surfaces During Small Storms
(CDM, 2003) Table 3b – Estimated Composite Runoff Coefficients for Small Storms by Land Use
(WEF/ASCE, 2003) FIGURES Figure 1 – Mean Annual Precipitation Depths and Soil Texture for the Santa Clara
Basin Figure 2 – Unit Basin Volumes for 80% Capture, Assumed slope = 1% Figure 3 – Unit Basin Volumes for 80% Capture, Assumed slope = 15% Figure 4 – Rain Intensity-Frequency-Duration Curves
Santa Clara Valley Urban Runoff Pollution Prevention Program

C.3 Stormwater Handbook
IV. Treatment Control Sizing Criteria Attachment IV-1 – Page 1 FINAL F:\SC46\SC46.24\C.3. Guidance Manual\Final May 2004\Chapter 4\Attachment iv-1 sizing worksheets_May 2004.doc May 20, 2004
Santa Clara Valley Urban Runoff Pollution Prevention Program
Attachment IV-1 Sizing Criteria Worksheets
These worksheets are designed to assist municipal staff and development project proponents in sizing stormwater treatment controls. Figures used in the computations can be found at the back of these worksheets. I. Type of Treatment Measure Proposed for Project 1. Does the treatment measure (or part of a series of measures) operate based on the volume of water
treated (i.e., detains an amount of runoff for a certain amount of time to allow solids and pollutants to settle to the bottom)? (See Table 1 for examples.)
___ Yes ____ No
If Yes, continue to Section II.—Sizing for Volume-Based Treatment Controls on page 2. If No, continue to next question.
2. Does the treatment measure (or part of a series of measures) operate based on continuous flow of
runoff through the device? (See Table 1 for examples.)
___ Yes ____ No If Yes, continue to Section III.—Sizing for Flow-Based Treatment Controls on page 8.
Table 1: Examples Of Volume-Based And Flow-Based Controls
Volume-based Controls Flow-based Controls Extended detention (dry) ponds Vegetated swales Wet ponds Vegetated buffer strips Infiltration trench Media filters Infiltration basin Hydrodynamic separators Bioretention areas Wet vaults Constructed wetlands Other proprietary treatment devices

Santa Clara Valley C.3 Stormwater Handbook Urban Runoff Pollution Prevention Program
IV. Treatment Control Sizing Criteria Attachment IV-1 – Page 2 FINAL F:\SC46\SC46.24\C.3. Guidance Manual\Final May 2004\Chapter 4\Attachment iv-1 sizing worksheets_May 2004.doc May 20, 2004
Attachment IV-1 Sizing for Volume-Based Treatment Controls
II. Sizing for Volume-Based Treatment Controls The SCVURPPP Permit Provision C.3.d allows two methods for sizing volume-based controls—the Urban Runoff Quality Management method (URQM Method) or the California Stormwater Best Management Practice1 (BMP) Handbook Volume Method. Steps for applying these methods are presented in Sections A and B below. The equations used in this method are:
Po=(a*Cw)* P6
Cw =0.858i3 – 0.78i2 + 0.774i + 0.04 Where: Po = maximized detention storage volume (inches over the drainage area to the BMP) a = regression constant (unitless) Cw = watershed runoff coefficient (unitless)2
P6 = mean storm event precipitation depth (inches); i = watershed impervious ratio (range: 0-1) Step 1. Determine the drainage area for the BMP, A = _____ acres Step 2. Determine the watershed impervious ratio, “i”, which is the amount of impervious area in the
drainage area to the BMP divided by the drainage area, or the percent of impervious area in the drainage area divided by 100.
a. Estimate the amount of impervious surface (rooftops, hardscape, streets, and sidewalks, etc.) in the area draining to the BMP = _____ acres
b. Calculate the watershed impervious ratio, i:
i = amount of impervious area (acres)/drainage area for the BMP (acres)
i = (Step 2.a.)/(Step 1) = __________________ (range: 0-1)
Percent impervious area= i/100 = ________%
1 For the purpose of this worksheet, a stormwater best management practice, or BMP, is the same as a stormwater treatment measure or device. 2 For the purpose of this worksheet, the watershed runoff coefficient is notated as “Cw” to avoid confusion with the runoff coefficient “C” used in the Rational Method.
Section A.— Sizing Volume-Based Treatment Controls based on the Urban Runoff Quality Management1, Approach (URQM Approach)

Santa Clara Valley C.3 Stormwater Handbook Urban Runoff Pollution Prevention Program
IV. Treatment Control Sizing Criteria Attachment IV-1 – Page 3 FINAL F:\SC46\SC46.24\C.3. Guidance Manual\Final May 2004\Chapter 4\Attachment iv-1 sizing worksheets_May 2004.doc May 20, 2004
Attachment IV-1 Sizing for Volume-Based Treatment Controls
Section A.— URQM Approach (continued)
Step 3. Determine the watershed runoff coefficient, “Cw”, using the following equation:
Cw =0.858i3 – 0.78i2 + 0.774i + 0.04 , using “i” from Step 2.b.
Cw = __________________________
Step 4. Find the mean annual precipitation at the site (MAPsite). To do so, estimate where the site is on Figure 1and estimate the mean annual precipitation in inches from the rain line (isopleth) nearest to the project site.3,
Mean annual precipitation at the site, MAPsite = ______________
(Each line on the figure, called a rainfall isopleth, indicates locations where the same amount of rainfall falls on average each year (e.g., the isopleth marked 14 indicates that areas crossed by this line average 14 inches of rainfall per year). If the project location is between two lines, estimate the mean annual rainfall depending on the location of the site.)
Step 5. Identify the reference rain gage closest to the project site from the following list.
Table 2: Precipitation Data for Four Reference Gages Gages Mean Annual
Precipitation (MAPgage) (in)
Mean Storm Event Precipitation (P6) gage
(in)
San Jose Airport 13.9 0.512
Palo Alto 13.7 0.522
Gilroy 18.2 0.684
Morgan Hill 19.5 0.760
Select the MAPgage and the mean storm precipitation (P6) gage for the reference gage, and use them to determine (P6) site for the project site in Step 6.
MAPgage = ______________
(P6) gage = ______________
3 Check with the local municipality to determine if more detailed maps are available for locating the site and
estimating MAP.

Santa Clara Valley C.3 Stormwater Handbook Urban Runoff Pollution Prevention Program
IV. Treatment Control Sizing Criteria Attachment IV-1 – Page 4 FINAL F:\SC46\SC46.24\C.3. Guidance Manual\Final May 2004\Chapter 4\Attachment iv-1 sizing worksheets_May 2004.doc May 20, 2004
Attachment IV-1 Sizing for Volume-Based Treatment Controls
Section A.— URQM Approach (continued)
Step 6. Calculate the mean storm event precipitation depth at the project site, called (P6) site. Multiply the mean storm event precipitation depth for the rain gage chosen by a correction factor, which is the ratio of the mean annual precipitation at the site (MAPsite) to the mean annual precipitation at the rain gage (MAPgage).
(P6) site = (P6) gage * (MAPsite) / (MAPgage).
(P6) site = Mean Event Precipitation (P6) gage (Step5) * (MAPsite) (Step4) / (MAPgage)(Step5).
P6 site = __________ inches
Step 7 Find “a”, the regression constant (unitless) 4:
a = 1.963 for a 48-hour drain time a = 1.582 for a 24-hour drain time a = ____________ a = 1.312 for a 12-hour drain time
Recommendation: Use a 48-hour drain time for detention basins and 24-hour drain time for pervious paving.
Step 8 Determine the maximized detention storage volume Po:
Po = (a*Cw) * P6
Po = (Step 7 * Step 3) * (Step 6)
Po = __________ inches
Step 9 Determine the volume of the runoff to be treated from the drainage area to the BMP (i.e., the BMP design volume):
Design volume = Po * A = (Step 8) * (Step 1) * 1 foot/12 inches
Design Volume = __________ acre-feet
4 WEF Manual of Practice No. 23 and the ASCE Manual of Practice No. 87 (1998), pages 175-178.

Santa Clara Valley C.3 Stormwater Handbook Urban Runoff Pollution Prevention Program
IV. Treatment Control Sizing Criteria Attachment IV-1 – Page 5 FINAL F:\SC46\SC46.24\C.3. Guidance Manual\Final May 2004\Chapter 4\Attachment iv-1 sizing worksheets_May 2004.doc May 20, 2004
Attachment IV-1 Sizing for Volume-Based Treatment Controls
The equation that will be used to size the BMP is:
BMP Volume = (Correction Factor) X (Unit Storage) X (Drainage Area to the BMP)
Step 1. Determine the drainage area for the BMP, A = _____ acres Step 2. Determine the watershed impervious ratio, “i”, which is the amount of impervious area in the
drainage area to the BMP divided by the drainage area, or the percent of impervious area in the drainage area divided by 100.
a) Estimate the amount of impervious surface (rooftops, hardscape, streets, and sidewalks, etc.) in the area draining to the BMP = _____ acres
b) Calculate the watershed impervious ratio, i:
i = amount of impervious area (acres)/drainage area for the BMP (acres)
i = (Step 2.a.)/(Step 1) = __________________ (range: 0-1)
Percent impervious area= i/100 = ________%
Step 3. Determine from Figure 1 the mean annual precipitation (MAPsite) at the project site location: (see Section II. Step 4 for more explanation.)
MAPsite = _____inches
Step 4 Identify the reference rain gage closest to the project site from the following list and record the MAPgage:
MAPgage = _____inches
Reference Rain Gages
Mean Annual Precipitation (MAPgage)
(in) San Jose Airport 13.9
Palo Alto 13.7 Gilroy 18.2
Morgan Hill 19.5
Section B — Sizing Volume-Based Treatment Controls based on the Adapted California Stormwater BMP Handbook Approach

Santa Clara Valley C.3 Stormwater Handbook Urban Runoff Pollution Prevention Program
IV. Treatment Control Sizing Criteria Attachment IV-1 – Page 6 FINAL F:\SC46\SC46.24\C.3. Guidance Manual\Final May 2004\Chapter 4\Attachment iv-1 sizing worksheets_May 2004.doc May 20, 2004
Attachment IV-1 Sizing for Volume-Based Treatment Controls
Section B —Adapted California Stormwater BMP Handbook Approach (continued) Step 5 Determine the rain gage correction factor for the precipitation at the site using the information
from Step 3 and Step 4.
Correction Factor = MAPsite (Step 3)/MAPgage (Step 4)
Correction Factor = ____________ Step 6. Identify representative soil type for the BMP drainage area.
a) Identify from Figure 1, the soil type that is representative of the pervious portion of the project shown here in order of increasing infiltration capability:
____ Clay ____ Sandy Clay ____ Clay Loam
____ Silt Loam ____ Loam
b) Does the site planning allow for protection of natural areas and associated vegetation and soils so that the soils outside the building footprint are not graded/compacted? ___
If your answer is no, and the soil will be compacted during site preparation and grading, the soil’s infiltration ability will be decreased. Modify your answer to a soil with a lower infiltration rate (e.g., Silt Loam to Clay Loam or Clay).
Modified soil type: ____________
7. Determine the average slope for the drainage area for the BMP: ________% 8. Determine the unit basin storage volume from sizing curves.
a) Slope ≤ 1%,
Use the figure entitled “Unit Basin Volume for 80% Capture, 1% Slope” corresponding to the nearest rain gage: Figure 2-A, B, C, or D for San Jose, Palo Alto, Gilroy and Morgan Hill, respectively. Find the percent imperviousness of the drainage area (see answer to Step 2, above) on the x-axis. From there, find the line corresponding to the soil type (from Step 6), and obtain the unit basin storage on the y-axis.
Unit Basin Storage (UBS) 1% =____________(inches)
b) Slope ≥ 15%
Use the figure entitled “Unit Basin Volume for 80% Capture, 15% Slope” corresponding to the nearest rain gage: Figure 3-A, B, C, or D for San Jose, Palo Alto, Gilroy and Morgan Hill, respectively. Find the percent imperviousness of the drainage area (see answer to Step 2, above) on the x-axis. From there, find the line corresponding to the soil type (from Step 6), and obtain the unit basin storage on the y-axis.
Unit Basin Storage UBS 15% =____________(inches)

Santa Clara Valley C.3 Stormwater Handbook Urban Runoff Pollution Prevention Program
IV. Treatment Control Sizing Criteria Attachment IV-1 – Page 7 FINAL F:\SC46\SC46.24\C.3. Guidance Manual\Final May 2004\Chapter 4\Attachment iv-1 sizing worksheets_May 2004.doc May 20, 2004
Attachment IV-1 Sizing for Volume-Based Treatment Controls
Section B —Adapted California Stormwater BMP Handbook Approach (continued)
c) Slope > 1% and < 15%
Find the unit basin volumes for 1% and 15% using the techniques in Steps 8a and 8b and interpolate by appling a slope correction factor per the following formula:
UBSx= Unit Basin Storage of intermediate slope, x
Unit Basin Storage volume =____________(inches)
(corrected for slope of site)
9. Size the BMP, using the following equation:
BMP Volume = Rain Gage Correction Factor * Unit Basin Storage Volume * Drainage Area
BMP Volume = (Step 5) * (Step 8 unit storage) * (Step 1 Drainage area) * 1 foot/12 in.
BMP Volume = _____ acre-feet
UBSx = UBS1% + (UBS15% - UBS1 )*(x-1) / (15% -1%) = (Step 8a) + (Step 8b- Step 8a) * (x-1)/15%-1%)

Santa Clara Valley C.3 Stormwater Handbook Urban Runoff Pollution Prevention Program
IV. Treatment Control Sizing Criteria Attachment IV-1 – Page 8 FINAL F:\SC46\SC46.24\C.3. Guidance Manual\Final May 2004\Chapter 4\Attachment iv-1 sizing worksheets_May 2004.doc May 20, 2004
III. Sizing for Flow-based Treatment Controls The SCVURPPP permit allows three methods for sizing flow-based treatment measures—the Factored Flood Flow Method (10% of the 50-year peak flow rate); the California BMP Handbook Method (the flow produced by a rain event equal to at least 2 times the 85th percentile hourly rainfall intensity); or the Uniform Intensity Method (the flow produced by a rain event equal to at least 0.2 inches/hour intensity). Tables 3a and 3b are utilized in each of the three methods.
Table 3a – Estimated Runoff Coefficients for Various Surfaces During Small Storms (CDM, 2003)
Surface Runoff Coefficient (C Factor)
Concrete 0.80 Asphalt 0.70 Pervious Concrete 0.60 Cobbles 0.60 Pervious Asphalt 0.55 Natural Stone (without grout) 0.25 Turf Block 0.15 Brick (without grout) 0.13 Unit Pavers on Sand 0.10 Crushed Aggregate 0.10 Grass 0.10 Roofs (from WEF/ASCE, 1992) 0.75
Notes: The above C-factors were estimated by selecting the lower range of the best available C-factor for each paving surface. These C-factors are only appropriate for small storm treatment BMP design, and should not be used for flood control sizing. Where available, locally developed small storm C-factors for various surfaces should be used.
Table 3b – Estimated Composite Runoff Coefficients for Small Storms by Land Use (WEF/ASCE, 2003)
Description of Area Runoff Coefficient (C Factor)
Business: Neighborhood Downtown
0.50 0.70
Residential: Single Family Multi-unit, detached Apartment Multi-unit, attached
0.30 0.40 0.50 0.60
Industrial: Light Heavy
0.50 0.60
Parks, cemeteries 0.10 Playgrounds 0.20 Unimproved 0.10
Notes: The above C-factors were estimated by selecting the lower range of the runoff coefficients listed for various land uses in WEF/ASCE, 1992. Where available, locally developed small storm C-factors for various land uses should be applied.
Santa Clara Valley C.3 Stormwater Handbook Urban Runoff Pollution Prevention Program
IV. Treatment Control Sizing Criteria Attachment IV-1 – Page 9 FINAL F:\SC46\SC46.24\C.3. Guidance Manual\Final May 2004\Chapter 4\Attachment iv-1 sizing worksheets_May 2004.doc May 20, 2004
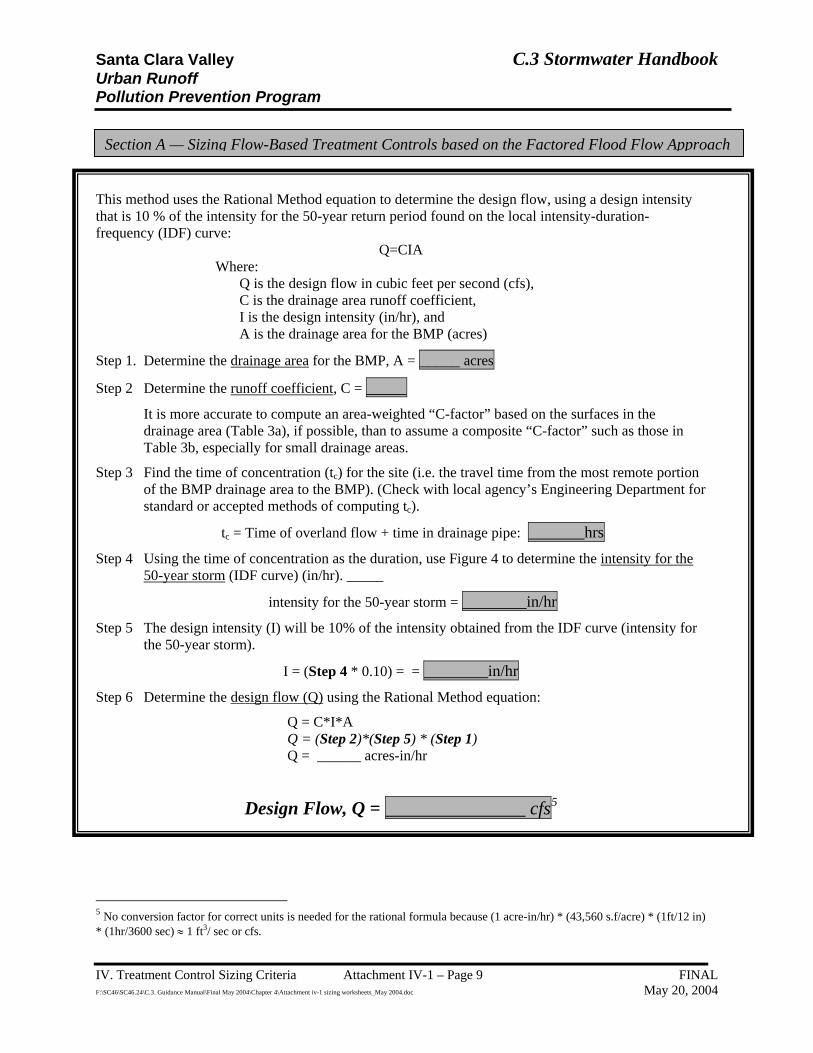
This method uses the Rational Method equation to determine the design flow, using a design intensity that is 10 % of the intensity for the 50-year return period found on the local intensity-duration-frequency (IDF) curve:
Q=CIA Where:
Q is the design flow in cubic feet per second (cfs), C is the drainage area runoff coefficient, I is the design intensity (in/hr), and A is the drainage area for the BMP (acres)
Step 1. Determine the drainage area for the BMP, A = _____ acres
Step 2 Determine the runoff coefficient, C = _____
It is more accurate to compute an area-weighted “C-factor” based on the surfaces in the drainage area (Table 3a), if possible, than to assume a composite “C-factor” such as those in Table 3b, especially for small drainage areas.
Step 3 Find the time of concentration (tc) for the site (i.e. the travel time from the most remote portion of the BMP drainage area to the BMP). (Check with local agency’s Engineering Department for standard or accepted methods of computing tc).
tc = Time of overland flow + time in drainage pipe: _______hrs
Step 4 Using the time of concentration as the duration, use Figure 4 to determine the intensity for the 50-year storm (IDF curve) (in/hr). _____
intensity for the 50-year storm = ________in/hr
Step 5 The design intensity (I) will be 10% of the intensity obtained from the IDF curve (intensity for the 50-year storm).
I = (Step 4 * 0.10) = = ________in/hr
Step 6 Determine the design flow (Q) using the Rational Method equation:
Q = C*I*A Q = (Step 2)*(Step 5) * (Step 1) Q = ______ acres-in/hr
Design Flow, Q = _______________ cfs5
5 No conversion factor for correct units is needed for the rational formula because (1 acre-in/hr) * (43,560 s.f/acre) * (1ft/12 in) * (1hr/3600 sec) ≈ 1 ft3/ sec or cfs.
Section A — Sizing Flow-Based Treatment Controls based on the Factored Flood Flow Approach

Santa Clara Valley C.3 Stormwater Handbook Urban Runoff Pollution Prevention Program
IV. Treatment Control Sizing Criteria Attachment IV-1 – Page 10 FINAL F:\SC46\SC46.24\C.3. Guidance Manual\Final May 2004\Chapter 4\Attachment iv-1 sizing worksheets_May 2004.doc May 20, 2004
Attachment IV-1 Sizing for Flow-Based Treatment Controls
This method uses the Rational Method equation to determine the design flow, using a design intensity that is 10 % of the intensity for the 50-year return period found on the local intensity-duration-frequency (IDF) curve:
Q=CIA
Where: Q = the design flow in cubic feet per second (cfs), C = the drainage area runoff coefficient, I = the design intensity (in/hr), and A = the drainage area for the BMP (acres)
Step 1. Determine the drainage area for the BMP, A = _____ acres
Step 2 Determine the runoff coefficient, C = _____
It is more accurate to compute an area-weighted “C-factor” based on the surfaces in the drainage area (Table 3a), if possible, than to assume a composite “C-factor” such as those in Table 3b, especially for small drainage areas.
Step 3. Determine from Figure 1 the mean annual precipitation (MAPsite) at the project site location: (see Section II. Step 4 for more explanation.)
MAPsite = _____inches
Step 4 Identify the reference rain gage closest to the project site from the following list and record the MAPgage:
MAPgage = _____inches
Reference Rain Gages
Mean Annual Precipitation (MAPgage)
(in) San Jose Airport 13.9
Palo Alto 13.7 Gilroy 18.2
Morgan Hill 19.5
Step 5 Determine the rain gage correction factor for the precipitation at the site using the information from Step 3 and Step 4.
Correction Factor = MAPsite /MAPgage = (Step 3)/(Step 4)
Correction Factor = ____________
Section B—Sizing Flow-Based Treatment Controls based on the California Stormwater BMP Handbook Flow Approach

Santa Clara Valley C.3 Stormwater Handbook Urban Runoff Pollution Prevention Program
IV. Treatment Control Sizing Criteria Attachment IV-1 – Page 11 FINAL F:\SC46\SC46.24\C.3. Guidance Manual\Final May 2004\Chapter 4\Attachment iv-1 sizing worksheets_May 2004.doc May 20, 2004
Attachment IV-1 Sizing for Flow-Based Treatment Controls
Section B—California Stormwater BMP Handbook Flow Approach (continued) Step 6 Select the design intensity, I, for the reference gage closest to the site from the following list:
I, Design Rainfall Intensity = _____________ in/hour
Gages 85th Percentile Hourly Rainfall Intensity
(in/hr)
Design Rainfall Intensity
(I) (in/hr)
San Jose Airport 0.087 0.17
Palo Alto 0.096 0.19
Gilroy 0.11 0.21
Morgan Hill 0.12 0.24
The design intensity is twice the 85th percentile Hourly Rainfall Intensity.
7. Determine the corrected design rainfall intensity (I) for the site:
Design intensity (site) = Correction factor * Design rainfall intensity for closest rain gage
Design intensity (site) = (Step 5) * (Step 6) = ___________
9. Determine the design flow (Q) using the Rational Method equation:
Q = C*I*A
Q = (Step 2) * (Step 7) * (Step 1)
Q = ______ acres-in
Q = _____________cfs6
6 No conversion factor for correct units is needed for the rational formula because (1 acre-in/hr) * (43,560 sq.ft/acre) * (1ft/12 in) * (1hr/3600 sec) ≈ 1 ft3/ sec or cfs.

Santa Clara Valley C.3 Stormwater Handbook Urban Runoff Pollution Prevention Program
IV. Treatment Control Sizing Criteria Attachment IV-1 – Page 12 FINAL F:\SC46\SC46.24\C.3. Guidance Manual\Final May 2004\Chapter 4\Attachment iv-1 sizing worksheets_May 2004.doc May 20, 2004
Attachment IV-1 Sizing for Flow-Based Treatment Controls
This method uses the Rational Method equation:
Q=CIA
Where:
Q is the design flow in cubic feet per second (cfs), C is the drainage area runoff coefficient, I is the design intensity (in/hr), and A is the drainage area for the BMP (acres)
Step 1. Determine the drainage area for the BMP, A = _____ acres
Step 2 Determine the runoff coefficient, C = _____
It is more accurate to compute an area-weighted “C-factor” based on the surfaces in the drainage area (Table 3a), if possible, than to assume a composite “C-factor” such as those in Table 3b, especially for small drainage areas.
Step 3 Use a design intensity of 0.2 in/hr for “I” in the Q=CIA equation.
I = __0.2 in/hour___
Step 4 Determine the design flow (Q) using Q = CIA
Q = C*I*A
Q = (Step 2) * (0.2 in/hr) * (Step 1)
Q = ______ acres-in/hr
Design Flow, Q = __________cfs7
7 No conversion factor for correct units is needed for the rational formula because (1 acre-in/hr) * (43,560 sq.ft/acre) * (1ft/12 in) * (1hr/3600 sec) ≈ 1 ft3/ sec or cfs.
Section C.—Sizing Flow-Based Treatment Controls based on the Uniform Intensity Approach

�
�
�
���������
���������������
��������� �
�������
���������
�� �����
�����������
�������
��������
������������ �� � ��
���� ��
�������
����������
��
��
��
��
����
��
��
��
��
��
��
������
������
��
���������������������
������������
��� ����������������������������
��������������
���� � �
���� ��
��� � �
���� � �
��� � ��� �
��� �
��� �
��� � �
�������������������
���
����
����
�������
������
����
�������������
����!��
����
���������������
�����
���������
����������
���
�������
�������������
�������
����
�������
����
"��
�����
����
���#�
�����
������
���
���������
��� !"#!� $�% ��"��&'�(� $�%
�!") �*� $�%
&")�+,!�
$�%
�*'�-!"� $�%
����./)&*�
$�%
�� �)
&+���
0
�� �)&+���&(���)&(��-
�� �)&+���,""%0�*!��-
��%���1
�&&)2/**� $.�%
�*'���)
*���'/"&��!�*
'3� #�-! &��
)
� �() �-!
&��-
���������������������� �������������������������������
�������������������������������������
����!���������"���!�������
��!���
#�����"������#�����"�����#����������!���������������
�����$%�����& ���'!�������������(�����
��������'���)�
����(���
����������*������������������+������������ ���!�������,--.
- / , 0 . 1 ����
�
�/+, !���&/*��!$), !��"-�!�"�
�"",�*�� !#/./)�)/&"�4!.)2(�5& �)2!���")���*� ����(/"

Santa Clara Valley C.3 Stormwater Handbook Urban Runoff Pollution Prevention Program
IV. Treatment Control Sizing Criteria Attachment IV-1 – Page 14 FINAL DRAFT F:\SC46\SC46.24\C.3. Guidance Manual\Final May 2004\Chapter 4\Attachment iv-1 sizing worksheets_May 2004.doc April 2004
0.0
0.1
0.2
0.3
0.4
0.5
0.6
0.7
0.8
0.9
1.0
1.1
0% 10% 20% 30% 40% 50% 60% 70% 80% 90% 100%% Imperviousness
Uni
t Bas
in S
tora
ge fo
r 80%
Cap
ture
(inc
h)
SAN JOSE AIRPORT RAIN GAGEASSUMED SLOPE = 1%
LOAM/SILT LOAM (B)
CLAY (D)
CLAY LOAM (D)SANDY CLAY (D)
Figure 2-A Unit Basin Volume for 80% Capture - San Jose Airport Rain Gage

Santa Clara Valley C.3 Stormwater Handbook Urban Runoff Pollution Prevention Program
IV. Treatment Control Sizing Criteria Attachment IV-1 – Page 15 FINAL DRAFT F:\SC46\SC46.24\C.3. Guidance Manual\Final May 2004\Chapter 4\Attachment iv-1 sizing worksheets_May 2004.doc April 2004
0.0
0.1
0.2
0.3
0.4
0.5
0.6
0.7
0.8
0.9
1.0
1.1
0% 10% 20% 30% 40% 50% 60% 70% 80% 90% 100%% Imperviousness
Uni
t Bas
in S
tora
ge fo
r 80%
Cap
ture
(inc
h)
PALO ALTO RAIN GAGEASSUMED SLOPE = 1%
LOAM/SILT LOAM (B)
CLAY (D)
CLAY LOAM (D)
SANDY CLAY (D)
Figure 2-B Unit Basin Volume for 80% Capture - Palo Alto Rain Gage

Santa Clara Valley C.3 Stormwater Handbook Urban Runoff Pollution Prevention Program
IV. Treatment Control Sizing Criteria Attachment IV-1 – Page 16 FINAL DRAFT F:\SC46\SC46.24\C.3. Guidance Manual\Final May 2004\Chapter 4\Attachment iv-1 sizing worksheets_May 2004.doc April 2004
UNIT BASIN STORAGE FOR 80% CAPTURE FOR VARIOUS SOIL TYPES AND IMPERVIOUSNESS
0.0
0.1
0.2
0.3
0.4
0.5
0.6
0.7
0.8
0.9
1.0
1.1
0% 10% 20% 30% 40% 50% 60% 70% 80% 90% 100%% Imperviousness
Uni
t Bas
in S
tora
ge fo
r 80%
Cap
ture
(inc
h)
GILROY RAIN GAGEASSUMED SLOPE = 1%
LOAM/SILT LOAM (B)
CLAY (D)
CLAY LOAM (D)
SANDY CLAY (D)
Figure 2-C Unit Basin Volume for 80% Capture - Gilroy Rain Gage

Santa Clara Valley C.3 Stormwater Handbook Urban Runoff Pollution Prevention Program
IV. Treatment Control Sizing Criteria Attachment IV-1 – Page 17 FINAL DRAFT F:\SC46\SC46.24\C.3. Guidance Manual\Final May 2004\Chapter 4\Attachment iv-1 sizing worksheets_May 2004.doc April 2004
0.0
0.1
0.2
0.3
0.4
0.5
0.6
0.7
0.8
0.9
1.0
1.1
0% 10% 20% 30% 40% 50% 60% 70% 80% 90% 100%% Imperviousness
Uni
t Bas
in S
tora
ge fo
r 80%
Cap
ture
(inc
h)
MORGAN HILL RAIN GAGEASSUMED SLOPE = 1%
SILT LOAM (B)
CLAY (D)
CLAY LOAM (D)
SANDY CLAY (D)
LOAM (B)
Figure 2-D Unit Basin Volume for 80% Capture - Morgan Hill Rain Gage

Santa Clara Valley C.3 Stormwater Handbook Urban Runoff Pollution Prevention Program
IV. Treatment Control Sizing Criteria Attachment IV-1 – Page 18 FINAL DRAFT F:\SC46\SC46.24\C.3. Guidance Manual\Final May 2004\Chapter 4\Attachment iv-1 sizing worksheets_May 2004.doc April 2004
0.0
0.1
0.2
0.3
0.4
0.5
0.6
0.7
0.8
0.9
1.0
1.1
0% 10% 20% 30% 40% 50% 60% 70% 80% 90% 100%% Imperviousness
Uni
t Bas
in S
tora
ge fo
r 80%
Cap
ture
(inc
h)
SAN JOSE AIRPORT RAIN GAGEASSUMED SLOPE = 15%
LOAM/SILT LOAM (B)
CLAY (D)
CLAY LOAM (D)
SANDY CLAY (D)
Figure 3-A Unit Basin Volume for 80% Capture - San Jose Airport Rain Gage

Santa Clara Valley C.3 Stormwater Handbook Urban Runoff Pollution Prevention Program
IV. Treatment Control Sizing Criteria Attachment IV-1 – Page 19 FINAL DRAFT F:\SC46\SC46.24\C.3. Guidance Manual\Final May 2004\Chapter 4\Attachment iv-1 sizing worksheets_May 2004.doc April 2004
0.0
0.1
0.2
0.3
0.4
0.5
0.6
0.7
0.8
0.9
1.0
1.1
0% 10% 20% 30% 40% 50% 60% 70% 80% 90% 100%% Imperviousness
Uni
t Bas
in S
tora
ge fo
r 80%
Cap
ture
(inc
h)
PALO ALTO RAIN GAGEASSUMED SLOPE = 15%
LOAM/SILT LOAM (B)
CLAY (D)
CLAY LOAM (D)
SANDY CLAY (D)
Figure 3-B Unit Basin Volume for 80% Capture - Palo Alto Rain Gage

Santa Clara Valley C.3 Stormwater Handbook Urban Runoff Pollution Prevention Program
IV. Treatment Control Sizing Criteria Attachment IV-1 – Page 20 FINAL DRAFT F:\SC46\SC46.24\C.3. Guidance Manual\Final May 2004\Chapter 4\Attachment iv-1 sizing worksheets_May 2004.doc April 2004
0.0
0.1
0.2
0.3
0.4
0.5
0.6
0.7
0.8
0.9
1.0
1.1
0% 10% 20% 30% 40% 50% 60% 70% 80% 90% 100%% Imperviousness
Uni
t Bas
in S
tora
ge fo
r 80%
Cap
ture
(inc
h)
GILROY RAIN GAGEASSUMED SLOPE = 15%
LOAM/SILT LOAM (B)
CLAY (D)
CLAY LOAM (D)
SANDY CLAY (D)
Figure 3-C Unit Basin Volume for 80% Capture - Gilroy Rain Gage

Santa Clara Valley C.3 Stormwater Handbook Urban Runoff Pollution Prevention Program
IV. Treatment Control Sizing Criteria Attachment IV-1 – Page 21 FINAL DRAFT F:\SC46\SC46.24\C.3. Guidance Manual\Final May 2004\Chapter 4\Attachment iv-1 sizing worksheets_May 2004.doc April 2004
0.0
0.1
0.2
0.3
0.4
0.5
0.6
0.7
0.8
0.9
1.0
1.1
0% 10% 20% 30% 40% 50% 60% 70% 80% 90% 100%% Imperviousness
Uni
t Bas
in S
tora
ge fo
r 80%
Cap
ture
(inc
h)
MORGAN HILL RAIN GAGEASSUMED SLOPE = 15%
SILT LOAM (B)
CLAY (D)
CLAY LOAM (D)
SANDY CLAY (D)
LOAM (B)
Figure 3-D Unit Basin Volume for 80% Capture - Morgan Hill Rain Gage

Santa Clara Valley C.3 Stormwater Handbook Urban Runoff Pollution Prevention Program
IV. Treatment Control Sizing Criteria Attachment IV-1 – Page 22 FINAL DRAFT F:\SC46\SC46.24\C.3. Guidance Manual\Final May 2004\Chapter 4\Attachment iv-1 sizing worksheets_May 2004.doc April 2004
0.1
1
10
0.1 1 10Duration (hr)
Inte
nsity
(in/
hr)
Haskins Ranch - 24.44 in/yrShanti Ashrama - 20.46 in/yrMaryknoll - 16.74 in/yrSan Jose - 13.72 in/yr
Figure 4 Intensity-Frequency-Duration Curves for a 50-Year Return Period for Haskins Ranch, Shanti
Ashrama, Maryknoll, and San Jose Airport Rain Gages
Haskins Ranch
San Jose Airport
Shanti Ashrama And Maryknoll

C.3. Stormwater Handbook
IV. Treatment Control Sizing Criteria Attachment IV- 2 FINAL F:\SC46\SC46.24\C.3. Guidance Manual\Final May 2004\Chapter 4\Attachment iv-2 FLY_May 2004.doc May 2004
ATTACHMENT IV-2
Example Completed Worksheets Single-Family Subdivision
Santa Clara Valley Urban Runoff Pollution Prevention Program

Santa Clara Valley C.3 Stormwater Handbook Urban Runoff Pollution Prevention Program
IV. Treatment Control Sizing Criteria Attachment IV-2 � Page 1 FINAL F:\SC46\SC46.24\C.3. Guidance Manual\Final May 2004\Chapter 4\Attachment iv-2 completed worksheets_May 2004.doc May 20, 2004
Attachment IV-2 Residential Example Problems
Single-Family Subdivision
The following are examples of how to size treatment controls using the Sizing Criteria Worksheets (Attachment IV-1) as well as all of the figures and tables that can be found in Chapter IV of the C.3 Handbook. These examples demonstrate the calculations for sizing possible BMPs at an actual development site, a proposed single-family subdivision in the southeast end of the City of Santa Clara. It should be noted that the examples demonstrate how to size BMPs for two different components of the project: the paved public areas of the project in this case streets and the single family homes. In this example both types are needed for the project to comply. The conditions and results for the two analyses are summarized below.
Given: 10-acre (435,600 ft2) single-family subdivision with the following: 1-acre (43,560 ft2) proposed city park 131,040 square feet (30%) of pavement (paved public streets) 87 residences with:
� 3,000 square feet per lot (261,000 ft2) � 130,500 square feet (50%) of rooftops � 39,150 square feet (15%) of walkways (includes patio areas) � 1% slope on-site
Example 1: Sizing for Volume-Based Controls
• Pavement (paved public streets) drain to one BMP • Sizing for Volume-Based Controls
Example 2: Sizing for Flow-Based Controls
• Rooftop and walkway runoff for each lot drains to individual onsite BMPs • Sizing for Flow-Based Controls
Table of Results
Example BMP Size Comments
1. Volume-Based 7,629 cubic feet All public streets/sidewalks drain to one BMP
2. Flow-Based 0.0094 cfs (4.2 gal/min) Each lot drains to individual onsite BMP

Santa Clara Valley C.3 Stormwater Handbook Urban Runoff Pollution Prevention Program
IV. Treatment Control Sizing Criteria Attachment IV-2 � Page 2 FINAL F:\SC46\SC46.24\C.3. Guidance Manual\Final May 2004\Chapter 4\Attachment iv-2 completed worksheets_May 2004.doc May 20, 2004
This example demonstrates use of the CA Stormwater BMP Handbook Volume Approach. Given: 10-acre (435,600 ft2) single-family subdivision with the following:
1-acre (43,560 ft2) proposed city park 131,040 square feet (30%) of pavement (paved public streets) 87 residences with:
-3,000 square feet per lot (261,000 ft2) -130,500 square feet (50%) of rooftops -39,150 square feet (15%) of walkways (includes patio areas)
1% slope on-site
All pavement runoff drains to BMP, excluding lot areas
Task: Determine BMP volume required to effectively detain and treat stormwater runoff from pavement areas.
Step 1: Determine the drainage area for the BMP (A) Total Drainage Area to BMP = A
= Total Area �Areas draining to individual BMPs on each lot = 435,600 ft2 � 261,000 ft2 (lot area)
= 174,600 ft2
Step 2: Determine percent imperiousness of the drainage area. a. Estimate the amount of impervious surface (rooftops, hardscape, streets, and sidewalks, etc.)
in the area draining to the BMP. Total Impervious Area = Pavement Area
= 131,000 ft2
b. % impervious area = (amount of impervious area/drainage area for the BMP)*100 = (Step 2a/Step 1)*100
= (131,040 ft2/174,600 ft2)*100
= 75%
Step 3: Determine from Figure 2 the mean annual precipitation (MAP) at the project site location. The subdivision is located between the isopleths with values of 14 and 15. A value of 14.9 is estimated from the figure.
MAPsite = 14.9 inches
Step 4: Identify the rain gage closest to the project site from the following list:
San Jose Airport MAPgage = 13.9 in
Example 1: Sizing for Volume-Based Controls
Santa Clara Valley C.3 Stormwater Handbook Urban Runoff Pollution Prevention Program
IV. Treatment Control Sizing Criteria Attachment IV-2 � Page 3 FINAL F:\SC46\SC46.24\C.3. Guidance Manual\Final May 2004\Chapter 4\Attachment iv-2 completed worksheets_May 2004.doc May 20, 2004
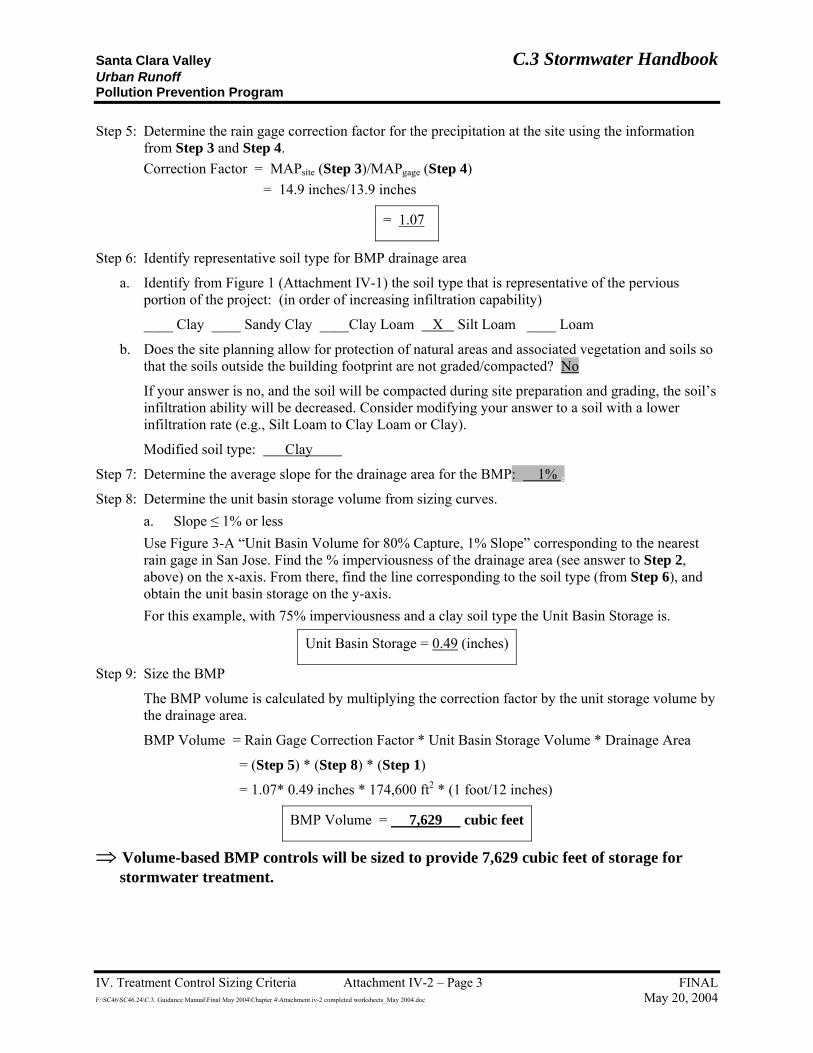
Step 5: Determine the rain gage correction factor for the precipitation at the site using the information from Step 3 and Step 4. Correction Factor = MAPsite (Step 3)/MAPgage (Step 4)
= 14.9 inches/13.9 inches
= 1.07
Step 6: Identify representative soil type for BMP drainage area
a. Identify from Figure 1 (Attachment IV-1) the soil type that is representative of the pervious portion of the project: (in order of increasing infiltration capability)
____ Clay ____ Sandy Clay ____Clay Loam X Silt Loam ____ Loam
b. Does the site planning allow for protection of natural areas and associated vegetation and soils so that the soils outside the building footprint are not graded/compacted? No
If your answer is no, and the soil will be compacted during site preparation and grading, the soil�s infiltration ability will be decreased. Consider modifying your answer to a soil with a lower infiltration rate (e.g., Silt Loam to Clay Loam or Clay).
Modified soil type: Clay .
Step 7: Determine the average slope for the drainage area for the BMP: 1% .
Step 8: Determine the unit basin storage volume from sizing curves. a. Slope ≤ 1% or less Use Figure 3-A �Unit Basin Volume for 80% Capture, 1% Slope� corresponding to the nearest rain gage in San Jose. Find the % imperviousness of the drainage area (see answer to Step 2, above) on the x-axis. From there, find the line corresponding to the soil type (from Step 6), and obtain the unit basin storage on the y-axis. For this example, with 75% imperviousness and a clay soil type the Unit Basin Storage is.
Unit Basin Storage = 0.49 (inches)
Step 9: Size the BMP
The BMP volume is calculated by multiplying the correction factor by the unit storage volume by the drainage area.
BMP Volume = Rain Gage Correction Factor * Unit Basin Storage Volume * Drainage Area
= (Step 5) * (Step 8) * (Step 1)
= 1.07* 0.49 inches * 174,600 ft2 * (1 foot/12 inches)
BMP Volume = 7,629 cubic feet
⇒ Volume-based BMP controls will be sized to provide 7,629 cubic feet of storage for stormwater treatment.

Santa Clara Valley C.3 Stormwater Handbook Urban Runoff Pollution Prevention Program
IV. Treatment Control Sizing Criteria Attachment IV-2 � Page 4 FINAL F:\SC46\SC46.24\C.3. Guidance Manual\Final May 2004\Chapter 4\Attachment iv-2 completed worksheets_May 2004.doc May 20, 2004
This example is demonstrates use of the California Stormwater BMP Handbook Flow Approach. Given: 10-acre (435,600 ft2) single-family subdivision with the following:
1-acre (43,560 ft2) proposed city park 131,040 square feet (30%) of public streets 87 residences with:
3,000 square feet per lot (261,000 ft2) 1,500 square feet per lot (50%) of rooftops 450 square feet per lot (15%) of walkways (includes patio areas)
1% slope on-site All runoff drains to BMPs on individual lots
Task: To determine the BMP flow required to effectively treat stormwater runoff.
Step 1. Determine the drainage area for the BMP (A) Total Drainage Area to BMP = 3,000 ft2 =
0.0689 acres
Step 2a: Estimate the amount of impervious surface (rooftops, hardscape, streets, and sidewalks, etc.) in the area draining to the BMP. Total Impervious Area = Roof Area + Walkway Area
= 1,500 ft2 + 450 ft2
= 1,950 ft2
Note: Although each individual lot does not exceed 43,560 ft2 (or 1 acre); the combination of impervious area in the 87 units in the subdivision does trigger BMP requirements. In this exercise, the individual lot BMP is being sized.
Step 2b: Determine the watershed runoff coefficient, C from the Tables 5a. and 5.b. in the C.3 Handbook. From these tables, roofs and concrete were selected as the character of the impervious surfaces. A runoff coefficient of 0.75 was assumed for both surfaces (since the roof area is the majority of the impervious surface).
C = 0.75
Step 4: Determine from the figure in Attachment V-3 of the C.3 Manual the mean annual precipitation (MAP) at the project site location. The subdivision is located between the isopleths with values of 14 and 15. A value of 14.9 is estimated from the figure.
MAPsite = 14.9 inches
Step 5: Determine the mean annual rainfall at the gage closest to the site:
San Jose Airport MAPgage = 13.9 in
Example 2: Sizing for Flow-Based Controls

Santa Clara Valley C.3 Stormwater Handbook Urban Runoff Pollution Prevention Program
IV. Treatment Control Sizing Criteria Attachment IV-2 � Page 5 FINAL F:\SC46\SC46.24\C.3. Guidance Manual\Final May 2004\Chapter 4\Attachment iv-2 completed worksheets_May 2004.doc May 20, 2004
Step 6: Determine the rain gage correction factor for the precipitation at the site using the information from Step 4 and Step 5.
Correction Factor = MAPsite (Step 4)/MAPgage (Step 5)
Correction Factor = 14.9 inches/13.9 inches
= 1.07
Step 7: Identify the gage closest to the site from the following list to determine I, the design intensity:
Gages 85th Percentile Hourly Rainfall Intensity
(in/hr)
Design Rainfall Intensity (I)
(in/hr) San Jose Airport 0.087 0.17
Palo Alto 0.096 0.19 Gilroy 0.11 0.21
Morgan Hill 0.12 0.24
Step 8. Determine the corrected design rainfall intensity (I) for the site:
Design intensity (site) = Correction factor * Design rainfall intensity for closest rain gage
= (Step 6) * (Step 7)
= 1.07 * (0.17 inches/hour)
= 0.182 inches/hour
Step 9. Determine the design flow (Q) using the Rational Method equation
Q = C*I*A
Q = (Step 3) * (Step 8) * (Step 1)
Q = (0.75) * (0.182in/hr) * (0.0689 acres)
Q = 0.0094 cfs (4.2 gallons per minute)
⇒ Flow-based BMP controls will be sized to treat a flow of 0.0094 cfs of stormwater for each lot.