Embed Size (px)
Citation preview
PNL- 10704 UC-606
WASTE TANK VAPOR PROGRAM
Vapor Space Characterization of Waste Tank 241-B-103: Results from Samples Collected on 2/8/95
M. W. Ligotke K. H. Pool R. B. Lucke B. D. McVeety G. S. Klinger T. W. Clauss K. B. Olson 0. P. Bredt J. S. Fruchter S. C. Goheen
October 1995
Prepared for Westinghouse Hanford Company under a Related Services Agreement with the U.S. Department of Energy Contract DE-AC06-76RLO 1830
Pacific Northwest Laboratory Richland, Washington 99352
DECLAIMER
Portions of this document may be illegibie electronic image products. Images are produced from the best avaiiabie original document.
Summary
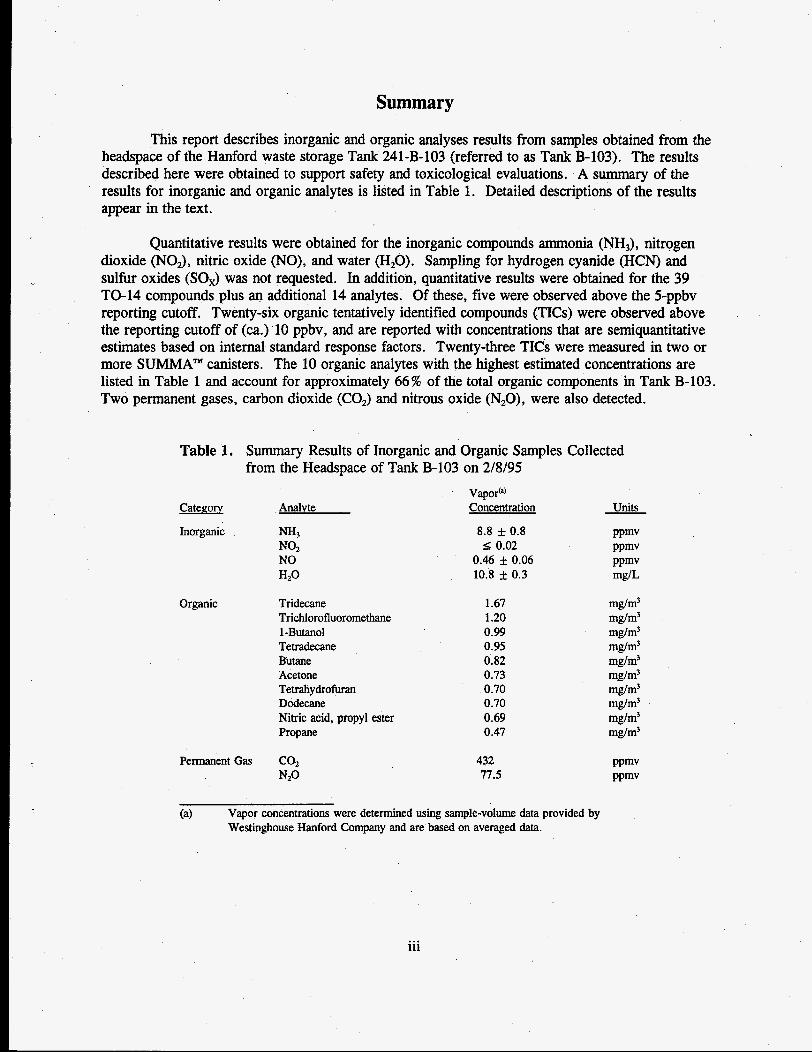
This report describes inorganic and organic analyses results from samples obtained from the headspace of the Hanford waste storage Tank 241-B-103 (referred to as Tank B-103). The results described here were obtained to support safety and toxicological evaluations. A summary of the results for inorganic and organic analytes is listed in Table 1. Detailed descriptions of the results appear in the text.
Quantitative results were obtained for the inorganic compounds ammonia (NH,), nitrogen dioxide (Noh, nitric oxide (NO), and water (H,O). Sampling for hydrogen cyanide (HCN) and sulfur oxides (SO,) was not requested. In addition, quantitative results were obtained for the 39 TO-14 compounds plus an additional 14 analytes. Of these, five were observed above the 5-ppbv reporting cutoff. Twenty-six organic tentatively identified compounds (TICs) were observed above the reporting cutoff of (ca.) 10 ppbv, and are reported with concentrations that are semiquantitative estimates based on internal standard response factors. Twenty-three TICs were measured in two or more SUMMA" canisters. The 10 organic analytes with the highest esthated concentrations are listed in Table 1 and account for approximately 66% of the total organic components in Tank B-103. Two permanent gases, carbon dioxide (CO,) and nitrous oxide (N,O), were also detected.
Table 1. Summary Results of Inorganic and Organic Samples Collected from the Headspace of Tank B-103 on 2/8/95
Category
Inorganic
Organic
Vapor@) Analvte Concentration
Tridecane Tr ichlorofluoromethane
Tetradecane Butane Acetone Tetrahydrofuran Dodecane Nitric acid, propyl ester Propane
l-BUtanOl
Permanent Gas CO, N20
8.8 f 0.8 5 0.02
0.46 * 0.06 10.8 f 0.3
1.67 1.20 0.99 0.95 0.82 0.73 0.70 0.70 0.69 0.47
432 77.5
Units
PPmv PPmv PPmv mg/L
mg/m3 mg/m3 mg/m3 mg/m3 mg/m3 mg/m3 mg/m3 mg/m3 mg/m3 mg/m3
(a) Vapor concentrations were determined using sample-volume data provided by Westinghouse Hanford Company and are based on averaged data.
iii

Acknowledgments
The authors gratefully acknowledge the support of other project staff at Pacific Northwest Laboratory who contributed to the successful completion of this sampling and analysis activity. Jeff Edwards served as the PNL single-point-of-contact and coordinated sample handling and communications with Westinghouse Hanford Company. Sally Slate, May-Lin Thomas, and Karen Schielke analyzed inorganic samples, and Gary Dennis prepared the solid-sorbent sample trains. Brenda M. Thornton provided word processing support.
V

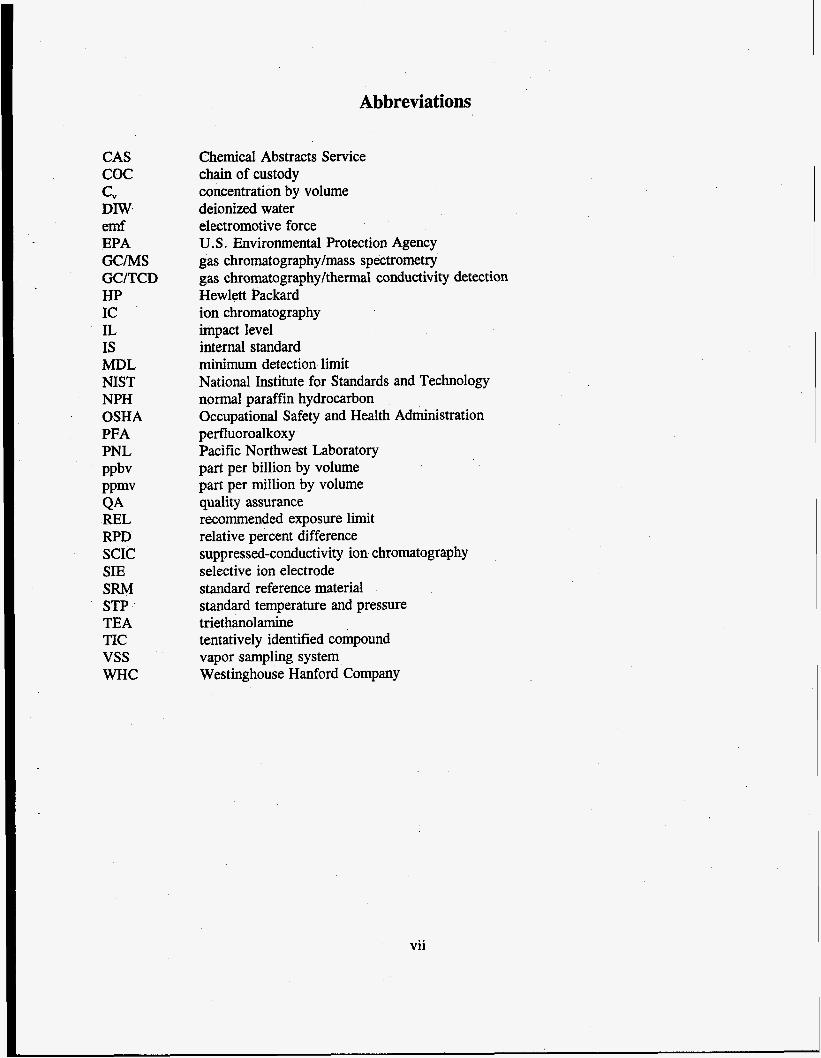
Abbreviations
CAS COC C" DIW. emf EPA GCMS GC/TCD HP IC IL IS MDL NIST NPH OSHA PFA PNL PPbV PPmv QA REL RPD SCIC SIE SRM STP TEA TIC vss WHC
Chemical Abstracts Service chain of custody concentration by volume deionized water electromotive force U.S. Environmental Protection Agency gas chromatography/mass spectrometry gas chrornatographykhermal conductivity detection Hewlett Packard ion chromatography impact level internal standard minimum detection limit National Institute for Standards and Technology normal paraffin hydrocarbon Occupational Safety and Health Administration per fluoroal koxy Pacific Northwest Laboratory part per billion by volume part per million by volume quality assurance recommended exposure limit relative percent difference suppressed-conductivity ion chromatography selective ion electrode standard reference material standard temperature and pressure triethanolamine tentatively identified compound vapor sampling system Westinghouse Hanford Company
vii

Contents
Summary . . . . . . . . . . . . . . . . . . . . . . . . . . . . . . . . . . . . . . . . . . . . . . . . . . . . . . . . iii
Acknowledgments . . . . . . . . . . . . . . . . . . . . . . . . . . . . . . . . . . . . . . . . . . . . . . . . . . . . v
Abbreviations . . . . . . . . . . . . . . . . . . . . . . . . . . . . . . . . . . . . . . . . . . . . . . . . . . . . . vii
1.0 Introduction . . . . . . . . . . . . . . . . . . . . . . . . . . . . . . . . . . . . . . . . . . . . . . . . . . . . . 1
2.0 Inorganic Task . . . . . . . . . . . . . . . . . . . . . . . . . . . . . . . . . . . . . . . . . . . . . . . . . . . 5 2.1 Standard Sampling Methodology . . . . . . . . . . . . . . . . . . . . . . . . . . . . . . . . . . . 5 2.2 Analytical Procedures . . . . . . . . . . . . . . . . . . . . . . . . . . . . . . . . . . . . . . . . . . 6 2.3 Quality Assurance/Quality Control . . . . . . . . . . . . . . . . . . . . . . . . . . . . . . . . . . 8 2.4 Inorganic Sample Results . . . . . . . . . . . . . . . . . . . . . . . . . . . . . . . . . . . . . . . . 9
3.0 Organic Task . . . . . . . . . . . . . . . . . . . . . . . . . . . . . . . . . . . . . . . . . . . . . . . . . . . 13 3.1 SUMMA” Canister Preparation . . . . . . . . . . . . . . . . . . . . . . . . . . . . . . . . . . 13 3.2 Sample Analysis Method . . . . . . . . . . . . . . . . . . . . . . . . . . . . . . . . . . . . . . . 13 3.3 Quality Assurance/Quality Control . . . . . . . . . . . . . . . . . . . . . . . . . . . . . . . . . 14 3.4 Analysis Results . . . . . . . . . . . . . . . . . . . . . . . . . . . . . . . . . . . . . . . . . . . . 16
. . . . . . . . . . . . . . . . . . . . . . . . . . . . . . . . . . . . . . . . . . . . . . . . . . . . . 4.0 Conclusions 19
. . . . . . . . . . . . . . . . . . . . . . . . . . . . . . . . . . . . . . . . . . . . . . . . . . . . . 5.0 References 21
6.0 Further Reading . . . . . . . . . . . . . . . . . . . . . . . . . . . . . . . . . . . . . . . . . . . . . . . . . 21
Distribution . . . . . . . . . . . . . . . . . . . . . . . . . . . . . . . . . . . . . . . . . . . . . . . . . . . . Dist . 1
ix
Tables
2.1
2.2
2.3
3.1
3.2
Analysis Procedures and Typical Detection Limits of Target Inorganic Analytes . . . . . . . . 8
List of PNL Inorganic Samples, Controls, and Gravimetric Results Obtained from a Heated Tube Inserted into the Headspace of Tank B-103 on 2/8/95 . . . . . . . . . . 10
Inorganic Vapor Sample Results Obtained from a Heated Tube Inserted into the Headspace of Tank B-103 on 2/8/95 . . . . . . . . . . . . . . . . . . . . . . . . . . . . . . . . . . 11
Positively Identified and Quanitated Target Organic Analytes of Samples Collected from the Headspace of Tank B-103 in SUMMA" Canisters on 2/8/95 . . . . . . . . . . . . . 22
Tentatively Identified Compounds and Estimated Concentrations of Samples from the Headspace of Tank B-103 in SUMMA" Canisters Collected on 2/8/95 . . . . . . . 24
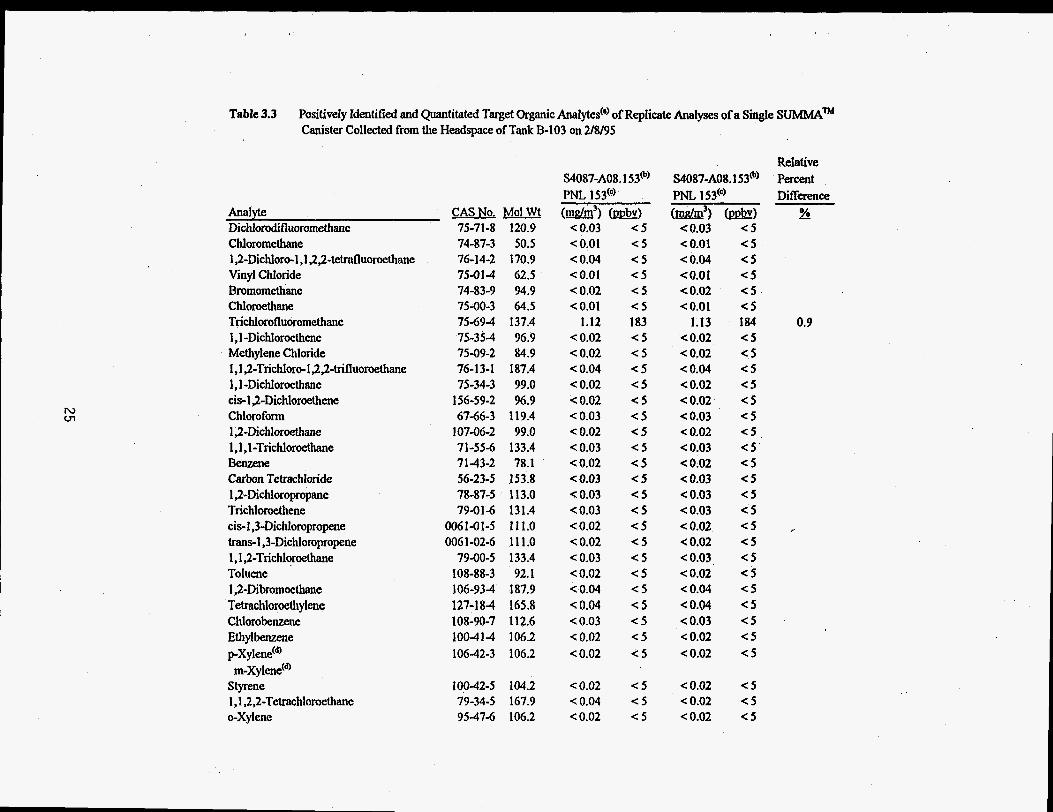
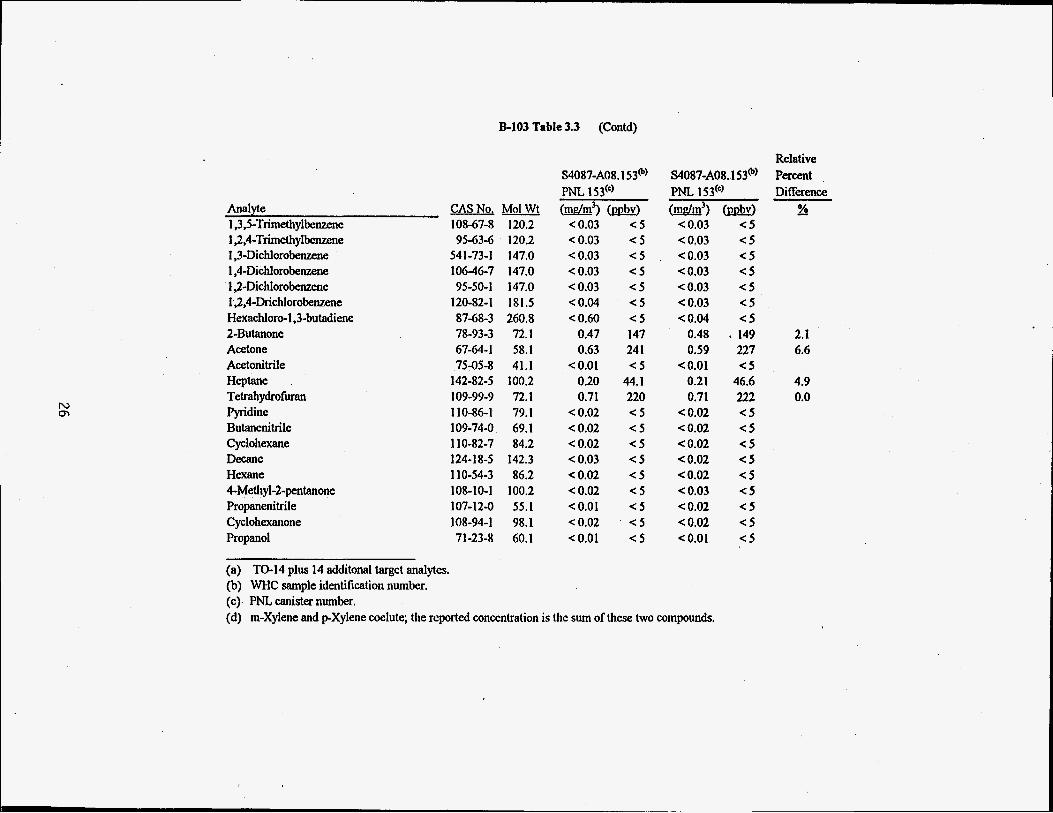
3.3 Positively Identified and Quantitated Target Organic Analytes of Replicate Analyses of Single SUMMA" Canister Collected from the Headspace of Tank B-103 on 2/8/95 . . . . . . . . . . . . . . . . . . . . . . . . . . . . . . . . . . . . . . . . . . . . . . . 25
3 .4
3.5
3.6
3.7
1.1
3.1
Tentatively Identified Compounds and Estimated Concentrations of Replicate Analyses of a Single SUMMA" Canister Collected from the Headspace of Tank B-103 on 2/8/95 . . . . . . . . . . . . . . . . . . . . . . . . . . . . . . . . . . . . . . . . . . . . . . . 27
Positively Identified and Quantitated Target Organic Analytes for Ambient Air Samples Collected Near Tank B-103 In SUMMA'" Canisters on 2/8/95 . . . . . . . . . . . 28
Tentatively Identified Compounds and Estimated Concentrations for Ambient Air Samples Collected Near Tank B-103 in SUMMA" Canisters on218195 . . . . . . . . . . . . . . . . . . . . . . . . . . . . . . . . . . . . . . . . . . . . . . . . . . . 29
Permanent Gas Analysis Results for Samples Collected from the Headspace of Tank B-103 and for Ambient Air Samples Collected Near Tank B-103 in SUMMA" Canisters on 2/8/95 . . . . . . . . . . . . . . . . . . . . . . . . 30
Chain-of-Custody for Tank B-103 . . . . . . . . . . . . . . . . . . . . . . . . . . . . . . . . . . . . . 2
Total Ion Chromatogram for Hanford Waste Tank B-103 SUMMA" Canister Sample S5OO3-AO9-225 Collected on 2/8/95 . . . . . . . . . . . . . . . . . . . . . . . . . . . . . . . . . . 3 1
X
1 .O Introduction
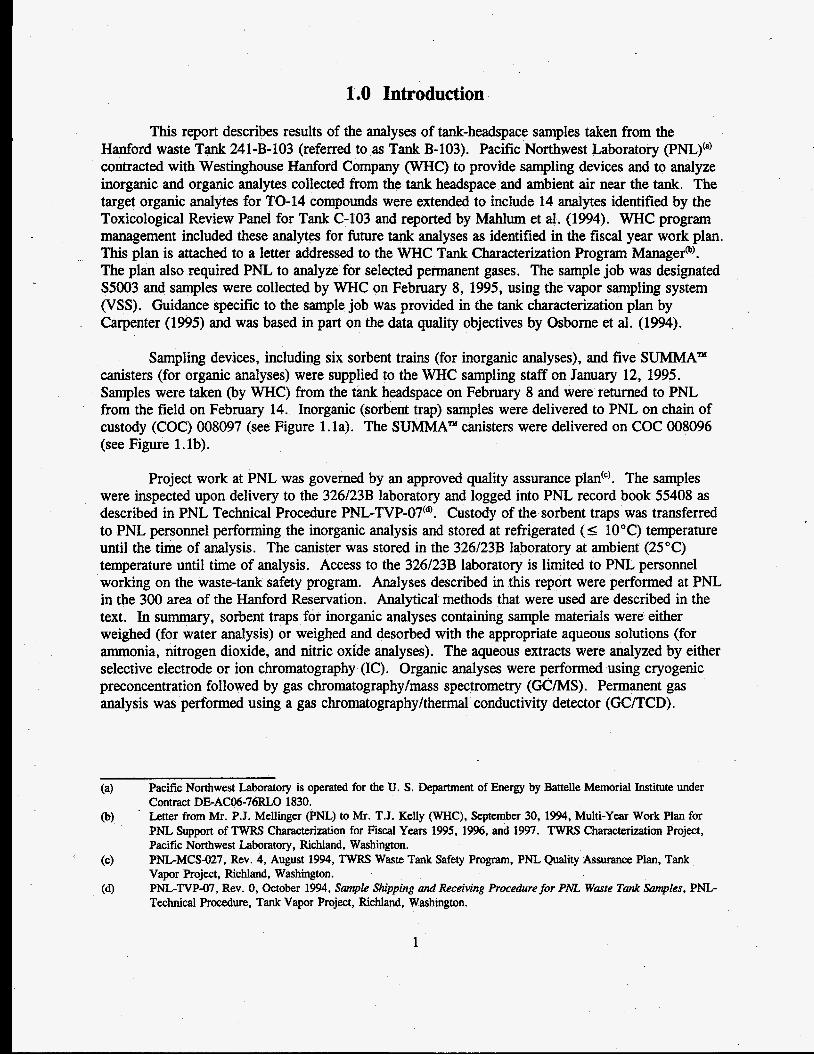
This report describes results of the analyses of tank-headspace samples taken from the Hanford waste Tank 241-B-103 (referred to as Tank B-103). Pacific Northwest Laboratory (PNL)'") contracted with Westinghouse Hanford Company (WHC) to provide sampling devices and to analyze inorganic and organic analytes collected from the tank headspace and ambient air near the tank. The target organic analytes for TO-14 compounds were extended to include 14 analytes identified by the Toxicological Review Panel for Tank C-103 and reported by Mahlum et al. (1994). WHC program management included these analytes for future tank analyses as identified in the fiscal year work plan. This plan is attached to a letter addressed to the WHC Tank Characterization Program Manager@). The plan also required PNL to analyze for selected permanent gases. The sample job was designated S5003 and samples were collected by WHC on February 8, 1995, using the vapor sampling system (VSS) . Guidance specific to the sample job was provided in the tank characterization plan by Carpenter (1995) and was based in part on the data quality objectives by Osborne et al. (1994).
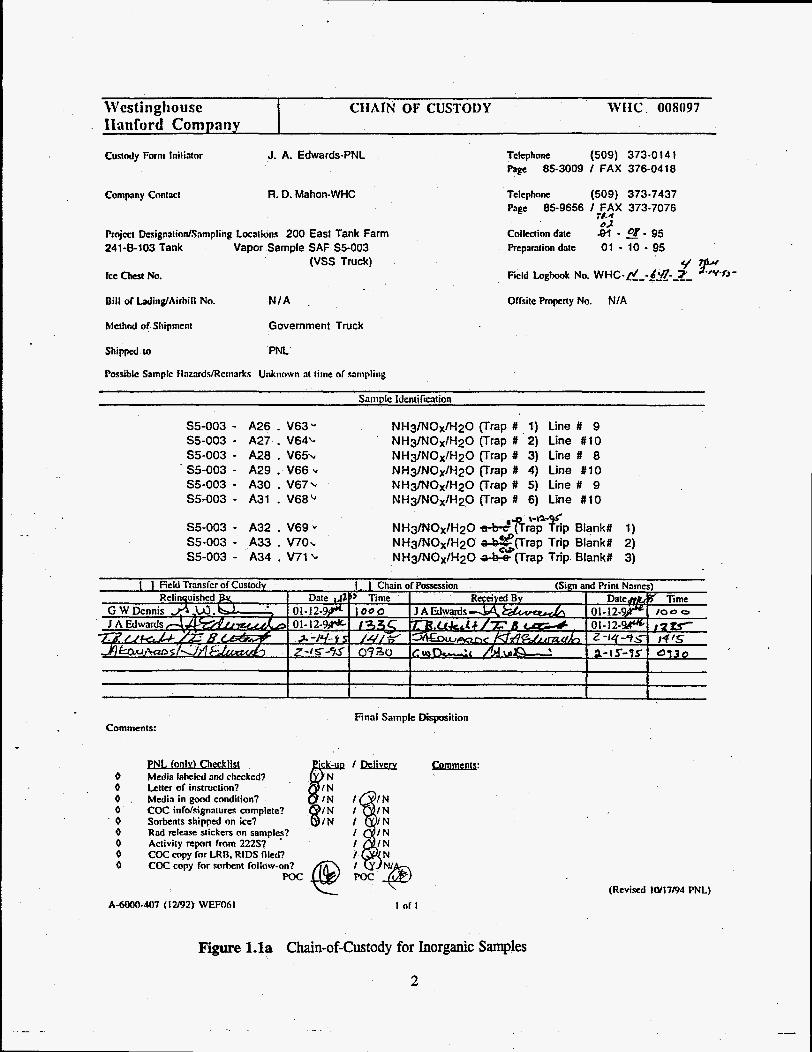
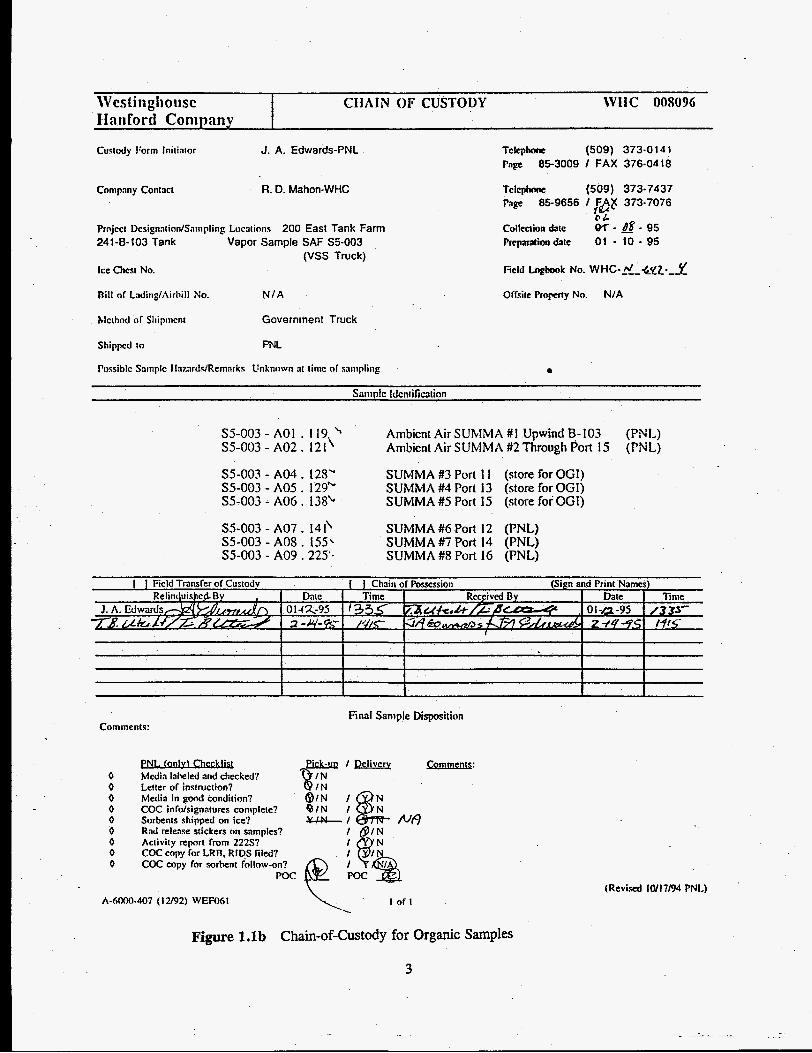
Sampling devices, including six sorbent trains (for inorganic analyses), and five SUMMA" canisters (for organic analyses) were supplied to the WHC sampling staff on January 12, 1995. Samples were taken (by WHC) from the tank headspace on February 8 and were returned to PNL from the field on February 14. Inorganic (sorbent trap) samples were delivered to PNL on chain of custody (COC) 008097 (see Figure 1.la). The SUMMA" canisters were delivered on COC 008096 (see Figure 1.lb).
Project work at PNL was governed by an approved quality assurance plan('). The samples were inspected upon delivery to the 326/23B laboratory and logged into PNL record book 55408 as described in PNL Technical Procedure PNL-TVP-07(d). Custody of the sorbent traps was transferred to PNL personnel performing the inorganic analysis and stored at refrigerated ( 5 10°C) temperature until the time of analysis. The canister was stored in the 326/23B laboratory at ambient (25°C) temperature until time of analysis. Access to the 326/23B laboratory is limited to PNL personnel working on the waste-tank safety program. Analyses described in this report were performed at PNL in the 300 area of the Hanford Reservation. Analytical methods that were used are described in the text. In summary, sorbent traps for inorganic analyses containing sample materials were either weighed (for water analysis) or weighed and desorbed with the appropriate aqueous solutions (for ammonia, nitrogen dioxide, and nitric oxide analyses). The aqueous extracts were analyzed by either selective electrode or ion chromatography (IC). Organic analyses were performed using cryogenic preconcentration followed by gas chromatography/mass spectrometry (GC/MS). Permanent gas analysis was performed using a gas chromatography/thermal conductivity detector (GUTCD).
(a)
@)
Pacific Northwest Laboratory is operated for the U. S. Department of Energy by Battelle Memorial Institute under Contract DEACM-76RLO 1830. Letter from Mr. P.J. Mellinger (PNL) to Mr. T.J. Kelly (WHC), September 30, 19p4, Multi-Year Work Plan for PNL Support of TWRS Characterization for Fiscal Years 1995, 1996, and 1997. TWRS Characterization Project, Pacific Northwest Laboratory, Richland, Washington. PNGMCS-027, Rev. 4, August 1994, TWRS Waste Tank Safety Program, PNL Quality Assurance Plan, Tank Vapor Project, Richland, Washington. PNGTVP-07, Rev. 0, October 1994, Sample Shipping and Receiving Procedure for PATL Waste Tank Samples, PNG Technical Procedure, Tank Vapor Project, Richland, Washington.
(c)
(a)
1
Westinghouse IIanford Company
Custody Forni Initiator
CIIAIN OF CUSTODY WfIC 008097
Company Con tx t
J. A. Edwards-PNL
R. D. Mahon-WHC
Project DcsignatiodSnmplinp Locations 200 East Tank Farm 241-8-103 Tank
k c chest No.
Vapor Sample SAF S5-003 (VSS Truck)
Bill or WingIAirhii l No. N I A
Mahod of Shipment Government Truck
Shipped to PM
Possiblc Satnplc flnrarddReinarks Unknown at time of sanipliiig
Tckphone (509) 373-0141 Page 85-3009 I FAX 376-0410
Telephnne (509) 373-7437 h g e 85-9656 I FAX 373-7076
7g.e OL 81 - 3 - 95 01 - 10 - 95
Collection date J'repantion date
Field Loghook NO. WHC-&-_6_rZ-)- V F ''Y-fJ-
Offsite Property No. NIA
Saniplc Identifition
S5-003 ~ A26 . V63- S5-003 - A27 . V64L S5-003 * A20 . V 6 5 ~ S5-003 - A29 . V66v S5-003 - A30 . V67\ S5-003 - A31 . V60b
SS-003 - A32 . V69. S5-003 - A33 . V7Qk s5-003 - A34 . V71L
NH3/NOx/H20 (Trap # 1) Line # 9 NH3/NOx/H20 (Trap # 2) Line #10 NH31NOx/H20 (Trap # 3) Line # 8 NH31NOx/H20 (Trap # 4) Line #I0 NH3MOxIH20 (Trap # 5) Line # 9 NH3/NOX/H20 (Trap 11 6) Line 1110
NH3/NOxlH20 &?rap Trip Blank# 1) NH3INOxlH20 **(Trap Trip Blank# 2) NH3/NOx/H20 +be (Trap Trip Blank# 3)
t-la-q
final Sample Disposition Comments:
PNL (onlv) Checklisr 0 Media laheled and checked? 0 Letter of instruction? 0 Media in good condition? 0 COC infdsignatures complete? 0 Sorbents shipped on ice? 0 0 Activity report rrorn 22237 0 0
Rad release stickers on samples?
COC copy for LRB. RIDS filed? COC copy for sorbent follow-on?
Poc
A-6000407 ( Iu92) WEFMI 1 of I
Comments:
(Rcvi.wl l(Y17/94 PNL)
.--
Figure l.la Chain-of-Custody for Inorganic Samples
2
\Vestiiigiiousc CIIAIN OF CUSTODY WilC 008096 €I a n fo r (1 Coni pan y
Custdy Form Initiator J. A. Edwards-PNL Telephone (509) 373-0141 r a p 85-3009 I FAX 376-0418
Conipnny Contact R. 0. Mahon-WHC Telcphme (509) 373-7437 Page 05-9656 I &A8 373-7076
E t Project DesignatinnlSniiipline Locationc 200 East Tank Farm Collection date w - @ - 95 241-8-103 Tank Vapor Sample SAF S5-003 Prcpalalion date 01 - 10 - 95
(VSS Truck) Ice Chest No.
Bill of LadiiigIAirhill No. NIA Offsite Property No. N I A
f ield Lmgbwk No. WHC-&-Gfl---f
hlcthod or Sliipmcnt Government Truck
Sliippcd to PNL
Possible Sainplc Iln~~rcIdReinnrks Unknrnvn nt tiiiic of sniiipliiig
Sa~iiplc Idcntiliwtion
S5-003 - A01 . I 19 '' S5-003 - A02. 121\
S5-003 - A04 . 125' S5-003 - A05 . 129% S5-003 - A06. 13SL
S5-003 - A07 . 141' SUMMA #G Port 12 (PNL) S5-003 - AOS . 155' SUMMA #7 Port 14 (PNL) S5-003 - A09 .225'* SUMMA #8 Port 1G (PNL)
Ambient Air SUMMA # I Upwind B- 103 Ambient Air SUMMA #2 Through Port 15
SUMMA #3 Port I 1 (store for OGI) SUMMA #4 Port 13 (store for OGI) SUMMA #5 Port 15 (store for OGI)
(PNI,) (PNL)
I I I I I I I I
I I
I I I f I ~~
Final Seniple Dispositiivn Comments:
PNL (oniv) Checklisl , ~ ; u Q I Delivery CommentS: Media laheled and checked? Letter of instruction?
Sorbents shipped on ice?
Media in good condition? COC infolsignstures complete?
Rad release stickers on samples? Activity report from 222S? COC copy Tor LRD. RIDS Filed? COC copy for sorbent follow-on?
- 1 x& /Vn
A-6000-407 ( I 2/92) WEFO61
Figure 1. lb Chain-of-Custody for Organic Samples
3
(Revised 10117/94 PNlJ

2.0 Inorganic Task
Solid sorbent traps, prepared in multi-trap sampling trains, were supplied to WHC for sampling the tank headspace using the VSS. Blanks, spiked blanks (when requested), and exposed samples were returned to PNL for analysis. Analyses were performed to provide information on the tank-headspace concentration of the following analytes: ammonia (NH,), nitrogen dioxide (NOJ, nitric oxide (NO), and water (H20). Procedures were similar to those developed previously during sample jobs performed with the VSS connected to the headspace of Tank C-103 (Ligotke et al. 1994). During those sample jobs, control samples provided validation that samples were effectively trapping NH3 and mass. Sample preparation, handling and disassembly were performed as described in Technical Procedure PNL-TVP-09(a). Analytical accuracy was estimated based on procedures used. Sample preparation and analyses were performed following PNL quality assurance (QA) impact level (IL) 11 requirements.
2.1 Standard Sampling Methodology
Standard glass tubes containing sorbent materials to trap vapors of selected analytes of NH,, NO, NO2, and H,O (SKC Inc., Eighty Four, Pennsylvania) were obtained, prepared, and submitted for use by WHC. The sorbent traps were selected based on their use by the Occupational Safety and Health Administration (OSHA) to perform workplace monitoring, and because of available procedures and verification results associated with that particular application. The typical sorbent traps used consisted of a glass tube containing a sorbent material specific to the compound of interest. In general, the tubes contained two sorbent layers, or sections; the first layer was the primary trap, and the second layer provided an indication of breakthrough. In the tubes, sorbent layers are generally held in packed layers separated by glass wool. The sorbent traps, having glass-sealed ends, were received from the vendor.
The type and nominal quantity of sorbent material varied by application. Sorbent traps were selected for the tank sample job and included the following products. The NH, sorbent traps contained carbon beads impregnated with sulfuric acid; nominally, 500 mg were contained in the primary and 250 mg in the breakthrough sections. The NH, was chemisorbed as ammonium sulfate {(NH4)2S04}. The NO2 traps contained a zeolite impregnated with triethanolamine (TEA), with 400 mg in the primary and 200 mg in the breakthrough sections. The NO2 was absorbed and disproportionated to equi-molar quantities of nitrite ions (NO;) and nitrate ions (NO;). Glass tubes containing 800 mg of an oxidant such as chromate were used to convert NO to NO2. The converted NO was then collected as nitrite and nitrate in an NO, trap. The water traps contained 300 mg of silica gel in the primary and 150 mg in the breakthrough sections.
Samples provided by PNL to trap inorganic compounds include all or some of the following: samples, spiked samples, spares, single trap blanks, and spiked blanks. The samples of each were prepared from same-lot batches, with the oxidizer sections of the NO, sorbent trains having been stored previously in a freezer. After sample preparation, all samples, spiked samples, blanks, and spiked blanks were stored in a freezer, primarily because of handling recommendations for the oxidizer tubes attached to some samples. After receipt of exposed and radiologically cleared samples
(a) Pacific Northwest Laboratory. 10194. Sorbent Trap Preparation for sampling and Analysis: Waste Tank Inorganic Vqor Samples, PNLTVP-09 fRev.O), PNL Technical Procedure, Richland, Washington,
5
from WHC and disassembly of the sorbent trains, samples were provided to the analytical laboratory at ambient temperature, and selected oxidizer sections were returned to a freezer until completion of analyses.
The sorbent traps were prepared in multi-trap sorbent trains configured so sample flow passed in order through the traps, targeting specific analytes, and then through a desiccant trap. The specific order of traps within the various sorbent trains is described in Section 2.4. The ends of the glass-tube traps were broken, and the traps were weighed and then connected to each other using uniform lengths of 3/8-in. periluoroalkoxy (PFA)-grade Teflon@ tubing. The tubing was heated in hot air and forced over the open ends of the traps to form a tight seal. The inlets of the sorbent trains each consist of a short section of tubing having a 318411. stainless steel Swagelok@ nut, sealed using a Swageloka cap. The trailing ends of the sorbent trains (the downstream end of the traps containing silica gel) were each sealed with red-plastic end caps provided by the manufacturer. The sorbent-tube trains remained sealed other than during the actual sampling periods. C-Flex@ tubing was provided by WHC to connect the downstream ends of the sorbent trains to the sampling exhaust manifold connections.
2.1.1 Concentration Calculations. The concentrations of target compounds in the tank headspace were determined from sample results, assuming effective sample transport to the sorbent traps. Concentration, in parts per million by volume (ppmv), was determined by dividing the mass of the compound, in pmol, by the volume of the dried tank air sampled in mol. The micromolar sample mass was determined by dividing the compound mass, in pg, by the molecular weight of the compound, in g/mol. The molar sample volume was determined, excluding water vapor, by dividing the standard sample volume (at 0°C and 760 torr), in L, by 22.4 L/mol. For example, the concentration (C,) of a 3.00-L sample containing 75.0 pg of NH, equals
= 32.9 ppmv 75.0 pg ( 3.00 L )-' 17 @mol 22.4 L/mol
c, =
This calculational method produces concentration results that are slightly conservative (greater than actual) because the volume of water vapor in the sample stream is neglected. The volume of water vapor is not included in the measured sampled volume because of its removal in desiccant traps upstream of the mass flowmeter. However, the bias is generally expected to be small. For a tank- headspace temperature of 35"C, the magnitude of the bias would be about 1 to 6%, assuming tank- headspace relative humidities of 20 to loo%, respectively. The concentration of mass (determined gravimetrically) was also per dry-gas volume at standard conditions.
2.2 Analytical Procedures
The compounds of interest were trapped using solid sorbents and chemisorption (adsorption of water vapor). Analytical results were based on extraction and analysis of selected ions. Analytical procedures used are specified in the text. All were compiled in PNL-MA-599.
2.2.1 Ammonia Analysis. The sorbent material from the NH,-selective sorbent traps was placed into labeled 20-mL glass scintillation vials. Vials containing front-, or primary-, section sorbent material were treated with 10.0 mL of deionized water (DIW), and vials containing back-up-section
6
sorbent material were treated with 5.0 mL of DIW. After extraction, the NH, sorbent traps were analyzed using the selective ion electrode (SIE) procedure PNL-ALO-226 {Ammonia (Nitrogen) in Aqueous Samples). Briefly, this method includes 1) preparing a lOoO-pg/mL (ppm) NH, stock standard solution from dried reagent-grade NH,C1 and DlW on the day analyses are performed; 2) preparing 0.1-, OS-, 1.0-, lo-, and 100-ppm NH, working calibration standards by serial dilution of the freshly made stock standard; 3) generating an initial calibration curve from the measured electromotive force (emf) signal versus NH, concentration data obtained for the set of working standards; 4) performing a calibration-verification check, using one of the midrange standards, after analyzing every four or five samples; 5 ) continuing this sequence until all samples of the batch have been measured, including duplicates and spiked samples; and 6) remeasuring the complete set of calibration standards (at the end of the session). Emf signal measurements obtained for samples are compared to those for standards, either graphically or algebraically (using linear regression) to determine NH, concentration in the samples.
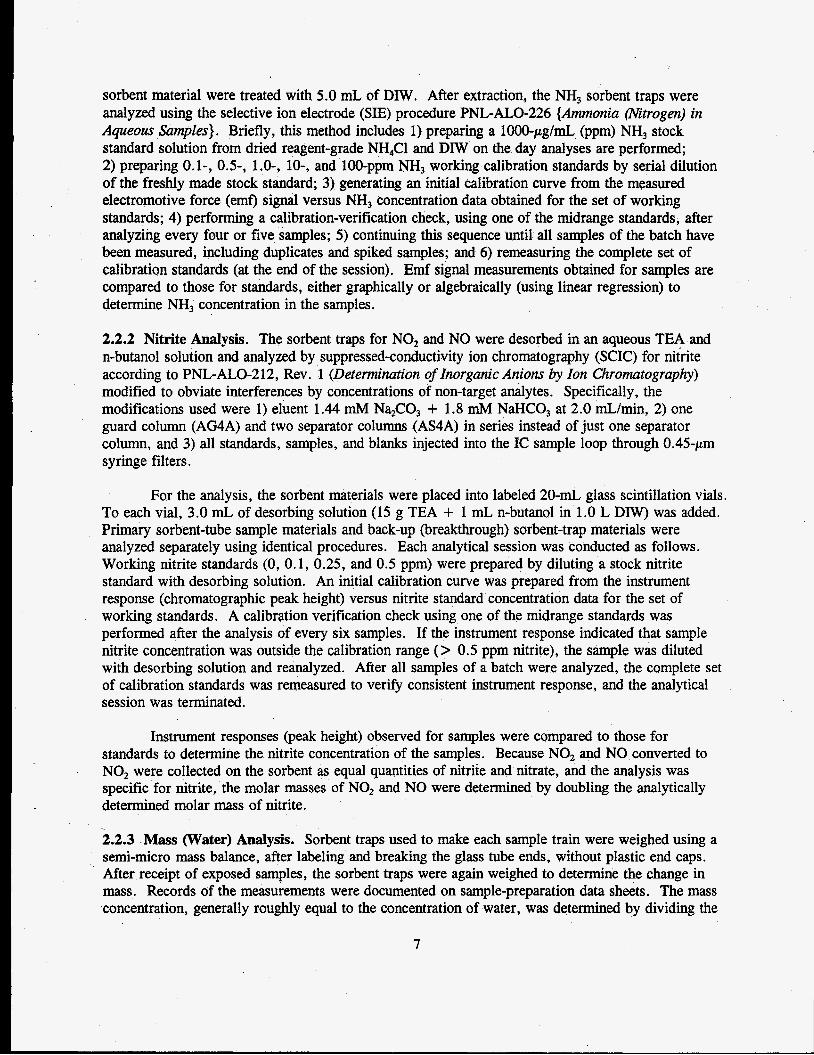
2.2.2 Nitrite Analysis. The sorbent traps for NO, and NO were desorbed in an aqueous TEA and n-butanol solution and analyzed by suppressed-conductivity ion chromatography (SCIC) for nitrite according to PNL-ALO-212, Rev. 1 (Determination of Inorganic Anions by Ion Chromatography) modified to obviate interferences by concentrations of non-target analytes. Specifically, the modifications used were 1) eluent 1.44 mM Na,CO, + 1.8 mM NaHCO, at 2.0 mL/min, 2) one guard column (AG4A) and two separator columns (AS4A) in series instead of just one separator column, and 3) all standards, samples, and blanks injected into the IC sample loop through 0.45-pm syringe filters.
For the analysis, the sorbent materials were placed into labeled 20-mL glass scintillation vials. To each vial, 3.0 mL of desorbing solution (15 g TEA + 1 mL n-butanol in 1.0 L DIW) was added. Primary sorbent-tube sample materials and back-up (breakthrough) sorbent-trap materials were analyzed separately using identical procedures. Each analytical session was conducted as follows. Working nitrite standards (0, 0.1, 0.25, and 0.5 ppm) were prepared by diluting a stock nitrite standard with desorbing solution. An initial calibration curve was prepared from the instrument response (chromatographic peak height) versus nitrite standard concentration data for the set of working standards. A calibration verification check using one of the midrange standards was performed after the analysis of every six samples. If the instrument response indicated that sample nitrite concentration was outside the calibration range (> 0.5 ppm nitrite), the sample was diluted with desorbing solution and reanalyzed. After all samples of a batch were analyzed, the complete set of calibration standards was remeasured to verify consistent instrument response, and the analytical session was terminated.
Instrument responses (peak height) observed for samples were compared to those for standards to determine the nitrite concentration of the samples. Because NO, and NO converted to NO, were collected on the sorbent as equal quantities of nitrite and nitrate, and the analysis was specific for nitrite, the molar masses of NO, and NO were determined by doubling the analytically determined molar mass of nitrite.
2.2.3 Mass (Water) Analysis. Sorbent traps used to make each sample train were weighed using a semi-micro mass balance, after labeling and breaking the glass tube ends, without plastic end caps. After receipt of exposed samples, the sorbent traps were again weighed to determine the change in mass. Records of the measurements were documented on sample-preparation data sheets. The mass concentration, generally roughly equal to the concentration of water, was determined by dividing the
7
combined change in mass from all traps in a sorbent train by the actual volume of gas sampled. Blanks and spiked blanks were included to provide information on uncertainty.
2.3 Quality Assurance/Quality Control
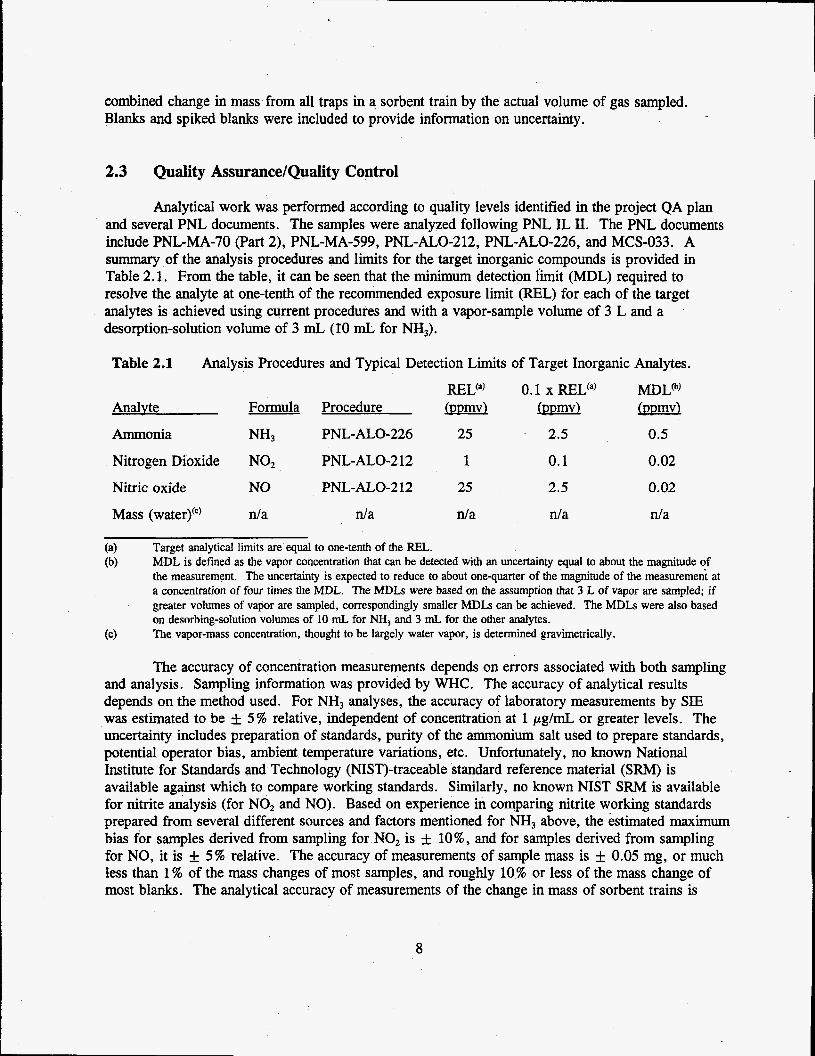
Analytical work was performed according to quality levels identified in the project QA plan and several PNL documents. The samples were analyzed following PNL IL II. The PNL documents include PNL-MA-70 (Part 2), PNL-MA-599, PNL-ALO-212, PNL-ALO-226, and MCS-033. A summary of the analysis procedures and limits for the target inorganic compounds is provided in Table 2.1. From the table, it can be seen that the minimum detection limit (MDL) required to resolve the analyte at one-tenth of the recommended exposure limit (REL) for each of the target analytes is achieved using current procedures and with a vapor-sample volume of 3 L and a desorption-solution volume of 3 mL (IO mL for NH,).
Table 2.1 Analysis Procedures and Typical Detection Limits of Target Inorganic Analytes.
REL") 0.1 x RELQ MDL@" Analvte Formula Procedure @lxw Q€!m!l 0
Nitrogen Dioxide NO, PNL-ALO-2 12 1 0.1 0.02
Ammonia NH, PNL-ALO-226 25 2.5 0.5
Nitric oxide NO PNL-ALO-2 12 25 2.5 0.02
Mass (water)") n/a n/a n/a n/a n/a
(a) (b)
Target analytical limits are equal to one-tenth of the REL. MDL is defined as the vapor concentration that can be detected with an uncertainty equal to about the magnitude of the measurement. The uncertainty is expected to reduce to about onequarter of the magnitude of the measurement at a concentration of four times the MDL. The MDLs were based on the assumption that 3 L of vapor are sampled; if greater volumes of vapor are sampled, correspondingly smaller MDLs can be achieved. The MDLs were also based on desorbing-solution volumes of 10 mL for NH, and 3 mL for the other analytes. The vapor-mass concentration, thought to be largely water vapor, is determined gravimetrically. (c)
The accuracy of concentration measurements depends on errors associated with both sampling and analysis. Sampling information was provided by WHC. The accuracy of analytical results depends on the method used. For NH, analyses, the accuracy of laboratory measurements by SIE was estimated to be f 5% relative, independent of concentration at 1 pg/mL or greater levels. The uncertainty includes preparation of standards, purity of the ammonium salt used to prepare standards, potential operator bias, ambient temperature variations, etc. Unfortunately, no known National Institute for Standards and Technology (NIST)-traceable standard reference material (SRM) is available against which to compare working standards. Similarly, no known NIST SRM is available for nitrite analysis (for NOz and NO). Based on experience in comparing nitrite working standards prepared from several different sources and factors mentioned for NH, above, the estimated maximum bias for samples derived from sampling for NOz is f lo%, and for samples derived from sampling for NO, it is f 5% relative. The accuracy of measurements of sample mass is f 0.05 mg, or much less than 1 % of the mass changes of most samples, and roughly 10% or less of the mass change of most blanks. The analytical accuracy of measurements of the change in mass of sorbent trains is
8
estimated to be f 1 mg per Strap sorbent train; this estimate is based largely on preliminary information that unopened field-blank sorbent trains gain 0.3 f 0.4 mg per train.
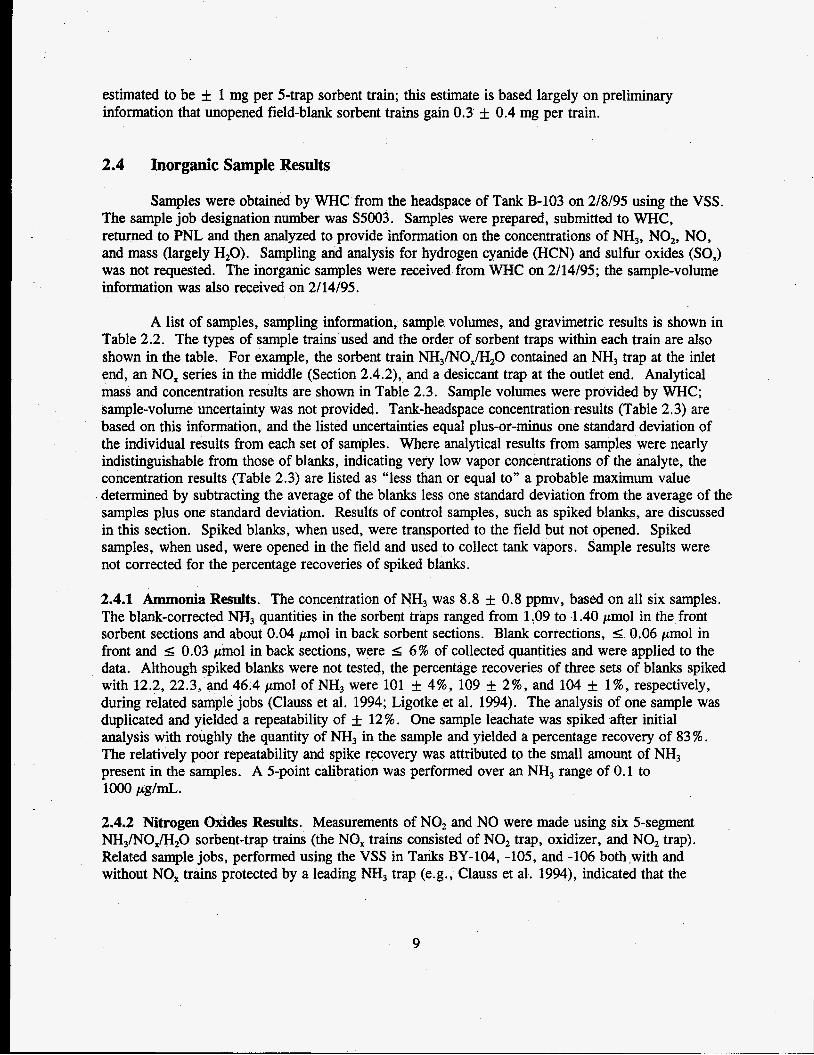
2.4 Inorganic Sample Results
Samples were obtained by WHC from the headspace of Tank B-103 on 2/8/95 using the VSS. The sample job designation number was S5003. Samples were prepared, submitted to WHC, returned to PNL and then analyzed to provide information on the concentrations of NH,, NO,, NO, and mass (largely H,O). Sampling and analysis for hydrogen cyanide (HCN) and sulfur oxides (SO,) was not requested. The inorganic samples were received from WHC on 2/14/95; the sample-volume information was also received on 2/14/95.
A list of samples, sampling information, sample volumes, and gravimetric results is shown in Table 2.2. The types of sample trains used and the order of sorbent traps within each train are also shown in the table. For example, the sorbent train NH,/NO,/H,O contained an NH, trap at the inlet end, an NO, series in the middle (Section 2.4.2), and a desiccant trap at the outlet end. Analytical mass and concentration results are shown in Table 2.3. Sample volumes were provided by WHC; sample-volume uncertainty was not provided. Tank-headspace concentration results (Table 2.3) are based on this information, and the listed uncertainties equal plus-or-minus one standard deviation of the individual results from each set of samples. Where analytical results from samples were nearly indistinguishable from those of blanks, indicating very low vapor concentrations of the analyte, the concentration results (Table 2.3) are listed as “less than or equal to” a probable maximum value determined by subtracting the average of the blanks less one standard deviation from the average of the samples plus one standard deviation. Results of control samples, such as spiked blanks, are discussed in this section. Spiked blanks, when used, were transported to the field but not opened. Spiked samples, when used, were opened in the field and used to collect tank vapors. Sample results were not corrected for the percentage recoveries of spiked blanks.
2.4.1 Ammonia Results. The concentration of NH, was 8.8 f 0.8 ppmv, based on all six samples. The blank-corrected NH, quantities in the sorbent traps ranged from 1.09 to 1.40 pmol in the front sorbent sections and about 0.04 pmol in back sorbent sections. Blank corrections, I 0.06 pmol in front and S 0.03 pmol in back sections, were 5 6% of collected quantities and were applied to the data. Although spiked blanks were not tested, the percentage recoveries of three sets of blanks spiked with 12.2, 22.3, and 46.4 pmol of NH, were 101 f 4%, 109 f 2%, and 104 f 1%, respectively, during related sample jobs (Clauss et al. 1994; Ligotke et al. 1994). The analysis of one sample was duplicated and yielded a repeatability of f 12%. One sample leachate was spiked after initial analysis with roughly the quantity of NH, in the sample and yielded a percentage recovery of 83 % . The relatively poor repeatability and spike recovery was attributed to the small amount of NH, present in the samples. A 5-point calibration was performed over an NH, range of 0.1 to lo00 pg/mL.
2.4.2 Nitrogen Oxides Results. Measurements of NO, and NO were made using six 5-segment NH,/NO,/H,O sorbent-trap trains (the NO, trains consisted of NO, trap, oxidizer, and NO, trap). Related sample jobs, performed using the VSS in Tanks BY-104, -105, and -106 both,with and without NO, trains protected by a leading NH, trap (e.g., Clauss et al. 1994), indicated that the
9
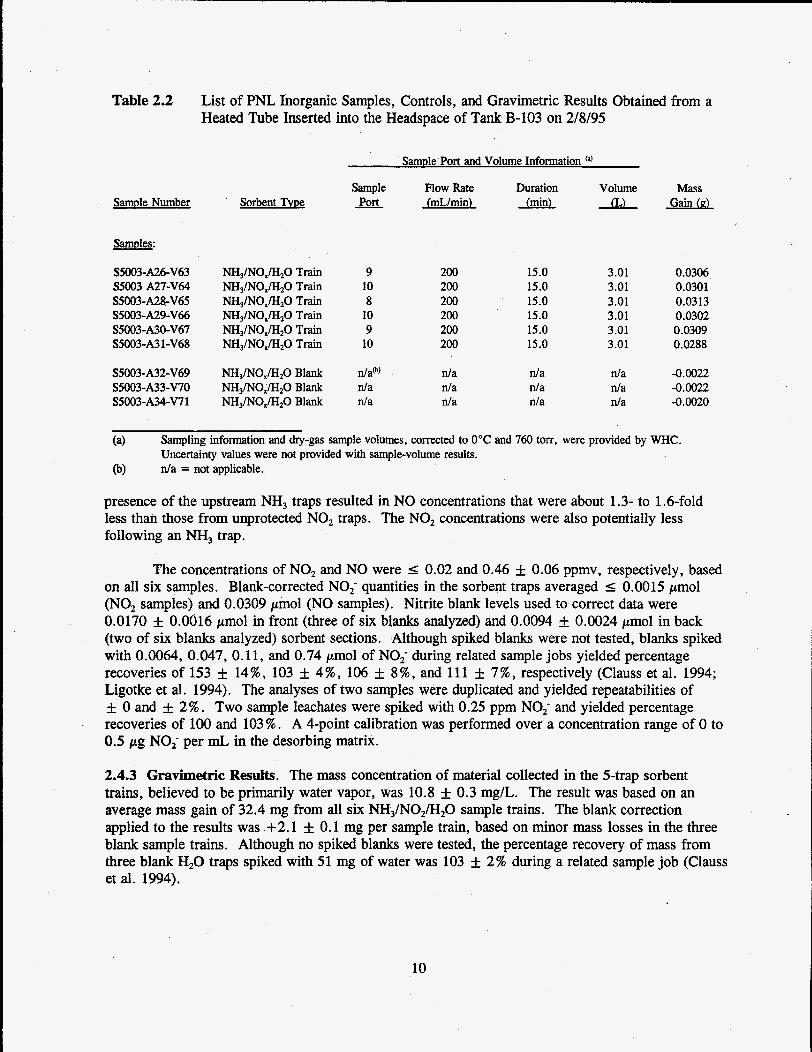
Table 2.2 List of PNL Inorganic Samples, Controls, and Gravimetric Results Obtained from a Heated Tube Inserted into the Headspace of Tank B-103 on 2/8/95
SamDle Number Sorbent T Y D ~
SS003-A26-V63 NH3/NOx/H20 Train S5003 A27-V64 NH3/NOx/H20 Train S5003-A28-V65 NH3/N0,/H20 Train S5003-A29-V66 NH3/N0,/H20 Train S5003-A3O-V67 NH3/NOxM20 Train S5003-A31-V68 NH3/NOx/H20 Train
S5003-A32-V69 NH3/NOx/H20 Blank S5003-A33-V70 NH3/N0,/H20 Blank S5003-AWV71 NH,/NOJH,O Blank
SamDle Port and Volume Information (a)
Mass Volume Sample Flow Rate Duration - Port ( a m i n ) (mid Gain (9)
9 10 8
10 9
10
n/a@) n/a n/a
200 200 200 200 200 200
n/a n/a n/a
15.0 15.0 15.0 15.0 15.0 15.0
n/a n/a n/a
3.01 3.01 3.01 3.01 3.01 3.01
n/a n/a n/a
0.0306 0.0301 0.0313 0.0302 0.0309 0.0288
-0.0022 -0.0022 -0.0020
(a)
(b) n/a = not applicable.
Sampling information and dry-gas sample volumes, corrected to 0°C and 760 torr, were provided by WHC. Uncertainty values were not provided with sample-volume results.
presence of the upstream NH, traps resulted in NO concentrations that were about 1.3- to 1.6-fold less than those from unprotected NO, traps. The NO, concentrations were also potentially less following an NH, trap.
The concentrations of NO, and NO were I 0.02 and 0.46 f 0.06 ppmv, respectively, based on all six samples. Blank-corrected NO; quantities in the sorbent traps averaged I 0.0015 pmol (NO, samples) and 0.0309 pmol (NO samples). Nitrite blank levels used to correct data were 0.0170 f 0.0016 pmol in front (three of six blanks analyzed) and 0.0094 k 0.0024 pmol in back (two of six blanks analyzed) sorbent sections. Although spiked blanks were not tested, blanks spiked with 0.0064, 0.047, 0.11, and 0.74 pmol of NO; during related sample jobs yielded percentage recoveries of 153 f 14%, 103 f 4%, 106 f 8%, and 111 f 7%, respectively (Clauss et al. 1994; Ligotke et al. 1994). The analyses of two samples were duplicated and yielded repeatabilities of f 0 and f 2%. Two sample leachates were spiked with 0.25 ppm NO; and yielded percentage recoveries of 100 and 103 % . A 4-point calibration was performed over a concentration range of 0 to 0.5 pg NO; per mL in the desorbing matrix.
2.4.3 Gravimetric Results. The mass concentration of material collected in the 5-trap sorbent trains, believed to be primarily water vapor, was 10.8 f 0.3 mg/L. The result was based on an average mass gain of 32.4 mg from all six NH,/NO,/H,O sample trains. The blank correction applied to the results was +2.1 f 0.1 mg per sample train, based on minor mass losses in the three blank sample trains. Although no spiked blanks were tested, the percentage recovery of mass from three blank H,O traps spiked with 51 mg of water was 103 f 2% during a related sample job (Clauss et al. 1994).
10
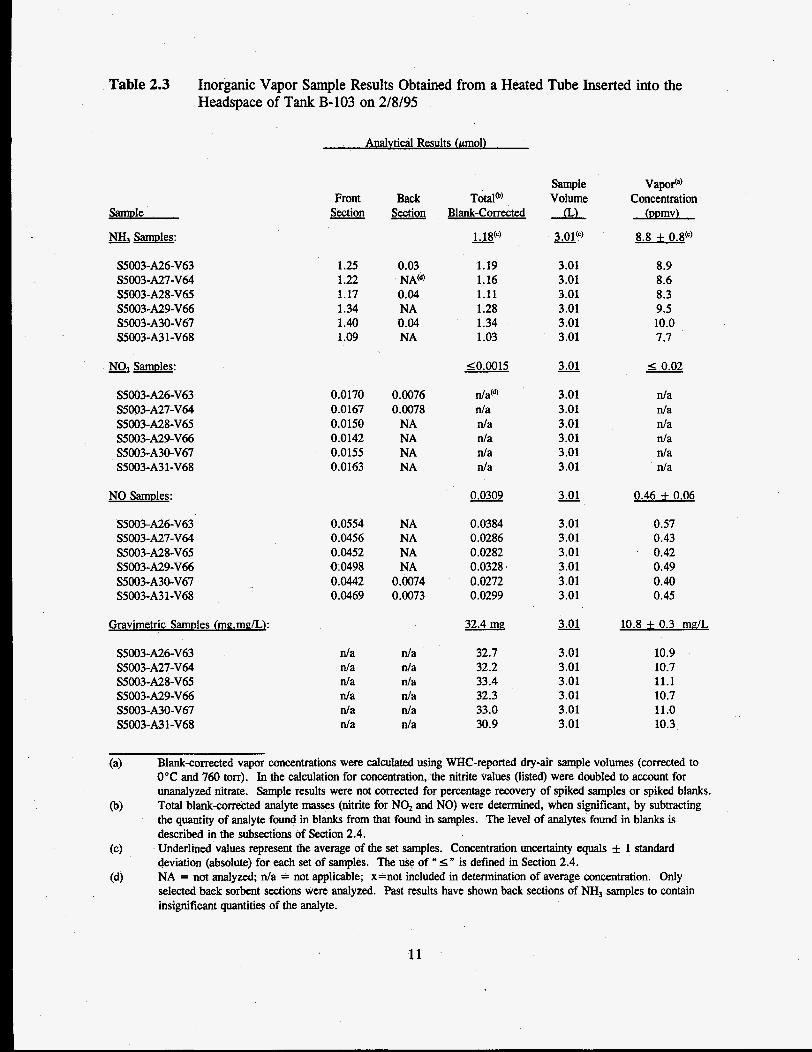
Table 2.3 Inorganic Vapor Sample Results Obtained from a Heated Tube Inserted into the Headspace of Tank B-103 on 2/8/95
Analvtical Results hmol)
Sample Front
Section - Back Total@) Section Blank-Corrected
NH, SamDles:
NO, Samples:
NO Samples:
Gravimetric Samples (me.melL):
1.25 1.22 1.17 1.34 1.40 1.09
0.03 NA(" 0.04 NA 0.04 NA
0.0170 0.0076 0.0167 0.0078 0.0150 NA 0.0142 NA 0.0155 NA 0.0163 NA
0.0554 NA 0.0456 NA 0.0452 NA 0.0498 NA 0.0442 0.0074 0.0469 0.0073
n/a n/a n/a n/a n/a n/a n/a n/a n/a n/a n/a n/a
- 1.18"'
Sample Volume
- 3.01(')
1.19 1.16 1.11 1.28 1.34 1.03
3.01 3.01 3.01 3.01 3.01 3.01
10.0015
n/a") n/a n/a n/a n/a n/a
- 3.01
3.01 3.01 3.01 3.01 3.01 3.01
0.0309 - 3.01
0.0384 0.0286 0.0282 0.0328. 0.0272 0.0299
3.01 3.01 3.01 3.01 3.01 3.01
32.4 mq - 3.01
32.7 32.2 33.4 32.3 33.0 30.9
3.01 3.01 3.01 3.01 3.01 3.01
Vapor(a) Concentration
(opmv)
8.8 t 0.8"'
8.9 8.6 8.3 9.5 10.0 7.7
5 0.02
n/a n/a n/a n/a n/a n/a
0.46 + 0.06 0.57 0.43 0.42 0.49 0.40 0.45
10.8 + 0.3 mdL
10.9 10.7 11.1 10.7 11.0 10.3
(a) Blank-corrected vapor concentrations were calculated using WHC-reported dry-air sample voIumes (corrected to 0°C and 760 torr). In the calculation for concentration, the nitrite values (listed) were doubled to account for unanalyzed nitrate. Sample results were not corrected for percentage recovery of spiked samples or spiked blanks. Total blankarrected analyte masses (nitrite for NO2 and NO) were determined, when significant, by subtracting the quantity of analyte found in blanks from that found in samples. The level of analytes found in blanks is described in the subsections of Section 2.4. Underlined values represent the average of the set samples. Concentration uncertainty equals f 1 standard deviation (absolute) for each set of samples. The use of S " is defined in Section 2.4. NA = not analyzed; n/a = not applicable; x=not included in determination of average concentration. Only selected back sorbent sections were analyzed. Past results have shown back sections of NH, samples to contain insignificant quantities of the analyte.
(b)
( 4
(d)
11

3.0 Organic Task
3.1 SUMMA" Canister Preparation
Before sending SUMMA" canisters out to the field for sampling, the canisters are cleaned and verified contaminant free according to PNL Technical Procedure PNL-TVP-02("). The cleaning procedure uses an EnTech 3000 cleaning system that controls 1) filling the canisters with purified humid air and 2) evacuating, for several cycles with applied heat, before allowing the canister to evacuate overnight. The canister is filled a final time with purified humid air for analysis by PNL Technical Procedure PNL-TVP-0 l@), which is a modification of US . Environmental Protection Agency (EPA) compendium Method TO-14. If the canister is verified as clean, free of TO-14 and unknown contaminants to a level of 5 parts per billion by volume (ppbv), the canister is evacuated to 5 mtorr Hg, tagged, and stored for use in the field. Before sending the canisters out to the field for sampling, the canister vacuum is measured to determine if any leakage has occurred. If the vacuum has remained constant during storage, the canisters are prehumidified with 100 pL of distilled water and labeled with a field-sampling identification. Canisters stored more than 30 but less than 60 days are re-evacuated and rehumidified before use. If stored more than 60 days, the canisters are recleaned and validated before use.
3.2 Sample Analysis Method
The SUMMA" canister sample was analyzed according to PNL Technical Procedure PNL-TVP-03, Determination of TO-14 Volatile Organic Compounds in Hanford Waste Tank Headspace Samples Using SUMMA " Passivated Canister Sampling and Gas Chromatographic-Mass Spectrometry Analysis, which is a modified version of EPA compendium Method TO-14. The method uses an EnTech cryoconcentration system interfaced with either a 5971 or a 5972 Hewlett Packard (HP) benchtop GC/MS. The EnTech concentrator is used to pull a metered volume of sample air from the SUMMA" canister, cryogenically concentrate the air volume, then transfer the volume to the GUMS for analysis. A 100-mL volume of sample is measured and analyzed from the tank headspace. The organic components in the sampled air are separated on an analytical column, J&W Scientific DB-1 phase, 60-m by 0.32-mm internal diameter with 3-pm film thickness. The GC oven is programmed to run a temperature gradient beginning at 40°C, holding for 5 min, and ramping at 4°C per min to a final temperature of 260"C, with a 5-min hold. Twenty-four hours before the anaIysis, the SUMMA" canister samples were pressurized with purified air (Aadco Instruments, Inc., 1920 Sherwood St., Clearwater, Florida 34625). The starting pressure was first measured using a calibrated diaphragm gauge (Cole Parmer) then pressurized to a level exactly twice the original pressure. For example, if the canister had a starting pressure of 740 torr, it was pressurized to 1480 torr. This dilution was an effort to improve the precision of the analysis. The sample dilution was taken into account when calculating the analysis results.
(a) Pacific Northwest Laboratory. 8/94. Cleaning SUMMA Canisters and the VaIidation of the Cleaning Process,
@I PNL-TVP-02 (Rev. 0), PNL Technical Procedure, Richland, Washington. Pacific Northwest Laboratory. 8/94. Determination of TO-14 VoIatiIe Organic Cmnpounds in Ambient Air Using SUMMA Passivated Canister Sampling and Gas Chromatographic-Mass Spectromenic Analysis, PNL-TVP-01 (Rev. 0). PNL Technical Procedure, Richland, Washington.
13
The instrument calibration mixture for the TO-14 analysis consists of the standard 39 organic d y t e s with an additional 14 tank-related compounds. Together, these 53 compounds that are directly quantified in this analysis make up the target analyte list (these 53 compounds will be referred to as target analytes). The calibration mixture was prepared by blending a commercially prepared 39-compound TO-14 calibration mixture with a 14-compound mixture created using a Kin-Tek@ permeation-tube standard generation system. The operation of the permeation tube system follows the method detailed in Preparation of TO-14 Volatile Organic Compounds Gas Standards, PNL Technical Procedure PNL-TVP-06. The standard calibration mix was analyzed using six aliquot sizes ranging from 5 mL to 300 mL. Depending on the concentration of each analyte in the mixture, either five or six points were used to construct the calibration curve. Butonoic acid was added to the mixture, but was not detected in the analysis. Butanal was recovered very poorly, producing a much lower than expected response. This results in a much higher measured amount reported in the sample analysis. While this problem is under investigation, butanal will continue to be measured as a tentatively identified compound. This results in a much higher measured amount reported in the sample analysis. This problem is currently under investigation. Performance-based detection limits for the target analytes will be developed as a pool of calibration data becomes available. Currently, the nominal detection limit of 5 ppbv is met.
The SUMMA" canister samples were analyzed for permanent gases according to PNL Technical Procedure PNL-TVP-05, Analysis Method for the Determination of Permanent Gases in Hanford Wmte Tank Vapor Samples Collected in SUMMA " Passivated Stainless Steel Canisters, with the exceptions listed in the following text and in the Quality Assurance/Quality Control section of this report. This method was developed in-house for the analysis of permanent gases defined as hydrogen (Ha, carbon dioxide (COJ, carbon monoxide (CO), methane (CH4), and nitrous oxide fN,O) by GC-TCD and is not validated in any other laboratory. No previous work up of the sample canister is necessary before permanent gas analysis. Aliquots of sampled air are manually drawn from each canister into a 5-mL gas-tight syringe and directly injected into a GC-TCD fitted with a 1.0-mL injection loop. An aliquot of 5 mL is used so that the injection loop is flushed and filled with sample air, ensuring that no dilution of the sample takes place within the injection loop. One set of GC conditions is used to analyze for CO, CO,, N,O, and CH, using Helium (He) as the carrier gas. A second GC analysis is performed for H, (using nitrogen as the carrier gas) to enhance the signal sensitivity and lower the detection limit for this analyte. A total of 30 to 60 mL, depending upon the number of repeat analyses performed, may be drawn from each 6-L canister.
3.3 Quality Assurance/Quality Control
Before the tank sample was analyzed, a diagnostic check was performed on the GUMS instrument by running an instrument "high-sensitivity tune," as described in PNL-TVP-03. Upon satisfactory completion of the instrument diagnostic check, a blank volume of purified nitrogen was analyzed to check the cleanliness of the system. The instrument was then calibrated over 5 to 7 data points ranging from 5 ppbv to 300 ppbv, using a standard gas mixture containing 39 volatile organic compounds listed in EPA compendium Method TO-14 and an additional 14 tank-related compounds. A gas mixture containing bromochloromethane, 1,4-difluorobenzene, and chlorobenzene-d, was used as an internal standard (IS) for all blank, calibration standard, and sample analyses. Analyte responses from sample components, ISs, and standards were obtained from the extracted ion plot from their selected mass ion. The calibration curve was generated by calculating the relative response ratios of the IS to calibration standard responses and plotting the ratios against the ratio of the calibration-standard concentration (in ppbv) to the IS concentration. A least-squares linear-regression
14
The ppbv concentrations are calculated from mg/m3 and the molecular weight of the analyte.
15
routine was applied to the data set to generate the best-fit line for each compound. The equation for that line was then used to quantify the target analytes found in the tank samples.
Standards for the permanent gas analysis were blended from commercially prepared and certified standards for each of the analytes reported in Table 3.5. The instrument was calibrated over three data points for CO, CO,, N,O, and CH, using He as a carrier gas, and then the samples were analyzed. The carrier was changed to N,, the calibration was performed for H2 only, and the samples were reanalyzed. A least-squares linear-regression routine was applied to the data set to generate the best fit for each compound. The quantitation for each analyte was performed by direct comparison of sample analyte peaks to the plot generated for the compound. The lowest calibration standard for each analyte is reported as the method detection limit. An MDL for the instrument has not been determined. An N, reagent blank, ambient air sample collected - 10 m upwind of B-103, and the ambient air collected through the VSS were used as method blanks and used to determine the potential for analyte interferences in the samples. Continuing calibration standards for this sample set fell within & 25% of the expected concentrations for the analytes reported.
3.3.1 Quantitation Results of Target Analytes. The quantitative-analysis results for the target analytes were calculated directly from the calibration curve generated using the IS method described above and in PNL-TVP-03. The conversion from ppbv to mg/m3 assumes standard temperature and pressure (STP) conditions of 760 torr and 273K and was calculated directly from the following equation:
3 - @pbv/lOOO) x g mol wt of compound mglm - 22.4 L/mol
3.3.2 Identification and Quantitation of Tentatively Identified Compounds. The tentatively identified compounds (TICS) are determined by mass-spectral interpretation and comparison of the spectra with the EPA/NIST/WILEY Library, which is a part of the HP 5971/5972 instrument operating system. Chromatographic peaks with an area count greater than, or equal to, one tenth of the total area count of the nearest eluting IS are tentatively identified and quantitatively estimated. The quality of the mass-spectral searches was then reviewed by the principal investigators before the identification was assigned to each chromatographic peak.
The concentration of each TIC was estimated using a relative response factor calculated using the total peak area for the nearest eluting IS. The IS peak area was used to calculate a response factor using the IS concentration in mg/m3:
IS conc. (m@m3) IS peak area
Response Factor = (3.2)
The calculated response factor was then multiplied by the TIC peak area to give an estimated concentration for that compound.
TIC (mg/m3) x 22.4 L/mol x loo0 TIC g mol wt
TIC in ppbv = (3.3)
The IS level added to all blank, standard, and sample injections was 104 ppbv for bromochloromethane, 101 ppbv for 1,6difluorobenzene, and 98.5 ppbv for chlorobenzene4. The IS concentrations were converted from ppbv to mg/m3 at STP using a molecular weight of 129.39 (g/mol) for bromochloromethane, 114.09 for 1,4difluorobenzene, and 117.6 for chlorobenzene4. All sample concentrations were multiplied by a factor of two to account for the dilution step described in Section 3.2.
3.4 Analysis Results
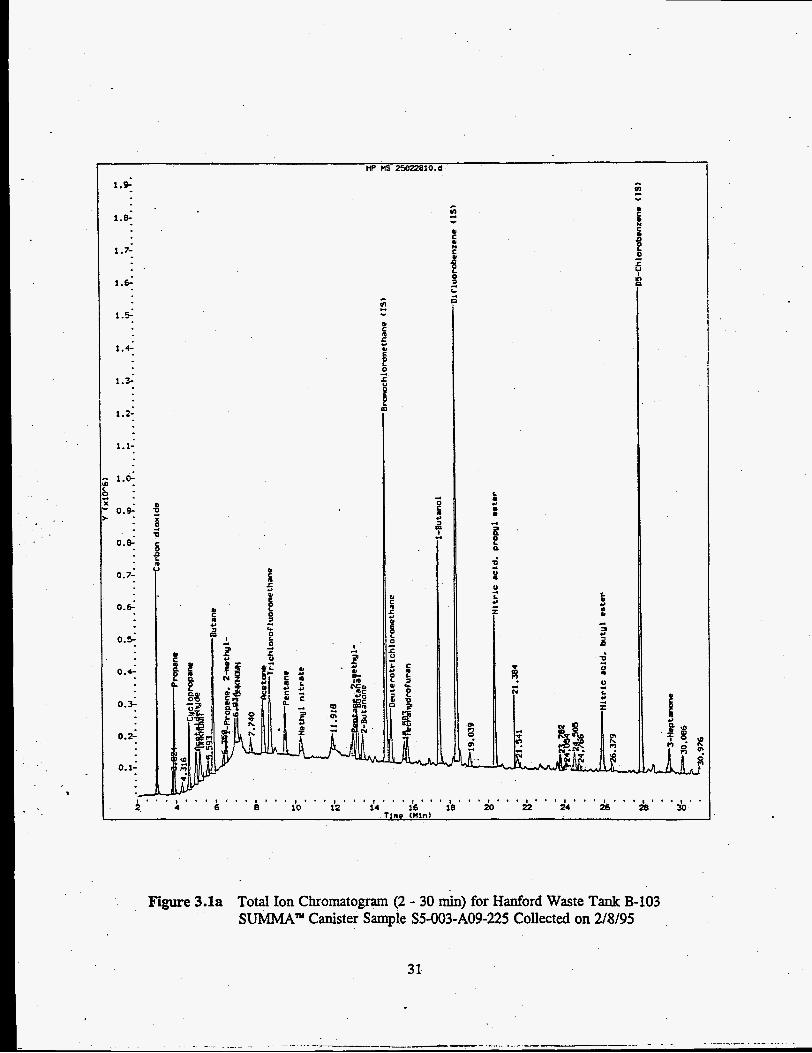
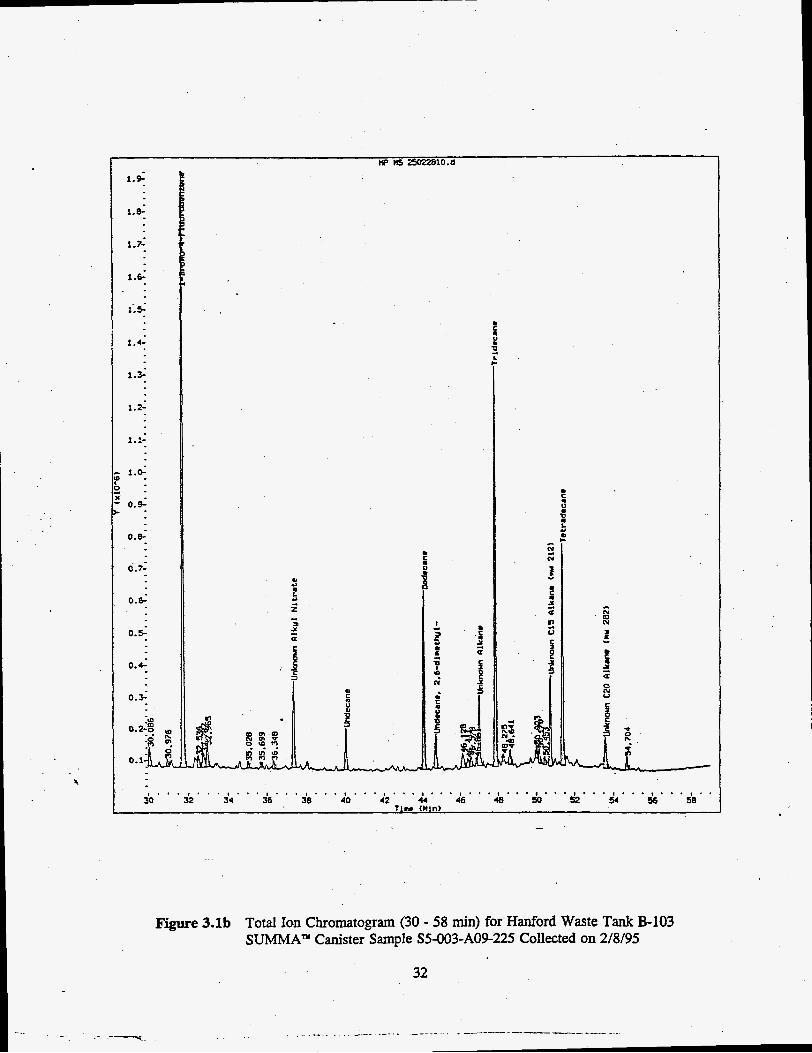
The results from the GUMS analysis of the tank-headspace samples are presented in Tables 3.1, 3.2, 3.3, and 3.4. The results of GC/MS analysis of ambient-air samples collected upwind of Tank B-103 and through the VSS near Tank B-103 are presented in Tables 3.5 and 3.6. The GC/TCD analysis results for permanent gases for both the ambient-air samples and the tank headspace are presented in Table 3.7. A representative total ion chromatogram showing the identity of major constituents is given in Figure 3.1.
Table 3.1 lists the quantitative results for compounds listed & target analytes. Five target analytes above the 5-ppbv MDL were detected in the tank samples. Trichlorofluoromethane and acetone accounted for 37% and 22% of the target analytes, respectively. The total target analytes concentration (3.28 pg/m3) accounted for 24% of the total compounds identified by both the target and TIC analyses.
Table 3.2 lists the semi-quantitative results for the TICs. The predominant species observed in this sample were tridecane, l-butanol, and tetradecane. The normal paraffin hydrocarbons (NPH), defined as n-alkanes from C,, to CIS, were observed at trace levels. The total concentration of the TIC compounds was found to be 10.26 mg/m3, which accounted for 76% of the total compounds identified by the target and TIC analyses.
SUMMA" canister PNL 153 was analyzed in replicate for target analytes and TICs to determine analytical precision. The relative percent difference (RPD) results are presented in Tables 3.3 and 3.4. The RPD was calculated for analytes detected above the detection limit and found in both replicates. All five target analytes had an RPD of less than 10%. Seventeen of the 22 TICs detected had RPDs less than 10%. Five TICs had RPDs greater than 10%.
Tables 3.5 and 3.6 list results of target andyte and TIC analyses, respectively, for ambient air collected upwind of Tank B-103 and ambient air collected through the VSS. Acetone was detected in the upwind sample. Acetaldehyde and 3-buten-2-one were observed through the VSS.
Table 3.7 lists results of permanent-gas analysis from samples collected from the headspace of Tank B-103, ambient air collected - 10 m upwind of the tank, and ambient air collected through the VSS. Permanent gases observed in the headspace were CO, and N,O. Carbon dioxide in the headspace was at a higher concentration than in ambient air. Nitrous oxide was not detected either in the ambient air collected - 10 m upwind of the Tank B-103 or ambient air collected through the VSS.
16
Carbon monoxide at 54 ppmv was measured in the ambient upwind sample. A replicate analysis was performed on SUMMA" canister 225 (see footnote c in Table 3.5).
17

4.0 Conclusions
The concentrations of selected inorganic and organic compounds were determined from samples of the headspace of Tank B-103 on 2/8/95. Sampling and analysis methods followed those described by Ligotke et al. (1994) and Clauss et al. (1994) for samples obtained from C-103, a tank containing a relatively complex headspace composition. Method-validation measurements during that study did appear to validate the trapping and analysis of NH3, but did not eliminate the possibility of interferences that could affect NO, results. It is recommended that additional control samples be obtained if a tank is discovered in the future to contain significant quantities of NO,. In the current sample job, NO, samples were obtained after fmt passing the sample flow through an NH3 trap. The average and standard deviation of the concentration results from inorganic sorbent trains were 8.8 f 0.8 ppmv (NH,), S0.02 ppmv (Nod, 0.46 f 0.06 ppmv (NO), and 10.8 f 0.3 mg/L (vapor- mass concentration). The vapor-mass concentration is expected to consist largely of water vapor. All analytical results were within the target criteria (* 25% precision, 70 - 130% accuracy, Carpenter, 1995) for inorganic analytes found at concentrations exceeding the lower target analytical limits (see Table 2.1).
Organic analysis of the tank-headspace samples from Tank B-103 identified five target analytes above the 5-ppbv reporting cutoff and 26 TICs above the 10-ppbv reporting cutoff. Twenty three TICs were identified in two or more of the SUMMA" samples. The total target analytes concentration accounted for 24% of the total compounds identified by both the target analyte and TIC analyses. Trichlorofluoromethane and acetone accounted for 37% and 22% of the target analytes, respectively. Trichlorofluoromethane and acetone accounted for 12% and 5% of the total compounds identified by both the target analyte and TIC analyses. Tentatively identified compounds accounted for 76% of the total compounds identified by both the target analyte and TIC analyses. Tridecane was the highest concentration TIC measured, accounting for 16% of the TICs and 12% of the total compounds identified by both the target analyte and TIC analyses. The results of the TIC analysis identified numerous NPH-type compounds as the predominant species (by number) present in the tank-headspace samples. Results of replicate analysis on a single SUMMA"' canister observed all five target analytes and 17 of the 22 TICs having an RPD of less than 10%. Acetone was observed in the upwind ambient-air sample. Acetaldehyde and 3-buten-2-one were observed through the VSS sample. Two permanent gases, CO, and N,O, were also detected in the tank-headspace samples. Carbon monoxide was observed in the upwind ambient-air sample.
19

5.0 References
Carpenter, B. C. 1995. Tank 241-B-103 Tank Characterizm'on Plan. WHC-SD-WM-TP-250, Westinghouse Hanford Company, Richland, Washington.
Clauss, T. W., M. W. Ligotke, B. D. McVeety, K. H. Pool, R. B. Lucke, J. S. Fruchter, and S. C. Goheen. 1994. Vapor Space Characterizm'on of Waste Tank 241-BY-104: Results from Samples Collected on 6/24/94. PNL-10208. Pacific Northwest Laboratory, Richland, Washington.
Ligotke, M. W., K. H. Pool, and B. D. Lerner. 1994. Vapor Space Characterization of Waste Tank 241 -C-1 03: Inorganic Resultsfrom Sample Job 7B (5/12/94 - 5/25/94). PNL-10172, Pacific Northwest Laboratory, Richland, Washington.
Mahlum, D. 1994. Toxicological Evaluation of Analytesfrom Tank 241-C-103. PNL-10189, Pacific Northwest Laboratory, Richland, Washington.
Osborne, J. W., J. L. Huckaby, E. R. Hewitt, C. M. Anderson, D. D. Mahlum, B. A. pulsipher, and J. Y. Young. 1994. Data Quality Objectives for Generic Zn-Tank Health and Safety Vapor Issue Resolution. WHC-SD-WM-DQO-002, Rev. O., Westinghouse Hanford Company, Richland, washington.
6.0 Further Reading
Pacific Northwest Laboratory. Analytical Laboratory Procedure Compendium. Procedures PNL- ALO-212, -226, -271. PNL-MA-599, Richland, Washington.
Pacific Northwest Laboratory. Quality Assurance Manual, Part 2: Good Practices Standard. PNL- MA-70, Part 2, Richland, Washington.
Pacific Northwest Laboratory. Quality Assurance Plan for Activities Conducted by the Analytical Chemistry Laboratory (ACL). MCS-033, Analytical Chemistry Laboratory, Richland, Washington.
Pacific Northwest Laboratory. 1994. Determination of TO-I4 Volatile Organic Compounds in Hanford Waste Tank Headspace Samples Using SUMMA Passivated Canister Sampling and Gas Chromutographic-Mass Spectrometry Analysis, PNL-TVP-03 (Rev. 0), PNL Technical Procedure, Richland, Washington.
Pacific Northwest Laboratory. 1994. Sample Shipping and Receiving Procedure - DRAFT for PNL Waste Tank Samples. PNL-TVP-07 (Rev. 0), PNL Technical Procedure, Richland, Washington.
21
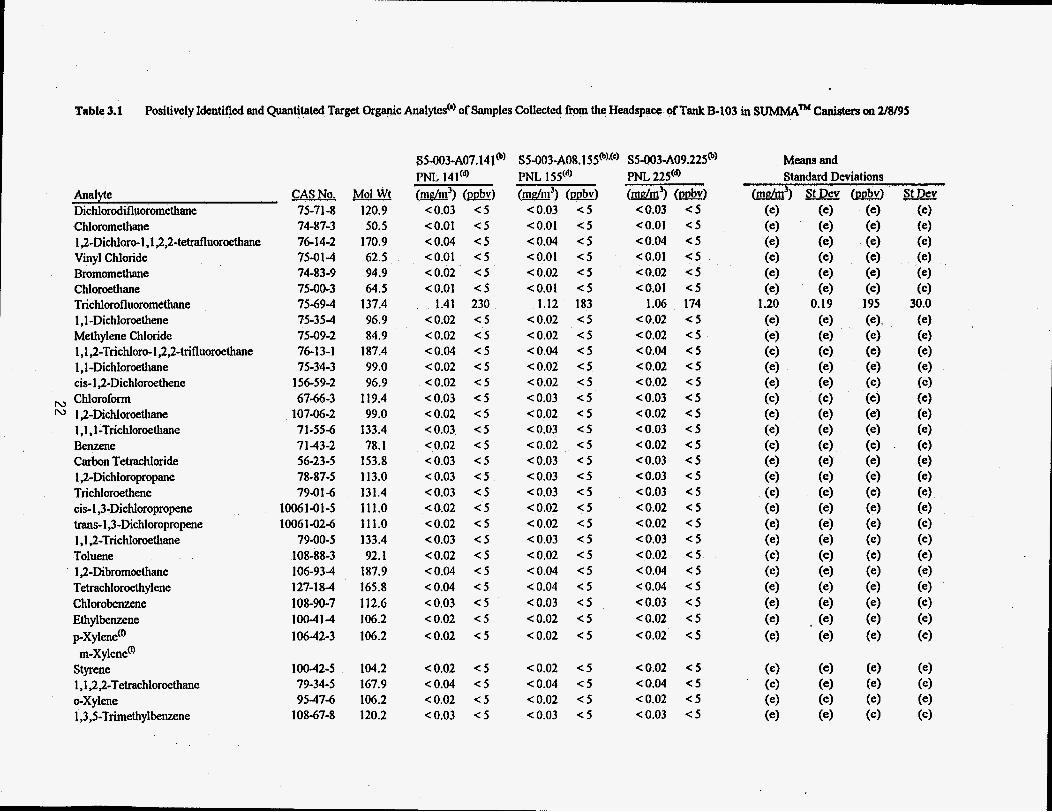
Table 3.1 Positively Identified and Quantitated Target Organic Analytes(') of Samples Collected from the Headspace of Tank B-103 in SUIbfMAm Canisters on 2/8/95
Analyte CAS No. Dichlorodifluoromethane 75-71 -8 Chloromethane 1,2-Dichloro-l ,I ,2,2-tetrafluoroethane Vinyl Chloride Bromomethane C hloroethane Trichlorofluoromethane 1,l -Dichloroethene Methylene Chloride 1 ,I ,2-Trichlor+l,2,2-trifluoroethane I ,I-Dichloroethane cis-I ,2-Dichloroethene Chloroform
1,l ,I-Trichloroethane Benzene Carbon Tetrachloride 1 ,2-Dichloropropane Trichloroethene cis-l,3-Dichloropropene trans-I ,3-Dichloropropene 1,1,2-Trichloroethane Toluene 1 ,2-Dibromoethane Tetrachloroethylene Chlorobenzene Ethylbenzene p-xylene'o m-xylcnc@
Styrene 1 ,I ,2,2-Tetrachloroethane 0-Xylene 1,3,5-Trimethylbenzene
po 1 ,2-Dichloroethane
74-87-3 76-14-2 75-01-4 74-83-9 75-00-3 75-69-4 75-35-4 75-09-2 76-13-1 75-34-3
156-59-2 67-66-3
107-06-2 71-55-6 71-43-2 56-23-5 78-87-5 79-01-6
1006 1-02-6 1006 1-01 -5
79-00-5 108-88-3 106-93-4 127-18-4 108-90-7 100-41-4 106-42-3
100-42-5 79-34-5 95-47-6
108-67-8
Mol Wt 120.9 50.5
170.9 62.5 94.9 64.5
137.4 96.9 84.9
187.4 99.0 96.9
119.4 99.0
133.4 78.1
153.8 113.0 131.4 111.0 111.0 133.4 92.1
187.9 165.8 112.6 106.2 106.2
104.2 167.9 106.2 120.2
S5-003-A07.14 I@) PNL 141(Q (mrr/m3) (Dtlb!!)
<0.03 < 5 <0.01 < 5 <0.04 < 5 <0.01 < 5 <0.02 < 5 <0.01 < 5
1.41 230 <0.02 < 5 <0.02 < 5 <0.04 < 5 <0.02 < 5 <0.02 < 5 <0.03 < 5 <0.02 < 5 ~ 0 . 0 3 < 5 <0.02 < 5 <0.03 < 5 <0.03 < 5 <0.03 < 5 <0.02 < 5 <0.02 < 5 <0.03 < 5 <0.02 < 5 <0.04 < 5 <0.04 < 5 <0.03 < 5 <0.02 < 5 <0.02 < 5
<0.02 < 5 <0.04 < 5 <0.02 < 5 <0.03 < 5
PNL 155(d) (I!&!3) (otlbv)
<0.03 < 5 <0.01 < 5 <0.04 < 5 CO.01 < 5 <0.02 < 5 CO.01 < 5
1.12 183 <0.02 < 5 <0.02 < 5 <0.04 < 5 <0.02 < 5 <0.02 < 5 <0.03 < 5 <0.02 < 5 <0.03 < 5 C0.02 < 5 <0.03 < 5 C0.03 < 5 <0.03 < 5 <0.02 < 5 <0.02 < 5 <0.03 < 5 <0.02 < 5 <0.04 < 5 <0.04 < 5 <0.03 < 5 <0.02 < 5 <0.02 < 5
PNL 225(@ (I!&!? (Dobv)
<0.03 < 5 <0.01 < 5 ~ 0 . 0 4 < 5 <0.01 < 5 <0.02 < 5 <0.01 < 5
1.06 174 <0.02 < 5 C0.02 < 5 <0.04 < 5 <0.02 < 5 <0.02 < 5 <0.03 < 5 <0.02 < 5 <0.03 < 5 C0.02 < 5 <0.03 < 5 <0.03 < 5 <0.03 < 5 <0.02 < 5 <0.02 < 5 <0.03 < 5 <0.02 < 5 <o.w < 5 <0.04 < 5 <0.03 < 5 <0.02 < 5 <O.O2 < 5
<0.02 < 5 <0.04 < 5 <0.02 < 5 <0.03 < 5
Means and Standard Deviations
(mg/m3) StDev (oobv) StDev
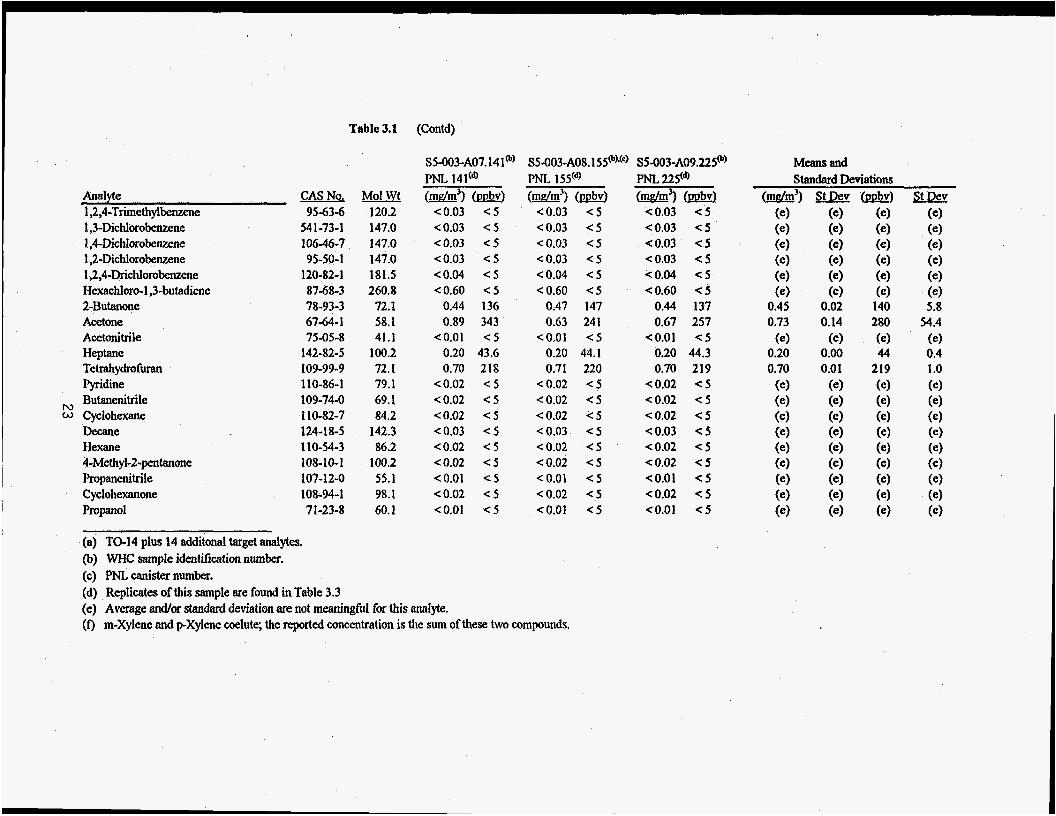
Analyte I ,2,4-Trimethylbenzene 1,3-Dichlorobenzene 1,4-Dichlorobentene 1,2-Dichlorobenzene 1,2,4-Drichlorobenzene Hexachloro-l,3-butadiene 2-Butanone Acetone Acelonitrile Heptane Tetrahydrofuran Pyridine Butanenitrile
w Cyclohexane Decane Hexane 4-MethyI-2-pentanone Propanenitrile Cyclohexanone Propanol
N
CAS No. 95-63-6
541-73-1 1064-7 95-50-1
120-82-1 87-68-3 78-93-3 67-64- 1 75-05-8
142-82-5 109-99-9 110-86-1 109-74-0 110-82-7 124- 1 8-5 110-54-3 108- 10- 1 107-1 2-0 108-94-1 7 1-23-8
Table 3.1
Mol Wt 120.2 147.0 147.0 147.0 181.5 260.8
72.1 58. I 41.1
100.2 72.1 79.1 69.1 84.2
142.3 86.2
100.2 55.1 98.1 60.1
(Contd)
S5403-A07.141@) PNL 141(@ (me/m3) (€?&I
<0.03 < 5 <0.03 < 5 <0.03 e5 <0.03 < 5 <O.M < 5 <0.60 < 5
0.44 136 0.89 343
<0.01 < s 0.20 43.6 0.70 218
<0.02 < s <0.02 < s <0.02 < s <0.03 < 5 c0.02 < 5 <0.02 < 5 <0.01 < 5 C0.02 c5 <0.01 c5
SS-003-A08.1 55@’(’) S5-003-A09.225@) PNL 15S(d) (E!&!’) (oobv)
<0.03 < 5 <0.03 < 5 <0.03 < 5 <0.03 < 5 <0.04 < 5 <0.60 < S
0.47 147 0.63 241
<0.01 < s 0.20 44.1 0.71 220
<0.02 < 5 <0.02 < s <0.02 < 5 <0.03 < 5 <0.02 < 5 c0.02 < 5 KO.01 < s <0.02 < 5 CO.01 < 5
(a) TO-14 plus 14 additonal target analytes. (b) WHC sample identification number. (c) PNL canister number. (d) Replicates of this sample are found in Table 3.3 (e) Average andor standard deviation are not meaningful for this analyte. ( f ) m-Xylene and pXylene coelute; the reported concentration is the sum of these two compounds.
PNL 2294 (!!&!l’) (oobvl
<0.03 < 5 <0.03 < 5 <0.03 < 5 <0.03 < 5 < O M < 5 <0.60 < S
0.44 137 0.67 257
CO.01 < 5 0.20 44.3 0.70 219
<0.02 < 5 x0.02 < 5 <0.02 < 5 <0.03 < 5 <0.02 < 5 <0.02 < 5 <0.01 < 5 <0.02 < 5 <0.01 < 5
Means and Standard Deviations
St Dev @&) StDev
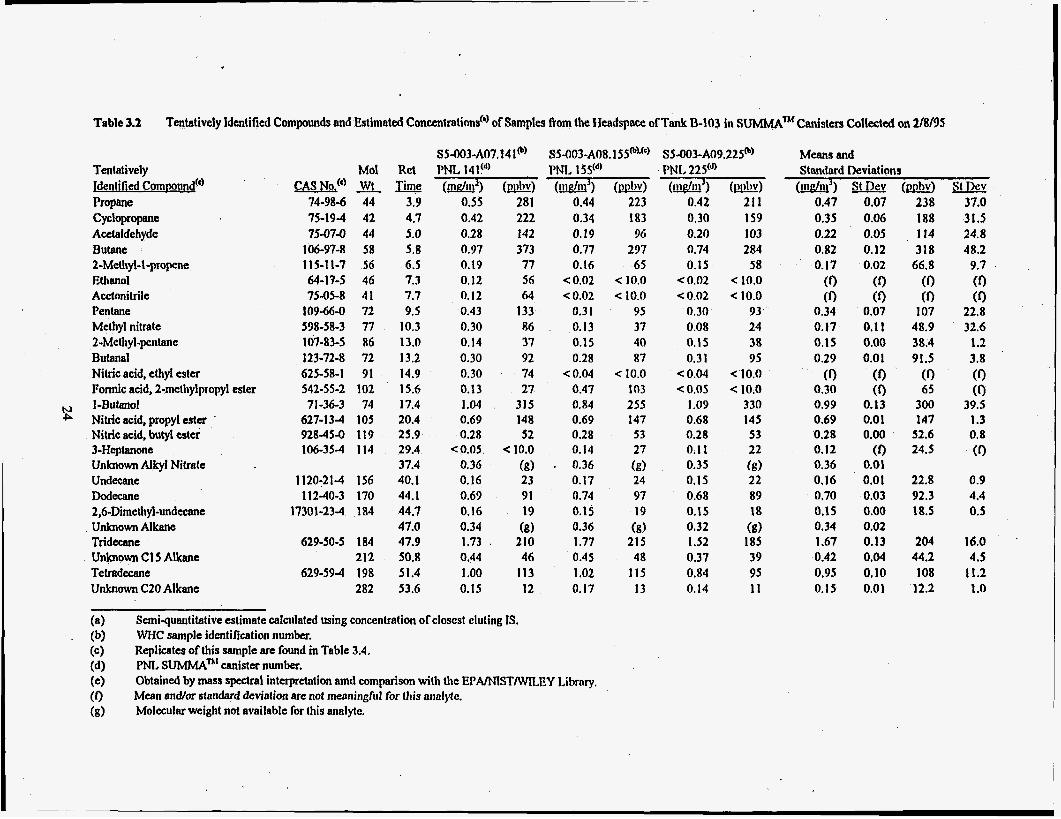
Table 3.2 Tentatively Identified Compounds and Estimated Concentrations(‘) of Samples from the IJeadspace of Tank B-103 in SUMMAm Canisters Collected on 2/8/95
Tentalively Identified Cornpu@(’) Propane Cyclopropane Acetaldehyde Butane 2-Methyl4 -propene Ethanol Acelonilrile Pentane Methyl nitrate 2-Methyl-pentane Butanal Nitric acid, ethyl ester Formic acid, 2-methylpropyl ester
Nitric acid, propyl ester ’
Nitric acid, butyl ester 3-Heptanone Unknown Alkyl Nitrate Undecane Dodecane 2,6-Dimelhyl-undecane Unknown Alkane Tridecane Unknown CI 5 Alkane Tetradecane Unknown C20 Alkane
hl I - B ~ t a n ~ l
Mol CAS No?)
74-986 44 75-19-4 41 75-076 44
106-97-8 58 115-11-7 56 64-17-5 46 75-05-8 41
109-666 72 598-58-3 77 107-83-5 86 123-72-8 72 625-58-1 91 542-55-2 102 71363 74
627-13-4 105 928-45-0 119 106-35-4 114
1120-21-4 156 112-40-3 170
17301-23-4 184
629504 184 212
629-594 198 282
Ret Time
3.9 4.7 5.0 5.8 6.5 7.3 7.7 9.5
10.3 13.0 13.2 14.9 15.6 17.4 20.4 25.9 29.4 37.4 40.1 44.1 44.7 47.0 47.9 50.8 51.4 53.6
S5-O3-AO7.14 I@) S5-003-A08.155’b)*(‘) PNL 141fd’ PNI, 1 SSCd)
(&J) 0.55 0.42 0.28 0.97 0.19 0.12 0.12 0.43 0.30 0.14 0.30 0.30 0.13 I .04 0.69 0.28
< 0.05 0.36 0.16 0.69 0.16 0.34 1.73 0.44 I .oo 0.15
(Pubv) 28 I 222 142 373 77 56 64
133 86 37 92 74 27
315 148 52
< 10.0 (g) 23 91 19 (€9
210 46
113 12
(melm’) (nnb!!) 0.44 223 0.34 183 0.19 96 0.77 237 0.16 65
<0.02 < 10.0 <0.02 < 10.0
0.3 I 95 0.13 37 0.15 40 0.28 87
<0.04 10.0 0.47 103 0.84 255 0.69 147 0.28 53 0.14 27
t 0.36 (g) 0.17 24 0.74 97 0.15 19 0.36 (l3) 1.77 215 0.45 48 I .02 115 0.17 13
(a) . (b) WHC! sample identification number.
(c) (d) PNL SUMMAn‘ canister number. (e) (0 (g)
Semiquantitative estimate calculated using concentration of closcst eluting IS,
Replicates of this sample tue found in Table 3.4,
Obtained by mass spectral interpretation amd comparison with the EPARJISTWLEY Library. Mean andlor standard deviation are not meaningful for Uiis annlytc. Molecular weight not available for this analyte.
PNI, 225“ (I&$) (&)
0.42 21 1 0.30 159 0.20 103 0.74 284 0.15 58
e0.02 < 10.0 <0.02 < 10.0
0.30 93 0.08 24 0.15 38 0.3 1 95
<0.04 < 10.0 xo.05 < 10.0
1.09 330 0.68 145 0.28 53 0.1 1 22 0.35 (g) 0.15 22 0.68 89 0.15 18 0.32 (g) 1.52 185 0.37 39 0.84 95 0.14 I 1
Means and Standard Deviations (a’) St Dev
0.47 0.35 0.22 0.82 0.17 (1) (1)
0.34 0.17 0.15 0.29 (1)
0.30 0.99 0.69 0.28 0.12 0.36 0.16 0.70 0.15 0.34 1.67 0.42 0.95 0.15
0.07 0.06 0.05 0.12 0.02
(9 (1)
0.07 0.1 1 0.00 0.0 1
(0 (9
0.13 0.0 1 0.00 (1)
0.01 0.0 1 0.03 0.00 0.02 0.13 0.04 0.10 0.01
Il?I!w 238 188 I14 318
66.8 (0 (0
107 48.9 38.4 91.5
65 300 147
52.6 24.5
22.8 92.3 18.5
204 44.2 I08
12.2
(1)
SI k v 37.0 31.5 24.8 48.2
9.7 (1) (0
22.8 32.6
1.2 3.8 (1) (9
39.5 I .3 0.8 (1)
0.9 4.4 0.5
16.0 4.5
11.2 1 .o
N cn
Table 3.3 Positively Identified and Quantitated Target Organic Analyted") of Replicate Analyses of a Single SUMMAm Canister Collected from the Headspace of Tank B-103 on 2/8/95
Analyte CAS No. Mol Wt Dichlorodifluoromethane 75-71-8 120.9 Chloromethane I ,2-Dichloro-l ,I ,2,2-tetrdluoroethane Vinyl Chloride Bromomethane Chloroethane Trichlorofluoromethane 1 ,I-Dichloroethene Methylene Chloride 1,1,2-Trichloro-l ,2,2-trifluoroethane 1, I -Dichloroethane cis-I ,2-Dichloroethene Chloroform 1,2-Dichloroethane 1,l ,I-Trichloroethane Benzene Carbon Tetrachloride 1,22-Dichloropropane Trichloroethene cis-I ,3-Dichloropropene trans-I ,3-Dichloropropene 1 ,I ,2-Trichloroethane Toluene 1,2-Dibromoethane Tetrachloroethylene Chlorobenzene Ethylbenzene pXylene(@ rn-Xylene(4
Styrene 1, I ,2,2-Tetrachloroethane o-Xylene
74-87-3 50.5 76-14-2 170.9 75-01-4 62.5 74-83-9 94.9 75-00-3 64.5 75-69-4 137.4 75-35-4 96.9 75-09-2 84.9 76-1 3-1 187.4 75-34-3 99.0
156-59-2 96.9 67-66-3 119.4
107-06-2 99.0 71-55-6 133.4 71-43-2 78.1 56-23-5 153.8 78-87-5 1 13.0 79-01-6 131.4
0061-01-5 11 1.0 0061-02-6 111.0
79-00-5 133.4 108-88-3 92.1 106-93-4 187.9 127-18-4 165.8 108-90-7 112.6 100-41-4 106.2 106-42-3 106.2
100-42-5 104.2 79-34-5 167.9 95-47-6 106.2
< 0.03 < 0.01 < 0.04 <0.01 < 0.02 < 0.01
1.12 < 0.02 < 0.02 < 0.04 < 0.02 < 0.02 < 0.03 < 0.02 < 0.03 < 0.02 < 0.03 < 0.03 < 0.03 < 0.02 < 0.02 < 0.03 < 0.02 < 0.04 < 0.04 < 0.03 < 0.02 < 0.02
< 0.02 < 0.04 < 0.02
Relative S4087-A08.153@) Percent PNL 153(') Difference rn3) @&E) - % < 0.03 < 0.01 < 0.04 <0.01 < 0.02 < 0.01
1.13 < 0.02 < 0.02 < 0.04 < 0.02 < 0.02 < 0.03 < 0.02 < 0.03 < 0.02 < 0.03 < 0.03 < 0.03 < 0.02 < 0.02 < 0.03 < 0.02 < 0.04 < 0.04 < 0.03 < 0.02 < 0.02
< 0.02 < 0.02 < 0.02
B-103 Table 3.3 (Contd)
Analyte 1,3,5-Trimethylknzene 1,2,4-Trimethylbenzene 1,3-Dichlorobenzene 1,4-Dichlorobenzene 1,2-DichlorobenZene 1,2,4-Drichlorobenzene Hexachloro-l,3-butadiene 2Butanone Acetone Acetonitrile Heptane Tetrahydrofuran Pyridine Butanenitrile Cyclohexane Decane Hexane 4-Methyl-2-pentanone Propanenitrile Cyclohexanone Propanol
CASNo, Mol Wt 108-67-8 120.2 95-63-6 120.2
541-73-1 147.0 10646-7 147.0 95-50-1 147.0
120-82-1 181.5 87-68-3 260.8 78-93-3 72.1 67-64-1 58.1 75-05-8 41.1
142-82-5 100.2 109-99-9 72.1 110-86-1 79.1 109-74-0 69.1 110-82-7 84.2 124-18-5 142.3 110-54-3 86.2 108-10-1 100.2 107-12-0 55.1 108-94-1 98.1 71-23-8 60.1
< 0.03 < 0.03 < 0.03 < 0.03 < 0.03 < 0.04 < 0.60
0.47 0.63
< 0.01 0.20 0.71
< 0.02 < 0.02 < 0.02 < 0.03 < 0.02 < 0.02 < 0.01 < 0.02 < 0.01
Relative S4087-AOS. 153@) Percent PNL I 53@ Diffaenw m3) W ) - %
< 0.03 < 0.03 < 0.03 < 0.03 < 0.03 < 0.03 < 0.04
0.48 0.59
< 0.01 0.2 1 0.71
< 0.02 < 0.02 -c 0.02 -c 0.02 < 0.02 < 0.03 < 0.02 < 0.02 < 0.01
(a) TO-14 plus 14 additonal target analytes. (b) W C sample identification number. (c). PNL canister number. . . (d) m-Xylene and p-Xylene coelute; the reported concentration is the sum of these two compounds.
< 5 < 5 < 5 < 5 < 5 < 5 < 5 . 149 2.1 227 6.6 < 5
46.6 4.9 222 0.0 < 5 < 5 < 5 < 5 < 5 < 5 < 5 < 5 < 5
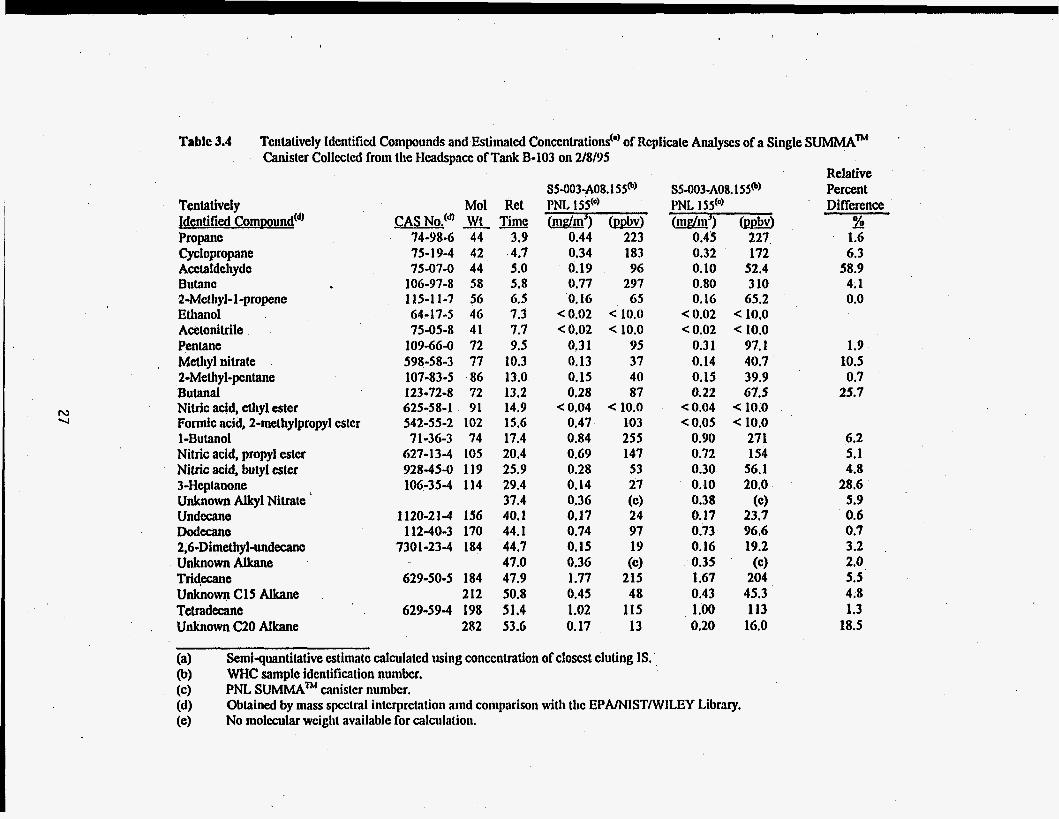
Table 3.4 Tentatively Identified Compounds and Estirnatcd Concentrations'" of Rcplicatc AM~YSCS of a Single SUMMAm Canister Collccled from the Hcadspacc of Tank B-103 on 2/8/95
Relative S5-O03-A08.155@) SS-OO3-A08.155@) Percent
Tentatively Jdentified Comuound'd' Propane Cyclopropane Acctaldeliyde Bulanc 2-Methyl-1-propene EU~anol Acetonitrile Pentane Methyl nitrate 2-Methyl-pcnlane Butanal Nitric acid, clhyl ester Formic acid, 2-metlrylpropyl eslcr 1 -Butanol Nitric acid, propyl estcr Nitric acid, butyl ester 3-Heplanone Unknown Alkyl Nitrate ' Undecana DodeGlIIe 2,6-Dimetl~yl-undecana Unknown Alkane Tridecane Unknown C15 Alkane Tetradecane Unknown C20 Alkane
Mol Ret CAS No.'d) Wt Time
74-98-6 44 3.9 75-19-4 42 4.7 75-07-0 44 5.0
106-97-8 58 5.8 115-11-7 56 6.5 64-17-5 46 7.3 75-05-8 41 7.7
10946-0 72 9.5 598-58-3 77 10.3 107-83-5 86 13.0 123-72-8 72 13.2 625-58-1 91 14.9 542-55-2 102 15.6 71-36-3 74 17.4
627-13-4 105 20.4 928-45-0 119 25.9 106-35-4 114 29.4
37.4 1120-21-4 156 40.1 112-40-3 170 44.1
7301-23-4 184 44.7
629-50-5 184 47.9 47.0
212 50.8 629-59-4 198 51.4
282 53.6
PNL 155"') (mdm') (~J&vJ
0.44 223 0.34 183 0.19 96 0.77 297 0.16 65
qo.02 < 10.0 <0.02 < 10.0
0.3 1 95 0.13 37 0.15 40 0.28 87
<0.04 < 10.0 0.47 103 0.84 255 0.69 147 0.28 53 0.14 27 0.36 (c) 0.17 24 0.74 97 0.15 19 0.36 (e) 1.77 215 0.45 48 1.02 115 0.17 13
PNL ISS(O) ( n i d d )
0.45 227 0.32 172 0.10 52.4 0.80 310 0.16 65.2
<0.02 < 10.0 <0.02 < 10.0
0.31 97.1 0.14 40.7 0.15 39.9 0.22 67.5
xO.04 < 10.0 <0.05 < 10.0
0.90 271 0.72 154 0.30 56.1 0.10 20.0 0.38 (e) 0.17 23.7 0.73 96.6 0.16 19.2
1.67 204 0.43 45.3 1.00 113 0.20 16.0
0.35 (c)
(a) (b) WHC sample idcntification numbcr. (c) PNL SUMMA^ canistcr number. (d) (e)
Semiquantitative estimatc calculated using conccntration of closcst eluting IS.
Obtained by mass spcctral inlcrprclation atnd comparison with tlic EPAMISTIWILEY Library, No molccular wciglit availablc for calculation.
' Diflerence %
1.6 6.3
58.9 4; 1 0.0
1.9 10.5 0.7
25.7
6.2 5.1
28.6 5.9 0.6 0.7 3.2 2.0 5.5 4.8 1.3
4.8
18.5
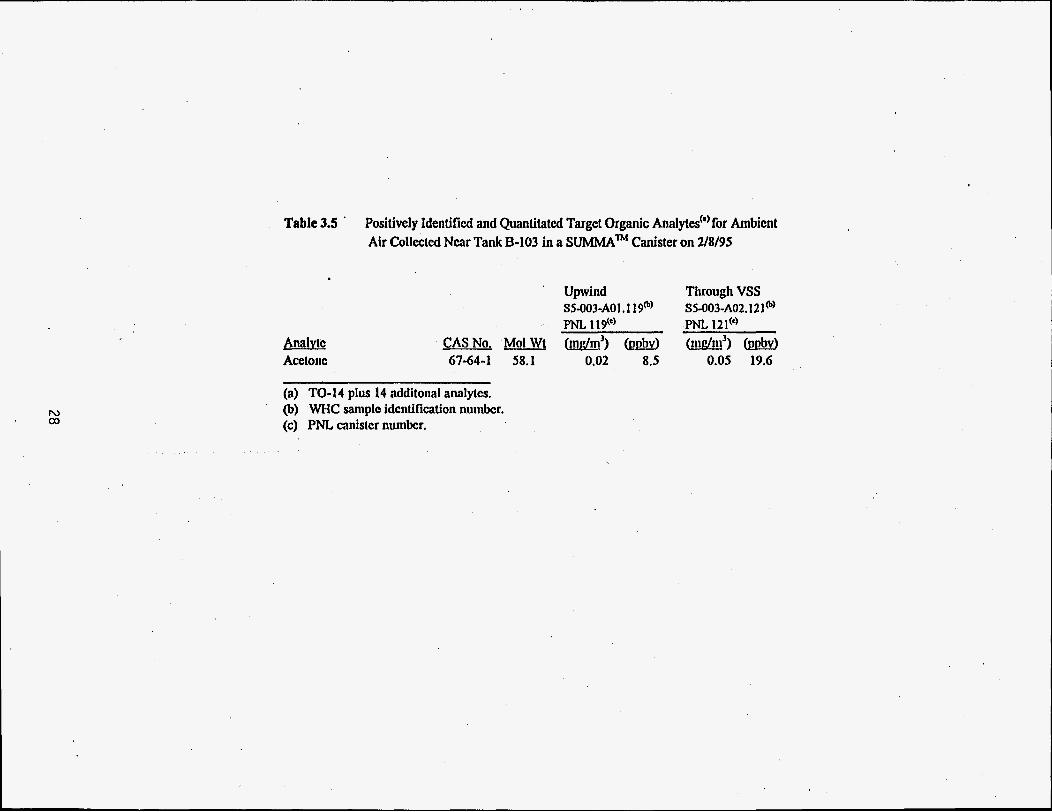
Table 3.5 ’ Positively Identified and Quantitated Target Organic Analytes(”for Ambient Air Collected Near Tank E-103 in a SUMMAm Canister on 2/8/95
Upwind S5-003-AOI. I 19”
Through VSS SS-003-AO2.12 I”
Analvte CAS No. Acetone 1744-1
(a) TO-14 plus 14 additonal atulytes.
58.1 0.02 8.5 0.05 19.6
N 03
(b) WHC samplc identification nutnkr. (c) PNL canister number.
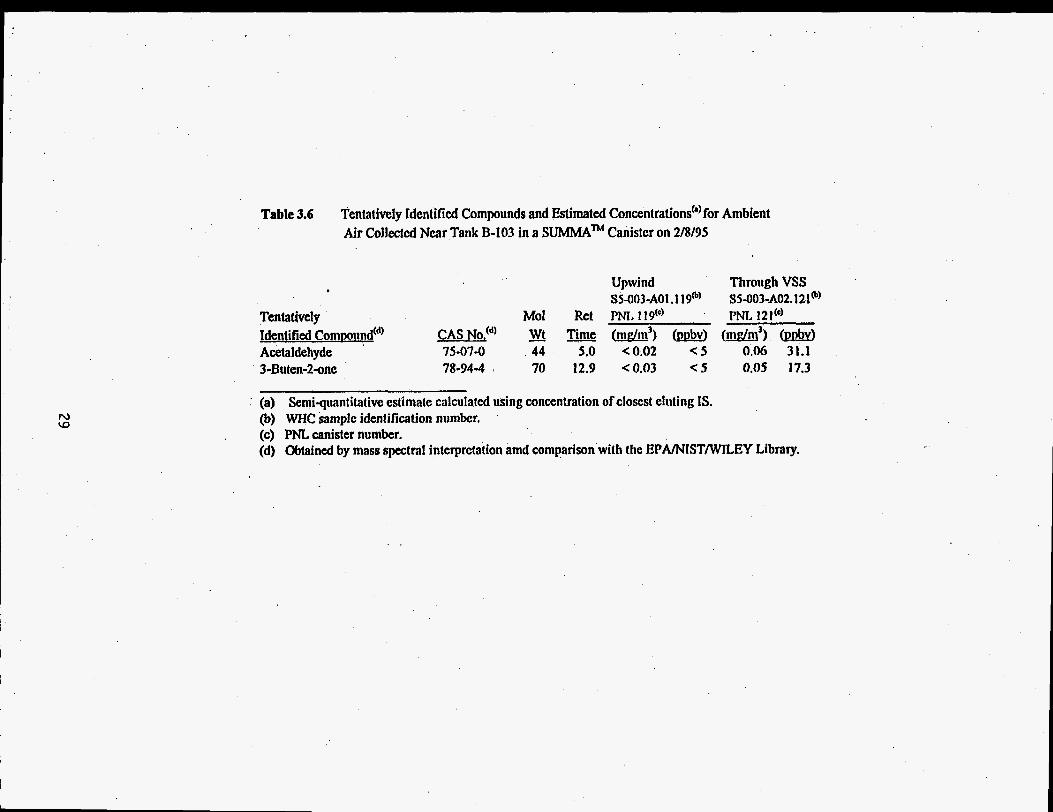
Table 3.6 Tentatively Identified Compounds and Estimated Concentrations(’)for Ambient Air Collected Near Tank B-103 in a SUMMAm Canister on 2/8/95
Upwind Through VSS SS-OO3-AOI . I 19”) S5-003-AO2.121@)
Tentatively Mol Ret PNL I19(‘) PNI, 1 2 1 Identified Compound(d) CASNO!~) Wt Time (mdm’) (@wJ (mdm’) (Dnbv) Acetaldehyde 75-07-0 44 5.0 <0.02 c5 0.06 31.1 3 -Buten-Z-one 78-94-4 1 70 12.9 <0.03 < 5 0.05 17.3
(a) SemGuantitative estimate calculated using concentration of closest eluting IS. (b) WHC sample identification numbcr. (c) PNL, canister number. (d) Obtained by mass spectral interpretation amd comparison with the EPA./NIST/WTLEY Library.
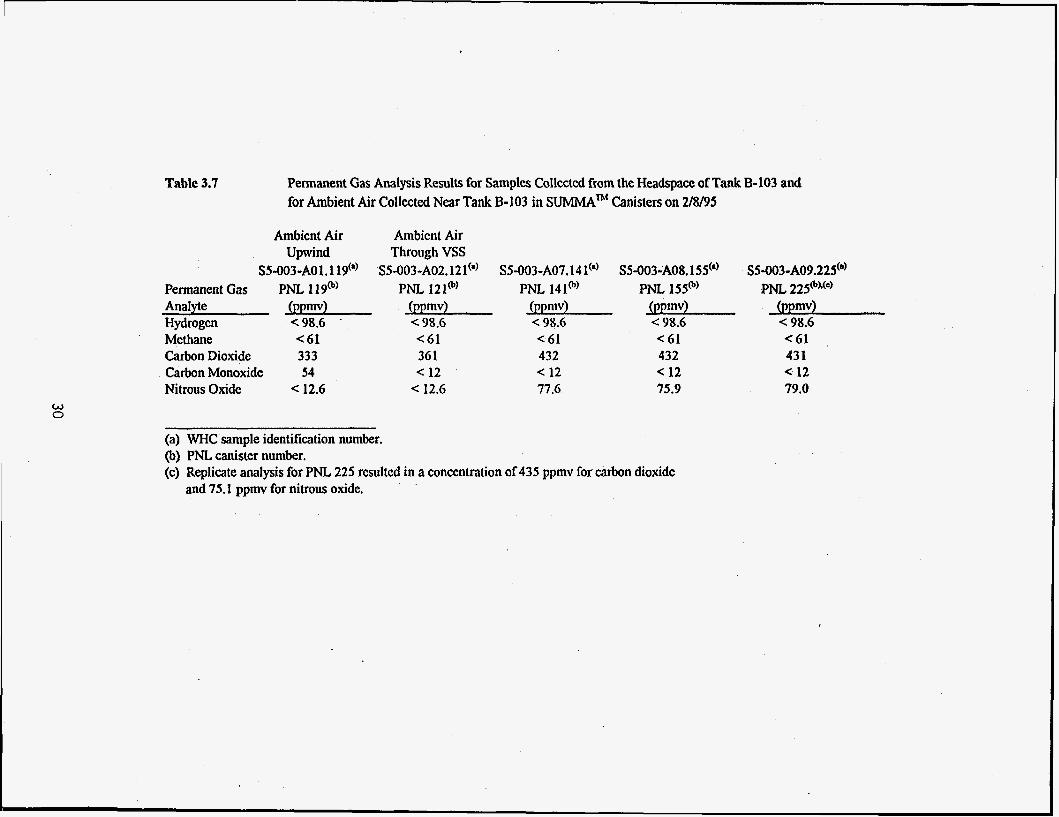
Table 3.7 Permanent Gas Analysis Results for Samples Collected from the Headspace of Tank B-103 and for Ambient Air Collected Near Tank B-103 in SUMMAm Canisters on 2/8/95
Ambient Air Ambient Air Upwind Through VSS
S5-003-AO1. 119'"' S5-003-AO2.121'"' S5-003-AO7.141'"' S5-003-AOS.155'" S5-003-AO9.225" Permanent Gas PNL 119@') PNL 121" PNL 141@' PNL 155" PNL 225cbxcc) Analyte (ppmv) (ppmv) (PPmv) (PPmv) Hydrogen <98.6 . 98.6 < 98.6 < 98.6 Methane Carbon Dioxide Carbon Monoxide Nitrous Oxide
C 61 333 54
< 12.6
< 61 36 1 < 12 12.6
< 61 432 < 12 77.6
C 61 432 < 12 75.9
w 0
(a) WHC sample identification number. (b) PNL canister number. (c) Replicate analysis for PNL 225 rcsultcd in a concentration of 435 ppmv for carbon dioxide
and 75.1 ppmv for nitrous oxide.
(ppmv) < 98.6 C 61 43 1 12
79.0
. , .
1.-
1.C
1.7-
1.G
1.5'.
1.4-
1.3:
1.2-
1.1-
; 1.-
: 0.-
0.-
1 - , -
0.7-
0.G
0.-
0.L
O S
0.2:
0.1-
-c
4.
c
E "
0' e !! a
I)
2 x 8 7 V
z L CI T I
Figure 3.la Total Ion Chromatogram (2 - 30 &) for Hanford Waste Tank B-103 SUMMAm Canister Sample S5-003-AO9-225 Collected on 2/8/95 .
31
HP n5 25022810.4
1.e
1.g 1.7:
1.G * .
I-.?
'.C
1 . i
1.2-
1.1-
1.-
0.-
0.g 0.7-
0 . i
0.G
0 . 1
0 . i
. , . . . . . . . . * . &. . .410* . ' & . . .&. I '4,6' . . .& ' . .& ' . . . * . . . * i o & i 4 is d4 Sk ;E
lime Win)
Figure 3.lb Total Ion Chromatogram (30 - 58 min) for Hanford Waste Tank B-103 SUMMA"' Canister Sample S5-003-AO9-225 Collected on 2/8/95
32
. , .. _ j .. ___ ~ .. - -____
No. of Copies
Offsite
Distribution
No. of Copies
Onsite
2 DOE/Office of Scientific and Technical 2 Information
R. A. Jenkins Oak Ridge National Laboratory P.O. Box 2008 Building 4500-5, MS 6120 Oak Ridge, Tennessee 37831-6120
B. C. Kowalski CPAC University of Washington
Seattle, Washington 98195 MS BG-10
8
20
Dist. 1
DOE Richland ODerations Office
M. F. Jarvis, S7-54 J. F. Thompson, Jr. S7-54
Corns of Engineers
T. W. Gardner-Clayson, A5-19
Westinghouse Hanford ComDanv
H. Babad, R2-78 D. R. Bratzel, S7-31 (2) S. J. Eberlien, R2-12 J. G. Kristofzski, K2-12 N. W. Kirch, E-11 J. M. Garcia, R3-01 J. E. Meacham, S7-15
Pacific Northwest Laboratow
PNL- 10704 UC-606
T. W. Clauss, P8-08 K. H. Pool, P8-44
B. D. McVeety, K6-84 K. B. Olsen, K6-96 J. S. Fruchter, K6-96 S. C. Goheen, P8-OS M. W. Ligotke P7-59 (6)
K. L. Silvers, P7-27 Technical Report Files (5)
B. L. Tho-, K9-25
J. L. Huckaby, K6-55