Embed Size (px)
Citation preview

PNAIR ConferenceNovember 8, 2012
Tim NorrisEducation Research and Data Center
Washington StateOffice of Financial Management
Using workforce information to help
identify future needs

Session Agenda
What’s available?Where can I get it?How can I use it?

In a Nutshell
Workforce information
Three components
Industry Employment levels, number of companies
Occupations What are people doing What skills are needed
Education Bridging together employer needs and skills of
workers
Bombarded with Acronyms???
USDOL
SOCNAICS
UI
LMICIP
Coding Systems
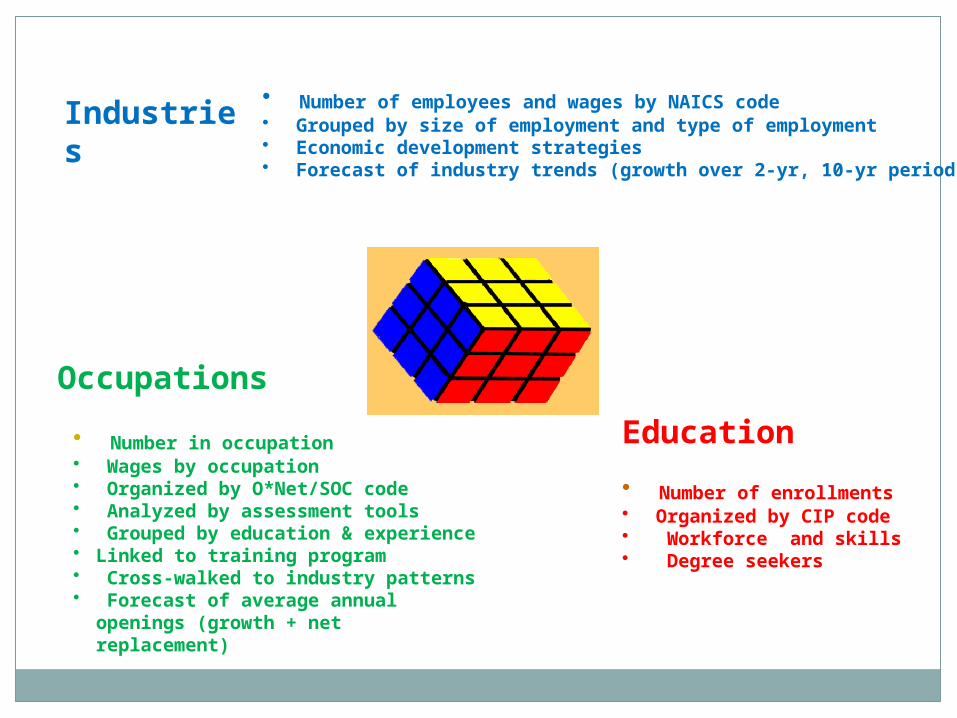
• Number of employees and wages by NAICS code • Grouped by size of employment and type of employment• Economic development strategies• Forecast of industry trends (growth over 2-yr, 10-yr period)
Industries
Occupations
• Number in occupation• Wages by occupation• Organized by O*Net/SOC code• Analyzed by assessment tools• Grouped by education & experience• Linked to training program• Cross-walked to industry patterns• Forecast of average annual openings
(growth + net replacement)
Education
• Number of enrollments • Organized by CIP code• Workforce and skills • Degree seekers
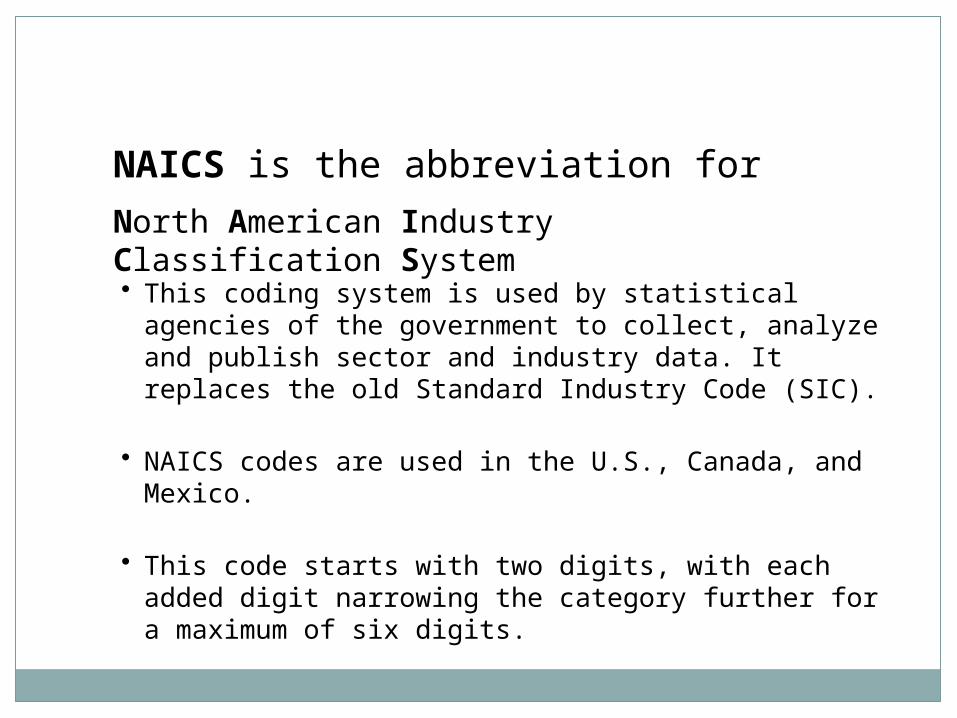
NAICS is the abbreviation for
North American Industry Classification System• This coding system is used by statistical agencies of the
government to collect, analyze and publish sector and industry data. It replaces the old Standard Industry Code (SIC).
• NAICS codes are used in the U.S., Canada, and Mexico.
• This code starts with two digits, with each added digit narrowing the category further for a maximum of six digits.
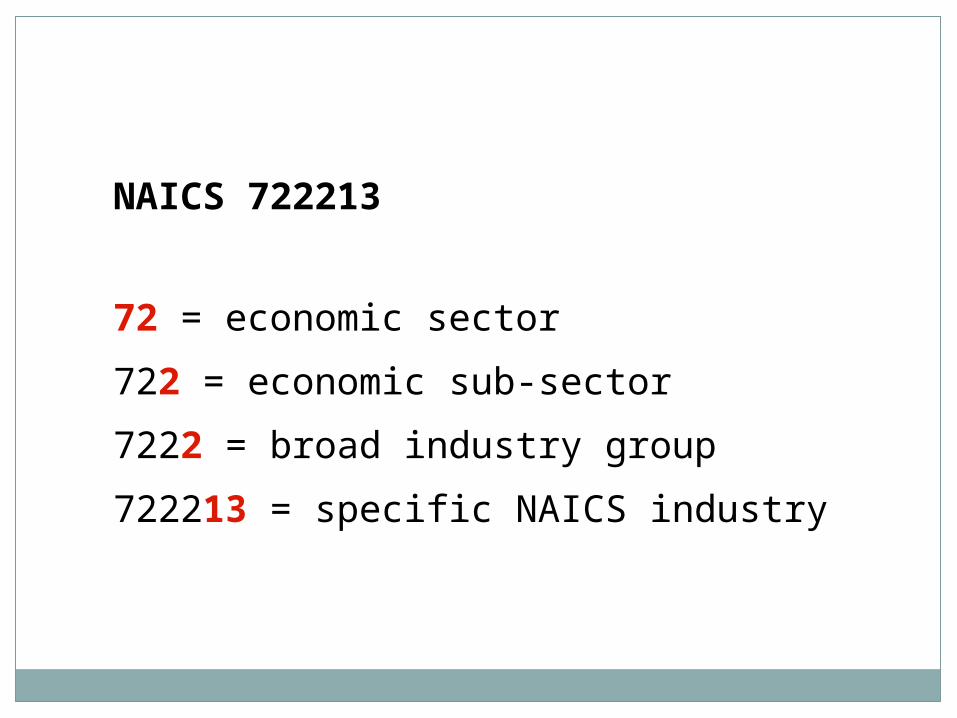
NAICS 722213
72 = economic sector
722 = economic sub-sector
7222 = broad industry group
722213 = specific NAICS industry
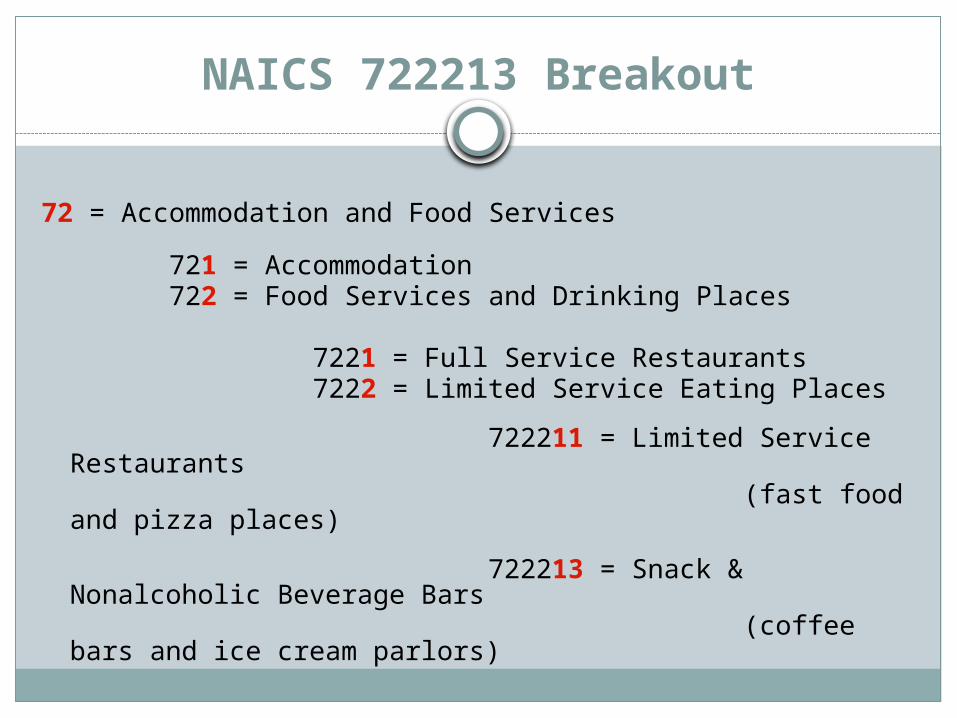
NAICS 722213 Breakout
72 = Accommodation and Food Services
721 = Accommodation 722 = Food Services and Drinking Places
7221 = Full Service Restaurants 7222 = Limited Service Eating Places
722211 = Limited Service Restaurants (fast food and pizza places)
722213 = Snack & Nonalcoholic Beverage Bars
(coffee bars and ice cream parlors)
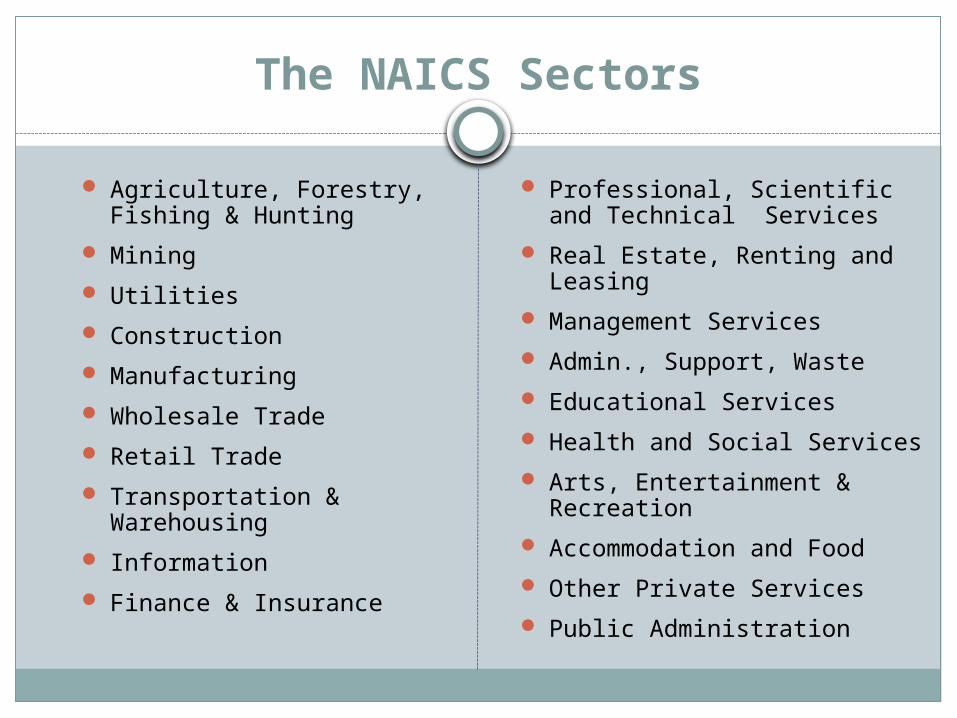
The NAICS Sectors
Agriculture, Forestry, Fishing & Hunting
Mining
Utilities
Construction
Manufacturing
Wholesale Trade
Retail Trade
Transportation & Warehousing
Information
Finance & Insurance
Professional, Scientific and Technical Services
Real Estate, Renting and Leasing
Management Services
Admin., Support, Waste
Educational Services
Health and Social Services
Arts, Entertainment & Recreation
Accommodation and Food
Other Private Services
Public Administration
Occupation coding
Describes what people do
Work characteristics of those who do
Common personality traits
Used by all federal programs when looking at occupations
www.onetcenter.org
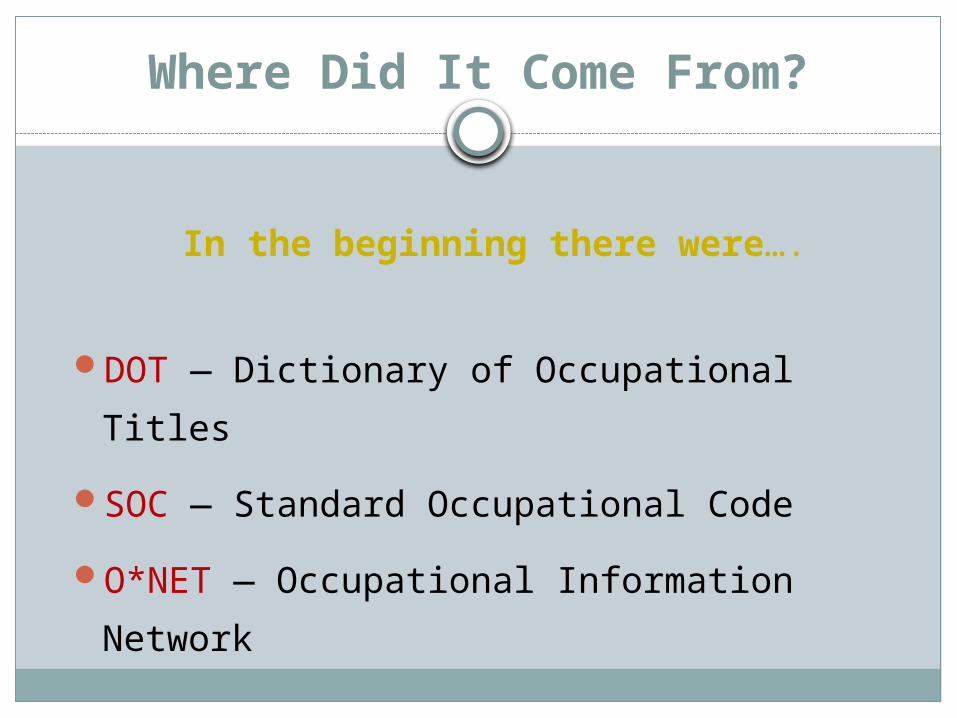
Where Did It Come From?
In the beginning there were….
DOT — Dictionary of Occupational Titles
SOC — Standard Occupational Code
O*NET — Occupational Information
Network
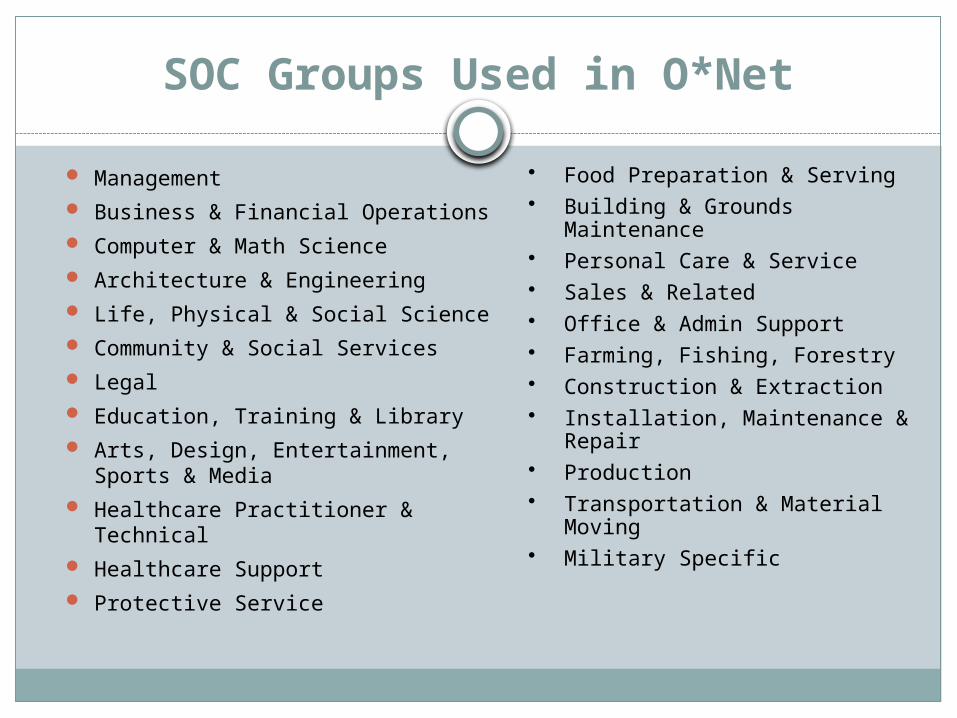
SOC Groups Used in O*Net
Management Business & Financial Operations Computer & Math Science Architecture & Engineering Life, Physical & Social Science Community & Social Services Legal Education, Training & Library Arts, Design, Entertainment, Sports
& Media Healthcare Practitioner & Technical Healthcare Support Protective Service
• Food Preparation & Serving• Building & Grounds Maintenance• Personal Care & Service• Sales & Related• Office & Admin Support• Farming, Fishing, Forestry• Construction & Extraction• Installation, Maintenance &
Repair• Production• Transportation & Material
Moving• Military Specific
O*Net: The Occupational Information Network
This coding system is used by statistical agencies of the government to collect, analyze and publish occupational data. It replaces the old Dictionary of Occupational Titles (DOT).
This coding system includes all types of jobs and allows query of job titles, skills and tasks.
The O*Net code has eight digits. The Standard Occupational Code (SOC) comprises the first six digits. Each digit narrows the category further.
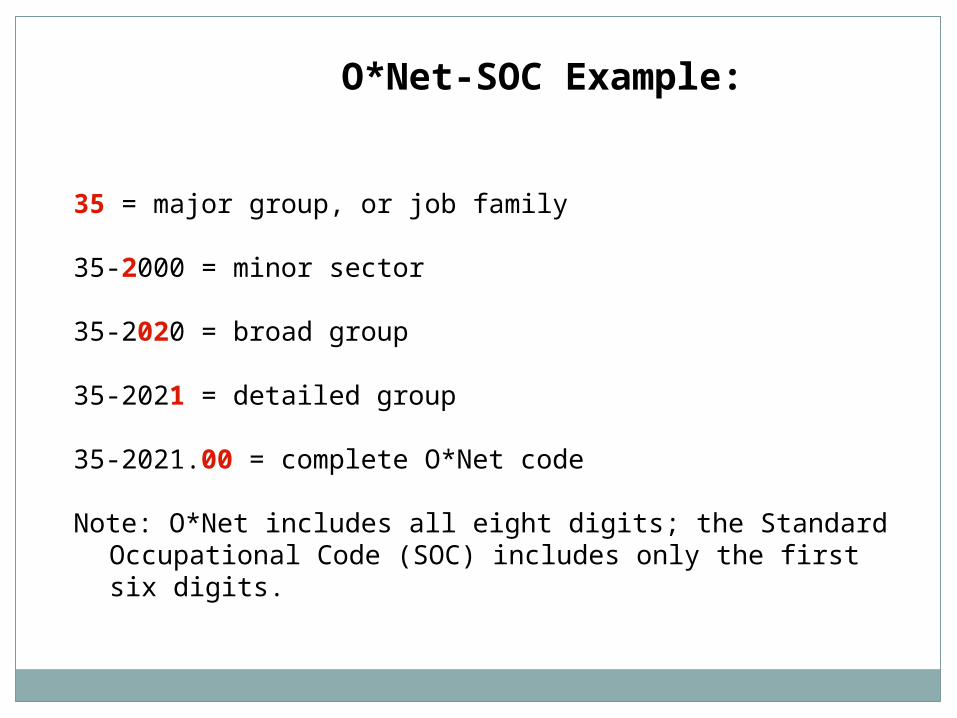
O*Net-SOC Example:
35 = major group, or job family
35-2000 = minor sector
35-2020 = broad group
35-2021 = detailed group
35-2021.00 = complete O*Net code
Note: O*Net includes all eight digits; the Standard Occupational Code (SOC) includes only the first six digits.
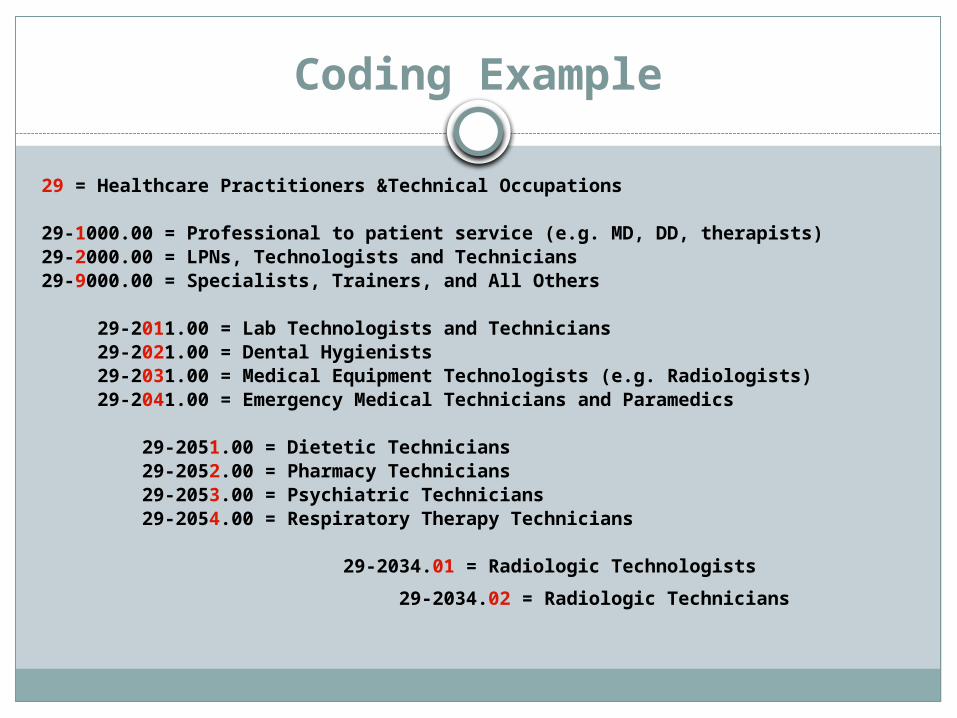
29 = Healthcare Practitioners &Technical Occupations
29-1000.00 = Professional to patient service (e.g. MD, DD, therapists)29-2000.00 = LPNs, Technologists and Technicians29-9000.00 = Specialists, Trainers, and All Others
29-2011.00 = Lab Technologists and Technicians 29-2021.00 = Dental Hygienists 29-2031.00 = Medical Equipment Technologists (e.g. Radiologists) 29-2041.00 = Emergency Medical Technicians and Paramedics 29-2051.00 = Dietetic Technicians 29-2052.00 = Pharmacy Technicians 29-2053.00 = Psychiatric Technicians 29-2054.00 = Respiratory Therapy Technicians
29-2034.01 = Radiologic Technologists
29-2034.02 = Radiologic Technicians
Coding Example
Classification of Instructional Programs (CIP)
Supports the tracking and reporting of fields of study and program completions activity
Originally developed by U.S. Dept of Education
Taxonomy is hierarchical in nature
What we know…
The NAICS codes is used to classify industries
The O*NET/SOC codes are used to classify occupations
CIP code is used to classify education programs
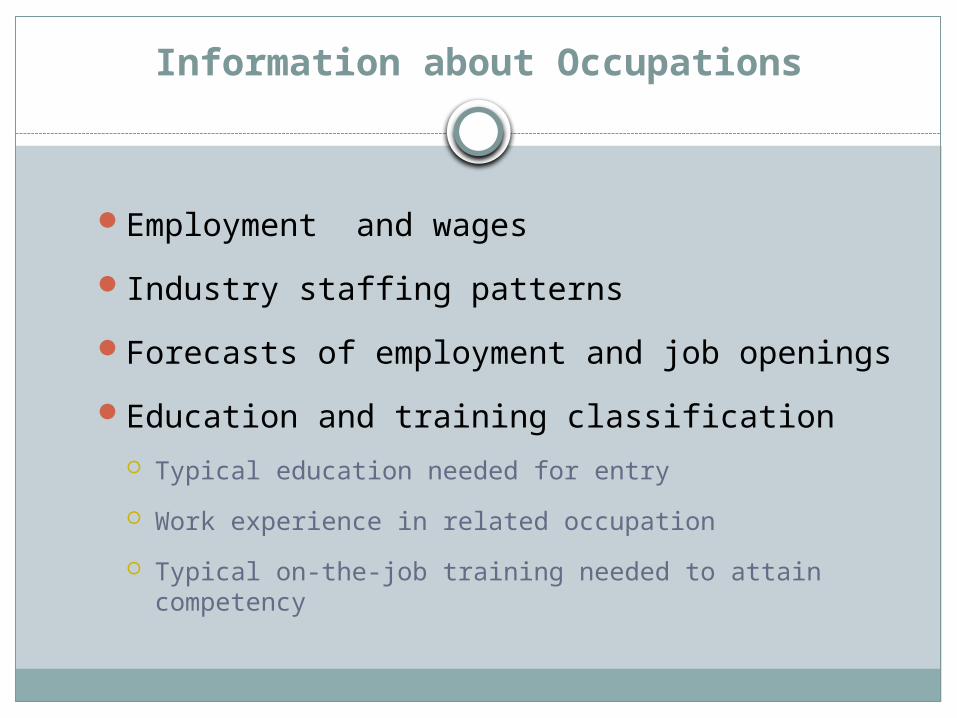
Information about Occupations
Employment and wages
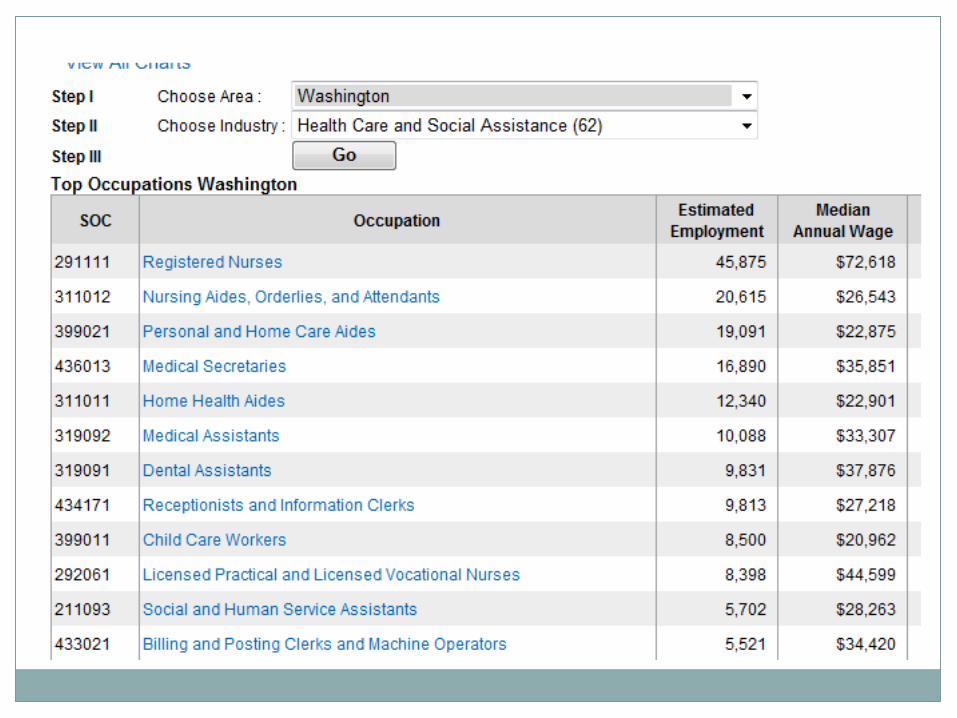
Industry staffing patterns
Forecasts of employment and job openings
Education and training classification Typical education needed for entry
Work experience in related occupation
Typical on-the-job training needed to attain competency
Source of Data
Occupational Employment Statistics (OES)
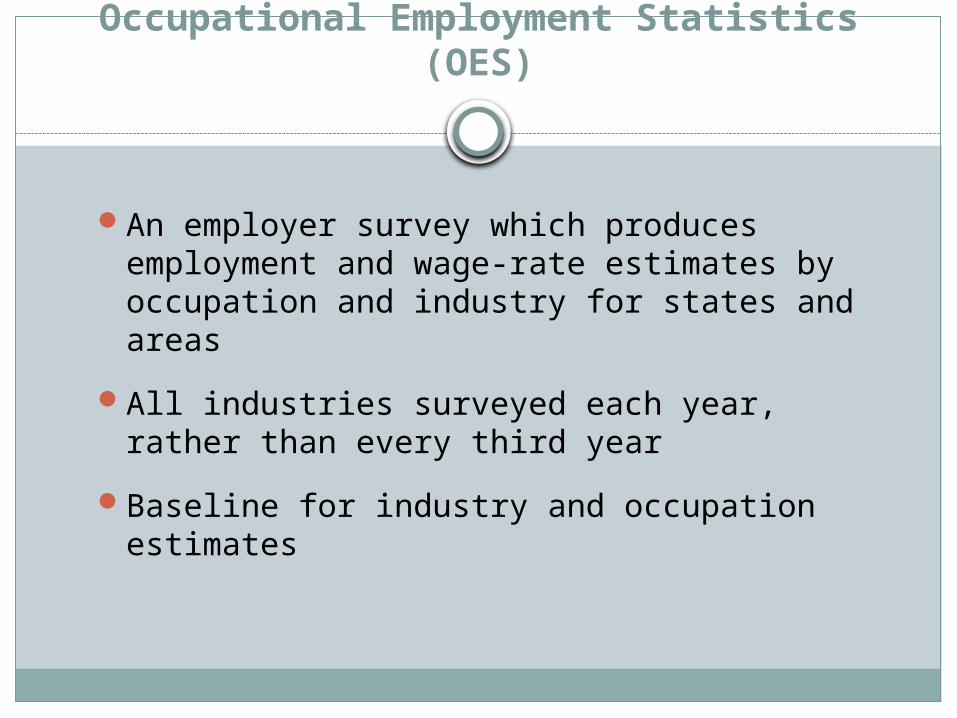
Occupational Employment Statistics (OES)
An employer survey which produces employment and wage-rate estimates by occupation and industry for states and areas
All industries surveyed each year, rather than every third year
Baseline for industry and occupation estimates
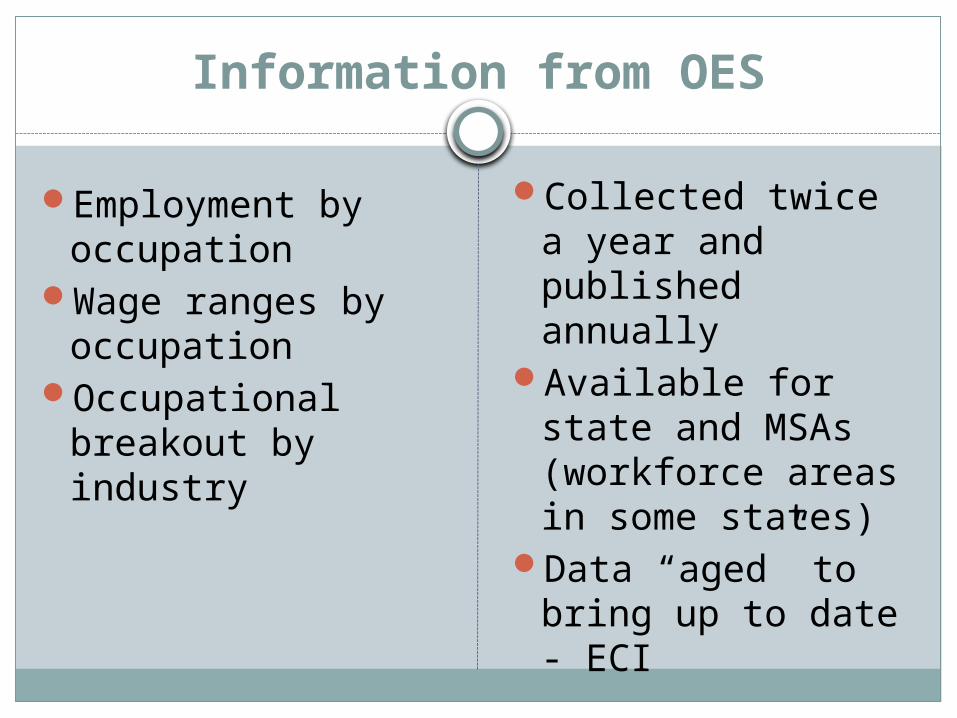
Information from OES
Employment by occupation
Wage ranges by occupation
Occupational breakout by industry
Collected twice a year and published annually
Available for state and MSAs (workforce areas in some states)
Data “aged” to bring up to date - ECI
OES Staffing Patterns Estimates
Data developed with most current 3 years of data
Employment by occupation tallied for each detailed industry
Staffing ratios developed represent each occupations share of industry employment
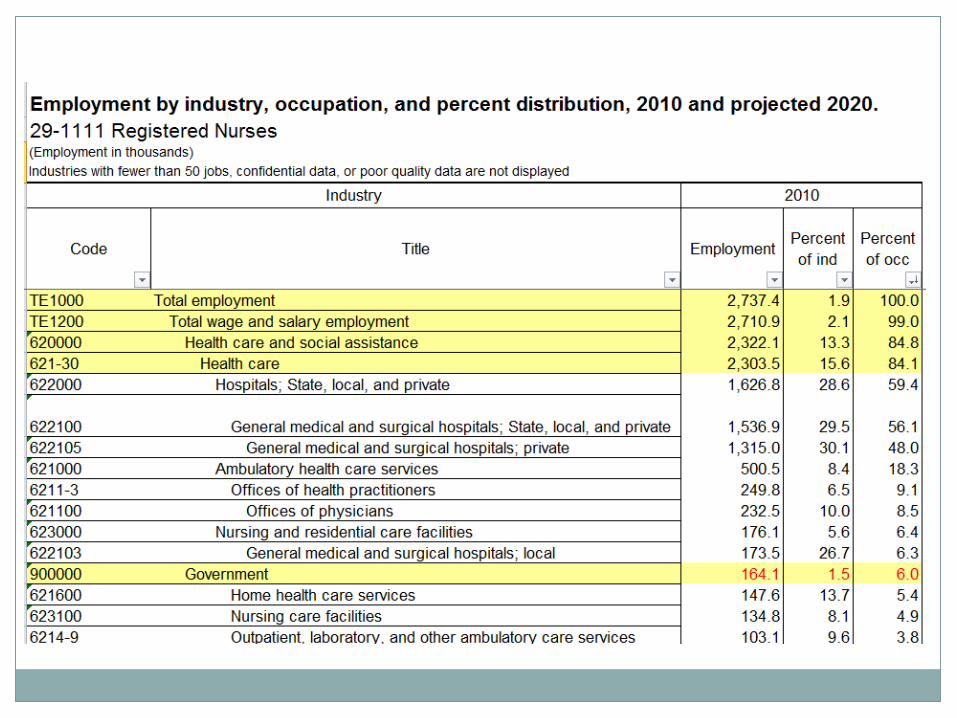
Industry-Occupation matrix established
shows what industries employ what occupations
Shows what occupations are employed in an industry
Education and Training Classifications
Developed by Bureau of Labor StatisticsHelps us answer questions like:
What is the demand for workers with a college degree (or some level of education)?
What training or experience is needed in different careers, in addition to formal education?
Three categories of information for each occupation: Typical education needed for entry Work experience in a related occupation Typical on-the-job training needed to attain competency in
occupation
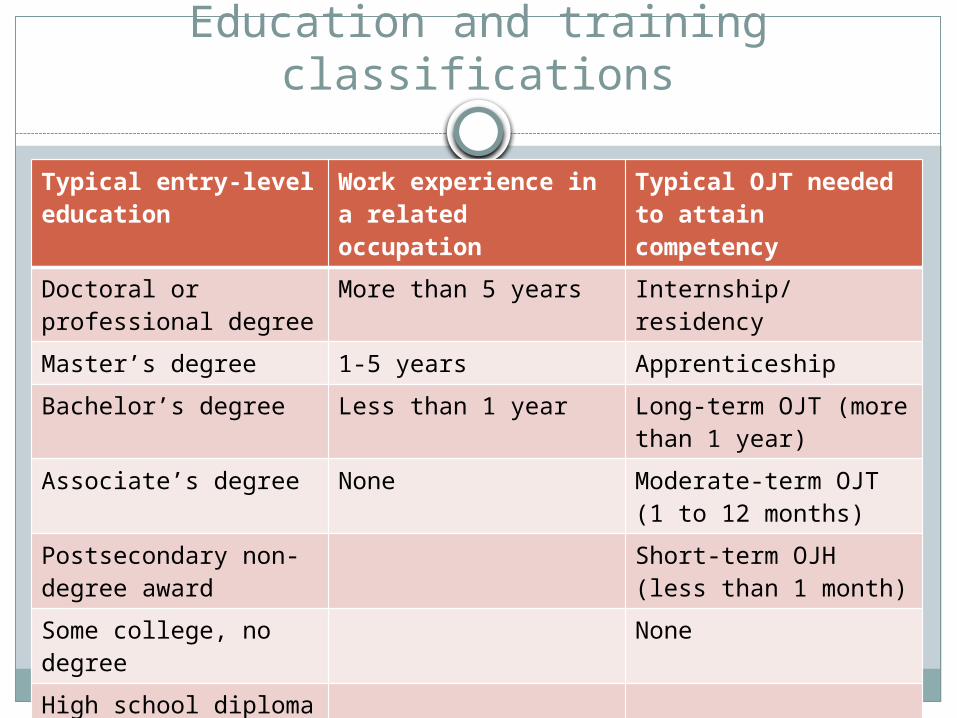
Education and training classifications
Typical entry-level education
Work experience in a related occupation
Typical OJT needed to attain competency
Doctoral or professional degree
More than 5 years Internship/residency
Master’s degree 1-5 years Apprenticeship
Bachelor’s degree Less than 1 year Long-term OJT (more than 1 year)
Associate’s degree None Moderate-term OJT (1 to 12 months)
Postsecondary non-degree award
Short-term OJH (less than 1 month)
Some college, no degree
None
High school diploma or equivalent
Less than high school
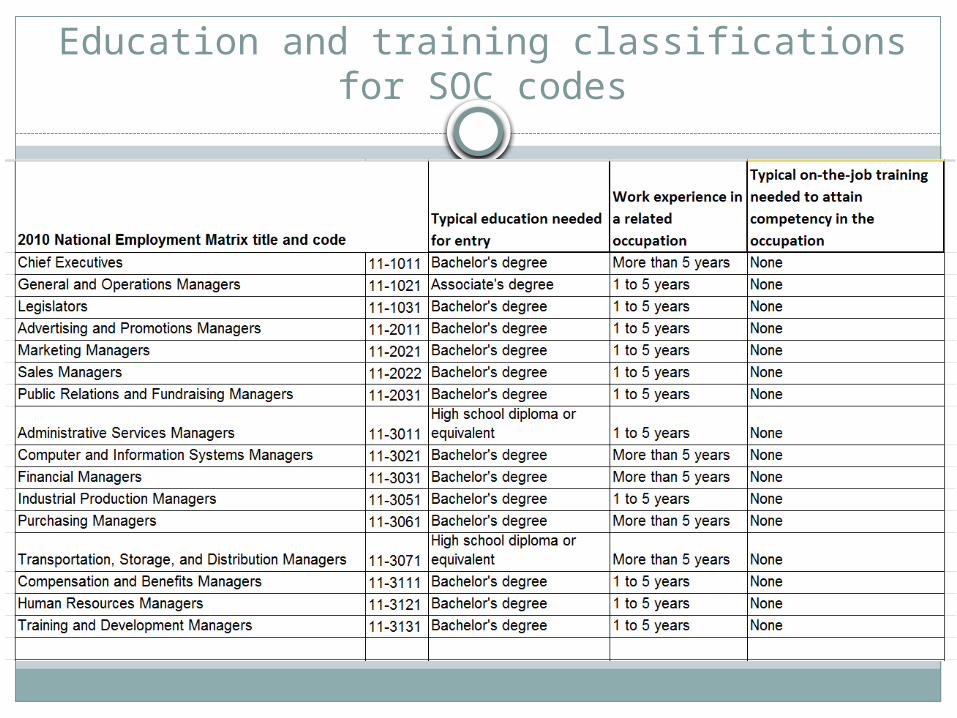
Education and training classifications for SOC codes
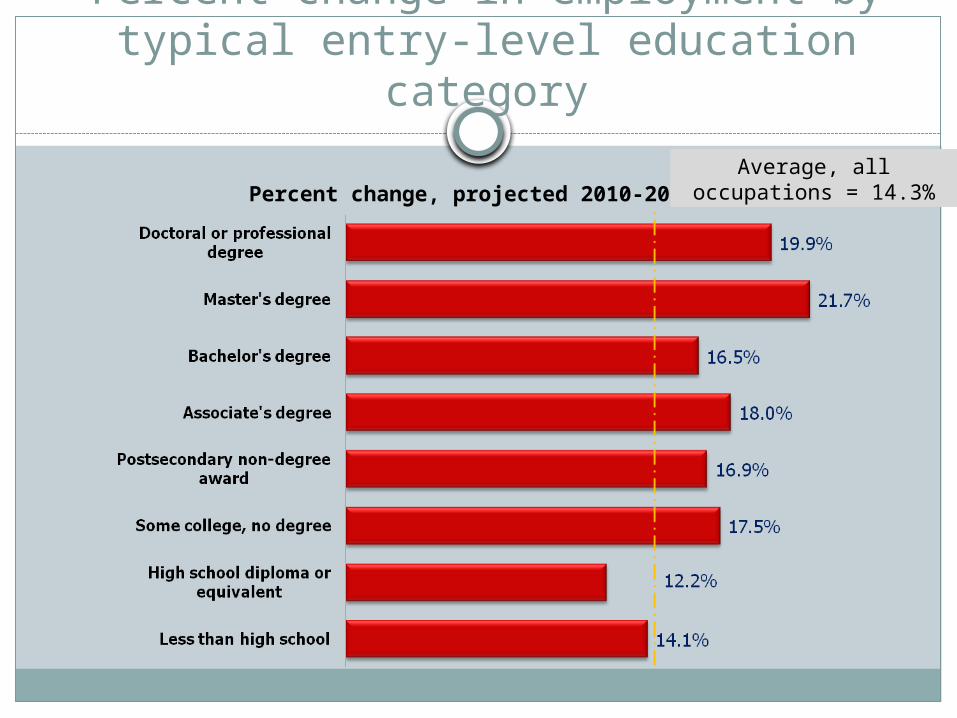
Percent change in employment by typical entry-level education category
Percent change, projected 2010-20Average, all occupations
= 14.3%
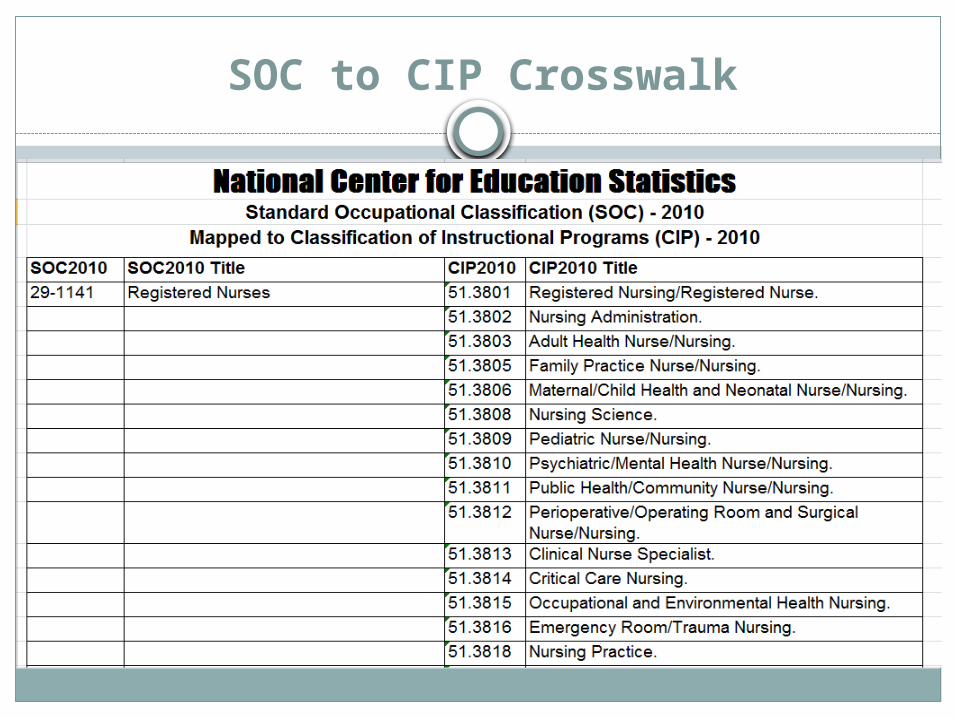
SOC to CIP Crosswalk
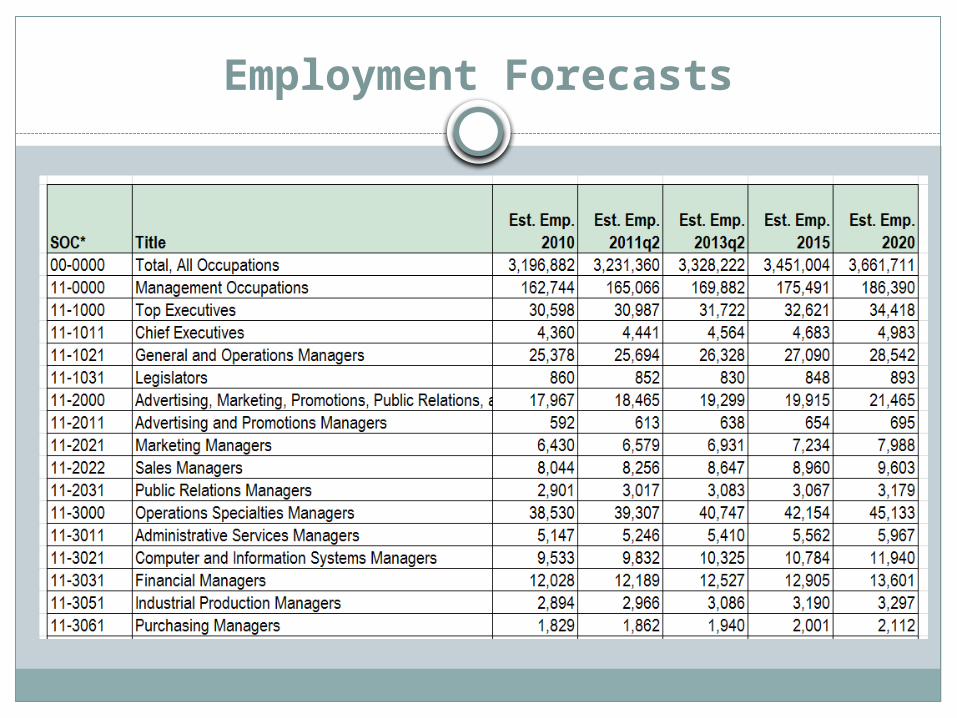
Employment Forecasts
Expected change in employmentBy industry and by occupationCurrent and projected employment countsGrowth rates and average annual openingsShort (2yr) Medium (5yr) and Long (10yr)
Employment Forecasts
What we know…
The NAICS and O*NET/SOC are used to classify industries and occupations
The OES survey is the basis for employment and wage estimates and baseline employment levels
The OES survey also helps identify staffing patterns for an industry and the inverse that shows which industry employ an occupation
BLS also has established an education and training classification for each occupation.
SOC to CIP relationships can be mappedShort and long-term employment forecasts
Putting it all together
Economic Development Firm moving to the area or expanding
What is the available workforce? Is their capacity for staff training
Training for specific jobs High skill, high wage Green jobs Demand jobs STEM jobs Fastest growing
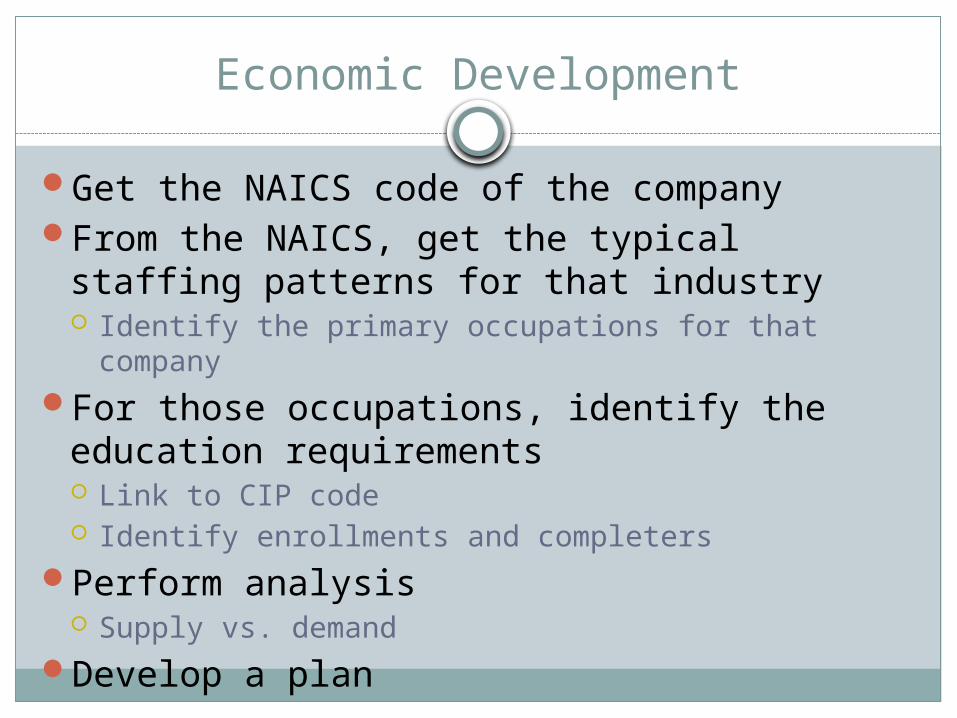
Economic Development
Get the NAICS code of the companyFrom the NAICS, get the typical staffing
patterns for that industry Identify the primary occupations for that company
For those occupations, identify the education requirements Link to CIP code Identify enrollments and completers
Perform analysis Supply vs. demand
Develop a plan
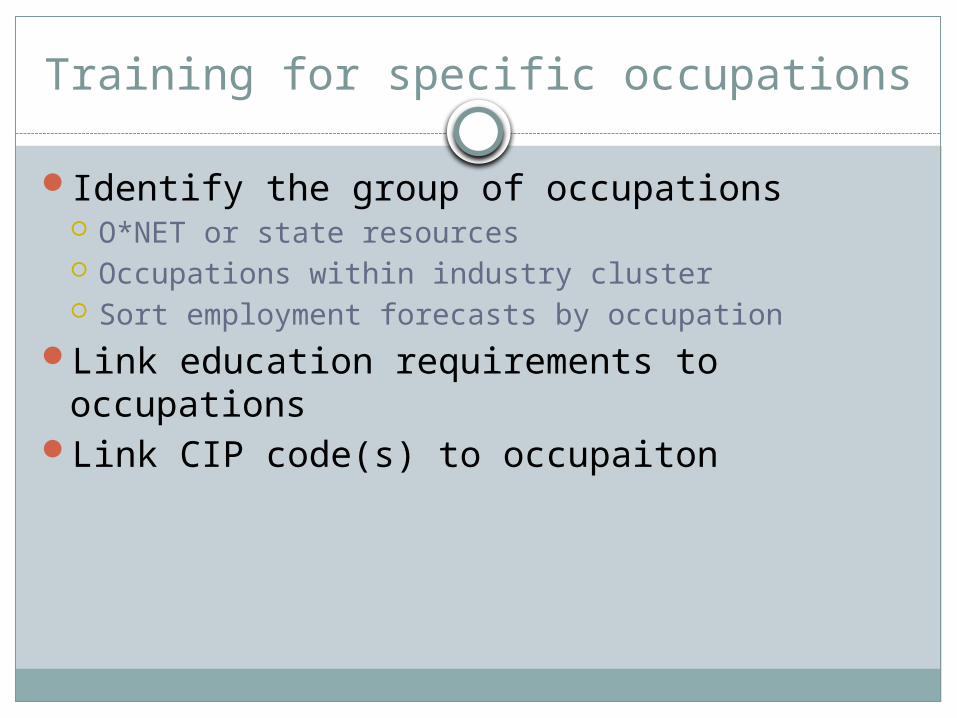
Training for specific occupations
Identify the group of occupations O*NET or state resources Occupations within industry cluster Sort employment forecasts by occupation
Link education requirements to occupationsLink CIP code(s) to occupaiton
Data Sources
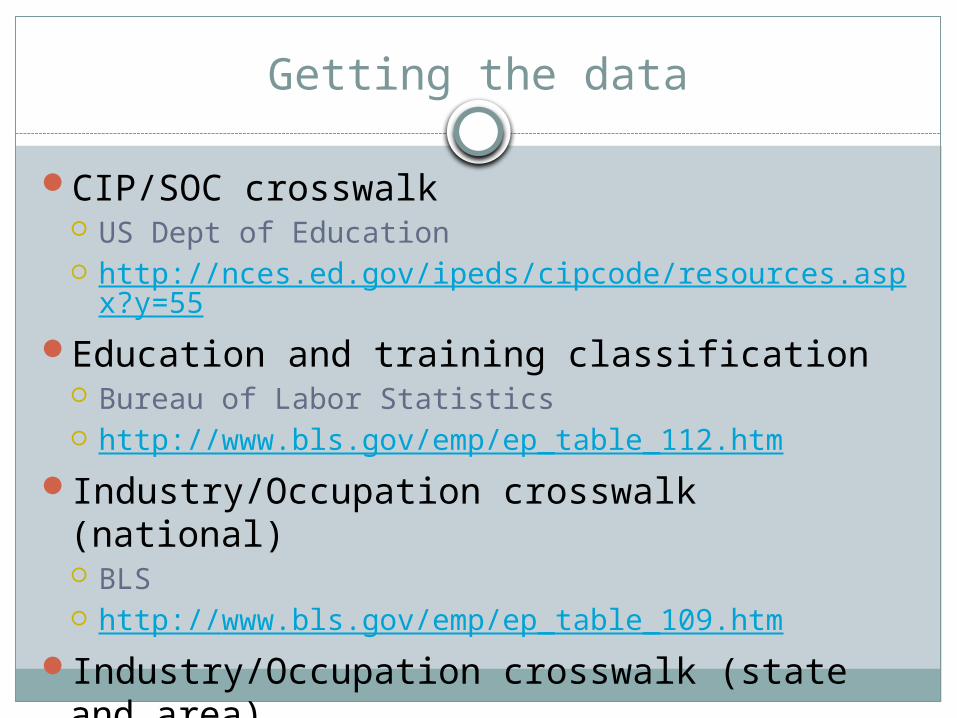
Getting the data
CIP/SOC crosswalk US Dept of Education http://nces.ed.gov/ipeds/cipcode/resources.aspx?y=55
Education and training classification Bureau of Labor Statistics http://www.bls.gov/emp/ep_table_112.htm
Industry/Occupation crosswalk (national) BLS http://www.bls.gov/emp/ep_table_109.htm
Industry/Occupation crosswalk (state and area)
Getting the data
Occupation Employment and Wages Bureau of Labor Statistics http://www.bls.gov/oes/
Link to state labor market information offices http://lmiontheweb.org/?page=8
O*NET Online http://www.onetonline.org/