Embed Size (px)
Citation preview

PLATINUM 2013

ACKNOWLEDGEMENTS
Johnson Matthey gratefully acknowledges the contribution of many individuals and companies within the platinum group metal industry in providing information for and assistance with the compilation of Platinum 2013.
In particular, our thanks go to Denise Garwood, Alison Cowley and the members of the Johnson Matthey precious metals market research team and to Tanaka Kikinzoku Kogyo KK for their invaluable assistance in Japan.
Platinum 2013 is based for the most part on information available up to the end of March 2013.
DISCLAIMER
Johnson Matthey PLC endeavours to ensure the accuracy of the information and materials contained within this report, but makes no warranty as to accuracy, completeness or suitability for any particular purpose. Johnson Matthey PLC accepts no liability whatsoever in respect of reliance placed by the user on information and materials contained in this report, which are utilised expressly at the user’s own risk.
In particular, this report and the information and materials in this report are not, and should not be construed as, an offer to buy or sell, or solicitation of an offer to buy or sell, any regulated precious metal related products or any other regulated products, securities or investments, or making any recommendation or providing any investment or other advice with respect to the purchase, sale or other disposition of, any regulated precious metal related products or any other regulated products, securities or investments including, without limitation, any advice to the effect that any precious metal related transaction is appropriate or suitable for any investment objective or financial situation of a prospective investor.
A decision to invest in any regulated precious metal related products or any other regulated products, securities or investments should not be made in reliance on any of the information or materials in this report. Before making any investment decision, prospective investors should seek advice from their financial, legal, tax and accounting advisers, take into account their individual financial needs and circumstances and carefully consider the risks associated with such investment decisions. This report does not, and should not be construed as acting to, sponsor, advocate, endorse or promote any regulated precious metal related products or any other regulated products, securities or investments.
Platinum 2013 is the copyright of Johnson Matthey PLC. Material from this publication may be reproduced without prior permission provided that ‘Platinum 2013’ and Johnson Matthey PLC are acknowledged as the source.
© Published in May 2013 by Johnson Matthey.
Johnson Matthey Public Limited Company.Precious Metals Marketing, Orchard Road, Royston, Hertfordshire, SG8 5HE, England.Tel: +44 (0)1763 256315Email: [email protected] Web: www.platinum.matthey.com
Background image: PGM grain.Printed in the United Kingdom on paper from well-managed sources.
ISSN 0268-7305
Design: Wonderberry UK Ltd.
Print: CPI Colour

PLATINUM 2013
Executive Summary ................................................... 2
Platinum Summary .................................................... 4
Palladium Summary .................................................. 6
Other PGM Summary ............................................... 8
Outlook ................................................................ 10
Supplies, Mining and Exploration............................ 14
Recycling ............................................................... 21
Platinum ................................................................ 23
Palladium .............................................................. 35
Other PGM ........................................................... 41
Prices .................................................................... 43
Special Features
South African Production in 2012 ........................... 17
The Components of Autocatalyst Demand............... 31
Supply and Demand Tables
Platinum Supply and Demand ................................ 50
Platinum Demand by Application: Regions .............. 51
Palladium Supply and Demand .............................. 52
Palladium Demand by Application: Regions ............ 53
Rhodium Supply and Demand ................................ 54
Ruthenium and Iridium Demand ............................. 55
Notes to Tables ...................................................... 56
Glossary ....................................... inside back cover

page 2 Platinum 2013
EXECUTIVE SUMMARYEXECUTIVE SUMMARY
The platinum market was in deficit by 375,000 oz in 2012 due to a steep decline in output from South
Africa. Primary supply of platinum fell by 13% to 5.64 million ounces, the lowest for 12 years. Total demand
for platinum in 2012 was down by 0.6% to 8.05 million ounces. Recycling of platinum came to 2.03 million
ounces, marginally less than in 2011.
Platinum shipments by South African producers fell by 16% to 4.10 million ounces in 2012. At least
750,000 oz of production were lost to legal and illegal strikes, safety stoppages and closure of some marginal
mining operations. Changes to supply from other regions were insignificant by comparison.
Gross demand for platinum in autocatalysts rose by 1.7% to 3.24 million ounces. Weak
European demand for platinum, due to depressed light vehicle output and a lower market share for
diesel vehicles, was more than offset by higher demand in Asia and North America and by increasing
demand for platinum autocatalysts for non-road diesel engines.
Industrial demand for platinum in 2012 fell by 21% to 1.57 million ounces. It was affected by a slowing
of expansion in the glass industry, reduced production of hard disk drives in the electrical industry and
the drawdown of inventory in both sectors. Chemical demand was slightly lower than in 2011, while
demand for platinum in other applications was stable.
Recycling of platinum from end-of-life autocatalysts fell in Europe and North America. The price of
platinum averaged $1,552 in 2012, $169 lower than in 2011, causing collectors of spent autocatalysts to
hoard stock awaiting better price opportunities. The decline in recovery from this source was partly offset
by greater recycling of platinum jewellery scrap in China.
Gross demand for rhodium grew by 6% in 2012 to 966,000 oz. Autocatalyst demand was bolstered by a rebound in vehicle production in
Japan after the catastrophic natural disasters of 2011 and by a buoyant market for cars in North America, but there was a fall in buying from
the glass industry. Primary supplies, affected by output lost to disruption at South African mines, declined by 43,000 oz to 722,000 oz. With
recovery from scrap down slightly to 259,000 oz in 2012, the rhodium market was in surplus by 15,000 oz.
Gross world jewellery demand for platinum improved by 12% in 2012 to 2.78 million ounces. It was
boosted by expansion of the retail jewellery distribution network in China, allied to a degree of increase
in manufacturers’ finished jewellery stocks. Investment demand for platinum was steady at 455,000 oz, with
strong investor interest in North America and a rise in the minting of platinum coins.

EXECUTIVE SUMMARY
Platinum 2013 page 3
Industrial demand for palladium weakened by 4% to 2.37 million ounces in 2012. The metal was less
intensively used for chip capacitors, its main electrical application, due to thrifting and to competition from
base metal alternatives. Demand for palladium process catalysts improved with the expansion of capacity
in Asia for making chemical intermediates for polyesters and plastics.
The palladium market moved into a deficit of 1.07 million ounces in 2012 from a surplus of
1.19 million ounces in 2011. This was the result of lower primary and secondary supplies, record demand
for palladium autocatalysts from the auto industry and a substantial swing in investment demand from
heavily negative in 2011 to strongly positive in 2012.
Palladium supply fell by 11% in 2012 to 6.55 million ounces, the lowest since 2002. Russian
newly-mined supply declined by 3% to 2.63 million ounces, while sales from state stocks fell by two-thirds
to 250,000 oz as palladium reserves neared depletion. South African palladium supply, affected by strikes
and other stoppages, fell by 9% to 2.33 million ounces.
Lower production in China was the cause of a 12% decline to 445,000 oz in gross world demand for
palladium in jewellery. Anaemic consumer demand for palladium jewellery in China has resulted in fewer
manufacturers and retailers producing it or carrying stock. Demand for palladium was steady in most other
regions and slightly higher in Europe, supported by its use in wedding rings for men.
Demand for both ruthenium and iridium fell substantially in 2012 after two exceptionally strong years. Ruthenium demand was
down by 32% to 679,000 oz due to sharply reduced buying of metal for the production of hard disks and for use in chemical catalysts.
Adequate stocks of iridium crucibles for growing single crystal sapphire meant a pronounced drop in buying from the electrical industry,
causing global iridium demand to fall by 46% to 178,000 oz.
Gross demand for palladium rose by 16% to 9.90 million ounces in 2012. Purchases for autocatalyst
manufacturing increased by 7.5% to a new high of 6.62 million ounces, propelled by recovering car
output in Japan after the natural disasters of 2011, further growth in China, and a boom in new registrations
in North America as consumer confidence and economic activity continued to improve.
Net physical investment in palladium in 2012 changed by over one million ounces. It switched from
a negative 565,000 oz in 2011 to a positive 470,000 oz last year. Flows of palladium into exchange traded
funds (ETFs) were strong in the first half of the year. The launch of a new investment trust in the USA in
December 2012 added significantly to demand.

page 4 Platinum 2013
SUMMARY
An unprecedented fall in supplies from South Africa
arising from a series of illegal strikes put the platinum
market into a deficit in 2012. Through industrial action,
safety stoppages and mine closures, producers in South
Africa altogether lost at least 750,000 oz of platinum
production. Industrial demand in 2012 was hit by a
downturn in purchasing by the glass and electrical sectors,
while investment demand was steady. Growth in demand
for platinum autocatalysts in Asia and North America
offset lower requirements from the weak European
vehicle market. Only the jewellery trade in China bought
significantly more platinum, in order to supply an
expanding jewellery retail network. The platinum price in
2012 was on average 10% weaker than in 2011, causing
secondary recovery of platinum to decline as collectors of
spent autocatalysts hoarded stock, waiting for better price
opportunities to arrive.
A series of illegal work stoppages took place during
the year at the mines on the western Bushveld operated by
Impala Platinum, Lonmin and Anglo American Platinum. The
first stoppage of the year started at Impala’s Rustenburg lease
area in January and resulted ultimately in the loss of a third
of the mine’s annual output. There was significant disruption
in August at Lonmin’s Marikana operations, where the strike
became violent and led to the loss of many lives, and between
September and November at Anglo’s Union, Rustenburg and
Amandelbult operations.
We estimate that losses from legal and illegal strike action in
2012 came to more than 600,000 oz of platinum, compounding
the pressure being felt by South African mining companies
from above-inflation labour and energy cost increases, falling
productivity and torpid dollar pgm prices. Interruptions due
to safety inspections, although less onerous than in 2011,
were a further drag on production and accounted for at least
70,000 oz of lost output.
These adverse factors began to make themselves felt in
the form of mine closures, with three of the smaller mines
in South Africa and one tailings reprocessing plant ceasing
to operate, in all taking around a further 60,000 oz out of
play in 2012. Even the major producers were not immune
to the threat of cutbacks, as Anglo Platinum concluded a
year-long review of its operations by announcing in January
2013 its intention to close shafts in order to reduce production
capacity by up to 400,000 oz per year.
Changes to supply from other regions were relatively
insignificant. Shipments of platinum from Norilsk Nickel’s
operations declined by 2% to 660,000 oz. Total Russian supply,
including production from alluvial platinum mines, fell by
35,000 oz to 800,000 oz. Supplies of platinum from North
America in 2012 dropped by 55,000 oz to 295,000 oz, reflecting
lower production of metal at Vale’s Canadian nickel mines.
Shipments from Zimbabwe, at 340,000 oz, were unchanged.
Demand for platinum in autocatalysts rose slightly in
2012 to 3.24 million ounces. Depressed light vehicle output
in Europe, combined with a lower market share for diesel
vehicles, led to a significant fall in demand for platinum in the
region. However, a rebound in output of vehicles in Japan, a
PLATINUM
z Platinum was in deficit by 375,000 oz in 2012, largely
due to production lost to strikes, stoppages and mine
closures in South Africa.
z Primary supplies of platinum, at 5.64 million ounces,
were at a 12-year low, with South African sales down by
16% to 4.10 million ounces.
z Gross demand for platinum fell marginally in 2012 to
8.05 million ounces, with higher jewellery demand but
sharply lower industrial buying.
z Autocatalyst demand for platinum was poor in Europe
but stronger in Asia and North America and for non-road
diesel emissions control.
Palladium Monthly Prices 2010-2012 (US$ per oz)
High Low Average
2010 2011 2012
London am & pm fixings
1,200
1,000
800
600
400
200
0
Platinum Monthly Prices 2010-2012 (US$ per oz)
High Low Average
2010 2011 2012
London am & pm fixings
2,200
2,000
1,800
1,600
1,400
1,200
1,000

SUMMARY
Platinum 2013 page 5
Platinum Supply and Demand’000 oz
Supply 2010 2011 2012
South Africa 4,635 4,860 4,095
Russia 825 835 800
Others 590 790 745
Total Supply 6,050 6,485 5,640
Gross Demand
Autocatalyst 3,075 3,185 3,240
Jewellery 2,420 2,475 2,780
Industrial 1,755 1,975 1,570
Investment 655 460 455
Total Gross Demand 7,905 8,095 8,045
Recycling (1,830) (2,060) (2,030)
Total Net Demand 6,075 6,035 6,015
Movements in Stocks (25) 450 (375)
continued surge in the manufacture of diesel vehicles in India
and Thailand, and increased production of diesel pickup trucks
in North America bolstered demand for platinum. The use
of platinum autocatalysts for heavy duty vehicles improved
marginally, while purchases of platinum more than doubled for
catalysts to control pollution from construction, agricultural and
other non-road diesel engines, which we now include in our
estimates of overall autocatalyst demand.
Demand for platinum for making jewellery increased
by 305,000 oz in 2012 to 2.78 million ounces. There was
a surge of buying by manufacturers in China, in order to
supply platinum jewellery to a growing number of retail
outlets in Chinese cities. Manufacturers also took advantage of
the relatively weak platinum price to increase stocks. In India
there was wider distribution of platinum jewellery in the retail
network. The discount of platinum to gold during most of the
year made platinum jewellery more competitive with white
gold in all markets.
Demand for platinum in industrial applications fell by
405,000 oz in 2012 to 1.57 million ounces. This was largely the
effect of changing conditions in the glass industry, where excess
production capacity, combined with the use of platinum from
decommissioned plants and existing inventories, led to a fall in
purchases. In the electrical industry, inventory adjustments and
weaker demand for hard disk drives impacted purchases of
platinum. Demand from the chemical sector was slightly lower
than in 2011, while demand for platinum in medical, petroleum
refining and other applications was stable.
Net identifiable physical demand for platinum in the
investment sector reached 455,000 oz in 2012, only 5,000 oz
lower than in the previous year. Investment in exchange
traded funds (ETFs) tended to fluctuate in accordance with
changes in the platinum price, demand for platinum ending
the year marginally higher compared to 2011. Significantly
lower net purchasing of large bars in Japan was largely offset
by a combination of increased demand for coins and small
bars and the acquisition of metal for the launch of a new
physically-backed product in North America.
The platinum price averaged $1,552 in 2012, $169 per oz
lower than in 2011. It began the year brightly and was bolstered
when the Impala mines went on strike, reaching a high of
$1,729 in February, but then came under pressure from weak
demand and Europe’s economic problems. It was at a low of
$1,390 before the eruption of violence during the Lonmin strike
propelled it back over $1,700. Although the price was unable
to sustain this level, concern about mine supplies continued to
provide support for the remainder of the year.
9
8
7
6
5
4
3
2
1
0
Autocatalyst Jewellery Industrial Investment
Gross Demand for Platinum 2008-2012million oz
2008 2009 2010 2011 20122011 201220092008 2010
9
8
7
6
5
4
3
2
1
0
South Africa Russia NorthAmerica
Others
Platinum Supply by Region 2008-2012million oz
2008 2009 2010 2011 20122008 201220102009 2011
9
8
7
6
5
4
3
2
1
0
Autocatalyst Jewellery Industrial Investment
Gross Demand for Platinum 2008-2012million oz
2008 2009 2010 2011 20122011 201220092008 2010
9
8
7
6
5
4
3
2
1
0
South Africa Russia NorthAmerica
Others
Platinum Supply by Region 2008-2012million oz
2008 2009 2010 2011 20122008 201220102009 2011

SUMMARY
page 6 Platinum 2013
Driven by record autocatalyst demand, a one million
ounce swing in investment demand and a fall in primary
and secondary supply, the market for palladium in 2012
moved into deficit by 1.07 million ounces. Although
South African shipments were badly affected by the loss
of production from strikes and other interruptions, the
major impact on supply in 2012 was a fall in sales of metal
from Russian state stocks to 250,000 oz, a fraction of what
the market has been accustomed to seeing in recent years.
The strength of demand for palladium was accentuated
by the large swing in physical investment from negative
to positive. However, excluding investment, demand still
grew by 300,000 oz compared to 2011. Demand in the
dominant auto sector increased by 460,000 oz, more than
compensating for a reduction in electrical and jewellery
demand, while chemical and dental demand were stable.
Supply of palladium last year, at 6.55 million ounces,
was the lowest since 2002. In South Africa the output of
by-product palladium suffered from disruption to platinum
mining arising from strikes and other stoppages. PGM grades in
the ores at Norilsk Nickel’s Russian mines have been declining
for some time and in 2012 palladium output in Russia was 3%
lower than in 2011. However, the most significant impact on
supply last year came from a sharp drop in sales of Russian
government stocks due, we believe, to state reserves being
almost completely depleted.
In 2012, for the second year running, gross demand for
palladium in autocatalysts was at a new all-time high. World
demand of 6.62 million ounces represented a 7.5% increase on
2011 and, even more impressively, a rise of nearly two-thirds
when compared to the depressed level of 4.05 million ounces
during the recession year of 2009. Some of the causes of this
demand strength were ongoing, such as increasing production
of light duty gasoline vehicles in China and another rise in the
ratio of palladium to platinum in autocatalysts for European
diesel vehicles. Others were germane to 2012, notably the
recovery of vehicle output in Japan after the tsunami of 2011
and, in the USA, growing consumer confidence and economic
activity. This, along with a renewed willingness of banks to
provide credit, persuaded an increasing number of US buyers
to return to car showrooms to replace their ageing vehicles.
Recycling of palladium from end-of-life catalysts did not
keep pace with gross demand last year, falling by 35,000 oz to
1.66 million ounces. Weakness in pgm prices caused collectors
to hoard stocks of spent converters for a time and only towards
the end of the year did recycling volumes begin to strengthen
as inventories were released. Consequently, the increase to
4.96 million ounces in net autocatalyst demand for palladium
was an 11% advance on the 2011 level.
Gross demand for palladium in jewellery in 2012, at
445,000 oz, was 60,000 oz lower than in 2011. Demand for
palladium jewellery in China fell for the fourth consecutive
year, while in other markets it was largely unchanged.
Anaemic consumer demand for palladium jewellery in China
has resulted in fewer manufacturers and retailers producing it
or carrying stock. With the amount of palladium recycled from
scrapped jewellery falling to 190,000 oz in 2012, net demand
PALLADIUM
z The palladium market moved into a deficit of 1.07 million
ounces in 2012 following a surplus of 1.19 million ounces
in 2011.
z Palladium supply declined by 11% in 2012 to 6.55 million
ounces. Russian mine supplies fell by 3% to 2.63 million
ounces, while sales from state stocks fell by two-thirds.
z Gross demand for palladium rose by 16% to 9.90 million
ounces in 2012, led by record purchases of palladium for
autocatalyst manufacturing.
z Net physical investment in palladium switched from a
negative 565,000 oz in 2011 to a positive 470,000 oz in
2012, a swing of over one million ounces.
Palladium Monthly Prices 2010-2012 (US$ per oz)
High Low Average
2010 2011 2012
London am & pm fixings
1,200
1,000
800
600
400
200
0
Platinum Monthly Prices 2010-2012 (US$ per oz)
High Low Average
2010 2011 2012
London am & pm fixings
2,200
2,000
1,800
1,600
1,400
1,200
1,000

SUMMARY
Platinum 2013 page 7
Palladium Supply and Demand’000 oz
Supply 2010 2011 2012
South Africa 2,640 2,560 2,330
Russia 3,720 3,480 2,880
Others 995 1,320 1,335
Total Supply 7,355 7,360 6,545
Gross Demand
Autocatalyst 5,580 6,155 6,615
Jewellery 595 505 445
Industrial 2,465 2,465 2,365
Investment 1,095 (565) 470
Total Gross Demand 9,735 8,560 9,895
Recycling (1,850) (2,385) (2,280)
Total Net Demand 7,885 6,175 7,615
Movements in Stocks (530) 1,185 (1,070)
reached 255,000 oz, compared with 295,000 oz in 2011.
The use of palladium in various industrial sectors came
to 2.37 million ounces in 2012, 100,000 oz lower than the
previous year. The use of palladium in dental restorations,
and in several minor applications such as petroleum refining
catalysts, stationary source pollution control and industrial
alloys, was largely stable. Chemical demand increased due
to further expansion of capacity for manufacturing chemical
intermediates for polyesters and plastics using palladium
catalysts, but these gains were eliminated by sharply lower
gross demand in electrical applications.
The metal content of multi-layer ceramic capacitors,
an important use for palladium in the electrical sector, is
constantly being reduced. At the same time, the improving
performance and reliability of base metal capacitors has
enabled manufacturers of electronic systems to employ
them in applications where previously only the performance
of precious metals was acceptable. Palladium capacitors
have been displaced from many automotive electronics,
for example, and increasingly their use is being confined to
extremely demanding applications such as military aircraft
systems. Demand for other electrical uses of palladium held
up well, especially as the price of palladium remained at a
large discount to the price of gold, the alternative material in
applications such as electronic plating.
Recovery of palladium from electronic scrap fell by
50,000 oz in 2012 to 430,000 oz due to a decline in the
concentration of palladium in electrical waste, the result of
years of miniaturisation of components and thrifting of the
palladium content. This offset part of the overall decline in
gross demand from the electrical sector.
Net physical investment demand for palladium reached
470,000 oz in 2012, compared to liquidation of 565,000 oz in
2011, a swing of over one million ounces. This was due primarily
to a return to net investment in the ETF market following heavy
profit-taking the previous year, notably by investors in the two
largest funds based in London and New York. New demand
of 285,000 oz was registered in ETFs and to this was added a
further 185,000 oz of palladium bought for the fully-subscribed
Sprott Physical Platinum and Palladium Trust when it was
launched in December 2012.
Like the platinum price, which it broadly shadowed
for most of the year, the palladium price peaked at $722 in
February 2012 and reached its nadir of $564 in July before being
bolstered by the mine strikes in South Africa. Palladium was
more resilient than platinum in the final two months, averaging
$643 for the year, $90 per oz lower than in 2011.
10
9
8
7
6
5
4
3
2
1
0
-1
Autocatalyst Jewellery Industrial Investment
Gross Demand for Palladium 2008-2012million oz
2008 2009 2010 2011 2012
South Africa Russia NorthAmerica
Others
Palladium Supply by Region 2008-2012million oz
2008 2009 2010 2011 2012
10
9
8
7
6
5
4
3
2
1
0
10
9
8
7
6
5
4
3
2
1
0
-1
Autocatalyst Jewellery Industrial Investment
Gross Demand for Palladium 2008-2012million oz
2008 2009 2010 2011 2012
South Africa Russia NorthAmerica
Others
Palladium Supply by Region 2008-2012million oz
2008 2009 2010 2011 2012
10
9
8
7
6
5
4
3
2
1
0

SUMMARY
page 8 Platinum 2013
OTHER PGM
z Gross demand for rhodium grew by 6% in 2012 to
966,000 oz, largely due to strong demand for rhodium
in autocatalysts, especially in North America and Japan.
z Primary supplies of rhodium declined by 43,000 oz to
722,000 oz. Weaker South African production was partly
offset by a rise in Russian output. Recovery of rhodium
from autocatalyst scrap fell by 6.5% to 259,000 oz.
z Ruthenium demand in 2012 was 32% down at
679,000 oz due to sharply reduced buying of ruthenium
for the production of hard disks and chemical catalysts.
z Adequate capacity for growing single crystal sapphire
meant a pronounced drop in buying from the electrical
industry, causing global iridium demand to fall by 46% to
178,000 oz in 2012.
Rhodium
Supply and demand for rhodium came close to balance in
2012 after the previous year’s substantial surplus. This was
the outcome of a reduction in mine supply, principally from
South Africa, a smaller amount of rhodium reprocessed
from end-of-life autocatalyst scrap and a strong increase
in demand for rhodium for new autocatalyst manufacture
and for physical investment.
Supplies of rhodium from South Africa fell in 2012 to
576,000 oz, a decline of 65,000 oz. This was due to loss
of production during a series of illegal strikes and other
interruptions at the operations of all three of the major South
African mining companies. The fall in supply was not so
pronounced as for platinum because the producers were able
to augment their regular production of rhodium by releasing
metal from inventories.
Higher shipments of rhodium reached the market from
Russia, the result, we believe, of metal being processed
from stored mine concentrates to supplement regular
newly-mined output at Norilsk Nickel. Russian supply rose by
20,000 oz to 90,000 oz, offsetting the losses from South Africa
to some extent and bringing total primary sales of rhodium in
2012 to 722,000 oz – 43,000 oz less than in 2011 and the lowest
level of supply for four years.
Autocatalyst demand for rhodium rose by 67,000 oz in
2012 to 782,000 oz, bolstered by a rebound in vehicle
production in Japan after the catastrophic natural disasters of
2011 and by a buoyant market for cars in North America. A 22%
increase in light duty gasoline vehicles made in Japan last year
was equivalent to an additional 1.6 million cars and light trucks,
while an improving economy brought consumers back to
showrooms in North America, prompting a 1.9 million unit rise
in the light duty gasoline build. As Japanese auto companies
tend to use, on average, more rhodium on autocatalysts than
other producers, and also have a large manufacturing base in
North America, the recovering production in both regions was
significant for rhodium demand.
Industrial demand for rhodium was mixed, with growth
in purchasing by the chemical industry outweighed by a fall
in demand from the glass sector after two very strong years.
Chemical demand was up by 9,000 oz to 81,000 oz, driven by
Asian demand for rhodium process catalysts to make acetic
acid and oxo-alcohols. Producers of glass fibre reduced their
purchases of rhodium in 2012 as they had metal on hand from
closures of old plants, while liquid crystal display (LCD) glass
manufacturers installed less capacity than in 2011 and had
access to rhodium bought in previous years, bringing total
glass demand down to 31,000 oz, from 77,000 oz in 2011.
A rise of 28,000 oz in Other demand for rhodium, to
66,000 oz, was entirely due to an increase in holdings of
physical rhodium in the Deutsche Bank ETF. In total, gross
demand for rhodium in 2012 rose by 58,000 oz to 966,000 oz.
With autocatalyst recovery falling by 18,000 oz to 259,000 oz,
the rhodium market was oversupplied by 15,000 oz.
120
110
100
90
80
70
Indexed Rhodium, Ruthenium and Iridium Prices in 2012
Iridium Ruthenium Rhodium
Jan Feb Mar Apr May Jun Jul Aug Sep Oct Nov Dec
3rd Jan 2012 = 100
SUMMARY
Platinum 2013 page 9
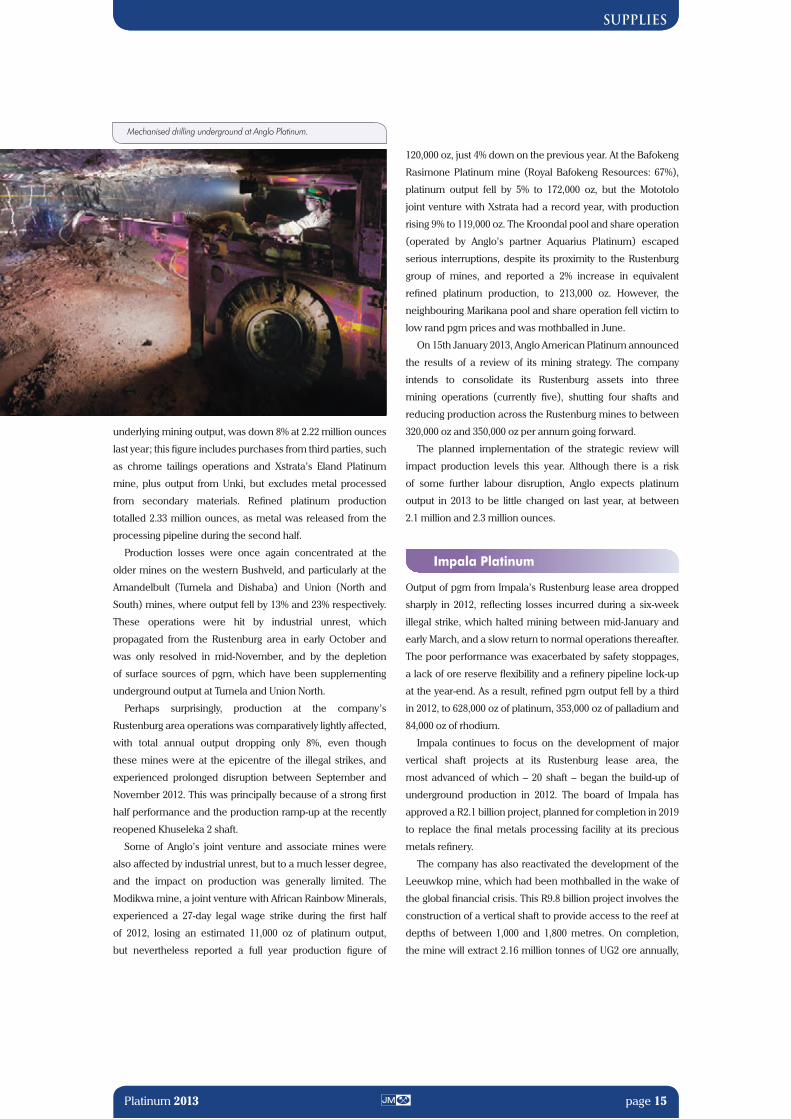
The price of rhodium was $1,400 at the start of 2012. It
ticked upwards to $1,500 in the first quarter, shadowing the rise
in platinum and palladium prices, but then went into decline,
reaching $1,100 in August. A characteristic pattern of trading
during the period was for buying interest from Asia to be met
by sellers in Europe and North America, with the latter having
a greater effect on the price. When the Anglo Platinum mines
in South Africa went on strike in September the price spiked to
$1,400 before relapsing. The average price of rhodium for the
year was $1,276, a fall of $746 per oz from 2011.
Ruthenium
Demand for ruthenium fell by nearly a third in 2012 after
two exceptionally strong years.
Purchases of ruthenium declined in the electrical and
chemical sectors. Weaker production of computer disk
drives required less ruthenium for coating of hard disks and
this, combined with a reduction of inventories and improved
manufacturing efficiency, accounted for the bulk of a 30%
decline in demand from the electrical industry.
Chemical demand for ruthenium fell by over 60%
compared to 2011, when demand was unusually high due to
purchases of new catalyst charges for converting natural gas
to ammonia. With demand for ruthenium catalysts for the
production of chlorine and for other minor applications broadly
stable, total demand for ruthenium in 2012, at 679,000 oz, was
318,000 oz lower year-on-year. The price of ruthenium averaged
$112 for the year, lower by $54 per oz than in 2011.
Mine production of ruthenium fell in 2012, in line with
lower platinum output at strike-hit South African mines.
Iridium
Iridium demand fell by almost a half in 2012 because of
lower purchasing from the electrical sector.
There was significant change in demand for iridium in
electrical applications last year as expansion in the use of
iridium crucibles to grow single crystal sapphire, which had
driven demand sharply higher in 2010 and 2011, came to an
end. Purchasing for other industrial applications was steady. In
total, demand for iridium fell to 178,000 oz from 332,000 oz in
2011. The iridium price on average was $34 an ounce higher
than in 2011 at $1,070.
Production of iridium was also impacted by disruptions
to South African mining operations. However, with industrial
buying in decline, there was no lack of availability in the market.
1,200
900
600
300
0
Chemical Electrical Electrochemical Other
Demand for Ruthenium 2008-2012‘000 oz
2008 2009 2010 2011 20122011 201220092008 2010
400
300
200
100
0
Chemical Electrical Electrochemical Other
Demand for Iridium 2008-2012‘000 oz
2008 2009 2010 2011 20122011 201220092008 2010
1,200
1,000
800
600
400
200
0
1,000
800
600
400
200
0
Autocatalyst Chemical Glass Other
Gross Demand for Rhodium 2008-2012‘000 oz
2008 2009 2010 2011 20122011 201220092008 2010
South Africa Russia NorthAmerica
Others
Rhodium Supply by Region 2008-2012‘000 oz
2008 2009 2010 2011 20122008 201220102009 2011
PLEASE IGNORE
THIS GRAPH FOR
SUMMARY
1,200
900
600
300
0
Chemical Electrical Electrochemical Other
Demand for Ruthenium 2008-2012‘000 oz
2008 2009 2010 2011 20122011 201220092008 2010
400
300
200
100
0
Chemical Electrical Electrochemical Other
Demand for Iridium 2008-2012‘000 oz
2008 2009 2010 2011 20122011 201220092008 2010

page 10 Platinum 2013
OUTLOOK
PLATINUM
We expect primary supply of platinum in 2013 to be a little
higher than last year, with broadly the same level of sales
from South Africa as in 2012 and slightly higher shipments
from other regions. Gross demand for autocatalysts is
unlikely to grow and jewellery demand may well decline
slightly. Demand from industry, notably the glass sector,
is expected to rebound from the low 2012 level, while
secondary recovery of platinum from autocatalyst scrap
should grow. This will leave auto, industrial and jewellery
demand more or less matched by supply. If investment
demand repeats last year’s pattern of net growth, then the
market for platinum may be in a slight deficit in 2013.
South African supply of platinum fell to its lowest since
2001 last year as a result of strikes, safety stoppages and mine
closures, but there are no definite prospects of significant
recovery in output in 2013.
Many of the mines remain under serious cost pressure.
Double digit inflation in labour and energy costs has become a
norm for South African platinum mines and as rand pgm prices
have not been rising enough to compensate, a large part of the
industry has lacked the revenue to sustain production in the
longer term. Some of the smaller platinum mining operations
were closed last year; in 2013 a substantial amount of capacity
is due to be shut down.
Anglo Platinum announced in January 2013 a plan to close
four shafts at its Rustenburg operations and lay off 14,000
employees, reducing production by 370,000 oz a year. The
company expects to supply a similar amount of platinum as
in 2012, with the output lost from facilities due to close being
offset by recovery of production at mines affected by last
year’s nine-week strike.
This assumes that the planned closures will go ahead.
However, it is difficult, from a social perspective, to make
drastic cuts to employment in South Africa even if there are
convincing economic arguments for doing so. This has been
demonstrated by the strength of the reaction of government
and unions to Anglo Platinum’s announcement, prompting the
company to delay execution of its plans while consultations
on the proposed dismissals take place.
Further industrial action in 2013 cannot be ruled out; there
has already been a strike this year at Northam Platinum. The
disputes at Impala, Lonmin and Angloplats in 2012 were
initiated by rock drill operators (RDOs) withdrawing their
labour, paralysing all production from underground. Many
of the strikers belonged to the Association of Mineworkers
and Construction Union (AMCU), which has displaced the
National Union of Miners (NUM) as the union with the largest
worker representation on the major platinum mines.
As mid-year wage negotiations in the platinum industry
loom, further strikes in support of pay rises are possible,
especially given the rivalry between the two unions. Even
if the bargaining process is uneventful it is likely to result in
increased cost pressure on the mines, putting operations
further in jeopardy.
As long as there are no major interruptions to output and
that Anglo Platinum reduces production according to its plans,
South African production in 2013 may not be very different
from last year – although sales into the market might be a
little higher than production, if South African producers have
refined inventory available to supplement output and choose
to release it.
Changes in supply from other regions will be slight. Russian
output of platinum is likely to decline slightly due to lower pgm
grades in the ores being mined at Norilsk Nickel. There should
be an increase in output from Zimbabwe where, despite a
challenging political environment, there is no sign of any intent
by the mines’ South African parent companies to alter their
production plans in this relatively low-cost mining area.
z Platinum supply is likely to be under pressure from weak
margins and unstable labour relations in South Africa.
z Demand for platinum in autocatalysts is expected to be
steady and jewellery demand may decline to an extent,
but a rebound in industrial demand will be led by higher
purchases of platinum by the glass industry.
z If investment demand continues to be positive, the
platinum market may be slightly in deficit in 2013.
z Palladium supply is likely to decline in 2013 as Russian
stock sales dwindle and primary mine output is stable.
z Autocatalyst demand will grow due to rising vehicle
output while palladium industrial and jewellery demand
are expected to diminish slightly. The palladium market
is likely to be undersupplied again this year.
z Rhodium demand will increase but we forecast that rising
supplies and recycling will keep the market in surplus.

OUTLOOK
Platinum 2013 page 11
The platinum market may not need additional supply this
year. Gross demand for platinum in autocatalysts does not
appear likely to grow in 2013. Purchases of platinum by the
auto industry mainly stem from its use in emissions control for
diesel engines, with Europe dominating demand because of
the high number of diesel light duty vehicles built in the region.
In 2013, light duty vehicle production in Europe is forecast
to fall by around 5% on the already depressed 2012 level.
With a continued squeeze on European household budgets,
there may be a further decline in sales of diesel vehicles as
consumers favour cheaper gasoline cars.
Growing sales of diesel cars and SUVs in India, supported by
a government subsidy on diesel fuel, have become important
factors in platinum autocatalyst demand, but slowing vehicle
sales in the first quarter of 2013 and a planned reduction in
the subsidy threaten to choke short term demand growth.
Increased output of diesels in some of the other markets where
emissions controls apply is unlikely to outweigh the impact on
demand for platinum from declining European production.
Meanwhile, no new light duty diesel emissions legislation
which would promote the use of platinum on catalysts is due
to be applied this year in any of the major diesel auto markets.
Some growth in demand for platinum in the auto industry
is likely in the heavy duty and non-road sub-sectors. The
former should benefit a little from the introduction of
Euro VI legislation for heavy duty trucks in Europe in January
2013 and from tighter legislation for heavy duty vehicles in
China which, after two postponements, is now expected
in mid-2013. The use of platinum to control emissions from
non-road diesel vehicles will also rise as increasing numbers
of engines meeting more stringent legislation are produced.
Although gross autocatalyst demand may be stable in 2013,
on a net basis it will probably decline. Recycling of platinum
from end-of-life catalysts can be expected to increase due
to natural growth in the amount of scrap collected and as
refiners receive material withheld from the market last year.
We expect industrial demand for platinum to recover in
2013 largely because of a change in levels of purchasing by
the glass industry, which after drawing on inventories of metal
in 2012 will have less platinum on hand to feed new plant
installations. This might be the last year of strong expansion
in display glass capacity for a while. Companies in China will
soon achieve their ambition to amass enough production to
supply their domestic market, leaving the rest of the world
with more capacity than can be immediately filled. New
chemical plants in Asia and the Middle East and a recovery in
output of hard disks will require more platinum this year too.
In China and India, currently the only growth sectors for
platinum jewellery, demand for platinum is far from reaching
a natural ceiling. Driven by these two markets, we expect
gross global demand for platinum in jewellery fabrication to
remain firm in 2013, while perhaps not attaining the level of
2012, which was the second highest on record. Most major
manufacturers in China reported that demand for platinum
jewellery was strong in the first nine months of 2012 but not
as good in the next two quarters, most likely a result of firmer
platinum prices and high inventories of finished jewellery.
Retail sales were reported to have been weaker in the first
three months of 2013, partly because Chinese New Year and
Valentine’s Day, both good selling occasions for jewellery
in China, were coincident this year. Nonetheless, major
jewellery brands in Hong Kong are planning to further expand
their retail distribution network into lower-tier regional cities
in China during 2013 and this is likely to stimulate production
of platinum jewellery for building the necessary retail stocks.
Demand in India, although at a far lower level than in China,
is growing due to enthusiasm for platinum from retailers and
their customers, evidenced by platinum being more and more
widely distributed in jewellery stores across the country.
Platinum is gaining acceptance as an alternative to gold for
jewellery to celebrate relationships, as men’s jewellery, or to
mark auspicious occasions.
Investment demand might prove to be the balancing factor
in the platinum market this year. Assuming that investors in
platinum exchange traded funds (ETFs) behave in 2013 as
they did in 2012, the direction taken by the platinum price will
tend to determine net investment in ETFs, with buying into
price increases stronger than selling during price falls.
Investment demand may decide the platinum market balance in 2013.

OUTLOOK
page 12 Platinum 2013
If our supply and demand assumptions are correct, little
price stimulus is likely from fundamental factors. Instead look
to broader investor and speculator sentiment, and how this
responds to movements in the gold price, economic policy
change and the challenging operating environment in South
Africa, to produce volatility in platinum in 2013.
PALLADIUM
Of all the platinum group metals palladium has the
strongest fundamental outlook, as a result of declining
supply and burgeoning autocatalyst demand.
The dynamics of the palladium market are becoming quite
distinctive. Supplies of palladium are likely to fall again in
2013 as Russian stock sales diminish further and mine output
from Russia and South Africa struggles to grow. Although
non-automotive industrial demand may only be stable at best,
autocatalyst demand will continue to increase, probably to a
greater extent in absolute terms than growth in recycling from
autocatalyst, electrical and jewellery scrap.
This is a recipe for an undersupplied market, an outlook
which should maintain positive interest in palladium by
subscribers to ETFs and other investment vehicles, with
potential upward pressure on the palladium price as a result.
The major risk to this prognosis is the price reaching a level
high enough to initiate release of some of the approximately
nine million ounces of surplus palladium which have been
absorbed by the market since 2001.
These surpluses were largely created by the sale of the
Russian government palladium stockpile. This process of
disposal has taken many years to accomplish but appears
now to be almost complete. Information about the size of
Russia’s state reserves is scant, and is officially still a state
secret. However, what has been gleaned in the last few years
supports a growing consensus (which we share) that sales
from stocks in 2013 will be less than half of the 2012 level,
which was itself sharply down on earlier years.
If this outlook is correct, the overall supply of primary
palladium in 2013 will probably fall, as it is unlikely that
new production this year will be able to compensate for
the predicted drop in sales of palladium from Russian state
inventories. We expect South African supply to be stable,
barring more episodes of prolonged disruption to output
through wage disputes or any unforeseeable events.
Production from Zimbabwe is scheduled to rise, with
government pressure on platinum mines in Zimbabwe to
transfer share of ownership to local stakeholders being
unlikely to affect operations in the short term, in our view.
However, a good portion of this increase in sales to
the market from southern Africa could be offset by lower
production of palladium in Russia, where declining pgm
grades in the orebodies being mined at Norilsk Nickel will
have an impact on palladium output. In total, the net increase
in newly-mined supply in 2013 may be quite small. A more
significant contribution to overall supply of palladium this
year is likely to come from increased volumes of scrap
from autocatalysts, as additional numbers of vehicles are
dismantled and as collectors release material hoarded during
periods of low prices in 2012.
Demand for palladium in autocatalysts grew by 7.5% in
2012. There is no reason not to expect another increase in
overall demand for palladium in 2013, although not at such
a high rate of growth as last year. The regional distribution of
demand will vary. It is likely to be slightly down in Europe and
Japan and flat in North America, but we expect demand to
grow in several key developing auto markets.
The continued weakness of auto sales in Europe will weigh
on palladium demand in the region in 2013, although its effect
will be offset to some extent by increasing substitution of
palladium for platinum in light duty Euro 5 diesel catalysts.
Small amounts of palladium are used in European heavy
duty catalysts too, and greater uptake of platinum–palladium
systems in Europe is expected due to implementation of
Euro VI legislation for heavy duty vehicles starting in January
2013. In Japan, most of the palladium used in autocatalyst is
for light duty gasoline vehicles. As Japanese production of
gasoline cars and light trucks is expected to decline this year
following the impressive growth in 2012, a corresponding
decrease in palladium demand is probable.
In complete contrast, output of light duty vehicles in China,
most of them powered by gasoline engines, is forecast to rise
substantially this year and this will raise palladium demand
significantly. In addition, China 4 emissions standards for
gasoline light duty vehicles, introduced for vehicles driven
in Beijing from March 2013 and due to be implemented
nationwide in later years, will cause average catalyst loadings
to rise slightly.
In Russia, palladium demand should be boosted by
higher vehicle production and new air quality legislation.
The application of Euro 4 standards to all vehicles sold in
the country from January 2013 will lead to an increase in the
average loading of palladium per car. The story will be similar
in Thailand, where gasoline car production is rising strongly
and all vehicles have been required to meet Euro 4 standards

OUTLOOK
Platinum 2013 page 13
since the beginning of the year, with a consequent sharp
increase in palladium catalyst loadings.
Demand for palladium in the once-dominant dental and
electrical sectors is likely to continue its decline. The major
use of palladium in the electrical industry, as the electrode
layers in multi-layer ceramic capacitors, is increasingly being
confined to military, aerospace and other sophisticated
applications, supplanted in other areas by the improving
technical performance and reliability of advanced base
metal materials. Meanwhile, alloys using palladium are
progressively being displaced in dental treatment by ceramics
and other alternatives. Demand for palladium catalysts in the
chemical sector may well be stable, but palladium jewellery
as a significant application is fading like a comet after its
appearance in China in the middle of the last decade.
As a result of these trends, demand for palladium is
increasingly becoming focused on the automotive sector.
Excluding investment, 70% of the palladium purchased
by end-users in 2012 was for autocatalyst manufacture
compared to less than half of non-investment demand in 2005.
This heavy exposure to a single application is potentially a
risk for palladium producers. However, production of light and
heavy duty vehicles using palladium catalysts for emissions
control is almost certain to increase for some years to come. A
more critical fundamental factor in the palladium market will
be the weak outlook for growth in mine supply, which is likely
to maintain the market in a deficit again in 2013 and keep the
palladium price underpinned.
OTHER PGM
Static primary supply and rising demand will keep the
market for rhodium tight in 2013, with the rate of growth
in recovery from spent autocatalysts playing a major role
in deciding the balance between supply and demand.
In every region of production we are expecting supply of
rhodium to be flat in 2013. Production of rhodium in South
Africa will be dependent on platinum output, which we expect
to be fairly stable. It is worth noting that many of the South
African shafts which have been closed or are threatened with
closure are UG2 operations where the orebody has a relatively
high rhodium content. We think Russian supply will be broadly
at the same level as in 2012, elevated by further recovery of
rhodium from old mine concentrates.
Global production of light duty gasoline vehicles is likely to
expand this year, requiring more rhodium for autocatalysts
as a result. Although consumer demand for new cars in
Europe is still weakening due to economic uncertainty in
the eurozone, and there is expected to be some contraction
in output in Japan after the strong growth of 2012, output of
vehicles in China and other Asian countries is forecast to grow
and to more than compensate for the decline in other major
manufacturing centres.
Buying by the glass industry should recover in 2013, if not
quite reaching the 2011 level. Despite overcapacity in the world
for producing flat panel display glass, further LCD production
plants are scheduled to be added in China to meet domestic
self-sufficiency plans. Inventories of rhodium in the glass
industry were reduced in 2012 and will have less impact on
demand for new metal this year.
Primary supply of rhodium on its own would be swamped
by gross demand but the market will be held to a tight
balance in our view by an increase in recovery of rhodium
from autocatalyst scrap. Additional material is likely to be
made available for refining, partly because many collectors
accumulated inventories in 2012.
Demand for ruthenium took a dive last year but we foresee
some recovery in 2013.
Depleted stocks in the hard disk industry may lead to higher
metal requirements, although demand for ruthenium catalysts
from the chemical industry could be weaker than in 2012 if
metal recovered from spent catalysts is sold back to the market.
There are no immediate prospects for significant change in
the level of iridium demand.
Chemical and electrical demand for iridium is unlikely to
increase by much and there may be some decline in buying
from the electrochemical sector as China’s upgrading of its
chlorine industry nears completion.
Sales of palladium from Russian state stocks are expected to decline again in 2013.

page 14 Platinum 2013
PGM Supplies: South Africa’000 oz
Supply 2010 2011 2012
Platinum 4,635 4,860 4,095
Palladium 2,640 2,560 2,330
Rhodium 632 641 576
SUPPLIES, MINING & EXPLORATION
SOUTH AFRICA
The South African pgm industry was severely hit by
unprotected work stoppages during 2012, with the result
that shipments of platinum fell to their lowest level in more
than a decade. Supplies would have been even lower were
it not for releases of metal from in-process inventories, as
refineries drew down their pipeline stocks during periods
of mine inactivity. In total, we estimate that the mines lost
at least 750,000 oz of platinum production in 2012 due to
strikes, both legal and illegal, safety stoppages and mine
closures. We discuss the chronology of these events and
their impacts on the industry in a special feature on South
African production on page 17.
The illegal work stoppages mainly hit the older mines on
the western Bushveld operated by Anglo American Platinum,
Impala Platinum and Lonmin. Worst hit were Impala’s
Rustenburg lease area, where refined platinum output
contracted by a third, and Anglo’s Union mines, where there
was a 23% decline. There were smaller reductions from the
latter’s Rustenburg and Amandelbult groups of mines, while
Lonmin reported an 8% fall in output of platinum in concentrate
from its Marikana operation.
In contrast, with the exception of Atlatsa Resources’ Bokoni
mine, which experienced a prolonged illegal stoppage, mining
operations on the eastern Bushveld and the Platreef were
comparatively unaffected by the turmoil. Indeed, the Two
Rivers and Mototolo mines both reported record platinum
output in 2012.
Low rand pgm prices also contributed to the reduction in
supplies, with three mines and one tailings reprocessing plant
ceasing operations during the year, and others rationalising
their activities in order to conserve cash. Aquarius Platinum
announced that it was mothballing two of its mines, Everest
and Marikana (the latter being operated under a pool and
share agreement with Anglo American Platinum), and halting
processing at its Chrome Tailings Retreatment Plant, a joint
venture (JV) with Sylvania and Ivanhoe Platinum. Meanwhile,
Platinum Australia, which operated the small Smokey Hills
operation on the eastern Bushveld, went into administration,
while the Canadian company Eastern Platinum scaled back
stoping operations at its Crocodile River mine. Anglo American
Platinum has announced a review of its mining strategy,
involving the closure of some shafts in the Rustenburg area
(see page 15), which is likely to impact supplies in 2013.
Anglo American Platinum
Shipments of platinum by Anglo American Platinum fell by
17% to 2.17 million ounces in 2012, reflecting significant
production losses from its western Bushveld operations during
unprotected strikes that took place between September and
November. This figure includes 62,000 oz of production from
the Unki mine, which we classify under Zimbabwe supplies,
although the metal is refined at Anglo’s facilities in South Africa.
Sales fell below the level of refined production, due to the
suspension of spot sales during the fourth quarter in response
to disruption at the mines. In total, 160,000 oz of platinum were
added to Anglo’s refined inventories during 2012.
Equivalent refined platinum production, an indicator of
z Global platinum shipments decreased by 13% to
5.64 million ounces, due to a steep decline in output
from strike-hit mines in South Africa.
z Platinum sales by South African producers fell by 16%
to 4.10 million ounces, a 12-year low. Palladium and
rhodium supplies were also hit by the stoppages, falling
by 9% and 10% respectively.
z Norilsk Nickel’s Russian operations reported a 3% decline
in palladium output, to 2.63 million ounces, while sales
from state stocks fell to just 250,000 oz. As a result,
palladium shipments from Russia were at their lowest
level for a decade.
z Shipments of platinum from North American mines
declined by 16% to 295,000 oz, but palladium supplies
were little changed at 905,000 oz.
z Production of pgm from Zimbabwe was affected by
smelter outages at Zimplats in 2012. As a result, pgm
supplies were unchanged on the previous year.
SUPPLIES
Platinum 2013 page 15
SUPPLIES
underlying mining output, was down 8% at 2.22 million ounces
last year; this figure includes purchases from third parties, such
as chrome tailings operations and Xstrata’s Eland Platinum
mine, plus output from Unki, but excludes metal processed
from secondary materials. Refined platinum production
totalled 2.33 million ounces, as metal was released from the
processing pipeline during the second half.
Production losses were once again concentrated at the
older mines on the western Bushveld, and particularly at the
Amandelbult (Tumela and Dishaba) and Union (North and
South) mines, where output fell by 13% and 23% respectively.
These operations were hit by industrial unrest, which
propagated from the Rustenburg area in early October and
was only resolved in mid-November, and by the depletion
of surface sources of pgm, which have been supplementing
underground output at Tumela and Union North.
Perhaps surprisingly, production at the company’s
Rustenburg area operations was comparatively lightly affected,
with total annual output dropping only 8%, even though
these mines were at the epicentre of the illegal strikes, and
experienced prolonged disruption between September and
November 2012. This was principally because of a strong first
half performance and the production ramp-up at the recently
reopened Khuseleka 2 shaft.
Some of Anglo’s joint venture and associate mines were
also affected by industrial unrest, but to a much lesser degree,
and the impact on production was generally limited. The
Modikwa mine, a joint venture with African Rainbow Minerals,
experienced a 27-day legal wage strike during the first half
of 2012, losing an estimated 11,000 oz of platinum output,
but nevertheless reported a full year production figure of
120,000 oz, just 4% down on the previous year. At the Bafokeng
Rasimone Platinum mine (Royal Bafokeng Resources: 67%),
platinum output fell by 5% to 172,000 oz, but the Mototolo
joint venture with Xstrata had a record year, with production
rising 9% to 119,000 oz. The Kroondal pool and share operation
(operated by Anglo’s partner Aquarius Platinum) escaped
serious interruptions, despite its proximity to the Rustenburg
group of mines, and reported a 2% increase in equivalent
refined platinum production, to 213,000 oz. However, the
neighbouring Marikana pool and share operation fell victim to
low rand pgm prices and was mothballed in June.
On 15th January 2013, Anglo American Platinum announced
the results of a review of its mining strategy. The company
intends to consolidate its Rustenburg assets into three
mining operations (currently five), shutting four shafts and
reducing production across the Rustenburg mines to between
320,000 oz and 350,000 oz per annum going forward.
The planned implementation of the strategic review will
impact production levels this year. Although there is a risk
of some further labour disruption, Anglo expects platinum
output in 2013 to be little changed on last year, at between
2.1 million and 2.3 million ounces.
Impala Platinum
Output of pgm from Impala’s Rustenburg lease area dropped
sharply in 2012, reflecting losses incurred during a six-week
illegal strike, which halted mining between mid-January and
early March, and a slow return to normal operations thereafter.
The poor performance was exacerbated by safety stoppages,
a lack of ore reserve flexibility and a refinery pipeline lock-up
at the year-end. As a result, refined pgm output fell by a third
in 2012, to 628,000 oz of platinum, 353,000 oz of palladium and
84,000 oz of rhodium.
Impala continues to focus on the development of major
vertical shaft projects at its Rustenburg lease area, the
most advanced of which – 20 shaft – began the build-up of
underground production in 2012. The board of Impala has
approved a R2.1 billion project, planned for completion in 2019
to replace the final metals processing facility at its precious
metals refinery.
The company has also reactivated the development of the
Leeuwkop mine, which had been mothballed in the wake of
the global financial crisis. This R9.8 billion project involves the
construction of a vertical shaft to provide access to the reef at
depths of between 1,000 and 1,800 metres. On completion,
the mine will extract 2.16 million tonnes of UG2 ore annually,
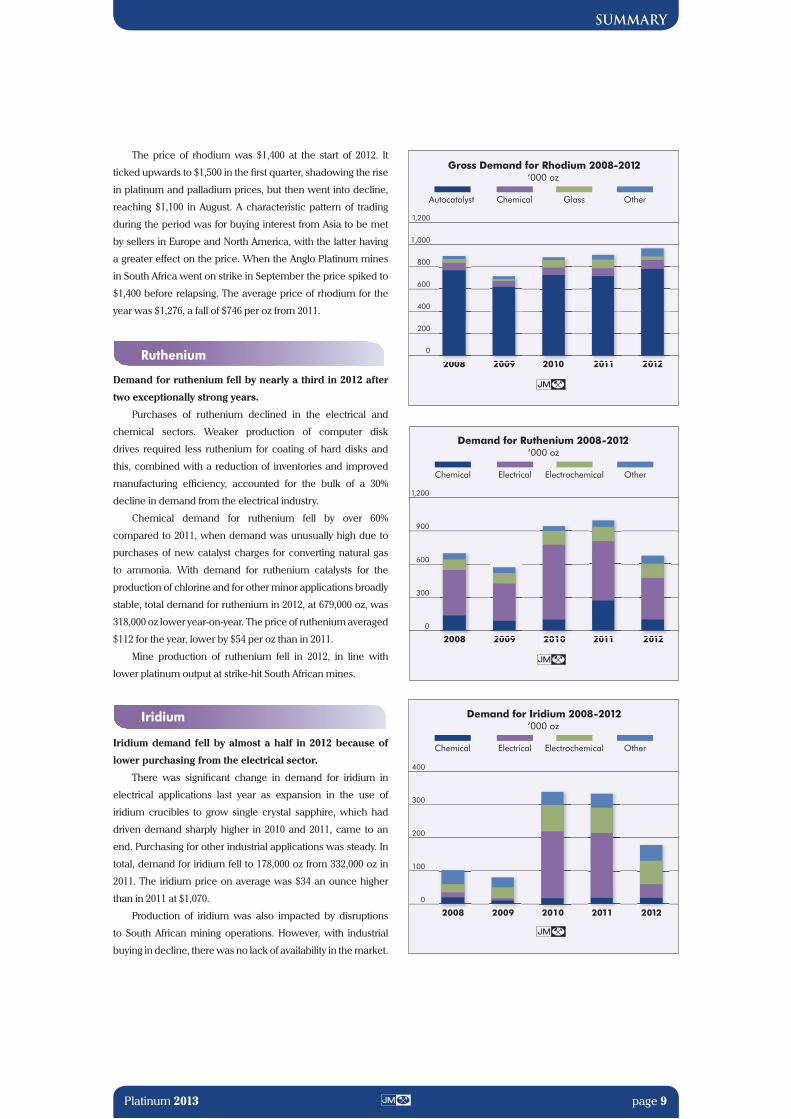
Mechanised drilling underground at Anglo Platinum.

SUPPLIES
page 16 Platinum 2013
yielding around 145,000 oz of platinum, with first production
planned for 2021. This long time lag between project approval
and pgm output is typical of deep underground mining projects.
The small Marula operation on the eastern Bushveld
saw its fortunes improve in 2012, with output of platinum in
concentrate rising by 6% to 69,000 oz. The mine will now seek
to optimise its infrastructure, allowing production to rise to
around 90,000 oz of platinum annually. It was also a good year
for the Two Rivers mine, a joint venture with African Rainbow
Minerals, where platinum output rose by 5% to 156,500 oz, an
all-time record for this operation.
Impala’s Zimbabwe operations, Mimosa and Zimplats,
once again reported consistently strong performances. Output
from these mines is included in our estimates of Zimbabwe
supplies, and is discussed on page 20.
Lonmin
Although illegal stoppages at Impala Platinum and Anglo
American Platinum had a larger impact on platinum supplies
last year, it was the violent unrest at Lonmin’s Marikana mine
which hit the world headlines in August 2012. During the dispute
there was significant loss of life, and mining at Marikana came
to a complete halt for six weeks during August and September.
Mining operations did not fully restart until early October.
Lonmin lost 1.8 million tonnes of ore production, equivalent
to about 110,000 oz of platinum output, as a direct result of the
illegal stoppage. Production of platinum in concentrate from
the Marikana mine was down only 8% in the full calendar year,
at 643,000 oz, reflecting the mine’s relatively good performance
in the first half and a rapid resumption of production in the final
quarter. Meanwhile, total refined platinum production fell 6%,
aided by a release of 31,000 oz of the metal from in-process
inventories. Sales of platinum totalled 717,000 oz, a drop of 4%.
Platinum shipments are likely to fall this year, as pipeline
restocking offsets an increase in mine output: Lonmin expects
to sell 660,000 oz of platinum in the year to September 2013.
Thereafter, production and sales are planned to increase to
at least 750,000 oz of platinum annually in the 2014 and 2015
financial years.
Northam
In contrast to its larger peers, Northam’s mining operations
were little affected in 2012 by the volatile labour relations
climate. The Zondereinde mine, the deepest pgm operation in
South Africa, recorded a 10% increase in mill throughput, to
2.1 million tonnes of ore, while production of pgm in
concentrate rose by 8% to 301,000 oz. However, a furnace run-
out in May resulted in a four-month interruption to smelting
operations; during the rebuild, concentrates containing just
over 100,000 oz of pgm were despatched for toll treatment by
a third party. The smelter was recommissioned in September.
Northam also refines and markets pgm from the Pilanesberg
mine, where production rose by a third in 2012 (see below).
However, during the smelter rebuild, Northam temporarily
halted purchases of concentrate from this source; as a result,
its total pgm shipments fell slightly last year, to 203,000 oz
platinum, 96,000 oz palladium and 24,000 oz rhodium.
Sales of pgm by Northam should rise this year, with the
commissioning of the Booysendal mine on the eastern
Bushveld. Underground mining has commenced, and by early
2013, a surface stockpile containing 320,000 tonnes of ore had
been accumulated. This material will be used to commission
the concentrator, and the first refined production from
Booysendal should be seen during the second half of this year.
Other Producers
In this section we discuss mines which are not owned or
part-owned by Anglo American Platinum, Impala Platinum,
Lonmin or Northam. Almost all pgm production from these
operations is processed in South Africa under concentrate
offtake agreements with the major producers.
In the first nine months of 2012, Platmin’s Pilanesberg open
pit mine reported a 34% increase in pgm output, to 64,000 oz;
concentrate from this operation is sold to Northam. The project
continued to struggle with low grades and recoveries, with the
Hauling ore at Anglo Platinum’s Mogalakwena mine.

Platinum 2013 Special Feature page 17
September 2012Anglo Rustenburg operations are suspended on safety grounds; subsequently, an illegal strike halts most operations.
November 2012The Anglo strike ends in mid-month.In total, Anglo loses over 300,000 oz of platinum production to illegal strikes in 2012.
All three major producers saw the shutdown of their main
production sites on the western Bushveld for periods of
several weeks at a time. Impala Platinum’s Rustenburg
lease area was the first to be affected, when rock drill
operators (RDOs) embarked on an unprotected illegal
strike in January, leading to the cessation of mining for six
weeks. Although production resumed in early March, by
mid year Impala reported that output was still only 85% of
pre-strike levels. As a result, the company estimated that
it lost 150,000 oz of platinum during the first half of 2012.
Anglo American Platinum was the next to experience an
illegal walk-out, with wildcat strikes in the Rustenburg area
cutting production by 9,000 oz during July. A month later,
an unprotected strike at Lonmin spiraled into violence and
bloodshed, culminating in the loss of many lives on 16th
August. The Marikana mine remained at a standstill for six
weeks, losing an estimated 110,000 oz of platinum output.
In September, Anglo suspended its Rustenburg operations
due to concerns about intimidation of mine workers. Although
the resumption of mining was announced on the 18th,
many miners failed to report for work, and by early October,
absenteeism was also affecting the Amandelbult and Union
mines to the north. An agreement enabling a return to work
was finally signed on 15th November. In total, Anglo estimates
that it lost over 300,000 oz of platinum production due to illegal
strikes at its managed and joint venture operations in 2012.
Safety stoppages had an impact on the mines in 2012,
although at a much reduced level compared to 2011. We
estimate that over 70,000 oz of production was lost to Section
54 stoppages. The closure of shafts on economic grounds at
Everest, Marikana and Smokey Hills also contributed to the drop
in output during the year. In January 2013, Anglo announced
the results of a strategic review of its platinum business, which
could see production reduced by up to 400,000 oz a year.
2012 saw exceptional disruption to platinum mining in South Africa. At least 750,000 oz of production was lost to strikes, safety stoppages, and mine closures.
NO
VD
EC
March 2012Miners at Modikwa embark on a three-week legal strike over wage negotiations.
April 2012Operations resume at the Modikwa mine. 11,000 oz of platinum is lost due to the industrial action.
OCT
SEP
AU
GJU
LJU
NM
AY
APR
MA
RFE
BJA
N
February 2012Stoppages continue at the Impala lease area. The illegal strike lasts 6 weeks and costs 150,000 oz in lost platinum output.
2012
May 2012Another two-day stoppage at the Impala lease area cuts platinum output by 6,000 oz. Northam suffers a furnace run out at its Zondereinde mine.
June 2012Aquarius Platinum mothballs the Everest and Marikana mines. Platinum Australia, owner of Smokey Hills, goes into administration.
July 2012Wildcat action affects production at Anglo’s Rustenburg operations and at the Kroondal mine, cutting platinum production by 9,000 oz.
August 2012Miners down tools at Lonmin. Many people are killed during outbreaks of violence. 110,000 oz of platinum are lost during the 6-week stoppage.
October 2012Disruption spreads to Anglo’s Amandelbult and Union mines. Bokoni also suffers illegal stoppages.
January 2012RDOs at Impala’s Rustenburg lease area walk out, bringing production to a standstill.
December 2012The Bokoni mine resumes production after a two-month illegal strike which reduces platinum output by nearly 20,000 oz.
SOUTH AFRICAN PRODUCTION IN 2012

SUPPLIES
page 18 Platinum 2013
head grade in the January to September period averaging only
1.8 grams of pgm per tonne, while concentrator recoveries
were just over 50%.
In November 2012, Platmin announced the completion
of a transaction which will result in the consolidation of its
pgm assets, consisting of the existing Pilanesberg Platinum
mine, and the neighbouring Sedibelo and Magazynskraal
properties. The company is to be renamed Sedibelo Platinum
Mines Limited. The South African Industrial Development
Corporation has injected R3.24 billion into the new company,
in return for 16.2% of the equity.
Output from Xstrata’s Eland Platinum mine fell sharply last
year, to around 20,000 oz of platinum, as open cast mining
ceased and the gradual build-up of mining from underground
got underway. In response to weak rand pgm prices, rising
cost pressures and challenging geological conditions, the
company has decided to defer the planned development of
the eastern decline, delaying the build-up in mining volumes.
Xstrata now expects Eland to reach steady-state production of
5.4 million tonnes of ore annually in 2018. Platinum group
metals from this operation are refined and sold by Anglo
American Platinum.
At Aquarius Platinum’s Everest mine, labour productivity
remained problematic, while geological difficulties continued
to plague the operation as it mined the shallower extremities
of the orebody, where ground conditions were poor, and
the ore lower in grade and more oxidised. As a result, it was
decided in June 2012 to mothball the mine until rand pgm
prices improve. Output of platinum in concentrate last year
fell to just 18,000 oz, from 56,000 oz the previous year. This
metal was refined and sold by Impala Refining Services (IRS).
At Eastern Platinum’s (Eastplats’) Crocodile River mine,
which also sends concentrate to IRS, platinum output totalled
43,000 oz, a fall of 7%. Mining volumes were affected by the
decision to temporarily suspend stoping at the Zandfontein
section, due to low pgm prices, although mining continues at
Maroelabult.
Development of Eastplats’ assets on the eastern Bushveld
has been put on hold. Construction of a concentrator on the
Kennedy’s Vale property commenced in 2011 and was due
to be completed in the first quarter of 2013; this plant was
to be used to process ore first from the nearby Mareesburg
project, and later from the neighbouring Spitzkop property.
However, in mid-2012, economic considerations led to the
company suspending funding for both the concentrator and
the Mareesburg open pit.
Platinum Australia’s Smokey Hills mine was placed on care
and maintenance in June 2012 due to low metal prices and
difficulties in securing finance. The company’s South African
assets have been acquired by Jubilee Platinum, which intends
to treat chrome tailings through the Smokey Hills concentrator,
and will restart underground mining operations in the second
half of this year. The aim is to ramp up production to around
60,000 oz of pgm annually from 2014.
Sylvania Platinum operates six chrome tailings retreatment
plants located at chrome mines on the eastern and western
limbs of the Bushveld. These operations process new tailings
arising from current chrome mining activities as well as material
from existing dumps, and they were therefore disrupted by
the general industrial unrest affecting Bushveld mines in 2012.
Nevertheless, the quantity of material processed through the
pgm plants rose slightly to 712,000 tonnes. However, a fall in
average grades meant that production of pgm in concentrate
contracted by 14% to 41,000 oz.
Sylvania also has a 25% interest in the Chrome Tailings
Retreatment Plant (CTRP), a joint venture with Aquarius
Platinum (50%) and Ivanhoe Platinum (25%), located at the
Kroondal platinum mine. Due to low rand pgm prices, this
plant ceased operations in mid-2012.
Construction of the Wesizwe Platinum mine, adjacent to
Royal Bafokeng Platinum’s Styldrift project, is now underway.
The first blast at the ventilation shaft took place in June 2012,
while sinking of the main shaft begins in 2013. Commissioning
of the first of three concentrator modules is due to take
place in 2020, and the remaining two modules in 2023, once
steady-state mining levels are achieved. At full production, the
mine is planned to extract around 230,000 tonnes of ore per
month, yielding 350,000 oz of pgm annually.
Developing the shaft at Royal Bafokeng Platinum’s Styldrift I mine.

SUPPLIES
Platinum 2013 page 19
PGM Supplies: Russia’000 oz
Supply 2010 2011 2012
Platinum 825 835 800
Palladium
Primary Production 2,720 2,705 2,630
State Sales 1,000 775 250
Rhodium 70 70 90
PGM Supplies: North America’000 oz
Supply 2010 2011 2012
Platinum 200 350 295
Palladium 590 900 905
Rhodium 10 23 23
Wesizwe Platinum is also a partner in the nearby Western
Bushveld Joint Venture (WBJV) Project 1, in which it holds a
26% stake. The remaining 74% interest in the project is held
by the Canadian company Platinum Group Metals Limited.
Mine development is progressing and construction of a
concentrator is scheduled to begin in the first half of this year,
with commissioning due in late 2014. The mine is planned to
produce around 275,000 oz of pgm annually.
Production continues to ramp up at the Nkomati Nickel
mine, a JV between African Rainbow Minerals and Norilsk
Nickel, which produces pgm as by-products. In 2012, output
totalled 24,000 oz of platinum and 64,000 oz of palladium, up
by around 30% compared with the previous year.
RUSSIA
Shipments of platinum and palladium from Norilsk
Nickel’s Russian operations fell slightly in 2012. At
660,000 oz, platinum output was down 2% on the previous
year, while palladium production declined by 3% to
2.63 million ounces. We believe that Norilsk also refined
large quantities of stored pyrrhotite concentrate, which
is relatively enriched in rhodium; as a result, we have
increased our estimate of supplies of this metal in 2012,
to 90,000 oz.
In view of the depletion of its richest, massive sulphide ore
resources, and the consequent decline in average grades across
its operations, Norilsk Nickel plans to increase production
from disseminated ores going forward. In September 2012,
the company announced that it had completed design works
aimed at expanding the Zapolyarny mine, which extracts
disseminated ore from the Norilsk-I deposit. Mine capacity will
be increased gradually from 1.2 to 2.0 million tonnes of ore
annually by 2019.
The company’s published outlook suggests that there will be
another modest decline in platinum and palladium output this
year, to around 650,000 oz and 2.6 million ounces respectively.
We believe that shipments of platinum from alluvial mining
operations contracted slightly in 2012, to 140,000 oz. In the
Russian Far East, output from the largest producer, Kondyor,
remained stable but production from the Koryak deposit
is thought to be in decline and to have fallen to relatively
insignificant levels. Small amounts of platinum are also
extracted from alluvial deposits in the Sverdlovsk area of the
Urals and from dredging in the area around Norilsk itself.
Our estimate of sales of palladium from government
controlled inventories remains unchanged, at 250,000 oz in
2012, down from 775,000 oz the previous year. Going forward,
we believe that there may be some residual sales of metal in
2013, but once again at much reduced levels. Our view is that
Russian stock sales are unlikely to be of significance to overall
palladium supplies in the foreseeable future.
NORTH AMERICA
Supplies of platinum from North America dropped by 16%
to 295,000 oz, reflecting lower production of this metal at
Vale’s Sudbury operations. However, palladium shipments
were up slightly, at 905,000 oz, with a reduction in sales by
Stillwater more than offset by increased output from North
American Palladium. Rhodium supplies were unchanged,
at 23,000 oz.
Canada
North American Palladium’s Lac des Iles (LDI) mine had a
positive year, with palladium output rising 12% to 164,000 oz.
The LDI plant currently processes a mixture of higher-grade
ore from underground operations, and lower-grade ore from
surface sources. A new shaft is being developed which will
enable the company to increase production of high-grade
underground ore, raising production to around 250,000 oz of
palladium annually from 2015.
Xstrata and Vale both produce pgm as by-products of nickel
mining at their Canadian operations. Vale reported a drop in
platinum output from its Sudbury mines in 2012, although

SUPPLIES
page 20 Platinum 2013
PGM Supplies: Zimbabwe’000 oz
Supply 2010 2011 2012
Platinum 280 340 340
Palladium 220 265 265
Rhodium 19 29 30
palladium shipments were stable and nickel output was up by
nearly 10%. At Xstrata’s Sudbury unit, nickel production rose
by 3% to 20,425 tonnes, while output of copper rose by 16%
to 57,813 tonnes, reflecting high copper volumes from the
company’s Nickel Rim South mine and from the Fraser mine,
where it is extracting copper-rich ore under an agreement with
Vale. Both these mines exploit orebodies containing higher
copper and pgm values than is typical of the Sudbury area.
Stillwater Mining Company is undertaking engineering
studies and environmental permitting activities at its Marathon
pgm and copper project north of Lake Superior in Ontario,
Canada. Initial estimates suggest that the planned open cast
mine would produce about 200,000 oz of pgm annually over
an 11.5-year mine life. In March 2012, it was announced that
Mitsubishi Corporation had entered into an agreement under
which it will acquire a 25% interest in the Marathon project.
USA
The Stillwater Mining Company operates two mines in Montana
which are currently the only significant producers of primary
pgm in the USA. In 2012, the company produced 514,000 oz
of platinum and palladium combined, similar to the previous
year, as a slight decline in mill throughput was offset by modest
increases in grades and recoveries. However, sales fell slightly
below the level of production, at 386,000 oz of palladium and
114,000 oz of platinum.
Stillwater expects to maintain output at around 500,000 oz
of pgm annually until new projects bring a modest expansion
of production in 2015 and beyond. The Graham Creek project
at the East Boulder mine will add around 30,000 oz of pgm
annually starting in late 2014, while the Far West project – an
unexploited area within the Stillwater mine – could add a
further 45,000 oz per annum by 2017.
ZIMBABWE
Supplies of platinum from Zimbabwe were unchanged
in 2012, as outages at the Zimplats smelter resulted in a
temporary increase in unprocessed stocks of pgm at the
year-end. Underlying production remained strong, with
both Mimosa and Unki reporting record pgm output.
Following its commissioning in January 2011, Anglo
American Platinum’s Unki mine has recorded a swift ramp
up to full production levels. In 2012, the mill processed
1.54 million tonnes of ore, up 20% compared with the previous
year, and in excess of its nameplate capacity (120,000 tonnes
per month). Although the average head grade fell by 6% to
3.43 grams of pgm per tonne, this was offset by an
improvement in recoveries, and equivalent refined platinum
production rose by 20% to 63,000 oz.
Improvements in capacity utilisation enabled the Mimosa
mine (a 50:50 joint venture between Aquarius Platinum and
Impala Platinum) to achieve record pgm output in 2012. Mill
throughput rose by 2% to 2.37 million tonnes, leading to a small
increase in output of platinum in concentrate, to 108,000 oz.
The mine is operating at full capacity and production is likely
to be flat this year.
Zimplats’ Ngezi mine produced 169,000 oz of platinum in
matte in 2012, down 9% on the previous year. However, this
was entirely due to a build-up in pgm stocks in the processing
pipeline, following a furnace run-out in November. At the
year-end, the company reported an 18,000 oz inventory of
unprocessed platinum, which will be refined in the first half of
2013 and will add to supplies this year.
The company’s Phase 2 expansion, planned to increase
production to 270,000 oz of platinum annually by 2015, remains
on schedule. The project involves the development of a
new two million tonne per annum underground mine plus
additional concentrator capacity.
J-M reef ore mined at Stillwater in Montana, USA.

Platinum 2013 page 21
RECYCLING
Recycling’000 oz
Platinum Palladium Rhodium
2011 2012 2011 2012 2011 2012
Autocatalyst (1,240) (1,130) (1,695) (1,660) (277) (259)
Electrical (10) (10) (480) (430) 0 0
Jewellery (810) (890) (210) (190) 0 0
Total (2,060) (2,030) (2,385) (2,280) (277) (259)
the increase in the availability of scrap material. However,
some of this was lost to the Japanese collection network as
de-registered vehicles for export passed the million-unit mark
for the first time since 2008.
In North America, pent-up demand for light and heavy
vehicles after the long recession helped to propel sales of
new vehicles in 2012, which in turn augmented the number of
older vehicles scrapped. At the same time, falling pgm prices
in the first half of the year encouraged collectors to hold on to
material. The higher average prices in the second half drove
collectors to release catalysts to refiners. In addition to catalysts
collected from end-of-life vehicles, one of the largest collectors
in the USA, known to hold large stocks of spent catalytic
converters, began processing its inventory in the second half
of the year. Consequently, recovery of pgm in North America
in 2012 substantially exceeded earlier expectations to reach
1.81 million ounces, only marginally below the 2011 level.
The autocatalyst recycling infrastructure in North America
is one of the oldest and most developed: recycling rates have
been optimised over the last three decades and are therefore
not expected to improve. Future recoveries will depend on the
amount of pgm used in catalysts over time and the number of
vehicles scrapped each year, as well as short-term holding and
release of inventory by collectors.
Recycling of catalytic converters in China and other
countries expanded at double digit rates in 2012, although
total quantities remain low compared with Europe, Japan and
North America. Recycling volumes will continue to increase as
AUTOCATALYST
Recovery of pgm from end-of-life vehicle catalysts in 2012
was 3.05 million ounces, lower than in 2011 by 160,000 oz.
Low pgm prices, which prompted collectors to hoard scrap,
and continued weakness in the European car market were
the main causes of the decline. A recovery in prices in the
second half of the year and the liquidation of old autocatalyst
inventories held by one collector in North America in particular
gave a late boost to scrap volumes.
PGM recovered from end-of-life European autocatalysts
declined by 21% in 2012 to 720,000 oz. The continued
weakness in car sales in the region had a knock-on impact on
vehicle scrap rates as motorists held on to their vehicles for
longer periods. The average age of cars on the road in Europe
has steadily increased since 2009. PGM recoveries were also
impacted by falling prices for steel during 2012, which further
reduced the throughput of scrap, and by lower average pgm
prices in the first half of the year which led to the hoarding of
catalysts at many of the smaller scrap yards and collectors.
Recoveries picked up in line with pgm prices in August and
September and were steady in the final quarter, but ended
the year well below 2011 levels. Platinum recoveries fell by a
lesser amount than palladium as a result of the year-on-year
growth in collection of diesel catalysts stemming from the
rapid growth in diesel vehicle registrations during the early part
of the last decade.
PGM autocatalyst recovery in Japan in 2012 increased
by 5% year-on-year to 205,000 oz. A higher turnover of
scrapped vehicles was the result of much improved new and
second-hand vehicle sales compared with 2011, when the
Japanese auto market was depressed by the disastrous
earthquake and tsunami. Used vehicle sales in 2012 rose for
the first time in 12 years. Also helping to boost autocatalyst
recoveries was the re-introduction of a Government subsidy for
fuel efficient vehicles, which encouraged greater movement
down the second-hand market chain, and contributed to
z Recycling of platinum, palladium and rhodium in 2012
came to 4.57 million ounces, a year-on-year decline of
150,000 oz.
z Recovery of platinum in 2012 was marginally down
compared to 2011, with a fall in autocatalyst scrap
refining in Europe and North America partly offset by
greater recycling of jewellery scrap in China.
z Palladium recycling fell by 105,000 oz to 2.28 million
ounces in 2012, the bulk of the decline coming from the
electrical sector.
z As with platinum and palladium, refining of rhodium
from scrap autocatalysts in 2012 was affected by weak
pgm prices and lower collection rates, total recoveries
falling by 6% to 259,000 oz.
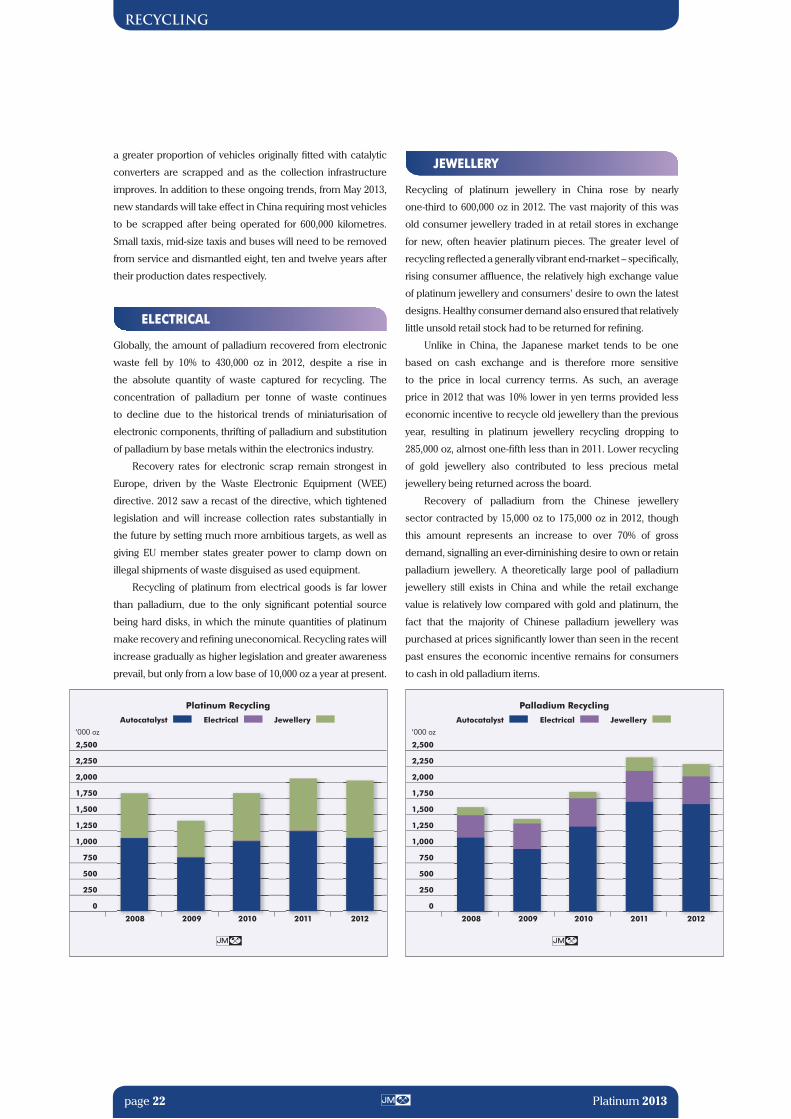
RECYCLING
page 22 Platinum 2013
Platinum Recycling
Autocatalyst Electrical Jewellery
2,500
2,250
2,000
1,750
1,500
1,250
1,000
750
500
250
0
‘000 oz
2008 2009 2010 2011 2012
Palladium Recycling
Autocatalyst Electrical Jewellery
2,500
2,250
2,000
1,750
1,500
1,250
1,000
750
500
250
0
‘000 oz
2008 2009 2010 2011 2012
JEWELLERY
Recycling of platinum jewellery in China rose by nearly
one-third to 600,000 oz in 2012. The vast majority of this was
old consumer jewellery traded in at retail stores in exchange
for new, often heavier platinum pieces. The greater level of
recycling reflected a generally vibrant end-market – specifically,
rising consumer affluence, the relatively high exchange value
of platinum jewellery and consumers’ desire to own the latest
designs. Healthy consumer demand also ensured that relatively
little unsold retail stock had to be returned for refining.
Unlike in China, the Japanese market tends to be one
based on cash exchange and is therefore more sensitive
to the price in local currency terms. As such, an average
price in 2012 that was 10% lower in yen terms provided less
economic incentive to recycle old jewellery than the previous
year, resulting in platinum jewellery recycling dropping to
285,000 oz, almost one-fifth less than in 2011. Lower recycling
of gold jewellery also contributed to less precious metal
jewellery being returned across the board.
Recovery of palladium from the Chinese jewellery
sector contracted by 15,000 oz to 175,000 oz in 2012, though
this amount represents an increase to over 70% of gross
demand, signalling an ever-diminishing desire to own or retain
palladium jewellery. A theoretically large pool of palladium
jewellery still exists in China and while the retail exchange
value is relatively low compared with gold and platinum, the
fact that the majority of Chinese palladium jewellery was
purchased at prices significantly lower than seen in the recent
past ensures the economic incentive remains for consumers
to cash in old palladium items.
a greater proportion of vehicles originally fitted with catalytic
converters are scrapped and as the collection infrastructure
improves. In addition to these ongoing trends, from May 2013,
new standards will take effect in China requiring most vehicles
to be scrapped after being operated for 600,000 kilometres.
Small taxis, mid-size taxis and buses will need to be removed
from service and dismantled eight, ten and twelve years after
their production dates respectively.
ELECTRICAL
Globally, the amount of palladium recovered from electronic
waste fell by 10% to 430,000 oz in 2012, despite a rise in
the absolute quantity of waste captured for recycling. The
concentration of palladium per tonne of waste continues
to decline due to the historical trends of miniaturisation of
electronic components, thrifting of palladium and substitution
of palladium by base metals within the electronics industry.
Recovery rates for electronic scrap remain strongest in
Europe, driven by the Waste Electronic Equipment (WEE)
directive. 2012 saw a recast of the directive, which tightened
legislation and will increase collection rates substantially in
the future by setting much more ambitious targets, as well as
giving EU member states greater power to clamp down on
illegal shipments of waste disguised as used equipment.
Recycling of platinum from electrical goods is far lower
than palladium, due to the only significant potential source
being hard disks, in which the minute quantities of platinum
make recovery and refining uneconomical. Recycling rates will
increase gradually as higher legislation and greater awareness
prevail, but only from a low base of 10,000 oz a year at present.

Platinum 2013 page 23
PLATINUM
Platinum Demand: Autocatalyst’000 oz
Gross Recycling Net
2011 2012 2011 2012 2011 2012
Europe 1,505 1,330 (445) (370) 1,060 960
Japan 500 600 (75) (80) 425 520
North America 370 405 (635) (580) (265) (175)
China 105 105 (15) (15) 90 90
Rest of the World 705 800 (70) (85) 635 715
Total 3,185 3,240 (1,240) (1,130) 1,945 2,110
AUTOCATALYST
The depressed light vehicle market in Europe and a lower
market share for diesel vehicles led to a significant fall in
demand for platinum in the region. However, a rebound
in output of vehicles in Japan, a continued surge in the
manufacture of diesel vehicles in India and increased
demand for pickup trucks in North America made up for
most of this decline. Demand for platinum autocatalysts
for heavy duty vehicles also improved marginally. Our
estimate of total gross demand, at 3.24 million ounces, now
includes platinum required for catalysts to control exhaust
emissions from diesel non-road mobile machinery.
This number, previously recorded in our Other demand
estimates, more than doubled in 2012 to reach 100,000 oz.
Europe
European demand for platinum in autocatalysts, mainly for
diesel engine cars, heavy duty vehicles and non-road mobile
machinery, fell by 12% in 2012 to 1.33 million ounces.
The principal driver of the lower demand was the
pronounced weakness of the European light vehicle market.
According to the European automobile manufacturers
association, ACEA, new car sales in the EU-27 countries fell by
8.2% in 2012 to 12.05 million units. In an already fragile market
this represented the lowest number of registrations since 1995.
The United Kingdom, where attractive price discounts drove
strong demand from private buyers, was the only major market
in the region to demonstrate growth at 5.3%. Car sales in
France, Spain and Italy all declined, by 13.9%, 13.4% and 19.9%
respectively, Italy posting the lowest new vehicle registrations
in over three decades. Even the previously resilient German
market was not immune to the weak economic sentiment.
After starting the year positively, the rate of German new car
registrations progressively deteriorated in the second half,
ending the year almost 3% down on 2011.
In line with the much reduced sales levels, total production
of light vehicles in the region, including light commercial
vehicles, fell by 7% to 17.24 million units, the lowest output
since 2009. Several auto manufacturers cut production capacity
during 2012, with more reductions expected in 2013.
Diesel vehicle output fell to a greater degree than gasoline
vehicle production as the share of diesel vehicles sold in
Western Europe contracted slightly in 2012 to around 55% of
total light vehicle registrations. While sales of premium diesel
vehicles held up relatively well, at the lower end of the market
demand for cheap, fuel-efficient cars drove a steady expansion
in the production of small cars in the A and B vehicle segments.
The proportion of diesel engine vehicles in these small car
categories is low relative to the mid-size C and D segment
vehicles they have displaced. Consequently, the number of
diesel vehicles produced in the region declined to less than
half of total European vehicle output. The resulting negative
impact on demand for platinum was exacerbated by further
substitution of platinum by palladium in diesel catalysts.
In contrast, demand for platinum in the European heavy
duty sector rose modestly in 2012. This growth was in spite of
an estimated 10% decline in truck output in the region. Euro VI
z Gross demand for platinum in autocatalysts rose by 1.7%
in 2012 to 3.24 million ounces. Weak demand from the
depressed European vehicle market was largely offset
by demand for light vehicle autocatalysts in Japan, India
and North America.
z Retail expansion and some building of stock in China
were mainly responsible for a 12% growth to 2.78 million
ounces in gross demand for platinum in jewellery.
z Industrial demand for platinum slumped by 21% to
1.57 million ounces, affected by a slowing of expansion
in the glass industry, reduced production of hard disk
drives in the electrical industry and the drawdown of
inventory in both sectors.
z Platinum investment demand was steady at 455,000 oz
due to strong investor interest in North America and
higher production of coins worldwide.

PLATINUM
page 24 Platinum 2013
emissions standards were introduced for heavy duty vehicles
sold in the EU from January 2013 and some Euro VI vehicles
were released during 2012 ahead of the application of the new
rules. Most Euro VI vehicles are fitted with a full aftertreatment
system comprising a diesel oxidation catalyst (DOC),
pgm-coated diesel particulate filter (DPF), selective catalytic
reduction (SCR) and ammonia slip catalyst (ASC), containing
significantly more pgm on average than Euro V vehicles.
In the non-road mobile machinery sector, which covers
a wide range of vehicles that use internal combustion
engines, including agricultural, construction and industrial
machines, demand for platinum in diesel emissions control
catalysts increased off a low base. To meet European Stage
IIIB emissions regulations, pgm-containing catalysts were
introduced for diesel engines in the 130-560 kW power band
in 2011. In 2012, the regulations were further rolled out to
engines of 56-130 kW power, increasing overall catalyst fitment
and platinum demand. More details on this component of
autocatalyst demand are in our special feature on page 31.
Japan
Demand for platinum for autocatalysts from the Japanese
domestic motor industry, including non-road emissions
control, increased by 20% to 600,000 oz in 2012.
In Japan, vehicle output in 2012 rebounded strongly from
the depressed production levels following the Great East Japan
Earthquake of March 2011. Total vehicle manufacturing in
2012 expanded to 9.7 million units, with both light and heavy
duty segments recording the highest output since 2008. Total
domestic vehicle sales also rallied, recording the strongest
annual total for five years.
Whilst light duty output grew by 20%, the production mix
altered in 2012, with fewer diesel vehicles being made and the
number of gasoline vehicles rising sharply, to account for 95%
of all light vehicles manufactured in Japan. This reduction of
the diesel share made little difference to demand for platinum,
since gasoline cars built in Japan still use platinum in the
catalyst mix.
Heavy duty output in Japan in 2012 returned for the first
time to pre-recession levels. Most of the heavier vehicles for
domestic sales, and for export markets with strict emissions
legislation, were fitted with platinum-containing systems
that included DOC, DPF and, if SCR was used for the control
of nitrogen oxide (NOx) emissions, ASC. Many of the lighter
vehicles in the heavy duty sector were fitted with lean NOx
traps (LNT) to control NOx emissions, resulting in the additional
use of a small amount of rhodium.
As with the rest of the automotive industry in Japan, the
non-road sector produces machinery such as tractors and
earth movers for a substantial export market. Consequently,
Japanese non-road vehicle manufacturers were fitting
platinum autocatalysts on vehicles in 2012 to meet tightening
emissions legislation in not only the domestic market but in
Europe and North America as well.
North America
With most gasoline vehicles built in North America using
palladium–rhodium catalysts, demand for platinum in the
auto sector is increasingly reliant on diesel vehicle sales in the
region. In 2012, pent-up demand for new diesel pickup trucks
in the North American automotive market helped propel light
duty diesel production up by 25%, to a record high of over half
a million vehicles. There is a direct correlation between the
number of new housing starts and pickup truck sales and, as
building activity increased in 2012, contractors and landscaping
companies felt confident enough to invest in new trucks. In
addition to improved domestic demand, exports increased
last year as some manufacturers consolidated production
of specific models in the USA and shipped them elsewhere.
This represents a significant shift from automakers' previous
strategy of building vehicles where they are sold; since 2009,
exports from North America to non-NAFTA countries have
more than doubled.
The heavy duty sector in North America also thrived in 2012.
The average age of trucks on the road hit a new high in 2010
Catalysts for controlling pollution from diesel vehicle exhaust.

PLATINUM
Platinum 2013 page 25
World Light Duty Diesel Vehicle Production
20122011
10,000
8,000
6,000
4,000
2,000
0
‘000 vehicles
Europe Japan N America China Rest
as fleet managers and truck owners delayed purchases while
the economy floundered. Since then, the average truck age
has declined but still remains well over the historical average.
As construction, housing starts and retail sales picked up last
year, so did North American sales of heavy duty diesel trucks,
rising by 14.5%.
While production of both light and heavy duty diesel
vehicles rose strongly last year, the rate of increase in demand
for platinum in road-going vehicles lagged behind, rising by
only 1.8%. Platinum’s less than stellar performance was due
mostly to continued substitution of platinum with palladium
by Japanese manufacturers in the light duty gasoline
segment. However, demand for platinum received a boost
from increased offtake in the burgeoning non-road mobile
machinery sector, so that total demand in North America in
2012 was 405,000 oz, up by 9.5% compared to 2011.
China
Light duty vehicle production in China grew in 2012 to reach
16.8 million units. Fewer than 5% of these were powered by
diesel engines, the key users of platinum-rich autocatalysts.
However, there was a slight increase in the light duty diesel
build in 2012, and despite a further postponement of China 4
emissions regulations for light duty diesels, which had been
intended to apply nationwide in 2012, platinum consumption
for diesel vehicles enjoyed some year-on-year growth.
Some foreign joint venture manufacturers in China use
platinum in their gasoline vehicle catalyst mix, but they made
fewer vehicles than in 2011. Chinese domestic manufacturers
tend to fit only palladium–rhodium catalysts on their gasoline
vehicles. Production of heavy duty diesels also declined, and
as a result, overall gross demand for platinum in the Chinese
autocatalyst sector remained flat in 2012 at 105,000 oz.
Rest of the World
Platinum autocatalyst demand in other countries rose by
13.5% in 2012 to 800,000 oz. Thailand and India were the
two markets registering the largest growth. In Thailand, the
increase was due to production of light duty diesel vehicles
growing by over 50% to 1.26 million units to meet strong
domestic demand for pickup trucks. In India, where the auto
market is three times the size of Thailand’s, light vehicle output
exceeded industry expectations, growing by 12% to just over
four million units. Significantly for platinum demand, diesel
vehicle production increased even more strongly, expanding
by over a quarter on 2011 levels.
Since the removal of price controls on gasoline fuel in
June 2010, the gap between gasoline and diesel pump prices
throughout India has widened as gasoline fuel costs have been
rising in line with international prices. This has encouraged a
growing number of cost-conscious Indian consumers to buy
diesel cars, and in response vehicle manufacturers in the
country have increased diesel vehicle supply. As part of a series
of measures to reduce its fiscal deficit, in September 2012 the
Indian government announced a 12% reduction to the subsidy
on diesel fuel. However, even with the reduced support in
place, diesel prices were substantially lower than gasoline
prices for the remainder of the year and into early 2013, thus
maintaining the incentive to purchase diesel vehicles. Diesel
registrations received a further boost at the top end of the
market with strong growth in SUV sales, the majority of which
are diesel-fuelled. Almost half of the light vehicles produced
in India in 2012 were powered by a diesel engine, a growth of
around five percentage points on 2011. The expanding market
share of diesel vehicles, combined with the overall growth
in Indian vehicle output, resulted in an increase in platinum
demand in India of almost 30% on 2011 levels.
World region. JEWELLERY
Gross demand for platinum for manufacturing jewellery
increased by 305,000 oz in 2012 to 2.78 million ounces.
There was a surge of buying by manufacturers in China,
in order to supply platinum jewellery to a growing number
of retail outlets in Chinese cities. Manufacturers also took
advantage of the relatively weak platinum price to increase

PLATINUM
page 26 Platinum 2013
stocks to an extent. In India there was wider distribution
of platinum jewellery in the retail network. The discount of
platinum to gold during nearly all of 2012 made platinum
jewellery more competitive with white gold in all markets.
Europe
Demand for platinum from the European jewellery industry
increased by 5,000 oz to 180,000 oz in 2012, marking the
first annual rise in demand since 2007 despite a significant
slowdown in economic growth in the region. Lower platinum
prices, both in absolute terms and relative to gold, have been
a factor encouraging consumers to trade up to platinum, often
at the expense of white gold, offsetting any retrenchment in
consumer spending.
In the UK, where platinum retains a strong position in the
bridal sector, the number of British-made hallmarked pieces
rose by a modest 1.8%. Exhibiting stronger growth, the number
of platinum jewellery pieces hallmarked in Switzerland in 2012
soared by 14% on the previous year, with the hallmarking of
platinum watch cases climbing by 5% to just over 9,500 pieces,
demonstrating continued recovery in demand for high-end
luxury goods.
Japan
Buying of platinum by the Japanese jewellery trade continued
to show signs of consolidation in 2012 as year-on-year gross
demand remained steady at 310,000 oz, supported by the first
annual increase in overall platinum retail sales since 2009.
Generally, a lower platinum price, both in absolute terms and
relative to gold, helped platinum to gain market share in place
of white gold. In some instances it also slowed the trend to
save costs by making lighter weight platinum jewellery pieces.
At retail level, in the all-important bridal sector, in which the
majority of rings are made in platinum, a decline in the weight
per wedding ring matched an increase in the number of rings
sold, leaving the market flat on the previous year. Demand
in the non-bridal sector grew thanks to the emergence of
moderately priced platinum jewellery, with lightweight chains
proving popular.
The increase in retail platinum sales was partly met by
higher platinum jewellery imports and, as exports of platinum
jewellery declined in 2012, domestic manufacturing of
platinum was flat overall. With the amount of old jewellery
recycled falling by 19% to 285,000 oz, demand net of scrap was
positive in 2012 at 25,000 oz.
North America
Purchasing of platinum by the North American jewellery
industry in 2012 was flat at 185,000 oz. The pull-through effect
on demand of greater sales of platinum jewellery at retail level
was offset by a drawdown of inventory by manufacturers as
they sought to operate leaner facilities.
Demand for platinum from the bridal sector remained
largely unchanged. Platinum’s favourable price relative to gold
in 2012 helped to advance its share of the female bridal market,
at the expense of white gold, by around 1%. However, this was
balanced by a continued decline in the number of marriages.
The marriage rate in the USA last year was 6.8 per thousand,
compared to 8.2 per thousand ten years earlier, while in
Canada the rate was also on a downward trend.
Demand from the non-bridal sector also remained fairly
stable. Platinum jewellery continued to be in demand in
the high-end market, both domestically and for export, but
lower priced alternatives such as 14k white gold provided stiff
competition in the mid-range market.
China
Gross demand for platinum jewellery in China increased
by 16% in 2012 to 1.95 million ounces, second only to the
record 2.08 million ounces bought in 2009. Purchasing by the
industry during the first three-quarters of the year was at a very
strong rate. This was driven by continued retail expansion,
in particular by Hong Kong brands into lower-tier mainland
cities, and to a lesser extent by an increase in manufacturers’
stocks as they took advantage of the weaker platinum price.
Significantly lower purchasing by the trade towards the end
of 2012 did not prevent full year purchasing of platinum by the
jewellery trade on the Shanghai Gold Exchange from reaching
a new record, surpassing the previous high of 2009.
Platinum Demand: Jewellery’000 oz
Gross1 Recycling2 Net3
2011 2012 2011 2012 2011 2012
Europe 175 180 (5) (5) 170 175
Japan 310 310 (350) (285) (40) 25
North America 185 185 0 0 185 185
China 1,680 1,950 (455) (600) 1,225 1,350
Rest of the World 125 155 0 0 125 155
Total 2,475 2,780 (810) (890) 1,665 1,890
NOTES TO TABLE1 Gross demand is equivalent to the sum of platinum jewellery manufacturing volumes and any increases in unfabricated metal stocks within the industry.2 Recycling represents the amount of retailer stock and consumer jewellery recycled whether the metal is re-used within the jewellery industry or sold back to the market.3 Net demand is the sum of these figures and therefore represents the industry’s net requirement for new metal.

PLATINUM
Platinum 2013 page 27
Reflecting the international spot price of platinum, which
traded at a discount to gold all year apart from six days in
March, the manufacturers’ selling prices for platinum jewellery
were lower than for gold jewellery throughout 2012.
Conversely, jewellery retailers – who by and large price
jewellery by weight rather than per piece – maintained a
relatively slender premium in the per gram price of platinum
relative to gold. This had multi-fold effects that combined to
help boost consumer demand for platinum in 2012.
Principally, it allowed retailers to benefit from even greater
relative profit margins in platinum, compared to gold, than
would ordinarily have been the case. Naturally, this translated
into a retail sales strategy that tended to emphasise platinum
jewellery in cases where the consumer was ambivalent
towards the two metals.
At the same time the retail price of platinum was historically
close to that of gold, making it easier to ‘up-sell’ platinum to
consumers, who were finding for the first time that platinum
was not very much more expensive than gold. Platinum
jewellery was more affordable, particularly for the more price
conscious younger consumers in lower-tier cities, with lighter
weight designs also helping to boost sales in some regions.
The fact that platinum maintained a retail premium, albeit only
marginally, continued to reinforce the perception of platinum’s
exclusivity in the minds of many consumers.
Consequently, retail sales of platinum jewellery remained
robust through the first three-quarters of 2012, if not necessarily
keeping pace with the growth in retail stocks. In the final three
months of the year the culmination of several successive
quarters of deteriorating economic growth, combined with
higher average precious metals prices, had an adverse impact
on retail platinum jewellery sales.
Poor sales around the Mid-Autumn Festival and National
Day in early October, traditionally a vibrant time of year for
retailers, signalled the downturn. Accordingly, total new
metal acquired by the trade for manufacturing in the fourth
quarter declined by close to one-fifth on the previous three
months of the year.
Despite this relatively weak end to 2012, the retail market
as a whole exhibited strong growth, with platinum continuing
to do well in both the bridal and fashion sectors. There was
more consistent demand throughout the year for gem-set
platinum jewellery: a lower platinum price, allied to a move
by manufacturers to set smaller stones in platinum, helped to
make diamond-set platinum jewellery more competitive with
white gold pieces.
With recycling of scrap platinum jewellery rising by
145,000 oz in 2012 to 600,000 oz, year-on-year growth in net
demand was pegged to 10%, reaching 1.35 million ounces for
the year as a whole.
Rest of the World
Demand in the Rest of the World region grew impressively in
2012, rising by 24% on the previous year to 155,000 oz. Most
of this was due to continued expansion in the relatively young
Indian market, which accounted for more than 70% of Rest of
the World region demand.
Demand in India was driven primarily by further growth
in the retail network. In a sign that platinum is playing an
increasingly important and sustainable role in the Indian
market, many large retail chains are incorporating bespoke
retail space for platinum into the design of new outlets.
Profit margins on platinum jewellery at retail level in India
were already greater than gold prior to 2012, prompting
retailers to enter the platinum market. With platinum trading
at a discount to gold on the international spot market
throughout almost all of 2012, platinum was more competitively
priced relative to gold than previously, leading to increased
consumer offtake.
Effective marketing has helped to convert increased levels
of stock into higher consumer purchases. The Platinum Guild’s
‘Platinum Day of Love’ campaign in particular has been keenly
received by the core 20-35 year age group in India. Even niche
markets that have yet to benefit from sustained targeted
promotion, such as men’s jewellery, have shown promising
signs of growth.
Platinum jewellery distribution continued to spread in China last year.

PLATINUM
page 28 Platinum 2013
Platinum Demand: Electrical’000 oz
Gross Recycling Net
2011 2012 2011 2012 2011 2012
Europe 20 15 (5) (5) 15 10
Japan 25 20 0 0 25 20
North America 25 20 0 0 25 20
China 30 25 (5) (5) 25 20
Rest of the World 130 85 0 0 130 85
Total 230 165 (10) (10) 220 155
INDUSTRIAL DEMAND
Demand for platinum in industrial applications fell by
405,000 oz in 2012 to 1.57 million ounces. This was largely
the effect of changing conditions in the glass industry,
where excess production capacity, combined with the use
of platinum from decommissioned plants and existing
inventories, led to a fall in purchases of metal. In the
electrical industry, inventory adjustments and weaker
demand for hard disk drives impacted purchases of
platinum. Demand from the chemical sector was slightly
lower than in 2011 while demand for platinum in medical,
petroleum refining and other applications was stable.
Chemical
Demand for platinum in the global chemical industry fell by
20,000 oz in 2012 to a total of 450,000 oz.
Platinum curing catalysts used in the manufacture of
silicones make up the biggest area of demand for platinum
in the chemical sector. Platinum is used in niche applications
where fast, low temperature curing is required or where
the end product has medical applications and relies on the
biocompatibility of platinum. The mature markets of Europe,
Japan and North America have previously led the growth in
use of platinum cured silicones. Demand in these regions has
reached a plateau, but fast growth is now taking place in China
and the rest of Asia, although this as yet contributes only a
small portion to total platinum demand.
Catalysts containing platinum are used in the synthesis
of paraxylene, a raw material in the production of purified
terephthalic acid (PTA), which is used to make polyethylene
terephthalate (PET), mainly for polyester textile and plastic
containers. Over the past few years growth in paraxylene
capacity has been driven predominantly by new plant builds
and expansions in China. However, the same levels of capacity
increases cannot be anticipated going forward.
Demand for platinum as a gauze catalyst for the conversion of
ammonia to nitric acid remained solid in 2012, with increased
demand for fertilisers and explosives in Asia and South Africa
more than offsetting a decline in European demand.
Electrical
Gross demand for platinum in the electrical industry declined
by 28% to 165,000 oz in 2012, with 95% of this reduction coming
from the hard disk sector. Hard disk drives, which use platinum-
containing disks to store data in personal computers, DVD
players and other devices, are under increasing threat from
solid state storage technologies which do not require pgm,
such as those found in tablet computers and smart phones.
Consumer personal computer (PC) sales declined in 2012,
due to a combination of economic uncertainty in several key
markets and the technology shift to new computing devices,
i.e. smart phones and tablets, which are now performing the
majority of tasks previously requiring a PC or laptop. Hard
disk manufacturers also sought to use existing inventories
of platinum wherever possible, further reducing demand for
metal last year.
Despite demand for platinum via the mobile and PC sector
being under significant threat, growth in demand for hard
drives in the business storage sector remains strong, driven by
increasing digital content and larger file sizes.
Moving into 2013, demand for platinum is expected to
increase as consumer purchasing improves and the trend to
install more disks per drive continues in order to meet higher
storage requirements.
Hard disks will continue to provide the best value data
storage for many years to come and their use in combination
with solid state memory as hybrid drives will continue to
provide firm demand for platinum in the consumer market.
2013 sees the introduction of a new 5mm form factor hard
disk drive, which is thin enough to fit the latest ultra-books.
Platinum Demand: Chemical’000 oz
2010 2011 2012
Europe 110 120 110
Japan 50 35 35
North America 100 95 105
China 80 100 90
Rest of the World 100 120 110
Total 440 470 450

PLATINUM
Platinum 2013 page 29
Platinum Demand: Investment’000 oz
2010 2011 2012
Europe 140 155 135
Japan 45 250 100
North America 465 10 190
China 0 0 0
Rest of the World 5 45 30
Total 655 460 455
Platinum Demand: Glass’000 oz
2010 2011 2012
Europe 10 30 5
Japan 90 130 10
North America 10 (5) 10
China 130 10 70
Rest of the World 145 350 85
Total 385 515 180
Hybrid drives will combine the benefits of fast solid state
drive (SSD) power-up ability with the large storage capacity of
the traditional hard disk.
Glass
Platinum demand in the glass sector fell from 515,000 oz in
2011 to 180,000 oz in 2012, a decline of 65%. Excess production
capacity in the glass fibre segment resulted in few new
projects added during the year, while sales of platinum back to
the market from redundant facilities further affected demand.
Except in China, the display glass industry also suffered from
overcapacity and experienced a sharp reduction in purchases
of platinum, exacerbated by glass producers having stocks of
metal to draw on.
Compared with 2011, when purchases of platinum for
glass were at a record, demand in 2012 fell by 335,000 oz
to 180,000 oz. Demand for glass fibre used in lightweight,
high-strength reinforcements for construction, transport and
consumer goods markets, increased by more than 5% last year
to reach 4.5 million tonnes. Despite this rise, average global
capacity utilization of only 70% in glass fibre production plants,
the result of a surge in new plant construction by Chinese
manufacturers in 2007 and 2008, limited the need for platinum.
An added negative effect on demand for new metal came from
the recycling and reuse of platinum from decommissioned
glass fibre plants using the less efficient 'marble melt' process.
Demand for platinum to produce display glass was also
weaker last year. Although LCD televisions, which are a key
driver of display glass production, continued to gain market
share from both CRT and plasma display TVs, global sales
of televisions fell by 6% in 2012 and sales of LCD TVs were
slightly lower year-on-year. The rate of expansion in flat glass
manufacturing capacity slowed in response, growing by only
11% last year compared with 13% annual growth in 2011
and 32% growth in 2010. Much of this demand was met by
improvements to manufacturing processes that resulted in
higher output rates from existing equipment. However, Chinese
manufacturers added seven new flat glass production lines in
2012 in pursuit of their goal to source all components for LCD
TV production domestically. No additional capacity was added
in Japan and the Rest of the World region.
INVESTMENT
Net identifiable physical demand for platinum reached
455,000 oz in 2012, 5,000 oz lower than in the previous
year. Demand for platinum exchange traded funds (ETFs)
was marginally higher compared to 2011. Significantly
lower net purchasing of large bars in Japan was largely
offset by a combination of an increase in demand for coins
and small bars and the acquisition of metal for the launch
of a new physically-backed product in North America.
ETF investment throughout 2012 was strongly and positively
correlated with price, more so than in any previous year.
Around three-quarters of all growth in ETFs during the year
occurred in a rising price environment, while over 80% of
liquidation accompanied a falling price. Greater conviction
from investors when the market was rising ensured that net
ETF investment remained positive for the year at 195,000 oz,
5,000 oz higher than in 2011.
The year began strongly as ETF investors responded to a
surge in the platinum price by buying close to 115,000 oz in the
first two months, making up for most of the net disinvestment
which had taken place in the final four months of 2011. There
followed a three-month period during which the early gains
in price were entirely relinquished and investors liquidated
positions heavily. This included nearly 45,000 oz of platinum
sold in May, the fourth largest monthly liquidation of ETFs on
record. After a period of relative inactivity, the strong price
response to the mining strikes in South Africa reignited investor
interest, leading to over 105,000 oz of additional demand for
platinum in August alone, the fourth largest monthly net inflow
on record. Further net investment in September drove ETF

PLATINUM
page 30 Platinum 2013
OthersZKB
ETFS – USAETFS – London
1,750
1,500
1,250
1,000
750
500
250
0
Platinum ETF Investment 2008-2012
2008 2009 2010 2011 2012
‘000 oz1,750
1,500
1,250
1,750
1,500
1,250
‘000 oz $/ozPt ETF Holdings Price
Jan Feb Mar Apr May Jun Jul Aug Sep Oct Nov Dec
Aggregate ETF Investment in 2012
platinum holdings to a new peak of over 1.7 million ounces,
surpassing the previous record set 12 months earlier. In the
fourth quarter, modest profit-taking occurred as the price
weakened in response to easing tensions in South Africa,
leaving total fund holdings by year-end at 1.65 million ounces.
In contrast to 2011, when two-thirds of net ETF demand
emanated from the Zurich-based funds, net investment
demand in 2012 came mainly from a return to strong growth
in the two largest funds, based in London and New York. Net
investment of over 95,000 oz in the ETF Securities London
product signalled the first annual increase in holdings
since 2009, while growth of 60,000 oz in its New York fund
represented a four-fold increase on the modest net investment
the previous year. November 2012 also marked the launch of a
new ETF listed in Hong Kong, although by year-end it had yet
to gain any significant momentum, net investment amounting
to less than 2,000 oz.
Investors in the Japanese large bar market largely reverted to
type in 2012, namely by investing in a falling price environment
and selling on price upturns. However, there were three
months in the year in which this pattern was reversed. Net
investment increased during January and August while the
price of platinum was rising, because both months were
preceded by a period of sharply falling local prices. Conversely,
in November the local platinum price was on the decline, but
investors were able to sell at a profit due to the price having
increased strongly during the preceding months. In all, the
greater conviction of investors during periods of weaker prices
ensured that the market recorded net positive investment for
the fifth consecutive year although, at 100,000 oz, the total was
135,000 oz lower than in 2011.
Movements in the yen–dollar exchange rate added to price
volatility throughout 2012. Starting the year at ¥76.7 to the dollar,
close to record lows, the yen weakened during February and
March, accentuating the platinum price rise in local currency
terms. Several consecutive months of yen appreciation then
exacerbated the subsequent reversal in the platinum dollar
price. Towards the end of the year, the anticipation and
eventual confirmation of the return to government of a Liberal
Democratic Party promising stronger action to weaken the
currency helped the yen to depreciate significantly, reaching
¥86.6 to the dollar at the end of December. This left the yen
price of platinum 24% higher than at the start of the year,
whereas the difference in the dollar price was only 10%.
December saw the launch and enthusiastic take-up by
investors of the Sprott Physical Platinum and Palladium Trust,
a fully-allocated closed-end trust listed on the New York Stock
Exchange (NYSE Arca) and Toronto Stock Exchange (TSX).
Full allocation of the 28 million units in the initial offering at an
opening price of $10 each enabled the fund to amass just over
80,000 oz of physical platinum.
2012 was a relatively strong year for small platinum bar and
coin demand. In the most significant development, the Royal
Canadian Mint restarted one-ounce Platinum Maple Leaf
bullion coins early in the year, adding to the 30,000 limited
mintage of one-ounce Platinum Platypus bullion coins from
the Perth Mint. The US Mint also issued the fourth American
Eagle Proof coin in its six-year annual commemoration of
American democracy, adding another 15,000 oz to demand.
Including some other numismatic releases, small bar and
coin demand grew to 80,000 oz, more than twice the size of
demand in the previous year.

Platinum 2013 Special Feature page 31
INTRODUCTION
Three fundamental factors determine the amount of platinum group metals
(pgm) used in the autocatalyst sector: vehicle production rates, fuel type,
and emissions legislation. Use of pgm by the automotive industry has steadily
increased as population growth and greater prosperity have raised demand
for new vehicles while at the same time legislation has set ever-tighter limits
on exhaust emissions. Generally, as emission controls become increasingly
strict, more pgm are needed per vehicle to lower the pollutant content of the
exhaust gas. Emissions standards are tightest in North America, Europe and
Japan, which are the most developed markets with the highest ownership of
vehicles per capita. These three regions, therefore, account for the majority
of autocatalyst pgm demand today, with the major emerging markets of
China, Brazil and India steadily increasing their global share. China is now
the world’s largest vehicle producing nation and although Chinese demand
for pgm in autocatalysts currently lags behind that of North America and
Europe, it will rise in importance in coming years due to continuing growth
in vehicle production in the country and increasingly tighter emissions limits
proposed there.
Control of harmful emissions from vehicle exhaust using catalysts is the largest single application for pgm, in 2012 accounting for 56% of gross world demand for platinum, palladium and rhodium combined. In this special feature we have for the first time split platinum and palladium autocatalyst demand values into their main components of light duty gasoline, light duty diesel and heavy duty diesel vehicles. We have also included in our autocatalyst numbers demand for catalysts for diesel non-road mobile machinery – this was previously reported as part of Other demand. Here we examine the historical long-term drivers and the future opportunities for the use of pgm in each of these automotive applications.
THE COMPONENTS OF AUTOCATALYST DEMAND

page 32 Special Feature Platinum 2013
Platinum Demand in Emissions Control Catalysts 2006 – 2012
7
6
5
4
3
2
1
0
LDG LDD HDV NRMMmillion oz
2006 2007 2008 2009 2010 2011 2012
Palladium Demand in Emissions Control Catalysts 2006 – 2012
7
6
5
4
3
2
1
0
LDG LDD HDV NRMMmillion oz
2006 2007 2008 2009 2010 2011 2012
Platinum Demand in Emissions Control Catalysts 2006 – 2012
7
6
5
4
3
2
1
0
LDG LDD HDV NRMMmillion oz
2006 2007 2008 2009 2010 2011 2012
Palladium Demand in Emissions Control Catalysts 2006 – 2012
7
6
5
4
3
2
1
0
LDG LDD HDV NRMMmillion oz
2006 2007 2008 2009 2010 2011 2012
In line with emissions standards, our light duty gasoline (LDG) and light
duty diesel (LDD) categories include all on-road vehicles of gross vehicle
weight (GVW) less than 3.5 tonnes (less than 4.54 tonnes in the USA and
under 6.35 tonnes in California) and the heavy duty (HDV) category consists
of vehicles of GVW above these weights.
LIGHT DUTY GASOLINE
The light duty gasoline sector comprises passenger cars and light
commercial vehicles as well as two and three-wheeled vehicles. Light
duty gasoline (LDG) vehicles make up the biggest share of the global
vehicle fleet.
Since being introduced in the USA as a result of the 1970 Clean Air Act,
emissions legislation for LDG vehicles has been progressively tightened
and extended around the world. Initially, simple platinum–palladium
oxidation catalysts were used to convert carbon monoxide (CO) and
unburnt hydrocarbons (HC) from gasoline engines during lean (excess
oxygen) conditions to form carbon dioxide (CO2) and water. The three-
way catalyst (TWC) was developed to meet the US–1983 emissions limits
which now included oxides of nitrogen (NOx). TWCs allow the oxidation of
CO and HC using platinum or palladium catalysts while a rhodium catalyst
performs the reduction of NOx to nitrogen and oxygen under rich (oxygen
depleted) conditions. This technology relies on the engine operating around
the stoichiometric point (air to fuel ratio of 14.7:1) at which the optimal
simultaneous reduction of NOx and oxidation of CO and HC take place.
Although platinum was originally used in TWCs for the oxidation
reactions, during the 1990s the relatively high cost of platinum compared
to palladium encouraged autocatalyst manufacturers to develop advanced
washcoat technologies that allowed the substitution of platinum by
palladium, leading to the development of Pt–Pd–Rh and Pd–Rh formulations.
Most auto companies now use Pd–Rh TWCs in gasoline vehicles, though
some continue to employ Pt–Pd–Rh systems.
Since palladium is the dominant component in gasoline exhaust
aftertreatment, LDG vehicles are responsible for the majority of palladium
demand in autocatalysts. Today, LDG catalysts account for just under 20% of
autocatalyst demand for platinum but close to 90% of autocatalyst demand
for palladium. As the global LDG fleet expands and more stringent emissions
legislation is implemented, demand for pgm, and for palladium in particular,
can be expected to grow.
LIGHT DUTY DIESEL
Our light duty diesel (LDD) category consists of passenger cars, pickup
trucks and light commercial vehicles. LDD vehicles are today responsible
for the majority of platinum demand in the autocatalyst sector and so the
use of platinum is high in markets where LDDs make up a large proportion
of the vehicle fleet, principally in Europe, India, Thailand and Korea.
Emissions legislation forcing the use of aftertreatment on LDDs was first
implemented in 2000 with the introduction of Euro 3 standards in Europe.
Platinum diesel oxidation catalysts (DOCs) were initially used to convert
CO and HC in the exhaust stream, but as catalyst technology advanced and
diesel fuel quality was improved manufacturers were able to thrift platinum
from DOCs and substitute some of the platinum with palladium, producing
a lower cost system.
The addition of particulate matter (PM) as a regulated pollutant in many
of the developed markets provided a further opportunity for using pgm. PM,
or soot, is trapped by a diesel particulate filter (DPF) downstream of the
DOC. The DPF is then periodically regenerated with platinum and palladium
catalysing the oxidation of soot into CO2 and water. Adding palladium
has improved the overall thermal durability of the system, allowing
high-temperature regeneration events to take place without damaging the
catalyst. However, platinum is more catalytically active in the oxidising
environment of a diesel exhaust and for this reason palladium is unable to
entirely replace platinum in diesel aftertreatment.

Platinum 2013 Special Feature page 33
Autocatalyst PGM Demand Share by Vehicle Type 2012
100%
80%
60%
40%
20%
0%
Pt Pd Rh
LDG LDD HDV NRMMLDG LDD HDV NRMM
Stricter NOx emissions regulations to be introduced in the near future
will provide an opportunity to increase the use of platinum and to introduce
the use of rhodium in diesel catalysts. Diesel vehicles sold in North America
and in Japan already require some additional form of NOx aftertreatment,
and European diesels will face tighter NOx emissions limits at Euro 6,
starting in 2014.
As in all lean burn engines, the chemical reduction of NOx is made
difficult by the highly-oxidising conditions in the exhaust stream. Although
vehicle manufacturers can, in some cases, calibrate a diesel engine to emit
sufficiently low NOx to meet standards, most LDD vehicles will use either
a pgm-containing lean NOx trap (LNT) or selective catalytic reduction
(SCR), using a base metal catalyst. As a general rule, smaller diesels
will employ LNTs, while larger vehicles which produce higher levels of
engine-out NOx will use SCR.
LNTs contain relatively high amounts of platinum, along with palladium
and rhodium. The SCR catalyst itself does not contain pgm. However, in
systems being developed for the European market, the associated DOC and
DPF components in the aftertreatment system benefit from a slightly higher
ratio of platinum in their washcoat formulation in order to ensure optimum
SCR activity at low temperature. These factors should together continue to
boost pgm demand in the LDD sector in the medium term, and will later
impact pgm demand in other regions as they gradually adopt tighter diesel
emissions standards.
HEAVY DUTY VEHICLES
Heavy duty vehicles (HDVs) range from delivery vans to buses and large
trucks. The majority of the 4.6 million HDVs produced in 2012 were powered
by diesel engines. However, some larger gasoline or gaseous fuel vehicles
are heavy enough to be classed as heavy duty and we include these vehicles
in our pgm estimates.
The use of pgm-containing aftertreatment on diesel HDVs has a shorter
history than light duty vehicles. Although emissions legislation for HDVs has
been in place since 1987, the limits have not always necessitated the use of
pgm catalysts.
The first national rules which forced the use of catalysts were the US
2007 standards, which were met by the addition of DOCs and DPFs to the
engine to control PM emissions. The US limits were further tightened in
2010 leading to the use of SCR catalysts to reduce NOx emissions and a
platinum-containing ammonia slip catalyst (ASC) downstream of the SCR
to oxidise excess ammonia to nitrogen and water. The North American
market, therefore, represents a major portion of current pgm demand in the
heavy duty diesel (HDD) sector.
Japan, a major exporter of both light and heavy duty vehicles, produces
more HDVs annually than North America, and accounts for the largest pgm
demand in this sector. A range of aftertreatment configurations are used on
Japanese-produced HDVs depending on the regulations in force in the end
use market. For larger vehicles sold in the domestic market, aftertreatment
systems with DOCs, DPFs, SCR catalysts and ASCs are used. Almost half of
the HDV vehicles assembled in Japan are diesel mini vans. For domestic
sales and certain export destinations these vehicles are fitted with NOx traps
containing platinum, palladium and rhodium, in order to meet the local
emissions limits.
The next area for growth in HDV pgm demand will be Europe. Euro VI
legislation, introduced in January 2013, will apply to all vehicles sold in the
region from January 2014. European vehicle manufacturers already employ
SCR to meet Euro V standards, but only a small proportion of vehicles are
fitted with pgm-containing catalysts. Euro VI will in almost all cases force the
addition of DOCs, DPFs and ASCs to the SCR system. Platinum will benefit
most from the transition to Euro VI as its use ensures good passive filter
regeneration and promotes low temperature activity of the SCR.
HDV legislation in most of the emerging markets is not yet tight enough
to require fitment of pgm-containing catalysts, though some ‘low emission’
vehicles in cities are fitted (or retro-fitted) with DOCs and/or DPFs. As in
the light duty sector, most countries follow the European legislation, with
China IV (equivalent to Euro IV) expected to be implemented in China later
this year and Euro V in Indian cities in 2015.
NON-ROAD MOBILE MACHINERY
Non-Road Mobile Machinery (NRMM) is defined as any mobile equipment
or vehicle in which an internal combustion engine is installed, but which is
not intended for the transport of passengers or goods on the road.
The category encompasses a wide range of machinery including
agricultural, construction and industrial vehicles, lawn and garden
equipment, inland marine vessels, mobile generator sets and rail
locomotives. Our NRMM category comprises diesel engines only. There are
a number of small gasoline and gaseous fuel engines that are covered by
NRMM legislation and the relatively small pgm demand from these sources
is included in our Other demand category.

page 34 Special Feature Platinum 2013
Platinum Demand: Autocatalyst’000 oz
Vehicle Type 2010 2011 2012
Light Duty Gasoline 640 545 620
Light Duty Diesel 2,025 2,105 2,020
Heavy Duty 400 490 500
Non-Road Mobile Machinery 10 45 100
Total 3,075 3,185 3,240
Palladium Demand: Autocatalyst’000 oz
Vehicle Type 2010 2011 2012
Light Duty Gasoline 5,040 5,335 5,805
Light Duty Diesel 495 710 670
Heavy Duty 40 100 120
Non-Road Mobile Machinery 5 10 20
Total 5,580 6,155 6,615
1
0.9
0.8
0.7
0.6
0.5
0.4
0.3
0.2
0.1
0
0 2 4 6 8 10
PM
g/k
Wh
1999 - 2014 PM reduction 96.4%; NOx reduction 95.7%
*Stage IIIA stipulates a [NOx + HC] limit, all other stages of legislation specify a NOx limit
EU STAGE IIIA*75-130 kW
EU STAGE IV 56-130 kW
EU STAGE IIIB75-130 kW
EU STAGE II75-130 kW
EU STAGE I75-130 kW
NOx or [NOx + HC] g/kWh
Non-Road Diesel Emissions Limits in Europe
1999
2003
2007
2012
2014
NRMM legislation is more coordinated globally than on-road emissions
regulations. Due to the global nature of the NRMM industry, in which
engines may be manufactured in one location, installed on vehicles or
equipment in another country, and then sold around the world, emissions
legislation for non-road engines is broadly harmonised across the three
mature markets of Japan, North America and Europe. Other countries are
expected to adopt these regulations over time; China, India and Brazil all
have emissions legislation in place for NRMM but these are not yet tight
enough to require catalysts.
Harmonised catalyst-forcing legislation was introduced for NRMM in
Japan, the USA and Europe in 2011 and is being progressively phased in
for engines of different power bands, starting with the largest engines.
Manufacturers are able to make use of flexibility schemes to produce a
certain number of engines meeting the previous stage of emissions limits
in the first few years after the new legislation has been introduced. A tighter
stage of legislation, Tier 4 final / Stage IV, will be implemented from 2014.
In very general terms, current Tier 4 interim / Stage IIIB emissions limits
highlight reductions in particulate matter (PM), whereas Tier 4 final / Stage
IV limits are focused on NOx emissions abatement.
Due to the diverse number of equipment types and end applications,
a wide variety of aftertreatment and catalyst configurations are used, but
they generally resemble those used in the on-road diesel sector. Platinum
and palladium can both be used in NRMM aftertreatment, though platinum
should retain the dominant role.
PGM demand from the non-road sector is currently small in comparison
with that in on-road emissions control, representing just 3% of total
autocatalyst platinum demand in 2012. However, NRMM is a promising
future area of growth for pgm demand, as engine production in the
mature markets increases from the currently depressed levels, and as
catalyst-forcing legislation is progressively rolled out in other markets.

Platinum 2013 page 35
Palladium Demand: Autocatalyst’000 oz
Gross Recycling Net
2011 2012 2011 2012 2011 2012
Europe 1,485 1,455 (390) (295) 1,095 1,160
Japan 680 785 (100) (105) 580 680
North America 1,545 1,815 (1,055) (1,080) 490 735
China 1,155 1,255 (35) (45) 1,120 1,210
Rest of the World 1,290 1,305 (115) (135) 1,175 1,170
Total 6,155 6,615 (1,695) (1,660) 4,460 4,955
PALLADIUM
AUTOCATALYST
In 2012, for the second year running, gross demand for
palladium was at a new all-time high. World demand of
6.62 million ounces represented a 7.5% increase on 2011
and, even more impressively, a rise of nearly two-thirds
when compared to the depressed level of 4.05 million
ounces during the recession year of 2009. Some of the
reasons behind this demand strength were familiar ones,
like the continuing increase in gasoline vehicle production
in China and the gradual rise in the average ratio of
palladium to platinum in autocatalysts for diesel vehicles.
Others were germane to 2012. There was a recovery
in Japanese vehicle output after so much production
capacity was put out of commission by the earthquake and
tsunami of March 2011; in the USA, production of light duty
cars and trucks soared as consumer confidence increased
and buyers finally returned to the showrooms to replace
their ageing vehicles. However, recycling of palladium
from end-of-life catalysts did not keep pace with gross
demand last year, falling by 2% to 1.66 million ounces as
weakness in pgm prices caused collectors to hoard stocks
of spent converters for a time. Consequently, the increase
in net autocatalyst demand to 4.96 million ounces was an
11% advance on the 2011 level.
Europe
Despite a very weak European vehicle market, demand for
palladium in European emissions control catalysts held up
well, falling by just 2% in 2012 to 1.46 million ounces.
European light duty vehicle sales in 2012 were the worst
in 13 years, with new car and light commercial registrations
falling by 8.2% year-on-year to 14.8 million units. However,
the effect on demand for palladium was alleviated by several
factors: a rise in production of gasoline-powered cars by
manufacturers of premium vehicles; an increase in the
market share of gasoline vehicles produced in Europe; and
the further part substitution of palladium for platinum in
diesel-powered vehicles.
Mass market producers, which are highly dependent on
demand for cars in their domestic markets, were the most
heavily impacted by the continued weakness in the European
economy in 2012 and the declining level of vehicle sales. In
contrast, output at most of the premium producers increased
thanks to sustained growth in sales of their vehicles outside
Europe, with the result that European vehicle exports rose for
the third successive year.
Demand in Europe’s largest export market, North America,
was fuelled by rebounding consumer demand for vehicles in
the USA, where German brands have been steadily gaining
popularity and accounted for one in eight cars sold in the
country last year. Vehicle exports to Asia grew to an all-time
high, driven by a seemingly insatiable appetite for top-end
luxury models in China. As premium vehicles typically contain
a higher amount of pgm on their aftertreatment systems than
mass market models, the increasing market share of these
vehicles partly offset the decline in palladium demand caused
by the overall lower vehicle production.
In addition to the higher number of predominantly
gasoline vehicle exports, 2012 also saw an increase in the
z Gross demand for palladium in autocatalysts reached a
new record of 6.62 million ounces in 2012, propelled by
recovering car output in Japan, further growth in China
and a rebound in new registrations in North America.
z Industrial demand for palladium weakened in 2012 to
2.37 million ounces due to less intensive use of palladium
in the electrical industry.
z Falling production in China was the cause of a decline
to 445,000 oz in gross world demand for palladium for
jewellery manufacturing.
z Net physical investment in palladium was positive in 2012
at 470,000 oz. ETF inflows were strong in the first half
and the launch of a new investment trust in December
added significantly to demand.

PALLADIUM
page 36 Platinum 2013
popularity of gasoline-powered vehicles in home markets,
as cash-strapped consumers opted for smaller, cheaper cars,
and tax schemes in some markets incentivised the purchase
of more fuel-efficient downsized engines. The growing share
of gasoline vehicles in an overall declining market provided a
further cushion to palladium demand.
In the light duty diesel sector, palladium now represents
30% of the pgm used in emissions control catalysts. 2011
was the first full year of Euro 5 emissions standards for cars
sold in Europe, which forced the fitment of diesel particulate
filters (DPFs) to meet the new tighter nitrogen oxide (NOx)
and particulate matter limits. These systems contained higher
levels of palladium than Euro 4 catalysts, partly to offer cost
savings to vehicle manufacturers by replacing a portion of the
platinum on the catalyst, but also to benefit from the increased
thermal durability of palladium–platinum catalysts during
high-temperature regeneration of the filter.
Following the strong increase in palladium substitution for
platinum in 2011, last year witnessed a more steady expansion
in palladium use as automakers and catalyst manufacturers
continued to look for further cost savings in emissions
aftertreatment. Even so, due to the 10% decline in European
diesel vehicle production in 2012, the use of palladium in light
duty diesel catalyst systems was lower year-on-year.
For heavy duty diesel vehicles, palladium is used along
with platinum in the limited number of Euro V vehicles that
contain diesel oxidiation catalysts (DOCs) and/or DPFs, and
also in newer Euro VI aftertreatment systems. Palladium use
in the European heavy duty sector remains small at present
but demonstrated some growth last year as a result of the
introduction of Euro VI trucks onto the European market.
Japan
Demand for palladium in the Japanese autocatalyst sector grew
by 15% in 2012 to reach 785,000 oz. The growth in demand has
been driven by a 22% increase in light duty gasoline vehicle
output in Japan. This was supported by an expansion of 27%
in domestic light duty sales in 2012, and together these were
significant contributors to the turnaround from a depressed
2011, which was greatly affected by the March earthquake.
A reduction in light duty diesel production in 2012 allowed
gasoline vehicles to take a greater share of output. Nonetheless,
the increase in pgm demand has not kept pace with the growth
in vehicle production. Thrifting in the pgm mix has resulted in a
reduction in average loadings for gasoline catalysts, including a
5% reduction in the average palladium content.
Palladium demand in heavy duty vehicles grew in line with
output in 2012, despite some adverse export trade. Over half of
trucks manufactured in Japan are sold overseas, and in 2012,
fewer were exported to those destinations where the tightest
emissions standards are in place. Truck exports to Europe, for
example, were 53% fewer than in 2011, even though in that year
vehicle output was adversely affected by the March disaster.
However, exports to regions in which emissions legislation
was being tightened, from a lower base than in Europe, were
sufficient to maintain a steady growth in palladium demand.
The use of palladium in non-road applications in Japan is not
significant at present.
North America
Purchases of palladium in the North American automotive
sector increased by 17.5% in 2012 to 1.82 million ounces as a
result of strong growth in the production of cars and light trucks
as well as continued substitution of platinum by palladium in
light duty gasoline vehicles.
Improving economic conditions and access to credit were
two of the reasons consumers flocked to vehicle showrooms
last year. In addition to new car loans being easily obtainable,
the average interest rate dropped to new lows during 2012
and high-risk lending expanded to 25% of all loans in the third
quarter of 2012, up from 22% during the same period of 2011.
Another underlying factor driving sales was the need to replace
older vehicles as the average age of cars and light trucks hit a
record 11 years.
High gasoline prices did little to deter sales, but rather
encouraged consumers to trade in their inefficient old vehicles
for new fuel-saving models. Sales of passenger cars increased
Palladium autocatalyst demand in North America was up in 2012.

World Light Duty Gasoline Vehicle Production
20122011
18,000
16,000
14,000
12,000
10,000
8,000
6,000
4,000
2,000
0
‘000 vehicles
Europe Japan N America China Rest
PALLADIUM
Platinum 2013 page 37
PALLADIUM
Platinum 2013 page 37
at twice the rate of truck sales and consumers strongly
favoured the smallest vehicles in both categories. For all of
2012, sales of compact cars and trucks increased by over 16%
and represented 42.5% of all vehicles sold. While this had some
negative impact on palladium demand, soaring production
more than made up for it.
All told, in 2012 consumers in North America purchased
12.6% more light duty vehicles while production surged
by 18.9% to 12.6 million units, only half a million shy of the
pre-recession total of 13.1 million vehicles. In addition to strong
domestic sales, a combination of a weaker dollar and free
trade pacts have made the USA a more attractive place to build
vehicles, resulting in foreign manufacturers moving production
capacity there for both domestic sales and exports.
China
The growth in light duty output in China raised the production
of gasoline vehicles there in 2012 to 16 million vehicles,
meaning that one in four new gasoline vehicles manufactured
globally was made in China. This growth in production added
100,000 oz of palladium to demand, an increase of 8.7% year-on-
year, taking Chinese purchases of palladium for autocatalysts
to 1.26 million ounces. Whilst this was an improvement on
the previous year, the anticipated introduction of the Euro 5
equivalent emissions legislation for gasoline light duty vehicles,
China 5, in Beijing during 2012, did not materialise, thus
dampening the full effect on demand that the implementation
of those standards might have had.
Some manufacturers, nevertheless, did supply the market
with China 5 compliant gasoline passenger cars, which resulted
in either significantly higher average palladium loadings than
China 4 equivalent models or the introduction of new, more
clean and efficient engines.
Rest of the World
Korea, Mexico and India are substantial buyers of palladium
for autocatalysts, each country using well over 100,000 oz of
palladium a year. Russia is a growing vehicle manufacturing
base which is fast catching up with this group and is likely to
join it in 2013. Russian vehicle production continued on a strong
growth path in 2012, with light vehicle output expanding by a
healthy 11.6% to a new record of 2.1 million units. Following a
collapse in vehicle sales in 2009, the Russian auto market has
recorded three consecutive years of robust growth. In 2012,
buoyed by falling unemployment and an increase in consumer
spending, light vehicle registrations grew by 11% to over
2.9 million units, reaching a par with the 2008 peak.
In the last few years, vehicle assembly in Russia has grown
at a stronger rate than new car sales as foreign automakers
have expanded their production capacity in the country to
meet ambitious government targets that allow them to qualify
for incentives. As a predominantly gasoline market, palladium
demand has benefited from the growth in vehicle output,
climbing by nearly a quarter in 2012. Demand was boosted by
the increased production of vehicles meeting Euro 4 emissions
legislation. Euro 4 rules were introduced in 2010 for new
models sold in Russia, but apply to all new vehicles sold in the
country from January 2013.
JEWELLERY
Gross demand for palladium in jewellery in 2012, at
445,000 oz, was 60,000 oz below the 2011 level. Demand
in China fell for the fourth consecutive year, while in other
major markets it was largely unchanged. With the amount
of palladium recycled from scrapped jewellery falling
to 190,000 oz in 2012, net demand reached 255,000 oz,
compared with 295,000 oz in 2011.
In a sign of further retrenchment in the Chinese palladium
jewellery industry, gross demand declined by 65,000 oz in 2012
to 240,000 oz. Despite the relatively high margins that continue
to be available throughout the palladium jewellery supply
chain, anaemic consumer demand for the end-product has
led to a larger number of manufacturers and retailers deciding
to no longer work with or carry a stock of palladium jewellery.
Many of those who remain active are doing so only as an
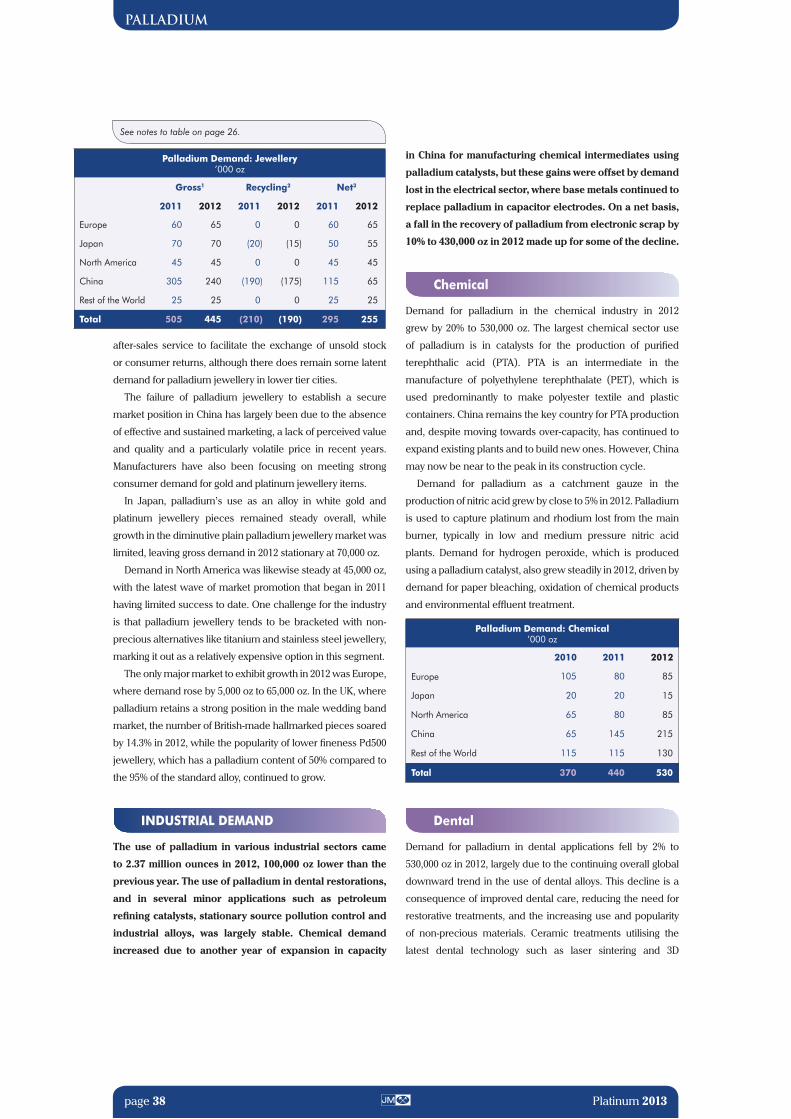
PALLADIUM
page 38 Platinum 2013
Palladium Demand: Jewellery’000 oz
Gross1 Recycling2 Net3
2011 2012 2011 2012 2011 2012
Europe 60 65 0 0 60 65
Japan 70 70 (20) (15) 50 55
North America 45 45 0 0 45 45
China 305 240 (190) (175) 115 65
Rest of the World 25 25 0 0 25 25
Total 505 445 (210) (190) 295 255
Palladium Demand: Chemical’000 oz
2010 2011 2012
Europe 105 80 85
Japan 20 20 15
North America 65 80 85
China 65 145 215
Rest of the World 115 115 130
Total 370 440 530
after-sales service to facilitate the exchange of unsold stock
or consumer returns, although there does remain some latent
demand for palladium jewellery in lower tier cities.
The failure of palladium jewellery to establish a secure
market position in China has largely been due to the absence
of effective and sustained marketing, a lack of perceived value
and quality and a particularly volatile price in recent years.
Manufacturers have also been focusing on meeting strong
consumer demand for gold and platinum jewellery items.
In Japan, palladium’s use as an alloy in white gold and
platinum jewellery pieces remained steady overall, while
growth in the diminutive plain palladium jewellery market was
limited, leaving gross demand in 2012 stationary at 70,000 oz.
Demand in North America was likewise steady at 45,000 oz,
with the latest wave of market promotion that began in 2011
having limited success to date. One challenge for the industry
is that palladium jewellery tends to be bracketed with non-
precious alternatives like titanium and stainless steel jewellery,
marking it out as a relatively expensive option in this segment.
The only major market to exhibit growth in 2012 was Europe,
where demand rose by 5,000 oz to 65,000 oz. In the UK, where
palladium retains a strong position in the male wedding band
market, the number of British-made hallmarked pieces soared
by 14.3% in 2012, while the popularity of lower fineness Pd500
jewellery, which has a palladium content of 50% compared to
the 95% of the standard alloy, continued to grow.
INDUSTRIAL DEMAND
The use of palladium in various industrial sectors came
to 2.37 million ounces in 2012, 100,000 oz lower than the
previous year. The use of palladium in dental restorations,
and in several minor applications such as petroleum
refining catalysts, stationary source pollution control and
industrial alloys, was largely stable. Chemical demand
increased due to another year of expansion in capacity
in China for manufacturing chemical intermediates using
palladium catalysts, but these gains were offset by demand
lost in the electrical sector, where base metals continued to
replace palladium in capacitor electrodes. On a net basis,
a fall in the recovery of palladium from electronic scrap by
10% to 430,000 oz in 2012 made up for some of the decline.
Chemical
Demand for palladium in the chemical industry in 2012
grew by 20% to 530,000 oz. The largest chemical sector use
of palladium is in catalysts for the production of purified
terephthalic acid (PTA). PTA is an intermediate in the
manufacture of polyethylene terephthalate (PET), which is
used predominantly to make polyester textile and plastic
containers. China remains the key country for PTA production
and, despite moving towards over-capacity, has continued to
expand existing plants and to build new ones. However, China
may now be near to the peak in its construction cycle.
Demand for palladium as a catchment gauze in the
production of nitric acid grew by close to 5% in 2012. Palladium
is used to capture platinum and rhodium lost from the main
burner, typically in low and medium pressure nitric acid
plants. Demand for hydrogen peroxide, which is produced
using a palladium catalyst, also grew steadily in 2012, driven by
demand for paper bleaching, oxidation of chemical products
and environmental effluent treatment.
Dental
Demand for palladium in dental applications fell by 2% to
530,000 oz in 2012, largely due to the continuing overall global
downward trend in the use of dental alloys. This decline is a
consequence of improved dental care, reducing the need for
restorative treatments, and the increasing use and popularity
of non-precious materials. Ceramic treatments utilising the
latest dental technology such as laser sintering and 3D
See notes to table on page 26.

PALLADIUM
Platinum 2013 page 39
Palladium Demand: Electrical’000 oz
Gross Recycling Net
2011 2012 2011 2012 2011 2012
Europe 190 185 (190) (160) 0 25
Japan 300 310 (55) (55) 245 255
North America 145 140 (85) (80) 60 60
China 270 185 (45) (40) 225 145
Rest of the World 470 380 (105) (95) 365 285
Total 1,375 1,200 (480) (430) 895 770
Palladium Demand: Dental’000 oz
2010 2011 2012
Europe 80 80 75
Japan 250 220 220
North America 250 225 220
China 0 0 0
Rest of the World 15 15 15
Total 595 540 530
printing techniques, or, alternatively, cheaper base metals, are
continuing to eat into the pgm share at opposite ends of the
dental alloy market spectrum. As a result, in 2012 demand for
palladium alloys fell slightly in two of the three largest markets,
North America and Europe, whilst demand in Japan was flat.
In Japan, demand for the state-subsidised Kinpala
palladium–gold alloy appears to have reached a plateau at
the same time that recovery of scrap material has increased,
resulting in broadly stable use last year. In North America, up
until 2008 the market share of palladium dental alloys was
increasing due to the rising cost of gold alloys. However, since
that time demand for palladium has been in steady decline
despite gold prices continuing to be significantly higher than
palladium prices. As in Japan and Europe, both gold and
palladium alloys are facing competition from base metals and
ceramics. Most of the switch from gold to palladium has already
occurred, and to further reduce costs, dental laboratories are
changing to alloys with lower or no palladium content.
Electrical
The electrical sector experienced a tough year in 2012, with
many electronic component markets posting a decline in
sales and production on the previous year. The evidence
for this comes from data on production of silicon for
making semiconductors, which are used in most electronic
applications. Silicon output grew only marginally last year.
Palladium demand for electronic plating and components
declined by 13% to 1.20 million ounces in 2012. For several
years multi-layer ceramic capacitors (MLCCs), which are one
of the fundamental passive components of electronic circuitry,
have accounted for the largest use of palladium in the sector.
The number of MLCCs produced increases annually,
driven by the ever-growing complexity of electronic devices
such as smart phones, tablets and automotive electronics.
However, this growth is no longer able to offset the effects of
substitution of palladium in MLCC electrodes by nickel and
copper, as well as thrifting of palladium in remaining products,
which are powerful trends affecting palladium demand at
present. Smaller chip capacitors require electronic pastes with
reduced particle size and thus greater surface area, with
the result that consistent performance and reliability can
be obtained using less metal. Due to improvements in
base metals technology, palladium-containing MLCCs have
become increasingly confined to niche areas like military and
aerospace applications, in which the high reliability of precious
metals is of paramount concern.
Palladium demand for electronic plating, on the other
hand, remained robust in 2012, with the metal continuing to
benefit from its substantial discount to gold, which palladium
can replace as a material for connectors and circuit boards.
Palladium plating in the lead-frame market profited from the
international move away from lead (Pb) solder. Manufacturers
used Pb solder for a long time and trusted its reliability and
alternatives are difficult to find. Pre-plating with palladium
allows the lead-frames to maintain reliability at the high
temperature required for Pb-free plating and soldering.
Palladium capacitors are increasingly being confined to military and aerospace applications.

OthersZKB
ETFS – USAETFS – London
2,500
2,000
1,500
1,000
500
0
Palladium ETF Investment 2008-2012
2008 2009 2010 2011 2012
‘000 oz2,500
2,000
1,500
750
650
550
‘000 oz $/ozPd ETF Holdings Price
Jan Feb Mar Apr May Jun Jul Aug Sep Oct Nov Dec
Aggregate ETF Investment in 2012
PALLADIUM
page 40 Platinum 2013
INVESTMENT
Net physical investment demand for palladium reached
a positive 470,000 oz in 2012, compared to liquidation
of 565,000 oz in 2011. This was due primarily to a return
to net investment in the ETF market following heavy
profit-taking the previous year, as well as new demand
from the Sprott Physical Platinum and Palladium Trust.
Net demand from ETF investors amounted to 285,000 oz
in 2012, effectively recovering just over half of the 530,000 oz
liquidated the previous year. A return to investment growth in
the two largest funds, based in London and New York, as well
as a more moderate swing in the London-based Deutsche
Bank ETF, were responsible for the positive demand. Net
investment in the ETF Securities London fund marked the first
annual increase in holdings in the fund since 2009.
ETF investment at the beginning of 2012 started strongly.
Net investment of over 200,000 oz in the first two months,
140,000 oz of which occurred in February alone, traced a
strong price recovery. Growth in net holdings extended for
a further three months, albeit at a somewhat more modest
pace, despite a retracement in the price to below $600.
Over the first five months net investment amounted to an
impressive 350,000 oz.
Further net investment in early June took total holdings up
to the 2012 high of 2.10 million ounces, but later in June and
throughout July net disinvestment accompanied a plunge in
the price to a low of $564. The violence that accompanied the
illegal strikes in South Africa in August sharply boosted the
palladium price but the response from investors was muted. A
relatively modest 15,000 oz was added to the palladium ETFs,
just 15% of the volume added to platinum holdings during
the same month.
Investors were still inactive in early September, remaining
on the sidelines despite the price of palladium continuing to
increase strongly. A correction during the second half of the
month resulted in net liquidation of more than 45,000 oz.
It was not until the price sustained a recovery to above
$675 at the end of November 2012 that any significant appetite
for investment returned. In December investors added
35,000 oz to holdings, the largest increment since May, for
total fund holdings by the end of the year to stand at just
over two million ounces.
The new Sprott Physical Platinum and Palladium Trust used
the $280 million raised in the process of the initial offering to
purchase equal dollar amounts of platinum and palladium.
The trust acquired just over 185,000 oz of palladium in 2012,
more than double the amount of platinum held in the product.
As there was no primary production of palladium coins in
2012, selling by investors in the secondary market led to metal
being returned to fabricators, resulting in marginally negative
palladium coin demand.
Palladium Demand: Investment’000 oz
2010 2011 2012
Europe (5) (35) (165)
Japan 10 5 0
North America 1,090 (535) 305
China 0 0 0
Rest of the World 0 0 0
Total 1,095 (565) 470

OTHER PLATINUM GROUP METALS
Platinum 2013 page 41
Rhodium Demand by Application’000 oz
2010 2011 2012
Autocatalyst 727 715 782
Chemical 67 72 81
Electrical 4 6 6
Glass 68 77 31
Other 21 38 66
Total Gross Demand 887 908 966
Autocatalyst Recycling (241) (277) (259)
Total Net Demand 646 631 707
OTHER PLATINUM GROUP METALS
RHODIUM
The market for rhodium was very close to balance in 2012
after the large surplus of the previous year. Supplies from
South Africa were significantly reduced due to loss of
production through mining strikes and other stoppages;
however, some extra shipments were made from
Russia in the form of metal recovered from stored mine
concentrates at Norilsk. Industrial demand for rhodium
was mixed, with growth in purchasing by the chemical
industry outweighed by a fall in demand from the glass
sector after two very strong years. Autocatalyst demand
was boosted by a recovery in vehicle production in Japan
from the disruption caused by the 2011 tsunami, plus a
buoyant market for cars in North America. In total, gross
demand for rhodium rose to 966,000 oz.
Autocatalyst Demand
Demand for rhodium by the automotive industry worldwide
rose by 9% in 2012 to 782,000 oz, the highest for five years, with
almost all the growth coming from Japan and North America.
A 22% increase in light duty gasoline vehicle output in Japan
reflected the industry returning to normal after production
was seriously interrupted by the 2011 earthquake and tsunami.
Japanese auto manufacturers are the heaviest users of
rhodium in the autocatalyst sector, and in 2012 a quarter of all
rhodium in light duty gasoline vehicles worldwide was used
in cars and light trucks produced in Japan.
Japanese automotive factories outside Japan are also
relatively high consumers of rhodium. In North America,
there was an increase in light duty vehicle output of nearly
19% in response to vibrant demand for cars and trucks from
consumers and industrial companies. This led to higher
purchases of rhodium for autocatalysts, especially by Japanese
auto companies operating in the USA as their share of light
vehicle production increased in 2012.
Other Demand
Purchasing of rhodium by the chemical industry remained
robust in 2012, with an increase of 13% to 81,000 oz. Demand
for rhodium catalysts for the production of acetic acid and
oxo-alcohols is being driven by growth in Asian manufacturing
capacity. Acetic acid is used to make vinyl acetate monomer,
purified terephthalic acid and ethyl acetate. Demand for these
chemicals is increasing from downstream paint, solvent and
polymer industries. Growth in oxo-alcohol capacity in China is
being stimulated by the automotive and construction sectors,
which use oxo-alcohols as plasticisers.
Demand for rhodium for platinum–rhodium alloys in the
glass industry fell from 77,000 oz in 2011 to 31,000 oz in 2012 as
excess capacity for LCD glass production resulted in a delay in
new capacity additions by flat glass manufacturers. In addition,
glassmakers have been focusing on increasing output from
glass melting tanks already installed. Despite the global over-
capacity, new tanks were added in China to meet the goal of
domestic panel manufacturers to acquire glass from domestic
sources. However, of the seven new tanks installed in China
in 2012, three were funded with rhodium purchased in 2011.
Excess capacity in the glass fibre manufacturing sector
resulted in at least one large project being delayed until
2013. In addition, rhodium coming back from the closure of
z Gross demand for rhodium grew by 6% to 966,000 oz in
2012, largely the result of strong demand for rhodium
in autocatalysts, especially in North America and Japan.
z Primary supplies of rhodium declined by 43,000 oz
to 722,000 oz. Weaker South African production was
partly offset by a rise in output from Russia. Recovery of
rhodium from autocatalyst scrap fell to 259,000 oz.
z Ruthenium demand in 2012 fell by 32% to 679,000 oz
due to sharply reduced buying of ruthenium for the
production of hard disks and for use in chemical catalysts.
z Adequate stocks of iridium crucibles for growing single
crystal sapphire meant a sharp drop in buying from the
electrical industry, causing global iridium demand to fall
by 46% to 178,000 oz in 2012.

page 42 Platinum 2013
OTHER PLATINUM GROUP METALS
Ruthenium Demand by Application’000 oz
2010 2011 2012
Chemical 100 273 101
Electrical 679 536 377
Electrochemical 124 130 127
Other 42 58 74
Total Demand 945 997 679
Iridium Demand by Application’000 oz
2010 2011 2012
Chemical 18 19 19
Electrical 201 195 42
Electrochemical 79 76 70
Other 40 42 47
Total Demand 338 332 178
less-efficient glass fibre manufacturing plants and old CRT
plants in China dampened demand in the glass industry.
Other demand for rhodium grew by 74% in 2012 to 66,000 oz.
Most of the increase was due to investment in the Deutsche
Bank rhodium ETF, launched in 2011. Steady incremental
buying resulted in the fund’s holdings growing by 36,400 oz
in 2012. Minting of rhodium bars in Europe added a further
6,000 oz to rhodium investment demand.
Supplies
In 2012, shipments of rhodium by primary producers fell by
5.6% to 722,000 oz, reflecting lower output from South Africa.
However, the decline in rhodium supplies was significantly
smaller than that in platinum and palladium shipments.
South African sales were supported by releases from the
refining pipeline, especially at Lonmin, which shipped more
rhodium in 2012 than it had the previous year. We also allow
for an increase in supplies from Russia, where we believe the
treatment of large quantities of stored pyrrhotite concentrate
has added to rhodium output at Norilsk Nickel.
RUTHENIUM & IRIDIUM
Demand for the minor pgm has been volatile in recent
years and 2012 was no exception. Ruthenium demand fell
by nearly a third and iridium demand by almost a half
after two years of strong demand for both metals.
Demand
Ruthenium demand in the chemical sector returned to a
more normal level of 101,000 oz in 2012, a sharp decrease of
172,000 oz year-on-year. There had been an exceptional
amount of purchasing in 2011, when replacement and
back-up charges of ruthenium catalyst were bought for
several plants producing ammonia from natural gas.
Demand for ruthenium for sputtering targets, used in
the coating of computer hard disks, fell by just over 9% to
137,000 oz in 2012. Lower consumer sales, combined with
a technology shift towards tablets and smart phones rather
than the more traditional PC and laptop computers, negatively
affected hard disk media manufacturing. A reduction of
inventories and the increasing ability of hard disk media
producers to get more product out of each ruthenium target
compounded the effect of poor hard drive sales.
The use of ruthenium as the resistive element in thick-film
hybrid integrated circuits and chip products fell by 5,000 oz
last year, with growth in the number of chips produced
being countered by progressive downsizing of components.
Purchases of iridium by the electronics industry fell in 2012 by
153,000 oz to a total of 42,000 oz, signalling an abrupt end to the
expansion in the use of iridium crucibles to manufacture single
crystal sapphire. As demand in this application stabilised, the
majority of metal bought in 2012 was to replace losses from
existing operations rather than for new crucible installations.
Ruthenium and iridium are used in the electrolysis of
sodium chloride solution (brine) to chlorine and sodium
hydroxide. China is coming towards the end of a massive
project to expand and upgrade its chloralkali industry, moving
from the older mercury and diaphragm technologies to more
efficient, environmentally acceptable membrane cells.
Overall, electrochemical demand for ruthenium fell by 2%,
with growth in North America and the Rest of the World region
going some way to offset a 28% drop in China. Iridium demand
in the electrochemical sector was similarly hurt by reduced
Chinese demand, decreasing by 8% in 2012.
Supplies
Mine production of ruthenium and iridium fell in 2012 in line
with lower platinum output at strike-hit South African mines.
However, with industrial purchasing down on the previous
year, there was no shortage of primary metal. We believe
that some additions were made to above-ground stockpiles,
indicating that both metals were in fundamental surplus.
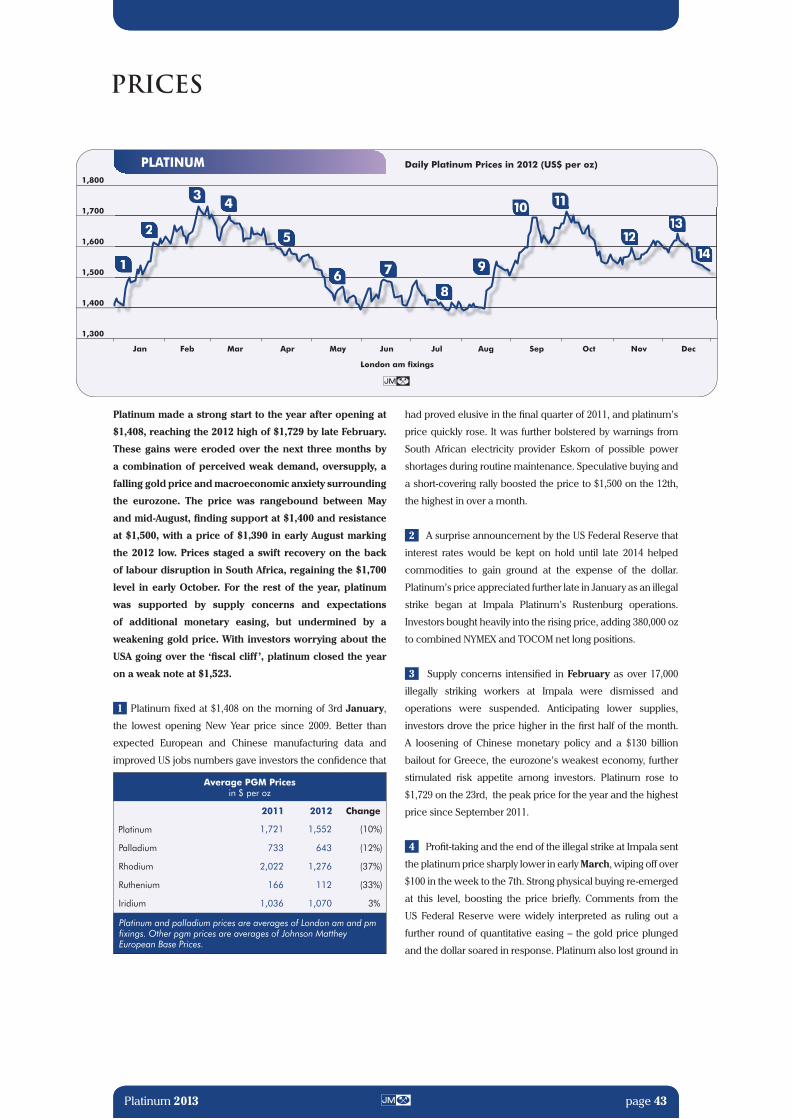
Jan Feb Mar Apr May Jun Jul Aug Sep Oct Nov Dec
Daily Palladium Prices in 2012 (US$ per oz)
London am fixings
800
750
700
650
600
550
500
Jan Feb Mar Apr May Jun Jul Aug Sep Oct Nov Dec
Daily Platinum Prices in 2012 (US$ per oz)
London am fixings
1,800
1,700
1,600
1,500
1,400
1,300
1
2
2
3
3
4
5 67
8 9
10
10
11 12
13
1
4
5
6 7
8
9
11
1213
14
1
4
5 67
8 9
1011 12
13
2
10
1
4
5
6 7
8
9
1213
11114
Platinum 2013 page 43Platinum 2013 page 43
Average PGM Pricesin $ per oz
2011 2012 Change
Platinum 1,721 1,552 (10%)
Palladium 733 643 (12%)
Rhodium 2,022 1,276 (37%)
Ruthenium 166 112 (33%)
Iridium 1,036 1,070 3%
Platinum and palladium prices are averages of London am and pm fixings. Other pgm prices are averages of Johnson Matthey European Base Prices.
PRICES
Platinum made a strong start to the year after opening at
$1,408, reaching the 2012 high of $1,729 by late February.
These gains were eroded over the next three months by
a combination of perceived weak demand, oversupply, a
falling gold price and macroeconomic anxiety surrounding
the eurozone. The price was rangebound between May
and mid-August, finding support at $1,400 and resistance
at $1,500, with a price of $1,390 in early August marking
the 2012 low. Prices staged a swift recovery on the back
of labour disruption in South Africa, regaining the $1,700
level in early October. For the rest of the year, platinum
was supported by supply concerns and expectations
of additional monetary easing, but undermined by a
weakening gold price. With investors worrying about the
USA going over the ‘fiscal cliff ’, platinum closed the year
on a weak note at $1,523.
1 Platinum fixed at $1,408 on the morning of 3rd January,
the lowest opening New Year price since 2009. Better than
expected European and Chinese manufacturing data and
improved US jobs numbers gave investors the confidence that
had proved elusive in the final quarter of 2011, and platinum’s
price quickly rose. It was further bolstered by warnings from
South African electricity provider Eskom of possible power
shortages during routine maintenance. Speculative buying and
a short-covering rally boosted the price to $1,500 on the 12th,
the highest in over a month.
2 A surprise announcement by the US Federal Reserve that
interest rates would be kept on hold until late 2014 helped
commodities to gain ground at the expense of the dollar.
Platinum’s price appreciated further late in January as an illegal
strike began at Impala Platinum’s Rustenburg operations.
Investors bought heavily into the rising price, adding 380,000 oz
to combined NYMEX and TOCOM net long positions.
3 Supply concerns intensified in February as over 17,000
illegally striking workers at Impala were dismissed and
operations were suspended. Anticipating lower supplies,
investors drove the price higher in the first half of the month.
A loosening of Chinese monetary policy and a $130 billion
bailout for Greece, the eurozone’s weakest economy, further
stimulated risk appetite among investors. Platinum rose to
$1,729 on the 23rd, the peak price for the year and the highest
price since September 2011.
4 Profit-taking and the end of the illegal strike at Impala sent
the platinum price sharply lower in early March, wiping off over
$100 in the week to the 7th. Strong physical buying re-emerged
at this level, boosting the price briefly. Comments from the
US Federal Reserve were widely interpreted as ruling out a
further round of quantitative easing – the gold price plunged
and the dollar soared in response. Platinum also lost ground in
PLATINUM

Platinum Net Long Weekly Speculative Positions on NYMEX and TOCOM in 2012
NYMEX TOCOM3,000
2,500
2,000
1,500
1,000
500
0
‘000 oz
Jan Feb Mar Apr May Jun Jul Aug Sep Oct Nov Dec
Platinum:Gold Price Ratio in 2012
1.05
1.00
0.95
0.90
0.85
0.80
Jan Feb Mar Apr May Jun Jul Aug Sep Oct Nov Dec
PRICES
page 44 Platinum 2013
mid-March but at a slower rate than gold, allowing the white
metal to briefly recapture a price premium over gold.
5 Fresh concerns regarding the financial stability of
the eurozone put pressure on risk assets in April as Spain
missed targets to reduce its budget deficit. New passenger
car registrations in the EU were reported to have fallen by 8%
year-on-year in the first quarter of 2012, adding further to the
gloom. Platinum slid below $1,600 on 11th April and continued
its downward trajectory for the remainder of the month.
Combined net long positioning also fell, shedding over a third
of a million ounces during April.
6 In May, reports of unemployment in the eurozone at record
highs of almost 11% were sufficient to weaken the euro and
trigger heavy falls in the precious metal complex. Platinum fell
beneath $1,500 for the first time since January on 9th May amid
the general gloom. London Platinum Week saw a distinctly
sombre mood prevail as South African producers weighed up
the prospects of high costs and inadequate revenues against a
backdrop of lower supplies and tapering demand. Liquidation
in the ETF market saw cumulative platinum holdings trimmed
to just under 1.5 million ounces by late May, leaving year-to-
date net investment at around 37,000 oz. Combined net long
futures positions, having declined in April and May, dropped
below a million ounces for the first time since August 2009.
7 Prevailing weak platinum prices and rising costs for
producers finally began to prompt action on the supply
side in June. Aquarius put its Marikana mine on care and
maintenance, while Eastern Platinum said it was suspending
the development of its eastern limb assets pending better
prices. These announcements appeared to be welcomed by
the market and the price jumped to $1,485 on the 14th.
8 Platinum was at the mercy of macroeconomic factors
for much of July. Prices drifted downwards amid a risk-off
backdrop as the full extent of bad loans in the Spanish banking
sector became clear, adding further pressure to the ailing
eurozone economy. Slack industrial demand and nervous
anticipation of further downside led the price to reach a low
for the year of $1,390 on the afternoon of 3rd August, wiping out
all of the gains in the year to date. With platinum cowed, the
spread with gold widened to 0.86:1, a ratio not seen since 1985.
9 There were echoes of the earlier strike at Impala as an
illegal walkout began at Lonmin’s Marikana mine on 10th
August. The dispute spilled over into violence between rival
union factions, causing Lonmin to halt production at the mine.
In unprecedented and shocking scenes, 34 striking miners
were shot dead by the South African Police Service on the 16th.
This tragic loss of life had an immediate effect on the platinum
price as investors feared a prolonged disruption to operations
and a spread of the conflict to other mines. Gaining over $150 in
the space of a few days, platinum reached $1,549 on the 23rd.
Futures markets rallied, with net long positioning increasing by
over 600,000 oz in the last two weeks of August.
10 Platinum prices were underpinned by a volatile and
highly fluid situation in the South African pgm mining industry
during September, while also benefitting from a risk rally that
followed the US Federal Reserve’s announcement of a third

PRICES
Platinum 2013 page 45
Platinum Prices in 2012London am and pm fixings, $ per oz
High Low Average
January 1,626.00 1,403.00 1,506.83
February 1,729.00 1,609.00 1,658.07
March 1,704.00 1,607.00 1,656.66
April 1,659.00 1,550.00 1,587.21
May 1,566.00 1,405.00 1,468.73
June 1,493.00 1,396.00 1,447.13
July 1,487.00 1,391.00 1,426.41
August 1,549.00 1,390.00 1,450.14
September 1,697.00 1,543.00 1,620.78
October 1,714.00 1,539.00 1,636.00
November 1,620.00 1,541.00 1,576.52
December 1,640.00 1,523.00 1,588.86
Annual 1,729.00 1,390.00 1,551.73
Palladium Prices in 2012London am and pm fixings, $ per oz
High Low Average
January 698.00 616.00 658.94
February 722.00 679.00 702.67
March 713.00 648.00 684.89
April 682.00 635.00 656.21
May 681.00 590.00 617.33
June 634.00 568.00 612.72
July 601.00 564.00 579.34
August 645.00 573.00 600.14
September 702.00 624.00 657.53
October 668.00 593.00 633.55
November 688.00 598.00 635.64
December 706.00 675.00 691.19
Annual 722.00 564.00 643.22
Rhodium Prices in 2012Johnson Matthey Base Prices, $ per oz
High Low Average
January 1,450.00 1,350.00 1,385.71
February 1,550.00 1,475.00 1,514.29
March 1,525.00 1,400.00 1,487.50
April 1,400.00 1,375.00 1,384.47
May 1,385.00 1,260.00 1,348.48
June 1,250.00 1,250.00 1,250.00
July 1,250.00 1,165.00 1,227.95
August 1,165.00 1,100.00 1,125.65
September 1,400.00 1,100.00 1,175.00
October 1,225.00 1,100.00 1,185.87
November 1,150.00 1,100.00 1,134.09
December 1,125.00 1,080.00 1,094.47
Annual 1,550.00 1,080.00 1,275.86
round of quantitative easing (QE3). As the strike continued at
Lonmin, Anglo American Platinum suspended its Rustenburg
operations in order to protect the workforce from intimidation.
Driven by speculative investment rather than any physical
shortages, platinum rose to a six-month high of $1,697 on
the 14th and net long platinum futures positions escalated to
2.5 million ounces by late September. Wage agreements at
Lonmin and Impala and the re-opening of Anglo’s’ operations saw
prices soften somewhat, although further disruption continued to
be anticipated by investors.
11 When Anglo initiated disciplinary action against 12,000
striking workers at its Rustenburg operations, the market
reacted by bidding platinum up to $1,714 on 5th October.
With supply concerns by now fairly well discounted, the price
strength was undermined by a progressively weak demand
picture. In the European auto market Volkswagen reported a
drop in profit and Ford announced the closure of three of its
European vehicle plants in response to a deepening slump in
vehicle sales. In addition, better-than-expected US economic
data strengthened the dollar, weakening the precious metals.
ETF investors sold into the falling price, liquidating 25,000 oz
of platinum during the month, while futures market investors,
after setting a new record-high of just under 2.9 million ounces
net long postions, also became net sellers.
12 Platinum began November by weakening in line with gold
in response to a positive non-farm payrolls report in the USA
and a subsequently stronger dollar, although ongoing supply
challenges in South Africa provided support at around $1,540.
Mining concerns continued to provide positive motivation for
investors, but this was tempered by weak end-user demand.
Platinum edged up to $1,594 by the 14th in response to the
re-election of US President Obama, more in favour of monetary
easing than his Republican opponent, Mitt Romney. This was
followed by a price correction when Anglo announced it had
reached agreement with striking workers, bringing to an end
the two-month hiatus at the world’s largest producer, and
by the 16th platinum had fallen to $1,554. In the same week,
Johnson Matthey forecast that the platinum market in 2012
would be in deficit by the largest amount in a decade and this
supported a steady rise in the price to $1,617 at the month-end.
13 Another release of better than expected US employment
data in early December boosted the dollar, pressuring
platinum into a retreat to $1,580 by the 6th. News of additional
asset purchases by the Federal Reserve, a new bank bailout
package for Spain and a debt management plan for Greece,
then combined to weaken the dollar and strengthen the euro,
boosting platinum to a month high of $1,640 on the 12th.
14 Despite bullish signals, including higher than expected
US third quarter growth, and sub-optimal production in South
Africa, the platinum price began to decline. Concerns over
the impending US ‘fiscal cliff ’ that, by automatically invoking
spending cuts and tax increases, threatened to tip the USA into
recession, were dominant in investors’ minds and contributed
to year-end profit-taking and a closing platinum price of $1,523.

Jan Feb Mar Apr May Jun Jul Aug Sep Oct Nov Dec
Daily Palladium Prices in 2012 (US$ per oz)
London am fixings
800
750
700
650
600
550
500
Jan Feb Mar Apr May Jun Jul Aug Sep Oct Nov Dec
Daily Platinum Prices in 2012 (US$ per oz)
London am fixings
1,800
1,700
1,600
1,500
1,400
1,300
1
2
2
3
3
4
5 67
8 9
10
10
11 12
13
1
4
5
6 7
8
9
11
1213
14
1
4
5 67
8 9
1011 12
13
2
10
1
4
5
6 7
8
9
1213
11114
PRICES
page 46 Platinum 2013
The palladium price opened the year at $655 in London
and echoed the early price strength of platinum, reaching
a high for the year of $722 in February before positive
market sentiment gave way to risk aversion and concerns
about industrial demand. The price was briefly lifted by
disruption to South African mining during August and into
September, although this had a naturally greater impact
on the platinum price, causing the price ratio between the
two metals to widen to 2.62:1 in October 2012. This trend
was reversed in the final two months of 2012, during which
palladium posted gains of 15% compared to a loss of 3%
in platinum, narrowing the ratio to 2.18:1 by the year end.
The divergence was driven by palladium’s more favourable
fundamentals – good growth in demand for palladium
in 2012, allied with disruption to primary supply from
South Africa and declining output from Russia. As a result
palladium closed the year on an upward trend at $699.
1 Palladium opened the year at $655, slightly up on the end
of 2011 as the gloom that had enveloped the pgm markets in
the final quarter began to lift. An estimated 10% rise in US new
car and light truck sales in 2011, the fastest since the 1980s,
helped give some upward momentum to the palladium price,
although it quickly retreated to $616 on 9th January.
2 Electricity supply concerns in South Africa, together with
firm physical demand, helped put the palladium price on a rising
trend for much of January and into early February. Comments
from the CEO of Norilsk Nickel, the world’s biggest palladium
miner, confirmed that its pgm production would be flat or lower
in 2012. Together with another rise in US car sales in January,
this helped palladium to regain the $700 level for the first time
in five months on 3rd February. Combined net long speculative
positions increased by over 740,000 oz to 1.2 million ounces in
the four weeks to 7th February, while ETF investment for the
year to date rose to over 100,000 oz, reflecting a return of investor
appetite for palladium.
3 The price dipped sharply in mid-February as investors
reduced their exposure to industrial commodities in the
wake of a credit rating downgrade for six European countries,
including Italy, Spain and Portugal. Palladium proved relatively
resilient, however, due to tightness in the availability of the
metal in sponge form, and the price quickly recovered to
reach $721 on 23rd February. This was to mark the high point
for the calendar year. Palladium was supported by lingering
supply concerns, a weaker dollar and stronger platinum and
gold prices.
4 With palladium looking overbought, investors liquidated
positions, bringing the price down. A fall in platinum as the
Impala strike came to an end also affected palladium, which
briefly reached $675 on 7th March. This was despite positive
news from the auto sector, in particular an 11% year-on-year
rise in US auto sales for February which beat analysts’
expectations, and rising sales in Japan aided by government
subsidies. Unusually, as the palladium price was falling in
March, ETF holdings continued to grow, suggesting investors
still had confidence in the underlying market fundamentals.
5 Thin trading conditions in Europe around the Easter holiday
meant that the palladium price behaved rather erratically,
before settling on an upward trend. In contrast to platinum,
which lost value in April, the palladium price was lifted by
PALLADIUM

Platinum:Palladium Price Ratio in 2012
2.7
2.6
2.5
2.4
2.3
2.2
2.1
Jan Feb Mar Apr May Jun Jul Aug Sep Oct Nov Dec
Palladium Net Long Weekly Speculative Positions on NYMEX in 2012
2,000
1,600
1,200
800
400
0
‘000 oz
Jan Feb Mar Apr May Jun Jul Aug Sep Oct Nov Dec
PRICES
Platinum 2013 page 47
news of a return to growth in the Chinese car market as well
as generally positive investor sentiment, reflecting strong
physical demand. Net long futures positions grew in line
with price rises, adding 100,000 oz in the week to 24th April
while ETF holdings were steady, unlike those of platinum,
which declined.
6 Palladium saw its year-to-date gains wiped out in a sharp
downward price correction in the first two weeks of May.
Palladium’s peak-to-trough decline was more severe than that
for platinum, losing 13% of its value between 30th April and
14th May, in contrast to a 9% fall for platinum between 30th
April and 16th May. The trigger for the fall in both metals was
investor concerns over eurozone debt levels as well as dimmer
prospects for growth in China and the USA. Risk aversion and
a falling price triggered a steep sell-off in palladium futures,
with combined net long positions shedding over half a million
ounces in the first three weeks of May to leave palladium long
futures positions at an historic low level of just under 250,000 oz.
Illustrating the divergent behaviour of the futures and physical
investment markets, investors in ETFs continued to add to
positions as the price fell during May.
7 Johnson Matthey’s ‘Platinum 2012’ publication, launched
on 14th May, forecast a market deficit for palladium in 2012,
due in part to lower Russian state stock sales and healthy
autocatalyst demand. With the fundamentals in the palladium
market remaining strong, the price clambered higher in the
second half of May and into June. Palladium gained some
support from a rising platinum price in early June, itself
boosted by reports of mine closures in South Africa. Rising to
$636 on 15th June, palladium once again came under pressure
alongside the other precious metals as the US Federal Reserve
slashed its growth forecasts and embarked on an extension of
‘Operation Twist’, designed to boost bank lending.
8 The price recovered in late June and into early July,
as investors regained confidence in palladium following a
loosening of monetary policy in China and the eurozone.
Reports of improved domestic sales for US automakers and
better sales in China also helped. Palladium was becalmed
in mid-July before a sell-off in gold and platinum caused
palladium to lose ground, dipping to a low for the year of
$564 on July 24th. Total physical investment in palladium
ETFs continued to hold up relatively steadily at just over
two million ounces in July, despite some light selling, perhaps
reflecting some positions being out of the money at prevailing
prices and also that some investors were seeing long-term
upside for palladium.
9 After a somewhat quiet start to August, prices moved up
rapidly in response to renewed supply concerns as a labour
dispute at Lonmin developed into a violent confrontation
between rival union factions. Between 14th and 24th August,
the palladium price increased by 12%. News of a strike at Royal
Bafokeng Platinum and fears of contagion further unsettled
the market.
10 Early in September palladium made further gains as
a double-digit rise in August US auto sales helped investor
sentiment towards the metal. Palladium rose along with
platinum as the South African supply situation deteriorated.

PRICES
page 48 Platinum 2013
With operations shuttered at Lonmin due to inter-union
violence and intimidation, Anglo Platinum’s Rustenburg mines
suspended and workers at Impala agitating for another wage
increase, investors moved in. Following announcements of
monetary stimulus in the eurozone, Japan and the USA, the
price soared as part of a broad-based risk rally, rising to $702
on the 14th, the highest level since March. It subsequently
dropped back under pressure from speculative liquidation and
technical selling late in the month.
11 Positive news from the North American automotive
market helped the palladium price to regain some upward
momentum in early October, with the price reaching a month
high of $668 on the 5th. Offsetting negative news from the
European and Japanese auto markets, cheap credit in the
USA supported growth in new light vehicle sales of 9.5% in
September, the highest rate of expansion since the ‘cash for
clunkers’ programme in 2009. As with platinum, there was a
correction but it was relatively limited, palladium ending the
month at $606.
12 Although the palladium price moved in tandem with
that of platinum on all but one of the 22 trading days in
November, palladium’s upward price movements were
relatively more pronounced, ensuring that over the month as
a whole palladium posted a gain of 13% compared to 3% for
platinum. The palladium price was boosted early in the month
by an announcement from Norilsk Nickel, the world’s largest
palladium miner, that its third quarter output was 4% lower
than in the previous three months. Palladium rose to $643 by
the 14th and although the price dipped over the next couple of
days on news that striking workers at Anglo Platinum were to
resume mining, the anticipation of a market close to one million
ounces in deficit in 2012, as forecast in Johnson Matthey’s
Interim Review, gave palladium a boost for the second half of
the month. During the last two weeks in November the price
rose by more than 10% (compared to 2% for platinum) to reach
$688 by the 30th, further supported by an increase of nearly half
a million ounces in net long futures positions.
13 December marked only the second month of 2012 in
which the direction of the palladium and platinum prices
diverged, with palladium posting a 2% gain compared to a 6%
fall in platinum. Price action during the month was nonetheless
rather choppy, but ultimately the strong fundamental outlook
for palladium stimulated a positive reaction from investors.
ETF investors added 36,000 oz to holdings, while NYMEX
speculators added close to half a million more ounces to
net long positions. Dollar depreciation towards the end of
the month helped palladium to finish the year strongly, rising
from a month low of $675 on the 21st to $706 on the 28th. This
narrowed the Pt:Pd price spread to just 2.18:1, close to where
it had begun the year, and significantly lower than its 2012 peak
of 2.62:1 in October. A palladium price of $699 brought 2012 to
a close, marking a 7% gain over the year.
OTHER PGM
Beginning the year at the lowest level since 2009, the
rhodium price gained some momentum in the initial
two months of the year before succumbing to the
prevailing weak market sentiment that also dragged down
platinum and palladium. There was a brief price spike in
mid-September, when the price jumped by $300, and a short
period of strength in October, when the price climbed by
$125. Apart from these episodes, rhodium was seemingly
at the mercy of negative news while experiencing little of
the periodic upside seen in the platinum and palladium
markets. Overall, rhodium traded on average at $1,276,
37% lower than in 2011.
Rhodium came under light selling pressure early in the New
Year, resulting in the price falling from an opening Johnson
Matthey Base Price of $1,400 on 3rd January to $1,350 on the
10th – the lowest price for 32 months. At this level, it attracted
steady buying interest from Europe and Asia. This, together
with supply side pressure coming from the prolonged strike
taking place at Impala, helped rhodium to make gains,
reaching a high for the year of $1,550 on 14th February. At
this point, Asian investors held back and light selling in Europe
saw the rhodium price soften to $1,525, where it remained
until 15th March.
A year on from the earthquake and tsunami disaster in
Japan, recovery in automotive production by Japanese
manufacturers, the biggest users of rhodium in emissions
control catalysts, failed to have much impact on the rhodium
price, which continued to shed value under the pressure of
selling in the market. Wiping out its gains for the year to date,
the rhodium price declined to $1,375 by mid-April before
appreciating by $10 in steady two-way trade.
Rhodium was not immune to the negative market
conditions in May. With weak prospects for economic
growth in the eurozone, the USA and China dominating the
news wires, rhodium succumbed to selling pressure and
dropped by 10% between 9th May and 1st June to reach $1,250.

3,000
2,500
2,000
1,500
1,000
250
200
150
100
50
1,200
1,000
800
600
400
2010 2011 2012
2010 2011 2012
Rhodium Monthly Prices 2010-2012 (US$ per oz)
High Low Average
High Low Average
High Low Average
Ruthenium Monthly Prices 2010-2012 (US$ per oz)
Johnson Matthey Base Prices
Johnson Matthey Base Prices
Johnson Matthey Base Prices
2010 2011 2012
Iridium Monthly Prices 2010-2012 (US$ per oz)
PRICES
Platinum 2013 page 49
Rhodium remained unchanged at this level until 10th July
with quiet trading. The price then softened for the remainder
of the month as the weight of European selling overwhelmed
Asian buying.
Subdued trading flows in August saw the price come under
further pressure, reaching a new low for the nine-month
period of $1,100. Prices showed almost no reaction initially to
the disruptions at Lonmin’s mines in South Africa, rhodium
gaining merely $20 on Asian buying interest, before softening
once again to $1,100.
After remaining becalmed for the first half of September,
speculators and industrial buyers moved to cover their
rhodium requirements in the light of the disruption to South
African pgm supplies. In the space of three days, the price
gained $300, briefly spiking at a five-month high of $1,400
on the 18th. At this level, investors liquidated speculative
holdings and the price dropped almost as quickly as it had
risen, coming to rest at $1,100 once again.
Rhodium gained $125 in early October, reaching a month
high of $1,225 before selling by investors led to a $100
retreat by month-end.
Price action during November and December was
particularly subdued, despite Johnson Matthey’s forecast of a
market in deficit. By the end of 2012 the price had fixed at a
new low of $1,080 for the year, signalling a 23% decline since
the start of 2012.
The price of ruthenium was on a declining trend in 2012,
with the average at $112, down from $166 in 2011.
Ruthenium made gains in January and February on the
back of industrial purchasing, increasing by 18% to $130. The
price weakened in March and early April amid a surfeit of
sellers in the market to reach $115, where it remained until
mid-August. Immune from the wider price movements in the
other precious metals markets, ruthenium then softened to
$110, where it remained until a further decline to $90 occurred
in November, marking the final price action of the year as well
as a three-year low.
Price movements in iridium were infrequent in 2012, the
price averaging $1,070 compared to $1,036 in 2011.
There was very limited activity in iridium between January
and July, with the price having remained at $1,085 since
September 2011. The market finally succumbed to some
selling pressure and a lack of buyers on 10th July to reach a
new Johnson Matthey Base Price of $1,070. Iridium fell by a
further $20 in August amid light selling and subdued buying,
ending September at $1,050, where it remained for the
rest of the year.

page 50 Platinum 2013
9
8
7
6
5
4
3
2
1
0
109876543210
-1
Platinum Demand 2008-2012
Palladium Demand 2008-2012
9
8
7
6
5
4
3
2
1
0
109876543210
Platinum Supply 2008-2012
Palladium Supply 2008-2012
Platinum Demand Platinum Supply
Palladium Demand Palladium Supply
-10-9-8-7-6-5-4-3-2-10
Palladium Recycling 2008-2012
Palladium Recycling
-9
-8
-7
-6
-5
-4
-3
-2
-1
0
Platinum Recycling 2008-2012
Platinum Recycling
9
8
7
6
5
4
3
2
1
0
109876543210
-1
Platinum Demand 2008-2012
Palladium Demand 2008-2012
9
8
7
6
5
4
3
2
1
0
109876543210
Platinum Supply 2008-2012
Palladium Supply 2008-2012
Platinum Demand Platinum Supply
Palladium Demand Palladium Supply
Others
North America
Russia
South Africa
Industrial
Investment
Jewellery
Autocatalyst
Others
North America
Russia
South Africa
Investment
Industrial
Jewellery
Autocatalyst
800
600
400
200
0
-200
-400
‘000 oz
2,000
1,500
1,000
500
0
$/oz Movements in stocks Price
SUPPLY AND DEMAND TABLES
Platinum Supply and Demand
’000 oz 2008 2009 2010 2011 2012
South Africa 4,515 4,635 4,635 4,860 4,095
Russia2 805 785 825 835 800
North America 325 260 200 350 295
Zimbabwe3 180 230 280 340 340
Others3 115 115 110 100 110
Total Supply 5,940 6,025 6,050 6,485 5,640
Autocatalyst4 3,655 2,185 3,075 3,185 3,240
Chemical 400 290 440 470 450
Electrical4 230 190 230 230 165
Glass 315 10 385 515 180
Investment 555 660 655 460 455
Jewellery4 2,060 2,810 2,420 2,475 2,780
Medical & Biomedical5 245 250 230 230 235
Petroleum 240 210 170 210 200
Other 290 190 300 320 340
Total Gross Demand 7,990 6,795 7,905 8,095 8,045
Autocatalyst (1,130) (830) (1,085) (1,240) (1,130)
Electrical (5) (10) (10) (10) (10)
Jewellery (695) (565) (735) (810) (890)
Total Recycling (1,830) (1,405) (1,830) (2,060) (2,030)
Total Net Demand7 6,160 5,390 6,075 6,035 6,015
Movements in Stocks8 (220) 635 (25) 450 (375)
Supp
ly1
At a glance
million oz
Year 2008 2009 2010 2011 2012
Year 2008 2009 2010 2011 2012
Year 2008 2009 2010 2011 2012
Gro
ss D
eman
d by
App
licat
ion4
Recy
clin
g6
Supply Demand / RecyclingPrices and Movements in Stocks
Year 2008 2009 2010 2011 2012
Average Price (US$ per oz)9
2008 2009 2010 2011 2012
1,576 1,205 1,611 1,721 1,552

SUPPLY AND DEMAND TABLES
Platinum 2013 page 51
3
2
1
0
3
2
1
0
Platinum European Demand 2008-2012
Platinum japanese Demand 2008-2012
3
2
1
0
Platinum North American Demand 2008-2012
3
2
1
0
3
2
1
0
Platinum China Demand 2008-2012
Platinum ROW Demand 2008-2012
European Demand Chinese Demand
Japanese Demand Rest of the World Demand
North American Demand
3
2
1
0
3
2
1
0
Platinum European Demand 2008-2012
Platinum japanese Demand 2008-2012
3
2
1
0
Platinum North American Demand 2008-2012
3
2
1
0
3
2
1
0
Platinum China Demand 2008-2012
Platinum ROW Demand 2008-2012
European Demand Chinese Demand
Japanese Demand Rest of the World Demand
North American Demand
Jewellery
Autocatalyst
Investment
Industrial
Gross Platinum Demand by Region
’000 oz 2008 2009 2010 2011 2012
Autocatalyst 1,970 970 1,495 1,505 1,330
Chemical 105 70 110 120 110
Electrical 20 20 15 20 15
Glass (25) 5 10 30 5
Investment 105 385 140 155 135
Jewellery 205 185 175 175 180
Medical & Biomedical 115 115 90 90 90
Petroleum 30 25 20 35 20
Other 85 55 100 95 95
Total 2,610 1,830 2,155 2,225 1,980
Autocatalyst 610 395 550 500 600
Chemical 55 45 50 35 35
Electrical 35 30 30 25 20
Glass 65 40 90 130 10
Investment 385 160 45 250 100
Jewellery 530 335 325 310 310
Medical & Biomedical 20 20 20 20 20
Petroleum 10 10 5 5 5
Other 25 15 40 40 40
Total 1,735 1,050 1,155 1,315 1,140
Autocatalyst 505 370 405 370 405
Chemical 95 65 100 95 105
Electrical 30 25 25 25 20
Glass (5) (35) 10 (5) 10
Investment 60 105 465 10 190
Jewellery 200 135 175 185 185
Medical & Biomedical 85 90 90 90 90
Petroleum 25 15 25 50 60
Other 150 90 105 110 115
Total 1,145 860 1,400 930 1,180
Autocatalyst 145 85 100 105 105
Chemical 60 40 80 100 90
Electrical 30 20 30 30 25
Glass 85 (90) 130 10 70
Investment 0 0 0 0 0
Jewellery 1,060 2,080 1,650 1,680 1,950
Medical & Biomedical 10 10 10 10 15
Petroleum 10 10 15 15 10
Other 10 10 25 30 40
Total 1,410 2,165 2,040 1,980 2,305
Autocatalyst 425 365 525 705 800
Chemical 85 70 100 120 110
Electrical 115 95 130 130 85
Glass 195 90 145 350 85
Investment 5 10 5 45 30
Jewellery 65 75 95 125 155
Medical & Biomedical 15 15 20 20 20
Petroleum 165 150 105 105 105
Other 20 20 30 45 50
Total 1,090 890 1,155 1,645 1,440
Total Gross Demand 7,990 6,795 7,905 8,095 8,045
Euro
pe
Jap
an
Nor
th A
mer
ica
Ch
ina
Rest
of
the
Wor
ld
At a glance
million oz
Year 2008 2009 2010 2011 2012
Year 2008 2009 2010 2011 2012
Year 2008 2009 2010 2011 2012
Year 2008 2009 2010 2011 2012
Year 2008 2009 2010 2011 2012

SUPPLY AND DEMAND TABLES
page 52 Platinum 2013
9
8
7
6
5
4
3
2
1
0
109876543210
-1
Platinum Demand 2008-2012
Palladium Demand 2008-2012
9
8
7
6
5
4
3
2
1
0
109876543210
Platinum Supply 2008-2012
Palladium Supply 2008-2012
Platinum Demand Platinum Supply
Palladium Demand Palladium Supply
-10-9-8-7-6-5-4-3-2-10
Palladium Recycling 2008-2012
Palladium Recycling
-9
-8
-7
-6
-5
-4
-3
-2
-1
0
Platinum Recycling 2008-2012
Platinum Recycling
9
8
7
6
5
4
3
2
1
0
109876543210
-1
Platinum Demand 2008-2012
Palladium Demand 2008-2012
9
8
7
6
5
4
3
2
1
0
109876543210
Platinum Supply 2008-2012
Palladium Supply 2008-2012
Platinum Demand Platinum Supply
Palladium Demand Palladium Supply
Others
North America
Russia
South Africa
Others
Electrical
Jewellery
Autocatalyst
Others
North America
Russia
South Africa
Investment
Industrial
Jewellery
Autocatalyst
2,000
1,500
1,000
500
0
-500
-1,000
‘000 oz
800
600
400
200
0
$/oz Movements in stocks Price
Palladium Supply and Demand
’000 oz 2008 2009 2010 2011 2012
South Africa 2,430 2,370 2,640 2,560 2,330
Russia2
Primary 2,700 2,675 2,720 2,705 2,630
Stock Sales 960 960 1,000 775 250
North America 910 755 590 900 905
Zimbabwe3 140 180 220 265 265
Others3 170 160 185 155 165
Total Supply 7,310 7,100 7,355 7,360 6,545
Autocatalyst4 4,465 4,050 5,580 6,155 6,615
Chemical 350 325 370 440 530
Dental 625 635 595 540 530
Electrical4 1,370 1,370 1,410 1,375 1,200
Investment 420 625 1,095 (565) 470
Jewellery4 985 775 595 505 445
Other 75 70 90 110 105
Total Gross Demand 8,290 7,850 9,735 8,560 9,895
Autocatalyst (1,140) (965) (1,310) (1,695) (1,660)
Electrical (345) (395) (440) (480) (430)
Jewellery (130) (70) (100) (210) (190)
Total Recycling (1,615) (1,430) (1,850) (2,385) (2,280)
Total Net Demand7 6,675 6,420 7,885 6,175 7,615
Movements in Stocks8 635 680 (530) 1,185 (1,070)
Supp
ly1
At a glance
million oz
Year 2008 2009 2010 2011 2012
Year 2008 2009 2010 2011 2012
Year 2008 2009 2010 2011 2012
Gro
ss D
eman
d by
App
licat
ion4
Recy
clin
g6
Supply Demand / RecyclingPrices and Movements in Stocks
Year 2008 2009 2010 2011 2012
Average Price (US$ per oz)9
2008 2009 2010 2011 2012
352 264 526 733 643

SUPPLY AND DEMAND TABLES
Platinum 2013 page 53
4
3
2
1
0
-1
4
3
2
1
0
-1
Palladium European Demand 2008-2012
Palladium japanese Demand 2008-2012
4
3
2
1
0
-1
Palladium North American Demand 2008-2012
4
3
2
1
0
-1
4
3
2
1
0
-1
Palladium China Demand 2008-2012
Palladium ROW Demand 2008-2012
European Demand Chinese Demand
Japanese Demand
North American Demand
Rest of the World Demand
4
3
2
1
0
-1
4
3
2
1
0
-1
Palladium European Demand 2008-2012
Palladium japanese Demand 2008-2012
4
3
2
1
0
-1
Palladium North American Demand 2008-2012
4
3
2
1
0
-1
4
3
2
1
0
-1
Palladium China Demand 2008-2012
Palladium ROW Demand 2008-2012
European Demand Chinese Demand
Japanese Demand
North American Demand
Rest of the World Demand
Jewellery
Autocatalyst
Investment
Industrial
Gross Palladium Demand by Region
’000 oz 2008 2009 2010 2011 2012
Autocatalyst 1,005 995 1,330 1,485 1,455
Chemical 100 85 105 80 85
Dental 65 65 80 80 75
Electrical 190 195 195 190 185
Investment 370 525 (5) (35) 165
Jewellery 45 50 65 60 65
Other 20 20 30 25 25
Total 1,795 1,935 1,800 1,885 2,055
Autocatalyst 885 590 820 680 785
Chemical 20 20 20 20 15
Dental 275 295 250 220 220
Electrical 320 270 295 300 310
Investment 0 0 10 5 0
Jewellery 115 80 75 70 70
Other 10 10 10 10 10
Total 1,625 1,265 1,480 1,305 1,410
Autocatalyst 1,290 1,020 1,355 1,545 1,815
Chemical 55 50 65 80 85
Dental 270 260 250 225 220
Electrical 170 170 160 145 140
Investment 50 95 1,090 (535) 305
Jewellery 60 60 65 45 45
Other 20 15 25 45 40
Total 1,915 1,670 3,010 1,550 2,650
Autocatalyst 390 685 1,005 1,155 1,255
Chemical 55 75 65 145 215
Dental 0 0 0 0 0
Electrical 255 335 360 270 185
Investment 0 0 0 0 0
Jewellery 740 560 360 305 240
Other 10 10 10 10 10
Total 1,450 1,665 1,800 1,885 1,905
Autocatalyst 895 760 1,070 1,290 1,305
Chemical 120 95 115 115 130
Dental 15 15 15 15 15
Electrical 435 400 400 470 380
Investment 0 5 0 0 0
Jewellery 25 25 30 25 25
Other 15 15 15 20 20
Total 1,505 1,315 1,645 1,935 1,875
Total Gross Demand 8,290 7,850 9,735 8,560 9,895
Euro
pe
Jap
an
Nor
th A
mer
ica
Ch
ina
Rest
of
the
Wor
ld
At a glance
million oz
Year 2008 2009 2010 2011 2012
Year 2008 2009 2010 2011 2012
Year 2008 2009 2010 2011 2012
Year 2008 2009 2010 2011 2012
Year 2008 2009 2010 2011 2012

SUPPLY AND DEMAND TABLES
page 54 Platinum 2013
1,200
1,000
800
600
400
200
0
1,200
900
600
300
0
Rhodium Demand 2008-2012
Rhodium Demand
Ruthenium Demand 2008-2012
Ruthenium Demand
1,200
1,000
800
600
400
200
0
400
300
200
100
0
Rhodium Supply 2008-2012
Rhodium Supply
Iridium Demand 2008-2012
Iridium Demand
1,200
1,000
800
600
400
200
0
1,200
900
600
300
0
Rhodium Demand 2008-2012
Rhodium Demand
Ruthenium Demand 2008-2012
Ruthenium Demand
1,200
1,000
800
600
400
200
0
400
300
200
100
0
Rhodium Supply 2008-2012
Rhodium Supply
Iridium Demand 2008-2012
Iridium Demand
300
200
100
0
-100
‘000 oz
7,500
5,000
2,500
0
$/oz Movements in stocks Price
Others
North America
Russia
South Africa
Other
Glass
Chemical
Autocatalyst
Others
North America
Russia
South Africa
Others
Electrical
Jewellery
Autocatalyst
-1,200
-1,000
-800
-600
-400
-200
0
Rhodium Recycling 2008-2012
Rhodium Recycling
Rhodium Supply and Demand
’000 oz 2008 2009 2010 2011 2012
South Africa 574 663 632 641 576
Russia2 85 70 70 70 90
North America 18 15 10 23 23
Zimbabwe3 15 19 19 29 30
Others3 3 3 3 2 3
Total Supply 695 770 734 765 722
Autocatalyst4 768 619 727 715 782
Chemical 68 54 67 72 81
Electrical4 3 3 4 6 6
Glass 34 19 68 77 31
Other 24 21 21 38 66
Total Gross Demand 897 716 887 908 966
Autocatalyst (227) (187) (241) (277) (259)
Total Recycling (227) (187) (241) (277) (259)
Total Net Demand7 670 529 646 631 707
Movements in Stocks8 25 241 88 134 15
Supp
ly1
At a glance
'000 oz
Year 2008 2009 2010 2011 2012
Year 2008 2009 2010 2011 2012
Year 2008 2009 2010 2011 2012
Gro
ss D
eman
d by
App
licat
ion4
Recy
clin
g6
Prices and Movements in Stocks
Year 2008 2009 2010 2011 2012
Average Price (US$ per oz)9
2008 2009 2010 2011 2012
6,564 1,592 2,458 2,022 1,276
Supply Demand / Recycling

SUPPLY AND DEMAND TABLES
Platinum 2013 page 55
1,200
1,000
800
600
400
200
0
1,200
900
600
300
0
Rhodium Demand 2008-2012
Rhodium Demand
Ruthenium Demand 2008-2012
Ruthenium Demand
1,200
1,000
800
600
400
200
0
400
300
200
100
0
Rhodium Supply 2008-2012
Rhodium Supply
Iridium Demand 2008-2012
Iridium Demand
1,200
1,000
800
600
400
200
0
1,200
900
600
300
0
Rhodium Demand 2008-2012
Rhodium Demand
Ruthenium Demand 2008-2012
Ruthenium Demand
1,200
1,000
800
600
400
200
0
400
300
200
100
0
Rhodium Supply 2008-2012
Rhodium Supply
Iridium Demand 2008-2012
Iridium Demand
Electrical
Chemical
Other
Electrochemical
Ruthenium Demand
’000 oz 2008 2009 2010 2011 2012
Chemical 139 89 100 273 101
Electrical 410 336 679 536 377
Electrochemical 95 95 124 130 127
Other 55 54 42 58 74
Total Demand 699 574 945 997 679
Dem
and
by A
pplic
atio
n
At a glance
'000 oz
Year 2008 2009 2010 2011 2012
Iridium Demand
’000 oz 2008 2009 2010 2011 2012
Chemical 21 11 18 19 19
Electrical 15 7 201 195 42
Electrochemical 25 33 79 76 70
Other 41 30 40 42 47
Total Demand 102 81 338 332 178
At a glance
'000 oz
Year 2008 2009 2010 2011 2012
Dem
and
by A
pplic
atio
n
Average Price (US$ per oz)9
2008 2009 2010 2011 2012
323 95 197 166 112
Average Price (US$ per oz)9
2008 2009 2010 2011 2012
450 425 642 1,036 1,070

SUPPLY AND DEMAND TABLES
page 56 Platinum 2013
NOTES TO TABLES
1Supply figures represent estimates of sales by the mines of primary pgm and are allocated to where the initial mining took place
rather than the location of refining. Additionally, we continue to report sales of metal which we believe has not previously been priced,
principally sales of Russian state stocks, as supplies.
2Our Russian supply figures represent the total pgm sold in all regions, including Russia and the ex-CIS. Demand in Russia and the ex-CIS
states is included in the Rest of the World region. Russian supply figures for palladium have been split into sales from primary mining
and sales of stocks.
3Supplies from Zimbabwe have been split from Others' supplies. Platinum group metals mined in Zimbabwe are currently refined in
South Africa, and our supply figures represent shipments of pgm in concentrate or matte, adjusted for typical refining recoveries.
4Gross demand figures for any given application represent the sum of manufacturer demand for metal in that application and any
changes in unrefined metal stocks in that sector. Increases in unrefined stocks lead to additional demand, reductions in stock lead to a
lower demand figure.
5Our Medical and Biomedical category represents combined metal demand in the medical, biomedical and dental sectors.
6Recycling figures represent estimates of the quantity of metal recovered from open loop recycling (i.e. where the original purchaser
does not retain control of the metal throughout). For instance, autocatalyst recycling represents the weight of metal recovered from
end-of-life vehicles and aftermarket scrap in an individual region, allocated to where the car is scrapped rather than where the metal is
finally recovered. These figures do not include warranty or production scrap. Where no recycling figures are given, open loop recycling is
negligible. In our recycling charts, we label recovery of electrical scrap as 'industrial' recycling.
7Net demand figures are equivalent to the sum of gross demand in an application less any metal recovery from open loop scrap in that
application, whether the recycled metal is reused in that industry or sold into another application. Where no recycling figure is given for
an application, gross and net demand are identical.
8Movements in stocks in any given year reflect changes in stocks held by fabricators, dealers, banks and depositories but excluding stocks
held by primary refiners and final consumers. A positive figure (sometimes referred to as a ‘surplus’) reflects an increase in market stocks.
A negative value (or ‘deficit’) indicates a decrease in market stocks.
9Average price figures for platinum and palladium are the mean of all daily fixing values in a given year. Average price figures for rhodium,
ruthenium and iridium are based on Johnson Matthey European Base Prices.

PET Polyethylene Terephthalate
pgm Platinum Group Metal(s)
Platreef A platiniferous orebody in South Africa
PM Particulate Matter
ppm Parts Per Million
ppt Parts Per Thousand
PTA Purified Terephthalic Acid
RDO Rock Drill Operator
SCR Selective Catalytic Reduction
SGE Shanghai Gold Exchange
SUV Sports Utility Vehicle
TOCOM Tokyo Commodity Exchange
tonne 1,000 kg
TWC Three-Way Catalyst
UG2 A platiniferous orebody in South Africa
WEE Waste Electronic Equipment
NOTE ON PRICES
All prices are quoted per oz unless otherwise stated.
R South African Rand
£ UK Pound
$ US Dollar
¥ Japanese Yen
€ Euro
RMB Chinese Renminbi
GLOSSARY
AMCU Association of Mineworkers & Construction Union
ASC Ammonia Slip Catalyst
CO Carbon Monoxide
CO2 Carbon Dioxide
CRT Cathode Ray Tube
DOC Diesel Oxidation Catalyst
DPF Diesel Particulate Filter
ETF Exchange Traded Fund
g Gram
HC Hydrocarbons
HDV Heavy Duty Vehicle
JV Joint Venture
kg Kilograms
LCD Liquid Crystal Display
LDD Light Duty Diesel
LDG Light Duty Gasoline
LNT Lean NOx Trap
Merensky A platiniferous orebody in South Africa
MLCC Multi-Layer Ceramic Capacitor
NOx Oxides of Nitrogen
NRMM Non-Road Mobile Machinery
NUM National Union of Mineworkers
NYMEX New York Mercantile Exchange
oz Ounces Troy
PC Personal Computer
Johnson MattheyFei Liu Fine Jewellery Komatsu LtdFord Motor CompanyJohnson MattheyAnglo American Platinum LimitedRoyal Bafokeng Platinum MinesJohnson Matthey©iStockphoto.com / Dimitriy Yakovlev Anglo American Platinum LimitedStillwater Mining Company©iStockphoto.com / Yenwen Lu
PICTURE CREDITS
Johnson Matthey is grateful to the following people and organisations for their help in providing illustrations for Platinum 2013. For copyright information or permission to use any of these images, please contact the relevant organisation.
One-ounce investment bars, front cover, p2 and p11 Platinum chain and pendant, front cover, p2 and p27 Non-road diesel bulldozer, front cover, p2 and p31Automobile production line, front cover, p3 and p36PGM grain, inside cover and p3 Mechanised drill rig, p2 and p15Shaft development at Styldrift I, p2 and p18Diesel autocatalyst production line, p2 and p24The Kremlin, Moscow, p3 and p13Load haul dump truck, p3 and p16J-M reef ore, p3 and p20Lockheed F-22 Raptor fighter jet, p3 and p39
Automotive production data are provided courtesy of LMC Automotive.

Precious Metals Marketing, Orchard Road, Royston, Hertfordshire, SG8 5HE, EnglandTelephone: +44 (0)1763 256315 Fax: +44 (0)1763 256339
Email: [email protected]
www.platinum.matthey.com