Embed Size (px)
Citation preview
0
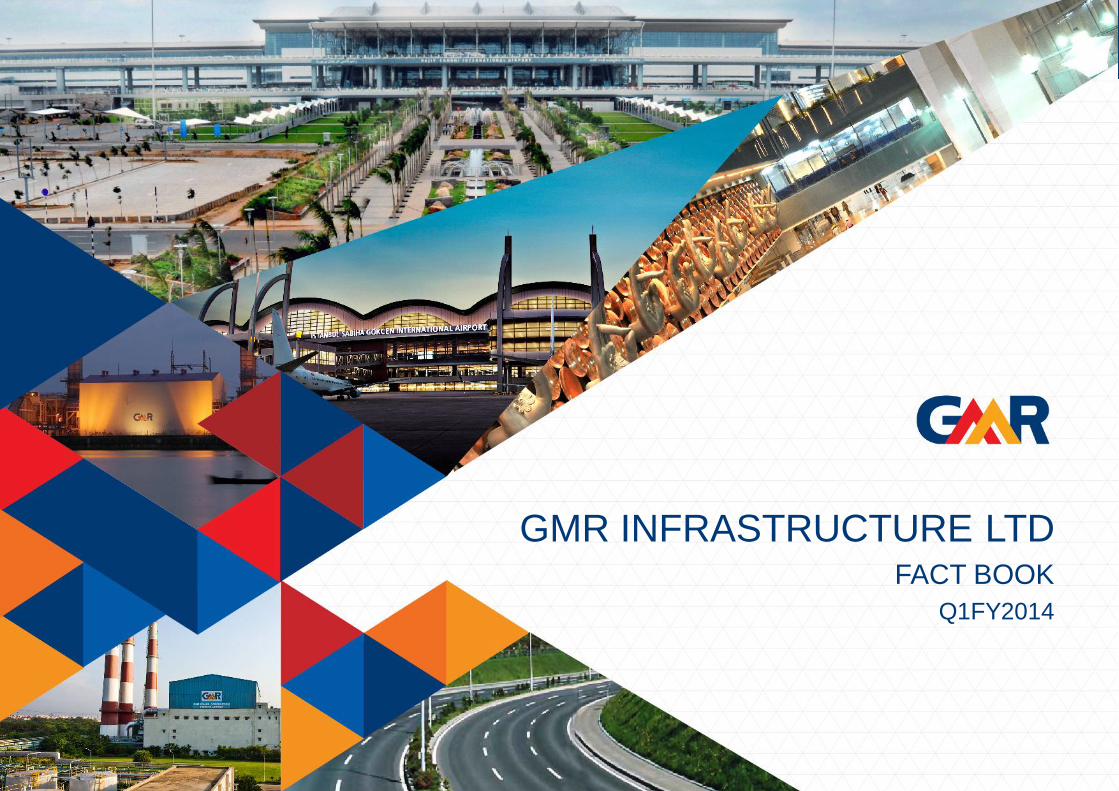
GMR INFRASTRUCTURE LTD FACT BOOK
Q1FY2014
1
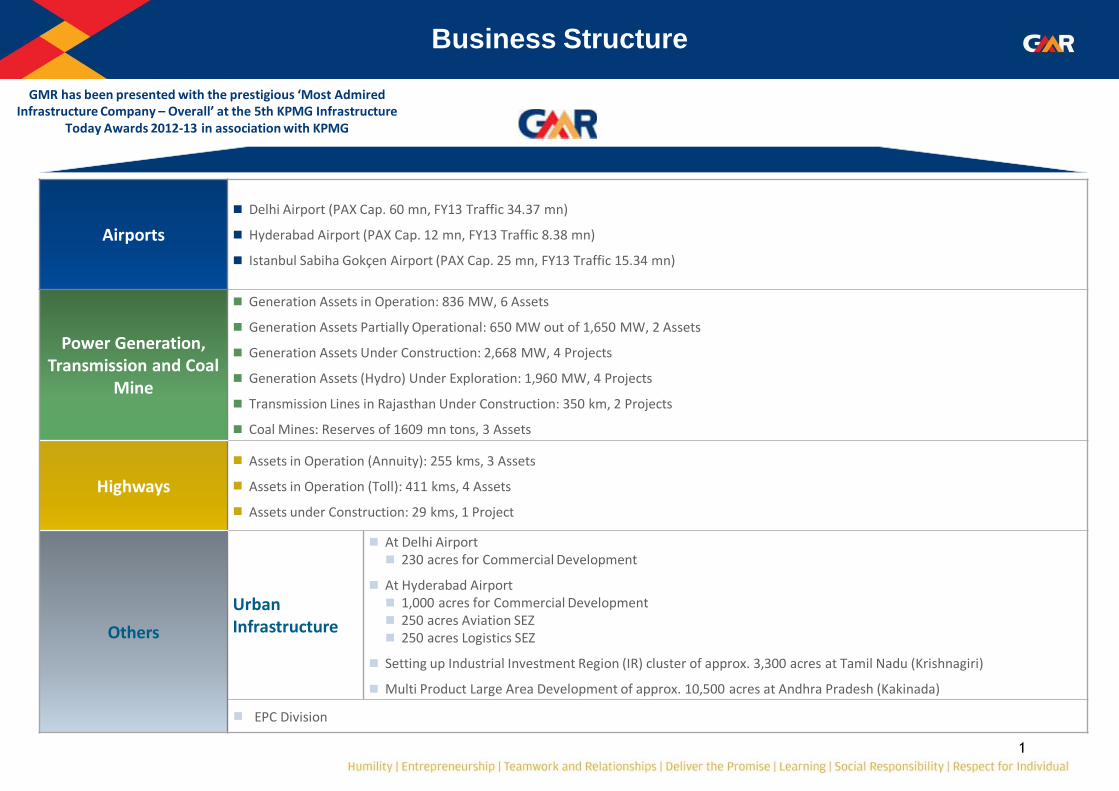
Airports
Delhi Airport (PAX Cap. 60 mn, FY13 Traffic 34.37 mn)
Hyderabad Airport (PAX Cap. 12 mn, FY13 Traffic 8.38 mn)
Istanbul Sabiha Gokçen Airport (PAX Cap. 25 mn, FY13 Traffic 15.34 mn)
Power Generation, Transmission and Coal
Mine
Generation Assets in Operation: 836 MW, 6 Assets
Generation Assets Partially Operational: 650 MW out of 1,650 MW, 2 Assets
Generation Assets Under Construction: 2,668 MW, 4 Projects
Generation Assets (Hydro) Under Exploration: 1,960 MW, 4 Projects
Transmission Lines in Rajasthan Under Construction: 350 km, 2 Projects
Coal Mines: Reserves of 1609 mn tons, 3 Assets
Highways
Assets in Operation (Annuity): 255 kms, 3 Assets
Assets in Operation (Toll): 411 kms, 4 Assets
Assets under Construction: 29 kms, 1 Project
Others
Urban Infrastructure
At Delhi Airport 230 acres for Commercial Development
At Hyderabad Airport 1,000 acres for Commercial Development 250 acres Aviation SEZ 250 acres Logistics SEZ
Setting up Industrial Investment Region (IR) cluster of approx. 3,300 acres at Tamil Nadu (Krishnagiri)
Multi Product Large Area Development of approx. 10,500 acres at Andhra Pradesh (Kakinada)
EPC Division
Business Structure
GMR has been presented with the prestigious ‘Most Admired Infrastructure Company – Overall’ at the 5th KPMG Infrastructure
Today Awards 2012-13 in association with KPMG
2
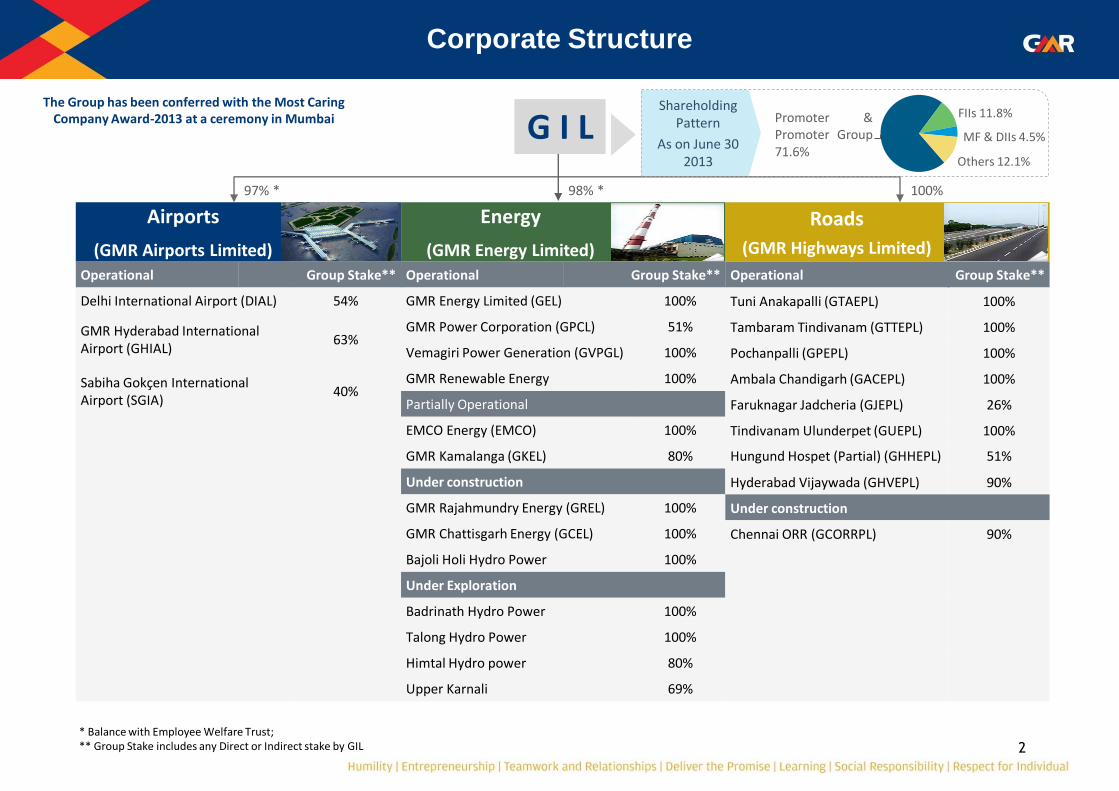
Corporate Structure
Airports
(GMR Airports Limited)
Energy
(GMR Energy Limited)
Roads
(GMR Highways Limited)
Operational Group Stake** Operational Group Stake** Operational Group Stake**
Delhi International Airport (DIAL) 54% GMR Energy Limited (GEL) 100% Tuni Anakapalli (GTAEPL) 100%
GMR Hyderabad International Airport (GHIAL)
63% GMR Power Corporation (GPCL) 51% Tambaram Tindivanam (GTTEPL) 100%
Vemagiri Power Generation (GVPGL) 100% Pochanpalli (GPEPL) 100%
Sabiha Gokçen International Airport (SGIA)
40% GMR Renewable Energy 100% Ambala Chandigarh (GACEPL) 100%
Partially Operational Faruknagar Jadcheria (GJEPL) 26%
EMCO Energy (EMCO) 100% Tindivanam Ulunderpet (GUEPL) 100%
GMR Kamalanga (GKEL) 80% Hungund Hospet (Partial) (GHHEPL) 51%
Under construction Hyderabad Vijaywada (GHVEPL) 90%
GMR Rajahmundry Energy (GREL) 100% Under construction
GMR Chattisgarh Energy (GCEL) 100% Chennai ORR (GCORRPL) 90%
Bajoli Holi Hydro Power 100%
Under Exploration
Badrinath Hydro Power 100%
Talong Hydro Power 100%
Himtal Hydro power 80%
Upper Karnali 69%
97% * 98% * 100%
Promoter & Promoter Group 71.6%
FIIs 11.8%
MF & DIIs 4.5%
Others 12.1%
Shareholding Pattern
As on June 30 2013
* Balance with Employee Welfare Trust; ** Group Stake includes any Direct or Indirect stake by GIL
The Group has been conferred with the Most Caring Company Award-2013 at a ceremony in Mumbai G I L
3
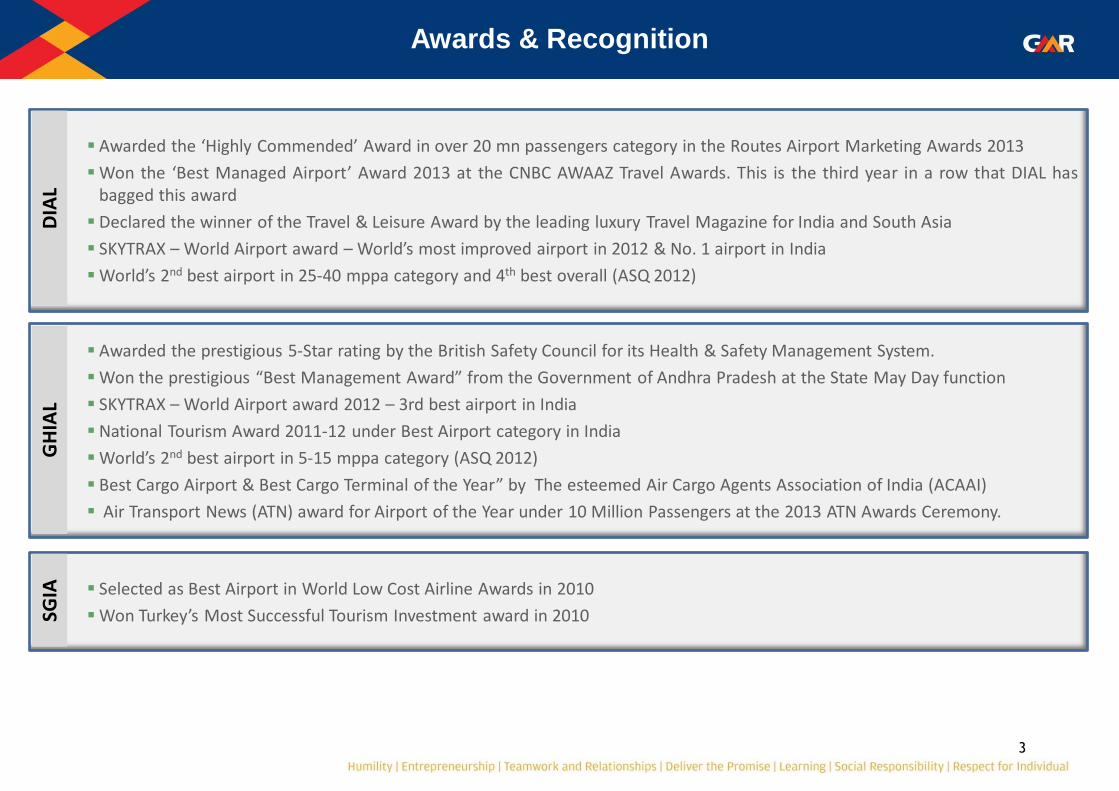
Selected as Best Airport in World Low Cost Airline Awards in 2010
Won Turkey’s Most Successful Tourism Investment award in 2010 SGIA
Awarded the prestigious 5-Star rating by the British Safety Council for its Health & Safety Management System.
Won the prestigious “Best Management Award” from the Government of Andhra Pradesh at the State May Day function
SKYTRAX – World Airport award 2012 – 3rd best airport in India
National Tourism Award 2011-12 under Best Airport category in India
World’s 2nd best airport in 5-15 mppa category (ASQ 2012)
Best Cargo Airport & Best Cargo Terminal of the Year” by The esteemed Air Cargo Agents Association of India (ACAAI)
Air Transport News (ATN) award for Airport of the Year under 10 Million Passengers at the 2013 ATN Awards Ceremony.
GH
IAL
Awarded the ‘Highly Commended’ Award in over 20 mn passengers category in the Routes Airport Marketing Awards 2013
Won the ‘Best Managed Airport’ Award 2013 at the CNBC AWAAZ Travel Awards. This is the third year in a row that DIAL has bagged this award
Declared the winner of the Travel & Leisure Award by the leading luxury Travel Magazine for India and South Asia
SKYTRAX – World Airport award – World’s most improved airport in 2012 & No. 1 airport in India
World’s 2nd best airport in 25-40 mppa category and 4th best overall (ASQ 2012)
Awards & Recognition D
IAL
4
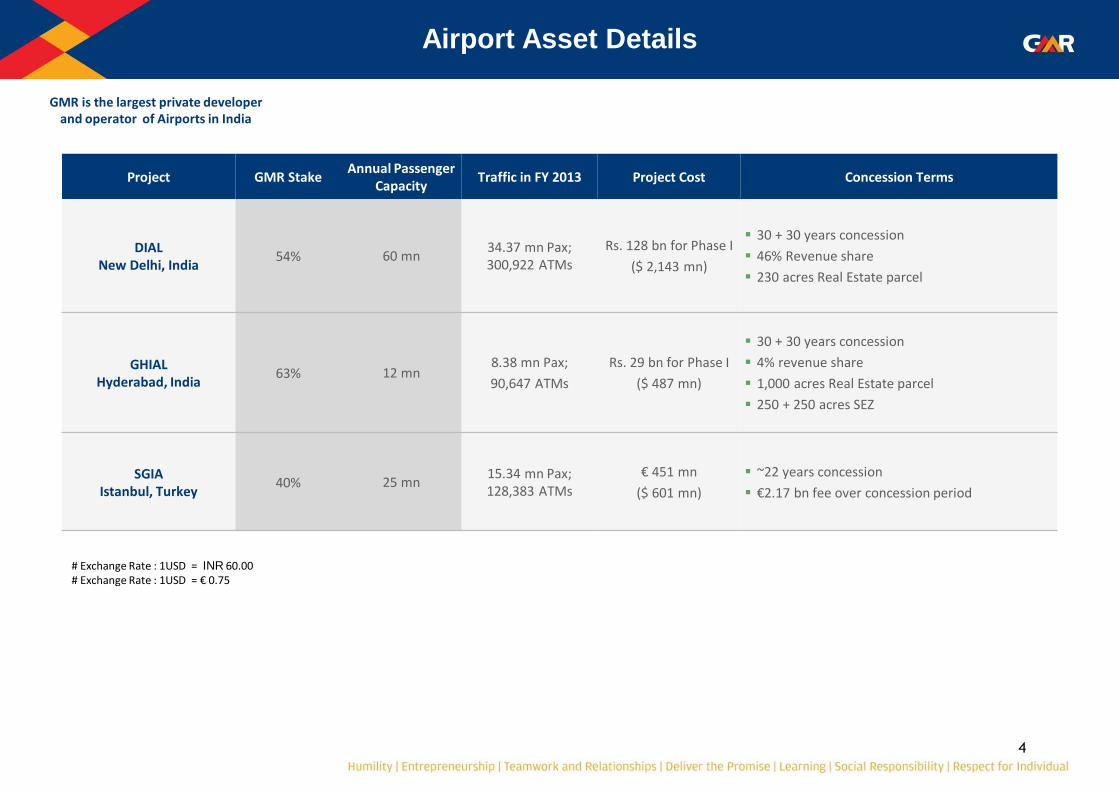
Project GMR Stake Annual Passenger
Capacity Traffic in FY 2013 Project Cost Concession Terms
DIAL New Delhi, India
54% 60 mn 34.37 mn Pax; 300,922 ATMs
Rs. 128 bn for Phase I
($ 2,143 mn)
30 + 30 years concession
46% Revenue share
230 acres Real Estate parcel
GHIAL Hyderabad, India
63% 12 mn 8.38 mn Pax;
90,647 ATMs
Rs. 29 bn for Phase I
($ 487 mn)
30 + 30 years concession
4% revenue share
1,000 acres Real Estate parcel
250 + 250 acres SEZ
SGIA Istanbul, Turkey
40% 25 mn 15.34 mn Pax; 128,383 ATMs
€ 451 mn
($ 601 mn)
~22 years concession
€2.17 bn fee over concession period
Airport Asset Details
# Exchange Rate : 1USD = INR 60.00 # Exchange Rate : 1USD = € 0.75
GMR is the largest private developer and operator of Airports in India
5
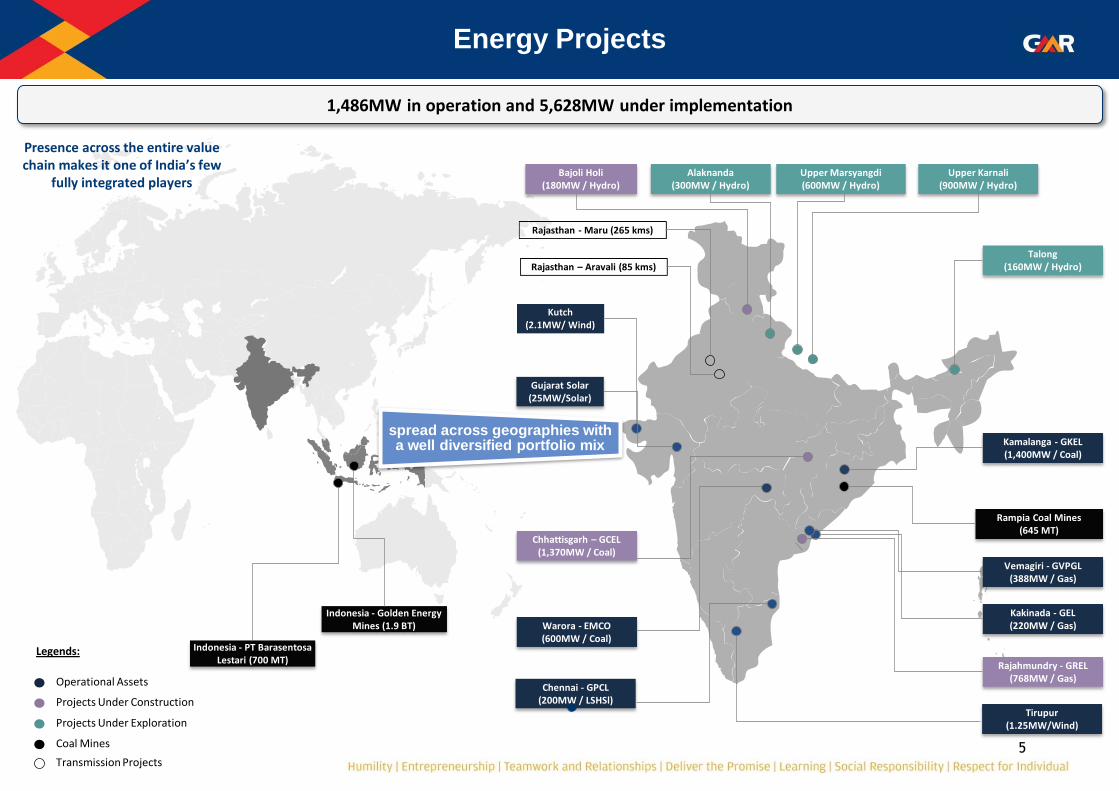
Energy Projects
Indonesia - PT Barasentosa Lestari (700 MT)
Bajoli Holi (180MW / Hydro)
Alaknanda (300MW / Hydro)
Upper Marsyangdi (600MW / Hydro)
Upper Karnali (900MW / Hydro)
Talong (160MW / Hydro)
Rajasthan - Maru (265 kms)
Rajasthan – Aravali (85 kms)
Kutch (2.1MW/ Wind)
Chhattisgarh – GCEL (1,370MW / Coal)
Warora - EMCO (600MW / Coal)
Kakinada - GEL (220MW / Gas)
Chennai - GPCL (200MW / LSHSl)
Rajahmundry - GREL (768MW / Gas)
Kamalanga - GKEL (1,400MW / Coal)
Rampia Coal Mines (645 MT)
Vemagiri - GVPGL (388MW / Gas)
Gujarat Solar (25MW/Solar)
Operational Assets
Projects Under Construction
Projects Under Exploration
Legends:
Transmission Projects
Coal Mines
1,486MW in operation and 5,628MW under implementation
Tirupur (1.25MW/Wind)
Indonesia - Golden Energy Mines (1.9 BT)
Presence across the entire value chain makes it one of India’s few
fully integrated players
spread across geographies with a well diversified portfolio mix
6
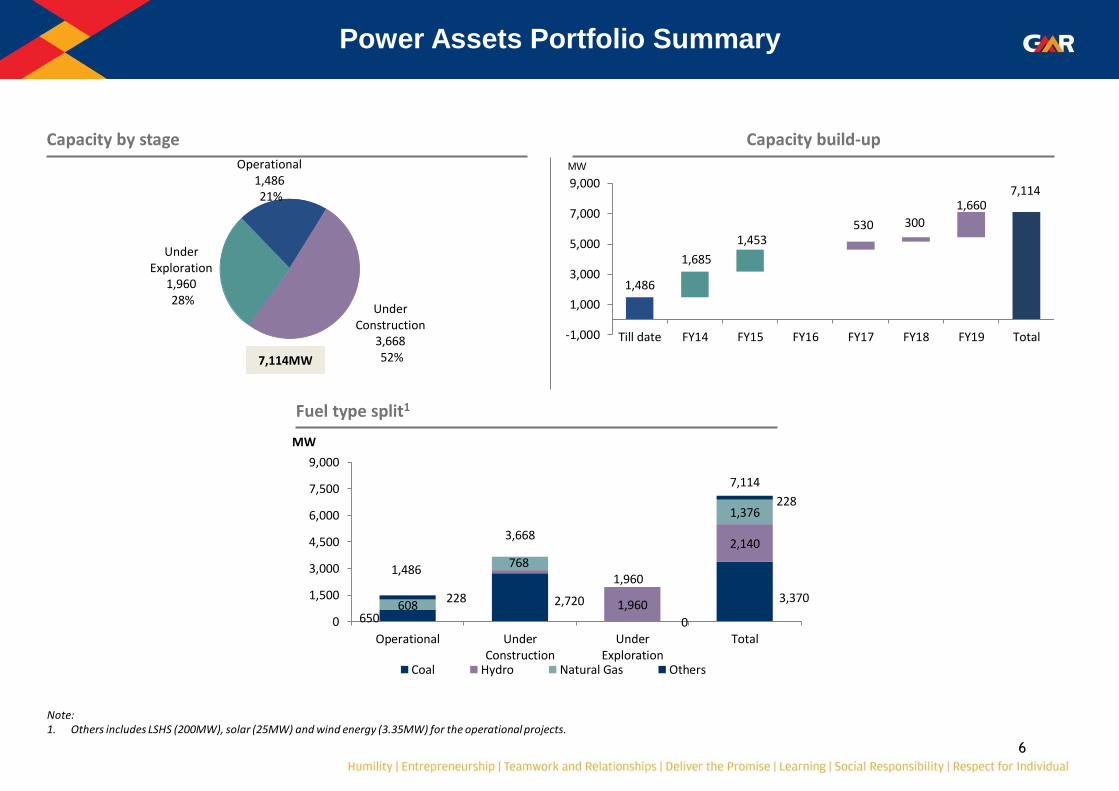
Power Assets Portfolio Summary
Capacity by stage Capacity build-up
Fuel type split1
1,486
7,114
1,685
1,453 530 300
1,660
-1,000
1,000
3,000
5,000
7,000
9,000
Till date FY14 FY15 FY16 FY17 FY18 FY19 Total
MW Operational 1,486 21%
Under Construction
3,668 52%
Under Exploration
1,960 28%
7,114MW
650
2,720
0
3,370 1,960
2,140
608
768
1,376
228
228
1,486
3,668
1,960
7,114
0
1,500
3,000
4,500
6,000
7,500
9,000
Operational UnderConstruction
UnderExploration
Total
MW
Coal Hydro Natural Gas Others
Note: 1. Others includes LSHS (200MW), solar (25MW) and wind energy (3.35MW) for the operational projects.
7
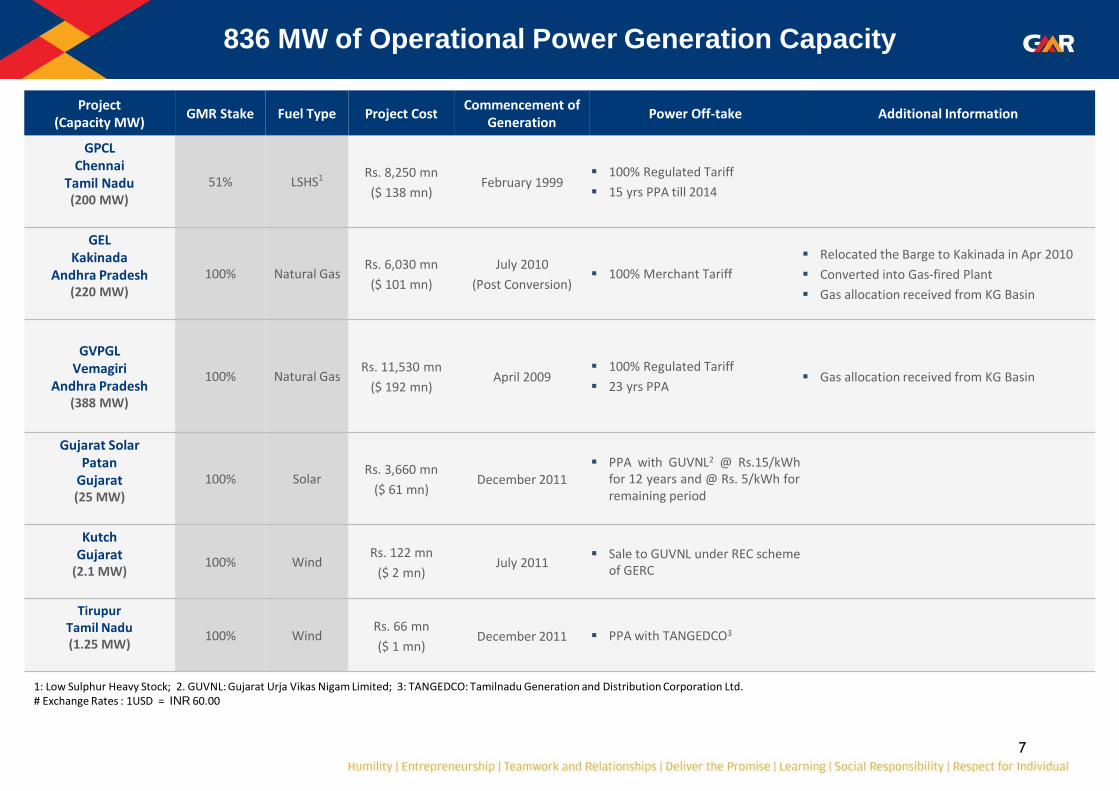
Project (Capacity MW)
GMR Stake Fuel Type Project Cost Commencement of
Generation Power Off-take Additional Information
GPCL Chennai
Tamil Nadu (200 MW)
51% LSHS1 Rs. 8,250 mn
($ 138 mn) February 1999
100% Regulated Tariff
15 yrs PPA till 2014
GEL Kakinada
Andhra Pradesh (220 MW)
100% Natural Gas Rs. 6,030 mn
($ 101 mn)
July 2010
(Post Conversion) 100% Merchant Tariff
Relocated the Barge to Kakinada in Apr 2010
Converted into Gas-fired Plant
Gas allocation received from KG Basin
GVPGL Vemagiri
Andhra Pradesh (388 MW)
100% Natural Gas Rs. 11,530 mn
($ 192 mn) April 2009
100% Regulated Tariff
23 yrs PPA Gas allocation received from KG Basin
Gujarat Solar Patan
Gujarat (25 MW)
100% Solar Rs. 3,660 mn
($ 61 mn) December 2011
PPA with GUVNL2 @ Rs.15/kWh for 12 years and @ Rs. 5/kWh for remaining period
Kutch Gujarat
(2.1 MW)
100% Wind Rs. 122 mn
($ 2 mn) July 2011
Sale to GUVNL under REC scheme of GERC
Tirupur Tamil Nadu (1.25 MW)
100% Wind Rs. 66 mn
($ 1 mn) December 2011 PPA with TANGEDCO3
836 MW of Operational Power Generation Capacity
1: Low Sulphur Heavy Stock; 2. GUVNL: Gujarat Urja Vikas Nigam Limited; 3: TANGEDCO: Tamilnadu Generation and Distribution Corporation Ltd. # Exchange Rates : 1USD = INR 60.00
8
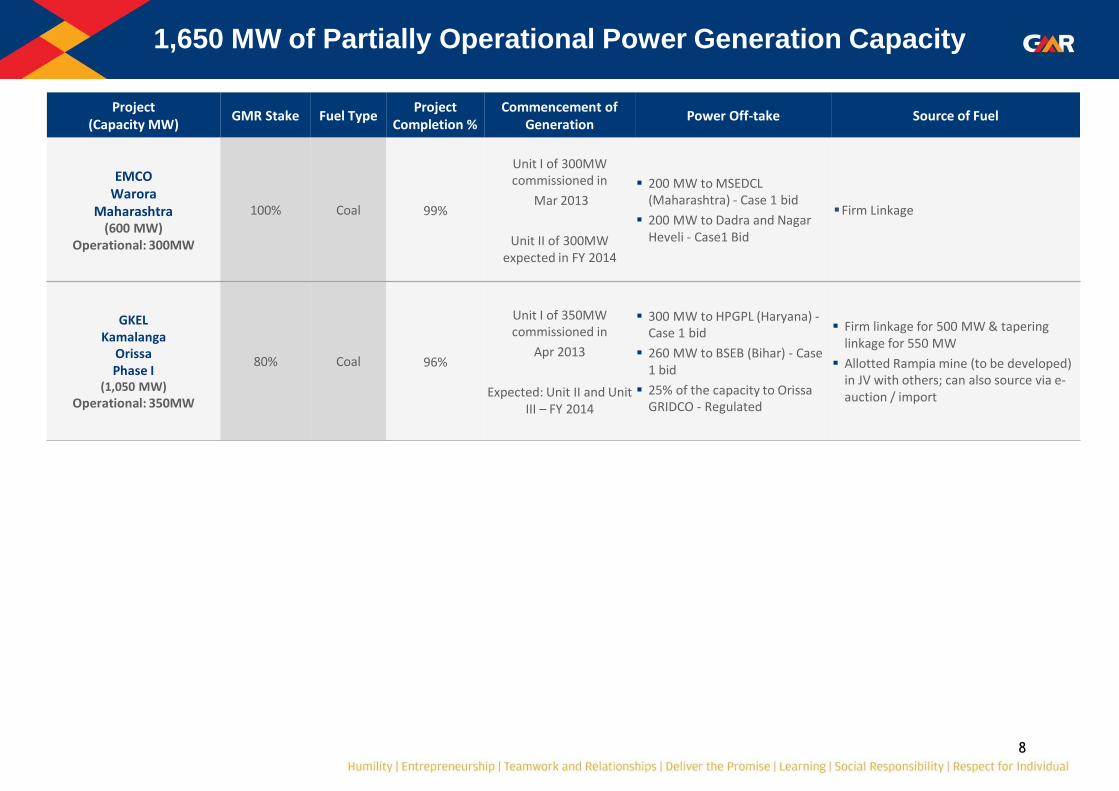
Project (Capacity MW)
GMR Stake Fuel Type Project
Completion % Commencement of
Generation Power Off-take Source of Fuel
EMCO Warora
Maharashtra (600 MW)
Operational: 300MW
100% Coal 99%
Unit I of 300MW commissioned in
Mar 2013
Unit II of 300MW expected in FY 2014
200 MW to MSEDCL (Maharashtra) - Case 1 bid
200 MW to Dadra and Nagar Heveli - Case1 Bid
Firm Linkage
GKEL Kamalanga
Orissa Phase I
(1,050 MW) Operational: 350MW
80% Coal 96%
Unit I of 350MW commissioned in
Apr 2013
Expected: Unit II and Unit III – FY 2014
300 MW to HPGPL (Haryana) - Case 1 bid
260 MW to BSEB (Bihar) - Case 1 bid
25% of the capacity to Orissa GRIDCO - Regulated
Firm linkage for 500 MW & tapering linkage for 550 MW
Allotted Rampia mine (to be developed) in JV with others; can also source via e-auction / import
1,650 MW of Partially Operational Power Generation Capacity
9
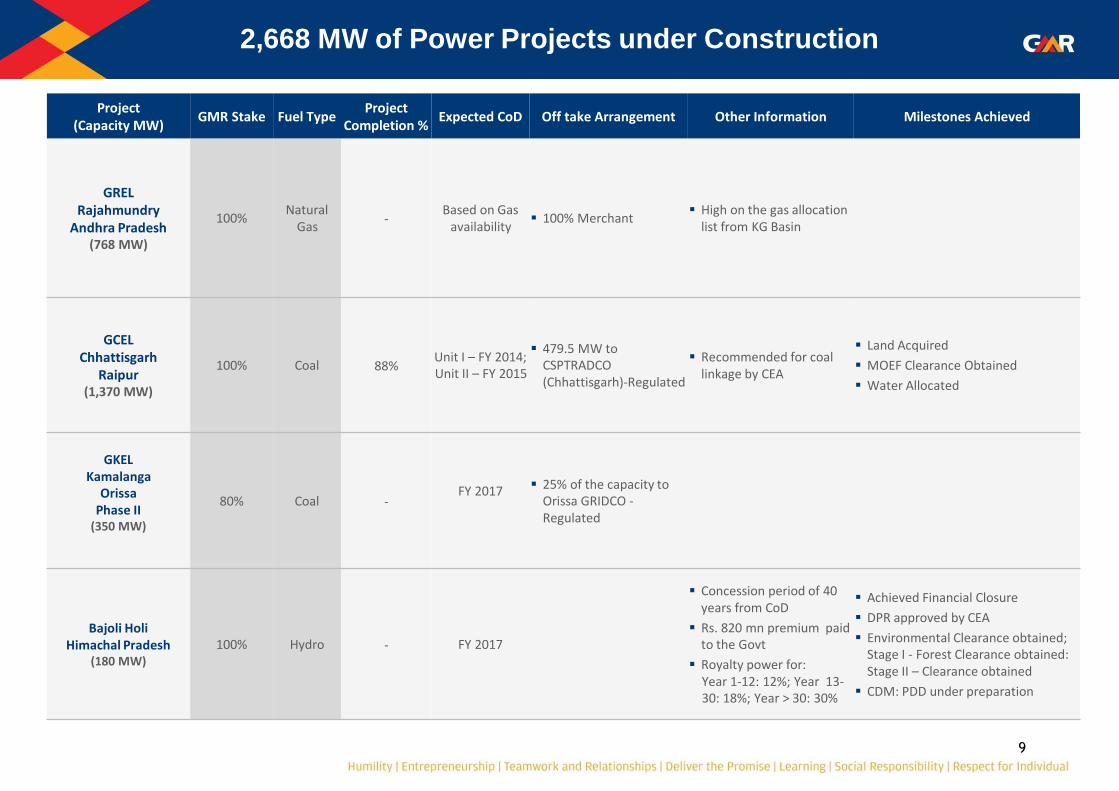
Project (Capacity MW)
GMR Stake Fuel Type Project
Completion % Expected CoD Off take Arrangement Other Information Milestones Achieved
GREL Rajahmundry
Andhra Pradesh (768 MW)
100% Natural
Gas -
Based on Gas availability
100% Merchant High on the gas allocation
list from KG Basin
GCEL Chhattisgarh
Raipur (1,370 MW)
100% Coal 88% Unit I – FY 2014; Unit II – FY 2015
479.5 MW to CSPTRADCO (Chhattisgarh)-Regulated
Recommended for coal linkage by CEA
Land Acquired
MOEF Clearance Obtained
Water Allocated
GKEL Kamalanga
Orissa Phase II
(350 MW)
80% Coal - FY 2017
25% of the capacity to Orissa GRIDCO - Regulated
Bajoli Holi Himachal Pradesh
(180 MW) 100% Hydro - FY 2017
Concession period of 40 years from CoD
Rs. 820 mn premium paid to the Govt
Royalty power for: Year 1-12: 12%; Year 13-30: 18%; Year > 30: 30%
Achieved Financial Closure
DPR approved by CEA
Environmental Clearance obtained; Stage I - Forest Clearance obtained: Stage II – Clearance obtained
CDM: PDD under preparation
2,668 MW of Power Projects under Construction
10
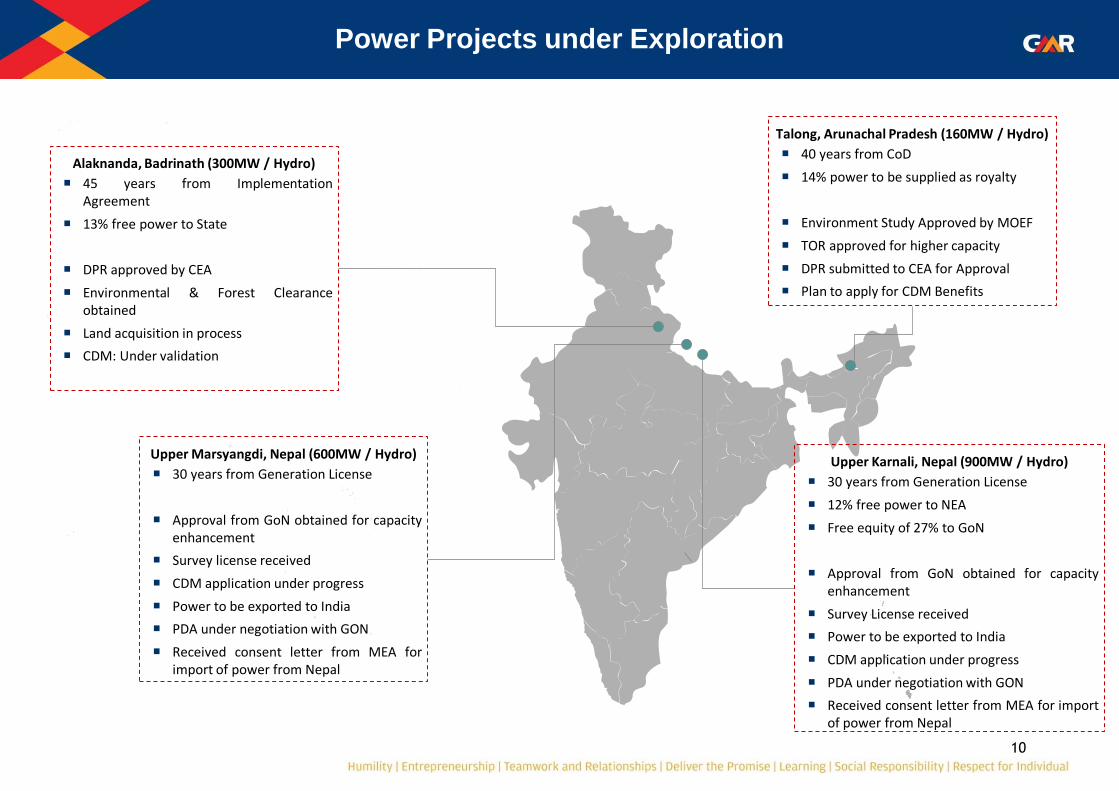
Power Projects under Exploration
Alaknanda, Badrinath (300MW / Hydro)
45 years from Implementation Agreement
13% free power to State
DPR approved by CEA
Environmental & Forest Clearance obtained
Land acquisition in process
CDM: Under validation
Upper Marsyangdi, Nepal (600MW / Hydro)
30 years from Generation License
Approval from GoN obtained for capacity enhancement
Survey license received
CDM application under progress
Power to be exported to India
PDA under negotiation with GON
Received consent letter from MEA for import of power from Nepal
Talong, Arunachal Pradesh (160MW / Hydro)
40 years from CoD
14% power to be supplied as royalty
Environment Study Approved by MOEF
TOR approved for higher capacity
DPR submitted to CEA for Approval
Plan to apply for CDM Benefits
Upper Karnali, Nepal (900MW / Hydro)
30 years from Generation License
12% free power to NEA
Free equity of 27% to GoN
Approval from GoN obtained for capacity enhancement
Survey License received
Power to be exported to India
CDM application under progress
PDA under negotiation with GON
Received consent letter from MEA for import of power from Nepal
11
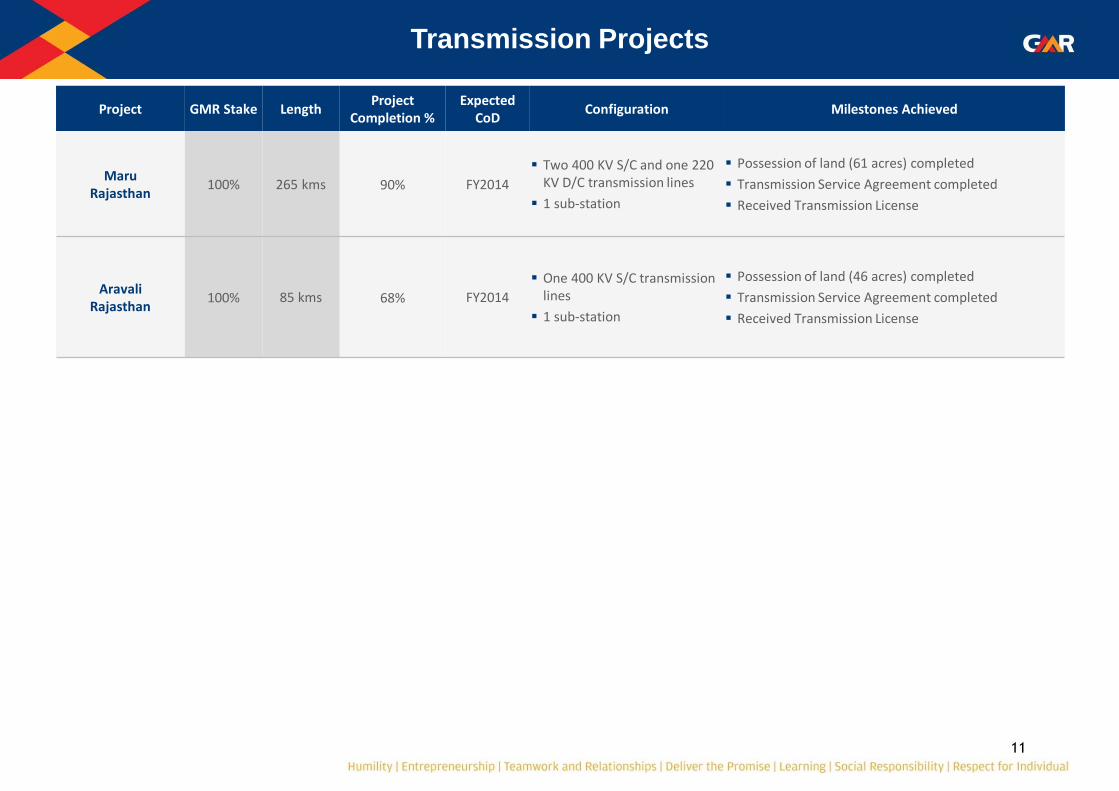
Project GMR Stake Length Project
Completion % Expected
CoD Configuration Milestones Achieved
Maru Rajasthan
100% 265 kms 90% FY2014
Two 400 KV S/C and one 220 KV D/C transmission lines
1 sub-station
Possession of land (61 acres) completed
Transmission Service Agreement completed
Received Transmission License
Aravali Rajasthan
100% 85 kms 68% FY2014
One 400 KV S/C transmission lines
1 sub-station
Possession of land (46 acres) completed
Transmission Service Agreement completed
Received Transmission License
Transmission Projects
12
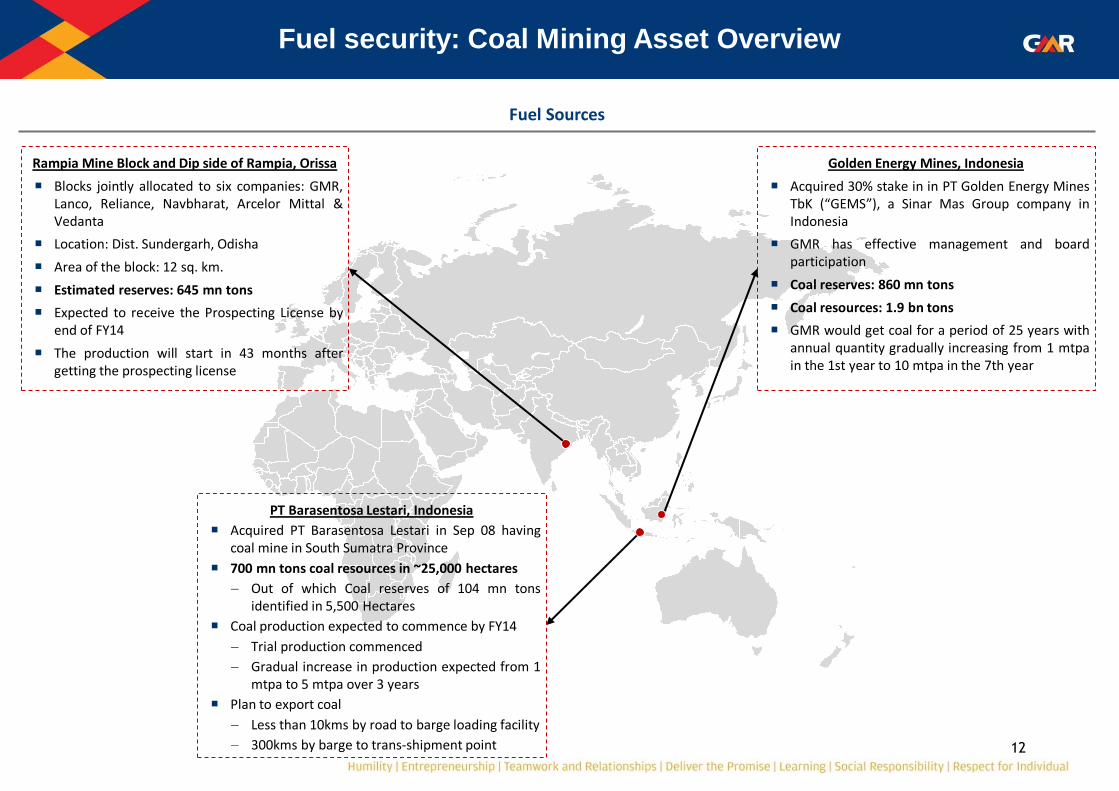
Fuel security: Coal Mining Asset Overview
Rampia Mine Block and Dip side of Rampia, Orissa
Blocks jointly allocated to six companies: GMR, Lanco, Reliance, Navbharat, Arcelor Mittal & Vedanta
Location: Dist. Sundergarh, Odisha
Area of the block: 12 sq. km.
Estimated reserves: 645 mn tons
Expected to receive the Prospecting License by end of FY14
The production will start in 43 months after getting the prospecting license
PT Barasentosa Lestari, Indonesia
Acquired PT Barasentosa Lestari in Sep 08 having coal mine in South Sumatra Province
700 mn tons coal resources in ~25,000 hectares
Out of which Coal reserves of 104 mn tons identified in 5,500 Hectares
Coal production expected to commence by FY14
Trial production commenced
Gradual increase in production expected from 1 mtpa to 5 mtpa over 3 years
Plan to export coal
Less than 10kms by road to barge loading facility
300kms by barge to trans-shipment point
Golden Energy Mines, Indonesia
Acquired 30% stake in in PT Golden Energy Mines TbK (“GEMS”), a Sinar Mas Group company in Indonesia
GMR has effective management and board participation
Coal reserves: 860 mn tons
Coal resources: 1.9 bn tons
GMR would get coal for a period of 25 years with annual quantity gradually increasing from 1 mtpa in the 1st year to 10 mtpa in the 7th year
Fuel Sources
13
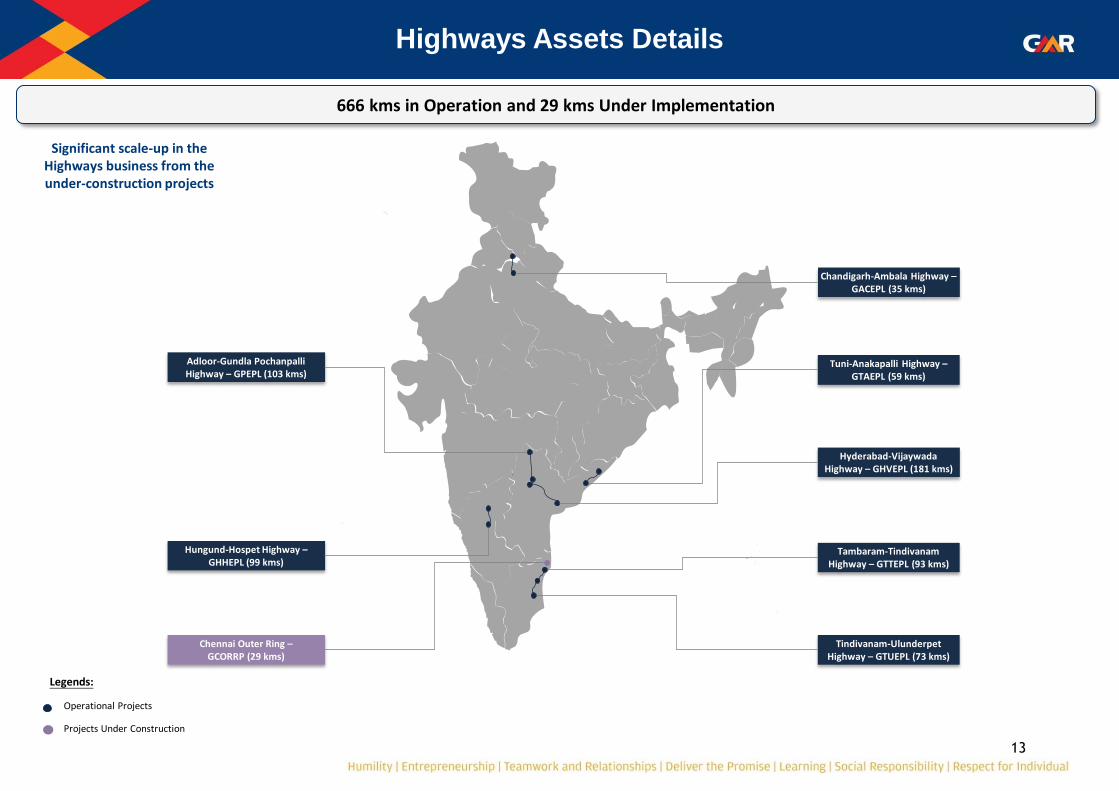
Hyderabad
Chandigarh-Ambala Highway – GACEPL (35 kms)
Tambaram-Tindivanam Highway – GTTEPL (93 kms)
Tindivanam-Ulunderpet Highway – GTUEPL (73 kms)
Tuni-Anakapalli Highway – GTAEPL (59 kms)
Adloor-Gundla Pochanpalli Highway – GPEPL (103 kms)
Hyderabad-Vijaywada Highway – GHVEPL (181 kms)
Chennai Outer Ring – GCORRP (29 kms)
Hungund-Hospet Highway – GHHEPL (99 kms)
Projects Under Construction
Operational Projects
Legends:
Highways Assets Details
666 kms in Operation and 29 kms Under Implementation
Significant scale-up in the Highways business from the under-construction projects
14
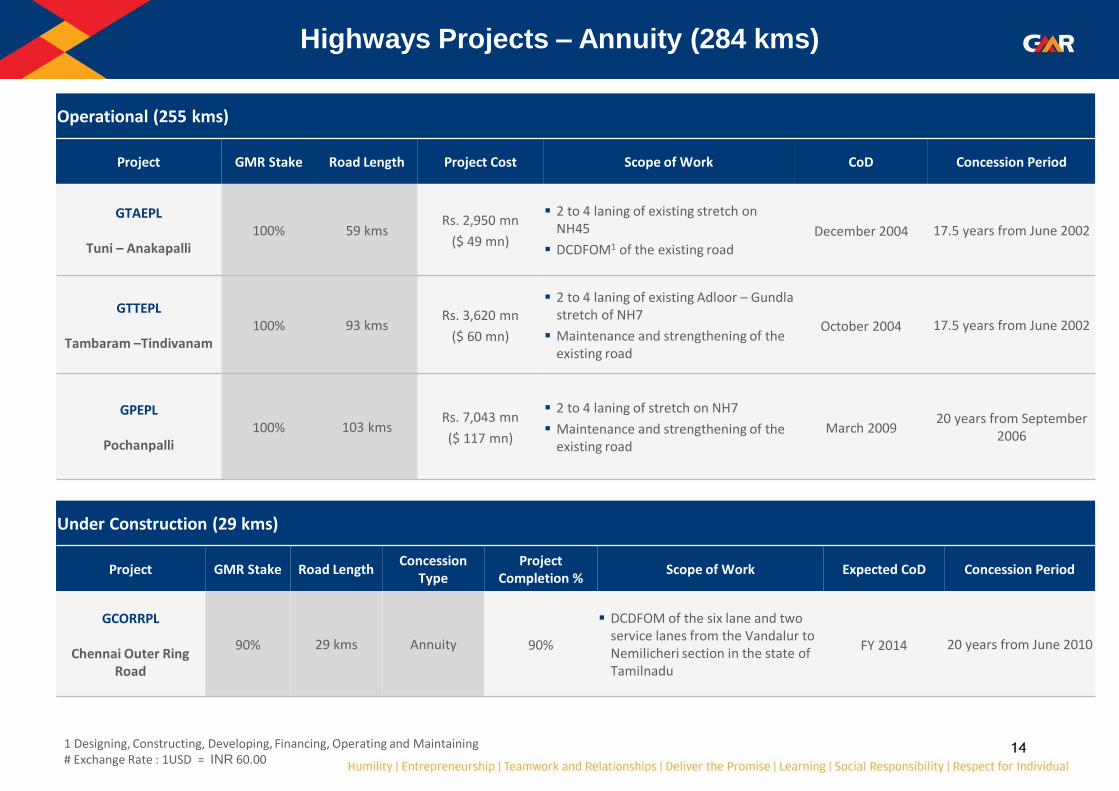
Operational (255 kms)
Project GMR Stake Road Length Project Cost Scope of Work CoD Concession Period
GTAEPL
Tuni – Anakapalli 100% 59 kms
Rs. 2,950 mn
($ 49 mn)
2 to 4 laning of existing stretch on NH45
DCDFOM1 of the existing road
December 2004 17.5 years from June 2002
GTTEPL
Tambaram –Tindivanam 100% 93 kms
Rs. 3,620 mn
($ 60 mn)
2 to 4 laning of existing Adloor – Gundla stretch of NH7
Maintenance and strengthening of the existing road
October 2004 17.5 years from June 2002
GPEPL
Pochanpalli 100% 103 kms
Rs. 7,043 mn
($ 117 mn)
2 to 4 laning of stretch on NH7
Maintenance and strengthening of the existing road
March 2009 20 years from September
2006
Highways Projects – Annuity (284 kms)
1 Designing, Constructing, Developing, Financing, Operating and Maintaining # Exchange Rate : 1USD = INR 60.00
Under Construction (29 kms)
Project GMR Stake Road Length Concession
Type Project
Completion % Scope of Work Expected CoD Concession Period
GCORRPL
Chennai Outer Ring Road
90% 29 kms Annuity 90%
DCDFOM of the six lane and two service lanes from the Vandalur to Nemilicheri section in the state of Tamilnadu
FY 2014 20 years from June 2010
15
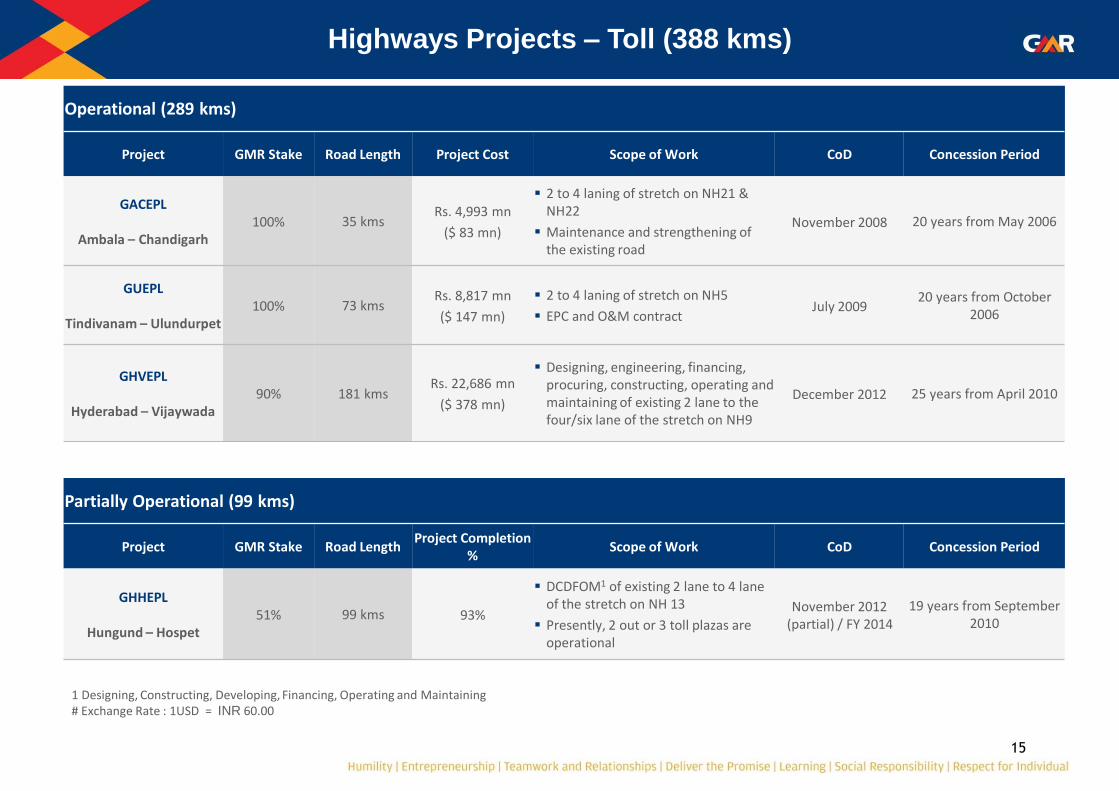
Operational (289 kms)
Project GMR Stake Road Length Project Cost Scope of Work CoD Concession Period
GACEPL
Ambala – Chandigarh 100% 35 kms
Rs. 4,993 mn
($ 83 mn)
2 to 4 laning of stretch on NH21 & NH22
Maintenance and strengthening of the existing road
November 2008 20 years from May 2006
GUEPL
Tindivanam – Ulundurpet 100% 73 kms
Rs. 8,817 mn
($ 147 mn)
2 to 4 laning of stretch on NH5
EPC and O&M contract July 2009
20 years from October 2006
GHVEPL
Hyderabad – Vijaywada 90% 181 kms
Rs. 22,686 mn
($ 378 mn)
Designing, engineering, financing, procuring, constructing, operating and maintaining of existing 2 lane to the four/six lane of the stretch on NH9
December 2012 25 years from April 2010
Highways Projects – Toll (388 kms)
1 Designing, Constructing, Developing, Financing, Operating and Maintaining # Exchange Rate : 1USD = INR 60.00
Partially Operational (99 kms)
Project GMR Stake Road Length Project Completion
% Scope of Work CoD Concession Period
GHHEPL
Hungund – Hospet 51% 99 kms 93%
DCDFOM1 of existing 2 lane to 4 lane of the stretch on NH 13
Presently, 2 out or 3 toll plazas are operational
November 2012 (partial) / FY 2014
19 years from September 2010
16
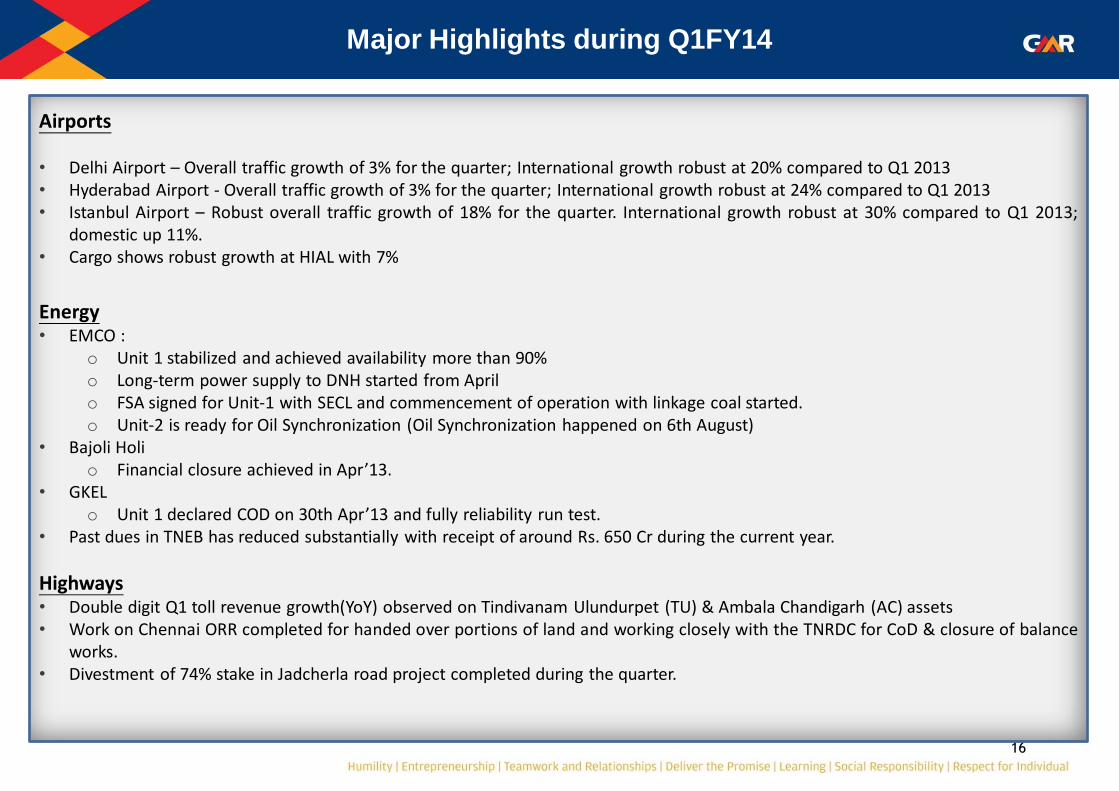
Airports
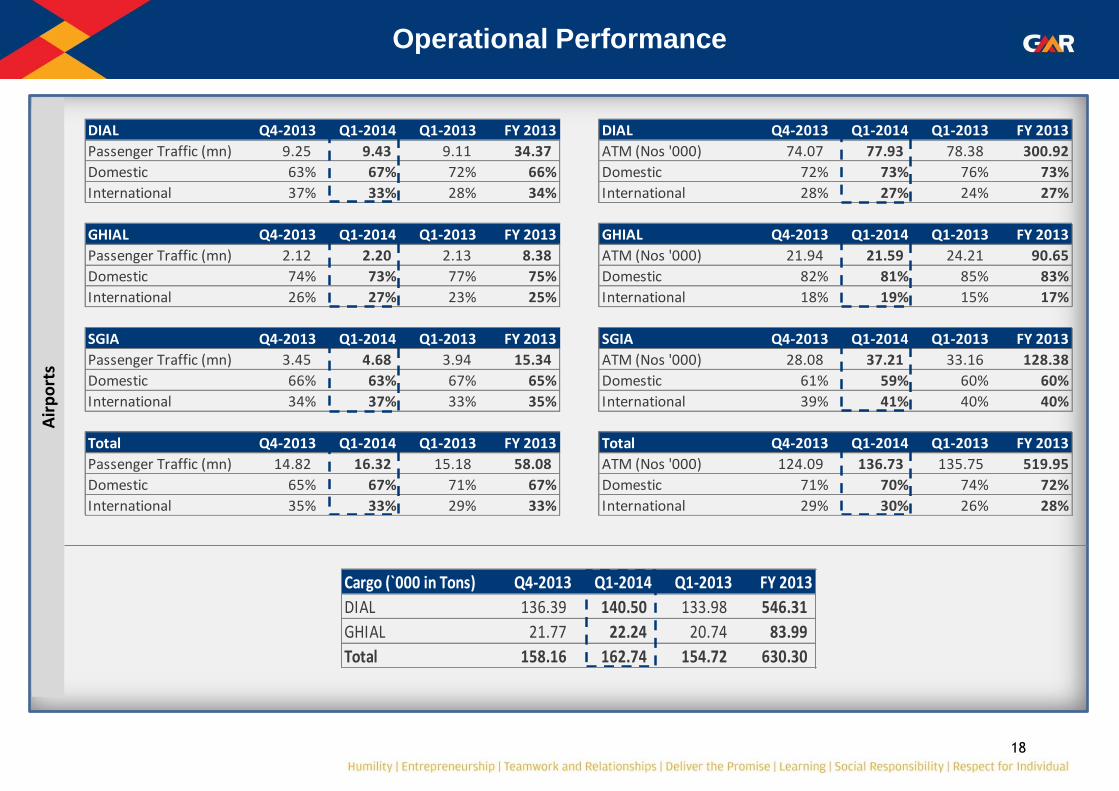
• Delhi Airport – Overall traffic growth of 3% for the quarter; International growth robust at 20% compared to Q1 2013 • Hyderabad Airport - Overall traffic growth of 3% for the quarter; International growth robust at 24% compared to Q1 2013 • Istanbul Airport – Robust overall traffic growth of 18% for the quarter. International growth robust at 30% compared to Q1 2013;
domestic up 11%. • Cargo shows robust growth at HIAL with 7%
Energy • EMCO :
o Unit 1 stabilized and achieved availability more than 90% o Long-term power supply to DNH started from April o FSA signed for Unit-1 with SECL and commencement of operation with linkage coal started. o Unit-2 is ready for Oil Synchronization (Oil Synchronization happened on 6th August)
• Bajoli Holi o Financial closure achieved in Apr’13.
• GKEL o Unit 1 declared COD on 30th Apr’13 and fully reliability run test.
• Past dues in TNEB has reduced substantially with receipt of around Rs. 650 Cr during the current year.
Highways • Double digit Q1 toll revenue growth(YoY) observed on Tindivanam Ulundurpet (TU) & Ambala Chandigarh (AC) assets • Work on Chennai ORR completed for handed over portions of land and working closely with the TNRDC for CoD & closure of balance
works. • Divestment of 74% stake in Jadcherla road project completed during the quarter.
Major Highlights during Q1FY14
17
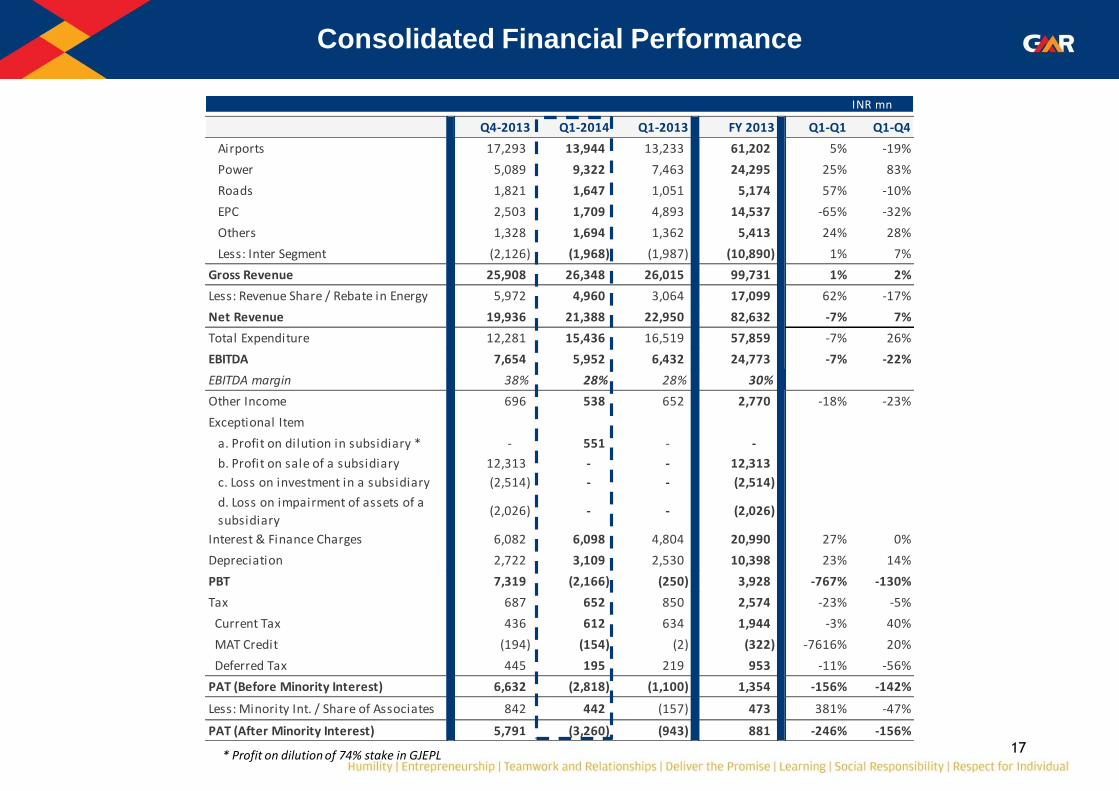
Consolidated Financial Performance
INR mn
Q4-2013 Q1-2014 Q1-2013 FY 2013 Q1-Q1 Q1-Q4
Airports 17,293 13,944 13,233 61,202 5% -19%
Power 5,089 9,322 7,463 24,295 25% 83%
Roads 1,821 1,647 1,051 5,174 57% -10%
EPC 2,503 1,709 4,893 14,537 -65% -32%
Others 1,328 1,694 1,362 5,413 24% 28%
Less: Inter Segment (2,126) (1,968) (1,987) (10,890) 1% 7%
Gross Revenue 25,908 26,348 26,015 99,731 1% 2%
Less: Revenue Share / Rebate in Energy 5,972 4,960 3,064 17,099 62% -17%
Net Revenue 19,936 21,388 22,950 82,632 -7% 7%
Total Expenditure 12,281 15,436 16,519 57,859 -7% 26%
EBITDA 7,654 5,952 6,432 24,773 -7% -22%
EBITDA margin 38% 28% 28% 30%
Other Income 696 538 652 2,770 -18% -23%
Exceptional Item
a. Profit on dilution in subsidiary * - 551 - -
b. Profit on sale of a subsidiary 12,313 - - 12,313
c. Loss on investment in a subsidiary (2,514) - - (2,514)
d. Loss on impairment of assets of a
subsidiary(2,026) - - (2,026)
Interest & Finance Charges 6,082 6,098 4,804 20,990 27% 0%
Depreciation 2,722 3,109 2,530 10,398 23% 14%
PBT 7,319 (2,166) (250) 3,928 -767% -130%
Tax 687 652 850 2,574 -23% -5%
Current Tax 436 612 634 1,944 -3% 40%
MAT Credit (194) (154) (2) (322) -7616% 20%
Deferred Tax 445 195 219 953 -11% -56%
PAT (Before Minority Interest) 6,632 (2,818) (1,100) 1,354 -156% -142%
Less: Minority Int. / Share of Associates 842 442 (157) 473 381% -47%
PAT (After Minority Interest) 5,791 (3,260) (943) 881 -246% -156%
* Profit on dilution of 74% stake in GJEPL
18
Operational Performance A
irp
ort
s
Cargo (`000 in Tons) Q4-2013 Q1-2014 Q1-2013 FY 2013
DIAL 136.39 140.50 133.98 546.31
GHIAL 21.77 22.24 20.74 83.99
Total 158.16 162.74 154.72 630.30
DIAL Q4-2013 Q1-2014 Q1-2013 FY 2013 DIAL Q4-2013 Q1-2014 Q1-2013 FY 2013
Passenger Traffic (mn) 9.25 9.43 9.11 34.37 ATM (Nos '000) 74.07 77.93 78.38 300.92
Domestic 63% 67% 72% 66% Domestic 72% 73% 76% 73%
International 37% 33% 28% 34% International 28% 27% 24% 27%
GHIAL Q4-2013 Q1-2014 Q1-2013 FY 2013 GHIAL Q4-2013 Q1-2014 Q1-2013 FY 2013
Passenger Traffic (mn) 2.12 2.20 2.13 8.38 ATM (Nos '000) 21.94 21.59 24.21 90.65
Domestic 74% 73% 77% 75% Domestic 82% 81% 85% 83%
International 26% 27% 23% 25% International 18% 19% 15% 17%
SGIA Q4-2013 Q1-2014 Q1-2013 FY 2013 SGIA Q4-2013 Q1-2014 Q1-2013 FY 2013
Passenger Traffic (mn) 3.45 4.68 3.94 15.34 ATM (Nos '000) 28.08 37.21 33.16 128.38
Domestic 66% 63% 67% 65% Domestic 61% 59% 60% 60%
International 34% 37% 33% 35% International 39% 41% 40% 40%
Total Q4-2013 Q1-2014 Q1-2013 FY 2013 Total Q4-2013 Q1-2014 Q1-2013 FY 2013
Passenger Traffic (mn) 14.82 16.32 15.18 58.08 ATM (Nos '000) 124.09 136.73 135.75 519.95
Domestic 65% 67% 71% 67% Domestic 71% 70% 74% 72%
International 35% 33% 29% 33% International 29% 30% 26% 28%
19
Hig
hw
ays
Ene
rgy
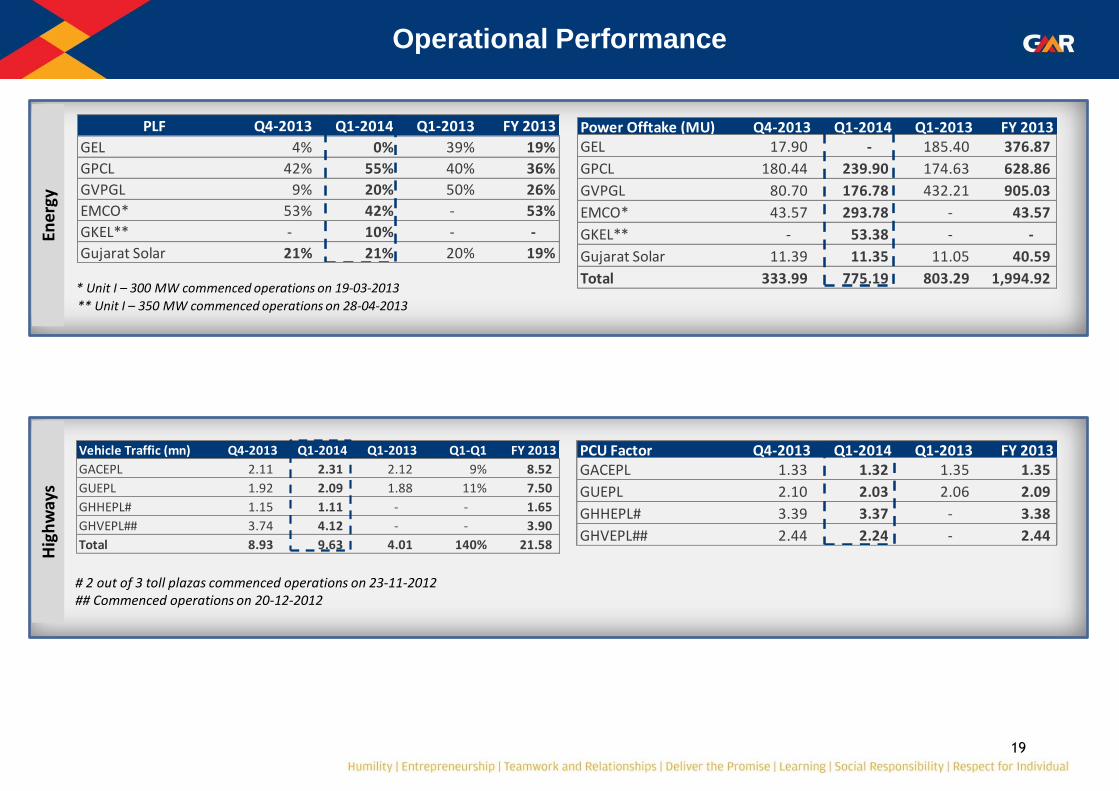
Operational Performance
PLF Q4-2013 Q1-2014 Q1-2013 FY 2013
GEL 4% 0% 39% 19%
GPCL 42% 55% 40% 36%
GVPGL 9% 20% 50% 26%
EMCO* 53% 42% - 53%
GKEL** - 10% - -
Gujarat Solar 21% 21% 20% 19%
* Unit I – 300 MW commenced operations on 19-03-2013
** Unit I – 350 MW commenced operations on 28-04-2013
# 2 out of 3 toll plazas commenced operations on 23-11-2012 ## Commenced operations on 20-12-2012
PCU Factor Q4-2013 Q1-2014 Q1-2013 FY 2013GACEPL 1.33 1.32 1.35 1.35
GUEPL 2.10 2.03 2.06 2.09
GHHEPL# 3.39 3.37 - 3.38
GHVEPL## 2.44 2.24 - 2.44
Power Offtake (MU) Q4-2013 Q1-2014 Q1-2013 FY 2013GEL 17.90 - 185.40 376.87
GPCL 180.44 239.90 174.63 628.86
GVPGL 80.70 176.78 432.21 905.03
EMCO* 43.57 293.78 - 43.57
GKEL** - 53.38 - -
Gujarat Solar 11.39 11.35 11.05 40.59
Total 333.99 775.19 803.29 1,994.92
Vehicle Traffic (mn) Q4-2013 Q1-2014 Q1-2013 Q1-Q1 FY 2013
GACEPL 2.11 2.31 2.12 9% 8.52
GUEPL 1.92 2.09 1.88 11% 7.50
GHHEPL# 1.15 1.11 - - 1.65
GHVEPL## 3.74 4.12 - - 3.90
Total 8.93 9.63 4.01 140% 21.58
20
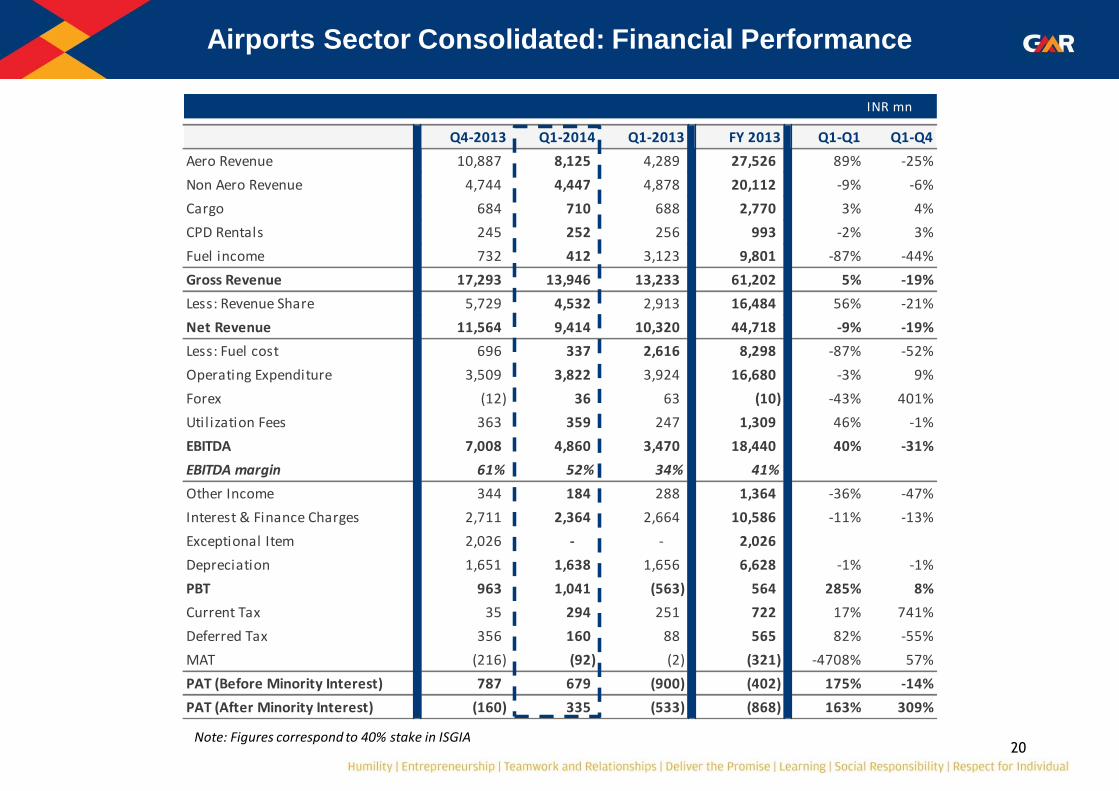
Airports Sector Consolidated: Financial Performance
Note: Figures correspond to 40% stake in ISGIA
INR mn
Q4-2013 Q1-2014 Q1-2013 FY 2013 Q1-Q1 Q1-Q4
Aero Revenue 10,887 8,125 4,289 27,526 89% -25%
Non Aero Revenue 4,744 4,447 4,878 20,112 -9% -6%
Cargo 684 710 688 2,770 3% 4%
CPD Rentals 245 252 256 993 -2% 3%
Fuel income 732 412 3,123 9,801 -87% -44%
Gross Revenue 17,293 13,946 13,233 61,202 5% -19%
Less: Revenue Share 5,729 4,532 2,913 16,484 56% -21%
Net Revenue 11,564 9,414 10,320 44,718 -9% -19%
Less: Fuel cost 696 337 2,616 8,298 -87% -52%
Operating Expenditure 3,509 3,822 3,924 16,680 -3% 9%
Forex (12) 36 63 (10) -43% 401%
Utilization Fees 363 359 247 1,309 46% -1%
EBITDA 7,008 4,860 3,470 18,440 40% -31%
EBITDA margin 61% 52% 34% 41%
Other Income 344 184 288 1,364 -36% -47%
Interest & Finance Charges 2,711 2,364 2,664 10,586 -11% -13%
Exceptional Item 2,026 - - 2,026
Depreciation 1,651 1,638 1,656 6,628 -1% -1%
PBT 963 1,041 (563) 564 285% 8%
Current Tax 35 294 251 722 17% 741%
Deferred Tax 356 160 88 565 82% -55%
MAT (216) (92) (2) (321) -4708% 57%
PAT (Before Minority Interest) 787 679 (900) (402) 175% -14%
PAT (After Minority Interest) (160) 335 (533) (868) 163% 309%
21
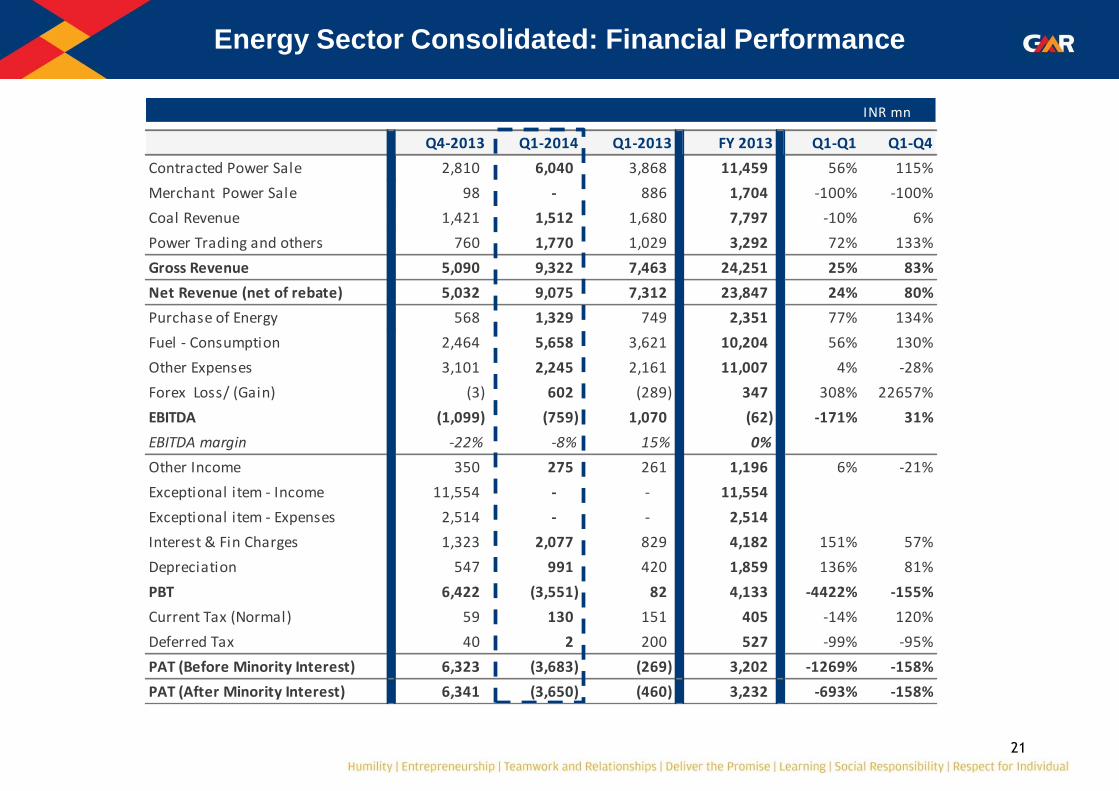
Energy Sector Consolidated: Financial Performance
INR mn
Q4-2013 Q1-2014 Q1-2013 FY 2013 Q1-Q1 Q1-Q4
Contracted Power Sale 2,810 6,040 3,868 11,459 56% 115%
Merchant Power Sale 98 - 886 1,704 -100% -100%
Coal Revenue 1,421 1,512 1,680 7,797 -10% 6%
Power Trading and others 760 1,770 1,029 3,292 72% 133%
Gross Revenue 5,090 9,322 7,463 24,251 25% 83%
Net Revenue (net of rebate) 5,032 9,075 7,312 23,847 24% 80%
Purchase of Energy 568 1,329 749 2,351 77% 134%
Fuel - Consumption 2,464 5,658 3,621 10,204 56% 130%
Other Expenses 3,101 2,245 2,161 11,007 4% -28%
Forex Loss/ (Gain) (3) 602 (289) 347 308% 22657%
EBITDA (1,099) (759) 1,070 (62) -171% 31%
EBITDA margin -22% -8% 15% 0%
Other Income 350 275 261 1,196 6% -21%
Exceptional item - Income 11,554 - - 11,554
Exceptional item - Expenses 2,514 - - 2,514
Interest & Fin Charges 1,323 2,077 829 4,182 151% 57%
Depreciation 547 991 420 1,859 136% 81%
PBT 6,422 (3,551) 82 4,133 -4422% -155%
Current Tax (Normal) 59 130 151 405 -14% 120%
Deferred Tax 40 2 200 527 -99% -95%
PAT (Before Minority Interest) 6,323 (3,683) (269) 3,202 -1269% -158%
PAT (After Minority Interest) 6,341 (3,650) (460) 3,232 -693% -158%

22
Highways Sector Consolidated: Financial Performance
INR mn
Q4-2013 Q1-2014 Q1-2013 FY 2013 Q1-Q1 Q1-Q4
Annuity Revenue 617 619 618 2,485 0% 0%
Toll Revenue 1,204 1,028 433 2,688 137% -15%
Gross Revenue 1,820 1,647 1,051 5,174 57% -10%
Less: Revenue Share 186 181 - 211 0% -3%
Net Revenue 1,635 1,466 1,051 4,963 40% -10%
Operating Expenses 534 344 189 1,074 82% -36%
EBITDA 1,100 1,122 862 3,888 30% 2%
EBITDA margin 67% 77% 82% 78%
Other Income 91 116 109 420 7% 27%
Exceptional Item-Income - 413 - -
Interest & Finance Charges 1,420 1,314 636 3,697 107% -7%
Depreciation 409 364 346 1,478 5% -11%
PBT (637) (28) (11) (866) -150% 96%
Current Tax (21) 89 37 99 140% 517%
Deferred Tax (7) (0) 1 3 -100% 100%
PAT (Before Minority Interest) (609) (117) (49) (968) -136% 81%
PAT (After Minority Interest) (561) (105) (83) (954) -27% 81%
23
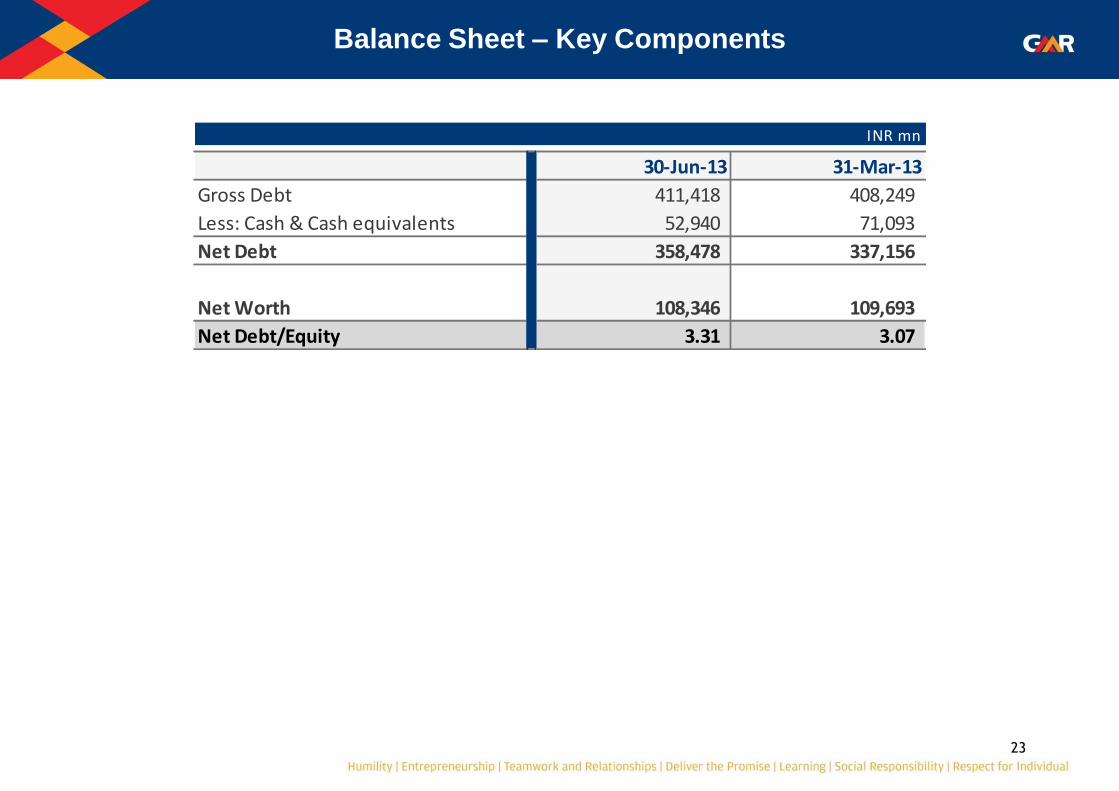
Balance Sheet – Key Components
INR mn
30-Jun-13 31-Mar-13
Gross Debt 411,418 408,249
Less: Cash & Cash equivalents 52,940 71,093
Net Debt 358,478 337,156
Net Worth 108,346 109,693
Net Debt/Equity 3.31 3.07
24
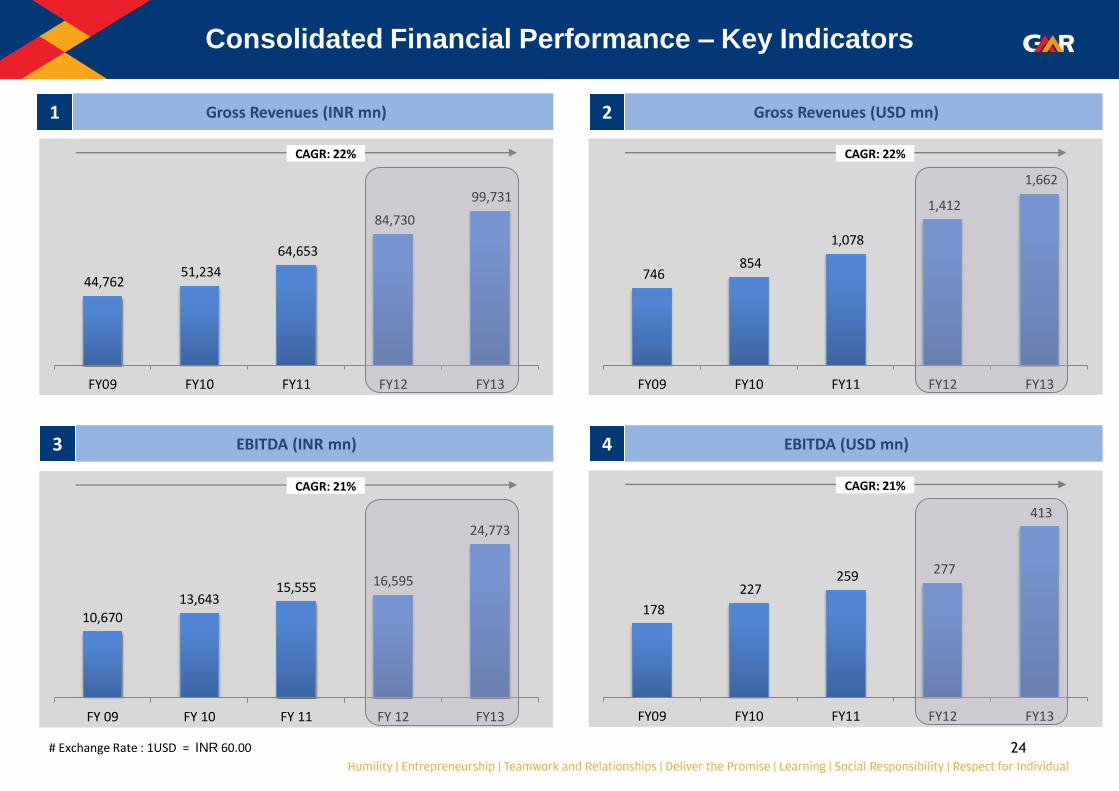
Consolidated Financial Performance – Key Indicators
EBITDA (INR mn) 3
Gross Revenues (INR mn) 1
EBITDA (USD mn) 4
Gross Revenues (USD mn) 2
# Exchange Rate : 1USD = INR 60.00
44,762 51,234
64,653
84,730
99,731
FY09 FY10 FY11 FY12 FY13
CAGR: 22%
10,670
13,643 15,555 16,595
24,773
FY 09 FY 10 FY 11 FY 12 FY13
CAGR: 21%
746 854
1,078
1,412
1,662
FY09 FY10 FY11 FY12 FY13
CAGR: 22%
178
227 259 277
413
FY09 FY10 FY11 FY12 FY13
CAGR: 21%