Embed Size (px)
Citation preview
Physiological and molecular features of
glucocorticoid actions in the gastrointestinal tract
Dissertation
for the award of the degree “Doctor rerum naturalium (Dr.rer.nat.)”
of the Georg-August-University Göttingen
within the doctoral program “Molecular Medicine”
submitted by Sybille Dorothee Reichardt, née Putzien
born in Esslingen, Germany
Göttingen, 2015

Thesis Committee
Prof. Dr. Martin Oppermann (Supervisor, First Referee) Institute for Cellular and Molecular Immunology University Medical Center Göttingen
Prof. Dr. Matthias Dobbelstein (Second Referee) Institute for Molecular Oncology University Medical Center Göttingen
PD. Dr. Fred Lühder Department of Neuroimmunology University Medical Center Göttingen
Additional members of the examination board
Prof. Dr. Heidi Hahn Institute of Human Genetics University Medical Center Göttingen
Prof. Dr. Hubertus Jarry Department of Clinical and Experimental Endocrinology University Medical Center Göttingen
Prof. Dr. Lutz Walter Department of Primate Genetics German Primate Center, Göttingen Day of oral examination: March 24
th 2015
Declaration
I hereby declare that the work presented in this thesis represents original work
carried out by the author and has not been submitted in any form to any other
university. It was written independently and with no other sources and aids than
quoted.
Göttingen, Germany Sybille D. Reichardt

For my family
“There is nothing perfect...only life.”
― Sue Monk Kidd, The Secret Life of Bees

Parts of this work have been published in the following article:
Reichardt, S.D., Weinhage, T., Rotte, A., Föller, M., Oppermann, M., Lühder, F.,
Tuckermann, J.P., Lang, F., van den Brandt, J., and Reichardt, H.M. (2014).
Glucocorticoids induce gastroparesis through depletion of L-arginine.
Endocrinology 155, 3899-908.
TABLE OF CONTENTS
Table of contents
1. Introduction .....................................................................................................1
1.1 Glucocorticoids .........................................................................................1
1.1.1 Synthesis of endogenous glucocorticoids .............................................1
1.1.2 Structure and function of the glucocorticoid receptor ............................1
1.1.3 Beneficial and adverse effects of GCs ..................................................5
1.1.4 Insights from animal models .................................................................6
1.2 The stomach ..............................................................................................7
1.2.1 Anatomy of the stomach .......................................................................8
1.2.2 The movement of the stomach .............................................................9
1.2.3 Gastric emptying and gastroparesis ................................................... 11
1.2.4 Effects of GCs on the stomach ........................................................... 13
1.3 Properties and functions of NO ............................................................. 14
1.3.1 NO as a signaling molecule ................................................................ 14
1.3.1 NO synthesis ...................................................................................... 15
1.3.2 Role of NO in gastric motility .............................................................. 17
1.4 Aim of the study ...................................................................................... 18
2. Material and Methods ................................................................................... 19
2.1 Materials................................................................................................... 19
2.1.1 General equipment ............................................................................. 19
2.1.2 Consumables ...................................................................................... 20
2.1.3 Chemicals and Reagents.................................................................... 21
2.1.4 Buffers and Solutions.......................................................................... 23
2.1.5 Antibodies for Western Blot ................................................................ 24
2.1.6 Commercial assays ............................................................................ 25
2.1.7 Oligonucleotides ................................................................................. 25
2.1.8 Mice .................................................................................................... 26
2.1.9 Software ............................................................................................. 27
TABLE OF CONTENTS
2.2 Methods ................................................................................................... 28
2.2.1 Animal experimentation ...................................................................... 28
2.2.1.1 Experimental protocols ................................................................. 28
2.2.1.2 Physiological parameters ............................................................. 28
2.2.1.3 Gastric emptying .......................................................................... 29
2.2.2 Molecular biological methods ............................................................. 30
2.2.2.1 Isolation of total RNA from tissue samples ................................... 30
2.2.2.2 Reverse transcription of RNA ....................................................... 31
2.2.2.3 Polymerase chain reaction ........................................................... 31
2.2.2.4 Agarose Gel Electrophoresis ....................................................... 32
2.2.2.5 Quantitative RT-PCR ................................................................... 32
2.2.3 Biochemical Methods ......................................................................... 33
2.2.3.1 Preparation of protein lysates from tissue samples ...................... 33
2.2.3.2 Measurement of protein concentration ......................................... 33
2.2.3.3 Polyacrylamide Gel Electrophoresis............................................. 33
2.2.3.4 Western Blot Analysis .................................................................. 34
2.2.4 Statistical analysis .............................................................................. 34
3. Results ........................................................................................................... 35
3.1 Oral administration of GCs induces gastroparesis .............................. 35
3.1.1 High-dose Dex treatment causes an enlargement of the stomach ..... 35
3.1.2 Dex administration impairs gastric emptying ...................................... 37
3.1.3 Increase in stomach weight induced by Dex is dose-dependent ........ 38
3.2 Target organ of GC-induced gastroparesis .......................................... 39
3.2.1 Gastroparesis is preserved in GRvillinCre mice ...................................... 39
3.3 Molecular mechanism of GC-induced gastroparesis ........................... 40
3.3.1 GC treatment of GRdim mice does not induce gastroparesis ............... 40
3.3.2 GC-induced gastric acid secretion does not influence gastroparesis . 42
3.4 The role of macrophages in gastroparesis induction by GCs ............ 44
3.4.1 Dex-treatment results in altered macrophage polarization ................. 44
3.4.2 Altered macrophage polarization is not related to gastroparesis ........ 47
3.5. Role of genes specifically expressed in the gastrointestinal tract .... 49
TABLE OF CONTENTS
3.6. Role of genes related to the regulation of gastric motility ................. 50
3.6.1 Expression of kallikrein 1, lipocalin 2 and arginase 2 in the stomach . 50
3.6.2 Role of Lcn2 in gastric motility ............................................................ 51
3.6.3 Role of Arg2 in gastroparesis ............................................................. 53
3.6.3.1 Regulation of genes related to NO production ............................. 53
3.6.3.2 Regulation of Arg2 at the protein level ......................................... 55
3.6.3.3 L-arginine supplementation prevents GC-induced gastroparesis . 56
3.6.3.4 Inhibition of Arg2 only partially restores gastric emptying ............ 59
4. Discussion .................................................................................................... 61
4.1 Adverse effects of glucocorticoids in the gastrointestinal tract ......... 61
4.2 The molecular mechanism of GCs in gastroparesis ............................ 63
4.3 The anti-emetic effect of GCs ................................................................. 65
5. Summary ....................................................................................................... 67
6. References .................................................................................................... 68
7. Appendices ................................................................................................... 76
7.1 List of abbreviations ............................................................................... 76
7.2 List of figures .......................................................................................... 77
7.4 Curriculum vitae ...................................................................................... 80

INTRODUCTION
1
1. Introduction
1.1 Glucocorticoids
1.1.1 Synthesis of endogenous glucocorticoids
Cortisol was first isolated from extracts of the adrenal gland independently in the
laboratories of Dr. E.C. Kendall and Dr. T. Reichstein as Compound E and Sub-
stance FA, respectively. The synthesis of endogenous glucocorticoids (GCs) is
tightly regulated by the hypothalamus-pituitary-adrenal axis (HPA axis), which
consists of the paraventricular nucleus (PVN) located in the hypothalamus of the
brain, the anterior pituitary and the adrenal glands.
Stimulation of the PVN in the hypothalamus in response either to stress, physical
activity, inflammation or the circadian rhythm leads to the secretion of corticotro-
pin-releasing-hormone (CRH), which in turn, stimulates the release of adrenocor-
ticotropin hormone (ACTH) from the anterior pituitary into the circulating blood-
stream. Upon reaching the adrenal glands, ACTH then induces the synthesis
and release of GCs.
The activity of HPA axis is mainly controlled by the central nervous system but
also by other mechanisms including cytokines (Mulla and Buckingham, 1999). In
addition, GCs regulate their homeostasis through a negative feedback loop that
regulates the HPA axis on the level of the anterior pituitary and the hypothala-
mus (Webster and Sternberg, 2004; Webster et al., 2002).
1.1.2 Structure and function of the glucocorticoid receptor
Endogenous GCs play an important role in the regulation of metabolic, homeo-
static, immunological and developmental processes. Both, endogenous GCs like
cortisol and synthetic GCs like dexamethasone exert their function through bind-
ing to the glucocorticoid receptor (GR).
INTRODUCTION
2
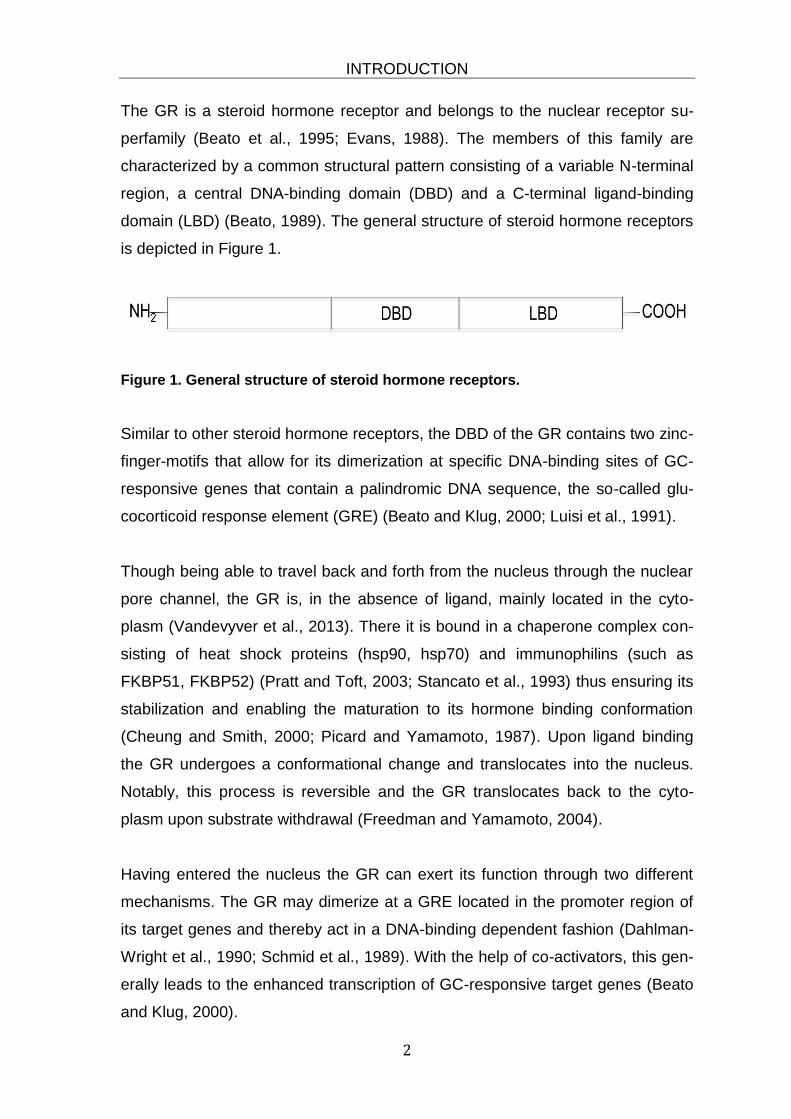
The GR is a steroid hormone receptor and belongs to the nuclear receptor su-
perfamily (Beato et al., 1995; Evans, 1988). The members of this family are
characterized by a common structural pattern consisting of a variable N-terminal
region, a central DNA-binding domain (DBD) and a C-terminal ligand-binding
domain (LBD) (Beato, 1989). The general structure of steroid hormone receptors
is depicted in Figure 1.
Figure 1. General structure of steroid hormone receptors.
Similar to other steroid hormone receptors, the DBD of the GR contains two zinc-
finger-motifs that allow for its dimerization at specific DNA-binding sites of GC-
responsive genes that contain a palindromic DNA sequence, the so-called glu-
cocorticoid response element (GRE) (Beato and Klug, 2000; Luisi et al., 1991).
Though being able to travel back and forth from the nucleus through the nuclear
pore channel, the GR is, in the absence of ligand, mainly located in the cyto-
plasm (Vandevyver et al., 2013). There it is bound in a chaperone complex con-
sisting of heat shock proteins (hsp90, hsp70) and immunophilins (such as
FKBP51, FKBP52) (Pratt and Toft, 2003; Stancato et al., 1993) thus ensuring its
stabilization and enabling the maturation to its hormone binding conformation
(Cheung and Smith, 2000; Picard and Yamamoto, 1987). Upon ligand binding
the GR undergoes a conformational change and translocates into the nucleus.
Notably, this process is reversible and the GR translocates back to the cyto-
plasm upon substrate withdrawal (Freedman and Yamamoto, 2004).
Having entered the nucleus the GR can exert its function through two different
mechanisms. The GR may dimerize at a GRE located in the promoter region of
its target genes and thereby act in a DNA-binding dependent fashion (Dahlman-
Wright et al., 1990; Schmid et al., 1989). With the help of co-activators, this gen-
erally leads to the enhanced transcription of GC-responsive target genes (Beato
and Klug, 2000).
INTRODUCTION
3
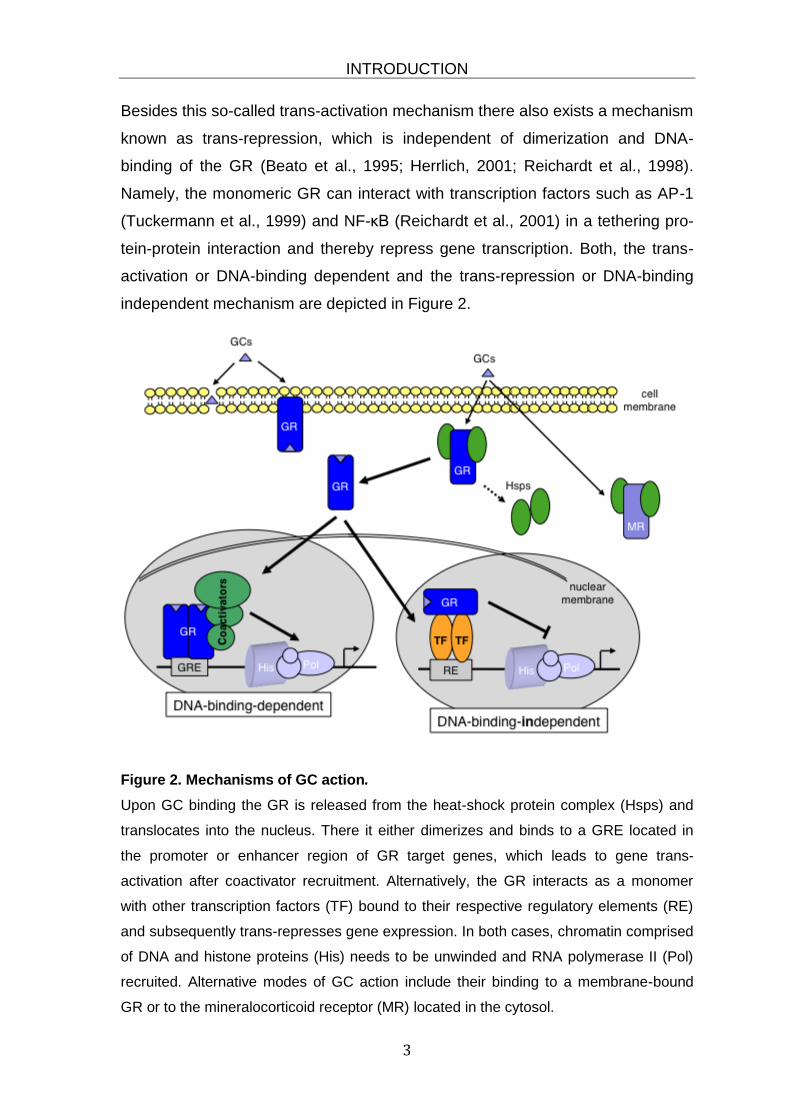
Besides this so-called trans-activation mechanism there also exists a mechanism
known as trans-repression, which is independent of dimerization and DNA-
binding of the GR (Beato et al., 1995; Herrlich, 2001; Reichardt et al., 1998).
Namely, the monomeric GR can interact with transcription factors such as AP-1
(Tuckermann et al., 1999) and NF-κB (Reichardt et al., 2001) in a tethering pro-
tein-protein interaction and thereby repress gene transcription. Both, the trans-
activation or DNA-binding dependent and the trans-repression or DNA-binding
independent mechanism are depicted in Figure 2.
Figure 2. Mechanisms of GC action.
Upon GC binding the GR is released from the heat-shock protein complex (Hsps) and
translocates into the nucleus. There it either dimerizes and binds to a GRE located in
the promoter or enhancer region of GR target genes, which leads to gene trans-
activation after coactivator recruitment. Alternatively, the GR interacts as a monomer
with other transcription factors (TF) bound to their respective regulatory elements (RE)
and subsequently trans-represses gene expression. In both cases, chromatin comprised
of DNA and histone proteins (His) needs to be unwinded and RNA polymerase II (Pol)
recruited. Alternative modes of GC action include their binding to a membrane-bound
GR or to the mineralocorticoid receptor (MR) located in the cytosol.
INTRODUCTION
4
Apart from the two aforementioned mechanisms that require the translocation of
the GR from the cytoplasm into the nucleus followed by the assembly of a tran-
scriptional complex and the initiation of gene expression (Cato et al., 2002),
there also exist more rapid effects of GCs that are commonly referred to as non-
genomic GC effects. They can either be mediated by the cytosolic GR or they
may even occur at the level of the plasma membrane.
In the first case proteins that are released upon ligand binding from the dissem-
bling heteromeric complex including Src have been found to be responsible for
rapid GC effects through activation of signalling pathways such as the MAPK-
pathway (Croxtall et al., 2000). In the second case, rapid GC effects result from
the interaction of GCs with membrane-associated proteins. It has been speculat-
ed that a membrane-bound form of the GR may exist and mediate some of the
non-genomic activities of GCs. However, evidence for such a mechanism is still
scarce.
Due to their lipophilic character GCs can easily attach to lipophilic membranes as
well. Hence, besides acting though membrane-proteins GCs can influence the
regulation of ion channels and interfere with intracellular calcium mobilization
(Buttgereit and Scheffold, 2002; Stahn et al., 2007).
Finally, it is noteworthy that the GR is not the only receptor that is able to medi-
ate physiological effects of GCs. There is also the mineralocorticoid receptor
(MR) that can bind GCs thereby leading to the initiation of transcription. Howev-
er, the MR is expressed in only a limited number of tissues and, in addition, bind-
ing of GCs to the MR in some tissues is prevented by a pre-receptor mechanism.
Thus, GC effects mediated via the MR are largely restricted to the hippocampus
and macrophages (Lim et al., 2007).
INTRODUCTION
5
1.1.3 Beneficial and adverse effects of GCs
Ever since their first successful isolation and the subsequent discovery of their
potent anti-inflammatory properties by applying cortisol to a patient with rheuma-
toid arthritis (RA) in the year 1948, GCs have been the gold standard in the
treatment of many inflammatory diseases, such as RA (Kirwan and Power,
2007), asthma (Adcock and Barnes, 2008) and inflammatory bowel disease
(IBD) (Ford et al., 2011; Pithadia and Jain, 2011).
Besides their potent anti-inflammatory properties, GCs are also involved in the
regulation of multiple non-immunological processes including the control of vari-
ous metabolic, homeostatic, cardiovascular and developmental functions. Being
expressed in almost every cell type the GR influences and controls multiple sig-
nalling pathways. Hence, when GCs are pharmacologically applied during anti-
inflammatory therapy, this pleiotropy can cause a plethora of potentially serious
adverse effects.
In particular, the gastrointestinal tract is an example for the dichotomy of GC ac-
tion. On the one hand, GCs have been the mainstay in the treatment inflammato-
ry disorders of the bowel such as ulcerative colitis (UC) and Crohn´s disease
(CD) for over 50 years. On the other hand, it became more and more evident
that prolonged application of GCs results in sometimes severe adverse effects
such as hypertension, diabetes (Rose and Herzig, 2013), osteoporosis (Rauch et
al., 2010) and the formation of peptic ulcers due to enhanced production of gas-
tric acid (Sandu et al., 2007; Schubert, 2008). Especially orally administered GCs
at high dose frequently cause pronounced gastrointestinal symptoms (Sellebjerg
et al., 1998). Nevertheless, oral application of steroids can often be advanta-
geous to the exhausting and costly intravenous therapy (Burton et al., 2012).
Then again, GCs are also known to possess anti-emetic properties and are wide-
ly used as a means to attenuate nausea and vomiting during chemotherapy alt-
hough the underlying mechanisms remain unclear, so far (Tanihata et al., 2004).
Taking into consideration that oral GCs are prescribed about 10 million times in
the USA each year (Schäcke et al., 2002) and that there has been a continuous
INTRODUCTION
6
increase in GC prescriptions, it appears to be vital to make efforts to further elu-
cidate the mechanistic details of GC action.
1.1.4 Insights from animal models
Multiple efforts have been made during the last two decades to mechanistically
dissect the side-effects of GCs from their beneficial activities. Most anti-
inflammatory effects are being thought to be a consequence of inhibition of proin-
flammatory transcription factors and therefore mediated by the trans-repression
mechanism of the GR. In contrast, many adverse effects, for instance those re-
sulting from the induction of genes involved in glucose or protein metabolism, are
mediated through trans-activation (De Bosscher and Haegeman, 2009).
To further investigate the molecular mechanism and function of the GR, several
mutant mouse models have been developed. The first one was a strain of ubiqui-
tous knock-out mice lacking the GR in all cell types. The mutants were found to
die shortly after birth due to respiratory failure (Cole et al., 1995), indicating that
GCs play a pivotal role during embryonic development. However, they weren’t
suitable for further studying the mode of action of GCs in adult mice.
By contrast, mice carrying the A458T point mutation in the second zinc finger of
the DBD turned out to be viable and present a very useful model to discriminate
between the trans-activation and the trans-repression mechanism of the GR
(Reichardt et al., 1998). These so-called GRdim mice have an impaired dimeriza-
tion capacity and therefore reduced GR-induced trans-activation of genes. In
contrast, trans-repression through interaction with other transcription factors is
still intact. With the help of the GRdim mice it could be shown that the therapeutic
efficacy of GCs in various disease models requires different molecular mecha-
nisms. In a mouse model of irritative skin inflammation for example DNA-binding
of the GR was not required for GC therapy. Contrariwise, it has been found that
in a murine model of rheumatoid arthritis, dimerization of the GR was essential
for GC therapy (Baschant et al., 2011). The same is true for the supression of
septic shock by endogenous GCs in mice (Kleiman et al., 2012). With regard to
INTRODUCTION
7
common side-effects of GCs, results obtained in GRdim mice weren’t unequivocal
as well. Induction of muscle atrophy for example was abolished in GRdim mice
and hence requires the DNA-binding function of the GR (Waddell et al., 2008),
whereas GC-induced osteoporosis occurs normally in GRdim mice (Rauch et al.,
2010). Consequently, adverse effects of GCs also involve various and complex
mechanisms making their separation from the desired therapeutic effect a diffi-
cult task.
To determine the different cell types targeted by GCs, mouse models with cell
type-specific depletions of the GR were developed. With the help of GRlckCre
mice, which lack the GR in the entire T cell-lineage (Baumann et al., 2005), it
could be shown that therapeutic efficacy of GCs in experimental autoimmune
encephalomyelitis (EAE), a rodent model of multiple sclerosis (MS), mainly de-
pends on the repression of T cell function (Schweingruber et al., 2012; Wüst et
al., 2008). In contrast, analysis of GRlysMCre mice led to the conclusion that mye-
loid cells are the major target cells of GCs in contact dermatitis (Tuckermann et
al., 2007).
GRvillinCre mice that specifically lack the GR in enterocytes of the intestinal tract
(Madison et al., 2002) were used to tackle the question whether regulation of
glucose uptake in the gut by GCs contributed to the development of hyperglyce-
mia as one major side effect of GC therapy. Here it could be shown that the GR
in enterocytes was indeed responsible for enhanced intestinal glucose transport
mediated by transcriptional regulation of target genes via a dimerization depend-
ent mechanism (Reichardt et al., 2012).
Taken together, the aforementioned studies made it clear that the concept of
separating beneficial from adverse GC effects on the basis of the dependency on
trans-activation versus trans-repression may not be entirely true and require fur-
ther study.
1.2 The stomach

INTRODUCTION
8
1.2.1 Anatomy of the stomach
The stomach is part of the digestive system and located in the upper half of the
abdomen between the esophagus and the small intestine next to liver and
spleen. It can be divided into four regions, namely the cardia, the fundus, the
corpus or body and the pyloric antrum (Figure 3). Food enters the stomach
through the esophagus into the cardia via the cardiac or lower esophagus
sphincter. The central part of the stomach, the corpus or body is the place were
chemical digestion takes place and the mixture of predigested food, the so-called
chyme is transported to the lower portion of the stomach, the pyloric antrum
where it leaves the stomach through the pyloric sphincter to enter the duodenum.
Located at the uppermost part of the stomach lies the fundus. Due to its ability to
relax and expand it can accommodate excessive food and provide space for the
gas produced during digestion, therefore preventing an increase in intragastric
pressure. Gastric folds or rugae in the inner wall of the stomach allow for expan-
sion of its surface when needed. In order to protect the stomach against gastric
juices that are produced during the digestion process and which mainly consist
of hydrochloric acid and pepsins, its inside is protected by mucus.
The stomach wall itself consists of four layers, the innermost being called the
mucosa followed by the submucosa, the muscularis externa and the serosa. To-
wards the lumen the mucosa is lined with epithelial cells. Loose connective tis-
sue, the lamina propria seperates the epithelium from a smooth muscle layer
beneath. The submucosa consists of connective tissue and is surrounded by the
muscular wall of the stomach that comprises three layers of muscular tissue.
First, the inner oblique layer that mechanically breaks up the food by churning.
Second, a circular layer that prevents the backward movement of the chyme by
creating circular contractions. Third, the longitudinal layer that ensures the for-
ward movement of the stomach content.
Essential for the transportation of food through the stomach to the duodenum are
contractive movements of the gastric muscles. The so-called peristalsis consists
of permanent contraction and relaxation of the gastric smooth muscle layer to
produce a wavelike movement.
INTRODUCTION
9
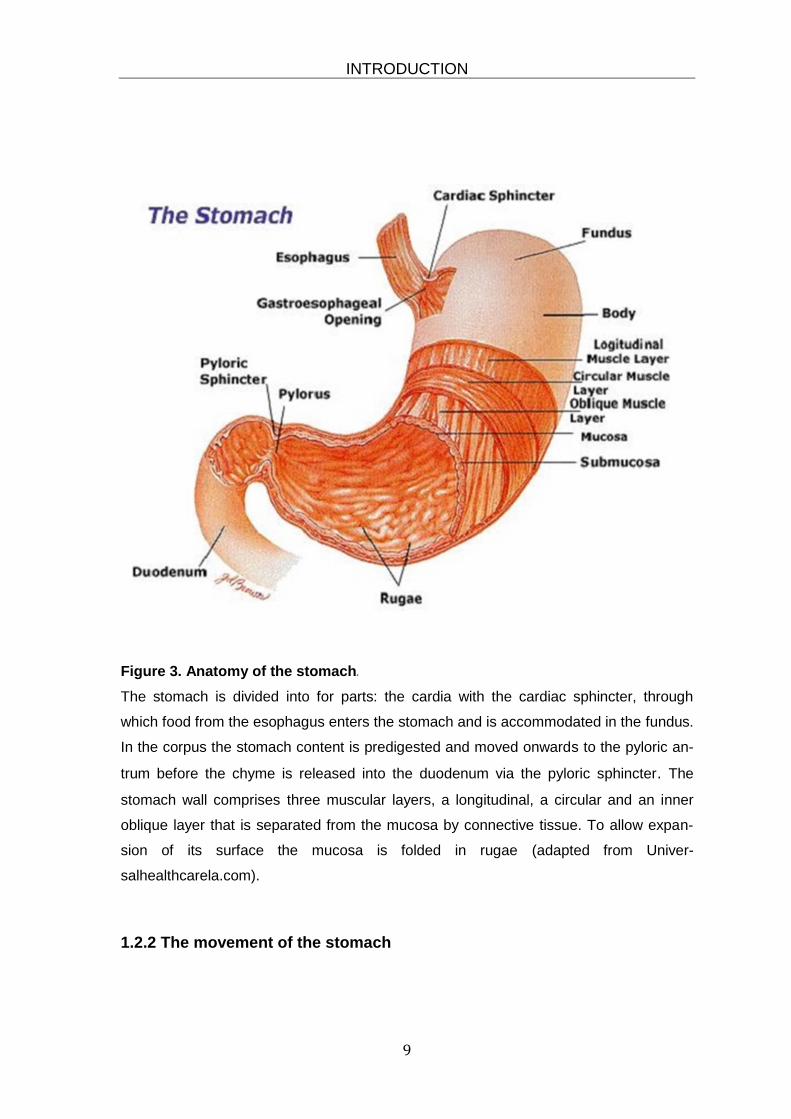
Figure 3. Anatomy of the stomach.
The stomach is divided into for parts: the cardia with the cardiac sphincter, through
which food from the esophagus enters the stomach and is accommodated in the fundus.
In the corpus the stomach content is predigested and moved onwards to the pyloric an-
trum before the chyme is released into the duodenum via the pyloric sphincter. The
stomach wall comprises three muscular layers, a longitudinal, a circular and an inner
oblique layer that is separated from the mucosa by connective tissue. To allow expan-
sion of its surface the mucosa is folded in rugae (adapted from Univer-
salhealthcarela.com).
1.2.2 The movement of the stomach

INTRODUCTION
10
Since the time of Galenos, a Greek physician and scientist living in the second
century AD, it remained unclear until the 19th century how the movements of the
stomach exactly come to pass. Galenos was the first to divide the stomach into
four parts and to assign to them the different functions of reception and accom-
modation of food followed by its digestion and passing on of the modified content
into the small intestine (Claudii Galeni opera omnia, Kühn, 1822). It was long
believed that the pylorus being a gatekeeper was the crucial player in all the
functions of the stomach, ranging from retaining the food, digesting it and finally
releasing it into the duodenum.
In the middle of the 18th century in his opus “elementa physiologiae corporis hu-
mani” Albrecht von Haller defined the movements of the stomach as an alterna-
tion between relaxation and contraction in longitudinal or transverse compres-
sions so that the stomach content is shifted around until either the cardia or the
pylorus opens. In the first case food is expelled from the stomach by vomiting
whereas in the latter case the chyme enters into the duodenum. Notably, either
procedure, the expulsion of stomach contents by vomiting or its transfer to the
small intestine, requires a controlled movement of the gastric muscles.
In the years between 1822 and 1833, William Beaumont, an US army surgeon,
performed experiments on digestion on his patient Alexis St. Martin who lived
with a permanent gastric fistula since when he had recovered from a gunshot in
his side. By inserting a tube into the lateral hole of his patient, he was able to
deduce the motions of the stomach muscles from the movements of the tube.
In the late 19th century W.B. Cannon decided to further investigate gastric motion
with the help of roentgen rays. He therefore mixed food with bismuth oxynitrate
and after feeding this mixture to cats he detected the movement of this mass
through the stomach by roentgen rays. Using this method he could confirm the
earlier findings, namely that the stomach content is mixed and passed forward by
constriction waves continually arising and subsiding in the pyloric part of the
stomach whereas the function of the fundus is primarily the accommodation of
food. Nevertheless, the astonishing new finding was the impact of strong emo-
INTRODUCTION
11
tions on gastric peristalsis. Because Cannon had to immobilize the cats during
the entire procedure and since male animals didn’t tolerate this measure calmly,
he observed that strong emotions completely inhibit the motoric gastric function.
Having made this observation he performed several other experiments in which
he distressed the animals for a brief period of time thus causing the constriction
waves to subside. By stroking the animal reassuringly the stomach movements
immediately set in again thus proving the extent of nervous influence on gastric
motility (Cannon, 1898).
Today it is known that stomach motility is mainly controlled by an autonomic
nervous system consisting of an extrinsic (i.e. the vagus nerve) and intrinsic (i.e.
the enteric nervous system) innervation pathways (Olsson and Holmgren, 2001).
1.2.3 Gastric emptying and gastroparesis
Gastric emptying is a process that normally takes place without noticing. If food
enters the stomach a variety of signals regulate the process of gastric emptying
that begins with the adaptive accommodation reflex which enables the intake of
food without increasing intragastric pressure (Cannon and Lieb, 1911). This is
followed by trituration and digestion of the stomach content to produce chyme
that is then released through the pyloric sphincter into the small intestine.
To ensure proper functioning of this complex procedure the gut is equipped with
an intrinsic nervous system that is located in the lining of the gastrointestinal
tract. The neurons of the enteric nervous system (ENS) are collected into the
myenteric plexus located in the muscularis externa and the submucosal plexus.
Capable of local and autonomous functioning the ENS continuously exchanges
information back and forth with the central nervous system (CNS) thus control-
ling the digestive process (Furness, 2006; Gershon, 2005).
The peristalsis of the stomach is a prerequisit for proper gastric emptying. The
wave-like movement of the stomach results from excitatory and inhibitory signals
that alternately induce contraction and relaxation of the gastric muscles and in-
INTRODUCTION
12
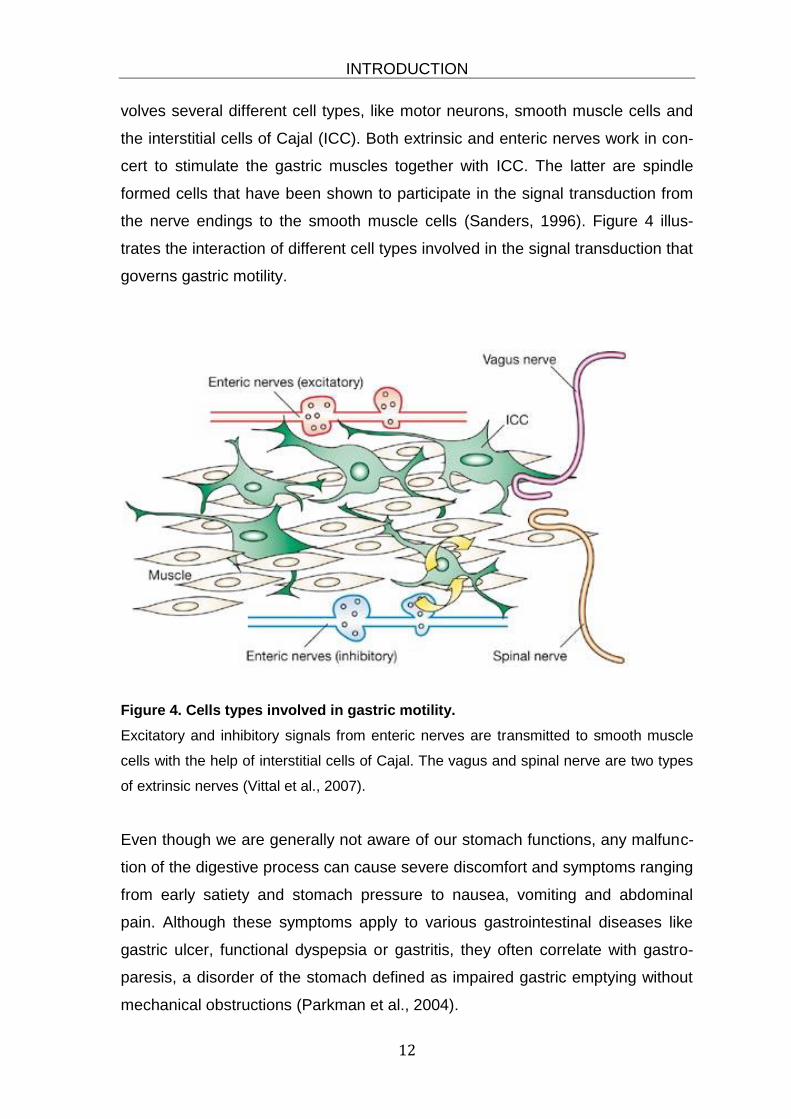
volves several different cell types, like motor neurons, smooth muscle cells and
the interstitial cells of Cajal (ICC). Both extrinsic and enteric nerves work in con-
cert to stimulate the gastric muscles together with ICC. The latter are spindle
formed cells that have been shown to participate in the signal transduction from
the nerve endings to the smooth muscle cells (Sanders, 1996). Figure 4 illus-
trates the interaction of different cell types involved in the signal transduction that
governs gastric motility.
Figure 4. Cells types involved in gastric motility.
Excitatory and inhibitory signals from enteric nerves are transmitted to smooth muscle
cells with the help of interstitial cells of Cajal. The vagus and spinal nerve are two types
of extrinsic nerves (Vittal et al., 2007).
Even though we are generally not aware of our stomach functions, any malfunc-
tion of the digestive process can cause severe discomfort and symptoms ranging
from early satiety and stomach pressure to nausea, vomiting and abdominal
pain. Although these symptoms apply to various gastrointestinal diseases like
gastric ulcer, functional dyspepsia or gastritis, they often correlate with gastro-
paresis, a disorder of the stomach defined as impaired gastric emptying without
mechanical obstructions (Parkman et al., 2004).
INTRODUCTION
13
Kassander was the first one to describe impaired gastric emptying as a side-
effect of diabetes (Kassander, 1958) but there is also a large number of patients
that suffer from idiopathic gastroparesis. Taking into consideration the complexity
of the process of gastric emptying and the many different cell types involved, it is
not astonishing that until today the mechanisms of gastroparesis remain partially
unclear. There is, however, some evidence that the inhibitory signals of the ENS
are responsible for impaired gastric emptying. In particular the neurotransmitters
used to mediate the inhibitory nervous signals have recently come into focus.
Especially nitric oxide (NO), a small reactive molecule produced by nitric oxide
synthase (NOS), an enzyme that is found in inhibitory motor neurons of the ENS,
has been shown to play a crucial role in gastroparesis (Rivera et al., 2011; Vittal
et al., 2007).
1.2.4 Effects of GCs on the stomach
Elevated levels of GCs can lead to enhanced gastric acid secretion and thereby
increase the risk of peptic ulcers and bleeding (Cooke et al., 1966; Gray et al.,
1951; Hernandez-Diaz and Rodriguez, 2001). Until today the underlying mecha-
nism of this effect is poorly understood. Apart from the stimulation of gastric acid
production and inhibition of gastroprotective enzymes like prostaglandin synthe-
tase and peroxidase (Bandyopadhyay et al., 1999) other mechanisms have been
proposed including the regulation of genes that take part in the control of energy
homeostasis and metabolism.
As mentioned before GCs play a major role in the control of metabolic and ho-
meostatic processes. In response to stress factors such as infection, serum lev-
els of GCs become elevated and foster gluconeogenesis, glycolysis, proteolysis
and lipolysis thus activating the energy resources of the organism. In this con-
text, the role of serum and glucocorticoid inducible kinase (SGK), a GC-
responsive gene that is highly expressed in gastric tissue, has been explored
lately. It has been found that the up-regulation of SGK by GCs enhances gastric
acid secretion via the regulation of several transport proteins (Sandu et al.,

INTRODUCTION
14
2007). However, such an effect is true only for the pharmacological application of
GCs. Contrariwise, endogenous GCs have been found to exert rather gastropro-
tective effects. Namely, induction of corticosterone secretion either by stress or
the application of nonsteroidal anti-inflammatory drugs (NSAIDs) can even pro-
tect against ulcerogenic actions by increasing mucus production (Filaretova et
al., 2002) or reducing gastric hypermotility (Takeuchi et al., 1989).
1.3 Properties and functions of NO
1.3.1 NO as a signaling molecule
NO is a highly reactive volatile molecule that naturally occurs as a free radical.
Upon contact with water and oxygen it reacts to nitrous acid and is oxidized in air
to nitrogen dioxide, a toxic gas. It is therefore not astonishing that when it was
first reported to be the substance responsible for nervous transmission of smooth
muscle relaxation many scientists remained skeptic about this revelation. None-
theless, for Robert Furchgott, Louis Ignarro and Ferid Murad it led to the award
of the Nobel Prize in Physiology or Medicine in 1998 “for their discoveries con-
cerning nitric oxide as a signaling molecule in the cardiovascular system”
(www.nobelprize.org/nobel_prizes/medicine/laureates/1998/). While it was al-
ready known that a substance called by then the “endothelial derived relaxing
factor” or EDRF was essential for vascular smooth muscle relaxation, they where
able to identify this substance as being NO.
Today it is well known that NO plays a key role in the neurotransmission of the
central and the peripheral nervous system. One of its key functions in the pe-
ripheral nervous system is the regulation of muscle contractility by inducing
smooth muscle relaxation. Due to its ephemeral and volatile character it has to
be produced on demand and in close vicinity to the recipient smooth muscle
cells. It is therefore synthesized at nerve endings from where it diffuses to adja-
cent cells (Esplugues, 2002).
As a small-sized molecule NO can easily permeate cell membranes to reach its
intracellular targets. The major target protein for neuronal NO is soluble guanylyl
INTRODUCTION
15
cyclase (sGC) (Esplugues, 2002) which is activated by nitrosylation of its heme-
group. The activation of sGC leads to an increase in intracellular cyclic guanosin
monophosphate (cGMP) levels which, in turn, leads to a decrease in intracellular
calcium levels and therefore to muscle relaxation (Gangula et al., 2011).
In contrast to other known neurotransmitters there is no need to degrade NO
enzymatically in order to terminate its signalling function, as it is rather bound to
inactivate itself having reached and reacted with its target (Esplugues, 2002). On
the other hand, this fact leaves NO synthesis as the only regulatory mechanism
available to control its functional activity.
1.3.1 NO synthesis
NO is synthesized from nitric oxide synthase (NOS) by conversion of its sub-
strate L-arginine to citrulline and NO (Stuehr, 1997). There are three different
isoforms of NOS, namely endothelial NOS (eNOS), neuronal NOS (nNOS) and
inducible NOS (iNOS). Whilst iNOS expression is almost absent under normal
physiological conditions and up-regulated mainly in response to inflammatory
signals, the two other isoforms are expressed constitutively (Mungrue et al.,
2003).
The main function of eNOS, which is expressed in endothelial cells, is the regula-
tion of the cardiovascular system (Andrew and Mayer, 1999). In contrast, nNOS
plays a major role in neuronal signalling in non-adrenergic non-cholinergic
(NANC) nerves. Being expressed in peripheral nitrergic nerves, an important
function of nNOS is to produce NO as a signalling molecule to induce smooth
muscle relaxation (Esplugues, 2002). All three isoforms of NOS are solely active
as homodimers and need the assistance of cofactors such as heme, tetrahydro-
biopterin and flavin adenin dinucleotide for the biosynthesis of NO (Andrew and
Mayer, 1999).
Although the exact mechanism of NO production remains unclear, the proposed
mode of action involves the formation of the intermediate Nω-hydroxy-L-arginine
INTRODUCTION
16
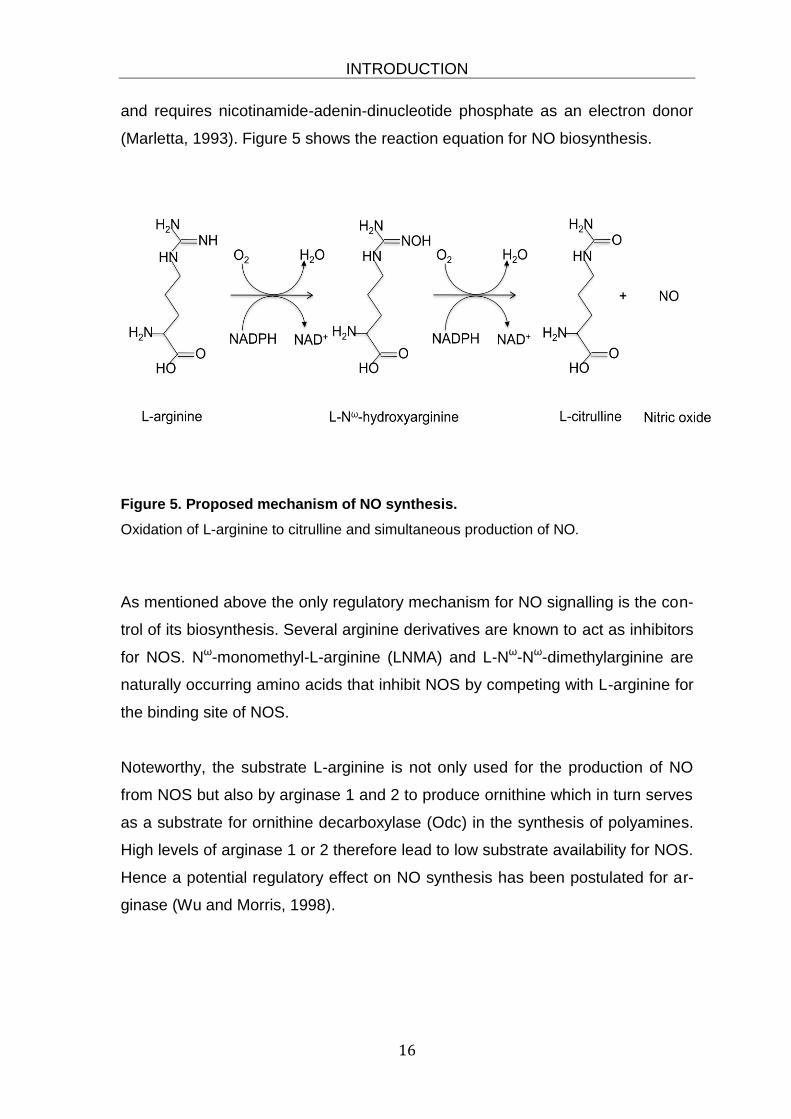
and requires nicotinamide-adenin-dinucleotide phosphate as an electron donor
(Marletta, 1993). Figure 5 shows the reaction equation for NO biosynthesis.
Figure 5. Proposed mechanism of NO synthesis.
Oxidation of L-arginine to citrulline and simultaneous production of NO.
As mentioned above the only regulatory mechanism for NO signalling is the con-
trol of its biosynthesis. Several arginine derivatives are known to act as inhibitors
for NOS. Nω-monomethyl-L-arginine (LNMA) and L-Nω-Nω-dimethylarginine are
naturally occurring amino acids that inhibit NOS by competing with L-arginine for
the binding site of NOS.
Noteworthy, the substrate L-arginine is not only used for the production of NO
from NOS but also by arginase 1 and 2 to produce ornithine which in turn serves
as a substrate for ornithine decarboxylase (Odc) in the synthesis of polyamines.
High levels of arginase 1 or 2 therefore lead to low substrate availability for NOS.
Hence a potential regulatory effect on NO synthesis has been postulated for ar-
ginase (Wu and Morris, 1998).

INTRODUCTION
17
1.3.2 Role of NO in gastric motility
The peristalsis of the stomach is a complex process that is initiated upon food
uptake via vagal stimulation. Its main function is to churn the stomach content
and to move it forward towards the pylorus. The wave-like movement that is cre-
ated from alternating constriction and relaxation of the different smooth muscle
layers of the stomach is controlled by motoric neurons.
The pivotal role of NO for gastric motility was first demonstrated for the adaptive
accommodation reflex that allows for the intake of large volumes of food without
increase in intragastric pressure (Cannon and Lieb, 1911). It was shown that re-
laxation of the stomach upon vagal stimulation is transmitted via NANC nerves
using NO as neurotransmitter (Abrahamsson and Jansson, 1969; Wilbur and
Kelly, 1973). Moreover, the gastric emptying of solid meals was found to be pro-
foundly reduced upon inhibition of nNOS (Orihata and Sarna, 1994).
A central role of NO for diabetic gastroparesis was proposed after several stud-
ies employing animal models of diabetes revealed a reduced nNOS expression
and activity in the gastric myenteric plexus (Takahashi et al., 1997). In addition, it
was found that diabetic patients suffering from gastric stasis exhibited low levels
of NO and nNOS.
The generation of nNOS knock-out mice has offered the opportunity to study the
role of this enzyme on gastric emptying. It was found that these mice have a
crossly enlarged stomach and exhibit impaired emptying of solids and liquids
(Mashimo et al., 2000).
Altogether these studies revealed the significance of NO as a crucial factor for
proper functioning of gastric motility.
INTRODUCTION
18
1.4 Aim of the study
Since the discovery of their potent anti-inflammatory properties GCs have been
the mainstay in the therapy of autoimmune diseases, such as RA, IBD, asthma
and MS. Nonetheless, prolonged application or high-dose GC therapy can often
lead to severe adverse effects like osteoporosis, muscle atrophy, diabetes or
gastric ulcer. Especially the oral application of GCs that has some advantages
over intravenously applied GC therapy causes severe gastrointestinal symptoms
thus seriously affecting the quality-of-life of the patients. On the other hand GCs
are known to possess anti-emetic potential and are therefore widely used to treat
chemotherapy induced nausea and vomiting (CINV). The underlying mechanism
of this effect, however, is yet unknown. The aim of this study was therefore to
investigate the impact of oral GC therapy on the stomach and to further elucidate
the mode of GC action in the stomach. For this purpose I employed several ex-
perimental approaches utilizing different mutant mouse strains in order to dis-
cover mechanism and targets of GC function. Since GCs are as yet indispensa-
ble for the therapy of many inflammatory disorders and the prescription of oral
GCs is continuously increasing a more detailed knowledge might provide a
means to reduce side-effects of GC therapy in the future.

MATERIALS AND METHODS
19
2. Material and Methods
2.1 Materials
2.1.1 General equipment
Table 1. General equipment
Accu-jet® pro pipette controller Brand GmbH + CO KG, Wertheim, Germany
Arium® 611 laboratory water
Purification system
Sartorius AG, Göttingen, Germany
Balance TE 313S Sartorius AG, Göttingen, Germany
Balance Acculab ALC 3100.2 Sartorius AG, Göttingen, Germany
Balance MC1 RC 210 P-0D1 Sartorius AG, Göttingen, Germany
Chemo Cam Imaging System Intas Science Imaging Instruments GmbH,
Göttingen, Germany
Centrifuge 5417R Eppendorf, Hamburg, Germany
Centrifuge 5804 Eppendorf, Hamburg, Germany
Centrifuge multifuge 4 KR Heraeus, Hanau, Germany
Centrifuge Sigma 2-5 Sigma Laborzentrifugen GmbH,
Osterode am Harz, Germany
Electrophoresis chambers
Type 40-0708, 40-1214, 40-1410
Peqlab Biotechnology GmbH,
Erlangen , Germany
Electrophoresis chamber
Mini-PROTEAN Tetra Cell
BioRad Laboratories GmbH, München,
Germany
Electrophoresis power supply 301 Amersham Biosciences, Freiburg,
Germany
Electrophoresis power supply
PowerPac Basic
BioRad Laboratories GmbH, München,
Germany
Electrophoresis transfer unit
SEMIPHOR TRANSPHOR
Amersham Biosciences, Freiburg, Germany
Freezer Hera freeze -80°C Heraeus, Hanau, Germany
Freezer Liebherr Comfort -20°C Liebherr-International Deutschland GmbH,
Biberach an der Riß, Germany
MATERIALS AND METHODS
20
Micropipette 2μl, 20μl, 200μl,1000μl Gilson, Middleton,WI, USA
PCR Mastercycler EP Gradient Eppendorf, Hamburg, Germany
pH-Meter 766 Calimatic Knick Elektronische Messgeräte
GmbH&Co. KG, Berlin, Germany
Photometer Biophotometer Eppendorf, Hamburg, Germany
Photometer Nanodrop 2000 Peqlab Biotechnology GmbH,
Erlangen, Germany
7500 Real Time PCR System Applied Biosystems, Foster City, CA, USA
Thermomixer comfort Eppendorf, Hamburg, Germany
Ultra Turrax IKA®T18 basic IKA®-werke GmbH&Co.KG,
Staufen, Germany
UV Transilluminator and Camera
system
Intas Science Imaging Instruments Gmbh,
Göttingen, Germany
Vortex Genie-2 Scientific Industries, Bohemia, NY, USA
Water Bath W 12 Labortechnik Medingen, Dresden, Germany
2.1.2 Consumables
Table 2. Consumables
Animal feeding needles 20Gx1,5’’ Fine Science Tools, Foster City, CA, USA
CryoTube™Vials Nunc, Roskilde, Denmarc
Disposable cuvettes semi-micro,
1,5ml
Brand GmbH + CO KG, Wertheim, Germany
Falcon tubes 15ml, 50ml Greiner Bio-One GmbH,
Frickenhausen Germany
Glass pipettes 5ml, 10ml Brand GmbH + CO KG, Wertheim, Germany
Hybond ECL blotting membrane Amersham Biosciences, Freiburg, Germany
Pipette tips 2μl, 20μl, 200μl, 1000μl Greiner Bio-One GmbH,
Frickenhausen, Germany
PCR tubes Sarstedt, Nürnbrecht, Germany
PCR-plate 96 well, half skirted Greiner Bio-One GmbH,
Frickenhausen, Germany
MATERIALS AND METHODS
21
Reaction tubes 1,5ml, 2ml Greiner Bio-One GmbH
Optical adhesive covers Applied Biosystems, Foster City, CA, USA
Whatman® Gel blotting paper
GB005
Sigma-Aldrich, Taufkirchen, Germany
Single-use syringe Injekt®-F B.Braun, Melsungen, Germany
2.1.3 Chemicals and Reagents
Table 3. Chemicals and Reagents
Acetic acid glacial Carl Roth, Karlsruhe, Germany
Agarose UltraPure Invitrogen, Carlsbad, CA, USA
Ammonium persulphate (APS) Sigma-Aldrich, Taufkirchen, Germany
L-Arginine Sigma-Aldrich, Taufkirchen, Germany
(S)-(2-Boronoethyl)-L-cystein (BEC) Merck KGaA, Darmstadt, Germany
Bovine serum albumin (BSA) Carl Roth, Karlsruhe, Germany
Bradford reagent Sigma-Aldrich, Taufkirchen, Germany
Bromophenol blue Merck KGaA, Darmstadt, Germany
Chloroform Sigma-Aldrich, Taufkirchen, Germany
p-Coumaric acid Sigma-Aldrich, Taufkirchen, Germany
Dexamethasone, water soluble Sigma-Aldrich, Taufkirchen, Germany
Diethyl pyrocarbonate (DEPC) Sigma-Aldrich, Taufkirchen, Germany
Dimethyl sulfoxide (DMSO) Carl Roth, Karlsruhe, Germany
DNA ladder 1kb Fermentas GmbH, St-Leon-Rot, Germany
Ethylenediaminetetraacetate
(EDTA)
Sigma-Aldrich, Taufkirchen, Germany
Ethanol Carl Roth, Karlsruhe, Germany
Ethidiumbromide Carl Roth, Karlsruhe, Germany
Glycine Sigma-Aldrich, Taufkirchen, Germany
Hydrogen peroxide 30% Carl Roth, Karlsruhe, Germany
Igepal® CA-630 Sigma-Aldrich, Taufkirchen, Germany
Iron(II) gluconate hydrate Sigma-Aldrich, Taufkirchen, Germany
Luminol Serva Electrophoresis GmbH, Heidelberg,
Germany
MATERIALS AND METHODS
22
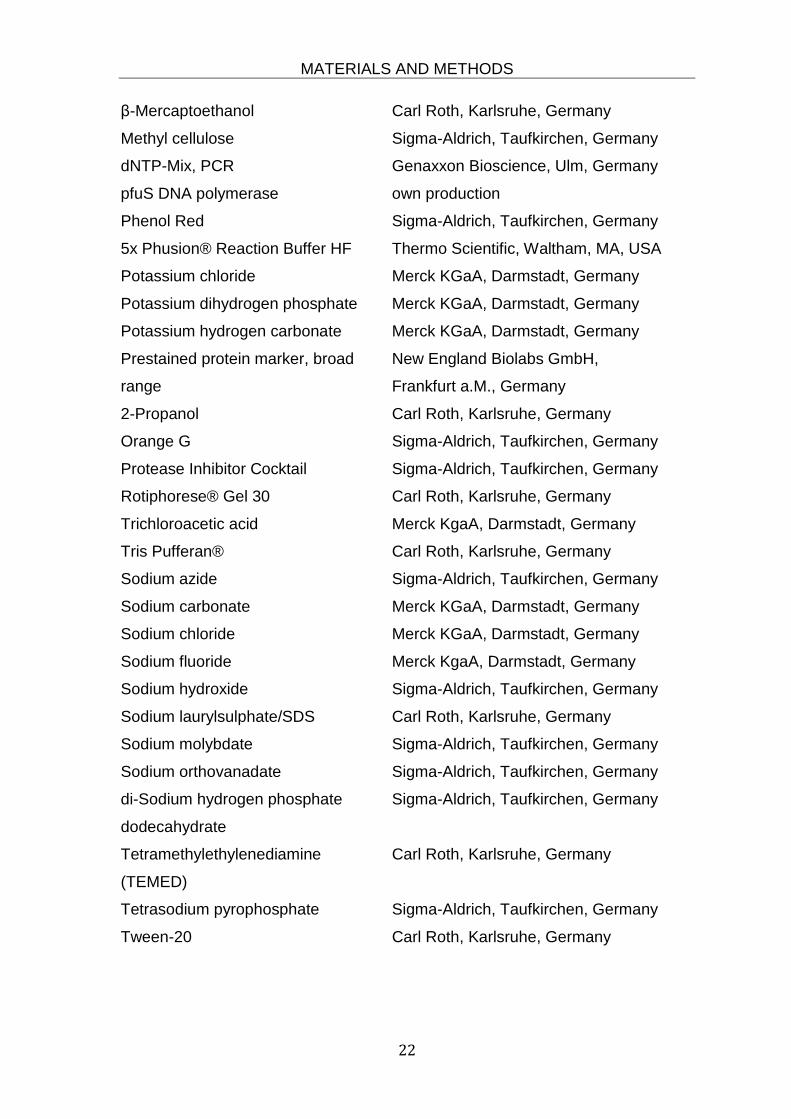
β-Mercaptoethanol Carl Roth, Karlsruhe, Germany
Methyl cellulose Sigma-Aldrich, Taufkirchen, Germany
dNTP-Mix, PCR Genaxxon Bioscience, Ulm, Germany
pfuS DNA polymerase own production
Phenol Red Sigma-Aldrich, Taufkirchen, Germany
5x Phusion® Reaction Buffer HF Thermo Scientific, Waltham, MA, USA
Potassium chloride Merck KGaA, Darmstadt, Germany
Potassium dihydrogen phosphate Merck KGaA, Darmstadt, Germany
Potassium hydrogen carbonate Merck KGaA, Darmstadt, Germany
Prestained protein marker, broad
range
New England Biolabs GmbH,
Frankfurt a.M., Germany
2-Propanol Carl Roth, Karlsruhe, Germany
Orange G Sigma-Aldrich, Taufkirchen, Germany
Protease Inhibitor Cocktail Sigma-Aldrich, Taufkirchen, Germany
Rotiphorese® Gel 30 Carl Roth, Karlsruhe, Germany
Trichloroacetic acid Merck KgaA, Darmstadt, Germany
Tris Pufferan® Carl Roth, Karlsruhe, Germany
Sodium azide Sigma-Aldrich, Taufkirchen, Germany
Sodium carbonate Merck KGaA, Darmstadt, Germany
Sodium chloride Merck KGaA, Darmstadt, Germany
Sodium fluoride Merck KgaA, Darmstadt, Germany
Sodium hydroxide Sigma-Aldrich, Taufkirchen, Germany
Sodium laurylsulphate/SDS Carl Roth, Karlsruhe, Germany
Sodium molybdate Sigma-Aldrich, Taufkirchen, Germany
Sodium orthovanadate Sigma-Aldrich, Taufkirchen, Germany
di-Sodium hydrogen phosphate
dodecahydrate
Sigma-Aldrich, Taufkirchen, Germany
Tetramethylethylenediamine
(TEMED)
Carl Roth, Karlsruhe, Germany
Tetrasodium pyrophosphate Sigma-Aldrich, Taufkirchen, Germany
Tween-20 Carl Roth, Karlsruhe, Germany

MATERIALS AND METHODS
23
2.1.4 Buffers and Solutions
RadioImmunoPrecipitation Assay
PBS, pH 7,3 (RIPA) Buffer, pH 7,4
80g NaCl 8,77g NaCl
29g Na2HPO4 x 12 H2O 1,46g EDTA
2g KCl 1,24g Tris
2g KH2PO4 0,45g Na4P2O7 x 10 H2O
ad 1000ml ddH2O 0,42g NaF
ad 1000ml ddH2O
Blotting Buffer Protein Lysis Buffer
2,93g Glycine 500μl 2 x RIPA Buffer
0,58g Tris 100μl NP40, 10%
0,375g SDS 25μl Protease Inhibitor
0,1g NaN3 20μl Na3VO4 50mM
200ml Methanol 1μl Na3MO4 10mM
ad 1000ml ddH2O 354μl ddH2O
Western Blot Washing Buffer NP40, 10%
PBS 5ml Igepal CA-630
+ 0,1% Tween 45ml ddH2O
Western Blot Blocking Buffer TAE Buffer
PBS 4,8g Tris
+ 5% BSA 1,1g Acetic acid glacial
+ 0,1% Tween 0,29g EDTA
ad 1000ml H2O
MATERIALS AND METHODS
24
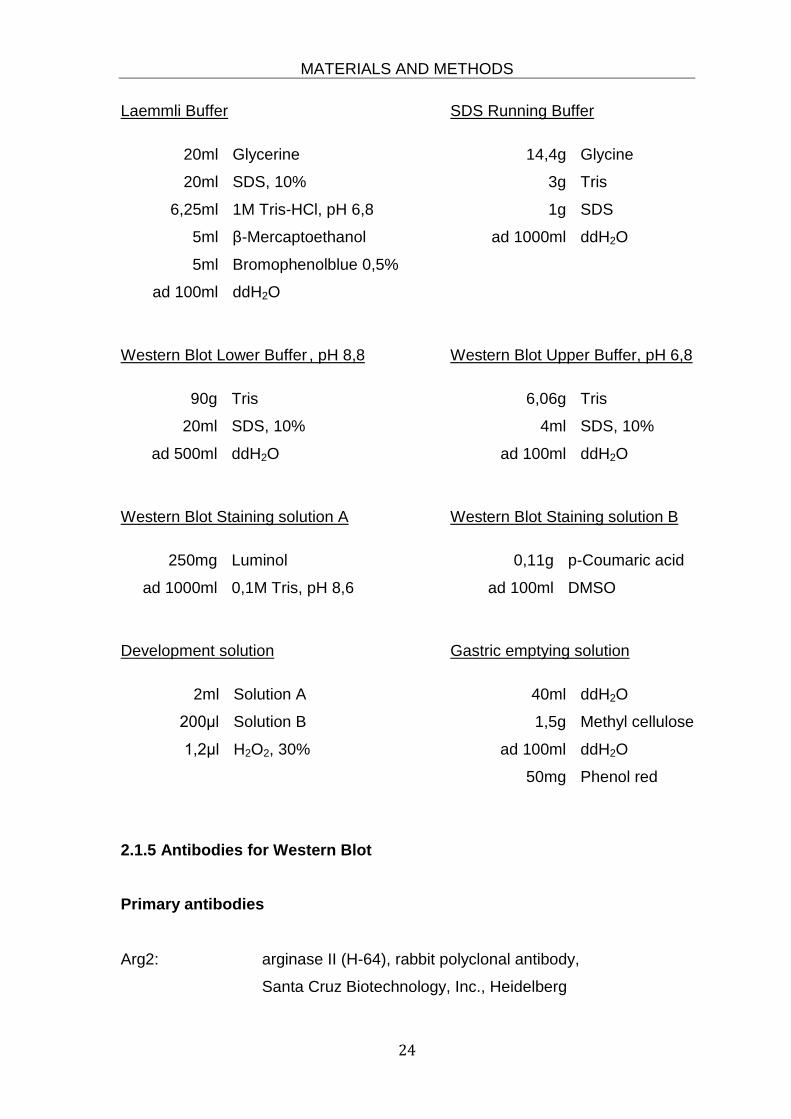
Laemmli Buffer SDS Running Buffer
20ml Glycerine 14,4g Glycine
20ml SDS, 10% 3g Tris
6,25ml 1M Tris-HCl, pH 6,8 1g SDS
5ml β-Mercaptoethanol ad 1000ml ddH2O
5ml Bromophenolblue 0,5%
ad 100ml ddH2O
Western Blot Lower Buffer , pH 8,8 Western Blot Upper Buffer, pH 6,8
90g Tris 6,06g Tris
20ml SDS, 10% 4ml SDS, 10%
ad 500ml ddH2O ad 100ml ddH2O
Western Blot Staining solution A Western Blot Staining solution B
250mg Luminol 0,11g p-Coumaric acid
ad 1000ml 0,1M Tris, pH 8,6 ad 100ml DMSO
Development solution Gastric emptying solution
2ml Solution A 40ml ddH2O
200μl Solution B 1,5g Methyl cellulose
1,2μl H2O2, 30% ad 100ml ddH2O
50mg Phenol red
2.1.5 Antibodies for Western Blot
Primary antibodies
Arg2: arginase II (H-64), rabbit polyclonal antibody,
Santa Cruz Biotechnology, Inc., Heidelberg

MATERIALS AND METHODS
25
ERK: ERK-1 (C-16), rabbit polyclonal antibody,
Santa Cruz Biotechnology Inc., Heidelberg
β-tubulin: β-tubulin (TUB 2.1), mouse monoclonal antibody
Sigma-Aldrich, Taufkirchen, Germany
GR: GR (M-20): sc-1004, rabbit polyclonal antibody,
Santa Cruz Biotechnology Inc., Heidelberg
Secondary antibodies
Rabbit IgG, (H+L): ImmunoPure®, Goat Anti-Rabbit IgG, peroxidase
conjugated, Pierce Biotechnology, Rockford, IL, USA
Mouse IgG2a: ImmunoPure®, Goat Anti-mouse IgG, peroxidase
conjugated, Pierce Biotechnology, Rockford, IL, USA
2.1.6 Commercial assays
Table 4. Commercial assays
iScript cDNA Synthesis Kit Bio-Rad laboratories, München, Germany
RNeasy® Plus Universal Mini Kit Qiagen, Hilden, Germany
Power SYBR Green PCR Mastermix Applied Biosystems, Foster City, CA, USA
2.1.7 Oligonucleotides
Table 5. Oligonucleotides
Target gene Sequence (5´- 3´)
Arginase type1 (arg1) Fwd: AGCCCGAGCACATGCAGCAG
Rev: ACCCCTCCTCGAGGCTGTCCT
MATERIALS AND METHODS
26
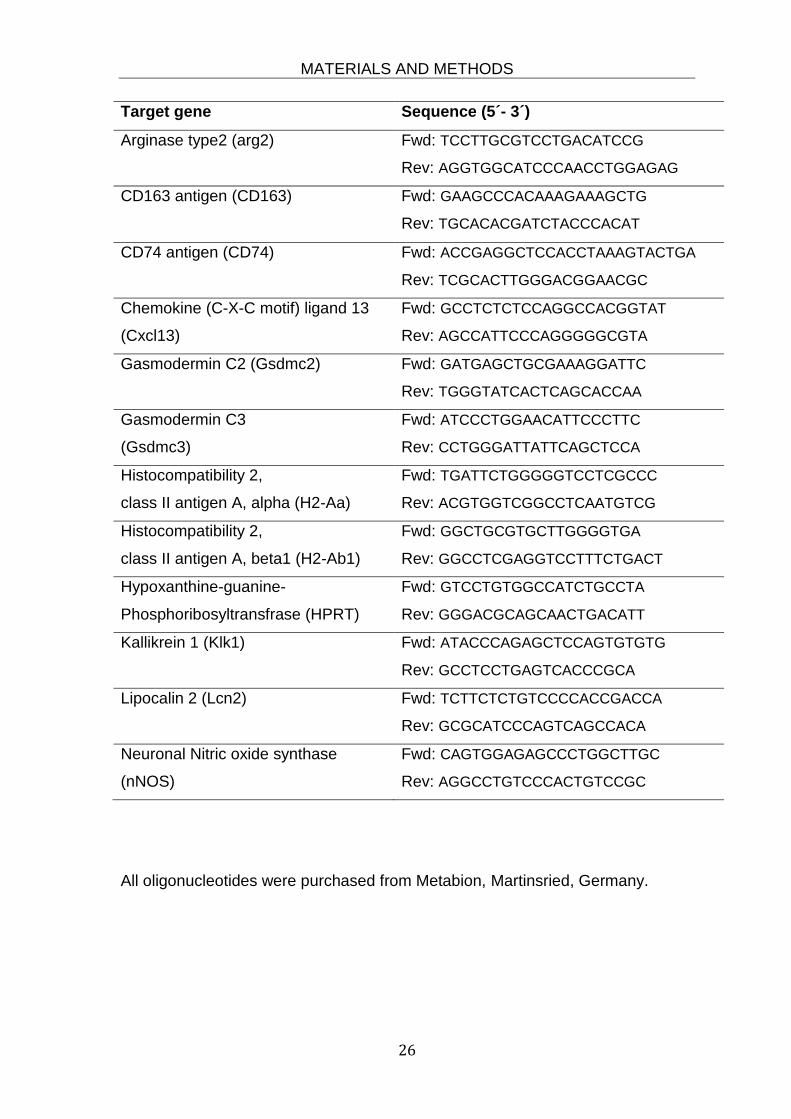
Target gene Sequence (5´- 3´)
Arginase type2 (arg2) Fwd: TCCTTGCGTCCTGACATCCG
Rev: AGGTGGCATCCCAACCTGGAGAG
CD163 antigen (CD163) Fwd: GAAGCCCACAAAGAAAGCTG
Rev: TGCACACGATCTACCCACAT
CD74 antigen (CD74) Fwd: ACCGAGGCTCCACCTAAAGTACTGA
Rev: TCGCACTTGGGACGGAACGC
Chemokine (C-X-C motif) ligand 13
(Cxcl13)
Fwd: GCCTCTCTCCAGGCCACGGTAT
Rev: AGCCATTCCCAGGGGGCGTA
Gasmodermin C2 (Gsdmc2) Fwd: GATGAGCTGCGAAAGGATTC
Rev: TGGGTATCACTCAGCACCAA
Gasmodermin C3
(Gsdmc3)
Fwd: ATCCCTGGAACATTCCCTTC
Rev: CCTGGGATTATTCAGCTCCA
Histocompatibility 2,
class II antigen A, alpha (H2-Aa)
Fwd: TGATTCTGGGGGTCCTCGCCC
Rev: ACGTGGTCGGCCTCAATGTCG
Histocompatibility 2,
class II antigen A, beta1 (H2-Ab1)
Fwd: GGCTGCGTGCTTGGGGTGA
Rev: GGCCTCGAGGTCCTTTCTGACT
Hypoxanthine-guanine-
Phosphoribosyltransfrase (HPRT)
Fwd: GTCCTGTGGCCATCTGCCTA
Rev: GGGACGCAGCAACTGACATT
Kallikrein 1 (Klk1) Fwd: ATACCCAGAGCTCCAGTGTGTG
Rev: GCCTCCTGAGTCACCCGCA
Lipocalin 2 (Lcn2) Fwd: TCTTCTCTGTCCCCACCGACCA
Rev: GCGCATCCCAGTCAGCCACA
Neuronal Nitric oxide synthase
(nNOS)
Fwd: CAGTGGAGAGCCCTGGCTTGC
Rev: AGGCCTGTCCCACTGTCCGC
All oligonucleotides were purchased from Metabion, Martinsried, Germany.
MATERIALS AND METHODS
27
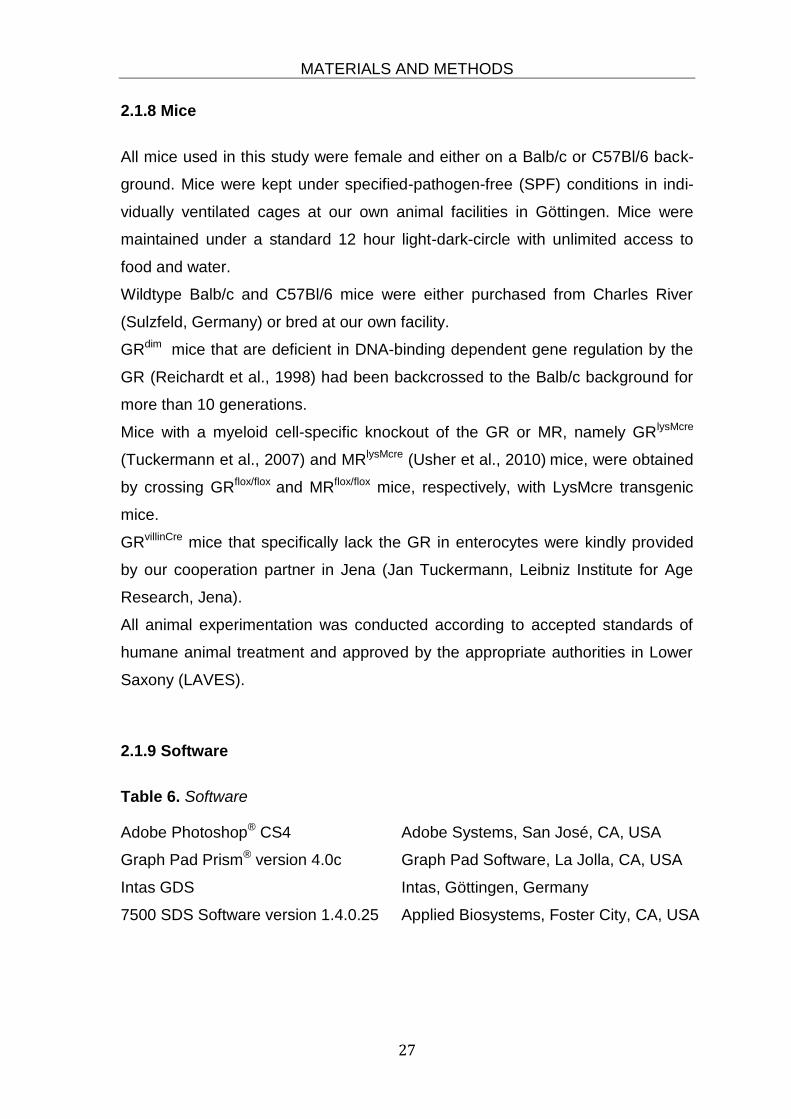
2.1.8 Mice
All mice used in this study were female and either on a Balb/c or C57Bl/6 back-
ground. Mice were kept under specified-pathogen-free (SPF) conditions in indi-
vidually ventilated cages at our own animal facilities in Göttingen. Mice were
maintained under a standard 12 hour light-dark-circle with unlimited access to
food and water.
Wildtype Balb/c and C57Bl/6 mice were either purchased from Charles River
(Sulzfeld, Germany) or bred at our own facility.
GRdim mice that are deficient in DNA-binding dependent gene regulation by the
GR (Reichardt et al., 1998) had been backcrossed to the Balb/c background for
more than 10 generations.
Mice with a myeloid cell-specific knockout of the GR or MR, namely GRlysMcre
(Tuckermann et al., 2007) and MRlysMcre (Usher et al., 2010) mice, were obtained
by crossing GRflox/flox and MRflox/flox mice, respectively, with LysMcre transgenic
mice.
GRvillinCre mice that specifically lack the GR in enterocytes were kindly provided
by our cooperation partner in Jena (Jan Tuckermann, Leibniz Institute for Age
Research, Jena).
All animal experimentation was conducted according to accepted standards of
humane animal treatment and approved by the appropriate authorities in Lower
Saxony (LAVES).
2.1.9 Software
Table 6. Software
Adobe Photoshop® CS4 Adobe Systems, San José, CA, USA
Graph Pad Prism® version 4.0c Graph Pad Software, La Jolla, CA, USA
Intas GDS Intas, Göttingen, Germany
7500 SDS Software version 1.4.0.25 Applied Biosystems, Foster City, CA, USA
MATERIALS AND METHODS
28
2.2 Methods
2.2.1 Animal experimentation
2.2.1.1 Experimental protocols
To mimic a standard high-dose oral GC therapy, mice were treated with water-
soluble dexamethasone (Dex) via the drinking water at a concentration of 50
mg/L for three consecutive days, which was changed once on the second day.
Based on a daily drinking volume of approximately 5 ml ± 0,7 ml this treatment
corresponds to an effective dose of about 10 mg/kg*d (Reichardt et al., 2012). In
some experiments, Dex was applied at lower concentrations as indicated in the
Results section.
L-Arginine at a concentration of 1% was added to the drinking water one day
prior to Dex and changed once on the second day. Iron(II) gluconate hydrate
was added at a concentration of either 600 mg/L or 1200 mg/L one day prior to
Dex and changed once every second day. Based on a drinking volume of 5 ml ±
0,7 ml this treatment corresponds to an effective dose of 150 mg/kg*d or 300
mg/kg*d, respectively.
A volume of 100μl of BEC at a concentration of 1 mg/ml was given once a day by
oral gavage.
2.2.1.2 Physiological parameters
To determine the weight of the filled stomach, mice were sacrificed by inhalation
of carbon dioxide. After opening the abdomen the stomach was clamped at the
cardiac and pyloric sphincter, carefully removed and then weighed. The stomach
weight was normalized to the body weight as follows: stomach weight [mg]/body
weight [g]/10 = normalized stomach weight.
The daily intake of food and drinking water was determined by providing the mice
access to a defined amount of food and water. The difference in weight and vol-
ume every day was then measured and the average daily intake calculated.

MATERIALS AND METHODS
29
Determination of the dry weight of the feces was accomplished by their daily col-
lection followed by an overnight drying in an oven at 60°C and subsequent
weighing.
2.2.1.3 Gastric emptying
To determine the rate of gastric emptying I modified a previously published
method (Martinez et al., 1997). In principle this method is based on determina-
tion of gastric emptying by feeding a defined volume of a stained meal of stable
viscosity followed by subsequent photometric detection of the amount of retained
meal in the stomach.
To prepare a liquid meal of stable viscosity an aqueous solution of 1,5% methyl
cellulose was prepared. To this end, 1,5 g methyl cellulose were dissolved in 40
ml distilled water at a temperature of about 80°C under continuous stirring until
all particles were dispersed. The remaining amount of water was added at a
temperature below 10°C and the solution was stirred and cooled for at least an-
other 30 minutes at a temperature below 10°C. In this step the dispersed methyl
cellulose particles become hydrated and an increase in viscosity can be ob-
served. In a final step 50 mg phenol red were dissolved in 100 ml of the resulting
solution thus ensuring the later photometric detection of the remaining stomach
content.
For the determination of gastric emptying mice were fasted overnight and then
given 150 μl of the prepared gastric emptying solution by gavage.
Thirty minutes after force-feeding the mice were sacrificed in an atmosphere of
excessive carbon dioxide and the abdominal part was opened. The stomach was
clamped at the cardiac and pyloric sphincter, carefully removed and placed into
4 ml 0,1N NaOH before homogenizing it with the help of an Ultra Turrax.
After the addition of another 6 ml 0,1N NAOH the solution was thoroughly mixed
and subsequently centrifuged at 3000 rpm for 10 minutes at 4°C. 1 ml of the su-
pernatant was added to 100 μl of 20% trichloro-acetic acid, vortexed and centri-
fuged at 3000 rpm at 4°C for 2 minutes. A volume of 500 μl was removed from
the clear supernatant and mixed thoroughly with another volume of 400 μl of
0,5 N NaOH.

MATERIALS AND METHODS
30
The absorption of the sample was measured at a wavelength of 562 nm (A562)
in a photometer. For baseline control some mice were killed immediately after
force-feeding and the absorption of the stomach content was determined like-
wise.
The rate of gastric emptying was then calculated according to the following equa-
tion: (1-[A562 of test sample]/[A562 of baseline control]) x 100
2.2.2 Molecular biological methods
2.2.2.1 Isolation of total RNA from tissue samples
For the isolation of total RNA from tissue samples the Qiagen RNeasy® Mini Kit
was used. Therefore, the frozen tissue samples were placed into 900 μl of QI-
Azol® lysis reagent and homogenized with the help of an Ultra Turrax. To remove
genomic DNA 100 μl of DNA-eliminator solution was added and the mixture vor-
texed. After the addition of 180 μl chloroform and vortexing, the homogenates
were incubated for three minutes at room temperature before centrifugation at
12,000 g for 15 minutes at 4°C. The upper aqueous phase containing the RNA
was placed in another tube mixed with 1 volume of 70% ethanol by pipetting up
and down. A volume of 700 μl of the mixture was transferred to a spin column
and centrifuged at ≥ 8,000 g for 20 seconds. After discarding the flow-through
this step was repeated with the remainder of the sample. In three consecutive
steps the column membrane was washed by first adding 700 μl of wash-buffer to
the column before centrifugation at ≥ 10,000 g for 20 seconds. For each step a
different wash buffer was used and the flow-through discarded. Afterwards the
RNA was eluted twice with 35 μl RNase-free water by centrifugation at ≥ 8000 g
for 1 minute. An aliquot of the sample was used for measuring the concentration
and the samples were frozen immediately.
MATERIALS AND METHODS
31
2.2.2.2 Reverse transcription of RNA
For further analysis by quantitative reverse-transcription polymerase chain reac-
tion (qRT-PCR) the RNA samples were transcribed into complementary DNA
(cDNA). This was accomplished with the help of the iScript cDNA synthesis Kit.
In brief, 1 μg of RNA was mixed with 0,25 μl Reverse transcriptase and 4 ml of
iScript reaction mix. RNA-free water was added to a final volume of 20 μl. The
samples were held at 25°C for 5 minutes before incubating them at 42°C for 30
minutes. In a final step the reaction was stopped by incubation at 85°C for 5
minutes.
2.2.2.3 Polymerase chain reaction
Successful reverse transcription into cDNA was checked with the help of a poly-
merase chain reaction (PCR) aimed to amplify the housekeeping gene Hypoxan-
thine-guanine phosphoribyl-transferase (HPRT). To this end 1 μl of cDNA was
added to a volume of 19 μl of the following master mix:
12,7μl ddH2O
4μl Buffer HF
1μl dNTP´s
0,5μl HPRT Primer forward
0,5μl HPRT Primer reverse
0,3μl pfuS DNA polymerase
The tubes were then transferred into a PCR Mastercycler and the PCR was con-
ducted according to this protocol:
Initialization step 98,5°C 2 minutes
Denaturation step 98,5°C 20 seconds
Annealing step 64°C 15 seconds 30 cycles
Elongation step 72°C 20 seconds
Final elongation 72°C 2 minutes
MATERIALS AND METHODS
32
2.2.2.4 Agarose Gel Electrophoresis
Analysis of the PCR products was done with the help of agarose gel elec-
tropheresis. To this end 7 μl of loading buffer consisting of a 30% solution of Or-
ange G in DMSO was added to the samples which were then loaded onto a 2%
agarose gel in a electrophoresis chamber filled with TAE buffer. According to the
size of the gel, the electrophoresis was run at 120 V and 230 mA, for small gels
or at 150 V and 290 mA, for large gels, respectively. After 35 minutes electropho-
resis was stopped and the gel was placed on a UV screen to detect the seperat-
ed fragments.
2.2.2.5 Quantitative RT-PCR
To study changes in the relative expression level of genes qRT-PCR was used.
RNA from tissue samples was isolated and subsequently transcribed into cDNA
as described above. A mastermix of 11 μl distilled water, 12.5 μl SYBR-Green
reaction mix and 0.25 μl of the respective forward and reverse primer of the gene
of interest each (at a concentration of 10 μM) was prepared. 1 μl of cDNA was
added to each well of a 96 well PCR plate and subsequently 24 μl of the Mas-
termix was added to each well. Following centrifugation the plate was placed into
a 7500 Real Time PCR System and the PCR was performed following the follow-
ing protocol:
Enzyme activation 50°C 2 minutes
Initial denaturation 95°C 20 seconds
Denaturation 95°C 15 seconds
40 cycles Annealing and elongation 60°C 60 seconds
95°C 15 seconds
Dissociation 60°C 60 seconds
95°C 15 seconds
For evaluation of the relative expression of genes the ΔΔct method was em-
ployed. The housekeeping gene HPRT served as an endogenous control for
normalization.

MATERIALS AND METHODS
33
2.2.3 Biochemical Methods
2.2.3.1 Preparation of protein lysates from tissue samples
Protein lysates were prepared from the stomach of mice by homogenizing tissue
samples in 500 μl freshly made protein lysis buffer with the help of an Ultra tur-
rax. The resulting homogenates were then put on ice for at least one hour before
centrifugation at 12,000 g for 20 minutes at 4°C. The supernatant was removed
and the concentration measured using the Bradford protein assay.
2.2.3.2 Measurement of protein concentration
Protein lysates were diluted 10-fold in RIPA buffer before adding 25 μl of the
sample to 750 μl Bradford reagent. A blank solution was prepared by adding of
25 μl RIPA buffer to 750 μl Bradford reagent. The absorption of the samples at
595 nm was measured in a Nanodrop 2000 photometer and the concentration
was calculated with the help of a standard curve.
2.2.3.3 Polyacrylamide Gel Electrophoresis
For further analysis of protein levels in tissues by Western Blot, protein lysates
were separated by sodium dodecyl sulfate polyacrylamide gel electrophoresis
(SDS-PAGE). To this end separating and stacking gels were prepared according
to the following table:
Table 7. Preparation of WesternBlot Gels
Separating Gel (7,5%) Stacking Gel
Lower Buffer 1950 μl
Upper Buffer 938μl
Rotiphorese® Gel 30 2025μl 600μl
H2O 3975μl 2205μl
TEMED 7,5μl 3,75μl
APS (10%), added shortly
before casting
49,95μl 37,5μl

MATERIALS AND METHODS
34
The separating gel was casted between plate and spacer plate at a thickness of
0,75 mm and allowed to polymerize for 10 to 20 minutes before the stacking gel
was poured and a comb inserted. After solidifying the gel was placed in a elec-
trophoresis chamber filled with SDS Running Buffer. An amount of 20 μg protein
lysate was added up to a volume of 10 μl with RIPA Buffer and mixed with 2x
Laemmli Buffer before heating to 95°C for 5 minutes. The samples were then
loaded onto the gel and the electrophoresis was run at a constant current of 20
mA for 50 minutes.
2.2.3.4 Western Blot Analysis
After separation by SDS-PAGE the proteins were transferred to an ECL nitrocel-
lulose membrane. Therefore, a Whatman® blotting paper soaked with blotting
buffer was placed in a SEMIPHOR transfer unit before sandwich-like the nitrocel-
lulose membrane, the separating gel and another Whatman® paper was each
put on top. To transfer the proteins to the membrane a voltage of 16 V was ap-
plied for one hour. The membrane was then blocked for another hour with 5%
BSA solution and subsequently washed 3 times with PBS/Tween before incuba-
tion overnight at 4°C with the primary antibody. The secondary antibody was ap-
plied after washing 3 times with PBS/Tween and incubated for one hour at room
temperature. After adding the freshly prepared development solution the protein
bands were visualized using a Chemo Cam Imaging system.
2.2.4 Statistical analysis
Statistical analysis was performed by either 2-way ANOVA followed by Bonferro-
ni multiple comparison test, unpaired t test or Mann-Whitney U test as indicated
in the respective figure legends. Data are depicted as mean ± SEM. P values
below 0.05 were considered significant and are indicated as follows: *p<0.05;
**p<0.01; ***p<0.001. For all statistical analyses Graph Pad Prism® software
was used.
RESULTS
35
3. Results
3.1 Oral administration of GCs induces gastroparesis
3.1.1 High-dose Dex treatment causes an enlargement of the stomach
GCs are the mainstay in the treatment of inflammatory diseases such as MS, RA
or IBD. Nevertheless, pharmacological application of GCs can lead to severe
side-effects including diabetes, muscle atrophy, osteoporosis (Rauch et al.,
2010; Rose and Herzig, 2013; Watson et al., 2012) as well as the formation of
gastric ulcers (Sandu et al., 2007). Administration of GCs, in particular orally, can
lead to gastrointestinal disturbances with symptoms ranging from early satiety
and bloating to nausea. In fact, patients often range gastrointestinal symptoms
as one of the most important adverse effect because they pose a serious disad-
vantage on their daily life (Sellebjerg et al., 1998). On the other hand oral therapy
has major advantages over intravenous therapy. It does not require hospitaliza-
tion or daily appointments for treatment in the clinic, which may be cumbersome
and wearing for the patients especially in rural regions with less health facilities.
Furthermore oral treatment is a far less exhausting method of application for the
patients and it is therefore often the method of choice.
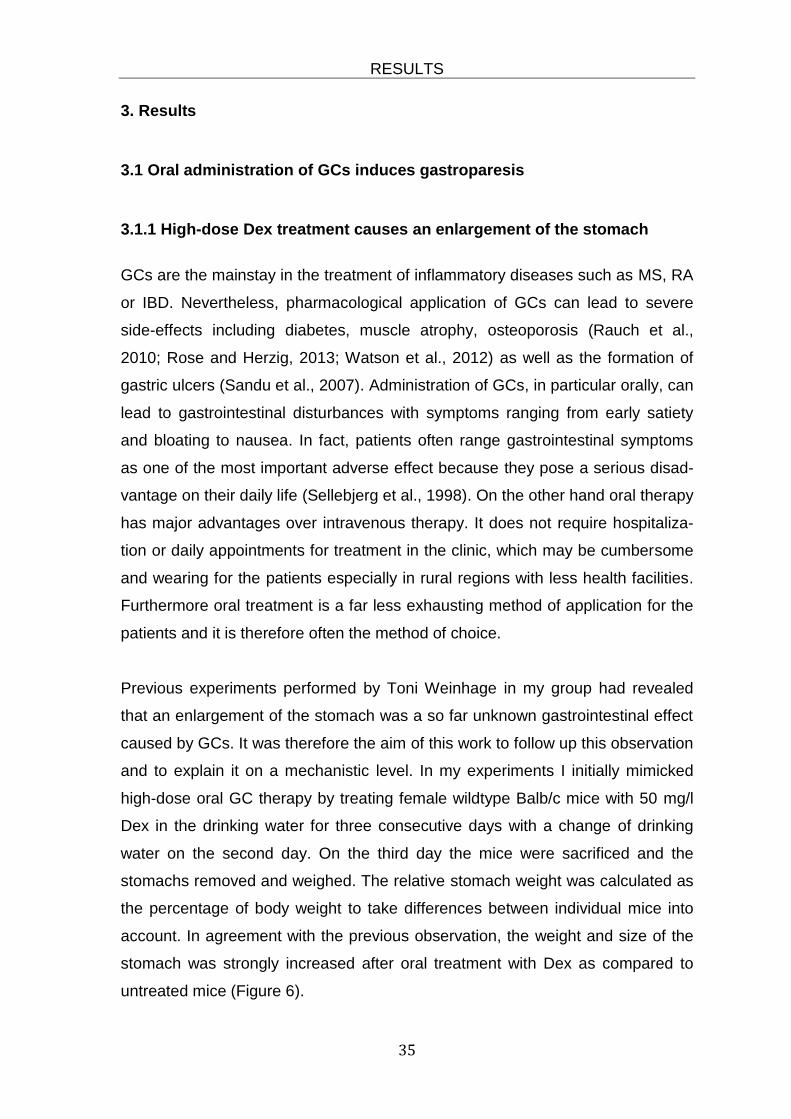
Previous experiments performed by Toni Weinhage in my group had revealed
that an enlargement of the stomach was a so far unknown gastrointestinal effect
caused by GCs. It was therefore the aim of this work to follow up this observation
and to explain it on a mechanistic level. In my experiments I initially mimicked
high-dose oral GC therapy by treating female wildtype Balb/c mice with 50 mg/l
Dex in the drinking water for three consecutive days with a change of drinking
water on the second day. On the third day the mice were sacrificed and the
stomachs removed and weighed. The relative stomach weight was calculated as
the percentage of body weight to take differences between individual mice into
account. In agreement with the previous observation, the weight and size of the
stomach was strongly increased after oral treatment with Dex as compared to
untreated mice (Figure 6).
RESULTS
36
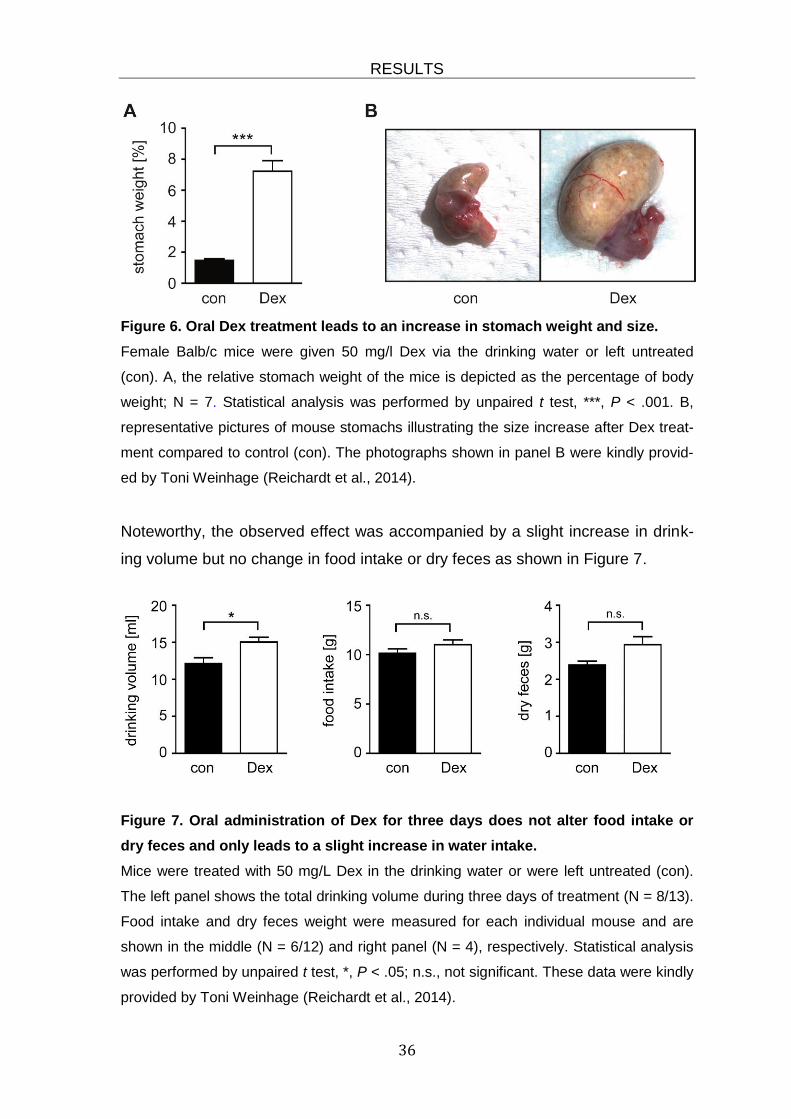
Figure 6. Oral Dex treatment leads to an increase in stomach weight and size.
Female Balb/c mice were given 50 mg/l Dex via the drinking water or left untreated
(con). A, the relative stomach weight of the mice is depicted as the percentage of body
weight; N = 7. Statistical analysis was performed by unpaired t test, ***, P < .001. B,
representative pictures of mouse stomachs illustrating the size increase after Dex treat-
ment compared to control (con). The photographs shown in panel B were kindly provid-
ed by Toni Weinhage (Reichardt et al., 2014).
Noteworthy, the observed effect was accompanied by a slight increase in drink-
ing volume but no change in food intake or dry feces as shown in Figure 7.
Figure 7. Oral administration of Dex for three days does not alter food intake or
dry feces and only leads to a slight increase in water intake.
Mice were treated with 50 mg/L Dex in the drinking water or were left untreated (con).
The left panel shows the total drinking volume during three days of treatment (N = 8/13).
Food intake and dry feces weight were measured for each individual mouse and are
shown in the middle (N = 6/12) and right panel (N = 4), respectively. Statistical analysis
was performed by unpaired t test, *, P < .05; n.s., not significant. These data were kindly
provided by Toni Weinhage (Reichardt et al., 2014).
RESULTS
37
3.1.2 Dex administration impairs gastric emptying
Having excluded altered excretion or feeding behaviour as a potential cause of
stomach enlargement after Dex administration, I suspected a reduced gastric
emptying rate as the underlying mechanism. To confirm this hypothesis a meth-
od for the measurement of gastric emptying was established. To this end mice
were fasted overnight and then force-fed a liquid test meal consisting of a methyl
cellulose solution of stable viscosity. To be able to later detect the remains of the
meal in the stomach it was stained with phenol red prior to feeding by oral ga-
vage. Either immediately as a baseline control or after 30 minutes the mice were
sacrificed and the stomach clamped, removed and homogenized before the ab-
sorption of the remaining stomach content was measured (Figure 8A). The re-
duced absorption observed after 30 minutes in control mice indicates that part of
the meal has been removed from the stomach as a result of normal gastric mo-
tility.
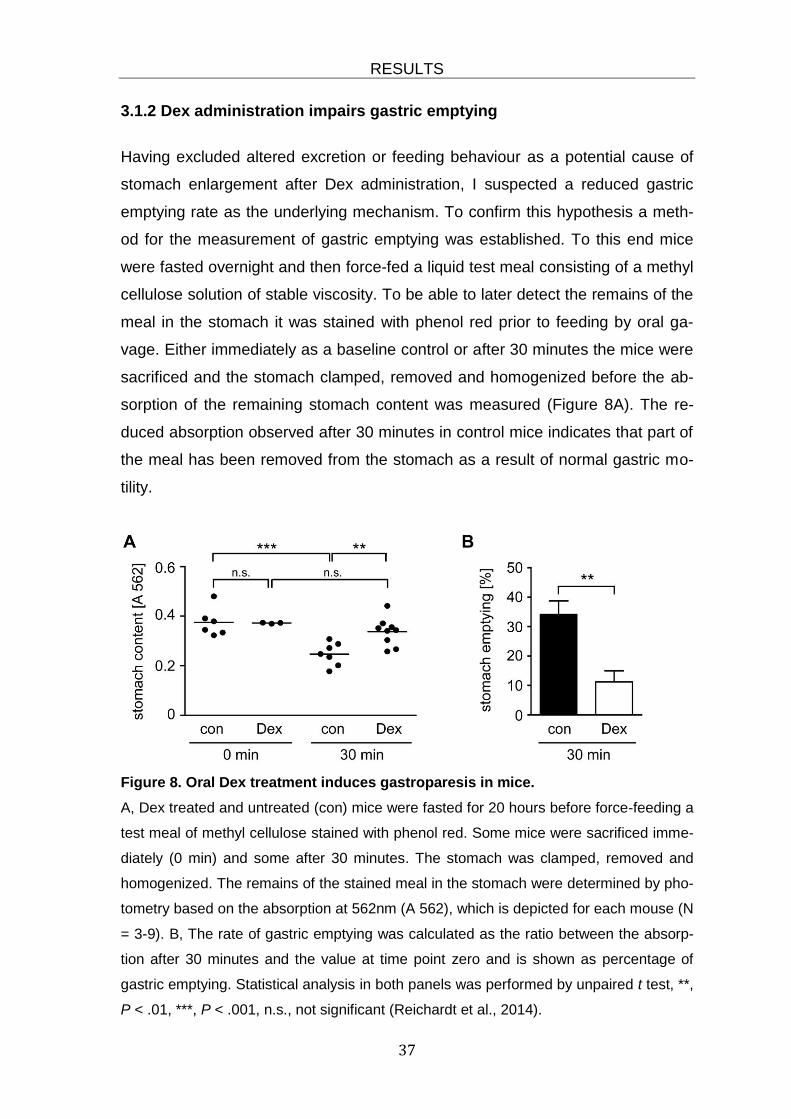
Figure 8. Oral Dex treatment induces gastroparesis in mice.
A, Dex treated and untreated (con) mice were fasted for 20 hours before force-feeding a
test meal of methyl cellulose stained with phenol red. Some mice were sacrificed imme-
diately (0 min) and some after 30 minutes. The stomach was clamped, removed and
homogenized. The remains of the stained meal in the stomach were determined by pho-
tometry based on the absorption at 562nm (A 562), which is depicted for each mouse (N
= 3-9). B, The rate of gastric emptying was calculated as the ratio between the absorp-
tion after 30 minutes and the value at time point zero and is shown as percentage of
gastric emptying. Statistical analysis in both panels was performed by unpaired t test, **,
P < .01, ***, P < .001, n.s., not significant (Reichardt et al., 2014).
RESULTS
38
3.1.3 Increase in stomach weight induced by Dex is dose-dependent
Although the initially administered high concentration of Dex indeed relates to
doses given to patients suffering from chronic inflammatory diseases such as
MS, I wanted to explore the dose dependency of gastroparesis induced by Dex.
To rule out that the observed effect was strain-specific I conducted the experi-
ment using both Balb/c and C57Bl/6 mice. Different concentrations of Dex were
provided via the drinking water for three days, ranging from 50 mg/L to 2 mg/L. It
turned out that a significant increase in the stomach weight could be seen even
at the lowest dosage in both strains (Figure 9).
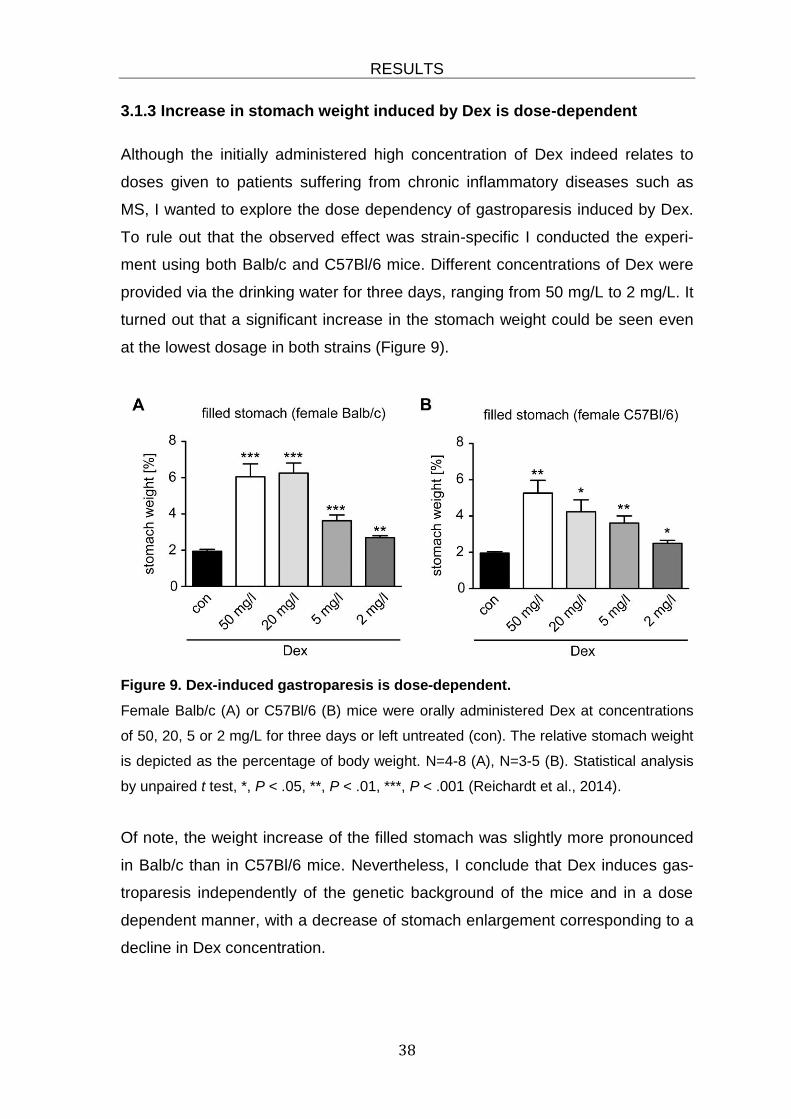
Figure 9. Dex-induced gastroparesis is dose-dependent.
Female Balb/c (A) or C57Bl/6 (B) mice were orally administered Dex at concentrations
of 50, 20, 5 or 2 mg/L for three days or left untreated (con). The relative stomach weight
is depicted as the percentage of body weight. N=4-8 (A), N=3-5 (B). Statistical analysis
by unpaired t test, *, P < .05, **, P < .01, ***, P < .001 (Reichardt et al., 2014).
Of note, the weight increase of the filled stomach was slightly more pronounced
in Balb/c than in C57Bl/6 mice. Nevertheless, I conclude that Dex induces gas-
troparesis independently of the genetic background of the mice and in a dose
dependent manner, with a decrease of stomach enlargement corresponding to a
decline in Dex concentration.

RESULTS
39
3.2 Target organ of GC-induced gastroparesis
3.2.1 Gastroparesis is preserved in GRvillinCre mice
GCs are known to influence many functional properties of the intestine amongst
others the uptake of glucose from enterocytes (Reichardt et al., 2012). For this
reason I wanted to know whether the observed GC-induced gastroparesis was a
direct effect on the stomach or rather an indirect effect resulting from so far un-
known GC activities in the intestine. I thus made use of GRvillinCre mice that lack
the GR in the intestine but not in the stomach. By using Western Blot I could
show that indeed protein expression of the GR was absent in the jejunum and
ileum of GRvillinCre mice, whereas it was normally expressed in the stomach of the
mutant mice (Figure 10).
B
Figure 10. GR protein expression in the intestine and stomach of GRvillincre mice.
GR protein levels were determined in the intestine (A) and the stomach (B) of GRvillinCre
as well as GRflox control mice by Western blot. β-tubulin served as a control. One repre-
sentative experiment is shown each (Reichardt et al., 2012; Reichardt et al., 2014).
Having confirmed the absence of GR protein in jejunum and ileum of GRvilinCre
mice and its presence in the stomach, I next tested whether GC effects on the
intestine were responsible for the induction of gastroparesis by orally applying 50
mg/L Dex to GRvilinCre mice as well as GRflox wildtype littermates. Importantly, the
stomach of both control and knock-out mice showed a significant increase in the
weight of the filled stomach after three days (Figure 11).
This suggests that gastroparesis is mainly a direct effect of GCs on the stomach
rather than an indirect effect on the intestine.

RESULTS
40
Figure 11. The GC-induced increase in stomach weight is preserved in enterocyte-
specific GR knock-out mice.
Mice were orally administered 50 mg/L Dex for three days or left untreated (con). The
relative stomach weight of GRflox control and GRvillinCre knock-out mice was determined
and is depicted as percentage of body weight; N = 5-9. Statistical analysis was per-
formed by 2-way ANOVA followed by Bonferroni multipe comparison test, n.s., not sig-
nificant (Reichardt et al., 2014).
3.3 Molecular mechanism of GC-induced gastroparesis
3.3.1 GC treatment of GRdim mice does not induce gastroparesis
GCs exert most of their functions through binding to the GR. Upon ligand binding
and translocation to the nucleus the GR can either trans-repress gene transcrip-
tion independently of DNA-binding, or it can trans-activate genes which requires
DNA-binding of the GR. GRdim mice carry the A458T point mutation in the second
zinc finger of the DBD, which impairs the ability of the GR to dimerize and there-
fore to modulate gene transcription in a DNA-binding dependent manner. Having
found that GC-induced gastroparesis is a direct effect on the stomach I set out to
determine the underlying molecular mechanism by employing GRdim mice.
To this end, GRdim and GRwt mice were treated with 50 mg/L Dex for up to three
days followed by the analysis of the stomach weight. A slight increase was ob-
served for both genotypes already after one day of Dex treatment. However,
when I treated the mice with Dex for three consecutive days the stomach of

RESULTS
41
wildtype mice was strongly enlarged whereas GRdim mice showed only a minor
increase in stomach weight and size (Figure 12A).
Subsequently I also determined the gastric emptying rate for GRwt and GRdim
mice after Dex treatment as described previously. While control mice showed
severe gastroparesis as expected, the gastric emptying rate of GRdim mice re-
mained unaltered (Figure 12B).
Figure 12. GC-induced gastroparesis is mediated by a DNA-binding dependent
mechanism of the GR.
GRwt and GRdim mice were orally administered 50 mg/L Dex or left untreated (con) for up
to three consecutive days. A, the relative stomach weight was determined after 1 and 3
days and is depicted as percentage of body weight, N = 5-9. B, Gastric emptying was
determined after three days of treatment using a photometric assay. In brief, mice were
force-fed a methyl cellulose solution stained with phenol red after being fasted for 20
hours. The remains of the stained test meal were determined on the basis of the absorp-
tion at 562 nm. For baseline control some mice were sacrificed immediately. The ratio of
stomach emptying was calculated and is depicted as percentage of stomach emptying
after 30 minutes N = 4-6. Statistical analysis by 2-way ANOVA followed by Bonferroni
multiple-comparison test, ***, p < .001; n.s., not significant (Reichardt et al., 2014).
Taken together, these findings indicate that GC-induced gastroparesis is mediat-
ed by DNA-binding dependent GR trans-activation.
RESULTS
42
3.3.2 GC-induced gastric acid secretion does not influence gastroparesis
Augmented secretion of hydrochloric acid (HCl) in the stomach is a well-known
consequence of either elevated levels of endogenous GCs after stress or follow-
ing pharmacological administration of synthetic GCs. In collaboration with the
group of Professor Dr. Florian Lang (University of Tübingen) the mechanism by
which GCs impact HCl secretion were studied. In addition, it was tested whether
HCl production is linked to GC-induced gastroparesis.
For that reason GRwt and GRdim mice were treated with Dex via the drinking wa-
ter for three consecutive days or left untreated. Subsequently the change in pH
value in the stomach per minute was measured. As expected, the secretion of
HCl was more pronounced in Dex-treated than in untreated wildtype mice. More-
over, increased gastric acid secretion after Dex treatment could be counteracted
by administering the proton pump inhibitor omeprazole. In contrast to wildtype
mice, the HCl secretion in the stomach of GRdim mice remained almost unaltered
after three days of Dex treatment (Figure 13A).
These findings confirm the well-known capacity of GCs to enhance gastric acid
secretion and indicate that dimerization of the GR and thus trans-activation of
GR target genes is required to achieve this effect.
Taking into consideration that both the stimulation of gastric acid secretion and
the induction gastroparesis by GCs were abolished in mice carrying the A485T
mutation of the GR, it was conceivable that there was a connection between
these two effects. However, previous work of my group could exclude such a
potential link between gastroparesis and HCl secretion.
Namely, in a former experiment female Balb/c mice had been treated with Dex
for three and ten days respectively. To counteract GC-induced gastric acid se-
cretion some mice had additionally received a daily injection of omeprazole, a
treatment that effectively abolishes enhanced gastric acid secretion after Dex
treatment (Figure 13A). Notably, a significant increase in stomach weight oc-
curred in both groups regardless of the additional treatment with omeprazole
(Figure 13B).
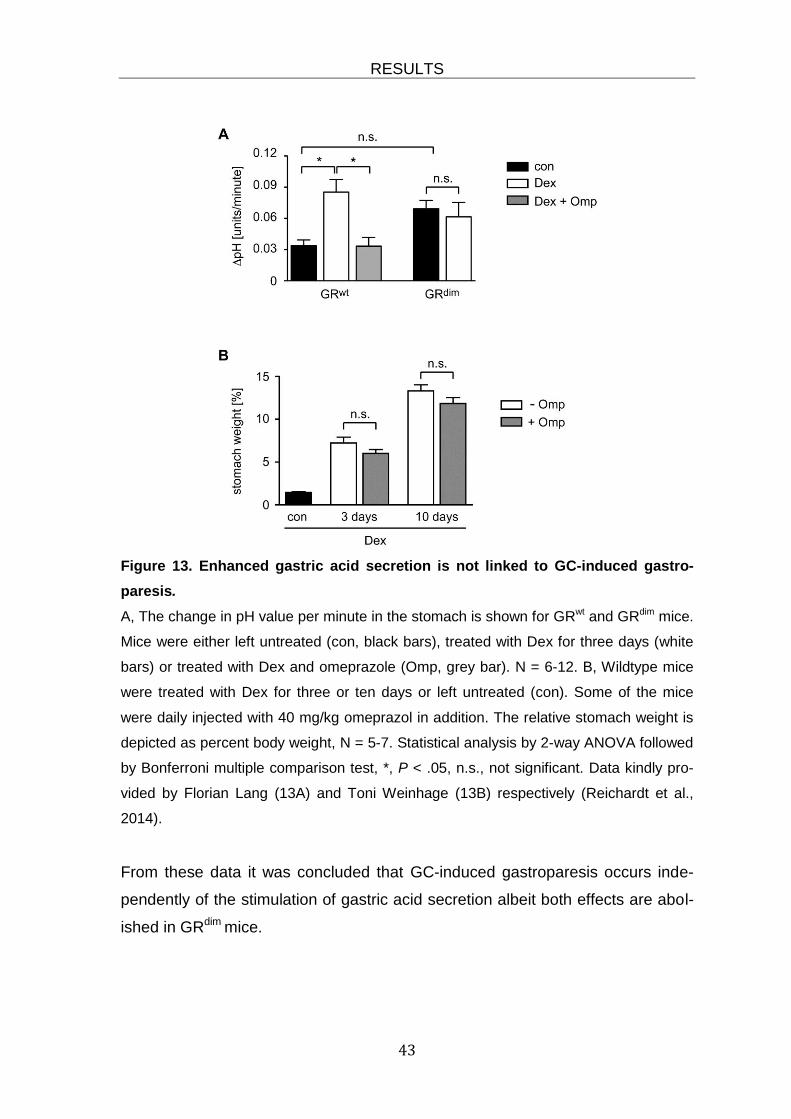
RESULTS
43
Figure 13. Enhanced gastric acid secretion is not linked to GC-induced gastro-
paresis.
A, The change in pH value per minute in the stomach is shown for GRwt and GRdim mice.
Mice were either left untreated (con, black bars), treated with Dex for three days (white
bars) or treated with Dex and omeprazole (Omp, grey bar). N = 6-12. B, Wildtype mice
were treated with Dex for three or ten days or left untreated (con). Some of the mice
were daily injected with 40 mg/kg omeprazol in addition. The relative stomach weight is
depicted as percent body weight, N = 5-7. Statistical analysis by 2-way ANOVA followed
by Bonferroni multiple comparison test, *, P < .05, n.s., not significant. Data kindly pro-
vided by Florian Lang (13A) and Toni Weinhage (13B) respectively (Reichardt et al.,
2014).
From these data it was concluded that GC-induced gastroparesis occurs inde-
pendently of the stimulation of gastric acid secretion albeit both effects are abol-
ished in GRdim mice.
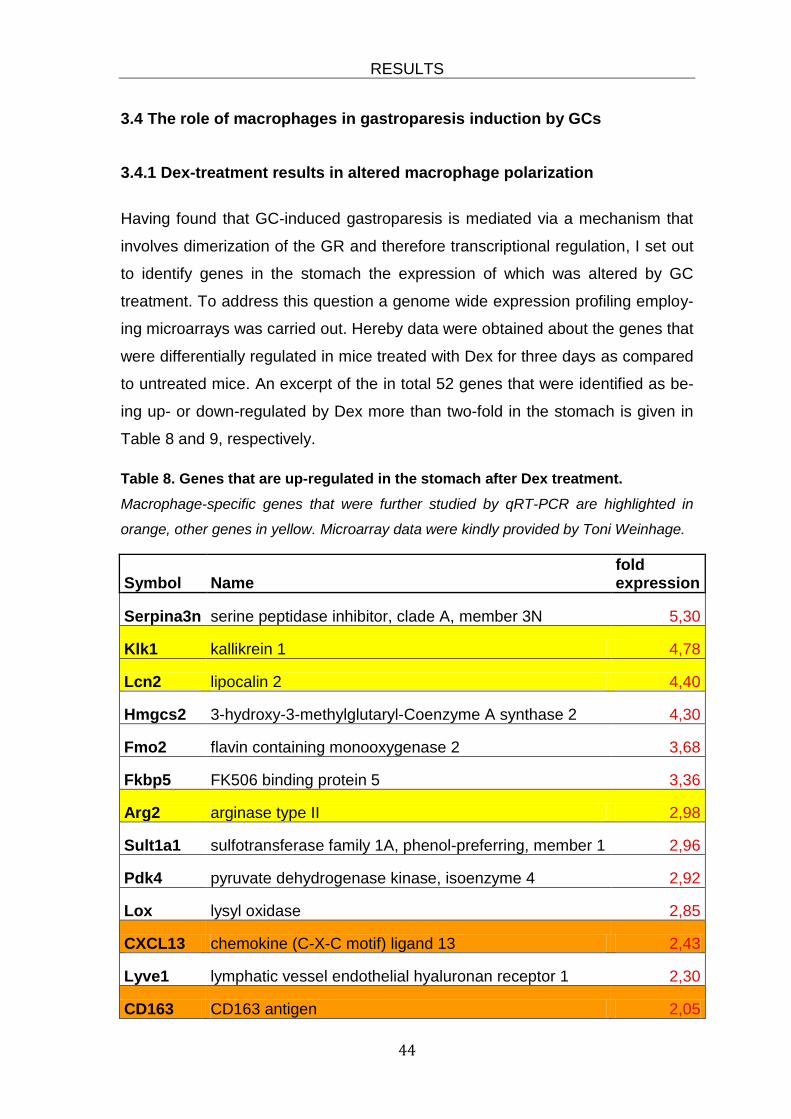
RESULTS
44
3.4 The role of macrophages in gastroparesis induction by GCs
3.4.1 Dex-treatment results in altered macrophage polarization
Having found that GC-induced gastroparesis is mediated via a mechanism that
involves dimerization of the GR and therefore transcriptional regulation, I set out
to identify genes in the stomach the expression of which was altered by GC
treatment. To address this question a genome wide expression profiling employ-
ing microarrays was carried out. Hereby data were obtained about the genes that
were differentially regulated in mice treated with Dex for three days as compared
to untreated mice. An excerpt of the in total 52 genes that were identified as be-
ing up- or down-regulated by Dex more than two-fold in the stomach is given in
Table 8 and 9, respectively.
Table 8. Genes that are up-regulated in the stomach after Dex treatment.
Macrophage-specific genes that were further studied by qRT-PCR are highlighted in
orange, other genes in yellow. Microarray data were kindly provided by Toni Weinhage.
Symbol Name fold expression
Serpina3n serine peptidase inhibitor, clade A, member 3N 5,30
Klk1 kallikrein 1 4,78
Lcn2 lipocalin 2 4,40
Hmgcs2 3-hydroxy-3-methylglutaryl-Coenzyme A synthase 2 4,30
Fmo2 flavin containing monooxygenase 2 3,68
Fkbp5 FK506 binding protein 5 3,36
Arg2 arginase type II 2,98
Sult1a1 sulfotransferase family 1A, phenol-preferring, member 1 2,96
Pdk4 pyruvate dehydrogenase kinase, isoenzyme 4 2,92
Lox lysyl oxidase 2,85
CXCL13 chemokine (C-X-C motif) ligand 13 2,43
Lyve1 lymphatic vessel endothelial hyaluronan receptor 1 2,30
CD163 CD163 antigen 2,05

RESULTS
45
Table 9. Genes that are down-regulated in the stomach after Dex treatment. Mac-
rophage-specific genes that were further studied by qRT-PCR are highlighted in blue,
other genes in green. Mircoarray data were kindly provided by Toni Weinhage.
Symbol Name fold expression
H2-Ab1 histocompatibility 2, class II antigen A, beta 1 -2,36
H2-Aa histocompatibility 2, class II antigen A, alpha -2,58
Gbp4 guanylate binding protein 4 -2,65
Nr1d1 nuclear receptor subfamily 1, group D, member 1 -2,66
Nr1d2 nuclear receptor subfamily 1, group D, member 2 -2,73
Gsta3 glutathione S-transferase, alpha 3 -2,83
Akr1b8 aldo-keto reductase family 1, member B8 -2,87
Igh-2 immunoglobulin heavy chain 2 (serum IgA) -2,95
H2-Ea histocompatibility 2, class II antigen E alpha -3,95
CD74 CD74 antigen (invariant polypeptide of major histocom-patibility complex, class II antigen-associated) -4,21
Nqo1 NAD(P)H dehydrogenase, quinone 1 -4,76
Gsdmc2 gasdermin C2 -8,67
Gsdmc3 gasdermin C3 -15,79
Strikingly, amongst the differentially expressed genes I identified some that are
specific for macrophages. GCs are known for their ability to impact macrophage
function, in particular by polarizing them from a pro-inflammatory M1 phenotype
towards an anti-inflammatory M2 phenotype (Varga et al., 2008). Accordingly,
genes that are specific for M2 polarized macrophages were up-regulated (high-
lighted in orange in Table 8), and those ones, which are specific for a M1 polari-
zation of macrophages, were down-regulated (highlighted in blue in Table 9).
To confirm the results from the microarray analysis I performed a qRT-PCR
analysis. Therefore mice were administered Dex via the drinking water or left
untreated. After three days the stomachs were removed and RNA was isolated
from the stomach corpus, reverse transcribed into cDNA and qRT-PCR per-
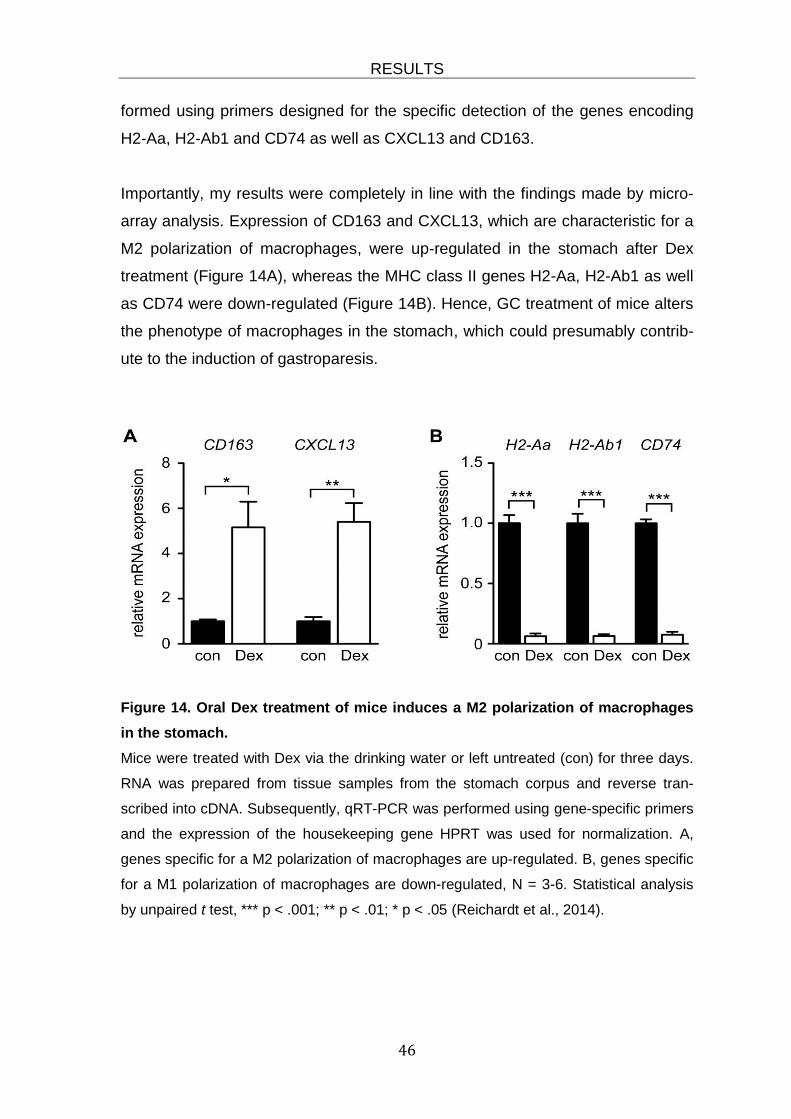
RESULTS
46
formed using primers designed for the specific detection of the genes encoding
H2-Aa, H2-Ab1 and CD74 as well as CXCL13 and CD163.
Importantly, my results were completely in line with the findings made by micro-
array analysis. Expression of CD163 and CXCL13, which are characteristic for a
M2 polarization of macrophages, were up-regulated in the stomach after Dex
treatment (Figure 14A), whereas the MHC class II genes H2-Aa, H2-Ab1 as well
as CD74 were down-regulated (Figure 14B). Hence, GC treatment of mice alters
the phenotype of macrophages in the stomach, which could presumably contrib-
ute to the induction of gastroparesis.
Figure 14. Oral Dex treatment of mice induces a M2 polarization of macrophages
in the stomach.
Mice were treated with Dex via the drinking water or left untreated (con) for three days.
RNA was prepared from tissue samples from the stomach corpus and reverse tran-
scribed into cDNA. Subsequently, qRT-PCR was performed using gene-specific primers
and the expression of the housekeeping gene HPRT was used for normalization. A,
genes specific for a M2 polarization of macrophages are up-regulated. B, genes specific
for a M1 polarization of macrophages are down-regulated, N = 3-6. Statistical analysis
by unpaired t test, *** p < .001; ** p < .01; * p < .05 (Reichardt et al., 2014).
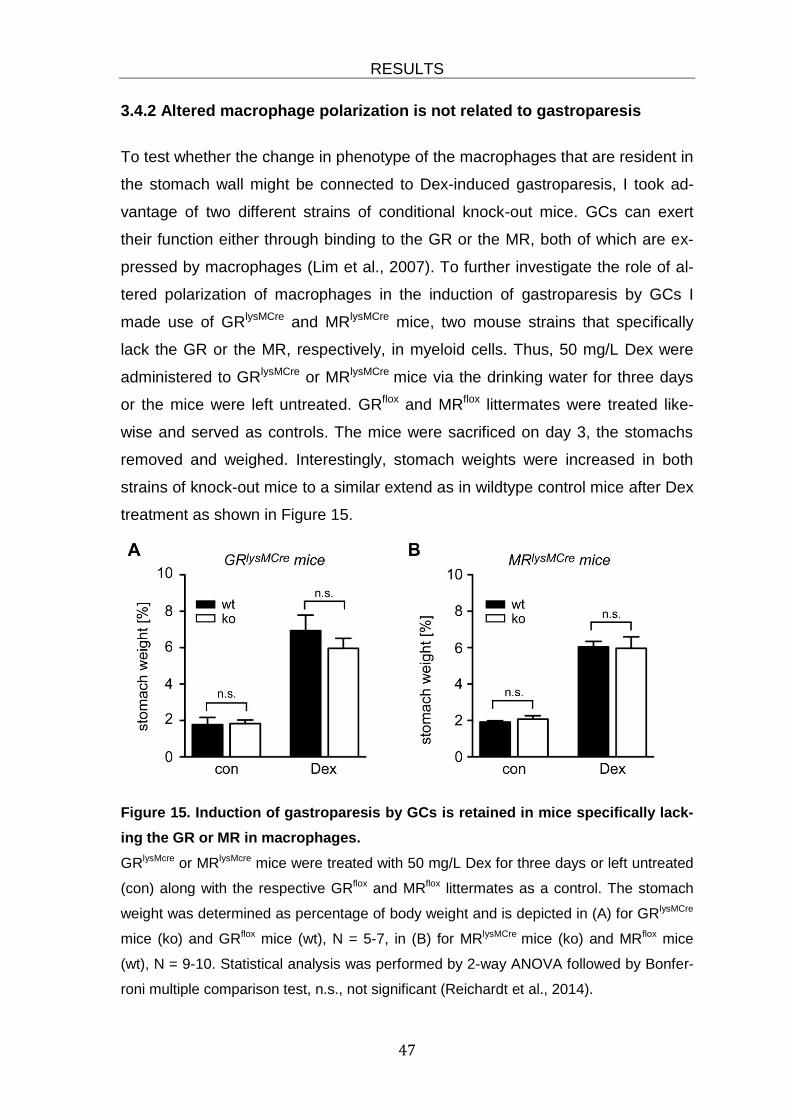
RESULTS
47
3.4.2 Altered macrophage polarization is not related to gastroparesis
To test whether the change in phenotype of the macrophages that are resident in
the stomach wall might be connected to Dex-induced gastroparesis, I took ad-
vantage of two different strains of conditional knock-out mice. GCs can exert
their function either through binding to the GR or the MR, both of which are ex-
pressed by macrophages (Lim et al., 2007). To further investigate the role of al-
tered polarization of macrophages in the induction of gastroparesis by GCs I
made use of GRlysMCre and MRlysMCre mice, two mouse strains that specifically
lack the GR or the MR, respectively, in myeloid cells. Thus, 50 mg/L Dex were
administered to GRlysMCre or MRlysMCre mice via the drinking water for three days
or the mice were left untreated. GRflox and MRflox littermates were treated like-
wise and served as controls. The mice were sacrificed on day 3, the stomachs
removed and weighed. Interestingly, stomach weights were increased in both
strains of knock-out mice to a similar extend as in wildtype control mice after Dex
treatment as shown in Figure 15.
Figure 15. Induction of gastroparesis by GCs is retained in mice specifically lack-
ing the GR or MR in macrophages.
GRlysMcre or MRlysMcre mice were treated with 50 mg/L Dex for three days or left untreated
(con) along with the respective GRflox and MRflox littermates as a control. The stomach
weight was determined as percentage of body weight and is depicted in (A) for GRlysMCre
mice (ko) and GRflox mice (wt), N = 5-7, in (B) for MRlysMCre mice (ko) and MRflox mice
(wt), N = 9-10. Statistical analysis was performed by 2-way ANOVA followed by Bonfer-
roni multiple comparison test, n.s., not significant (Reichardt et al., 2014).
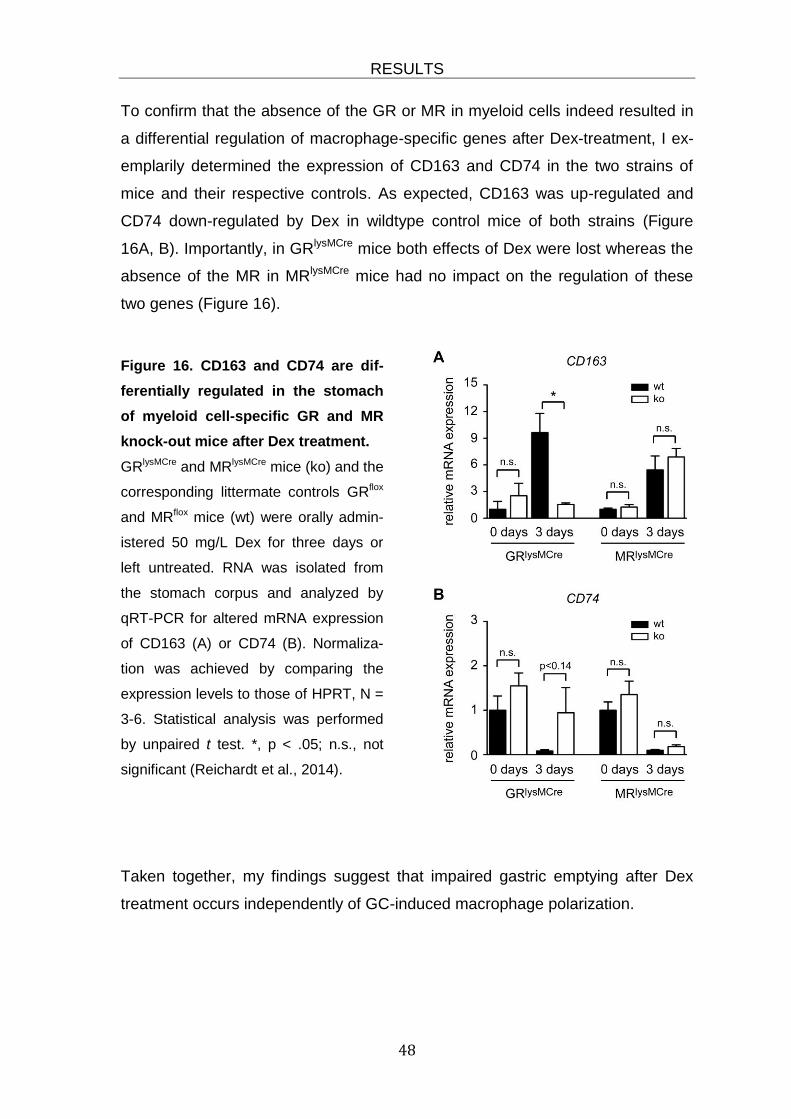
RESULTS
48
To confirm that the absence of the GR or MR in myeloid cells indeed resulted in
a differential regulation of macrophage-specific genes after Dex-treatment, I ex-
emplarily determined the expression of CD163 and CD74 in the two strains of
mice and their respective controls. As expected, CD163 was up-regulated and
CD74 down-regulated by Dex in wildtype control mice of both strains (Figure
16A, B). Importantly, in GRlysMCre mice both effects of Dex were lost whereas the
absence of the MR in MRlysMCre mice had no impact on the regulation of these
two genes (Figure 16).
Figure 16. CD163 and CD74 are dif-
ferentially regulated in the stomach
of myeloid cell-specific GR and MR
knock-out mice after Dex treatment.
GRlysMCre and MRlysMCre mice (ko) and the
corresponding littermate controls GRflox
and MRflox mice (wt) were orally admin-
istered 50 mg/L Dex for three days or
left untreated. RNA was isolated from
the stomach corpus and analyzed by
qRT-PCR for altered mRNA expression
of CD163 (A) or CD74 (B). Normaliza-
tion was achieved by comparing the
expression levels to those of HPRT, N =
3-6. Statistical analysis was performed
by unpaired t test. *, p < .05; n.s., not
significant (Reichardt et al., 2014).
Taken together, my findings suggest that impaired gastric emptying after Dex
treatment occurs independently of GC-induced macrophage polarization.
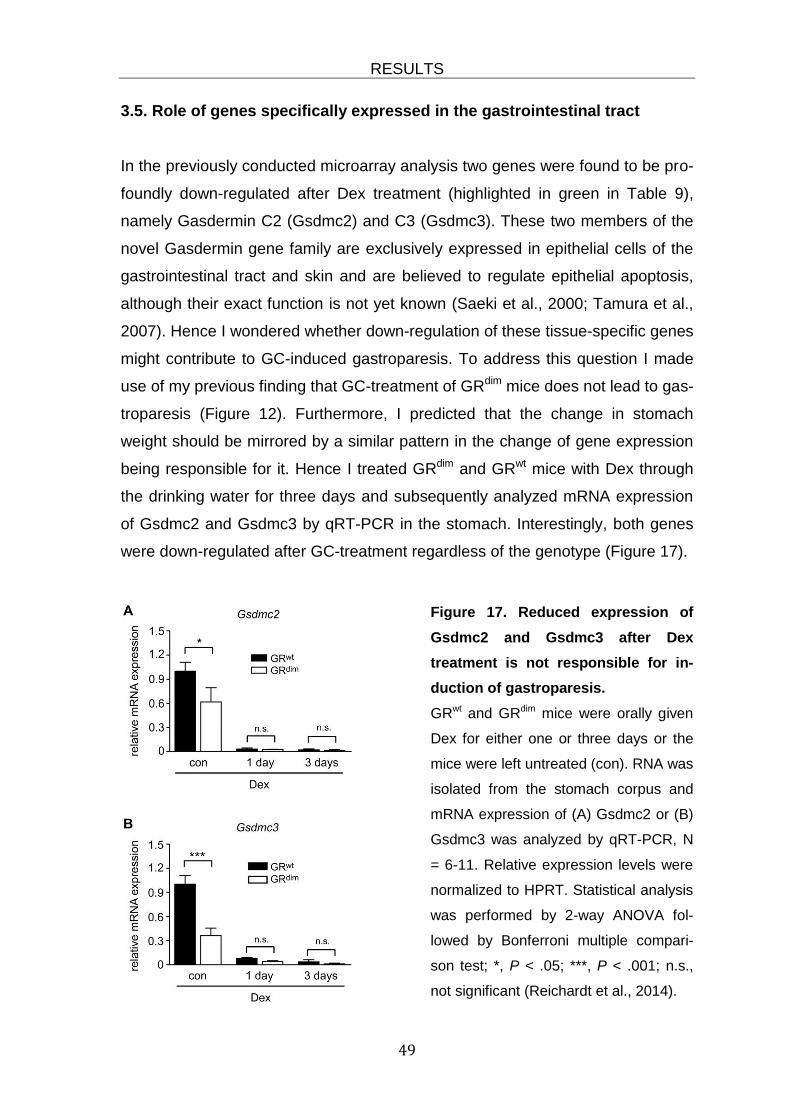
RESULTS
49
3.5. Role of genes specifically expressed in the gastrointestinal tract
In the previously conducted microarray analysis two genes were found to be pro-
foundly down-regulated after Dex treatment (highlighted in green in Table 9),
namely Gasdermin C2 (Gsdmc2) and C3 (Gsdmc3). These two members of the
novel Gasdermin gene family are exclusively expressed in epithelial cells of the
gastrointestinal tract and skin and are believed to regulate epithelial apoptosis,
although their exact function is not yet known (Saeki et al., 2000; Tamura et al.,
2007). Hence I wondered whether down-regulation of these tissue-specific genes
might contribute to GC-induced gastroparesis. To address this question I made
use of my previous finding that GC-treatment of GRdim mice does not lead to gas-
troparesis (Figure 12). Furthermore, I predicted that the change in stomach
weight should be mirrored by a similar pattern in the change of gene expression
being responsible for it. Hence I treated GRdim and GRwt mice with Dex through
the drinking water for three days and subsequently analyzed mRNA expression
of Gsdmc2 and Gsdmc3 by qRT-PCR in the stomach. Interestingly, both genes
were down-regulated after GC-treatment regardless of the genotype (Figure 17).
Figure 17. Reduced expression of
Gsdmc2 and Gsdmc3 after Dex
treatment is not responsible for in-
duction of gastroparesis.
GRwt and GRdim mice were orally given
Dex for either one or three days or the
mice were left untreated (con). RNA was
isolated from the stomach corpus and
mRNA expression of (A) Gsdmc2 or (B)
Gsdmc3 was analyzed by qRT-PCR, N
= 6-11. Relative expression levels were
normalized to HPRT. Statistical analysis
was performed by 2-way ANOVA fol-
lowed by Bonferroni multiple compari-
son test; *, P < .05; ***, P < .001; n.s.,
not significant (Reichardt et al., 2014).
RESULTS
50
3.6. Role of genes related to the regulation of gastric motility
3.6.1 Expression of kallikrein 1, lipocalin 2 and arginase 2 in the stomach
Having excluded the aforementioned genes Gsdmc2 and Gsdmc3 as possible
candidates being responsible for the induction of gastroparesis by Dex I next
focused on identifying genes that execute functions related to the regulation of
gastric motility. In this context I found kallikrein 1 (Klk1), lipocalin 2 (Lcn2) and
arginase 2 (Arg2) to be involved in the process of NO synthesis. All three of them
were up-regulated in the stomach after Dex treatment according to the previously
performed microarray analysis (highlighted in yellow in Table 8).
To further investigate whether these genes might indeed play a role in gastro-
paresis induction by GCs I employed the same strategy as described above,
namely to verify whether up-regulation of these genes occurs in both GRwt and
GRdim mice. Hence I isolated RNA from the corpus of mouse stomachs of GRwt
and GRdim mice after one or three days of oral Dex treatment and subsequently
analyzed changes in mRNA expression levels of Klk1, Lcn2 and Arg2 employing
qRT-PCR. Using this strategy I could confirm a considerable up-regulation of
each of the three genes in Dex-treated GRwt mice, whereas analysis of mRNA
expression levels in GRdim mice revealed only a slight increase after Dex treat-
ment as shown in Figure 18.
Following my previous line of argumentation, namely that genes that are differen-
tially regulated in GRdim and GRwt mice after Dex treatment should represent
promising candidates to play a role in gastroparesis induction, these findings
strongly suggested that each of the three analyzed genes might potentially be
linked to the effect of loss of gastric motility in mice receiving GCs via the drink-
ing water.
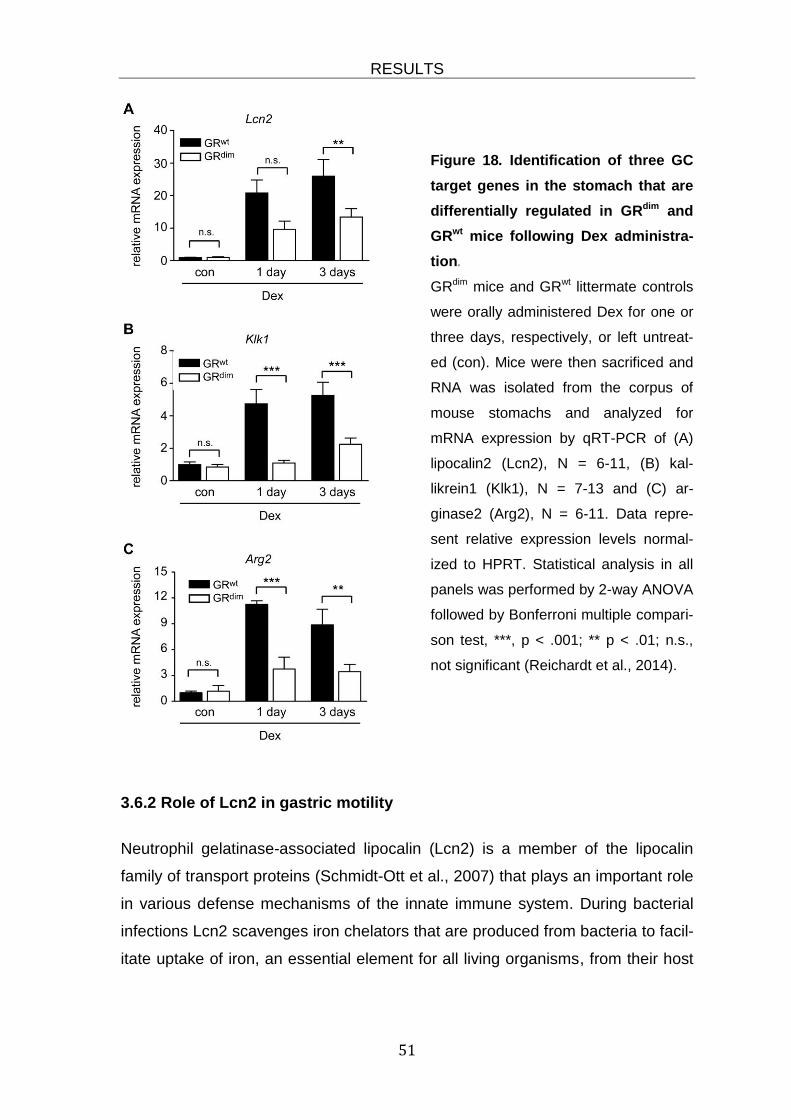
RESULTS
51
Figure 18. Identification of three GC
target genes in the stomach that are
differentially regulated in GRdim and
GRwt mice following Dex administra-
tion.
GRdim mice and GRwt littermate controls
were orally administered Dex for one or
three days, respectively, or left untreat-
ed (con). Mice were then sacrificed and
RNA was isolated from the corpus of
mouse stomachs and analyzed for
mRNA expression by qRT-PCR of (A)
lipocalin2 (Lcn2), N = 6-11, (B) kal-
likrein1 (Klk1), N = 7-13 and (C) ar-
ginase2 (Arg2), N = 6-11. Data repre-
sent relative expression levels normal-
ized to HPRT. Statistical analysis in all
panels was performed by 2-way ANOVA
followed by Bonferroni multiple compari-
son test, ***, p < .001; ** p < .01; n.s.,
not significant (Reichardt et al., 2014).
3.6.2 Role of Lcn2 in gastric motility
Neutrophil gelatinase-associated lipocalin (Lcn2) is a member of the lipocalin
family of transport proteins (Schmidt-Ott et al., 2007) that plays an important role
in various defense mechanisms of the innate immune system. During bacterial
infections Lcn2 scavenges iron chelators that are produced from bacteria to facil-
itate uptake of iron, an essential element for all living organisms, from their host
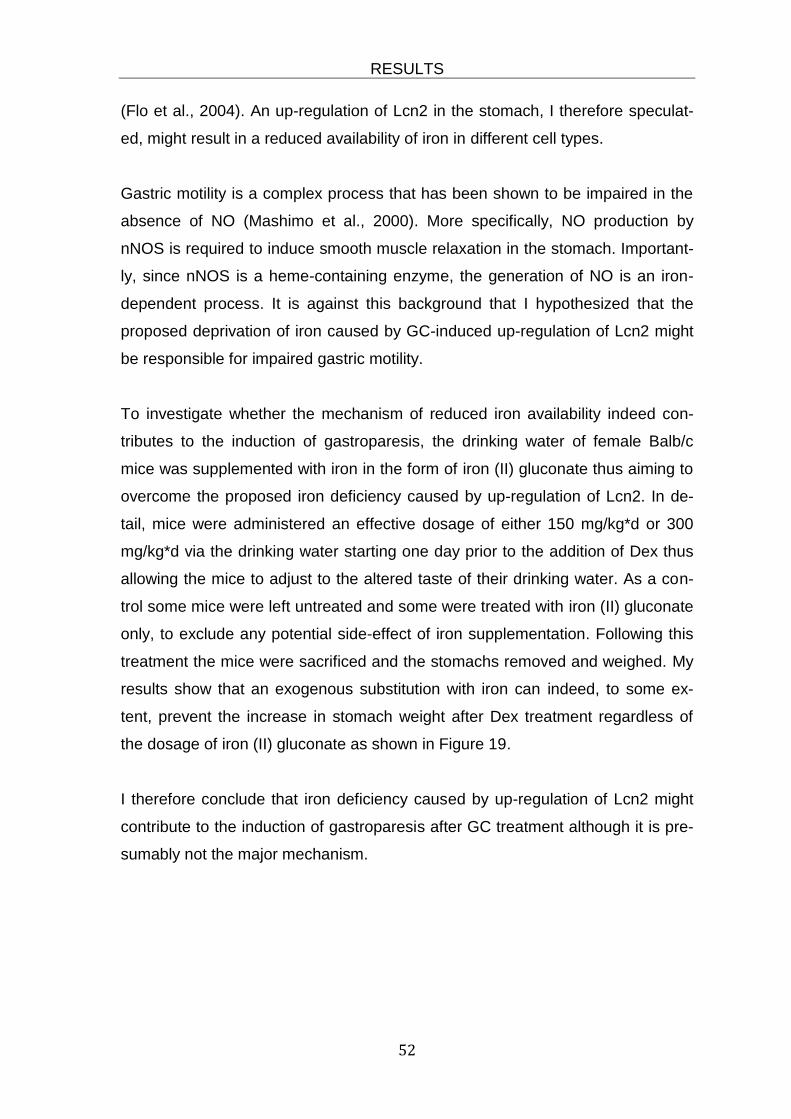
RESULTS
52
(Flo et al., 2004). An up-regulation of Lcn2 in the stomach, I therefore speculat-
ed, might result in a reduced availability of iron in different cell types.
Gastric motility is a complex process that has been shown to be impaired in the
absence of NO (Mashimo et al., 2000). More specifically, NO production by
nNOS is required to induce smooth muscle relaxation in the stomach. Important-
ly, since nNOS is a heme-containing enzyme, the generation of NO is an iron-
dependent process. It is against this background that I hypothesized that the
proposed deprivation of iron caused by GC-induced up-regulation of Lcn2 might
be responsible for impaired gastric motility.
To investigate whether the mechanism of reduced iron availability indeed con-
tributes to the induction of gastroparesis, the drinking water of female Balb/c
mice was supplemented with iron in the form of iron (II) gluconate thus aiming to
overcome the proposed iron deficiency caused by up-regulation of Lcn2. In de-
tail, mice were administered an effective dosage of either 150 mg/kg*d or 300
mg/kg*d via the drinking water starting one day prior to the addition of Dex thus
allowing the mice to adjust to the altered taste of their drinking water. As a con-
trol some mice were left untreated and some were treated with iron (II) gluconate
only, to exclude any potential side-effect of iron supplementation. Following this
treatment the mice were sacrificed and the stomachs removed and weighed. My
results show that an exogenous substitution with iron can indeed, to some ex-
tent, prevent the increase in stomach weight after Dex treatment regardless of
the dosage of iron (II) gluconate as shown in Figure 19.
I therefore conclude that iron deficiency caused by up-regulation of Lcn2 might
contribute to the induction of gastroparesis after GC treatment although it is pre-
sumably not the major mechanism.
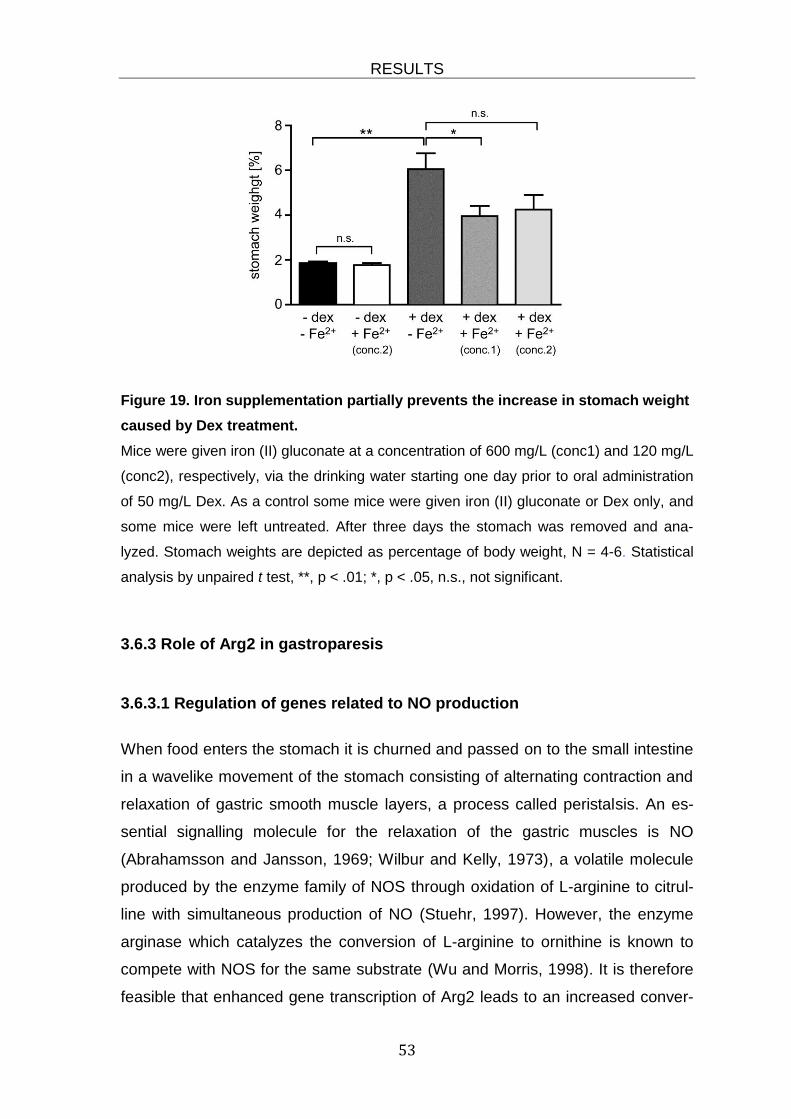
RESULTS
53
Figure 19. Iron supplementation partially prevents the increase in stomach weight
caused by Dex treatment.
Mice were given iron (II) gluconate at a concentration of 600 mg/L (conc1) and 120 mg/L
(conc2), respectively, via the drinking water starting one day prior to oral administration
of 50 mg/L Dex. As a control some mice were given iron (II) gluconate or Dex only, and
some mice were left untreated. After three days the stomach was removed and ana-
lyzed. Stomach weights are depicted as percentage of body weight, N = 4-6. Statistical
analysis by unpaired t test, **, p < .01; *, p < .05, n.s., not significant.
3.6.3 Role of Arg2 in gastroparesis
3.6.3.1 Regulation of genes related to NO production
When food enters the stomach it is churned and passed on to the small intestine
in a wavelike movement of the stomach consisting of alternating contraction and
relaxation of gastric smooth muscle layers, a process called peristalsis. An es-
sential signalling molecule for the relaxation of the gastric muscles is NO
(Abrahamsson and Jansson, 1969; Wilbur and Kelly, 1973), a volatile molecule
produced by the enzyme family of NOS through oxidation of L-arginine to citrul-
line with simultaneous production of NO (Stuehr, 1997). However, the enzyme
arginase which catalyzes the conversion of L-arginine to ornithine is known to
compete with NOS for the same substrate (Wu and Morris, 1998). It is therefore
feasible that enhanced gene transcription of Arg2 leads to an increased conver-
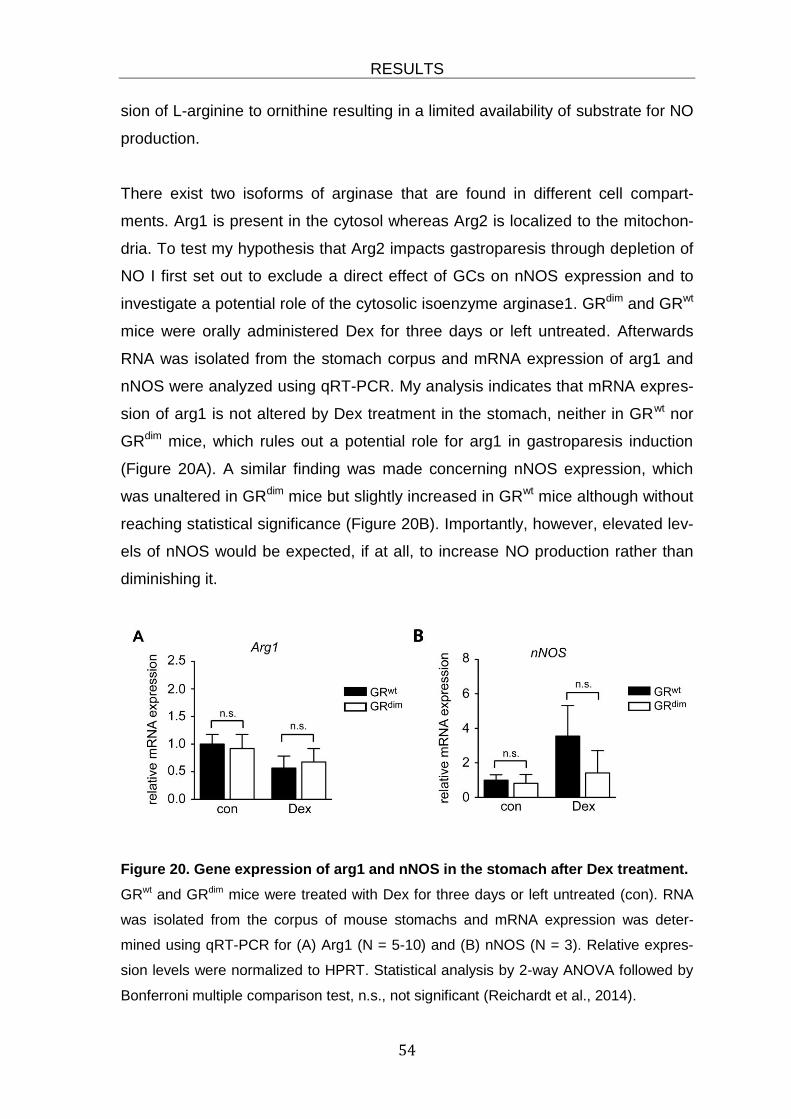
RESULTS
54
sion of L-arginine to ornithine resulting in a limited availability of substrate for NO
production.
There exist two isoforms of arginase that are found in different cell compart-
ments. Arg1 is present in the cytosol whereas Arg2 is localized to the mitochon-
dria. To test my hypothesis that Arg2 impacts gastroparesis through depletion of
NO I first set out to exclude a direct effect of GCs on nNOS expression and to
investigate a potential role of the cytosolic isoenzyme arginase1. GRdim and GRwt
mice were orally administered Dex for three days or left untreated. Afterwards
RNA was isolated from the stomach corpus and mRNA expression of arg1 and
nNOS were analyzed using qRT-PCR. My analysis indicates that mRNA expres-
sion of arg1 is not altered by Dex treatment in the stomach, neither in GRwt nor
GRdim mice, which rules out a potential role for arg1 in gastroparesis induction
(Figure 20A). A similar finding was made concerning nNOS expression, which
was unaltered in GRdim mice but slightly increased in GRwt mice although without
reaching statistical significance (Figure 20B). Importantly, however, elevated lev-
els of nNOS would be expected, if at all, to increase NO production rather than
diminishing it.
Figure 20. Gene expression of arg1 and nNOS in the stomach after Dex treatment.
GRwt and GRdim mice were treated with Dex for three days or left untreated (con). RNA
was isolated from the corpus of mouse stomachs and mRNA expression was deter-
mined using qRT-PCR for (A) Arg1 (N = 5-10) and (B) nNOS (N = 3). Relative expres-
sion levels were normalized to HPRT. Statistical analysis by 2-way ANOVA followed by
Bonferroni multiple comparison test, n.s., not significant (Reichardt et al., 2014).
RESULTS
55
Altogether, these findings exclude that GC treatment influences NO production
by impacting the expression of other genes, at least not via direct effects on Arg1
and nNOS.
3.6.3.2 Regulation of Arg2 at the protein level
To further investigate the role of Arg2 in gastroparesis I set out to test whether
the enhanced transcription of Arg2 also translated into higher protein levels.
Hence, female Balb/c mice were administered Dex via the drinking water for
three days or left untreated. Stomachs were then removed and lysates were pre-
pared. By employing Western Blot analysis I could identify a strong increase in
Arg2 protein levels in GRwt but not in GRdim mice (Figure 21).
Figure 21. Arg2 protein levels are
increased after Dex treatment in GRwt
but not GRdim mice.
Protein was isolated from the stomach
of GRdim or GRwt mice treated with Dex
for three days or left untreated (con) and
analyzed for Arg2 protein levels by
Western Blot. ERK was used as a load-
ing control. One representative experi-
ment is shown (Reichardt et al., 2014).
These findings strongly support my hypothesis that an increase in Arg2 mRNA
expression leads to an enhanced translation into Arg2 protein, which in turn pre-
sumably leads to an increase of enzymatic capacity for the conversion of
L-arginine to ornithine thus depleting the substrate for NO production.
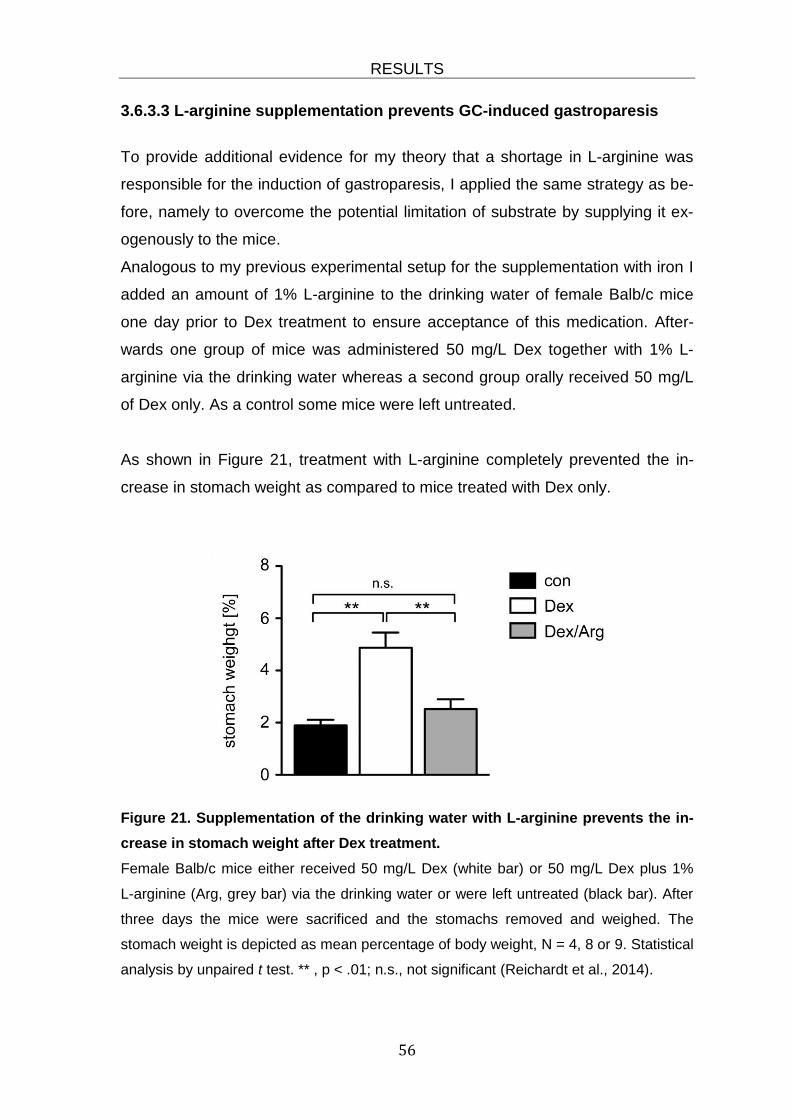
RESULTS
56
3.6.3.3 L-arginine supplementation prevents GC-induced gastroparesis
To provide additional evidence for my theory that a shortage in L-arginine was
responsible for the induction of gastroparesis, I applied the same strategy as be-
fore, namely to overcome the potential limitation of substrate by supplying it ex-
ogenously to the mice.
Analogous to my previous experimental setup for the supplementation with iron I
added an amount of 1% L-arginine to the drinking water of female Balb/c mice
one day prior to Dex treatment to ensure acceptance of this medication. After-
wards one group of mice was administered 50 mg/L Dex together with 1% L-
arginine via the drinking water whereas a second group orally received 50 mg/L
of Dex only. As a control some mice were left untreated.
As shown in Figure 21, treatment with L-arginine completely prevented the in-
crease in stomach weight as compared to mice treated with Dex only.
Figure 21. Supplementation of the drinking water with L-arginine prevents the in-
crease in stomach weight after Dex treatment.
Female Balb/c mice either received 50 mg/L Dex (white bar) or 50 mg/L Dex plus 1%
L-arginine (Arg, grey bar) via the drinking water or were left untreated (black bar). After
three days the mice were sacrificed and the stomachs removed and weighed. The
stomach weight is depicted as mean percentage of body weight, N = 4, 8 or 9. Statistical
analysis by unpaired t test. ** , p < .01; n.s., not significant (Reichardt et al., 2014).
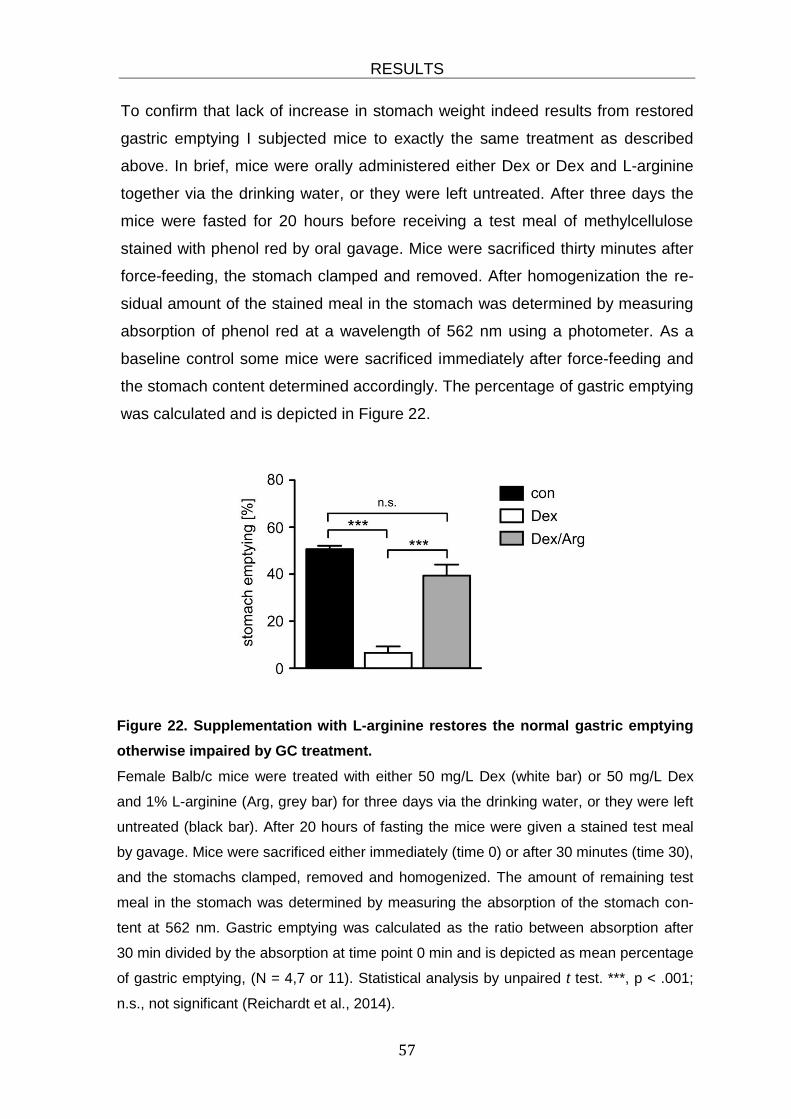
RESULTS
57
To confirm that lack of increase in stomach weight indeed results from restored
gastric emptying I subjected mice to exactly the same treatment as described
above. In brief, mice were orally administered either Dex or Dex and L-arginine
together via the drinking water, or they were left untreated. After three days the
mice were fasted for 20 hours before receiving a test meal of methylcellulose
stained with phenol red by oral gavage. Mice were sacrificed thirty minutes after
force-feeding, the stomach clamped and removed. After homogenization the re-
sidual amount of the stained meal in the stomach was determined by measuring
absorption of phenol red at a wavelength of 562 nm using a photometer. As a
baseline control some mice were sacrificed immediately after force-feeding and
the stomach content determined accordingly. The percentage of gastric emptying
was calculated and is depicted in Figure 22.
Figure 22. Supplementation with L-arginine restores the normal gastric emptying
otherwise impaired by GC treatment.
Female Balb/c mice were treated with either 50 mg/L Dex (white bar) or 50 mg/L Dex
and 1% L-arginine (Arg, grey bar) for three days via the drinking water, or they were left
untreated (black bar). After 20 hours of fasting the mice were given a stained test meal
by gavage. Mice were sacrificed either immediately (time 0) or after 30 minutes (time 30),
and the stomachs clamped, removed and homogenized. The amount of remaining test
meal in the stomach was determined by measuring the absorption of the stomach con-
tent at 562 nm. Gastric emptying was calculated as the ratio between absorption after
30 min divided by the absorption at time point 0 min and is depicted as mean percentage
of gastric emptying, (N = 4,7 or 11). Statistical analysis by unpaired t test. ***, p < .001;
n.s., not significant (Reichardt et al., 2014).

RESULTS
58
As found previously, gastric emptying was strongly impaired after three days of
oral Dex treatment. Importantly, the additional administration of L-arginine to-
gether with Dex completely restored gastric emptying to normal levels. Hence,
this finding is in line with my previous observation that supplementation with
L-arginine prevents the increase in stomach weight after GC administration.
Arg2 catalyzes the conversion of arginine to ornithine. The latter is further catab-
olized by ornithine decarboxylase (Odc) to produce polyamines. Accordingly I
hypothesized that increased availability of L-arginine would lead to increased
mRNA expression levels of Arg2 and Odc. To test this hypothesis I isolated RNA
from the corpus of stomachs of mice that were treated with Dex or a combination
of Dex and L-arginine, or left untreated, and subsequently performed a qRT-PCR
analysis. In line with my previous findings the expression of Arg2 was increased
after Dex treatment. Furthermore, Odc was also higher, presumably as a result
of the enhanced enzymatic capacity of Arg2 to produce ornithine leading to an
increased substrate availability for Odc. More importantly, however, supplemen-
tation of the drinking water with L-arginine led to a further increase in both Arg2
and Odc mRNA expression (Figure 23).
Figure 23. Supplementation with L-arginine leads to enhanced expression of Arg2
and Odc
Mice were treated with Dex ± L-arginine or left untreated. RNA was isolated from the
stomach corpus and mRNA expression levels of arg2 (A) and odc (B) were determined
by qRT-PCR and normalized to HPRT as a housekeeping gene. N = 4, 7, or 9. Statisti-
cal analysis by Mann-Whitney U test. **, p < .01; *, p < .05; n.s., not significant (Reich-
ardt et al., 2014).

RESULTS
59
These results confirm that L-arginine indeed reaches the stomach and impacts
the respective metabolic enzymes. Since the conversion to ornithin and polyam-
ines is increased, one can deduce that also NO production is restored by this
measure.
Taken together these findings strongly support the hypothesis that Dex-induced
gastroparesis is caused by depletion of L-arginine.
3.6.3.4 Inhibition of Arg2 only partially restores gastric emptying
Another possibility to restore the availability of L-arginine, which is the substrate
for nNOS and needed to produce NO in order to allow for proper gastric empty-
ing, is to inhibit the competitive reaction catalyzed by Arg2. In general, inhibition
of arginase can be achieved by arginine analogues by blocking the binding site
for the substrate. However, under these conditions also NOS is at risk of being
inhibited. Therefore I used (S)-(2-Boronoethyl)-L-cystein hydrochlorid (BEC) in
my experiments to selectively inhibit arginase but not NOS activity.
In detail, mice were treated with Dex via the drinking water for three days.
Throughout the whole duration of the treatment, mice additionally received 0,1 ml
of BEC at a concentration of 1 mg/ml once a day by oral gavage. Upon comple-
tion of the treatment, mice were sacrificed and either the stomach weight or gas-
tric emptying was determined (Figure 24A,B). Notably, neither the increase in
stomach weight nor gastroparesis could be completely prevented by administra-
tion of BEC. Nonetheless, there was a clear effect on both parameters although
the reduction of stomach weight as well as the improvement in gastric emptying
just missed significance. My finding that the rescue effect of the BEC treatment
was not as good as the one of L-arginine supplementation may be due to the fact
that BEC could only be applied intermittently while administration of Dex was
continuously maintained throughout the whole experiment. Hence, up-regulation
of Arg2 by Dex and the presumably resulting higher enzymatic capacity for the
conversion of arginine to ornithine could only be counteracted by the inhibition of
arginase during limited periods of time. Unfortunately a continuous application of
the inhibitor was not possible due to technical reasons. Furthermore, the admin-
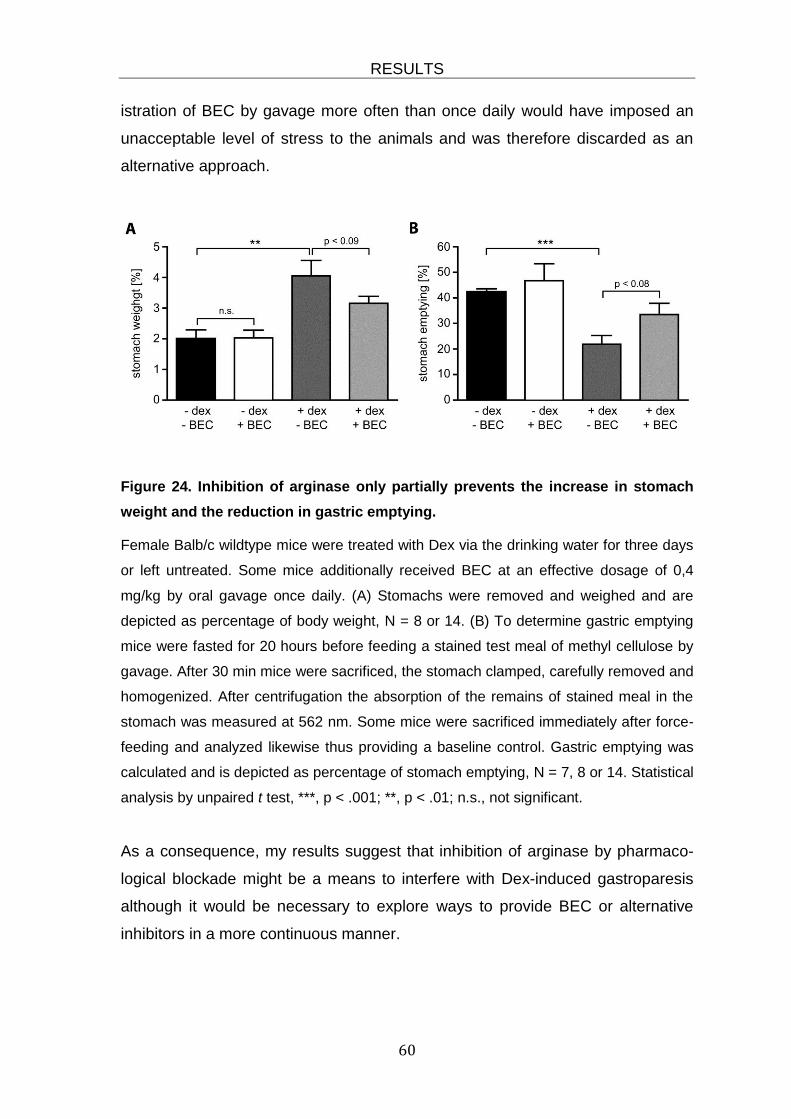
RESULTS
60
istration of BEC by gavage more often than once daily would have imposed an
unacceptable level of stress to the animals and was therefore discarded as an
alternative approach.
Figure 24. Inhibition of arginase only partially prevents the increase in stomach
weight and the reduction in gastric emptying.
Female Balb/c wildtype mice were treated with Dex via the drinking water for three days
or left untreated. Some mice additionally received BEC at an effective dosage of 0,4
mg/kg by oral gavage once daily. (A) Stomachs were removed and weighed and are
depicted as percentage of body weight, N = 8 or 14. (B) To determine gastric emptying
mice were fasted for 20 hours before feeding a stained test meal of methyl cellulose by
gavage. After 30 min mice were sacrificed, the stomach clamped, carefully removed and
homogenized. After centrifugation the absorption of the remains of stained meal in the
stomach was measured at 562 nm. Some mice were sacrificed immediately after force-
feeding and analyzed likewise thus providing a baseline control. Gastric emptying was
calculated and is depicted as percentage of stomach emptying, N = 7, 8 or 14. Statistical
analysis by unpaired t test, ***, p < .001; **, p < .01; n.s., not significant.
As a consequence, my results suggest that inhibition of arginase by pharmaco-
logical blockade might be a means to interfere with Dex-induced gastroparesis
although it would be necessary to explore ways to provide BEC or alternative
inhibitors in a more continuous manner.
DISCUSSION
61
4. Discussion
4.1 Adverse effects of glucocorticoids in the gastrointestinal tract
Despite the fact that pharmacological application of GCs can lead to a plethora
of side-effects they are still the gold standard for treating a variety of autoimmune
and atopic disorders, other inflammatory conditions such as Graft-versus-host
disease as well as neoplastic diseases including leukemia and lymphoma. Typi-
cally encountered adverse effects of GCs are hyperglycemia, diabetes, myopa-
thies, elevated blood pressure, osteoporosis, growth retardation and depression.
However, there are also side-effects that concern the gastrointestinal tract. In my
study I focussed on a novel activity of GCs in the stomach, namely the induction
of gastroparesis. Of note, GCs have previously been found to affect the digestive
system in several ways. For instance, it is well known that increased levels of
endogenous GCs, e.g. during emotional or physical stress, as well as synthetic
GCs administered during therapy enhance gastric acid secretion and may there-
fore foster the formation of peptic ulcers. Furthermore, gastrointestinal bleeding
and pancreatitis have been reported to accompany GC therapy as well (Schäcke
et al., 2002).
This work now gives evidence that gastroparesis is a so far unknown side-effect
of GC therapy. Although impaired gastric motility is well known to occur in the
course of diabetes, it has not yet been referred to as an adverse effect of high-
dose oral GC therapy. Contrariwise, gastrointestinal disturbances in general are
frequently reported as symptoms accompanying GC therapy. It may therefore
well be that discomfort experienced by patients is in fact caused by gastroparesis
but wrongly assigned to enhanced gastric acid secretion and the formation of
ulcers.
In recent years considerable effort has been made to dissect beneficial and ad-
verse GC effects. To put it simple, GC actions mediated by transcriptional regu-
lation can be subdivided into two major groups based on their molecular mecha-
nism, namely those relying on trans-activation of genes as opposed to those re-

DISCUSSION
62
sulting from trans-repression of genes. It was long believed that trans-activation
was responsible for most of the unwanted physiological effects of GCs, whereas
anti-inflammatory properties were thought to be mainly mediated by the trans-
repression mechanism. A common strategy to reduce side-effects caused by
GCs was therefore the development of new drugs that dissociate these two
modes of action. A couple of compounds with such properties, e.g. ZK 216348 or
Org214007, have been reported over the years but none of them made it into the
clinic so far (Schäcke et al., 2004; van Lierop et al., 2012). This is possibly be-
cause it has recently become clear that the concept of dissecting trans-activation
and trans-repression as a mean to avoid adverse effects had been oversimpli-
fied.
Namely, it has been shown that some anti-inflammatory effects of GCs require
gene trans-activation (Clark, 2007) whereas some side-effects are the result of
the combination of gene trans-activation and trans-repression (Schäcke et al.,
2004). One example of a major side-effect of GC therapy that is even exclusively
mediated by trans-repression is osteoporosis. This observation was made when
treating GRdim mice with synthetic GCs, which efficiently induced bone loss de-
spite the disruption of GR trans-activation in these mice (Rauch et al., 2010).
This example clearly shows that it will not be possible to separate all beneficial
from the adverse GC effects by dissociating GC derivatives although it might still
be feasible to separate selected anti-inflammatory properties from individual side
effects.
Interestingly, many of the adverse effects of GCs in the gastrointestinal tract ap-
parently rely on gene trans-activation by the GR. This includes the enhanced
intestinal glucose uptake that contributes to hyperglycemia (Reichardt et al.,
2012), the increase in gastric acid secretion and, as identified in this work, the
induction of gastroparesis. Currently it is not known whether the treatment of
IBD, one of the major therapeutic applications of synthetic GCs in the gastroin-
testinal tract, requires trans-activation or rather trans-repression of genes by the
GR. Nonetheless, it is likely that the trans-repressive mechanism at least plays
some role, which would open up the possibility to separate the beneficial GC ef-
DISCUSSION
63
fects in the treatment of IBD at least partially from the adverse ones in the gas-
trointestinal tract. Despite the fact that none of the new dissociating GR ligands
could so far meet the expectations to overcome all side-effects of GC therapy,
our study now suggests that the idea to design new drugs specifically aimed to
prevent adverse effects in the stomach remains a promising approach.
4.2 The molecular mechanism of GCs in gastroparesis
The induction of gastroparesis by high-dose oral GC therapy has to my
knowledge not been described before in literature. Accordingly, nothing has been
known concerning the underlying molecular mechanism. To tackle this issue
several experimental approaches have been taken, including conditional knock-
out mice, gene expression analysis and physiological assays. First, GRvillinCre
mice allowed me to exclude that gastroparesis was indirectly caused by GC ef-
fects on the intestine. Second, the analysis of GRdim mice indicated that altered
gene transcription and, more specifically, gene trans-activation by the GR was
responsible for this effect. Based on these findings it was reasonable to search
for genes that were transcriptionally altered by Dex treatment in the stomach. By
using this method a number of promising candidates could be identified.
The stomach wall contains a considerable number of macrophages and conse-
quently several genes specific for this cell type were identified to be affected by
Dex treatment. Of note, macrophages can polarize to phenotypes designated M1
or M2. Interestingly, the observed changes in the stomach were typical for a M2
polarization, which is generally observed in response to GC action (Varga et al.,
2008). Whilst I could confirm the changes in gene expression and thus the M2
polarization by qRT-PCR, neither the deletion of the GR nor of the MR, two re-
ceptors which are able to bind GCs, had any effect on the induction of gastro-
paresis. This suggests that macrophages are not a cause of impaired gastric
motility but may rather serve as a repair mechanism in the stomach aimed to
counteract other GC effects in the stomach such as ulcers.
DISCUSSION
64
Amongst the genes identified in the mircroarray experiment there were also two
genes which are largely restricted to the gastrointestinal tract (Saeki et al., 2000).
Gsdmc 2 and 3 were strongly down-regulated after Dex treatment, however this
was the case in GRwt as well as GRdim mice. Since GRdim mice do not develop
gastroparesis in response to GC therapy it is unlikely that inhibition of Gsmdc 2
and 3 contribute to this adverse effect in the stomach.
In contrast to the two gasdermin genes, Lcn2, Klk1 and Arg2 were up-regulated
after Dex treatment and, importantly, this was only the case in GRwt but not
GRdim mice. Hence, the regulation of these genes by Dex parallels the induction
of gastroparesis in mice of both genotypes. Lcn2 is known for its capacity to re-
duce iron availability (Flo et al., 2004), and iron is part of the heme-complex
which, in turn, is required for enzymatic activity of NOS. Consequently, enhanced
levels of Lcn2 would be expected to impair NOS function and thereby NO pro-
duction. As outlined below, this is a prerequisite for proper gastric motility. My
attempt to exogenously provide iron to overcome a potential shortage of iron due
to increased Lcn2 expression normalized gastric motility partially but not com-
pletely. This can be interpreted in such a way, that the postulated effect of higher
Lcn2 expression indeed contributes to the induction of gastroparesis but does
not suffice to explain it.
Gastric motility is a complex process that requires the interaction between the
enteric and the central nervous system. Intriguingly, NO, a small volatile mole-
cule, is a key player in the signal transduction pathway that regulates muscle
contraction and relaxation in the stomach (Rivera et al., 2011). It is produced
through the conversion of L-arginine to citrulline and NO, a reaction catalyzed by
nNOS. Due to its volatile nature NO has to be produced on demand and in close
vicinity to its target cells where it is immediately inactivated upon reaction with its
target (Esplugues, 2002). Thus NO production can only be controlled by regulat-
ing its synthesis but not via downstream degrading mechanisms. It is therefore
likely that substrate availability is the primary means to control NO biosynthesis.
In this context it is noteworthy that L-arginine is also converted to ornithine by
Arg1 and 2, which are competing with nNOS for the same substrate. Conse-

DISCUSSION
65
quently, my finding that Arg2 is up-regulated after oral administration of Dex pro-
vides a plausible explanation how reduced NO production in the gastric wall
might occur as a consequence of reduced substrate availability. I have provided
two lines of evidence that this hypothesis is indeed true. First, providing exoge-
nous L-arginine indeed prevents gastroparesis, indicating that a limitation in the
amount of available L-arginine is presumably the cause of impaired gastric motili-
ty. Second, direct pharmacological inhibition of arginase at least partially pre-
vents the effect of Dex on the stomach. This can be taken as an additional piece
of evidence that Arg2 is involved in the induction of gastroparesis. Finally, be-
sides mechanistically explaining the mode of GC action in the stomach, my find-
ing that supplementing the drinking water with L-arginine allows to circumvent
gastroparesis now offers a simple method, applicable in clinical practice, to im-
prove tolerability of GC therapy by patients.
4.3 The anti-emetic effect of GCs
Chemotherapy-induced nausea and vomiting (CINV) is a major side-effect in
cancer patients and is often a limiting factor for the dosage of anti-cancer drugs
such as cisplatin in the anti-tumor treatment regimens. The use of anti-emetic
drugs is therefore indispensible to reduce CINV and increase tolerability of anti-
cancer therapy (Rao and Faso, 2012). GCs are known to have such an anti-
emetic effect although the underlying mechanism has been unknown so far. In-
hibition of prostanoid synthesis was proposed as a possible mechanism as well
as a stabilizing effect on membranes thus hampering the entry of emetic sub-
stances into the CNS. However, some of the anti-emetic properties of GCs are
not sufficiently explained by the aforementioned modes of action (Tanihata et al.,
2004).
In my work I have demonstrated that Dex causes gastroparesis presumably
through up-regulation of Arg2, which diminishes the availability of L-arginine for
NO synthesis. Interestingly, gastrointestinal side-effects of cisplatin such as re-
duced colonic motor activity and altered intestinal transit time have been related
to changes in NOS activity and thus NO levels as well. Namely, it has been
DISCUSSION
66
shown that cisplatin affects the enteric nervous system by damaging myenteric
neurons thus leading to neuronal loss in the myenteric plexus while on the other
hand the number of NOS immunoreactive neurons increase after cisplatin treat-
ment (Vera et al., 2011). Moreover, nNOS has been found to be up-regulated by
cisplatin, an effect that could be prevented through administration of an nNOS
inhibitor (Jung et al., 2009). Altogether, these data suggest that CINV might be
caused by increased NO synthesis in the stomach. As our finding indicate that
NO levels are reduced after Dex treatment due to limited substrate availability, it
appears likely that the anti-emetic effect of GCs is due to its antagonistic activity
with regard to NO synthesis in the stomach.

SUMMARY
67
5. Summary
Ever since their first successful application in the treatment of RA patients in the
late 1950, GCs have been the gold standard for the treatment of multiple inflam-
matory and neoplastic diseases. There are, however, also severe adverse ef-
fects that denote restrictions upon the use of GCs. In particular oral application of
GCs can lead to gastrointestinal complications that may severely affect the pa-
tient’s quality of life and lead to a reduced tolerability of the therapy. In this work I
have described and characterized gastroparesis as a so far unrecognized effect
of GCs in the gastrointestinal tract that is mediated via trans-activation of genes.
Changes in gene expression characteristic for M2 macrophage polarization
proved to be unrelated to gastroparesis. Similarly, an involvement of two genes
specifically expressed in the gastrointestinal tract could be ruled out. In contrast,
I could confirm that genes related to the regulation of NO production contribute to
gastroparesis. A decrease in iron availability through up-regulation of Lcn2 was
found to partially impact on gastric motility whereas reduced substrate availabil-
ity for NO synthesis through up-regulation of Arg2 proved to be responsible for
impaired gastric emptying. Hence, GC therapy causes gastroparesis by increas-
ing gene expression in the stomach in a DNA-binding-dependent manner there-
by diminishing the availability of NO required for gastric motility. Complete pre-
vention of gastroparesis was achieved by an exogenous supply of L-arginine
thus providing a means to overcome the observed effect with the help of a die-
tary supplement. My study also offers a possible explanation for the anti-emetic
effect of GCs that has been used for long to interfere with CINV without knowing
the underlying mechanism. Now it appears likely that reducing NO availability in
the stomach is the way how GCs counteract CINV, which is accompanied by
increased NO production. Unfortunately, further elucidation of this process is im-
possible in rodent models due to the inability of mice and rats to vomit. Taken
together, the identification and characterization of GC-induced gastroparesis
sheds new light on both adverse and beneficial activities of GCs in the stomach
and may help to optimize therapy in the future for the patients’ benefit.
REFERENCES
68
6. References
Abrahamsson, H., and Jansson, G. (1969). Elicitation of reflex vagal relaxation of the stomach from pharynx and esophagus in the cat. Acta Physiol Scand 77, 172-178. Adcock, I.M., and Barnes, P.J. (2008). Molecular mechanisms of corticosteroid resistance. Chest 134, 394-401. Andrew, P.J., and Mayer, B. (1999). Enzymatic function of nitric oxide synthases. Cardiovasc Res 43, 521-531. Bandyopadhyay, U., Biswas, K., Bandyopadhyay, D., Ganguly, C.K., and Banerjee, R.K. (1999). Dexamethasone makes the gastric mucosa susceptible to ulceration by inhibiting prostaglandin synthetase and peroxidase--two important gastroprotective enzymes. Mol Cell Biochem 202, 31-36. Baschant, U., Frappart, L., Rauchhaus, U., Bruns, L., Reichardt, H.M., Kamradt, T., Brauer, R., and Tuckermann, J.P. (2011). Glucocorticoid therapy of antigen-induced arthritis depends on the dimerized glucocorticoid receptor in T cells. Proc Natl Acad Sci U S A 108, 19317-19322. Baumann, S., Dostert, A., Novac, N., Bauer, A., Schmid, W., Fas, S.C., Krueger, A., Heinzel, T., Kirchhoff, S., Schütz, G., et al. (2005). Glucocorticoids inhibit activation-induced cell death (AICD) via direct DNA-dependent repression of the CD95 ligand gene by a glucocorticoid receptor dimer. Blood 106, 617-625. Beato, M. (1989). Gene regulation by steroid hormones. Cell 56, 335-344. Beato, M., Herrlich, P., and Schütz, G. (1995). Steroid hormone receptors: many actors in search of a plot. Cell 83, 851-857. Beato, M., and Klug, J. (2000). Steroid hormone receptors: an update. Hum Reprod Update 6, 225-236. Burton, J.M., O'Connor, P.W., Hohol, M., and Beyene, J. (2012). Oral versus intravenous steroids for treatment of relapses in multiple sclerosis. Cochrane Database Syst Rev 12, CD006921. Buttgereit, F., and Scheffold, A. (2002). Rapid glucocorticoid effects on immune cells. Steroids 67, 529-534. Cannon, W.B. (1898). The movements of the stomach. J Boston Soc Med Sci 2, 59-66. Cannon, W.B., and Lieb, C. (1911). The receptive relaxation of the stomach. Am J Physiol 29.
REFERENCES
69
Cato, A.C., Nestl, A., and Mink, S. (2002). Rapid actions of steroid receptors in cellular signaling pathways. Sci STKE 2002, re9. Cheung, J., and Smith, D.F. (2000). Molecular chaperone interactions with steroid receptors: an update. Mol Endocrinol 14, 939-946. Clark, A.R. (2007). Anti-inflammatory functions of glucocorticoid-induced genes. Mol Cell Endocrinol 275, 79-97. Cole, T.J., Blendy, J.A., Monaghan, A.P., Krieglstein, K., Schmid, W., Aguzzi, A., Fantuzzi, G., Hummler, E., Unsicker, K., and Schütz, G. (1995). Targeted disruption of the glucocorticoid receptor gene blocks adrenergic chromaffin cell development and severely retards lung maturation. Genes Dev 9, 1608-1621. Cooke, A.R., Preshaw, R.M., and Grossman, M.L. (1966). Effect of adrenalectomy and glucocorticoids on the secretion and absorption of hydrogen i ion. Gastroenterology 50, 761-767. Croxtall, J.D., Choudhury, Q., and Flower, R.J. (2000). Glucocorticoids act within minutes to inhibit recruitment of signalling factors to activated EGF receptors through a receptor-dependent, transcription-independent mechanism. Br J Pharmacol 130, 289-298. Dahlman-Wright, K., Siltala-Roos, H., Carlstedt-Duke, J., and Gustafsson, J.A. (1990). Protein-protein interactions facilitate DNA binding by the glucocorticoid receptor DNA-binding domain. J Biol Chem 265, 14030-14035. De Bosscher, K., and Haegeman, G. (2009). Minireview: latest perspectives on antiinflammatory actions of glucocorticoids. Mol Endocrinol 23, 281-291. Esplugues, J.V. (2002). NO as a signalling molecule in the nervous system. Br J Pharmacol 135, 1079-1095. Evans, R.M. (1988). The steroid and thyroid hormone receptor superfamily. Science 240, 889-895. Filaretova, L., Bagaeva, T., and Makara, G.B. (2002). Aggravation of nonsteroidal antiinflammatory drug gastropathy by glucocorticoid deficiency or blockade of glucocorticoid receptors in rats. Life Sci 71, 2457-2468. Flo, T.H., Smith, K.D., Sato, S., Rodriguez, D.J., Holmes, M.A., Strong, R.K., Akira, S., and Aderem, A. (2004). Lipocalin 2 mediates an innate immune response to bacterial infection by sequestrating iron. Nature 432, 917-921. Ford, A.C., Bernstein, C.N., Khan, K.J., Abreu, M.T., Marshall, J.K., Talley, N.J., and Moayyedi, P. (2011). Glucocorticosteroid therapy in inflammatory bowel disease: systematic review and meta-analysis. Am J Gastroenterol 106, 590-599.
REFERENCES
70
Freedman, N.D., and Yamamoto, K.R. (2004). Importin 7 and importin alpha/importin beta are nuclear import receptors for the glucocorticoid receptor. Mol Biol Cell 15, 2276-2286. Furness, J.B. (2006). The enteric nervous system. Wiley-Blackwell. Gangula, P.R., Sekhar, K.R., and Mukhopadhyay, S. (2011). Gender bias in gastroparesis: is nitric oxide the answer? Dig Dis Sci 56, 2520-2527. Gershon, M.D. (2005). Nerves, reflexes, and the enteric nervous system: pathogenesis of the irritable bowel syndrome. J Clin Gastroenterol 39, S184-193. Gray, S.J., Benson, J.A., Jr., and Reifenstein, R.W. (1951). Chronic stress and peptic ulcer. I. Effect of corticotropin (ACTH) and cortisone on gastric secretion. J Am Med Assoc 147, 1529-1537. Hernandez-Diaz, S., and Rodriguez, L.A. (2001). Steroids and risk of upper gastrointestinal complications. Am J Epidemiol 153, 1089-1093. Herrlich, P. (2001). Cross-talk between glucocorticoid receptor and AP-1. Oncogene 20, 2465-2475. Jung, M., Hotter, G., Vinas, J.L., and Sola, A. (2009). Cisplatin upregulates mitochondrial nitric oxide synthase and peroxynitrite formation to promote renal injury. Toxicol Appl Pharmacol 234, 236-246. Kassander, P. (1958). Asymptomatic gastric retention in diabetics (gastroparesis diabeticorum). Ann Intern Med 48, 797-812. Kirwan, J., and Power, L. (2007). Glucocorticoids: action and new therapeutic insights in rheumatoid arthritis. Curr Opin Rheumatol 19, 233-237. Kleiman, A., Hübner, S., Rodriguez Parkitna, J.M., Neumann, A., Hofer, S., Weigand, M.A., Bauer, M., Schmid, W., Schütz, G., Libert, C., et al. (2012). Glucocorticoid receptor dimerization is required for survival in septic shock via suppression of interleukin-1 in macrophages. FASEB J 26, 722-729. Lim, H.Y., Müller, N., Herold, M.J., van den Brandt, J., and Reichardt, H.M. (2007). Glucocorticoids exert opposing effects on macrophage function dependent on their concentration. Immunology 122, 47-53. Luisi, B.F., Xu, W.X., Otwinowski, Z., Freedman, L.P., Yamamoto, K.R., and Sigler, P.B. (1991). Crystallographic analysis of the interaction of the glucocorticoid receptor with DNA. Nature 352, 497-505. Madison, B.B., Dunbar, L., Qiao, X.T., Braunstein, K., Braunstein, E., and Gumucio, D.L. (2002). Cis elements of the villin gene control expression in restricted domains of the vertical (crypt) and horizontal (duodenum, cecum) axes of the intestine. J Biol Chem 277, 33275-33283.
REFERENCES
71
Marletta, M.A. (1993). Nitric oxide synthase structure and mechanism. J Biol Chem 268, 12231-12234. Martinez, A., Elsasser, T.H., Muro-Cacho, C., Moody, T.W., Miller, M.J., Macri, C.J., and Cuttitta, F. (1997). Expression of adrenomedullin and its receptor in normal and malignant human skin: a potential pluripotent role in the integument. Endocrinology 138, 5597-5604. Mashimo, H., Kjellin, A., and Goyal, R.K. (2000). Gastric stasis in neuronal nitric oxide synthase-deficient knockout mice. Gastroenterology 119, 766-773. Mulla, A., and Buckingham, J.C. (1999). Regulation of the hypothalamo-pituitary-adrenal axis by cytokines. Baillieres Best Pract Res Clin Endocrinol Metab 13, 503-521. Mungrue, I.N., Bredt, D.S., Stewart, D.J., and Husain, M. (2003). From molecules to mammals: what's NOS got to do with it? Acta Physiol Scand 179, 123-135. Olsson, C., and Holmgren, S. (2001). The control of gut motility. Comp Biochem Physiol A Mol Integr Physiol 128, 481-503. Orihata, M., and Sarna, S.K. (1994). Inhibition of nitric oxide synthase delays gastric emptying of solid meals. J Pharmacol Exp Ther 271, 660-670. Parkman, H.P., Hasler, W.L., and Fisher, R.S. (2004). American Gastroenterological Association technical review on the diagnosis and treatment of gastroparesis. Gastroenterology 127, 1592-1622. Picard, D., and Yamamoto, K.R. (1987). Two signals mediate hormone-dependent nuclear localization of the glucocorticoid receptor. EMBO J 6, 3333-3340. Pithadia, A.B., and Jain, S. (2011). Treatment of inflammatory bowel disease (IBD). Pharmacol Rep 63, 629-642. Pratt, W.B., and Toft, D.O. (2003). Regulation of signaling protein function and trafficking by the hsp90/hsp70-based chaperone machinery. Exp Biol Med (Maywood) 228, 111-133. Rao, K.V., and Faso, A. (2012). Chemotherapy-induced nausea and vomiting: optimizing prevention and management. Am Health Drug Benefits 5, 232-240. Rauch, A., Seitz, S., Baschant, U., Schilling, A.F., Illing, A., Stride, B., Kirilov, M., Mandic, V., Takacz, A., Schmidt-Ullrich, R., et al. (2010). Glucocorticoids suppress bone formation by attenuating osteoblast differentiation via the monomeric glucocorticoid receptor. Cell Metab 11, 517-531.
REFERENCES
72
Reichardt, H.M., Kaestner, K.H., Tuckermann, J., Kretz, O., Wessely, O., Bock, R., Gass, P., Schmid, W., Herrlich, P., Angel, P., et al. (1998). DNA binding of the glucocorticoid receptor is not essential for survival. Cell 93, 531-541. Reichardt, H.M., Tuckermann, J.P., Göttlicher, M., Vujic, M., Weih, F., Angel, P., Herrlich, P., and Schütz, G. (2001). Repression of inflammatory responses in the absence of DNA binding by the glucocorticoid receptor. EMBO J 20, 7168-7173. Reichardt, S.D., Föller, M., Rexhepaj, R., Pathare, G., Minnich, K., Tuckermann, J.P., Lang, F., and Reichardt, H.M. (2012). Glucocorticoids enhance intestinal glucose uptake via the dimerized glucocorticoid receptor in enterocytes. Endocrinology 153, 1783-1794. Reichardt, S.D., Weinhage, T., Rotte, A., Föller, M., Oppermann, M., Lühder, F., Tuckermann, J.P., Lang, F., van den Brandt, J., and Reichardt, H.M. (2014). Glucocorticoids induce gastroparesis through depletion of L-arginine. Endocrinology 155, 3899-908. Rivera, L.R., Poole, D.P., Thacker, M., and Furness, J.B. (2011). The involvement of nitric oxide synthase neurons in enteric neuropathies. Neurogastroenterol Motil 23, 980-988. Rose, A.J., and Herzig, S. (2013). Metabolic control through glucocorticoid hormones: an update. Mol Cell Endocrinol 380, 65-78. Saeki, N., Kuwahara, Y., Sasaki, H., Satoh, H., and Shiroishi, T. (2000). Gasdermin (Gsdm) localizing to mouse Chromosome 11 is predominantly expressed in upper gastrointestinal tract but significantly suppressed in human gastric cancer cells. Mamm Genome 11, 718-724. Sanders, K.M. (1996). A case for interstitial cells of Cajal as pacemakers and mediators of neurotransmission in the gastrointestinal tract. Gastroenterology 111, 492-515. Sandu, C., Artunc, F., Grahammer, F., Rotte, A., Boini, K.M., Friedrich, B., Sandulache, D., Metzger, M., Just, L., Mack, A., et al. (2007). Role of the serum and glucocorticoid inducible kinase SGK1 in glucocorticoid stimulation of gastric acid secretion. Pflugers Arch 455, 493-503. Schäcke, H., Döcke, W.D., and Asadullah, K. (2002). Mechanisms involved in the side effects of glucocorticoids. Pharmacol Ther 96, 23-43. Schäcke, H., Schottelius, A., Docke, W.D., Strehlke, P., Jaroch, S., Schmees, N., Rehwinkel, H., Hennekes, H., and Asadullah, K. (2004). Dissociation of transactivation from transrepression by a selective glucocorticoid receptor agonist leads to separation of therapeutic effects from side effects. Proc Natl Acad Sci U S A 101, 227-232.
REFERENCES
73
Schmid, W., Strähle, U., Schütz, G., Schmitt, J., and Stunnenberg, H. (1989). Glucocorticoid receptor binds cooperatively to adjacent recognition sites. EMBO J 8, 2257-2263. Schmidt-Ott, K.M., Mori, K., Li, J.Y., Kalandadze, A., Cohen, D.J., Devarajan, P., and Barasch, J. (2007). Dual action of neutrophil gelatinase-associated lipocalin. J Am Soc Nephrol 18, 407-413.
Schubert, M.L. (2008). Gastric secretion. Curr Opin Gastroenterol 24, 659-664. Schweingruber, N., Reichardt, S.D., Lühder, F., and Reichardt, H.M. (2012). Mechanisms of glucocorticoids in the control of neuroinflammation. J Neuroendocrinol 24, 174-182. Sellebjerg, F., Frederiksen, J.L., Nielsen, P.M., and Olesen, J. (1998). Double-blind, randomized, placebo-controlled study of oral, high-dose methylprednisolone in attacks of MS. Neurology 51, 529-534. Stahn, C., Löwenberg, M., Hommes, D.W., and Buttgereit, F. (2007). Molecular mechanisms of glucocorticoid action and selective glucocorticoid receptor agonists. Mol Cell Endocrinol 275, 71-78. Stancato, L.F., Chow, Y.H., Hutchison, K.A., Perdew, G.H., Jove, R., and Pratt, W.B. (1993). Raf exists in a native heterocomplex with hsp90 and p50 that can be reconstituted in a cell-free system. J Biol Chem 268, 21711-21716. Stuehr, D.J. (1997). Structure-function aspects in the nitric oxide synthases. Annu Rev Pharmacol Toxicol 37, 339-359. Takahashi, T., Nakamura, K., Itoh, H., Sima, A.A., and Owyang, C. (1997). Impaired expression of nitric oxide synthase in the gastric myenteric plexus of spontaneously diabetic rats. Gastroenterology 113, 1535-1544. Takeuchi, K., Nishiwaki, H., Okada, M., Niida, H., and Okabe, S. (1989). Bilateral adrenalectomy worsens gastric mucosal lesions induced by indomethacin in the rat. Role of enhanced gastric motility. Gastroenterology 97, 284-293. Tamura, M., Tanaka, S., Fujii, T., Aoki, A., Komiyama, H., Ezawa, K., Sumiyama, K., Sagai, T., and Shiroishi, T. (2007). Members of a novel gene family, Gsdm, are expressed exclusively in the epithelium of the skin and gastrointestinal tract in a highly tissue-specific manner. Genomics 89, 618-629. Tanihata, S., Oda, S., Nakai, S., and Uchiyama, T. (2004). Antiemetic effect of dexamethasone on cisplatin-induced early and delayed emesis in the pigeon. Eur J Pharmacol 484, 311-321. Tuckermann, J.P., Kleiman, A., Moriggl, R., Spanbroek, R., Neumann, A., Illing, A., Clausen, B.E., Stride, B., Förster, I., Habenicht, A.J., et al. (2007). Macrophages and neutrophils are the targets for immune suppression by glucocorticoids in contact allergy. J Clin Invest 117, 1381-1390.
REFERENCES
74
Tuckermann, J.P., Reichardt, H.M., Arribas, R., Richter, K.H., Schütz, G., and Angel, P. (1999). The DNA binding-independent function of the glucocorticoid receptor mediates repression of AP-1-dependent genes in skin. J Cell Biol 147, 1365-1370. van Lierop, M.J., Alkema, W., Laskewitz, A.J., Dijkema, R., van der Maaden, H.M., Smit, M.J., Plate, R., Conti, P.G., Jans, C.G., Timmers, C.M., et al. (2012). Org 214007-0: a novel non-steroidal selective glucocorticoid receptor modulator with full anti-inflammatory properties and improved therapeutic index. PLoS One 7, e48385. Vandevyver, S., Dejager, L., Tuckermann, J., and Libert, C. (2013). New insights into the anti-inflammatory mechanisms of glucocorticoids: an emerging role for glucocorticoid-receptor-mediated transactivation. Endocrinology 154, 993-1007. Varga, G., Ehrchen, J., Tsianakas, A., Tenbrock, K., Rattenholl, A., Seeliger, S., Mack, M., Roth, J., and Sunderkoetter, C. (2008). Glucocorticoids induce an activated, anti-inflammatory monocyte subset in mice that resembles myeloid-derived suppressor cells. J Leukoc Biol 84, 644-650. Vera, G., Castillo, M., Cabezos, P.A., Chiarlone, A., Martin, M.I., Gori, A., Pasquinelli, G., Barbara, G., Stanghellini, V., Corinaldesi, R., et al. (2011). Enteric neuropathy evoked by repeated cisplatin in the rat. Neurogastroenterol Motil 23, 370-378, e162-373. Vittal, H., Farrugia, G., Gomez, G., and Pasricha, P.J. (2007). Mechanisms of disease: the pathological basis of gastroparesis--a review of experimental and clinical studies. Nat Clin Pract Gastroenterol Hepatol 4, 336-346. Waddell, D.S., Baehr, L.M., van den Brandt, J., Johnsen, S.A., Reichardt, H.M., Furlow, J.D., and Bodine, S.C. (2008). The glucocorticoid receptor and FOXO1 synergistically activate the skeletal muscle atrophy-associated MuRF1 gene. Am J Physiol Endocrinol Metab 295, E785-797. Watson, M.L., Baehr, L.M., Reichardt, H.M., Tuckermann, J.P., Bodine, S.C., and Furlow, J.D. (2012). A cell-autonomous role for the glucocorticoid receptor in skeletal muscle atrophy induced by systemic glucocorticoid exposure. Am J Physiol Endocrinol Metab 302, E1210-1220. Webster, J.I., and Sternberg, E.M. (2004). Role of the hypothalamic-pituitary-adrenal axis, glucocorticoids and glucocorticoid receptors in toxic sequelae of exposure to bacterial and viral products. J Endocrinol 181, 207-221. Webster, J.I., Tonelli, L., and Sternberg, E.M. (2002). Neuroendocrine regulation of immunity. Annu Rev Immunol 20, 125-163. Wilbur, B.G., and Kelly, K.A. (1973). Effect of proximal gastric, complete gastric, and truncal vagotomy on canine gastric electric activity, motility, and emptying. Ann Surg 178, 295-303.
REFERENCES
75
Wu, G., and Morris, S.M., Jr. (1998). Arginine metabolism: nitric oxide and beyond. Biochem J 336 ( Pt 1), 1-17. Wüst, S., van den Brandt, J., Tischner, D., Kleiman, A., Tuckermann, J.P., Gold, R., Lühder, F., and Reichardt, H.M. (2008). Peripheral T cells are the therapeutic targets of glucocorticoids in experimental autoimmune encephalomyelitis. J Immunol 180, 8434-8443.
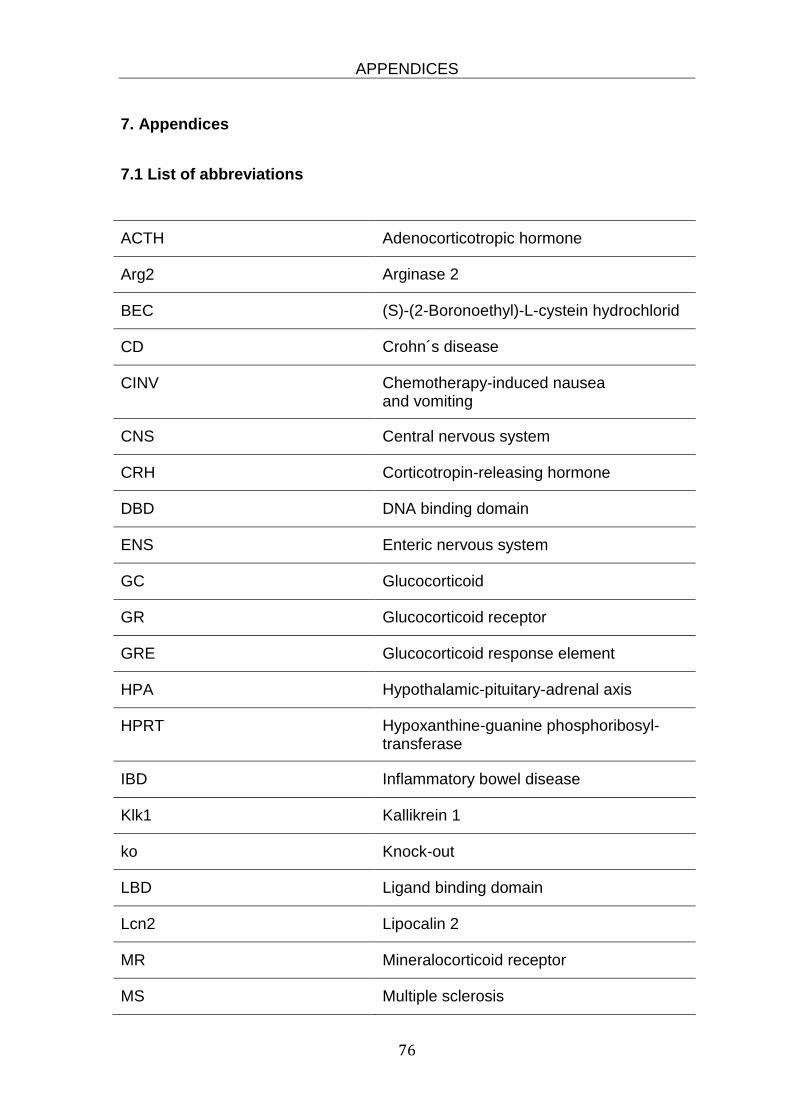
APPENDICES
76
7. Appendices
7.1 List of abbreviations
ACTH Adenocorticotropic hormone
Arg2 Arginase 2
BEC (S)-(2-Boronoethyl)-L-cystein hydrochlorid
CD Crohn´s disease
CINV Chemotherapy-induced nausea and vomiting
CNS Central nervous system
CRH Corticotropin-releasing hormone
DBD DNA binding domain
ENS Enteric nervous system
GC Glucocorticoid
GR Glucocorticoid receptor
GRE Glucocorticoid response element
HPA Hypothalamic-pituitary-adrenal axis
HPRT Hypoxanthine-guanine phosphoribosyl-transferase
IBD Inflammatory bowel disease
Klk1 Kallikrein 1
ko Knock-out
LBD Ligand binding domain
Lcn2 Lipocalin 2
MR Mineralocorticoid receptor
MS Multiple sclerosis

APPENDICES
77
NANC Nonadrenergic-noncholinergic
NO Nitric oxide
NOS Nitric oxide synthase
Odc Ornithine decarboxylase
RA Rheumatoide arthritis
UC Ulcerative colitis
wt wildtype
7.2 List of figures Figure 1. General structure of steroid hormone receptors. ................................. 2
Figure 2. Mechanisms of GC action. ................................................................... 3
Figure 3. Anatomy of the stomach. ..................................................................... 9
Figure 4. Cells types involved in gastric motility. ............................................... 12
Figure 5. Proposed mechanism of NO synthesis. ............................................. 16
Figure 6. Oral Dex treatment leads to an increase in stomach weight and size. ................................................................................................... 36
Figure 7. Oral administration of Dex for three days does not alter food intake or dry feces and only leads to a slight increase in water intake. ........ 36
Figure 8. Oral Dex treatment induces gastroparesis in mice. ........................... 37
Figure 9. Dex induced gastroparesis is dose-dependent. ................................. 38
Figure 10. GR protein expression in the intestine and stomach of GRvillincre
mice. .................................................................................................. 39
Figure 11. The GC-induced increase in stomach weight is preserved in enterocyte-specific GR knock-out mice.............................................. 40
APPENDICES
78
Figure 12. GC-induced gastroparesis is mediated by a DNA-binding dependent mechanism of the GR. ..................................................... 41
Figure 13. Enhanced gastric acid secretion is not linked to GC-induced gastroparesis. .................................................................................... 43
Figure 14. Oral Dex treatment induces a M2 polarization of macrophages in the stomach. ...................................................................................... 46
Figure 15. Induction of gastroparesis by GCs is retained in mice specifically lacking the GR or MR in macrophages. ............................................. 47
Figure 16. CD163 and CD74 are differentially regulated in the stomach of myeloid cell-specific GR and MR knock-out mice after Dex treatment. ........................................................................................... 48
Figure 17. Reduced expression of Gsdmc2 and Gsdmc3 after Dex treatment is not responsible for induction of gastroparesis. ............................... 49
Figure 18. Identification of three GC target genes in the stomach that are differentially regulated in GRdim and GRwt mice following Dex administration. ................................................................................... 51
Figure 19. Iron supplementation only partially prevents the increase in stomach weight caused by Dex treatment. ........................................ 53
Figure 20. Gene expression of arg1 and nNOS in the stomach after Dex treatment. ........................................................................................... 54
Figure 21. Arg2 protein levels are increased after Dex treatment in GRwt but not GRdim mice. .................................................................................. 55
Figure 21. Supplementation of the drinking water with L-arginine prevents the increase in stomach weight after Dex treatment. ............................... 56
Figure 22. Supplementation with L-arginine restores the normal gastric emptying otherwise impaired by GC treatment. ................................. 57
Figure 23. Supplementation with L-arginine leads to enhanced expression of arg2 and Odc ..................................................................................... 58
Figure 24. Inhibition of arginase only partially prevents the increase in stomach weight and the reduction in gastric emptying. ..................... 60

APPENDICES
79
7.3 Acknowledgements
I would like to express my sincere appreciation to my supervisor Prof. Dr. Martin
Oppermann for his support during this PhD project. While allowing me to work
independently I could always rely on his advice when needed.
Many thanks go to my thesis committee members Prof. Dr. Matthias Dobbelstein
and PD. Dr. Fred Lühder. I am grateful for their interest in my project and for mo-
tivating discussions and encouragement during thesis committee meetings.
Furthermore, I am indebted to our collaboration partners Prof. Dr. Florian Lang
and Prof. Dr. Jan Tuckermann, and to former and current lab members of the
Institute for Cellular and Molecular Immunology, that I refrain from naming all
individually. However, special thanks goes to Toni Weinhage for the set-up work
of this project and to Amina Bassibas for expert technical assistance on count-
less occasions.
I owe my deepest gratitude to my family. To Roxanna, Clara, Alban and Tristan
for filling my days with joy, challenge and life. To Holger for his support and en-
couragement, and for more than I can name.

APPENDICES
80
7.4 Curriculum vitae
Personal data Name: Reichardt, Sybille Dorothee Date and place of birth: 14.11.1968, Esslingen, a.N. Nationality: German
Education and Employment
04/2012 – 01/2015 Doctoral thesis at the Institute for Cellular and
Molecular Immunology, University of Göttingen. Project:“Physiological and molecular features of glu-cocorticoid actions in the gastrointestinal tract.”
01/2011 – 03/2012 Scientific employee at the Institute for Cellular and
Molecular Immunology, University Medical Center Göttingen
09/1992 – 08/2006 Chemical engineer in the Department of Research
and Development, Clariant GmbH, Leinfelden. 04/1992 – 09/1992 Internship at the Department of Quality Control at
Clariant GmbH, Leinfelden 10/1991 – 02/1992 Diploma thesis in Biochemistry (in cooperation with
Deutsche Gelatine Fabriken Stoess AG, Eberbach)
10/1988 – 02/1992 Studies in Chemical Engineering at the University of Applied Sciences in Darmstadt
09/1979 - 05/1988 Allgemeine Hochschulreife at the Immanuel-Kant-
Gymnasium, Leinfelden
APPENDICES
81
Publications
Gerber, U., Jucknischke, U., Putzien, S., and Fuchsbauer, H.L. (1994). A rapid and simple method for the purification of transglutaminase from Streptoverticillium mobaraense. Biochem J 29, 825-829. Sbiera, S., Dexneit, T., Reichardt, S.D., Michel, K.D., van den Brandt, J., Schmull, S., Kraus, L., Beyer, M., Mlynski, R., Wortmann, S., et al. (2011). Influence of short-term glucocorticoid therapy on regulatory T cells in vivo. PLoS ONE 6, e24345. Tischner, D., Theiss, J., Karabinskaya, A., van den Brandt, J., Reichardt, S.D., Karow, U., Herold, M.J., Lühder, F., Utermöhlen, O., and Reichardt, H.M. (2011). Acid sphingomyelinase is required for protection of effector memory T cells against glucocorticoid-induced cell death. J Immunol 187, 4509-4516. Schweingruber, N., Reichardt, S.D., Lühder, F., and Reichardt, H.M. (2012). Mechanisms of glucocorticoids in the control of neuroinflammation. J Neuroendocrinol 24, 174-182. Reichardt, S.D., Föller, M., Rexhepaj, R., Pathare, G., Minnich, K., Tuckermann, J.P., Lang, F., and Reichardt, H.M. (2012). Glucocorticoids enhance intestinal glucose uptake via the dimerized glucocorticoid receptor in enterocytes. Endocrinology 153, 1783-1794. Reichardt, S.D., Weinhage, T., Rotte, A., Föller, M., Oppermann, M., Lühder, F., Tuckermann, J.P., Lang, F., van den Brandt, J., and Reichardt, H.M. (2014). Glucocorticoids induce gastroparesis in mice through depletion of L-arginine. Endocrinology 155, 3899-3908. Theiss-Suennemann, J., Jörß, K., Messmann, J.J., Reichardt, S.D., Montes-Cobos, E., Lühder, F., Gröhne, H.J., Tuckermann, J.P., Wolff, H.A., Dressel, R., Strauß, G., and Reichardt, H.M. (2014). Glucocorticoids attenuate acute graft-versus-host disease by suppressing the cytotoxic capacity of CD8+ T cells. Journal of Pathology (doi: 10.1002/ path.4475).