Embed Size (px)
Citation preview
Identification of molecular and physiological responses tochronic environmental challenge in an invasive species: thePacific oyster, Crassostrea gigasMelody S. Clark1, Michael A. S. Thorne1, Ana Amaral2, Florbela Vieira2, Frederico M. Batista3,Jo~ao Reis2 & Deborah M. Power2
1British Antarctic Survey, Natural Environment Research Council, High Cross, Madingley Road, Cambridge CB3 0ET, U.K.2Center of Marine sciences (CCMAR), Universidade do Algarve, Campus de Gambelas, 8005-139, Faro, Portugal3Instituto Portugues do Mar e da Atmosfera (IPMA), Estac�~ao Experimental de Moluscicultura de Tavira, Vale Caranguejo, 880 Tavira, Portugal
Keywords
Candidate genes, condition index, energetic
trade-offs, mTOR pathway, transcriptional
profiling.
Correspondence
Melody S. Clark, British Antarctic Survey,
High Cross, Madingley Road, Cambridge CB3
0ET, UK. Tel: +44 1223 221371; Fax: +44
1223 221259; E-mail: [email protected]
Funding Information
This work was supported by an EU Research
Infrastructure Action under the FP7
“Capacities” Specific Programme, ASSEMBLE
grant agreement no. 227799, CCMAR Ref
00415/2010.
Received: 2 July 2013; Revised: 11 July 2013;
Accepted: 12 July 2013
Ecology and Evolution 2013; 3(10): 3283–
3297
doi: 10.1002/ece3.719
Abstract
Understanding the environmental responses of an invasive species is critical in
predicting how ecosystem composition may be transformed in the future, espe-
cially under climate change. In this study, Crassostrea gigas, a species well
adapted to the highly variable intertidal environment, was exposed to the
chronic environmental challenges of temperature (19 and 24°C) and pH (ambi-
ent seawater and a reduction of 0.4 pH units) in an extended 3-month labora-
tory-based study. Physiological parameters were measured (condition index,
shell growth, respiration, excretion rates, O:N ratios, and ability to repair shell
damage) alongside molecular analyses. Temperature was by far the most impor-
tant stressor, as demonstrated by reduced condition indexes and shell growth at
24°C, with relatively little effect detected for pH. Transcriptional profiling using
candidate genes and SOLiD sequencing of mantle tissue revealed that classical
“stress” genes, previously reported to be upregulated under acute temperature
challenges, were not significantly expressed in any of the treatments, emphasiz-
ing the different response between acute and longer term chronic stress. The
transcriptional profiling also elaborated on the cellular responses underpinning
the physiological results, including the identification of the PI3K/AKT/mTOR
pathway as a potentially novel marker for chronic environmental challenge.
This study represents a first attempt to understand the energetic consequences
of cumulative thermal stress on the intertidal C. gigas which could significantly
impact on coastal ecosystem biodiversity and function in the future.
Introduction
Understanding species’ responses to environmental per-
turbation is critical in predicting climate change effects
on biodiversity and consequently, ecosystem functioning.
Within any ecosystem, this comprises two major aspects:
the impact of change on the endemic species and the
potential for colonization by invasive species. The latter
have caused dramatic changes in ecological systems
worldwide and are major threats to biodiversity (Gurev-
itch and Padilla 2004; Zerebecki and Sorte 2011). One of
the best known European marine invasives, the Pacific
oyster Crassostrea gigas was introduced in the late 1960s
from Asia. Initially, C. gigas was introduced to replace
the Portuguese oyster Crassostrea angulata, which was
seriously affected by mass mortality events (Grizel and
Heral 1991), but it now has a wide geographic range from
Norway to the Mediterranean Sea. While C. gigas is a
numerically successful invasive, it is also an ecosystem
engineer; modifying habitats by constructing large three-
dimensional reef structures and inducing major changes
in invaded ecosystems (Troost 2010). These structures
can dominate intertidal zones and in some instances
increase both habitat heterogeneity and ecosystem species
diversity, providing shelter for the inhabitants against
extreme environmental conditions, acting as a buffer to
the environment (Troost 2010).
Successful invasive species generally share certain char-
acteristics that allow them to colonize, establish, and
expand their range. However, in the case of C. gigas, its
ª 2013 The Authors. Ecology and Evolution published by John Wiley & Sons Ltd.
This is an open access article under the terms of the Creative Commons Attribution License, which permits use,
distribution and reproduction in any medium, provided the original work is properly cited.
3283
spread has been facilitated by aquaculture practices, as
farms are generally located in open waters (i.e., lagoons
and estuaries) without containment measures, and oysters
may spawn several times before harvesting. Also C. gigas
outcompetes the native species when it is present in a
mixed oyster population (Troost 2010). In both labora-
tory and field sampling, C. gigas grows more quickly, has
a higher metabolic efficiency, scope for growth, and faster
feeding and absorption rates than other closely related
species, such as Crassostrea virginica, C. angulata, and
Saccostrea glomerata. Mortality of C. gigas is also lower
and it has a higher resistance to environmental factors
such as turbidity and temperature variation (Bayne 2000;
Soletchnik et al. 2002).
The high-temperature tolerance of C. gigas explains its
wide geographic range and it is found in Russia (ca. 48°N)to the east coast of China (30°N). In Europe, C. gigas can
reproduce in the Danish Wadden Sea (60°N, Wrange et al.
2010) if the water temperature rises above 16–18°C long
enough for spawning and larval development and in
warmer waters as far south as 37°N in southern Portugal.
C. gigas withstands short-term exposure to temperatures
close to freezing point and up to 35°C and its tolerance to
a broad pH range explains its ability to colonize environ-
ments such as estuaries that have large natural fluctuations
in pH and salinity (Yaroslavtseva et al. 1990). Few studies
have examined the physiological and molecular mecha-
nisms responsible for tolerance to wide ranges of environ-
mental conditions in invasive species. Therefore,
laboratory manipulation can be extremely useful in deter-
mining biological signatures to specific environmental
challenges and also the interaction between different types
of challenge. In C. gigas, these studies have concentrated
on understanding the causes of devastating mass summer
mortality events, which appears to result from a complex
interaction between environmental conditions and disease
susceptibility (Li et al. 2007; Chaney and Gracey 2011),
but more recently on the effects of ocean acidification
(Beniash et al. 2010; Lannig et al. 2010; Tomanek et al.
2011). However, although these latter experiments
recorded detrimental effects for both metabolism and shell
production of C. gigas they were very short term, ranging
from a few days to a maximum of a month. Similarly
studies on the impact of other environmental stressors,
such as heat and hypoxia, have also been carried out for
less than 1 month (Meistertzheim et al. 2007; Sussarellu
et al. 2010). While short-term experiments can provide
insight into stress pathways (Tomanek et al. 2011), they
represent acute responses. Short- and longer term expo-
sures can produce very different outcomes when gene
expression profiles are measured (Clark and Peck 2009a).
Therefore, acute responses may not accurately reflect the
long-term constraints of life in new conditions or the
subtle trade-offs in energy balance and physiology associ-
ated with acclimation to a permanent gradual shift in
environmental conditions, such as the predicted increases
in sea surface temperature (SST) over the coming decades.
This could particularly impact on intertidal and shallow
subtidal species and lead to altered seasonality and repro-
duction patterns, as these species have been argued to be
especially vulnerable to climate change because they are
close to their physiological limits already (Somero 2010).
Gene expression analyses can be effective in identifying
key processes underpinning acclimatization and were used
in many of the studies of environmental challenge cited
here. However, the approach was varied and ranged from
analyses of a single gene (Beniash et al. 2010) to the use
of microarrays with several thousand genes (Lang et al.
2009; Sussarellu et al. 2010). The latter exploited the
clones from a European-developed transcriptomic
resource of 29,745 unique C. gigas expressed sequence
tags (ESTs) (Fleury et al. 2009). These also provide a
backbone for short-read transcriptional profiling enabling
discovery-led gene expression analyses, as opposed to an a
priori candidate gene approach or the clone number con-
straints of microarrays.
This study represents a multidisciplinary approach to
dissect the effects of temperature and pH on physiological
parameters and gene expression of an invasive species,
C. gigas in an extended 3-month study over this species’
productive summer period. Physiological parameters
(condition index, shell growth, shell repair, respiration,
excretion rates, and O:N ratios) were analyzed alongside
molecular analyses, using both a candidate gene approach
via Q-polymerase chain reaction (PCR) and transcrip-
tional profiling using SOLiD technology with the aim of
providing a better understanding of the constraining envi-
ronmental factors of this invasive under future climate
change scenarios, in particular focussing on the ability of
the oysters to maintain their shell in the face of decreas-
ing water pH values.
Materials and Methods
Experiments were conducted in the experimental station
of CCMAR in the Ria Formosa (36°59′33″N 7°54′17″W,
Portugal). The experimental temperatures were chosen to
reflect summer temperatures (24°C) and spring/autumn
conditions (19°C). The facilities are licensed for animal
experimentation and the experiments are covered by a
Group-1 license (Direcc�~ao-Geral de Veterin�aria, Portu-
gal). Animals from the same cohort were obtained from
collectors placed in farmed oyster regions in Arcachon
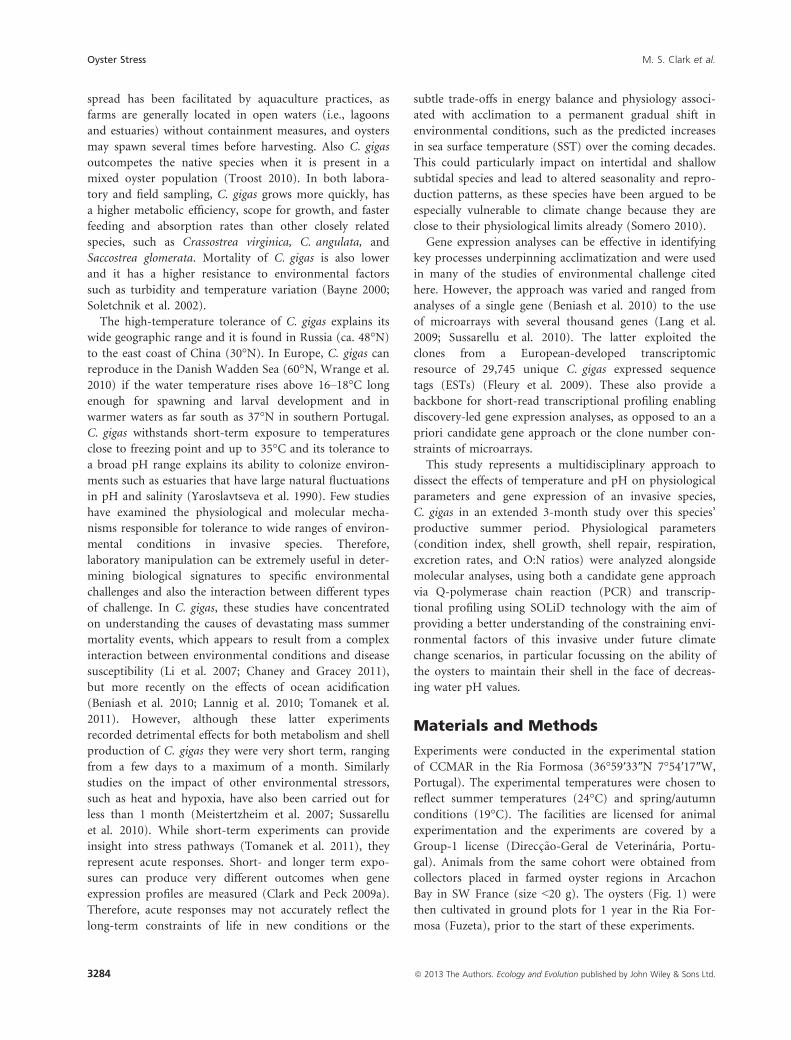
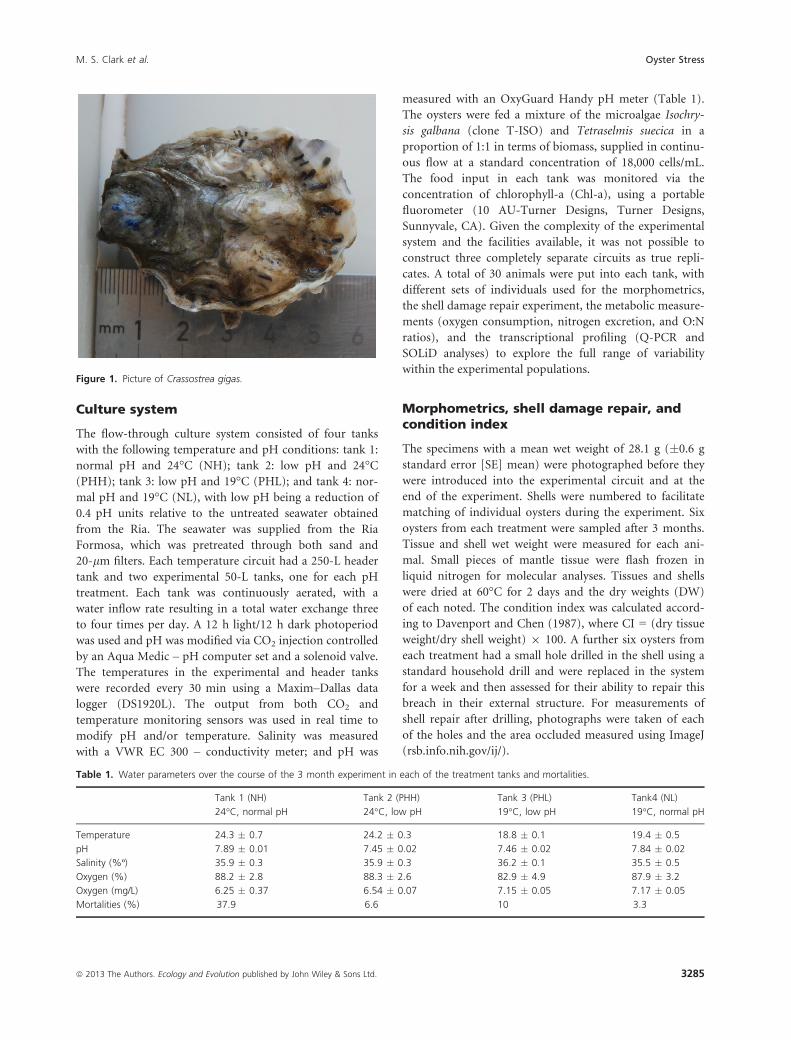
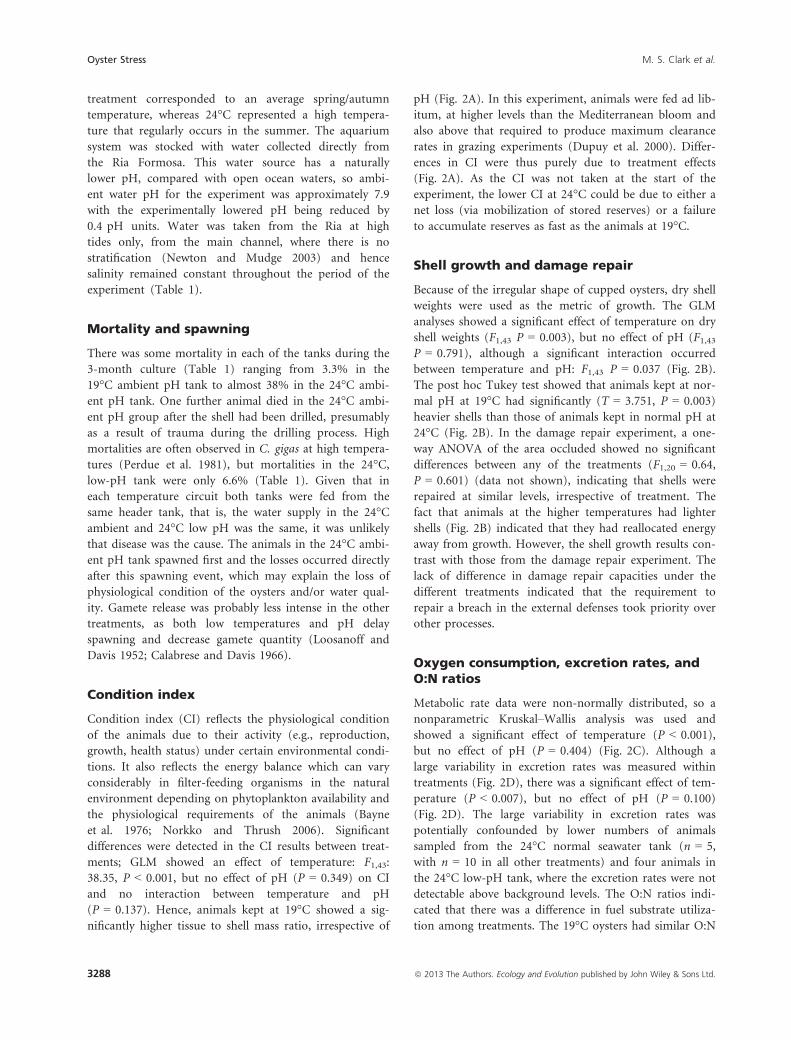
Bay in SW France (size <20 g). The oysters (Fig. 1) were
then cultivated in ground plots for 1 year in the Ria For-
mosa (Fuzeta), prior to the start of these experiments.
3284 ª 2013 The Authors. Ecology and Evolution published by John Wiley & Sons Ltd.
Oyster Stress M. S. Clark et al.
Culture system
The flow-through culture system consisted of four tanks
with the following temperature and pH conditions: tank 1:
normal pH and 24°C (NH); tank 2: low pH and 24°C(PHH); tank 3: low pH and 19°C (PHL); and tank 4: nor-
mal pH and 19°C (NL), with low pH being a reduction of
0.4 pH units relative to the untreated seawater obtained
from the Ria. The seawater was supplied from the Ria
Formosa, which was pretreated through both sand and
20-lm filters. Each temperature circuit had a 250-L header
tank and two experimental 50-L tanks, one for each pH
treatment. Each tank was continuously aerated, with a
water inflow rate resulting in a total water exchange three
to four times per day. A 12 h light/12 h dark photoperiod
was used and pH was modified via CO2 injection controlled
by an Aqua Medic – pH computer set and a solenoid valve.
The temperatures in the experimental and header tanks
were recorded every 30 min using a Maxim–Dallas data
logger (DS1920L). The output from both CO2 and
temperature monitoring sensors was used in real time to
modify pH and/or temperature. Salinity was measured
with a VWR EC 300 – conductivity meter; and pH was
measured with an OxyGuard Handy pH meter (Table 1).
The oysters were fed a mixture of the microalgae Isochry-
sis galbana (clone T-ISO) and Tetraselmis suecica in a
proportion of 1:1 in terms of biomass, supplied in continu-
ous flow at a standard concentration of 18,000 cells/mL.
The food input in each tank was monitored via the
concentration of chlorophyll-a (Chl-a), using a portable
fluorometer (10 AU-Turner Designs, Turner Designs,
Sunnyvale, CA). Given the complexity of the experimental
system and the facilities available, it was not possible to
construct three completely separate circuits as true repli-
cates. A total of 30 animals were put into each tank, with
different sets of individuals used for the morphometrics,
the shell damage repair experiment, the metabolic measure-
ments (oxygen consumption, nitrogen excretion, and O:N
ratios), and the transcriptional profiling (Q-PCR and
SOLiD analyses) to explore the full range of variability
within the experimental populations.
Morphometrics, shell damage repair, andcondition index
The specimens with a mean wet weight of 28.1 g (�0.6 g
standard error [SE] mean) were photographed before they
were introduced into the experimental circuit and at the
end of the experiment. Shells were numbered to facilitate
matching of individual oysters during the experiment. Six
oysters from each treatment were sampled after 3 months.
Tissue and shell wet weight were measured for each ani-
mal. Small pieces of mantle tissue were flash frozen in
liquid nitrogen for molecular analyses. Tissues and shells
were dried at 60°C for 2 days and the dry weights (DW)
of each noted. The condition index was calculated accord-
ing to Davenport and Chen (1987), where CI = (dry tissue
weight/dry shell weight) 9 100. A further six oysters from
each treatment had a small hole drilled in the shell using a
standard household drill and were replaced in the system
for a week and then assessed for their ability to repair this
breach in their external structure. For measurements of
shell repair after drilling, photographs were taken of each
of the holes and the area occluded measured using ImageJ
(rsb.info.nih.gov/ij/).
Figure 1. Picture of Crassostrea gigas.
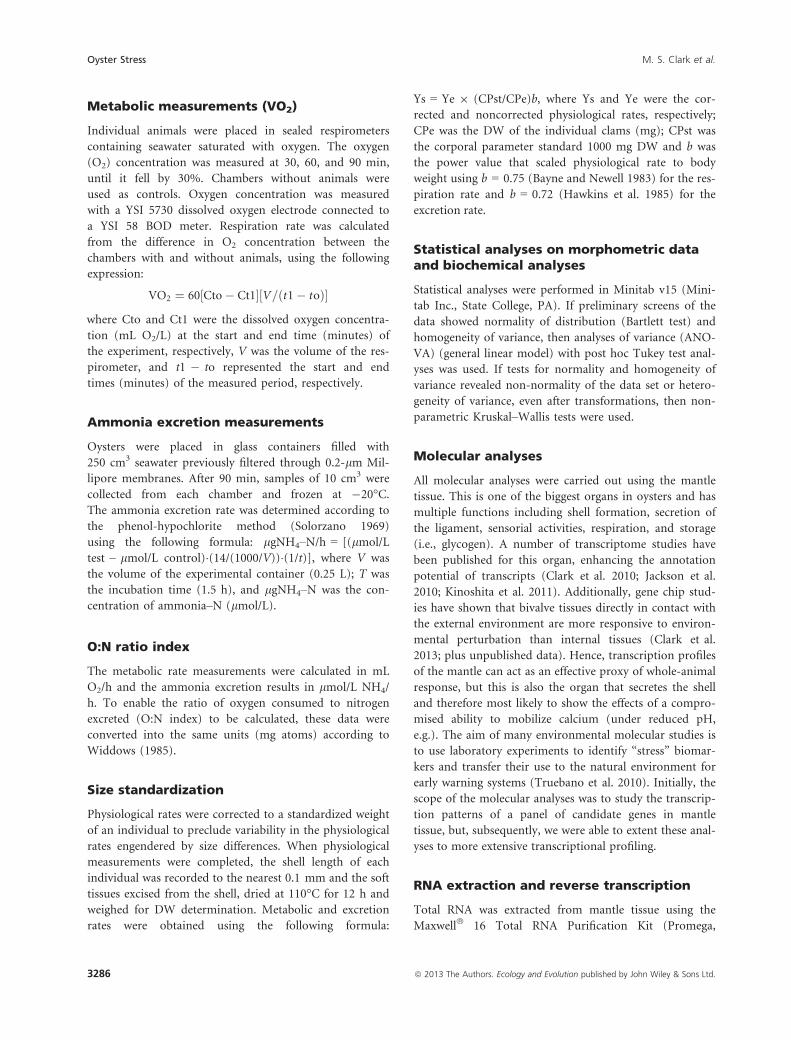
Table 1. Water parameters over the course of the 3 month experiment in each of the treatment tanks and mortalities.
Tank 1 (NH) Tank 2 (PHH) Tank 3 (PHL) Tank4 (NL)
24°C, normal pH 24°C, low pH 19°C, low pH 19°C, normal pH
Temperature 24.3 � 0.7 24.2 � 0.3 18.8 � 0.1 19.4 � 0.5
pH 7.89 � 0.01 7.45 � 0.02 7.46 � 0.02 7.84 � 0.02
Salinity (%º) 35.9 � 0.3 35.9 � 0.3 36.2 � 0.1 35.5 � 0.5
Oxygen (%) 88.2 � 2.8 88.3 � 2.6 82.9 � 4.9 87.9 � 3.2
Oxygen (mg/L) 6.25 � 0.37 6.54 � 0.07 7.15 � 0.05 7.17 � 0.05
Mortalities (%) 37.9 6.6 10 3.3
ª 2013 The Authors. Ecology and Evolution published by John Wiley & Sons Ltd. 3285
M. S. Clark et al. Oyster Stress
Metabolic measurements (VO2)
Individual animals were placed in sealed respirometers
containing seawater saturated with oxygen. The oxygen
(O2) concentration was measured at 30, 60, and 90 min,
until it fell by 30%. Chambers without animals were
used as controls. Oxygen concentration was measured
with a YSI 5730 dissolved oxygen electrode connected to
a YSI 58 BOD meter. Respiration rate was calculated
from the difference in O2 concentration between the
chambers with and without animals, using the following
expression:
VO2 ¼ 60½Cto� Ct1�½V=ðt1� toÞ�where Cto and Ct1 were the dissolved oxygen concentra-
tion (mL O2/L) at the start and end time (minutes) of
the experiment, respectively, V was the volume of the res-
pirometer, and t1 � to represented the start and end
times (minutes) of the measured period, respectively.
Ammonia excretion measurements
Oysters were placed in glass containers filled with
250 cm3 seawater previously filtered through 0.2-lm Mil-
lipore membranes. After 90 min, samples of 10 cm3 were
collected from each chamber and frozen at �20°C.The ammonia excretion rate was determined according to
the phenol-hypochlorite method (Solorzano 1969)
using the following formula: lgNH4–N/h = [(lmol/L
test – lmol/L control)�(14/(1000/V))�(1/t)], where V was
the volume of the experimental container (0.25 L); T was
the incubation time (1.5 h), and lgNH4–N was the con-
centration of ammonia–N (lmol/L).
O:N ratio index
The metabolic rate measurements were calculated in mL
O2/h and the ammonia excretion results in lmol/L NH4/
h. To enable the ratio of oxygen consumed to nitrogen
excreted (O:N index) to be calculated, these data were
converted into the same units (mg atoms) according to
Widdows (1985).
Size standardization
Physiological rates were corrected to a standardized weight
of an individual to preclude variability in the physiological
rates engendered by size differences. When physiological
measurements were completed, the shell length of each
individual was recorded to the nearest 0.1 mm and the soft
tissues excised from the shell, dried at 110°C for 12 h and
weighed for DW determination. Metabolic and excretion
rates were obtained using the following formula:
Ys = Ye 9 (CPst/CPe)b, where Ys and Ye were the cor-
rected and noncorrected physiological rates, respectively;
CPe was the DW of the individual clams (mg); CPst was
the corporal parameter standard 1000 mg DW and b was
the power value that scaled physiological rate to body
weight using b = 0.75 (Bayne and Newell 1983) for the res-
piration rate and b = 0.72 (Hawkins et al. 1985) for the
excretion rate.
Statistical analyses on morphometric dataand biochemical analyses
Statistical analyses were performed in Minitab v15 (Mini-
tab Inc., State College, PA). If preliminary screens of the
data showed normality of distribution (Bartlett test) and
homogeneity of variance, then analyses of variance (ANO-
VA) (general linear model) with post hoc Tukey test anal-
yses was used. If tests for normality and homogeneity of
variance revealed non-normality of the data set or hetero-
geneity of variance, even after transformations, then non-
parametric Kruskal–Wallis tests were used.
Molecular analyses
All molecular analyses were carried out using the mantle
tissue. This is one of the biggest organs in oysters and has
multiple functions including shell formation, secretion of
the ligament, sensorial activities, respiration, and storage
(i.e., glycogen). A number of transcriptome studies have
been published for this organ, enhancing the annotation
potential of transcripts (Clark et al. 2010; Jackson et al.
2010; Kinoshita et al. 2011). Additionally, gene chip stud-
ies have shown that bivalve tissues directly in contact with
the external environment are more responsive to environ-
mental perturbation than internal tissues (Clark et al.
2013; plus unpublished data). Hence, transcription profiles
of the mantle can act as an effective proxy of whole-animal
response, but this is also the organ that secretes the shell
and therefore most likely to show the effects of a compro-
mised ability to mobilize calcium (under reduced pH,
e.g.). The aim of many environmental molecular studies is
to use laboratory experiments to identify “stress” biomar-
kers and transfer their use to the natural environment for
early warning systems (Truebano et al. 2010). Initially, the
scope of the molecular analyses was to study the transcrip-
tion patterns of a panel of candidate genes in mantle
tissue, but, subsequently, we were able to extent these anal-
yses to more extensive transcriptional profiling.
RNA extraction and reverse transcription
Total RNA was extracted from mantle tissue using the
Maxwell� 16 Total RNA Purification Kit (Promega,
3286 ª 2013 The Authors. Ecology and Evolution published by John Wiley & Sons Ltd.
Oyster Stress M. S. Clark et al.
Madison, WI) according to manufacturer’s instructions.
Samples were then treated with a DNA-free Kit (Ambion,
Austin, TX) to remove genomic DNA, and reverse tran-
scription was carried out using 500 ng of total RNA, ran-
dom hexamers, and MMLV reverse transcriptase
(Promega) according to manufacturer’s protocols.
Q-PCR primer design and analysis
Primers were designed using Primer3 software (http://frodo.
wi.mit.edu/). Primer pairs that gave a single product with
the expected size and absence of primer dimers (Table S1)
were then tested for real-time PCR. The Q-PCR assays were
performed in duplicate in a total volume of 15 lL (7.5 lL of
29 SYBR� Green supermix [Biorad, Hercules, CA], 1 lmol/
L of each primer, and 2 lL of cDNA [1:5 dilution]). For all
genes, PCR cycling conditions were as follows: 10 min at
95°C, followed by 45 cycles of 15 sec at 95°C, and 1 min at
60°C. A final melt curve was carried out between 60 and
95°C. Each run included cDNA samples and blank no tem-
plate controls. PCR efficiency (E) was determined using
standard curves from a serial dilution of pooled cDNA from
all treatments for each primer pair. Baseline corrections and
Ct value determination were performed using StepOne soft-
ware v2.0 (Applied Biosystems, Foster City, CA). Relative
quantification was done by normalizing raw Ct values to the
reference gene using the formula, Etarget (Ct target)/EReference(Ct reference). No significant differences (Kruskal–Wallis
test, P > 0.05) in Ct values and a low coefficient of variation
(4.3%) were observed for the actin gene among treatments,
justifying its use as the reference gene. Differences in the rel-
ative expression of each gene among treatments were ana-
lyzed by one-way analysis of variance (ANOVA).
Transcription profiling
RNA was isolated as described above. Five individuals
from each treatment were pooled and subjected to SOLiD
transcriptional profiling at the Natural Environment
Research Council Biomolecular Analysis Facility at Liver-
pool. A total of 205,888 C. gigas ESTs from the public
database were assembled using CAP3 with default param-
eters to construct 20,125 contigs (Table S2), which were
then used as the reference for mapping the SOLiD
sequences. This consisted of the following groups of
paired-end reads: 45,900,175 (NH), 36,811,031 (PHH),
38,477,719 (NL), and 41,668,977 (PHL). The paired reads
were mapped to the contigs with Maq (Li et al. 2008),
using default parameters. Expression analysis was carried
out on all the pairwise combinations, rather than a facto-
rial design (Table 2). Filtering consisted of removing
mappings in which one of the treatments had no map-
ping for a given contig. Normalization was carried out by
dividing counts by library size. Selection for differential
expression consisted of two approaches for added strin-
gency: a twofold expression-level difference, and the use
of a linear model in Bayseq (Hardcastle and Kelly 2010),
with a Benjamin–Hochberg adjustment for multiple test-
ing (Benjamini and Hochberg 1995) with a cutoff set at
0.01. For the linear model, a proxy replication for map-
ping variance consisted of the separate mappings of the
paired-end reads to the contigs. Only mappings where
both paired-end reads mapped to the same contig were
used to generate expression levels and calculate signifi-
cance of expression (Table S2). Contigs were searched for
sequence similarity using Blast (Altschul et al. 1997)
against the GenBank nonredundant database (Benson
et al. 2007) with a threshold score of <1e�10. All annota-
tions were manually verified. All sequence data were
submitted to the NCBI Short-Read Archive (SRA) with
the accession number: SRA064041.
Results and Discussion
All the oysters used in this study came from the same
year cohort and were held under identical conditions
prior to the start of the experiment, with a year’s culti-
vation in the Ria, prior to the start of this experiment,
and hence were of a similar size, age, and physiological
condition. The temperatures used in this study were
well within the normal temperature ranges of the Ria
Formosa lagoon. Annually the temperatures vary from
12°C in winter to 27°C in summer (Newton and Mud-
ge 2003). So in the study described here, the 19°C
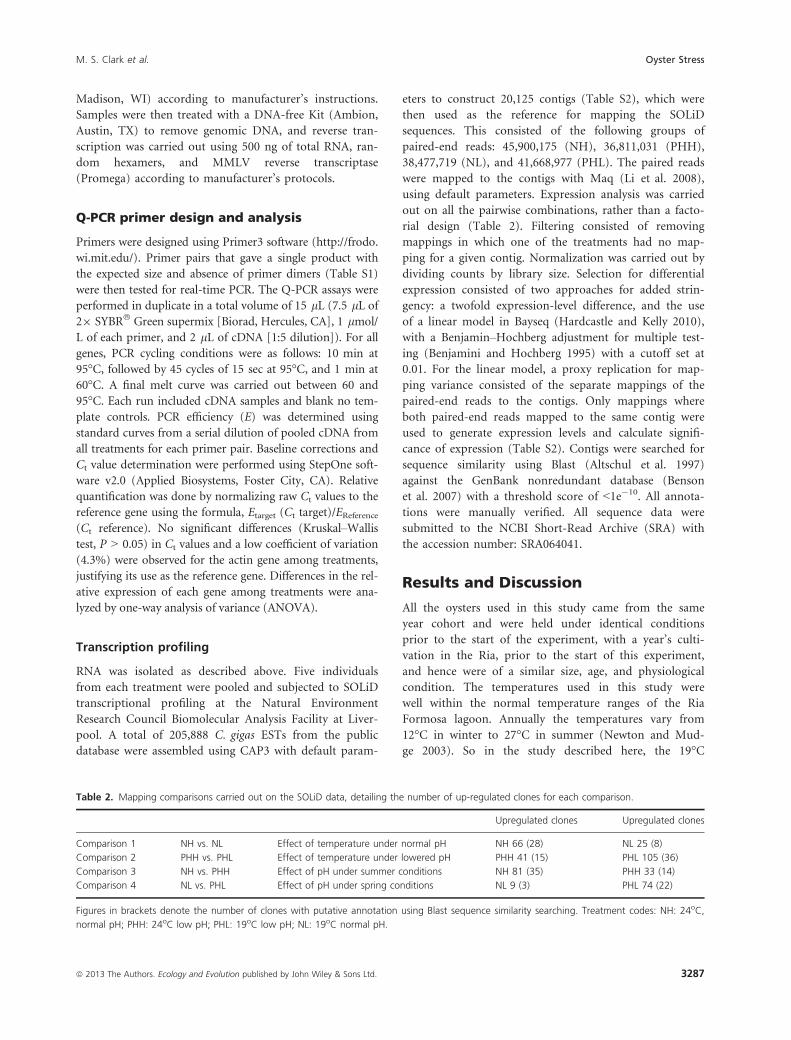
Table 2. Mapping comparisons carried out on the SOLiD data, detailing the number of up-regulated clones for each comparison.
Upregulated clones Upregulated clones
Comparison 1 NH vs. NL Effect of temperature under normal pH NH 66 (28) NL 25 (8)
Comparison 2 PHH vs. PHL Effect of temperature under lowered pH PHH 41 (15) PHL 105 (36)
Comparison 3 NH vs. PHH Effect of pH under summer conditions NH 81 (35) PHH 33 (14)
Comparison 4 NL vs. PHL Effect of pH under spring conditions NL 9 (3) PHL 74 (22)
Figures in brackets denote the number of clones with putative annotation using Blast sequence similarity searching. Treatment codes: NH: 24oC,
normal pH; PHH: 24oC low pH; PHL: 19oC low pH; NL: 19oC normal pH.
ª 2013 The Authors. Ecology and Evolution published by John Wiley & Sons Ltd. 3287
M. S. Clark et al. Oyster Stress
treatment corresponded to an average spring/autumn
temperature, whereas 24°C represented a high tempera-
ture that regularly occurs in the summer. The aquarium
system was stocked with water collected directly from
the Ria Formosa. This water source has a naturally
lower pH, compared with open ocean waters, so ambi-
ent water pH for the experiment was approximately 7.9
with the experimentally lowered pH being reduced by
0.4 pH units. Water was taken from the Ria at high
tides only, from the main channel, where there is no
stratification (Newton and Mudge 2003) and hence
salinity remained constant throughout the period of the
experiment (Table 1).
Mortality and spawning
There was some mortality in each of the tanks during the
3-month culture (Table 1) ranging from 3.3% in the
19°C ambient pH tank to almost 38% in the 24°C ambi-
ent pH tank. One further animal died in the 24°C ambi-
ent pH group after the shell had been drilled, presumably
as a result of trauma during the drilling process. High
mortalities are often observed in C. gigas at high tempera-
tures (Perdue et al. 1981), but mortalities in the 24°C,low-pH tank were only 6.6% (Table 1). Given that in
each temperature circuit both tanks were fed from the
same header tank, that is, the water supply in the 24°Cambient and 24°C low pH was the same, it was unlikely
that disease was the cause. The animals in the 24°C ambi-
ent pH tank spawned first and the losses occurred directly
after this spawning event, which may explain the loss of
physiological condition of the oysters and/or water qual-
ity. Gamete release was probably less intense in the other
treatments, as both low temperatures and pH delay
spawning and decrease gamete quantity (Loosanoff and
Davis 1952; Calabrese and Davis 1966).
Condition index
Condition index (CI) reflects the physiological condition
of the animals due to their activity (e.g., reproduction,
growth, health status) under certain environmental condi-
tions. It also reflects the energy balance which can vary
considerably in filter-feeding organisms in the natural
environment depending on phytoplankton availability and
the physiological requirements of the animals (Bayne
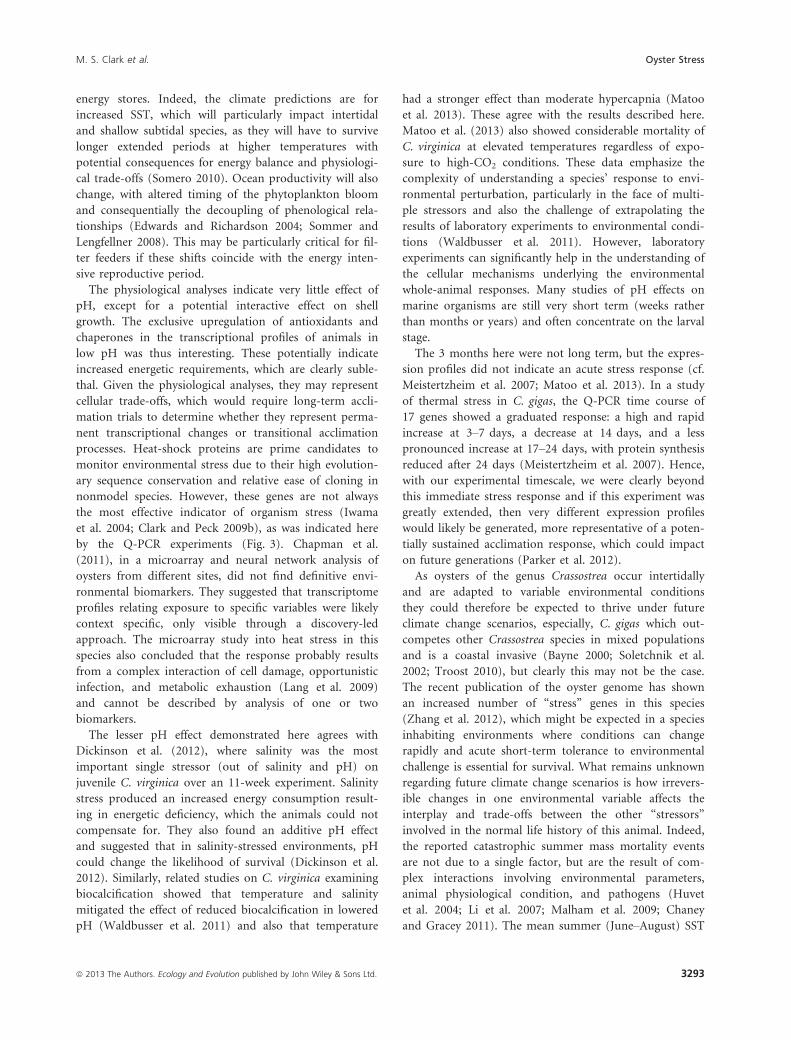
et al. 1976; Norkko and Thrush 2006). Significant
differences were detected in the CI results between treat-
ments; GLM showed an effect of temperature: F1,43:
38.35, P < 0.001, but no effect of pH (P = 0.349) on CI
and no interaction between temperature and pH
(P = 0.137). Hence, animals kept at 19°C showed a sig-
nificantly higher tissue to shell mass ratio, irrespective of
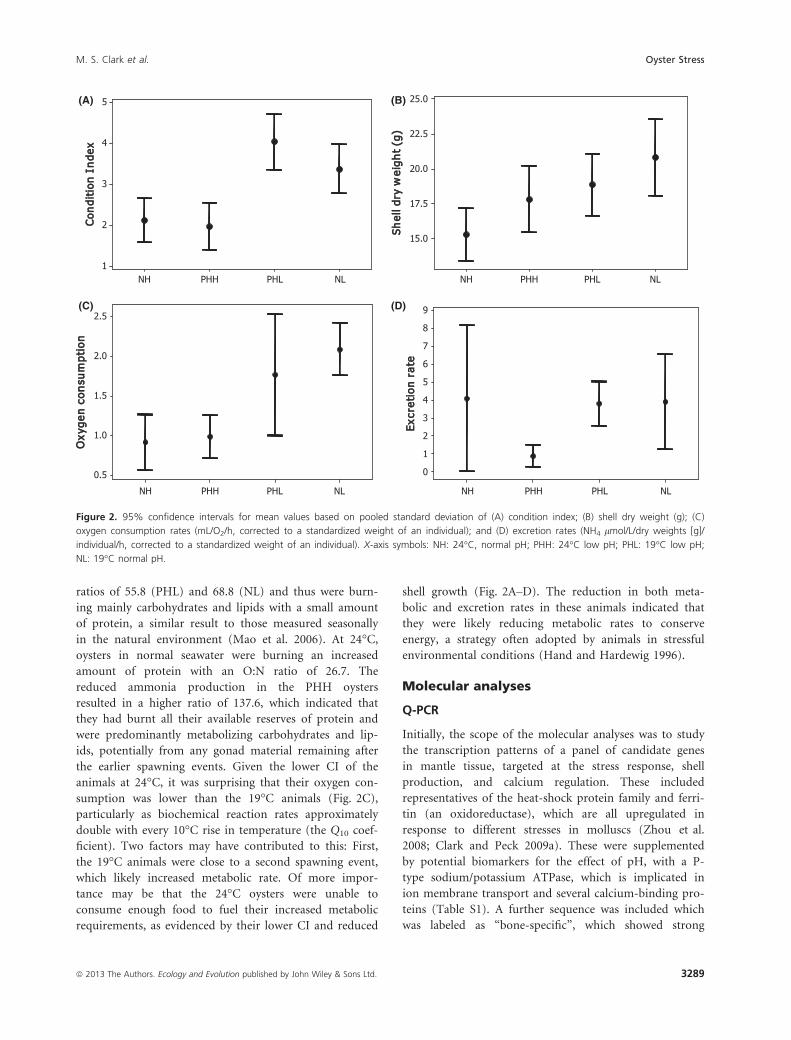
pH (Fig. 2A). In this experiment, animals were fed ad lib-
itum, at higher levels than the Mediterranean bloom and
also above that required to produce maximum clearance
rates in grazing experiments (Dupuy et al. 2000). Differ-
ences in CI were thus purely due to treatment effects
(Fig. 2A). As the CI was not taken at the start of the
experiment, the lower CI at 24°C could be due to either a
net loss (via mobilization of stored reserves) or a failure
to accumulate reserves as fast as the animals at 19°C.
Shell growth and damage repair
Because of the irregular shape of cupped oysters, dry shell
weights were used as the metric of growth. The GLM
analyses showed a significant effect of temperature on dry
shell weights (F1,43 P = 0.003), but no effect of pH (F1,43P = 0.791), although a significant interaction occurred
between temperature and pH: F1,43 P = 0.037 (Fig. 2B).
The post hoc Tukey test showed that animals kept at nor-
mal pH at 19°C had significantly (T = 3.751, P = 0.003)
heavier shells than those of animals kept in normal pH at
24°C (Fig. 2B). In the damage repair experiment, a one-
way ANOVA of the area occluded showed no significant
differences between any of the treatments (F1,20 = 0.64,
P = 0.601) (data not shown), indicating that shells were
repaired at similar levels, irrespective of treatment. The
fact that animals at the higher temperatures had lighter
shells (Fig. 2B) indicated that they had reallocated energy
away from growth. However, the shell growth results con-
trast with those from the damage repair experiment. The
lack of difference in damage repair capacities under the
different treatments indicated that the requirement to
repair a breach in the external defenses took priority over
other processes.
Oxygen consumption, excretion rates, andO:N ratios
Metabolic rate data were non-normally distributed, so a
nonparametric Kruskal–Wallis analysis was used and
showed a significant effect of temperature (P < 0.001),
but no effect of pH (P = 0.404) (Fig. 2C). Although a
large variability in excretion rates was measured within
treatments (Fig. 2D), there was a significant effect of tem-
perature (P < 0.007), but no effect of pH (P = 0.100)
(Fig. 2D). The large variability in excretion rates was
potentially confounded by lower numbers of animals
sampled from the 24°C normal seawater tank (n = 5,
with n = 10 in all other treatments) and four animals in
the 24°C low-pH tank, where the excretion rates were not
detectable above background levels. The O:N ratios indi-
cated that there was a difference in fuel substrate utiliza-
tion among treatments. The 19°C oysters had similar O:N
3288 ª 2013 The Authors. Ecology and Evolution published by John Wiley & Sons Ltd.
Oyster Stress M. S. Clark et al.
ratios of 55.8 (PHL) and 68.8 (NL) and thus were burn-
ing mainly carbohydrates and lipids with a small amount
of protein, a similar result to those measured seasonally
in the natural environment (Mao et al. 2006). At 24°C,oysters in normal seawater were burning an increased
amount of protein with an O:N ratio of 26.7. The
reduced ammonia production in the PHH oysters
resulted in a higher ratio of 137.6, which indicated that
they had burnt all their available reserves of protein and
were predominantly metabolizing carbohydrates and lip-
ids, potentially from any gonad material remaining after
the earlier spawning events. Given the lower CI of the
animals at 24°C, it was surprising that their oxygen con-
sumption was lower than the 19°C animals (Fig. 2C),
particularly as biochemical reaction rates approximately
double with every 10°C rise in temperature (the Q10 coef-
ficient). Two factors may have contributed to this: First,
the 19°C animals were close to a second spawning event,
which likely increased metabolic rate. Of more impor-
tance may be that the 24°C oysters were unable to
consume enough food to fuel their increased metabolic
requirements, as evidenced by their lower CI and reduced
shell growth (Fig. 2A–D). The reduction in both meta-
bolic and excretion rates in these animals indicated that
they were likely reducing metabolic rates to conserve
energy, a strategy often adopted by animals in stressful
environmental conditions (Hand and Hardewig 1996).
Molecular analyses
Q-PCR
Initially, the scope of the molecular analyses was to study
the transcription patterns of a panel of candidate genes
in mantle tissue, targeted at the stress response, shell
production, and calcium regulation. These included
representatives of the heat-shock protein family and ferri-
tin (an oxidoreductase), which are all upregulated in
response to different stresses in molluscs (Zhou et al.
2008; Clark and Peck 2009a). These were supplemented
by potential biomarkers for the effect of pH, with a P-
type sodium/potassium ATPase, which is implicated in
ion membrane transport and several calcium-binding pro-
teins (Table S1). A further sequence was included which
was labeled as “bone-specific”, which showed strong
NLPHLPHHNH
5
4
3
2
1NLPHLPHHNH
25.0
22.5
20.0
17.5
15.0
NLPHLPHHNH
2.5
2.0
1.5
1.0
0.5
NLPHLPHHNH
9
8
7
6
5
4
3
2
1
0
(D)
(A) (B)
(C)
Figure 2. 95% confidence intervals for mean values based on pooled standard deviation of (A) condition index; (B) shell dry weight (g); (C)
oxygen consumption rates (mL/O2/h, corrected to a standardized weight of an individual); and (D) excretion rates (NH4 lmol/L/dry weights [g]/
individual/h, corrected to a standardized weight of an individual). X-axis symbols: NH: 24°C, normal pH; PHH: 24°C low pH; PHL: 19°C low pH;
NL: 19°C normal pH.
ª 2013 The Authors. Ecology and Evolution published by John Wiley & Sons Ltd. 3289
M. S. Clark et al. Oyster Stress
sequence similarity to cmf608, a unique marker of early
osteochondroprogenitor cells in Homo sapiens (Segev
et al. 2004); although its function in other species
remains unknown, it presents a reasonable candidate for
further investigation in lesser characterized nonmodel
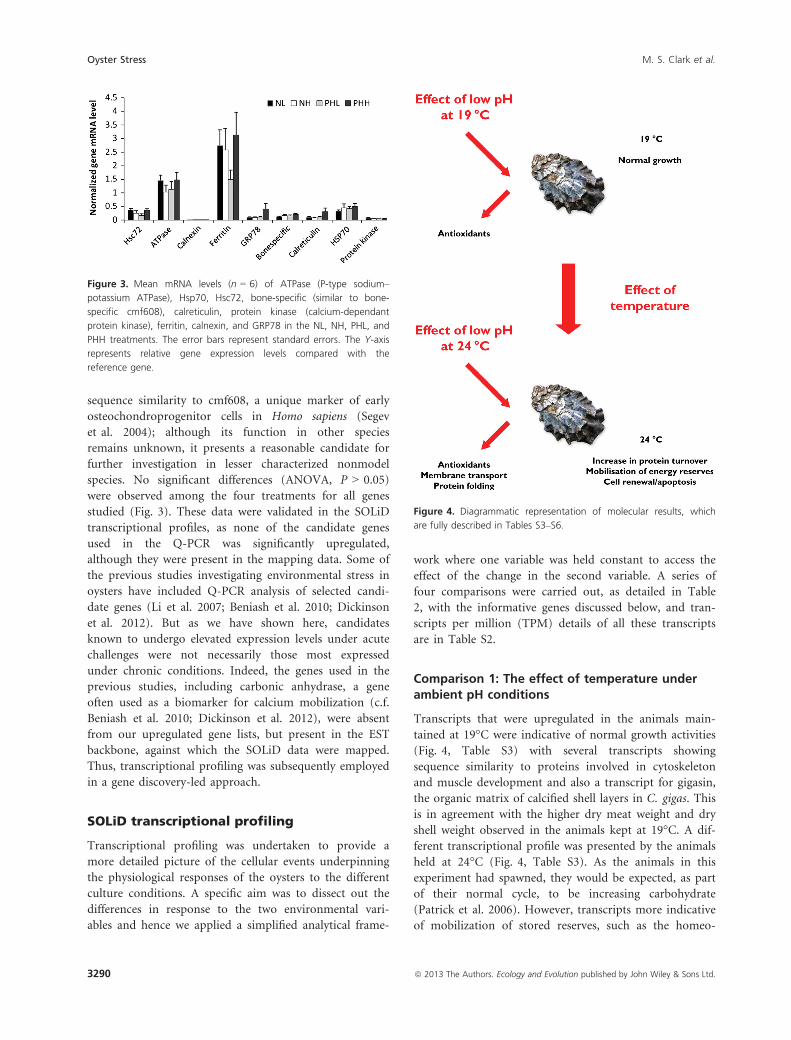
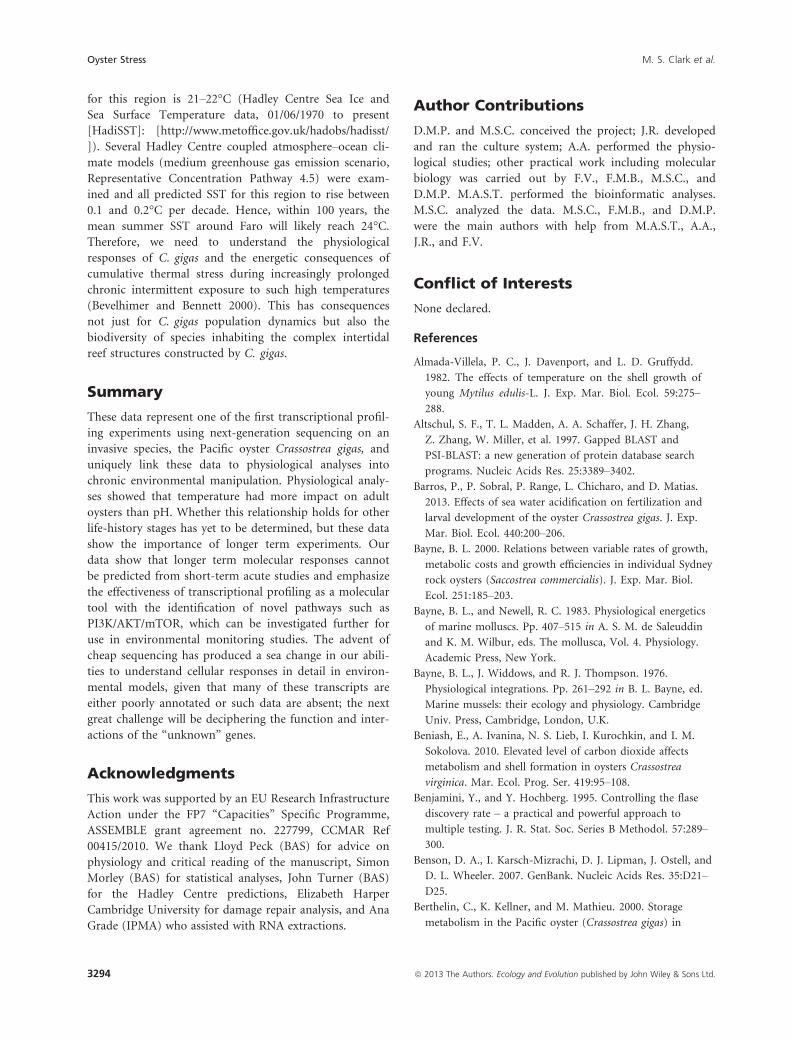
species. No significant differences (ANOVA, P > 0.05)
were observed among the four treatments for all genes
studied (Fig. 3). These data were validated in the SOLiD
transcriptional profiles, as none of the candidate genes
used in the Q-PCR was significantly upregulated,
although they were present in the mapping data. Some of
the previous studies investigating environmental stress in
oysters have included Q-PCR analysis of selected candi-
date genes (Li et al. 2007; Beniash et al. 2010; Dickinson
et al. 2012). But as we have shown here, candidates
known to undergo elevated expression levels under acute
challenges were not necessarily those most expressed
under chronic conditions. Indeed, the genes used in the
previous studies, including carbonic anhydrase, a gene
often used as a biomarker for calcium mobilization (c.f.
Beniash et al. 2010; Dickinson et al. 2012), were absent
from our upregulated gene lists, but present in the EST
backbone, against which the SOLiD data were mapped.
Thus, transcriptional profiling was subsequently employed
in a gene discovery-led approach.
SOLiD transcriptional profiling
Transcriptional profiling was undertaken to provide a
more detailed picture of the cellular events underpinning
the physiological responses of the oysters to the different
culture conditions. A specific aim was to dissect out the
differences in response to the two environmental vari-
ables and hence we applied a simplified analytical frame-
work where one variable was held constant to access the
effect of the change in the second variable. A series of
four comparisons were carried out, as detailed in Table
2, with the informative genes discussed below, and tran-
scripts per million (TPM) details of all these transcripts
are in Table S2.
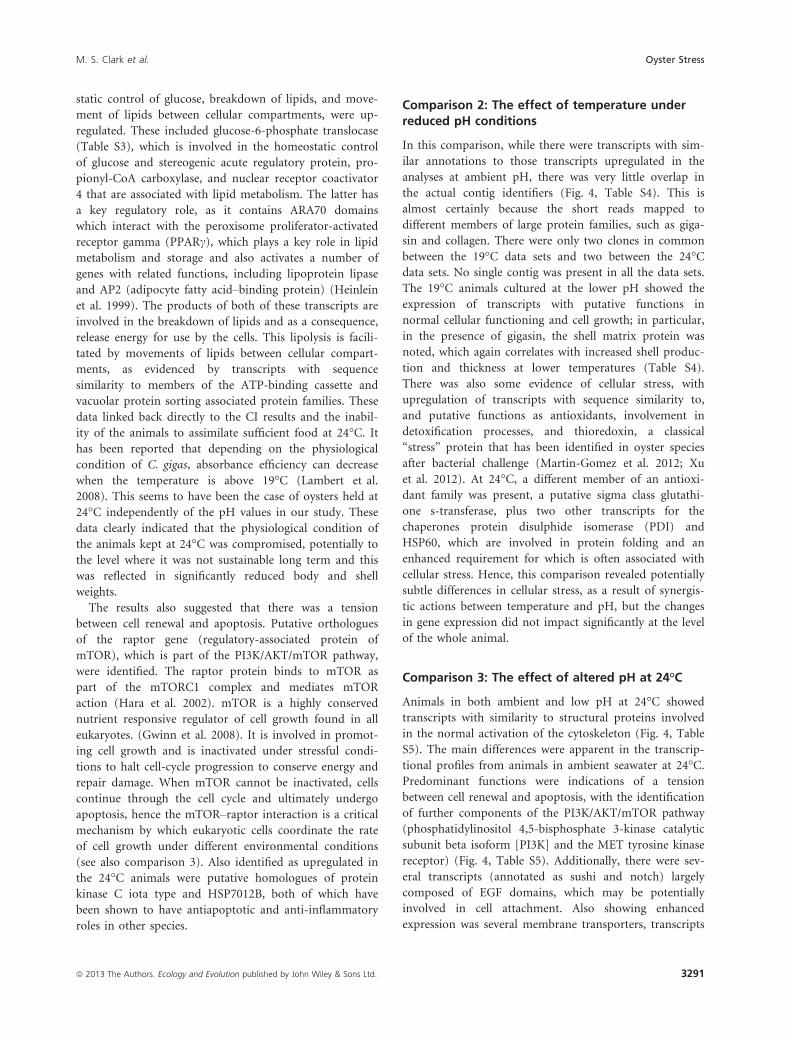
Comparison 1: The effect of temperature underambient pH conditions
Transcripts that were upregulated in the animals main-
tained at 19°C were indicative of normal growth activities
(Fig. 4, Table S3) with several transcripts showing
sequence similarity to proteins involved in cytoskeleton
and muscle development and also a transcript for gigasin,
the organic matrix of calcified shell layers in C. gigas. This
is in agreement with the higher dry meat weight and dry
shell weight observed in the animals kept at 19°C. A dif-
ferent transcriptional profile was presented by the animals
held at 24°C (Fig. 4, Table S3). As the animals in this
experiment had spawned, they would be expected, as part
of their normal cycle, to be increasing carbohydrate
(Patrick et al. 2006). However, transcripts more indicative
of mobilization of stored reserves, such as the homeo-
Figure 3. Mean mRNA levels (n = 6) of ATPase (P-type sodium–
potassium ATPase), Hsp70, Hsc72, bone-specific (similar to bone-
specific cmf608), calreticulin, protein kinase (calcium-dependant
protein kinase), ferritin, calnexin, and GRP78 in the NL, NH, PHL, and
PHH treatments. The error bars represent standard errors. The Y-axis
represents relative gene expression levels compared with the
reference gene.
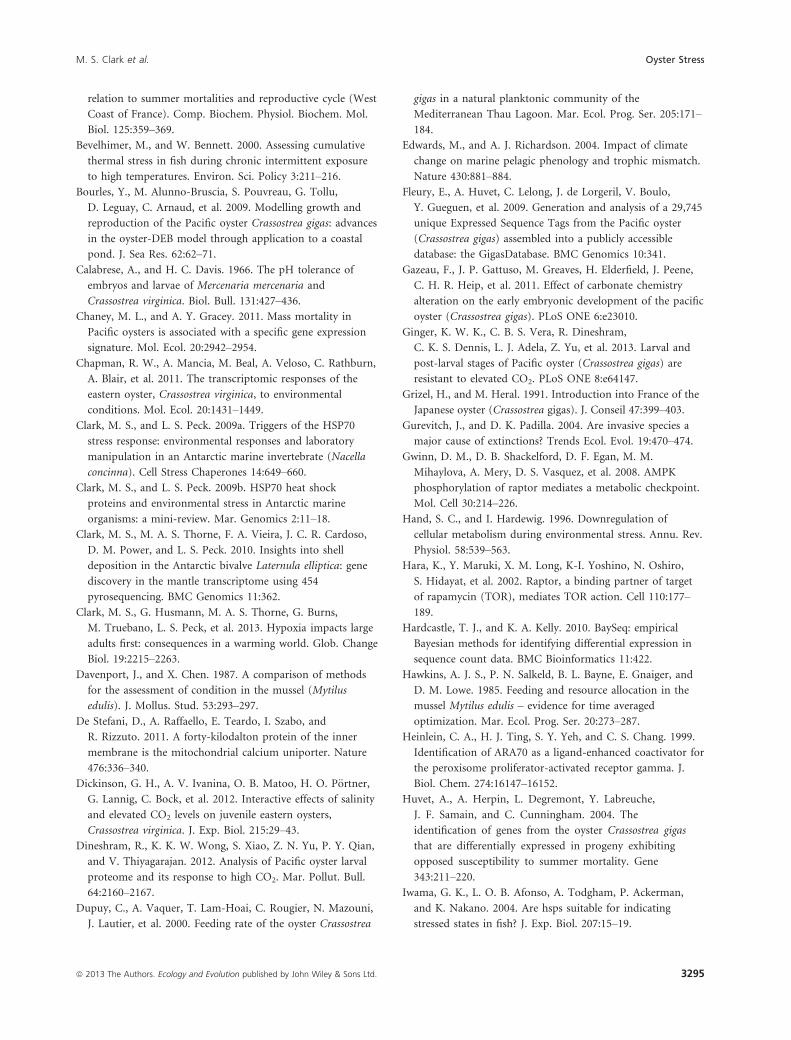
Figure 4. Diagrammatic representation of molecular results, which
are fully described in Tables S3–S6.
3290 ª 2013 The Authors. Ecology and Evolution published by John Wiley & Sons Ltd.
Oyster Stress M. S. Clark et al.
static control of glucose, breakdown of lipids, and move-
ment of lipids between cellular compartments, were up-
regulated. These included glucose-6-phosphate translocase
(Table S3), which is involved in the homeostatic control
of glucose and stereogenic acute regulatory protein, pro-
pionyl-CoA carboxylase, and nuclear receptor coactivator
4 that are associated with lipid metabolism. The latter has
a key regulatory role, as it contains ARA70 domains
which interact with the peroxisome proliferator-activated
receptor gamma (PPARc), which plays a key role in lipid
metabolism and storage and also activates a number of
genes with related functions, including lipoprotein lipase
and AP2 (adipocyte fatty acid–binding protein) (Heinlein
et al. 1999). The products of both of these transcripts are
involved in the breakdown of lipids and as a consequence,
release energy for use by the cells. This lipolysis is facili-
tated by movements of lipids between cellular compart-
ments, as evidenced by transcripts with sequence
similarity to members of the ATP-binding cassette and
vacuolar protein sorting associated protein families. These
data linked back directly to the CI results and the inabil-
ity of the animals to assimilate sufficient food at 24°C. Ithas been reported that depending on the physiological
condition of C. gigas, absorbance efficiency can decrease
when the temperature is above 19°C (Lambert et al.
2008). This seems to have been the case of oysters held at
24°C independently of the pH values in our study. These
data clearly indicated that the physiological condition of
the animals kept at 24°C was compromised, potentially to
the level where it was not sustainable long term and this
was reflected in significantly reduced body and shell
weights.
The results also suggested that there was a tension
between cell renewal and apoptosis. Putative orthologues
of the raptor gene (regulatory-associated protein of
mTOR), which is part of the PI3K/AKT/mTOR pathway,
were identified. The raptor protein binds to mTOR as
part of the mTORC1 complex and mediates mTOR
action (Hara et al. 2002). mTOR is a highly conserved
nutrient responsive regulator of cell growth found in all
eukaryotes. (Gwinn et al. 2008). It is involved in promot-
ing cell growth and is inactivated under stressful condi-
tions to halt cell-cycle progression to conserve energy and
repair damage. When mTOR cannot be inactivated, cells
continue through the cell cycle and ultimately undergo
apoptosis, hence the mTOR–raptor interaction is a critical
mechanism by which eukaryotic cells coordinate the rate
of cell growth under different environmental conditions
(see also comparison 3). Also identified as upregulated in
the 24°C animals were putative homologues of protein
kinase C iota type and HSP7012B, both of which have
been shown to have antiapoptotic and anti-inflammatory
roles in other species.
Comparison 2: The effect of temperature underreduced pH conditions
In this comparison, while there were transcripts with sim-
ilar annotations to those transcripts upregulated in the
analyses at ambient pH, there was very little overlap in
the actual contig identifiers (Fig. 4, Table S4). This is
almost certainly because the short reads mapped to
different members of large protein families, such as giga-
sin and collagen. There were only two clones in common
between the 19°C data sets and two between the 24°Cdata sets. No single contig was present in all the data sets.
The 19°C animals cultured at the lower pH showed the
expression of transcripts with putative functions in
normal cellular functioning and cell growth; in particular,
in the presence of gigasin, the shell matrix protein was
noted, which again correlates with increased shell produc-
tion and thickness at lower temperatures (Table S4).
There was also some evidence of cellular stress, with
upregulation of transcripts with sequence similarity to,
and putative functions as antioxidants, involvement in
detoxification processes, and thioredoxin, a classical
“stress” protein that has been identified in oyster species
after bacterial challenge (Martin-Gomez et al. 2012; Xu
et al. 2012). At 24°C, a different member of an antioxi-
dant family was present, a putative sigma class glutathi-
one s-transferase, plus two other transcripts for the
chaperones protein disulphide isomerase (PDI) and
HSP60, which are involved in protein folding and an
enhanced requirement for which is often associated with
cellular stress. Hence, this comparison revealed potentially
subtle differences in cellular stress, as a result of synergis-
tic actions between temperature and pH, but the changes
in gene expression did not impact significantly at the level
of the whole animal.
Comparison 3: The effect of altered pH at 24°C
Animals in both ambient and low pH at 24°C showed
transcripts with similarity to structural proteins involved
in the normal activation of the cytoskeleton (Fig. 4, Table
S5). The main differences were apparent in the transcrip-
tional profiles from animals in ambient seawater at 24°C.Predominant functions were indications of a tension
between cell renewal and apoptosis, with the identification
of further components of the PI3K/AKT/mTOR pathway
(phosphatidylinositol 4,5-bisphosphate 3-kinase catalytic
subunit beta isoform [PI3K] and the MET tyrosine kinase
receptor) (Fig. 4, Table S5). Additionally, there were sev-
eral transcripts (annotated as sushi and notch) largely
composed of EGF domains, which may be potentially
involved in cell attachment. Also showing enhanced
expression was several membrane transporters, transcripts
ª 2013 The Authors. Ecology and Evolution published by John Wiley & Sons Ltd. 3291
M. S. Clark et al. Oyster Stress
implicated in calcium mobilization, and mobilization of
energy stores. Of particular note was a putative mitochon-
drial calcium uniporter (MCU). Mitochondrial calcium
homeostasis via the MCU has a key role in the regulation
of aerobic metabolism and cell survival (De Stefani et al.
2011). It was noteworthy that carbonic anhydrase, a gene
often used as a biomarker for calcium mobilization (c.f.
Beniash et al. 2010; Dickinson et al. 2012) was not present
in any of our upregulated gene lists. Finally, similar to
comparison 1, there was evidence of enhanced mobiliza-
tion of energy stores with annotations for phosphoenol-
pyruvate carboxylase (carbohydrate biogenesis); fructose-1
(gluconeogenesis), and pancreatic lipase-related protein
(lipid metabolism). This potentially increased energy
mobilization in the animals in normal seawater at 24°Cmay explain the interaction effect observed in the analysis
of the shell weight data, where, in spite of similar CIs,
these animals had lighter shells than animals in lowered
seawater pH at the same temperature. The animals in nor-
mal seawater expressed transcripts, which indicated that
they may have been more active in their immune defense
(Table S5; e.g., ECSIT [evolutionary conserved signaling
intermediate in the Toll pathway]). This was the only set
of animals with mortalities occurring at the start of the
experiment and so represents a selected subset of the pop-
ulation. It may be that whatever caused the mortality
event may have sensitized the surviving animals to the
prolonged stressful conditions.
Comparison 4: The effect of altered pH at 19°C
There was virtually no overlap of the 19°C data sets, to
those at 24°C above, with only one unannotated contig in
common in the low-pH conditions. This final comparison
was largely characterized by an increased immune
response and production of antioxidants in the animals
cultured in low pH (Fig. 4, Table S6). The best example
of this was a match to the antimicrobial peptide, big
defensin 1 from C. gigas. This gene is presumed to be
expressed only in hemocytes. The presence of these tran-
scripts in mantle tissue may be due to hemocyte infiltra-
tion via the circulatory system. There were also other
transcripts identified with putative defensive roles, includ-
ing “classic” antioxidants, such as peroxidasin and gluta-
thione peroxidase. These data indicate that either the
animals in the lower pH came under enhanced microbial
challenge, or were more sensitive under the altered condi-
tions. But, again, these gene expression changes appear to
be subtle with regard to their effect on whole animal’s
physiology responses and morphometrics.
Previous investigations have reported C. gigas as sensi-
tive to both elevated temperatures and lowered pH with
significant mortalities predicted (Kurihara et al. 2007; Be-
niash et al. 2010; Lannig et al. 2010; Gazeau et al. 2011;
Tomanek et al. 2011; Dineshram et al. 2012; Barros et al.
2013), although this may vary with different populations
(Ginger et al. 2013). However, oysters of the genus Cras-
sostrea are generally found in intertidal to low subtidal
levels in estuaries and lagoons, environments where con-
ditions can change dramatically. For example, C. gigas is
able to survive in low- (ca. 5 ppt) and in extremely high
(ca. 42 ppt)-saline conditions and it also withstands tem-
peratures from close to freezing point up to 35°C. ThepH in the open ocean generally varies considerably less
than in estuary waters where it can easily drop below 7.
For example, during the 1960s when the Tagus estuary
(Portugal) had one of the biggest oyster beds in Europe
(species: C. angulata), pH values at the surface varied
between 5.75 and 7.85 with a mean value of 7.22 (Vilela
1975). Hence, oysters of the genus Crassostrea that are
well adapted to estuarine environments are likely to have
a high tolerance to short-term pH and temperature varia-
tion. Given the wide range of conditions tolerated by this
species in the natural environment, often exceeding those
of the laboratory manipulations, and the fact that it is a
successful invasive, such marked effects using laboratory-
manipulated pH experiments on oysters were surprising
and not necessarily in line with the results described here.
This experiment held C. gigas at elevated temperatures
and lowered pH for an extended period of 3 months
across the important summer reproductive period. The
compromised physiological condition in the 24°C oysters,
reflected in significantly reduced tissue and shell weights,
indicated that survival at this temperature was potentially
not sustainable in the long term. There were similarities
between these results shown here and the biochemical
processes associated with summer mortality events, where
carbohydrate metabolism decreases and lipid synthesis is
arrested (Berthelin et al. 2000). A previous study of
C. gigas indicated that feeding was only inhibited at 25°Cwith higher temperatures producing an energetic defi-
ciency. Temperatures of 15–25°C were reported as opti-
mal for sustaining increases in dry mass, even under
limiting food availability (Bourles et al. 2009). These data
would indicate that 24°C was a reasonable proxy for
summer exposure. However, in the natural environment,
temperature cycling occurs, whereas here, the animals
were held at 24°C constantly. Thus, recovery periods at
lower temperatures, where reductions in metabolism at
the same feeding rate, which enable the build-up of
energy reserves and continued growth, were not possible
(Almada-Villela et al. 1982). However, if the average tem-
perature of the Ria remains elevated over the summer in
the coming years, the recovery possible during diurnal
and more longer term (days) temperature cycling will
become less effective with potential chronic depletion of
3292 ª 2013 The Authors. Ecology and Evolution published by John Wiley & Sons Ltd.
Oyster Stress M. S. Clark et al.
energy stores. Indeed, the climate predictions are for
increased SST, which will particularly impact intertidal
and shallow subtidal species, as they will have to survive
longer extended periods at higher temperatures with
potential consequences for energy balance and physiologi-
cal trade-offs (Somero 2010). Ocean productivity will also
change, with altered timing of the phytoplankton bloom
and consequentially the decoupling of phenological rela-
tionships (Edwards and Richardson 2004; Sommer and
Lengfellner 2008). This may be particularly critical for fil-
ter feeders if these shifts coincide with the energy inten-
sive reproductive period.
The physiological analyses indicate very little effect of
pH, except for a potential interactive effect on shell
growth. The exclusive upregulation of antioxidants and
chaperones in the transcriptional profiles of animals in
low pH was thus interesting. These potentially indicate
increased energetic requirements, which are clearly suble-
thal. Given the physiological analyses, they may represent
cellular trade-offs, which would require long-term accli-
mation trials to determine whether they represent perma-
nent transcriptional changes or transitional acclimation
processes. Heat-shock proteins are prime candidates to
monitor environmental stress due to their high evolution-
ary sequence conservation and relative ease of cloning in
nonmodel species. However, these genes are not always
the most effective indicator of organism stress (Iwama
et al. 2004; Clark and Peck 2009b), as was indicated here
by the Q-PCR experiments (Fig. 3). Chapman et al.
(2011), in a microarray and neural network analysis of
oysters from different sites, did not find definitive envi-
ronmental biomarkers. They suggested that transcriptome
profiles relating exposure to specific variables were likely
context specific, only visible through a discovery-led
approach. The microarray study into heat stress in this
species also concluded that the response probably results
from a complex interaction of cell damage, opportunistic
infection, and metabolic exhaustion (Lang et al. 2009)
and cannot be described by analysis of one or two
biomarkers.
The lesser pH effect demonstrated here agrees with
Dickinson et al. (2012), where salinity was the most
important single stressor (out of salinity and pH) on
juvenile C. virginica over an 11-week experiment. Salinity
stress produced an increased energy consumption result-
ing in energetic deficiency, which the animals could not
compensate for. They also found an additive pH effect
and suggested that in salinity-stressed environments, pH
could change the likelihood of survival (Dickinson et al.
2012). Similarly, related studies on C. virginica examining
biocalcification showed that temperature and salinity
mitigated the effect of reduced biocalcification in lowered
pH (Waldbusser et al. 2011) and also that temperature
had a stronger effect than moderate hypercapnia (Matoo
et al. 2013). These agree with the results described here.
Matoo et al. (2013) also showed considerable mortality of
C. virginica at elevated temperatures regardless of expo-
sure to high-CO2 conditions. These data emphasize the
complexity of understanding a species’ response to envi-
ronmental perturbation, particularly in the face of multi-
ple stressors and also the challenge of extrapolating the
results of laboratory experiments to environmental condi-
tions (Waldbusser et al. 2011). However, laboratory
experiments can significantly help in the understanding of
the cellular mechanisms underlying the environmental
whole-animal responses. Many studies of pH effects on
marine organisms are still very short term (weeks rather
than months or years) and often concentrate on the larval
stage.
The 3 months here were not long term, but the expres-
sion profiles did not indicate an acute stress response (cf.
Meistertzheim et al. 2007; Matoo et al. 2013). In a study
of thermal stress in C. gigas, the Q-PCR time course of
17 genes showed a graduated response: a high and rapid
increase at 3–7 days, a decrease at 14 days, and a less
pronounced increase at 17–24 days, with protein synthesis
reduced after 24 days (Meistertzheim et al. 2007). Hence,
with our experimental timescale, we were clearly beyond
this immediate stress response and if this experiment was
greatly extended, then very different expression profiles
would likely be generated, more representative of a poten-
tially sustained acclimation response, which could impact
on future generations (Parker et al. 2012).
As oysters of the genus Crassostrea occur intertidally
and are adapted to variable environmental conditions
they could therefore be expected to thrive under future
climate change scenarios, especially, C. gigas which out-
competes other Crassostrea species in mixed populations
and is a coastal invasive (Bayne 2000; Soletchnik et al.
2002; Troost 2010), but clearly this may not be the case.
The recent publication of the oyster genome has shown
an increased number of “stress” genes in this species
(Zhang et al. 2012), which might be expected in a species
inhabiting environments where conditions can change
rapidly and acute short-term tolerance to environmental
challenge is essential for survival. What remains unknown
regarding future climate change scenarios is how irrevers-
ible changes in one environmental variable affects the
interplay and trade-offs between the other “stressors”
involved in the normal life history of this animal. Indeed,
the reported catastrophic summer mass mortality events
are not due to a single factor, but are the result of com-
plex interactions involving environmental parameters,
animal physiological condition, and pathogens (Huvet
et al. 2004; Li et al. 2007; Malham et al. 2009; Chaney
and Gracey 2011). The mean summer (June–August) SST
ª 2013 The Authors. Ecology and Evolution published by John Wiley & Sons Ltd. 3293
M. S. Clark et al. Oyster Stress
for this region is 21–22°C (Hadley Centre Sea Ice and
Sea Surface Temperature data, 01/06/1970 to present
[HadiSST]: [http://www.metoffice.gov.uk/hadobs/hadisst/
]). Several Hadley Centre coupled atmosphere–ocean cli-
mate models (medium greenhouse gas emission scenario,
Representative Concentration Pathway 4.5) were exam-
ined and all predicted SST for this region to rise between
0.1 and 0.2°C per decade. Hence, within 100 years, the
mean summer SST around Faro will likely reach 24°C.Therefore, we need to understand the physiological
responses of C. gigas and the energetic consequences of
cumulative thermal stress during increasingly prolonged
chronic intermittent exposure to such high temperatures
(Bevelhimer and Bennett 2000). This has consequences
not just for C. gigas population dynamics but also the
biodiversity of species inhabiting the complex intertidal
reef structures constructed by C. gigas.
Summary
These data represent one of the first transcriptional profil-
ing experiments using next-generation sequencing on an
invasive species, the Pacific oyster Crassostrea gigas, and
uniquely link these data to physiological analyses into
chronic environmental manipulation. Physiological analy-
ses showed that temperature had more impact on adult
oysters than pH. Whether this relationship holds for other
life-history stages has yet to be determined, but these data
show the importance of longer term experiments. Our
data show that longer term molecular responses cannot
be predicted from short-term acute studies and emphasize
the effectiveness of transcriptional profiling as a molecular
tool with the identification of novel pathways such as
PI3K/AKT/mTOR, which can be investigated further for
use in environmental monitoring studies. The advent of
cheap sequencing has produced a sea change in our abili-
ties to understand cellular responses in detail in environ-
mental models, given that many of these transcripts are
either poorly annotated or such data are absent; the next
great challenge will be deciphering the function and inter-
actions of the “unknown” genes.
Acknowledgments
This work was supported by an EU Research Infrastructure
Action under the FP7 “Capacities” Specific Programme,
ASSEMBLE grant agreement no. 227799, CCMAR Ref
00415/2010. We thank Lloyd Peck (BAS) for advice on
physiology and critical reading of the manuscript, Simon
Morley (BAS) for statistical analyses, John Turner (BAS)
for the Hadley Centre predictions, Elizabeth Harper
Cambridge University for damage repair analysis, and Ana
Grade (IPMA) who assisted with RNA extractions.
Author Contributions
D.M.P. and M.S.C. conceived the project; J.R. developed
and ran the culture system; A.A. performed the physio-
logical studies; other practical work including molecular
biology was carried out by F.V., F.M.B., M.S.C., and
D.M.P. M.A.S.T. performed the bioinformatic analyses.
M.S.C. analyzed the data. M.S.C., F.M.B., and D.M.P.
were the main authors with help from M.A.S.T., A.A.,
J.R., and F.V.
Conflict of Interests
None declared.
References
Almada-Villela, P. C., J. Davenport, and L. D. Gruffydd.
1982. The effects of temperature on the shell growth of
young Mytilus edulis-L. J. Exp. Mar. Biol. Ecol. 59:275–
288.
Altschul, S. F., T. L. Madden, A. A. Schaffer, J. H. Zhang,
Z. Zhang, W. Miller, et al. 1997. Gapped BLAST and
PSI-BLAST: a new generation of protein database search
programs. Nucleic Acids Res. 25:3389–3402.
Barros, P., P. Sobral, P. Range, L. Chicharo, and D. Matias.
2013. Effects of sea water acidification on fertilization and
larval development of the oyster Crassostrea gigas. J. Exp.
Mar. Biol. Ecol. 440:200–206.
Bayne, B. L. 2000. Relations between variable rates of growth,
metabolic costs and growth efficiencies in individual Sydney
rock oysters (Saccostrea commercialis). J. Exp. Mar. Biol.
Ecol. 251:185–203.
Bayne, B. L., and Newell, R. C. 1983. Physiological energetics
of marine molluscs. Pp. 407–515 in A. S. M. de Saleuddin
and K. M. Wilbur, eds. The mollusca, Vol. 4. Physiology.
Academic Press, New York.
Bayne, B. L., J. Widdows, and R. J. Thompson. 1976.
Physiological integrations. Pp. 261–292 in B. L. Bayne, ed.
Marine mussels: their ecology and physiology. Cambridge
Univ. Press, Cambridge, London, U.K.
Beniash, E., A. Ivanina, N. S. Lieb, I. Kurochkin, and I. M.
Sokolova. 2010. Elevated level of carbon dioxide affects
metabolism and shell formation in oysters Crassostrea
virginica. Mar. Ecol. Prog. Ser. 419:95–108.
Benjamini, Y., and Y. Hochberg. 1995. Controlling the flase
discovery rate – a practical and powerful approach to
multiple testing. J. R. Stat. Soc. Series B Methodol. 57:289–
300.
Benson, D. A., I. Karsch-Mizrachi, D. J. Lipman, J. Ostell, and
D. L. Wheeler. 2007. GenBank. Nucleic Acids Res. 35:D21–
D25.
Berthelin, C., K. Kellner, and M. Mathieu. 2000. Storage
metabolism in the Pacific oyster (Crassostrea gigas) in
3294 ª 2013 The Authors. Ecology and Evolution published by John Wiley & Sons Ltd.
Oyster Stress M. S. Clark et al.
relation to summer mortalities and reproductive cycle (West
Coast of France). Comp. Biochem. Physiol. Biochem. Mol.
Biol. 125:359–369.
Bevelhimer, M., and W. Bennett. 2000. Assessing cumulative
thermal stress in fish during chronic intermittent exposure
to high temperatures. Environ. Sci. Policy 3:211–216.
Bourles, Y., M. Alunno-Bruscia, S. Pouvreau, G. Tollu,
D. Leguay, C. Arnaud, et al. 2009. Modelling growth and
reproduction of the Pacific oyster Crassostrea gigas: advances
in the oyster-DEB model through application to a coastal
pond. J. Sea Res. 62:62–71.
Calabrese, A., and H. C. Davis. 1966. The pH tolerance of
embryos and larvae of Mercenaria mercenaria and
Crassostrea virginica. Biol. Bull. 131:427–436.
Chaney, M. L., and A. Y. Gracey. 2011. Mass mortality in
Pacific oysters is associated with a specific gene expression
signature. Mol. Ecol. 20:2942–2954.
Chapman, R. W., A. Mancia, M. Beal, A. Veloso, C. Rathburn,
A. Blair, et al. 2011. The transcriptomic responses of the
eastern oyster, Crassostrea virginica, to environmental
conditions. Mol. Ecol. 20:1431–1449.
Clark, M. S., and L. S. Peck. 2009a. Triggers of the HSP70
stress response: environmental responses and laboratory
manipulation in an Antarctic marine invertebrate (Nacella
concinna). Cell Stress Chaperones 14:649–660.
Clark, M. S., and L. S. Peck. 2009b. HSP70 heat shock
proteins and environmental stress in Antarctic marine
organisms: a mini-review. Mar. Genomics 2:11–18.
Clark, M. S., M. A. S. Thorne, F. A. Vieira, J. C. R. Cardoso,
D. M. Power, and L. S. Peck. 2010. Insights into shell
deposition in the Antarctic bivalve Laternula elliptica: gene
discovery in the mantle transcriptome using 454
pyrosequencing. BMC Genomics 11:362.
Clark, M. S., G. Husmann, M. A. S. Thorne, G. Burns,
M. Truebano, L. S. Peck, et al. 2013. Hypoxia impacts large
adults first: consequences in a warming world. Glob. Change
Biol. 19:2215–2263.
Davenport, J., and X. Chen. 1987. A comparison of methods
for the assessment of condition in the mussel (Mytilus
edulis). J. Mollus. Stud. 53:293–297.
De Stefani, D., A. Raffaello, E. Teardo, I. Szabo, and
R. Rizzuto. 2011. A forty-kilodalton protein of the inner
membrane is the mitochondrial calcium uniporter. Nature
476:336–340.
Dickinson, G. H., A. V. Ivanina, O. B. Matoo, H. O. P€ortner,
G. Lannig, C. Bock, et al. 2012. Interactive effects of salinity
and elevated CO2 levels on juvenile eastern oysters,
Crassostrea virginica. J. Exp. Biol. 215:29–43.
Dineshram, R., K. K. W. Wong, S. Xiao, Z. N. Yu, P. Y. Qian,
and V. Thiyagarajan. 2012. Analysis of Pacific oyster larval
proteome and its response to high CO2. Mar. Pollut. Bull.
64:2160–2167.
Dupuy, C., A. Vaquer, T. Lam-Hoai, C. Rougier, N. Mazouni,
J. Lautier, et al. 2000. Feeding rate of the oyster Crassostrea
gigas in a natural planktonic community of the
Mediterranean Thau Lagoon. Mar. Ecol. Prog. Ser. 205:171–
184.
Edwards, M., and A. J. Richardson. 2004. Impact of climate
change on marine pelagic phenology and trophic mismatch.
Nature 430:881–884.
Fleury, E., A. Huvet, C. Lelong, J. de Lorgeril, V. Boulo,
Y. Gueguen, et al. 2009. Generation and analysis of a 29,745
unique Expressed Sequence Tags from the Pacific oyster
(Crassostrea gigas) assembled into a publicly accessible
database: the GigasDatabase. BMC Genomics 10:341.
Gazeau, F., J. P. Gattuso, M. Greaves, H. Elderfield, J. Peene,
C. H. R. Heip, et al. 2011. Effect of carbonate chemistry
alteration on the early embryonic development of the pacific
oyster (Crassostrea gigas). PLoS ONE 6:e23010.
Ginger, K. W. K., C. B. S. Vera, R. Dineshram,
C. K. S. Dennis, L. J. Adela, Z. Yu, et al. 2013. Larval and
post-larval stages of Pacific oyster (Crassostrea gigas) are
resistant to elevated CO2. PLoS ONE 8:e64147.
Grizel, H., and M. Heral. 1991. Introduction into France of the
Japanese oyster (Crassostrea gigas). J. Conseil 47:399–403.
Gurevitch, J., and D. K. Padilla. 2004. Are invasive species a
major cause of extinctions? Trends Ecol. Evol. 19:470–474.
Gwinn, D. M., D. B. Shackelford, D. F. Egan, M. M.
Mihaylova, A. Mery, D. S. Vasquez, et al. 2008. AMPK
phosphorylation of raptor mediates a metabolic checkpoint.
Mol. Cell 30:214–226.
Hand, S. C., and I. Hardewig. 1996. Downregulation of
cellular metabolism during environmental stress. Annu. Rev.
Physiol. 58:539–563.
Hara, K., Y. Maruki, X. M. Long, K-I. Yoshino, N. Oshiro,
S. Hidayat, et al. 2002. Raptor, a binding partner of target
of rapamycin (TOR), mediates TOR action. Cell 110:177–
189.
Hardcastle, T. J., and K. A. Kelly. 2010. BaySeq: empirical
Bayesian methods for identifying differential expression in
sequence count data. BMC Bioinformatics 11:422.
Hawkins, A. J. S., P. N. Salkeld, B. L. Bayne, E. Gnaiger, and
D. M. Lowe. 1985. Feeding and resource allocation in the
mussel Mytilus edulis – evidence for time averaged
optimization. Mar. Ecol. Prog. Ser. 20:273–287.
Heinlein, C. A., H. J. Ting, S. Y. Yeh, and C. S. Chang. 1999.
Identification of ARA70 as a ligand-enhanced coactivator for
the peroxisome proliferator-activated receptor gamma. J.
Biol. Chem. 274:16147–16152.
Huvet, A., A. Herpin, L. Degremont, Y. Labreuche,
J. F. Samain, and C. Cunningham. 2004. The
identification of genes from the oyster Crassostrea gigas
that are differentially expressed in progeny exhibiting
opposed susceptibility to summer mortality. Gene
343:211–220.
Iwama, G. K., L. O. B. Afonso, A. Todgham, P. Ackerman,
and K. Nakano. 2004. Are hsps suitable for indicating
stressed states in fish? J. Exp. Biol. 207:15–19.
ª 2013 The Authors. Ecology and Evolution published by John Wiley & Sons Ltd. 3295
M. S. Clark et al. Oyster Stress
Jackson, D. J., C. McDougall, B. Woodcroft, P. Moase,
R. A. Rose, M. Kube, et al. 2010. Parallel evolution of nacre
building gene sets in molluscs. Mol. Biol. Evol. 27:591–608.
Kinoshita, S., N. Wang, H. Inoue, et al. 2011. Deep sequencing
of ESTs from nacreous and prismatic layer producing tissues
and a screen for novel shell formation-related genes in the
pearl oyster. PLoS ONE 6:e21238.
Kurihara, H., S. Kato, and A. Ishimatsu. 2007. Effects of
increased seawater pCO2 on early development of the oyster
Crassostrea gigas. Aquat. Biol. 1:91–98.
Lambert, C., J. Moal, G. Le Moullac, S. Pouvreau. 2008.
Mortality risks associated with physiological traits of oysters
during reproduction. Pp. 63–106 in J. F. Samain and
H. McCombie, eds. Summer mortality Pacific oyster
Crassostrea gigas: the morest project. Synth�eses. Editions
Quae, Versailles.
Lang, P. R., C. J. Bayne, M. D. Camara, C. Cunningham,
M. J. Jenny, and C. J. Langdon. 2009. Transcriptome
profiling of selectively bred oyster Crassostrea gigas that
differ in tolerance of heat shock. Mar. Biotechnol. 11:
650–668.
Lannig, G., S. Eilers, H. O. Portner, I. M. Sokolova, and C. Bock.
2010. Impact of Ocean acidification on energy metabolism of
oyster, Crassostrea gigas – changes in metabolic pathways and
thermal response. Mar. Drugs 8:2318–2339.
Li, Y., J. G. Qin, C. A. Abbott, X. X. Li, and K.
Benkendorff. 2007. Synergistic impacts of heat shock and
spawning on the physiology and immune health of
Crassostrea gigas: an explanation for summer mortality in
Pacific oysters. Am. J. Physiol. Regul. Integr. Comp.
Physiol. 293:R2353–R2362.
Li, H., J. Ruan, and R. Durbin. 2008. Mapping short DNA
sequencing reads and calling variants using mapping quality
scores. Genome Res. 18:1851–1858.
Loosanoff, V. L., and H. C. Davis. 1952. Temperature
requirements for maturation of gonads of northern oysters.
Biol. Bull. 103:80–96.
Malham, S. K., E. Cotter, S. O’Keeffe, S. Lynch, S. C. Culloty,
J. W. King, et al. 2009. Summer mortality of the Pacific
oyster, Crassostrea gigas, in the Irish Sea: the influence of
temperature and nutrients on health and survival.
Aquaculture 287:128–138.
Mao, Y. Z., Y. Zhou, H. S. Yang, and R. C. Wang. 2006.
Seasonal variation in metabolism of cultured Pacific oyster,
Crassostrea gigas, in Sanggou Bay, China. Aquaculture
253:322–333.
Martin-Gomez, L., A. Villalba, and E. Abollo. 2012.
Identification and expression of immune genes in the flat
oyster Ostrea edulis in response to bonamiosis. Gene
492:81–93.
Matoo, O. B., A. V. Ivanina, C. Ullstad, E. Beniash, and
I. M. Sokolova. 2013. Interactive effects of elevated
temperature and CO2 levels on metabolism and oxidative
stress in two common marine bivalves (Crassostrea virginica
and Mercenaria mercenaria). Comp. Biochem. Physiol. A
Mol. Integr. Physiol. 164:545–553.
Meistertzheim, A. L., A. Tanguy, D. Moraga, and
M. T. Thebault. 2007. Identification of differentially
expressed genes of the Pacific oyster Crassostrea gigas
exposed to prolonged thermal stress. FEBS J. 274:6392–6402.
Newton, A., and S. M. Mudge. 2003. Temperature and salinity
regimes in a shallow, mesotidal lagoon, the Ria Formosa,
Portugal. Estuar. Coast. Shelf Sci. 57:73–85.
Norkko, J., and S. F. Thrush. 2006. Ecophysiology in
environmental impact assessment: implications of spatial
differences in seasonal variability of bivalve condition. Mar.
Ecol. Prog. Ser. 326:175–186.
Parker, L. M., P. M. Ross, W. O’Connor, L. Borysko,
D. A. Raftos, and H.-O. P€ortner. 2012. Adult exposure
influences offspring response to ocean acidification in
oysters. Glob. Change Biol. 18:82–92.
Patrick, S., N. Faury, and P. Goulletquer. 2006. Seasonal
changes in carbohydrate metabolism and its relationship
with summer mortality of Pacific oyster Crassostrea gigas
(Thunberg) in Marennes-Ole’ron bay (France). Aquaculture
252:328–338.
Perdue, J. A., J. H. Beattie, and K. K. Chew. 1981. Some
relationship between gametogenic cycle and summer
mortality phenomenon in the Pacific oyster (Crassostrea
gigas) in Washington State. J. Shellfish Res. 1:9–16.
Segev, O., A. Samach, A. Faerman, H. Kalinski, M. Beirman,
A. Gelfand, et al. 2004. CMF608 – a novel mechanical
strain-induced bone-specific protein expressed in early
osteochondroprogenitor cells. Bone 34:246–260.
Soletchnik, P., A. Huvet, O. Le Moine, D. Razet, P. Geairon,
N. Faury, et al. 2002. A comparative field study of growth,
survival and reproduction of Crassostrea gigas, C. angulata
and their hybrids. Aquat. Living Resour. 15:243–250.
Solorzano, L. 1969. Determination of ammonia in natural
waters by the phenolhypochlorite method. Limnol.
Oceanogr. 14:799–801.
Somero, G. N. 2010. The physiology of climate change: how
potentials for acclimatization and genetic adaptation will
determine ‘winners’ and ‘losers’. J. Exp. Biol. 213:912–920.
Sommer, U., and K. Lengfellner. 2008. Climate change and the
timing, magnitude, and composition of the phytoplankton
spring bloom. Glob. Change Biol. 14:1199–1208.
Sussarellu, R., C. Fabioux, G. Le Moullac, E. Fleury, and
D. Moraga. 2010. Transcriptomic response of the Pacific
oyster Crassostrea gigas to hypoxia. Mar. Genomics 3:133–143.
Tomanek, L., M. J. Zuzow, A. V. Ivanina, E. Beniash, and I.
M. Sokolova. 2011. Proteomic response to elevated P-CO2
level in eastern oysters, Crassostrea virginica: evidence for
oxidative stress. J. Exp. Biol. 214:1836–1844.
Troost, K. 2010. Causes and effects of a highly successful
marine invasion: case-study of the introduced Pacific oyster
Crassostrea gigas in continental NW European estuaries. J.
Sea Res. 64:145–165.
3296 ª 2013 The Authors. Ecology and Evolution published by John Wiley & Sons Ltd.
Oyster Stress M. S. Clark et al.
Truebano, M., G. Burns, M. A. S. Thorne, G. Hillyard, L. S.
Peck, D. O. F. Skibinski, et al. 2010. Transcriptional
response to heat stress in the Antarctic bivalve Latemula
elliptica. J. Exp. Mar. Biol. Ecol. 391:65–72.
Vilela, H. 1975. A respeito de Ostras. Biologia – explorac�~ao –
salubridade, Vol. 1. Notas e estudos da secretaria de estado
das pescas, Lisboa. Pp. 220. (In Portuguese).
Waldbusser, G. G., E. P. Voigt, H. Bergschneider,
M. A. Green, and R. I. E. Newell. 2011. Biocalcification in the
Eastern Oyster (Crassostrea virginica) in relation to long-term
trends in Chesapeake Bay pH. Estuaries Coasts 34:221–231.
Widdows, J. 1985. Physiological procedures. Pp 161–178 in J.
Bayne, ed. The effects of stress and pollution on marine
animals. Praeger, NY and Eastbourne.
Wrange, A. L., J. Valero, L. S. Harkestad, O. Strand,
S. Lindegarth, H. T. Christensen, et al. 2010. Massive
settlements of the Pacific oyster, Crassostrea gigas, in
Scandinavia. Biol. Invasions 12:1453–1458.
Xu, T., J. S. Xie, J. M. Li, M. Luo, S. G. Ye, and X. Z. Wu.
2012. Identification of expressed genes in cDNA library of
hemocytes from the RLO-challenged oyster, Crassostrea
ariakensis Gould with special functional implication of three
complement-related fragments (CaC1q1, CaC1q2 and
CaC3). Fish Shellfish Immunol. 32:1106–1116.
Yaroslavtseva, L. M., E. P. Sergeeva, and S. D. Kashenko. 1990.
Euryhalinity changes in ontogeny of the oyster Crassostrea
gigas. Mar. Biol. 6:36–42.
Zerebecki, R. A., and C. J. B. Sorte. 2011. Temperature
tolerance and stress proteins as mechanisms of invasive
species success. PLoS ONE 6:e14806.
Zhang, G. F., X. D. Fang, X. M. Guo, L. Li, R. Luo, F. Xu,
et al. 2012. The oyster genome reveals stress adaptation and
complexity of shell formation. Nature 490:49–54.
Zhou, J., W. N. Wang, G. Z. Ma, A.-L. Wang, W.-Y. He, P. Wang,
et al. 2008. Gene expression of ferritin in tissue of the Pacific
white shrimp, Litopenaeus vannamei after exposure to pH stress.
Aquaculture 275:356–360.
Supporting Information
Additional Supporting Information may be found in the
online version of this article:
Table S1. Primers used for Q-PCR of candidate genes,
including the Accession number from which the primers
were designed, putative function of the gene, R2 and effi-
ciency of the primers.
Table S2. Contigs generated in this project from public
EST data and used for the SOLiD mapping.
Table S3. Annotation of contigs using Blast sequence
similarity searching, comparing those transcripts up-regu-
lated in animals cultured at 19 and 24°C under ambient
pH conditions.
Table S4. Annotation of contigs using Blast sequence
similarity searching, comparing those transcripts up-regu-
lated in animals cultured at 19 and 24°C under low pH
conditions.
Table S5. Annotation of contigs using Blast sequence
similarity searching, comparing those transcripts up-regu-
lated in animals cultured at 24°C under ambient pH and
24°C under low pH conditions.
Table S6. Annotation of contigs using Blast sequence
similarity searching, comparing those transcripts up-regu-
lated in animals cultured at 19°C under ambient pH and
19°C under low pH conditions.
ª 2013 The Authors. Ecology and Evolution published by John Wiley & Sons Ltd. 3297
M. S. Clark et al. Oyster Stress