Embed Size (px)
Citation preview
MOLECULAR SIGNATURE OF PHYSIOLOGICAL STRESS IN DOLPHINSBASED ON PROTEIN EXPRESSION PROFILING OF SKIN
Sarka Southern, Anne Allen and Nick Kellar
Southwest Fisheries Science CenterNational Marine Fisheries Service, NOAA
8604 La Jolla Shores Drive,La Jolla, California 92037
JUNE 2002
ADMINISTRATIVE REPORT LJ-02-27
2
ABSTRACT
Global climate change and the growing impact of human activities havecontributed to an increase in environmental stress in most ecosystems1. Theconsequences for wildlife may be profound, but remain poorly understood. A majorproblem is that any impact is only noticed when a population suffers rapid decline, bywhich time it may be too late to implement conservation strategies2. Here we describe anew technique for detecting a molecular signature of physiological stress, based on theexpression profiles of 40 proteins known to be associated with stress. Profiles wereobtained for 93 reference individuals with known health status, representing 8 species ofmammal and a wide range of stressors. Diagnostic stress-associated changes could bereadily identified using antibody staining of the skin. Using high throughput profiling wethen surveyed cellular stress in 868 wild spotted dolphins sampled from a naturalpopulation potentially stressed by commercial tuna fishing operations3. The protein panelidentified in this study provides a new tool for defining the proteomics of physiologicalstress responses. The integration of high throughput profiling linked to ecological dataprovides an effective approach to assess physiological stress in free living wildpopulations, and has further applications in medicine.
INTRODUCTION
Dolphins and whales encounter diverse forms of environmental andanthropogenic stress including climate variability, biotoxins, infectious diseases, habitatalteration, industrial pollution, and incidental entrapment in fishing gear. Some cetaceanpopulations, including the gray whales and the North Atlantic right whales, have beendeclining due to unexplained wasting conditions and low reproduction rates4,5. Spotteddolphins in the eastern tropical Pacific have been extensively chased and captured duringcommercial tuna fishing operations,3 and it is necessary to determine whether theinvolvement caused physiological stress, and triggered incipient changes in the healthand reproduction fitness of the population.
In cetaceans, monitoring population size cannot provide early warnings ofincreased stress impact because of the long generation times2. Thus, new tools are neededto help guide proactive conservation and inform management strategies. Furthermore, thetest tissue must be readily and non-invasively sampled. The only practical choice is theskin, which can be repeatedly collected by projectile biopsy, and for which large archivesalready exist.
Is there a generic molecular change that could indicate exposure to stress? Studiesin a variety of organisms suggest that the common physiological outcome of differenttypes of stress is perturbation of the physiological homeostasis, manifested as systemiccellular stress, and the counter-acting molecular stress response6-13. Cellular stress ischaracterized by physical and chemical perturbations in the cellular microenvironmentincluding ionic, pH and redox changes, and heat dissipation. Following a localized stressimpact such as a closed head injury, cellular stress spreads rapidly to distant tissues
2
including skin14. Skin produces and responds to several homeostatic processes thatprovide stress defense, including oxidative stress repair, cellular detoxification, control ofcell growth and cell death, cell adhesion, immunological signaling and neuroendocrineregulation. During continual stress such as disease, cellular stress persists in the wholeorganism11-13. Stress response is necessary but when prolonged it overburdens theorganism, and instead of restoring health it can contribute to disease pathogenesis, impairreproduction and accelerate aging11-21.
An independent scientific peer review of this work was administered by theCenter for Independent Experts located at the University of Miami. Responses toreviewer’s comments can be found in the Appendix.
METHODS
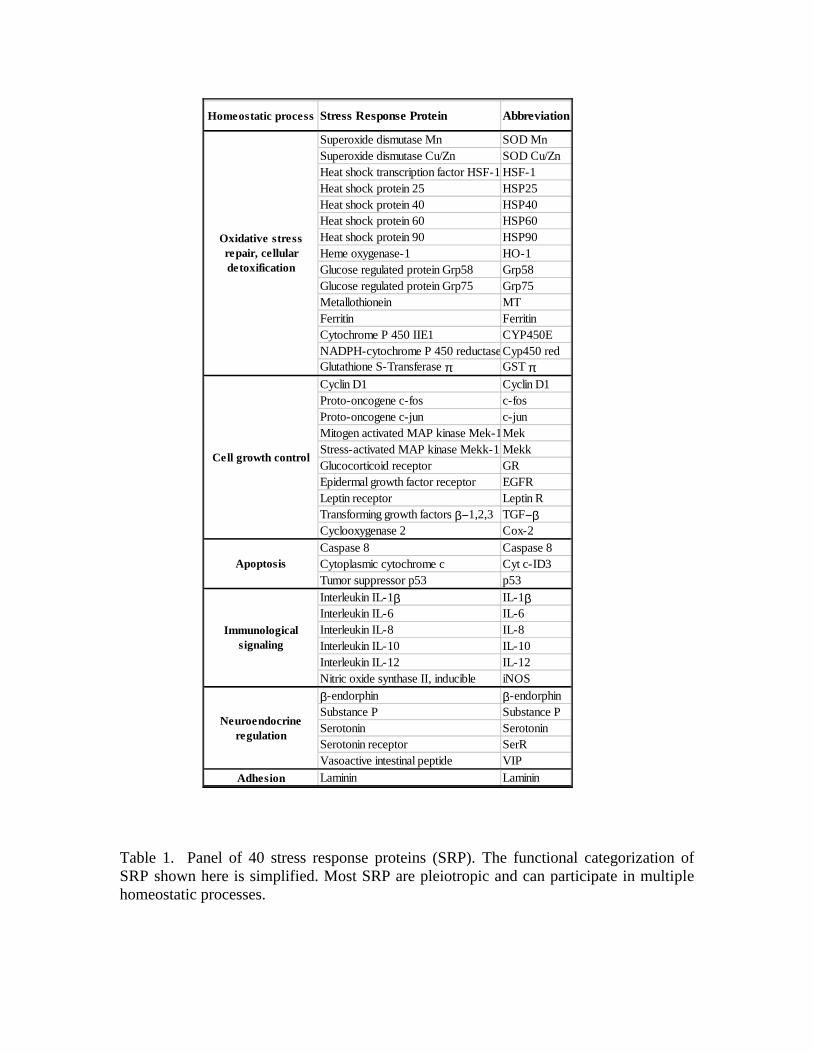
Stress response proteins (SRP) A panel of 40 stress response proteins (SRP, Table 1) was identified based on
several conceptual and experimental criteria: (1) Documented function in mammaliancellular stress/molecular stress response pathways during prolonged stress. (2)Documented expression in human keratinocytes. (3) Detectable in the formalin-fixedcetacean skin using a commercial antibody. (4) Baseline expression localized to theepidermis. (5) A stress-associated increase, rather than a decrease, in the expression levelwithin the epidermis.
Proteins were chosen as the most suitable proxy molecules to detect cellular stressin the skin for several reasons. (1) Proteins, unlike RNA messages, are directly involvedin the stress response pathways. (2) Proteins are better preserved in the chemically fixedskin (the majority of our specimens) than mRNA. (3) Protein expression is less likely tobe altered by post-mortem events than other molecules used for detecting stress, such aslipids or mRNA.
Reference specimens
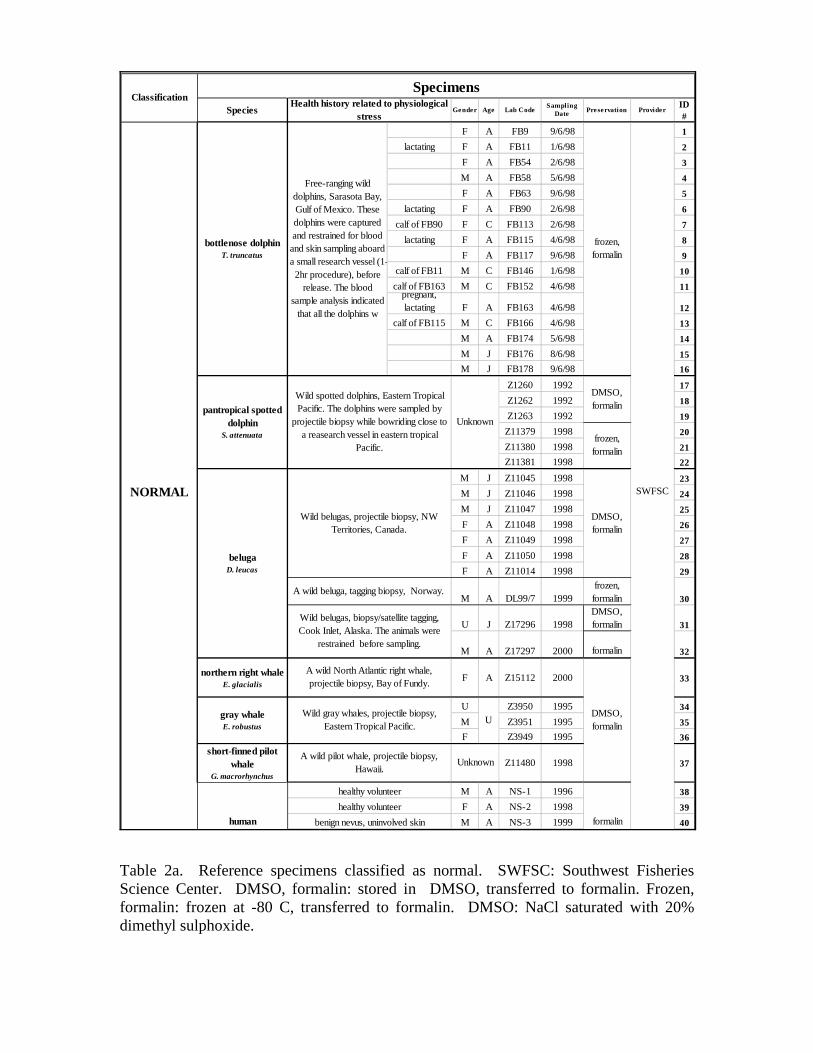
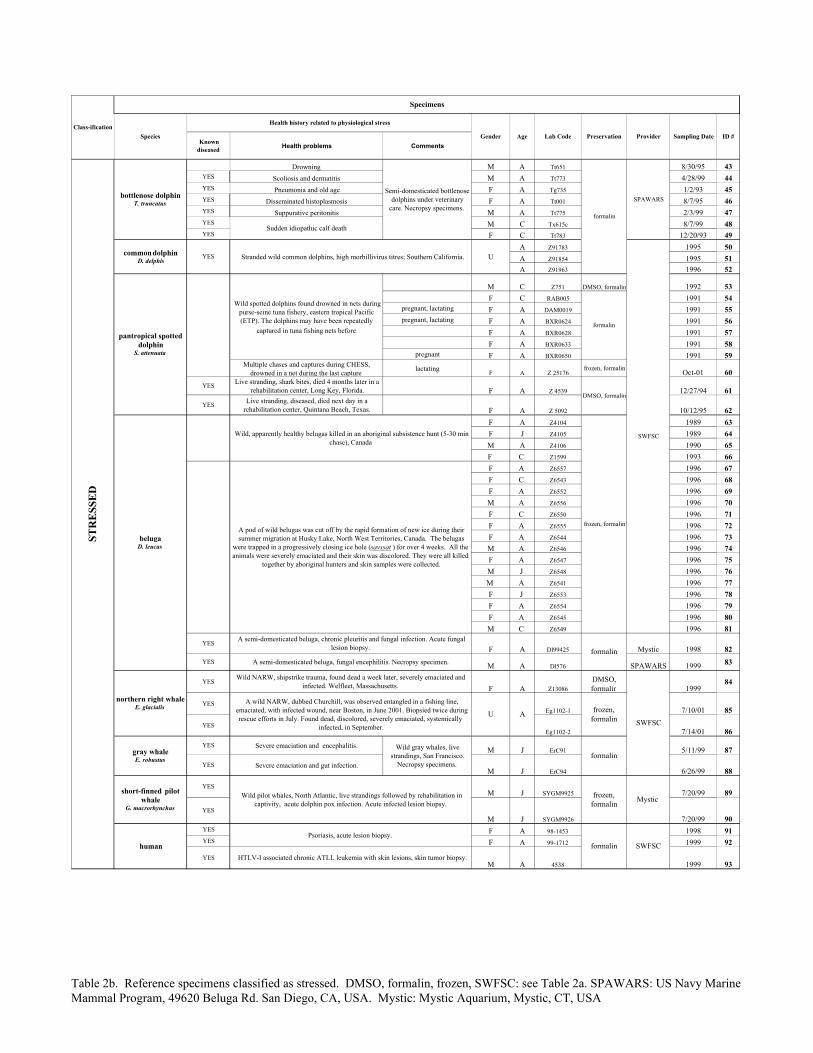
Reference specimens from individuals with known, contrasting differences incellular stress were necessary to characterize the SRP expression in the cetacean skin,and to assess the performance of the SRP panel as a stress marker. Based on a review ofmedical literature we assumed that live, apparently healthy individuals had nominallynormal levels of cellular stress, and that individuals with clinical diseases, or individualsthat were severely physiologically distressed, had abnormal levels of cellular stress. Adetailed description of 42 individuals classified as normal, and 51 individuals classifiedas stressed, is in Table 2. To focus on general differences between the normal andstressed groups, the reference specimens were from 7 cetacean species and from humans,and represented a variety of physiological and pathological conditions, both genders, anddifferent ages.
3
The reference individuals classified as normal may have experienced some acutestress due to sampling. Potential contribution of sampling stress would have beeneliminated from the comparative expression analysis during determination of the relativeexpression levels (see below).
The cetacean specimens were obtained by opportunistic sampling and therefore,in most cases, the precise skin sampling locations were not known, and were supposed torepresent random sites on the dorsum and the head. The original skin samples werepreserved in several different ways (Table 2). To assure consistent immunohistochemicalreactivity with the selected panel of anti-SRP antibodies (see below), sub-specimens(typically, 5x5x5-10mm) were placed into 10% normal buffered formalin for at least 24hours before embedding in the paraffin blocks.
Multi-specimen slides
Formalin-fixed skin specimens were used to prepare multi-specimen histologicalslides. The concept of multi-tissue slides was developed in our laboratory to allowsimultaneous immunohistochemical staining of a large number of specimens, and thusprovide the basis for quantitative comparisons among specimens. Furthermore, the use ofmulti-specimen slides substantially decreased the cost of the histological processing andthe immunohistochemical staining.
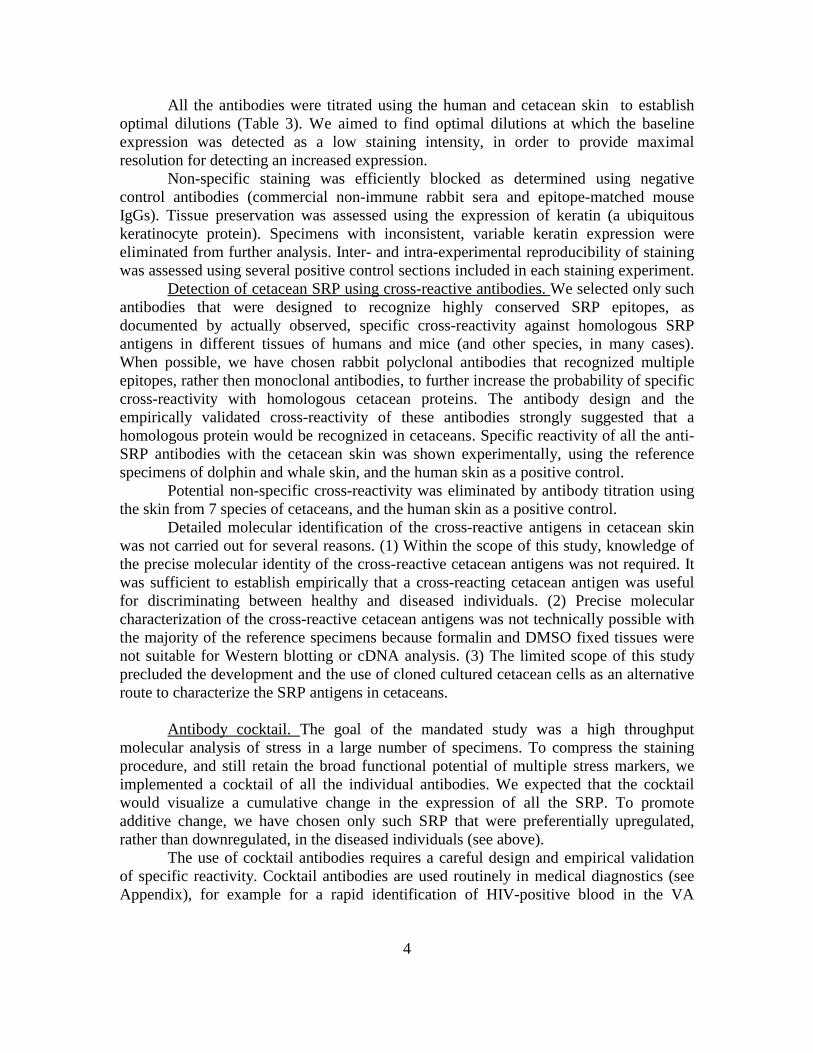
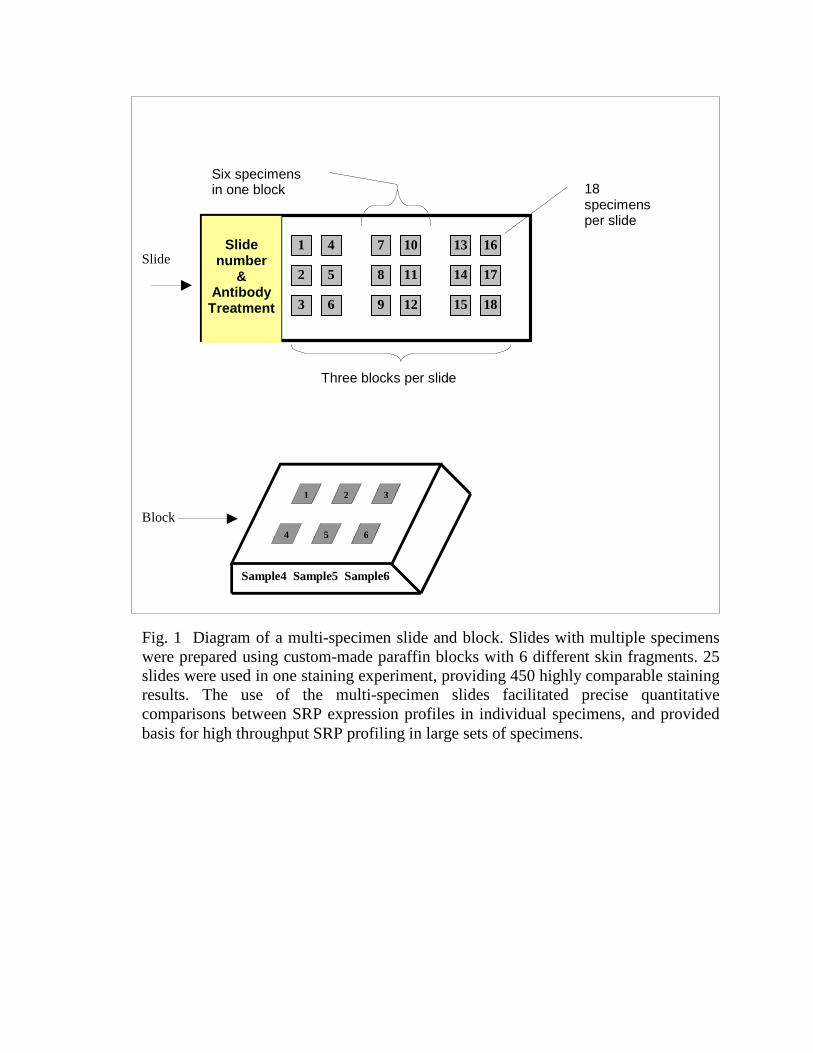
The multi-specimen slides were produced in the Histology Laboratory, UCSDMedical Center, San Diego, using our instructions (Fig. 1). Six different skin fragmentswere embedded in one paraffin block. Thin sections (5 microns) from 3 blocks wereplaced on one slide (18 specimens). Positive-charged slides were used to facilitateadhesion of the tissue sections. The multi-specimen slides were stained as described inthe standard immunohistochemical staining procedure (see below), using 0.5ml of eachimmunohistochemical reagent per slide. Up to 25 slides were processed simultaneouslyin one staining experiment, providing 450 highly comparable staining results.
Immunohistochemistry
Antibodies. An overview of the primary antibodies to individual SRP antigens isin Table 3. All the antibodies were commercially available, well characterized reagentsexcept for the 1D3 antibody against extra-mitochondrial cytochrome c that wasdeveloped and provided as a gift by Dr. R. Jemmerson, Department of Microbiology,University of Minnesota, Minneapolis.
We chose only such anti-SRP antibodies that were robust and compatible, inorder to assure that a simple immunohistochemical staining procedure would begenerally applicable to all the SRP antigens. The anti-SRP antibodies were chosen basedon following criteria: (1) Mouse or rabbit IgGs. (2) Identical reaction conditions. (3)Non-specific binding blocked by pre-incubation in 7% goat serum. (4) Documentedreactivity with formalin-fixed, paraffin-embedded antigens. (5) Antigen retrieval requiredor harmless. (6) Documented cross-reactivity with several mammalian species includinghuman and mouse.
4
All the antibodies were titrated using the human and cetacean skin to establishoptimal dilutions (Table 3). We aimed to find optimal dilutions at which the baselineexpression was detected as a low staining intensity, in order to provide maximalresolution for detecting an increased expression.
Non-specific staining was efficiently blocked as determined using negativecontrol antibodies (commercial non-immune rabbit sera and epitope-matched mouseIgGs). Tissue preservation was assessed using the expression of keratin (a ubiquitouskeratinocyte protein). Specimens with inconsistent, variable keratin expression wereeliminated from further analysis. Inter- and intra-experimental reproducibility of stainingwas assessed using several positive control sections included in each staining experiment.
Detection of cetacean SRP using cross-reactive antibodies. We selected only suchantibodies that were designed to recognize highly conserved SRP epitopes, asdocumented by actually observed, specific cross-reactivity against homologous SRPantigens in different tissues of humans and mice (and other species, in many cases).When possible, we have chosen rabbit polyclonal antibodies that recognized multipleepitopes, rather then monoclonal antibodies, to further increase the probability of specificcross-reactivity with homologous cetacean proteins. The antibody design and theempirically validated cross-reactivity of these antibodies strongly suggested that ahomologous protein would be recognized in cetaceans. Specific reactivity of all the anti-SRP antibodies with the cetacean skin was shown experimentally, using the referencespecimens of dolphin and whale skin, and the human skin as a positive control.
Potential non-specific cross-reactivity was eliminated by antibody titration usingthe skin from 7 species of cetaceans, and the human skin as a positive control.
Detailed molecular identification of the cross-reactive antigens in cetacean skinwas not carried out for several reasons. (1) Within the scope of this study, knowledge ofthe precise molecular identity of the cross-reactive cetacean antigens was not required. Itwas sufficient to establish empirically that a cross-reacting cetacean antigen was usefulfor discriminating between healthy and diseased individuals. (2) Precise molecularcharacterization of the cross-reactive cetacean antigens was not technically possible withthe majority of the reference specimens because formalin and DMSO fixed tissues werenot suitable for Western blotting or cDNA analysis. (3) The limited scope of this studyprecluded the development and the use of cloned cultured cetacean cells as an alternativeroute to characterize the SRP antigens in cetaceans.
Antibody cocktail. The goal of the mandated study was a high throughputmolecular analysis of stress in a large number of specimens. To compress the stainingprocedure, and still retain the broad functional potential of multiple stress markers, weimplemented a cocktail of all the individual antibodies. We expected that the cocktailwould visualize a cumulative change in the expression of all the SRP. To promoteadditive change, we have chosen only such SRP that were preferentially upregulated,rather than downregulated, in the diseased individuals (see above).
The use of cocktail antibodies requires a careful design and empirical validationof specific reactivity. Cocktail antibodies are used routinely in medical diagnostics (seeAppendix), for example for a rapid identification of HIV-positive blood in the VA
5
Hospital in San Diego (Abbott Diagnostics HIV-1, 2 kit). Based on the experience fromour previous studies23, only highly compatible primary antibodies (see below) were usedto design SRP cocktails. The optimal dilutions of antibodies in the cocktail wereestablished empirically, starting with the optimized concentrations of the individualantibodies.
At first we designed a universal cocktail, applicable to all reference specimens.The universal cocktail contained all anti-SRP antibodies at concentrations that were 40-fold lower concentrations than the optimized single antibody concentrations (Table 3).This cocktail was used to analyze the reference specimens.
For high throughput profiling of spotted dolphins we designed a new, spotteddolphin specific cocktail (Table 3). Twelve versions of the spotted dolphin cocktail weretested by staining all the available 868 spotted dolphin specimens (see below), to identifyantibody concentrations that provided optimal visual display of the broad range of SRPexpression levels in that large specimen group.
Staining procedure. The immunohistochemical staining was performed in ourlaboratory, as described previously22. Briefly, slides were de-waxed using 3 changes ofxylene, 3 changes of absolute ethanol, 3 changes of graded ethanol (95-80-60%), andtransferred to water. After antigen retrieval (full boil for 10 minutes in 10mM sodiumcitrate buffer), primary antibodies were applied at 4°C (all the anti-SRP antibodies), or ata room temperature (the anti-cytokeratin antibody), for 16 hours. The primary antibodieswere detected by consecutive application of several reagents. (1) Biotinylated antibody(concentrated mouse or rabbit links, 1:20 dilution, 1 hour, a room temperature, or a 1:1mixture of mouse and rabbit links at 1:20 dilutions for cocktail antibody detection;BioGenex, San Ramon, CA, USA). (2) Alkaline phosphatase-conjugated streptavidin(concentrated AP label, 1:15 dilution, 30 minutes, a room temperature, BioGenex). (3)Fuchsin chromogen (5 minutes color development, Dako, Carpinteria, CA, USA). (4)Mayer's hematoxylin (1 minute, BioGenex). The red signal produced by Fuchsin wasvisualized using a light microscope connected to a computerized image analysis system(see below).
Quantitative analysis of SRP expression using computerized image analysis (CIA)
We could measure and compare SRP expression levels in different specimensbecause the SRP expression levels were visualized under approximately identicalconditions (identical immunohistochemical reagents and procedure, simultaneousprocessing using the multi-specimen slides).
SRP expression levels (EL) were quantified based on the immunohistochemicalstaining intensity, which was determined using an improved CIA technique. The stainingintensity value was computed as the product of the mean optical density of the stainedcells (MOD), and the percentage of the stained area (PA). MOD and PA were determinedusing a new procedure developed in our laboratory (see Color File and Outlining Filebelow). A semi-automated method for computing EL was based on a new softwareprogram developed in our laboratory (Visual Basic). Three microscopic images captured
6
at 100x magnification (see Image capture below) were used for each specimen, toprovide a mean EL value.
The CIA-based quantification was generally applicable to all the SRP proteinsregardless of their individual sub-cellular distributions within keratinocytes because theEL value was computed based on the summary distribution within the entire epidermis.The epidermis was the common site where all the SRP proteins were expressed becausewhen designing the SRP panel, we only chose such proteins that were predominantlyexpressed in the epidermis.
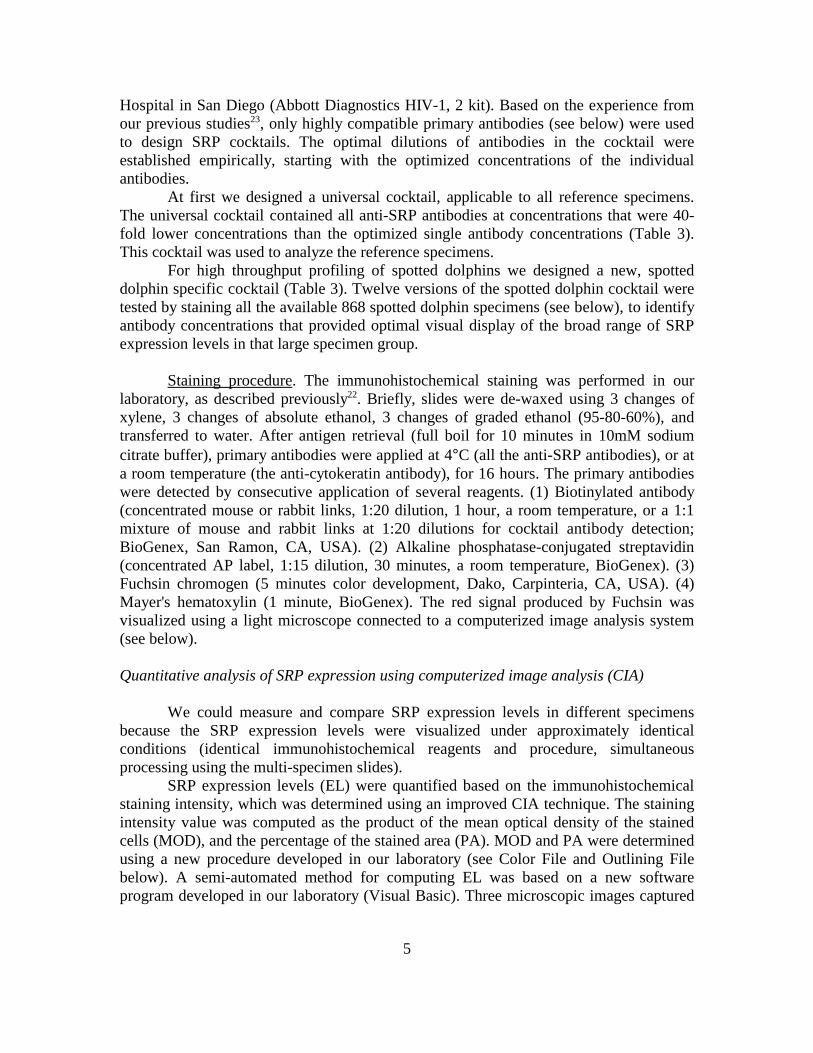
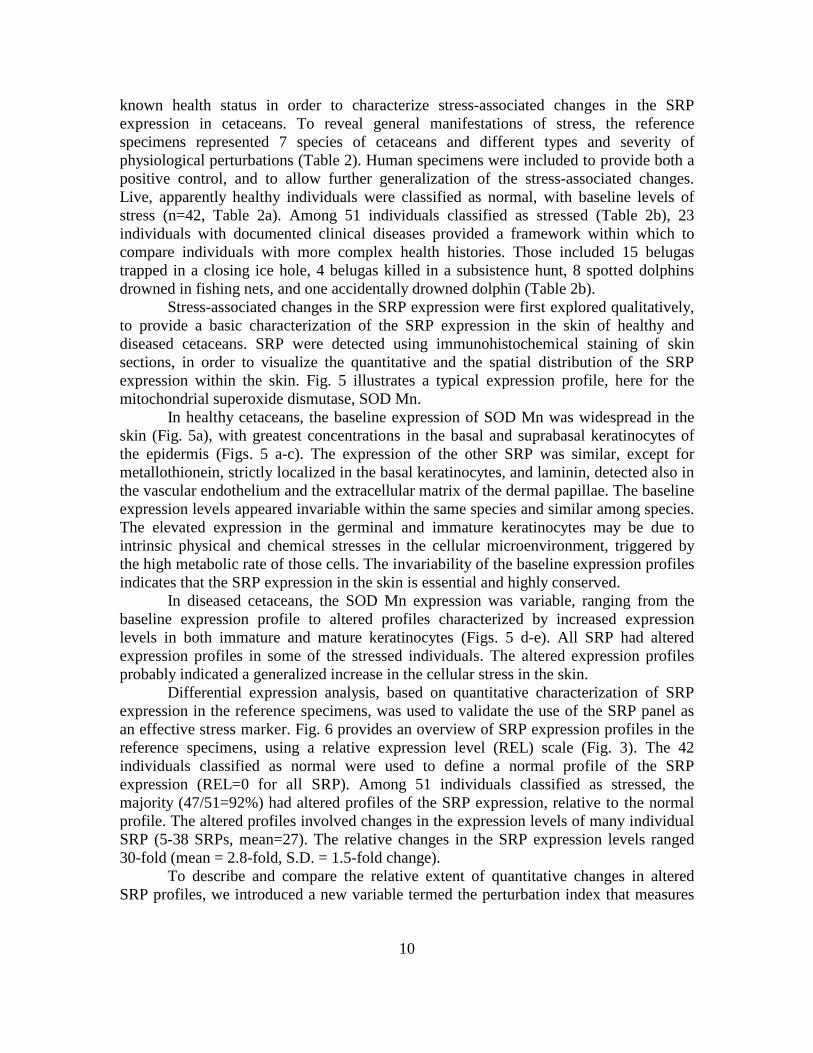
Color File. MOD selection was performed based on the RGB color cube modelthat describes the color spectrum as a cube of intensity along red, green, and blue axes.Each separate value in the color cube model can be selected independently, which allowsvery different colors in an image to be included in the same color class. This model isespecially appropriate for use with images that are difficult to segment. Using theeyedropper tool, varying intensities of red signal (all SRP antigens were visualized as ared pigment) were selected empirically from representative specimens and saved in acolor file. That color file was then applied to all images, ensuring that the same range ofred signal was analyzed each time. Application of the color file is illustrated in Fig. 2.
Outlining File. Precise PA selection was performed using the free-form outliningtool. The outlining tool enabled us to precisely select the area of image in which stainingneeded to be quantified (the epidermis, in this study), and allowed the exclusion ofartifacts such as tissue tears, folds, and non-specific staining, thus increasing the accuracyand precision of signal quantification. The outlining file for each image was saved andarchived. Application of the outlining tool is illustrated in Fig. 2.
Image Capture. All images were captured using the same microscope and camerasettings. The condenser, aperture, field iris diaphragm, and exposure time remainedconstant. All images were taken at 100x magnification, and an LBD color-balancing filterwas used to even out the background and any hotspots present in the lens. A light-presetbutton, which sets the light intensity at a pre-selected level regardless of the position ofthe voltage lever, was engaged for all images captured, and images were taken during thesame time of day to control for changes in ambient light. Three images representingabout 20-30% of the entire skin section were captured. All images were saved as 48-bitcolor 8 MB tiff files, and archived.
CIA system description. Gateway E-4200 computer and VX900 monitor, with thedisplay set to 32-bit True Color. Images were taken with the DVC digital camera 1310C,which is an RGB color high-resolution 10-bit digital camera outputting 1300(h) x1030(v). The camera was mounted on an Olympus System Light Microscope ModelBX50, and was linked to the computer via a pixeLYNX image processor board(Scientific Instrument Company, Sunnyvale, CA). The analysis software package usedwas the commercially available Image-Pro Plus version 4.1 for Windows 95/98/NT 4.0(Media Cybernetics, Silver Spring, MD).
7
SRP profiling of reference specimens
The reference specimens were stained using the same immunohistochemicalconditions. Some specimens were stained repeatedly, to assess staining and scoringreproducibility. Each staining experiment involved internal negative and positive controlsto monitor for staining specificity (non-immune rabbit sera, control rabbit antisera,isotype-matched control mouse antibodies), efficiency (serial SOD Mn antibody dilutionsapplied to sections from the same positive specimen), and tissue preservation(cytokeratin).
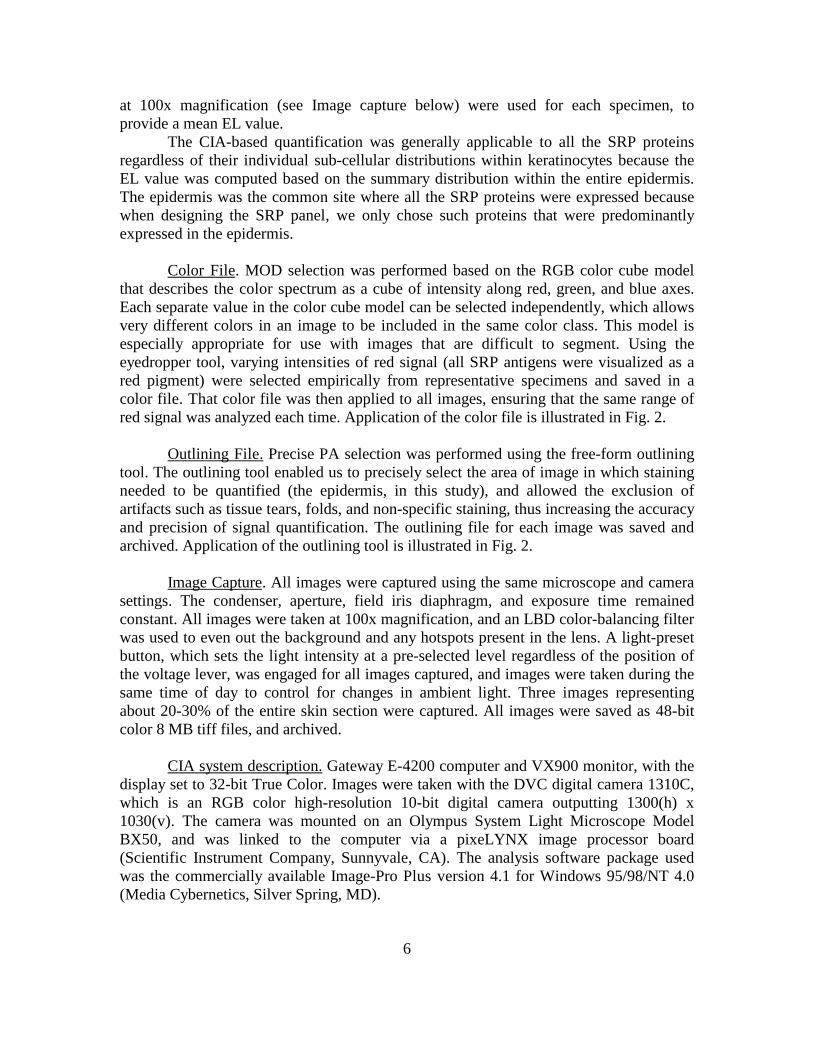
Classification of SRP expression profiles. SRP expression profiles in thereference specimens were classified based on changes in the SRP staining intensityrelative to the average staining intensity in the reference normal specimens (the baselineexpression level). Changes in the staining intensity were evaluated using a CIA-basedscale (Fig. 3). We found that the normal specimens had very similar expression levels(<2-fold differences) of SRP. In the stressed specimens, the staining intensity rangedfrom 3-fold decreased to 30-fold increased, relative to the normal pool. Only 3-foldchanges in the staining intensity, relative to the normal pool, were considered significant.The resulting staining intensity scores were -3, 0, 3, 9 and 27.
For most applications, such as statistical analysis of expression profile variability,ratio measurements are most naturally processed in a log space24. Therefore, wecomputed a relative expression level (REL) score, as a log 3 transformed value of thestaining intensity score. Base 3 was chosen because 3-fold differences in the stainingintensity were considered significant. The resulting REL scores, corresponding to thestaining intensity scores, were -1, 0, 1, 2 and 3 (Fig. 3).
Each skin specimen was assigned a SRP expression profile composed of 40 RELvalues corresponding to the individual SRP. In addition, each SRP was assigned anexpression profile composed of 93 values corresponding to the individual specimens.
Perturbation index (PI). A new variable was defined to evaluate the quantitativevariability in SRP expression profiles. PI values were defined to range from 0% (anormal SRP profile) to 100% (the maximal observable change in a SRP profile, if allREL = 3, not detected in this study). PI was a percentage ratio of the sum of the absolutevalues of the actual RELs, and the sum of maximal expected RELs (if all REL=3).
To assess the variability across the SRP, PIa was computed for each specimen.Example: For the specimen ID#43, PIa = (5x1)+(35x0)/40x3=5/120=4%. To assess thevariability across the specimens, PIb was computed for each SRP. Example: For SODMn, PIb = 72/141=51%.
High throughput SRP profiling of spotted dolphins
8
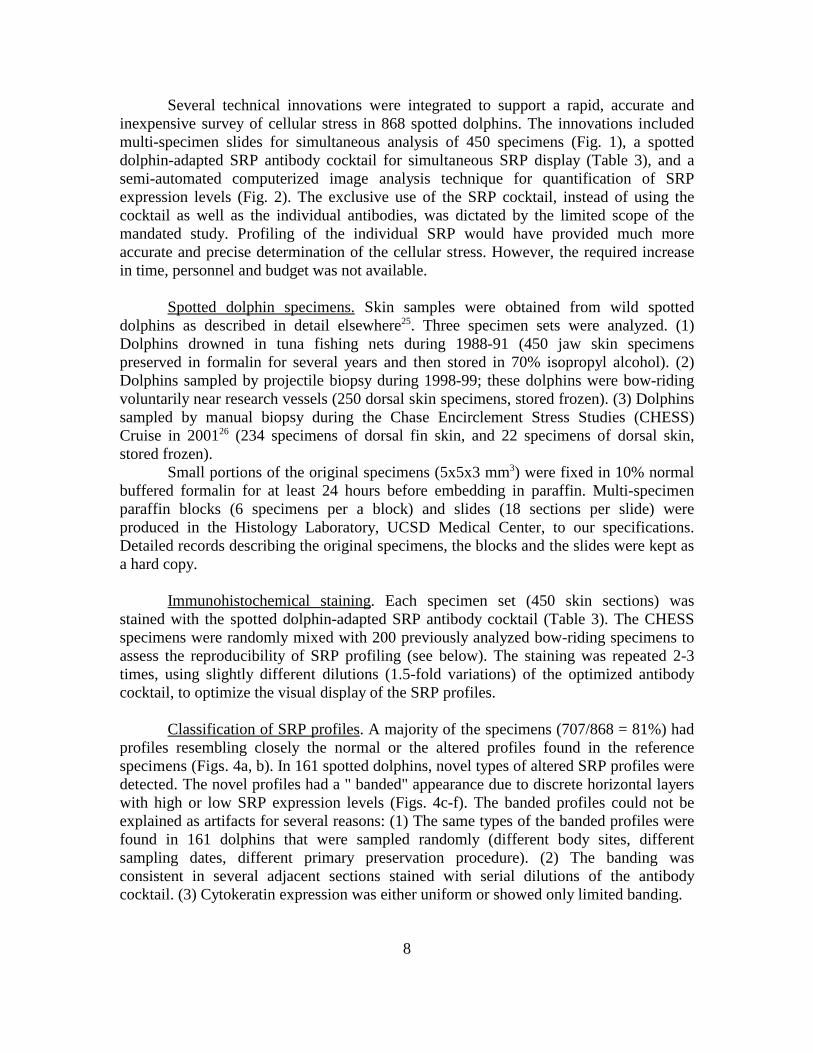
Several technical innovations were integrated to support a rapid, accurate andinexpensive survey of cellular stress in 868 spotted dolphins. The innovations includedmulti-specimen slides for simultaneous analysis of 450 specimens (Fig. 1), a spotteddolphin-adapted SRP antibody cocktail for simultaneous SRP display (Table 3), and asemi-automated computerized image analysis technique for quantification of SRPexpression levels (Fig. 2). The exclusive use of the SRP cocktail, instead of using thecocktail as well as the individual antibodies, was dictated by the limited scope of themandated study. Profiling of the individual SRP would have provided much moreaccurate and precise determination of the cellular stress. However, the required increasein time, personnel and budget was not available.
Spotted dolphin specimens. Skin samples were obtained from wild spotteddolphins as described in detail elsewhere25. Three specimen sets were analyzed. (1)Dolphins drowned in tuna fishing nets during 1988-91 (450 jaw skin specimenspreserved in formalin for several years and then stored in 70% isopropyl alcohol). (2)Dolphins sampled by projectile biopsy during 1998-99; these dolphins were bow-ridingvoluntarily near research vessels (250 dorsal skin specimens, stored frozen). (3) Dolphinssampled by manual biopsy during the Chase Encirclement Stress Studies (CHESS)Cruise in 200126 (234 specimens of dorsal fin skin, and 22 specimens of dorsal skin,stored frozen).
Small portions of the original specimens (5x5x3 mm3) were fixed in 10% normalbuffered formalin for at least 24 hours before embedding in paraffin. Multi-specimenparaffin blocks (6 specimens per a block) and slides (18 sections per slide) wereproduced in the Histology Laboratory, UCSD Medical Center, to our specifications.Detailed records describing the original specimens, the blocks and the slides were kept asa hard copy.
Immunohistochemical staining. Each specimen set (450 skin sections) wasstained with the spotted dolphin-adapted SRP antibody cocktail (Table 3). The CHESSspecimens were randomly mixed with 200 previously analyzed bow-riding specimens toassess the reproducibility of SRP profiling (see below). The staining was repeated 2-3times, using slightly different dilutions (1.5-fold variations) of the optimized antibodycocktail, to optimize the visual display of the SRP profiles.
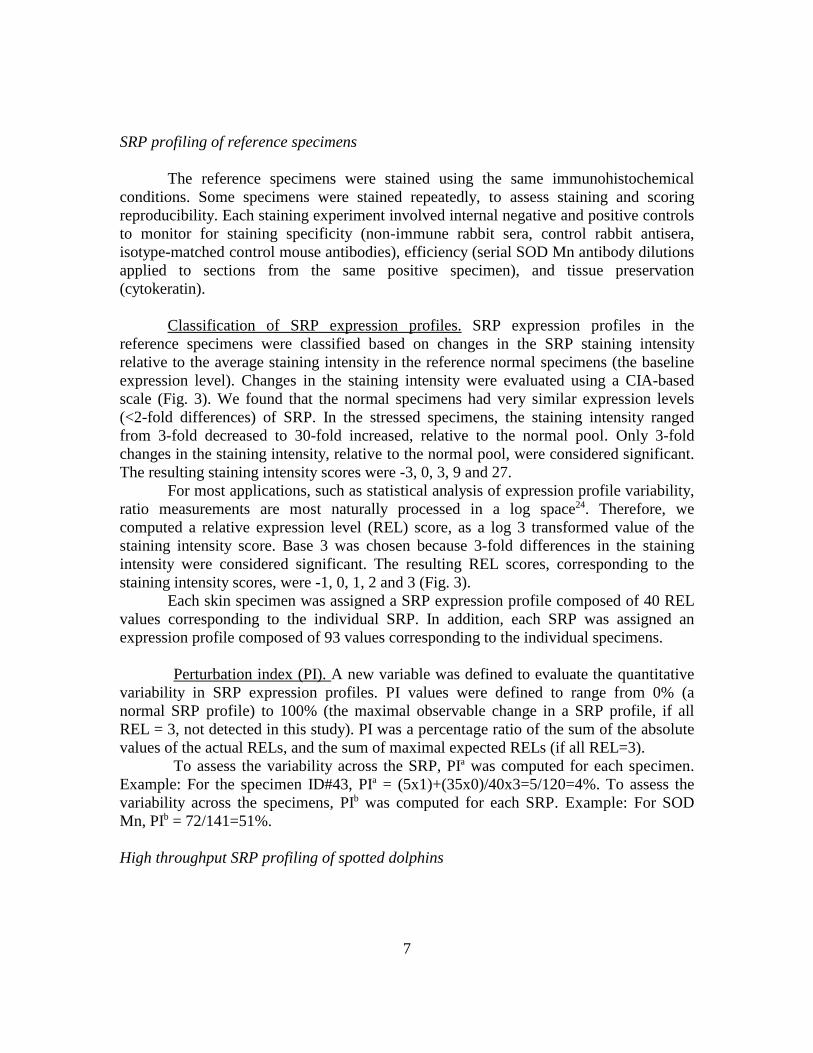
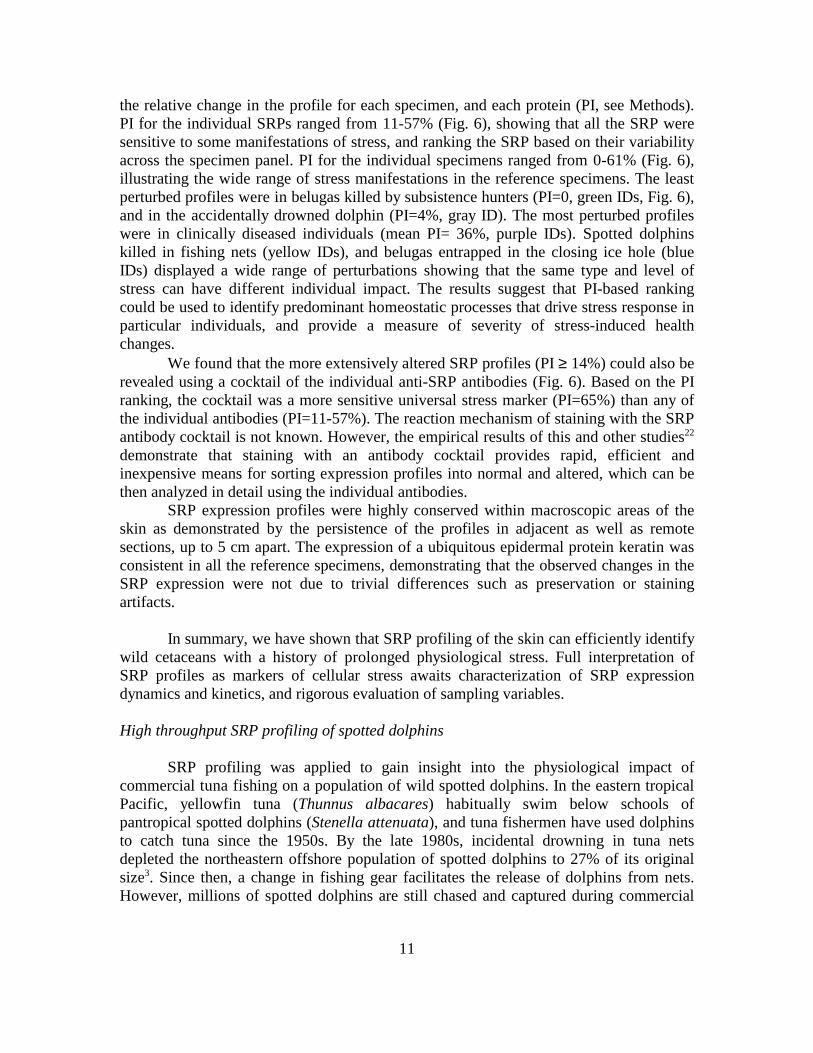
Classification of SRP profiles. A majority of the specimens (707/868 = 81%) hadprofiles resembling closely the normal or the altered profiles found in the referencespecimens (Figs. 4a, b). In 161 spotted dolphins, novel types of altered SRP profiles weredetected. The novel profiles had a " banded" appearance due to discrete horizontal layerswith high or low SRP expression levels (Figs. 4c-f). The banded profiles could not beexplained as artifacts for several reasons: (1) The same types of the banded profiles werefound in 161 dolphins that were sampled randomly (different body sites, differentsampling dates, different primary preservation procedure). (2) The banding wasconsistent in several adjacent sections stained with serial dilutions of the antibodycocktail. (3) Cytokeratin expression was either uniform or showed only limited banding.

9
Because of the banded profiles, classification of the SRP profiles in the spotteddolphins could not be based only on the quantity of the SRP expression, as in thereference specimens, but also on the spatial distribution of the SRP expression within theepidermis.
The spatial distribution of the SRP expression was assessed subjectively. Anobjective, image analysis-based method for evaluation of the spatial distribution couldnot be developed due to the limited scope of the study. Spatial distribution of SRP wasclassified as normal or altered based on the visual similarity with the SRP expression inthe reference specimens.
The quantity of the SRP expression was measured objectively using CIA, as acontinuous range of EL values (EL=0-33). A normal quantitative level of SRP expressionwas defined as the average EL in the spotted dolphins with a normal spatial SRPdistribution (normal EL=mean EL +/- 2 SD).
SRP profiles were classified as “normal” if they had a normal spatial distribution,and a normal quantitative level of SRP expression. All other SRP profiles were classifiedas “altered”. During the final scoring, 278 poor quality specimens (too small, folded,torn), were identified by a specific code, and recommended for elimination from furtheranalysis25.
Blinding. The multi-tissue slide production, the immunohistochemical staining,CIA, visual inspection and the scoring of SRP profiles were performed blind, withoutknowledge of the fishing activity level associated with individual specimens. However,the identity of historical fishery dolphins and bow-riders, as groups, was known (exceptin the combined CHESS/bow-riders set that was assembled blind). The blind data wereexported to the Access database for statistical analysis25.
Reproducibility. A high reproducibility of the SRP profile classification wasdemonstrated using results from a repeated classification of 158 bow-riders. The bow-riders were analyzed at first in the context of 250 other bow-riders, and then in a blindedcombination with 250 CHESS specimens. The original and the repeated classificationscorrelated significantly (137/158=87% duplicated classification, 21/158=13% differentclassification, Spearman rank correlation test rS=0.999).
RESULTS AND DISCUSSION
Development of SRP profiling
To detect stress-associated molecular changes in the cetacean skin, we identified40 proteins (stress response proteins, SRP) with documented roles in molecular stressresponses of humans and other mammals, and known expression in the human skin(Table 1). The SRP panel represents several principal homeostatic pathways and providesthe potential for broad-spectrum recognition of diverse changes triggered by differenttypes of stress. Reference specimens were obtained from wild dolphins and whales with
10
known health status in order to characterize stress-associated changes in the SRPexpression in cetaceans. To reveal general manifestations of stress, the referencespecimens represented 7 species of cetaceans and different types and severity ofphysiological perturbations (Table 2). Human specimens were included to provide both apositive control, and to allow further generalization of the stress-associated changes.Live, apparently healthy individuals were classified as normal, with baseline levels ofstress (n=42, Table 2a). Among 51 individuals classified as stressed (Table 2b), 23individuals with documented clinical diseases provided a framework within which tocompare individuals with more complex health histories. Those included 15 belugastrapped in a closing ice hole, 4 belugas killed in a subsistence hunt, 8 spotted dolphinsdrowned in fishing nets, and one accidentally drowned dolphin (Table 2b).
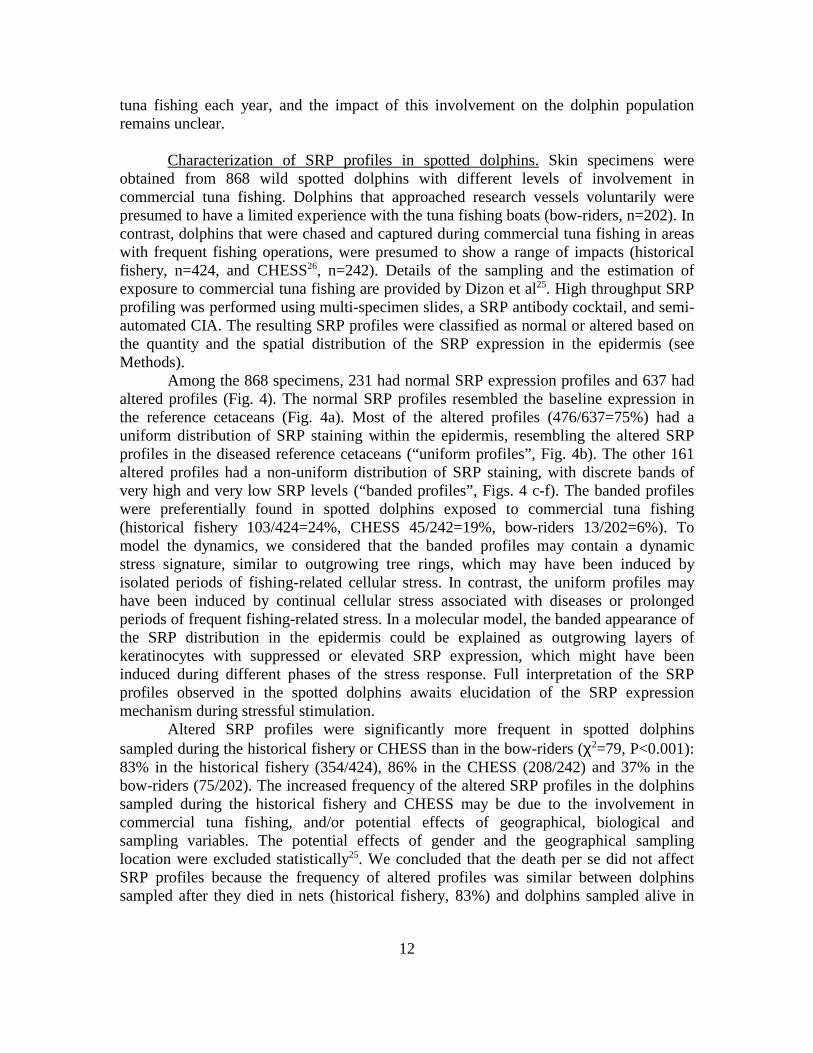
Stress-associated changes in the SRP expression were first explored qualitatively,to provide a basic characterization of the SRP expression in the skin of healthy anddiseased cetaceans. SRP were detected using immunohistochemical staining of skinsections, in order to visualize the quantitative and the spatial distribution of the SRPexpression within the skin. Fig. 5 illustrates a typical expression profile, here for themitochondrial superoxide dismutase, SOD Mn.
In healthy cetaceans, the baseline expression of SOD Mn was widespread in theskin (Fig. 5a), with greatest concentrations in the basal and suprabasal keratinocytes ofthe epidermis (Figs. 5 a-c). The expression of the other SRP was similar, except formetallothionein, strictly localized in the basal keratinocytes, and laminin, detected also inthe vascular endothelium and the extracellular matrix of the dermal papillae. The baselineexpression levels appeared invariable within the same species and similar among species.The elevated expression in the germinal and immature keratinocytes may be due tointrinsic physical and chemical stresses in the cellular microenvironment, triggered bythe high metabolic rate of those cells. The invariability of the baseline expression profilesindicates that the SRP expression in the skin is essential and highly conserved.
In diseased cetaceans, the SOD Mn expression was variable, ranging from thebaseline expression profile to altered profiles characterized by increased expressionlevels in both immature and mature keratinocytes (Figs. 5 d-e). All SRP had alteredexpression profiles in some of the stressed individuals. The altered expression profilesprobably indicated a generalized increase in the cellular stress in the skin.
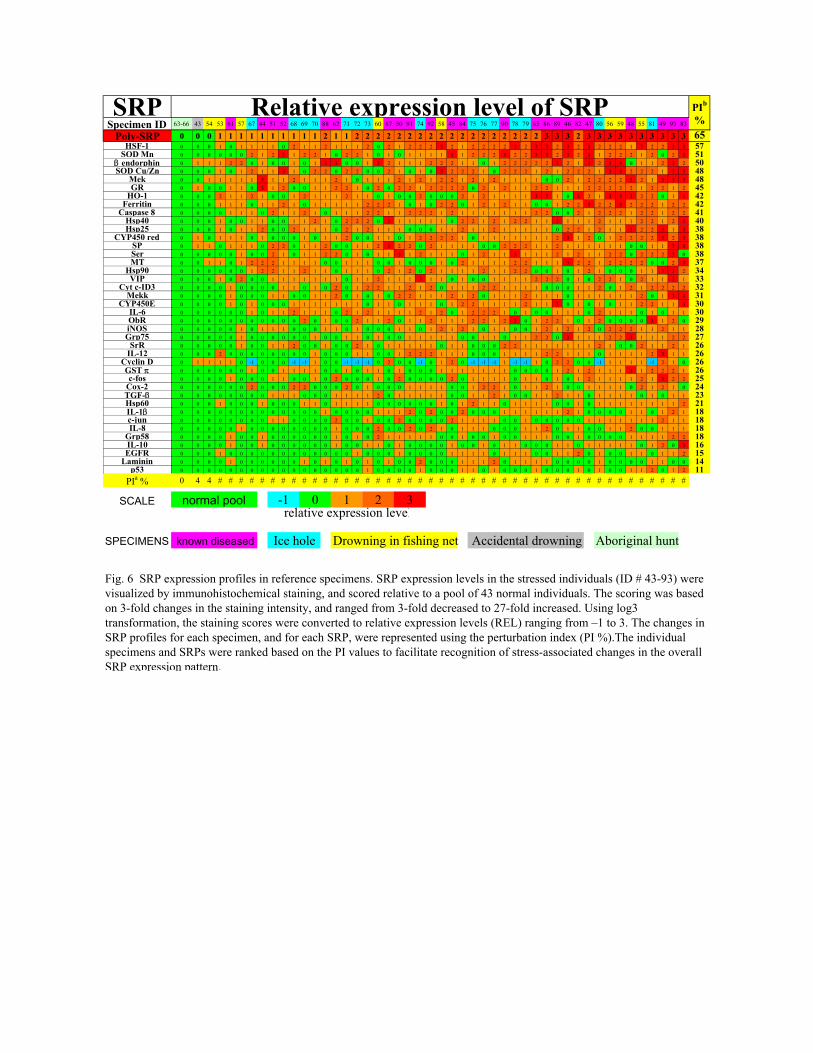
Differential expression analysis, based on quantitative characterization of SRPexpression in the reference specimens, was used to validate the use of the SRP panel asan effective stress marker. Fig. 6 provides an overview of SRP expression profiles in thereference specimens, using a relative expression level (REL) scale (Fig. 3). The 42individuals classified as normal were used to define a normal profile of the SRPexpression (REL=0 for all SRP). Among 51 individuals classified as stressed, themajority (47/51=92%) had altered profiles of the SRP expression, relative to the normalprofile. The altered profiles involved changes in the expression levels of many individualSRP (5-38 SRPs, mean=27). The relative changes in the SRP expression levels ranged30-fold (mean = 2.8-fold, S.D. = 1.5-fold change).
To describe and compare the relative extent of quantitative changes in alteredSRP profiles, we introduced a new variable termed the perturbation index that measures
11
the relative change in the profile for each specimen, and each protein (PI, see Methods).PI for the individual SRPs ranged from 11-57% (Fig. 6), showing that all the SRP weresensitive to some manifestations of stress, and ranking the SRP based on their variabilityacross the specimen panel. PI for the individual specimens ranged from 0-61% (Fig. 6),illustrating the wide range of stress manifestations in the reference specimens. The leastperturbed profiles were in belugas killed by subsistence hunters (PI=0, green IDs, Fig. 6),and in the accidentally drowned dolphin (PI=4%, gray ID). The most perturbed profileswere in clinically diseased individuals (mean PI= 36%, purple IDs). Spotted dolphinskilled in fishing nets (yellow IDs), and belugas entrapped in the closing ice hole (blueIDs) displayed a wide range of perturbations showing that the same type and level ofstress can have different individual impact. The results suggest that PI-based rankingcould be used to identify predominant homeostatic processes that drive stress response inparticular individuals, and provide a measure of severity of stress-induced healthchanges.
We found that the more extensively altered SRP profiles (PI ≥ 14%) could also berevealed using a cocktail of the individual anti-SRP antibodies (Fig. 6). Based on the PIranking, the cocktail was a more sensitive universal stress marker (PI=65%) than any ofthe individual antibodies (PI=11-57%). The reaction mechanism of staining with the SRPantibody cocktail is not known. However, the empirical results of this and other studies22
demonstrate that staining with an antibody cocktail provides rapid, efficient andinexpensive means for sorting expression profiles into normal and altered, which can bethen analyzed in detail using the individual antibodies.
SRP expression profiles were highly conserved within macroscopic areas of theskin as demonstrated by the persistence of the profiles in adjacent as well as remotesections, up to 5 cm apart. The expression of a ubiquitous epidermal protein keratin wasconsistent in all the reference specimens, demonstrating that the observed changes in theSRP expression were not due to trivial differences such as preservation or stainingartifacts.
In summary, we have shown that SRP profiling of the skin can efficiently identifywild cetaceans with a history of prolonged physiological stress. Full interpretation ofSRP profiles as markers of cellular stress awaits characterization of SRP expressiondynamics and kinetics, and rigorous evaluation of sampling variables.
High throughput SRP profiling of spotted dolphins
SRP profiling was applied to gain insight into the physiological impact ofcommercial tuna fishing on a population of wild spotted dolphins. In the eastern tropicalPacific, yellowfin tuna (Thunnus albacares) habitually swim below schools ofpantropical spotted dolphins (Stenella attenuata), and tuna fishermen have used dolphinsto catch tuna since the 1950s. By the late 1980s, incidental drowning in tuna netsdepleted the northeastern offshore population of spotted dolphins to 27% of its originalsize3. Since then, a change in fishing gear facilitates the release of dolphins from nets.However, millions of spotted dolphins are still chased and captured during commercial
12
tuna fishing each year, and the impact of this involvement on the dolphin populationremains unclear.
Characterization of SRP profiles in spotted dolphins. Skin specimens wereobtained from 868 wild spotted dolphins with different levels of involvement incommercial tuna fishing. Dolphins that approached research vessels voluntarily werepresumed to have a limited experience with the tuna fishing boats (bow-riders, n=202). Incontrast, dolphins that were chased and captured during commercial tuna fishing in areaswith frequent fishing operations, were presumed to show a range of impacts (historicalfishery, n=424, and CHESS26, n=242). Details of the sampling and the estimation ofexposure to commercial tuna fishing are provided by Dizon et al25. High throughput SRPprofiling was performed using multi-specimen slides, a SRP antibody cocktail, and semi-automated CIA. The resulting SRP profiles were classified as normal or altered based onthe quantity and the spatial distribution of the SRP expression in the epidermis (seeMethods).
Among the 868 specimens, 231 had normal SRP expression profiles and 637 hadaltered profiles (Fig. 4). The normal SRP profiles resembled the baseline expression inthe reference cetaceans (Fig. 4a). Most of the altered profiles (476/637=75%) had auniform distribution of SRP staining within the epidermis, resembling the altered SRPprofiles in the diseased reference cetaceans (“uniform profiles”, Fig. 4b). The other 161altered profiles had a non-uniform distribution of SRP staining, with discrete bands ofvery high and very low SRP levels (“banded profiles”, Figs. 4 c-f). The banded profileswere preferentially found in spotted dolphins exposed to commercial tuna fishing(historical fishery 103/424=24%, CHESS 45/242=19%, bow-riders 13/202=6%). Tomodel the dynamics, we considered that the banded profiles may contain a dynamicstress signature, similar to outgrowing tree rings, which may have been induced byisolated periods of fishing-related cellular stress. In contrast, the uniform profiles mayhave been induced by continual cellular stress associated with diseases or prolongedperiods of frequent fishing-related stress. In a molecular model, the banded appearance ofthe SRP distribution in the epidermis could be explained as outgrowing layers ofkeratinocytes with suppressed or elevated SRP expression, which might have beeninduced during different phases of the stress response. Full interpretation of the SRPprofiles observed in the spotted dolphins awaits elucidation of the SRP expressionmechanism during stressful stimulation.
Altered SRP profiles were significantly more frequent in spotted dolphinssampled during the historical fishery or CHESS than in the bow-riders (χ2=79, P<0.001):83% in the historical fishery (354/424), 86% in the CHESS (208/242) and 37% in thebow-riders (75/202). The increased frequency of the altered SRP profiles in the dolphinssampled during the historical fishery and CHESS may be due to the involvement incommercial tuna fishing, and/or potential effects of geographical, biological andsampling variables. The potential effects of gender and the geographical samplinglocation were excluded statistically25. We concluded that the death per se did not affectSRP profiles because the frequency of altered profiles was similar between dolphinssampled after they died in nets (historical fishery, 83%) and dolphins sampled alive in
13
nets (CHESS, 86%). In addition, only minimal changes in the expression of theindividual SRP were detected in healthy cetaceans that died due to subsistence huntingand accidental drowning (IDs 63-66, and 43, respectively, Fig. 6). However, we couldnot exclude the effects of the age, the reproductive status and the anatomical samplingsite (the dorsum was sampled in bow-riders, the dorsum and the dorsal fin in CHESS,and the jaw in the historical fishery).
The specimens from the historical fishery were directly comparable (identicallypreserved jaw skin) and enabled us to further investigate the effects of commercial tunafishing in the absence of the sampling site effect. In a blinded study, a significant positivecorrelation was documented between the frequency of altered SRP profiles, or thefrequency of the banded SRP profiles, and our index of involvement in commercial tunafishing (Mann-Whitney U test, P<0.001). Detailed statistical analysis of the relationshipsis provided by Dizon et al25. The increased proportion of altered SRP profiles was foundonly in dolphins exposed to repeated captures for at least 10 days (and up to 70 days)prior to sampling. Dolphins exposed to captures for <10 days before sampling did nothave significantly higher proportions of altered profiles. This empirical observationsuggests that the increase in altered SRP profiles was induced by an accumulated impactof many tuna fishing operations, rather then immediately following one or a fewcaptures. A significant correlation was also found between the type of the altered profileand the level of involvement in the fishery. The banded and the uniform profiles weresignificantly associated with lower and higher levels of involvement, respectively (Mann-Whitney U test, P<0.001). These empirical results further support the models describedabove, whereby the banded SRP profiles might be driven by isolated stress events, andthe uniform profiles, by continual stress.
SRP profiles in spotted dolphins recaptured during CHESS. 12 dolphins werecaptured twice or three times within 5 days during CHESS26. In these recaptured dolphinsthe proportions of altered profiles were lower following the recaptures as compared to thefirst capture (altered/normal profiles: 1st capture 10/1; 2nd capture 7/4; 3rd capture 0/1). Infour of the 12 repeatedly captured dolphins, altered profiles were detected following thefirst capture, and normal profiles during recaptures. This observation appeared to be incontrast with a conclusion based on the historical fishery study, suggesting that increasedinvolvement in the fishery was associated with increased proportion of altered SRPprofiles (see above). The contrasting results can be explained based on differencesbetween the historical fishery and CHESS specimens. The differences may involve boththe level and duration of stress due to recaptures, and also the type of stress, if theCHESS recaptures had a different impact than the commercial tuna fishery.
Regarding the differences in the level/duration of stress, the historical fisheryspecimens constituted two categories based on the relationship between altered SRPprofiles and the involvement in the fishery (see above). Only the dolphins which werefrequently involved in the fishery during >10 days before sampling showed a relationshipbetween the frequency of altered SRP profiles and the involvement in the fishery. Thedolphins involved less frequently, for < 10 days, did not show the relationship. The
14
CHESS specimens, and the SRP profiling results, were similar to the latter category ofthe historical fishery specimens (a few captures in <10 days).
In a hypothetical model of the SRP expression dynamics, the two categories ofspecimens may represent two distinct phases of the molecular stress response. The lowlevel/duration category (CHESS recaptures and the similar historical fishery specimens)may represent the initial phase of stress response, involving non-linear (even chaotic)molecular events, with suppressed or unpredictable alteration of the molecularexpression. A transient suppression of the molecular stress response, induced by stressfulstimuli repeated once a day for 6 days, was described previously, and was found to bemediated by a surge of corticosterone and heat shock proteins28,29. A transient suppressionof SRP expression may be manifested as a banded SRP profile, or as a normal-likeprofile, depending on whether the original profile was normal or uniformly altered. Thehigh level/duration category (the other historical fishery specimens, no similar CHESScounterparts) may represent a later, mature phase of the stress response with quasi-lineardynamics. In the mature phase, stressful stimuli may drive a regularly increasingaccumulation of increased SRP expression across the epidermis, manifested as auniformly altered SRP profile. This hypothetical reconstruction of SRP expressiondynamics is consistent with the empirical observations described above but requiresexperimental validation.
Considering the very limited number of animals (n=12), the potential effects oftagging (the recaptured CHESS animals were tagged with 3 kinds of tags, and nountagged controls were available for repeatedly captured animals), the potentialdifference between CHESS and commercial tuna fishing, and the complex, unknowndynamics of SRP expression, it may be premature to draw any firm conclusions from theCHESS recaptures.
SRP profiles in the skin from the dorsal fin and the dorsum of CHESS dolphins.Different proportions of altered SRP profiles were found in the skin of CHESS dolphinsobtained by different sampling methods (sampling details in Forney et al.26). Most of theCHESS dolphins (n=220) were sampled from the dorsal fin while handled by aresearcher and had a high proportion of altered profiles (198/220=90%). A small group(n=22) was sampled using a long pole (dorsal skin biopsies, n=22), and had a lowerproportion of altered profiles (10/22=45%).
The high proportion of altered profiles in the dorsal fin skin may be associatedwith prolonged exposure to stress, or with the constitutive biochemical properties of thefin skin. The proportion of altered SRP profiles in the fin skin was similar to the jaw skinsampled in the historical fishery (90% and 83%, respectively). In the jaw skin, thefrequency of altered SRP profiles was not invariable, as expected for a constitutiveproperty. Rather, we found significant differences associated with exposure to the fishery(see above). Similarly, the frequency of altered SRP profiles in the dorsal fin skin may bestress-related rather than constitutive.
In the CHESS specimens obtained by the manual biopsy (n=220), the proportionof altered SRP profiles produced by previous exposures to stress might have beenchanged during the sampling procedure, due to direct handling of the fin skin, and
15
systemic stress due to a close contact with humans. Spotted dolphins are known to reactanxiously when handled, and the first CHESS capture was most likely the first time thesedolphins were touched by humans. Direct handling of the skin during massage in humansresulted in a transient display of altered SRP profiles within 30 minutes (S.O.S. and V.Morhenn, unpublished results).
In the CHESS dolphins sampled by the pole biopsy (n=22), the proportion ofaltered SRP profiles may have reflected an unidentified previous exposure to stress, thatmight (transiently) suppressed altered SRP profiles (the effect of isolated stress events,see above). Noticeably, the 22 dolphins were captured together26, indicating a commonhistory that might have affected their SRP profiles.
Any possibility of variability in the SRP profiles relating to anatomical samplingsites, handling and previous stress history will require systematic evaluation in futureexperiments, using precisely defined skin biopsies.
In summary, SRP profiling was applicable to analysis of physiological stress in alarge sample of wild dolphins exposed to commercial tuna fishing activities. Highproportions of altered SRP profiles were found in spotted dolphins sampled in the easterntropical Pacific during 1988-91 and 2001, in areas with frequent commercial tuna fishing.Those results indicate that long-term systemic cellular stress was present in largenumbers of spotted dolphins. Based on analogy with humans and other mammals,prolonged systemic cellular stress could have affected the health and the reproductionfitness of individual spotted dolphins, and triggered incipient population level effects.The mechanism whereby frequent involvement in commercial tuna fishing could inducesystemic cellular stress in spotted dolphins is currently unknown. It was shown thatcellular stress can be triggered by involuntary social disorganization29, which happensduring commercial tuna fishing (mother-calf separation30), and by tissue injury during achase31. Full interpretation of SRP profiling results in spotted dolphins awaitscharacterization of SRP expression mechanism during repeated stress, rigorousevaluation of skin sampling variables, and elucidation of the relationship between alteredSRP profiles and health status in the wild spotted dolphins. These questions need to beresolved in further study.
CONCLUSIONS
The high throughput SRP profiling technique described in this study is a new,effective and practical tool for detecting prolonged systemic cellular stress in wildcetaceans. We showed that SRP are expressed widely in the epidermis of the normal skin,and their expression becomes altered due to prolonged physiological stress. Changes inthe cutaneous SRP expression can be triggered rapidly (S.O.S. unpublished data), and canpersist and accumulate for 10 weeks during continual stress25. The general pattern of thestress-associated changes in SRP expression is highly conserved in mammals, and can bevisualized by antibody staining of routinely preserved skin and other tissues (S.O.S.unpublished data). SRP are highly conserved in most vertebrates, and the anti-SRPantibodies identified here were successfully used in other species including elephants andbirds (S.O.S. unpublished data), suggesting broad applicability of SRP profiling.
16
Repeated sampling of the skin could allow long-term monitoring of SRP profiles.Conceptually analogous SRP panels could be designed for most organisms and used forecosystem-wide studies.
To the best of our knowledge, this is the first report of a large-scale survey ofcellular stress in wild, free-ranging cetaceans, and the first report of cellular stressassociated with the involvement of spotted dolphins in commercial tuna fishing. Theintegration of high throughput SRP profiling and linked ecological data has the potentialto provide an early warning of a relationship between ecological variables and incipientindividual health changes. In medicine, SRP profiling could provide better understandingof diseases that involve cellular stress such as cancer, stroke and AIDS.
ACKNOWLEDGEMENTS
We thank A. Dizon for assistance with the design of the spotted dolphin study, P.Clapham, F. Gulland, C. Lyndersen, C. Manivel, D. Matilla, V. Morhenn, G. O'Corry-Crow, M. Setoyama, D. St.Aubin, P. Vacha, W. VanBonn and R. Wells for use of skinspecimens, R. Jemmerson for use of the 1D3 antibody, P. Southern, W. Amos and R.Brownell, Jr. for insightful discussions and encouragement, A. Allen, N. Kellar, R.Abayon, H. Haselbach and D. McIntyre for skillful technical assistance and H. Orr forexpert graphics assistance. S.O.S. extends special thanks to her children Carolyn andDerek, and to her parents, for inspiring this work. Work by S.O.S. was performed under aNational Research Council Senior Associateship at the Southwest Fisheries ScienceCenter.
17
LITERATURE CITED
1. Harvell, C. D. et al. Emerging marine diseases-climate links and anthropogenicfactors. Science 285, 1505-10 (1999).
2. Primack, R. B. in Essentials of Conservation Biology 284-298 (Sinauer Ass. Inc.,Sunderland, Massachusetts, 1996).
3. Perrin, W. F. Stenella attenuata. Mammalian Species 683, 1-8 (2001).
4. Caswell, M. et al. Declining survival probability threatens the North Atlantic rightwhale. Proc. Natl. Acad. Sci. USA 96, 3308-3313 (1999).
5. Le-Boeuf, B. J. et al. High gray whale mortality and low recruitment in 1999:potential causes and implications. J Cetacean Res Manage. 2, 85-99 (2000).
6. Selye, H. A. Syndrome produced by diverse nocuous agents. Nature 138, 32 (1936).
7. Tyrell, R. M. in Stress-Inducible Cellular Response (eds Feige, U., Morimoto, R. I.,Yahara, I. & Polla, B.) 255-271 (Birkhäuser Verlag Basel, Switzerland, 1996).
8. Feder, M. E. Organismal, ecological and evolutionary aspects of heat-shock proteinsand the stress response. Am Zoologist 39, 857-864 (1999).
9. Strollo F. Hormonal changes in humans during spaceflight. Adv Space Biol Med. 7,99-129 (1999).
10. Calderón-Garcidueñas L. et al. 8-hydroxy-2'-deoxyguanosine, a major mutagenicoxidative DNA lesion, and DNA strand breaks in nasal respiratory epithelium ofchildren exposed to urban pollution. Environ Health Perspect. 107, 469-474 (1999).
11. Lachgar, A. et al. Amplification of the inflammatory cellular redox state by humanimmunodeficiency virus type 1-immunosuppressive tat and gp160 proteins. J Virol.73, 1447-52 (1999).
12. Southern, S. O. and Southern, P. J. in Integrating Population Outcomes, BiologicalMechanisms, and Research Methods in the Study of Human Milk and Lactation (edsDavis, M. K., Isaacs, C. E., Hanson, L. A. & Wright, A. L.) pp. 183-190 (KluwerAcademic/Plenum Publishers, New York, 2002).
13. Biondi, M. and Zannino, L. G. Psychological stress, neuroimmunomodulation, andsusceptibility to infectious diseases in animals and man: a review. PsychotherPsychosom. 66, 3-26 (1997).
18
14. Shohami, E. et al. Closed head injury in the rat induces whole body oxidative stress:overall reducing antioxidant profile. J Neurotrauma 16, 365-376 (1999).
15. Tausk, F. A. and Nousari, H. Stress and the skin. Arch Dermatol 137, 78-82 (2001).
16. Selye, H. The general adaptation syndrome and the disease of adaptation. J ClinEndocrinol 6, 117-230 (1946).
17. Zügel, U., and Kaufmann, S. H. Role of heat shock proteins in protection from andpathogenesis of infectious diseases. Clin Microbiol Rev 12, 19-39 (1999).
18. Leserman, J. et al. Progression to AIDS: the effects of stress, depressive symptoms,and social support. Psychosom Med. 61, 397-406 (1999).
19. Sanocka, D. et al. Oxidative stress and male infertility. J Androl 17, 449-454 (1996).
20. Von Schantz,et al. Good genes, oxidative stress and condition-dependent sexualsignals. Proc R Soc Lond B Biol Sci. 266, 1-12 (1999).
21. Kapahi, P. et al. Positive correlation between mammalian life span and cellularresistance to stress. Free Radic Biol Med 26, 495-500 (1999).
22. Southern, S. O. and Southern, P. J. Persistent HTLV-I infection of breast luminalepithelial cells: a role in HTLV-I transmission? Virology 241, 200-215 (1998).
23. Southern, S. O. Milk-borne transmission of HIV: Characterization of productivelyinfected cells in breast milk and interactions between milk and saliva. J. HumanVirol. 1:328-337 (1998).
24. Eisen M. B. et al., Cluster analysis and display of genome-wide expression patterns.Proc. Natl. Acad. Sci. USA 95, 14863-8 (1998).
25. Dizon, A., Allen, A.C., Kellar, N. and Southern, S.O. Stress in spotted dolphins(Stenella attenuata) associated with purse-seine tuna fishing in the eastern tropicalPacific. Administrative Report No. LJ-02-26, NMFS, Southwest Fisheries ScienceCenter, 8604 La Jolla Shores Drive, La Jolla, CA 92037. (2002).
26. Forney, K.A., D. J. St. Aubin, and S. J. Chivers. Chase-Encirclement Stress Studieson Dolphins Involved in Eastern Tropical Pacific Ocean Purse Seine OperationsDuring 2001. Administrative Report No. LJ-02-32, NMFS, Southwest FisheriesScience Center, 8604 La Jolla Shores Drive, La Jolla, CA 92037. (2002).
27. Heckel, G., et al. Evasive behavior of spotted and spinner dolphins (Stenellaattenuata and S. longirostris) during fishing for yellowfin tuna (Thunnus albacares)in the eastern Pacific Ocean. Fish. Bull. 98, 692-703 (2000).
19
28. Jacob, S. T. et al. Induction of metallothionein by stress and its molecularmechanisms. Gene Expr. 7, 301-310 (1999).
29. Umemoto, S. et al. Chronic glucocorticoid administration as well as repeated stressaffects the subsequent acute immobilization stress-induced expression of immediate-early genes but not that of NGFI-A. Neuroscience 80, 763-773 (1997).
30. Archer, F., Southern, S.O. et al. Unobserved kill of nursing dolphin calves in a tunapurse seine fishery. Marine Mammal Science, 17, 540-554 (2001).
31. Bateson, P. and Bradshaw, E.L. Physiological effects of hunting red deer (Cervuselaphus). Proc. Zool. Soc. London, 264 1707-1714 (1997).
1
18 specimens per slide
Six specimens in one block
Slide number
& Antibody
Treatment
Three blocks per slide
Fig. 1 Diagram of a multi-specimen slide and block. Slides with multiple specimens were prepared using custom-made paraffin blocks with 6 different skin fragments. 25 slides were used in one staining experiment, providing 450 highly comparable staining results. The use of the multi-specimen slides facilitated precise quantitative comparisons between SRP expression profiles in individual specimens, and provided basis for high throughput SRP profiling in large sets of specimens.
1 2
Sample4 Sample5 Sample6
5 4 6
3
2
3
4
5
6
7 10
8
13
14
15
16
17
18
11
9 12
Slide
Block
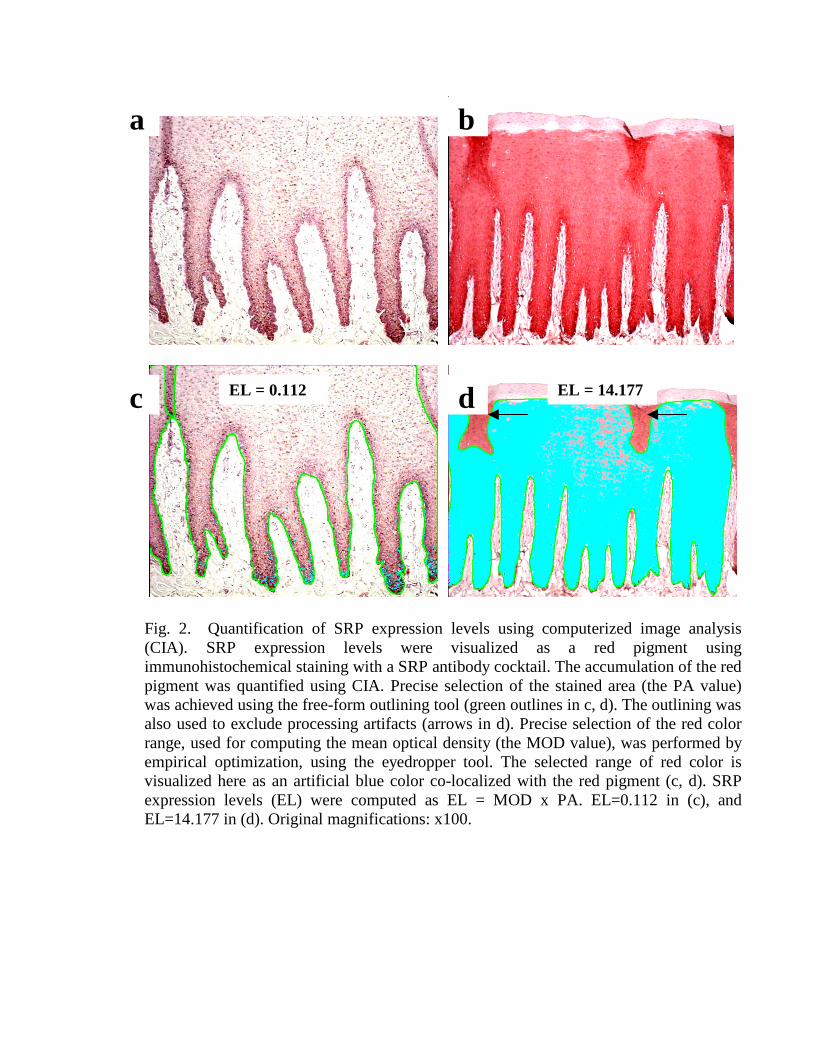
Fig. 2. Quantification of SRP expression levels using computerized image analysis (CIA). SRP expression levels were visualized as a red pigment using immunohistochemical staining with a SRP antibody cocktail. The accumulation of the red pigment was quantified using CIA. Precise selection of the stained area (the PA value) was achieved using the free-form outlining tool (green outlines in c, d). The outlining was also used to exclude processing artifacts (arrows in d). Precise selection of the red color range, used for computing the mean optical density (the MOD value), was performed by empirical optimization, using the eyedropper tool. The selected range of red color is visualized here as an artificial blue color co-localized with the red pigment (c, d). SRP expression levels (EL) were computed as EL = MOD x PA. EL=0.112 in (c), and EL=14.177 in (d). Original magnifications: x100.
a b
d EL = 14.177 c EL = 0.112
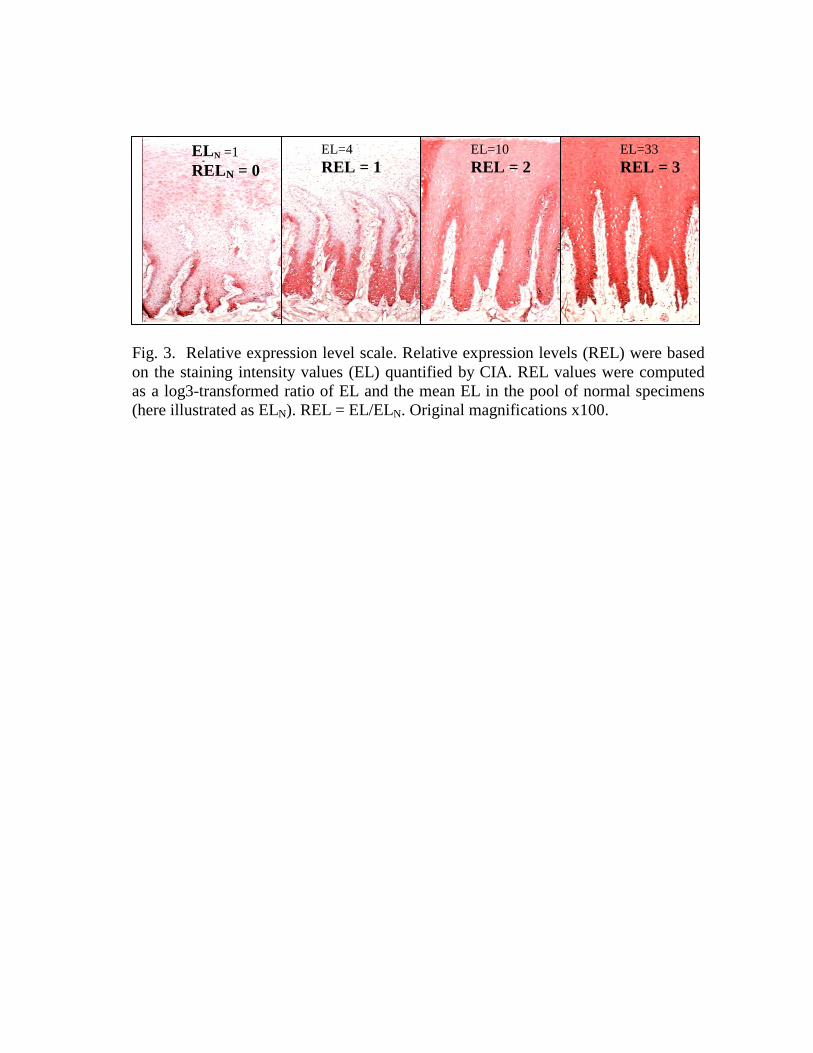
Fig. 3. Relative expression level scale. Relative expression levels (REL) were based on the staining intensity values (EL) quantified by CIA. REL values were computed as a log3-transformed ratio of EL and the mean EL in the pool of normal specimens (here illustrated as ELN). REL = EL/ELN. Original magnifications x100.
ELN =1
RELN = 0 EL=4 REL = 1
EL=10 REL = 2
EL=33 REL = 3
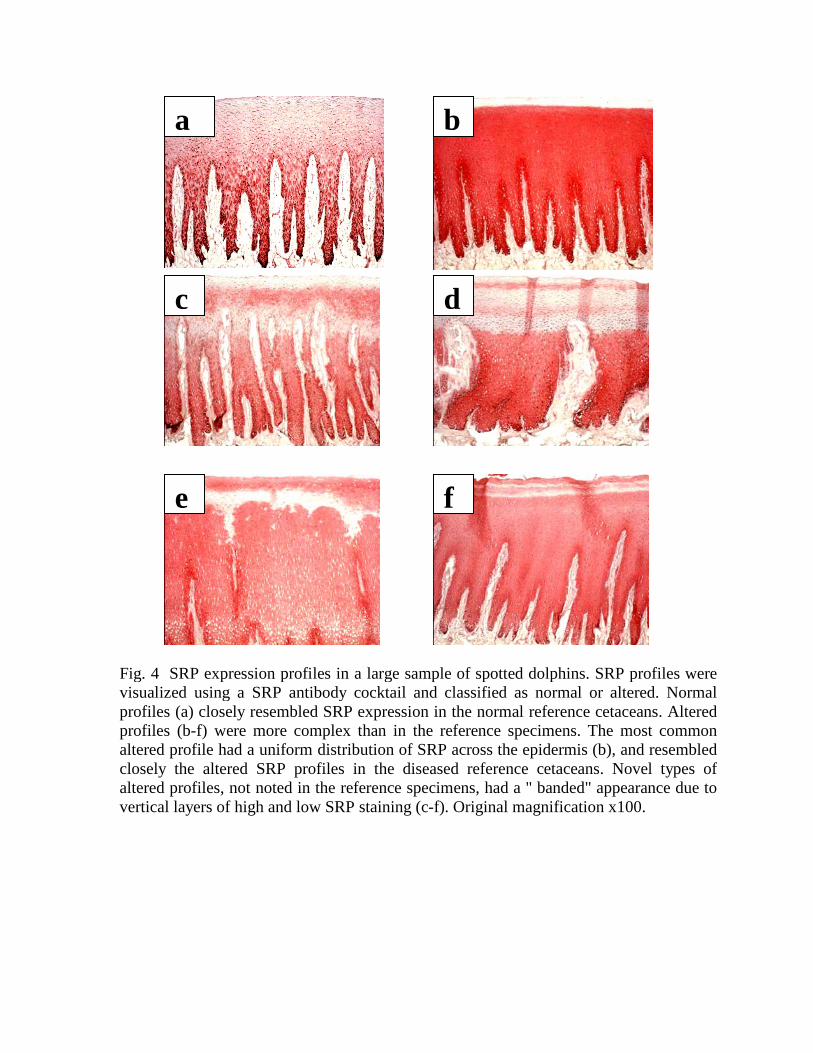
Fig. 4 SRP expression profiles in a large sample of spotted dolphins. SRP profiles were visualized using a SRP antibody cocktail and classified as normal or altered. Normal profiles (a) closely resembled SRP expression in the normal reference cetaceans. Altered profiles (b-f) were more complex than in the reference specimens. The most common altered profile had a uniform distribution of SRP across the epidermis (b), and resembled closely the altered SRP profiles in the diseased reference cetaceans. Novel types of altered profiles, not noted in the reference specimens, had a " banded" appearance due to vertical layers of high and low SRP staining (c-f). Original magnification x100.
b c
c d
e f
a b
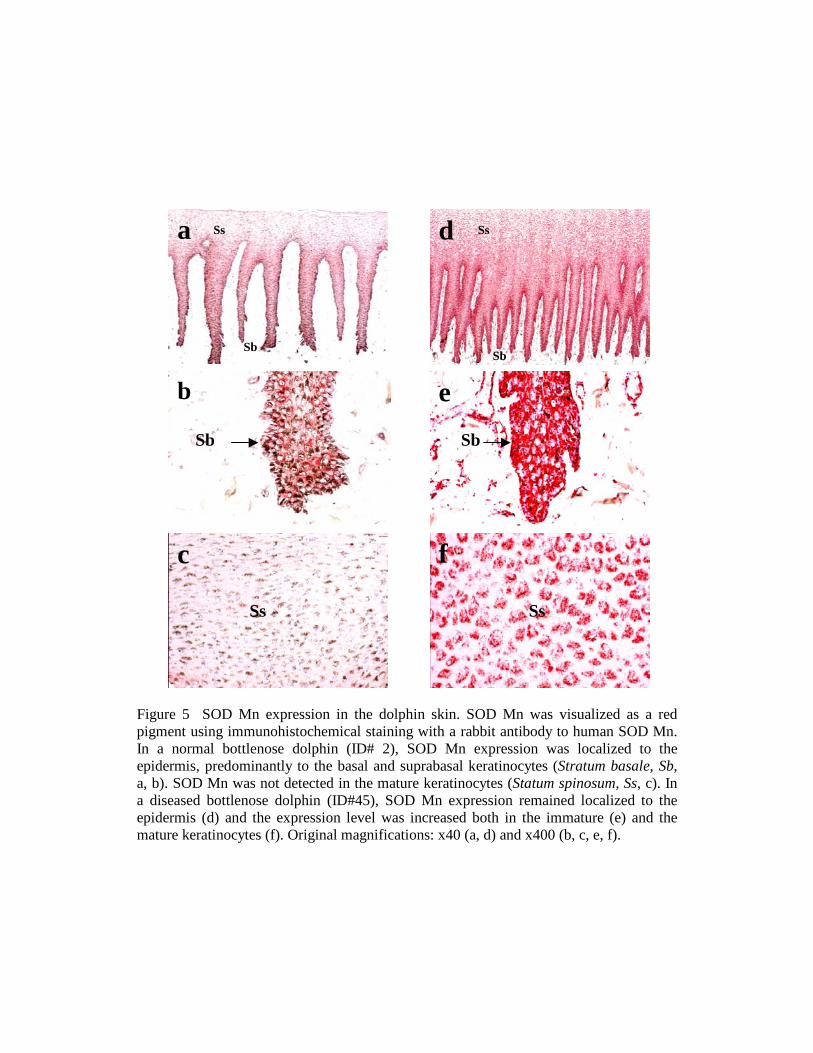
Figure 5 SOD Mn expression in the dolphin skin. SOD Mn was visualized as a red pigment using immunohistochemical staining with a rabbit antibody to human SOD Mn. In a normal bottlenose dolphin (ID# 2), SOD Mn expression was localized to the epidermis, predominantly to the basal and suprabasal keratinocytes (Stratum basale, Sb, a, b). SOD Mn was not detected in the mature keratinocytes (Statum spinosum, Ss, c). In a diseased bottlenose dolphin (ID#45), SOD Mn expression remained localized to the epidermis (d) and the expression level was increased both in the immature (e) and the mature keratinocytes (f). Original magnifications: x40 (a, d) and x400 (b, c, e, f).
a
b
c
d
e
f
Ss Ss
Sb Sb
Sb Sb
Ss Ss
b
Sb
Superoxide dismutase Mn SOD MnSuperoxide dismutase Cu/Zn SOD Cu/ZnHeat shock transcription factor HSF-1 HSF-1Heat shock protein 25 HSP25Heat shock protein 40 HSP40Heat shock protein 60 HSP60Heat shock protein 90 HSP90Heme oxygenase-1 HO-1Glucose regulated protein Grp58 Grp58Glucose regulated protein Grp75 Grp75Metallothionein MTFerritin FerritinCytochrome P 450 IIE1 CYP450ENADPH-cytochrome P 450 reductaseCyp450 redGlutathione S-Transferase π GST πCyclin D1 Cyclin D1Proto-oncogene c-fos c-fosProto-oncogene c-jun c-junMitogen activated MAP kinase Mek-1MekStress-activated MAP kinase Mekk-1 MekkGlucocorticoid receptor GREpidermal growth factor receptor EGFRLeptin receptor Leptin RTransforming growth factors β−1,2,3 TGF−βCyclooxygenase 2 Cox-2Caspase 8 Caspase 8Cytoplasmic cytochrome c Cyt c-ID3Tumor suppressor p53 p53Interleukin IL-1β IL-1βInterleukin IL-6 IL-6Interleukin IL-8 IL-8Interleukin IL-10 IL-10Interleukin IL-12 IL-12Nitric oxide synthase II, inducible iNOS
β-endorphin β-endorphinSubstance P Substance PSerotonin SerotoninSerotonin receptor SerRVasoactive intestinal peptide VIP
Adhesion Laminin Laminin
Homeostatic process AbbreviationStress Response Protein
Immunological signaling
Neuroendocrine regulation
Oxidative stress repair, cellular detoxification
Cell growth control
Apoptosis
Table 1. Panel of 40 stress response proteins (SRP). The functional categorization ofSRP shown here is simplified. Most SRP are pleiotropic and can participate in multiplehomeostatic processes.
Species Gender Age Lab CodeSampling
Date Preservation ProviderID #
F A FB9 9/6/98 1
lactating F A FB11 1/6/98 2
F A FB54 2/6/98 3
M A FB58 5/6/98 4
F A FB63 9/6/98 5
lactating F A FB90 2/6/98 6
calf of FB90 F C FB113 2/6/98 7
lactating F A FB115 4/6/98 8
F A FB117 9/6/98 9
calf of FB11 M C FB146 1/6/98 10
calf of FB163 M C FB152 4/6/98 11pregnant, lactating F A FB163 4/6/98 12
calf of FB115 M C FB166 4/6/98 13
M A FB174 5/6/98 14
M J FB176 8/6/98 15
M J FB178 9/6/98 16
Z1260 1992 17
Z1262 1992 18
Z1263 1992 19
Z11379 1998 20
Z11380 1998 21
Z11381 1998 22
M J Z11045 1998 23
M J Z11046 1998 24
M J Z11047 1998 25
F A Z11048 1998 26
F A Z11049 1998 27
F A Z11050 1998 28
F A Z11014 1998 29
M A DL99/7 1999frozen, formalin 30
U J Z17296 1998DMSO, formalin 31
M A Z17297 2000 formalin 32
northern right whaleE. glacialis
F A Z15112 2000 33
U Z3950 1995 34
M Z3951 1995 35
F Z3949 1995 36
short-finned pilot whale
G. macrorhynchus
Z11480 1998 37
M A NS-1 1996 38
F A NS-2 1998 39
M A NS-3 1999 40human
gray whale E. robustus
Wild gray whales, projectile biopsy, Eastern Tropical Pacific.
U
pantropical spotted dolphin
S. attenuata
beluga D. leucas
A wild pilot whale, projectile biopsy, Hawaii.
Unknown
A wild North Atlantic right whale, projectile biopsy, Bay of Fundy.
Wild belugas, projectile biopsy, NW Territories, Canada.
A wild beluga, tagging biopsy, Norway.
Wild belugas, biopsy/satellite tagging, Cook Inlet, Alaska. The animals were
restrained before sampling.
formalin
DMSO, formalin
NORMAL
healthy volunteer
healthy volunteer
benign nevus, uninvolved skin
bottlenose dolphin T. truncatus
Free-ranging wild dolphins, Sarasota Bay, Gulf of Mexico. These dolphins were captured and restrained for blood
and skin sampling aboard a small research vessel (1-2hr procedure), before
release. The blood sample analysis indicated
that all the dolphins w
ClassificationSpecimens
Health history related to physiological stress
Wild spotted dolphins, Eastern Tropical Pacific. The dolphins were sampled by
projectile biopsy while bowriding close to a reasearch vessel in eastern tropical
Pacific.
Unknown
frozen, formalin
DMSO, formalin
frozen, formalin
SWFSC
DMSO, formalin
Table 2a. Reference specimens classified as normal. SWFSC: Southwest FisheriesScience Center. DMSO, formalin: stored in DMSO, transferred to formalin. Frozen,formalin: frozen at -80 C, transferred to formalin. DMSO: NaCl saturated with 20%dimethyl sulphoxide.
Known diseased Health problems Comments
Drowning M A Tt651 8/30/95 43YES Scoliosis and dermatitis M A Tt773 4/28/99 44YES Pneumonia and old age F A Tg735 1/2/93 45YES Disseminated histoplasmosis F A Tt001 8/7/95 46YES Suppurative peritonitis M A Tt775 2/3/99 47YES M C Tx615c 8/7/99 48YES F C Tt783 12/20/93 49
A Z91783 1995 50A Z91854 1995 51A Z91963 1996 52
M C Z751 DMSO, formalin 1992 53F C RAB005 1991 54
pregnant, lactating F A DAM0019 1991 55pregnant, lactating F A BXR0624 1991 56
F A BXR0628 1991 57F A BXR0633 1991 58
pregnant F A BXR0650 1991 59Multiple chases and captures during CHESS,
drowned in a net during the last capture. lactating F A Z 25176frozen, formalin Oct-01 60
YES Live stranding, shark bites, died 4 months later in a rehabilitation center, Long Key, Florida. F A Z 4539 12/27/94 61
YES Live stranding, diseased, died next day in a rehabilitation center, Quintana Beach, Texas. F A Z 5092 10/12/95 62
F A Z4104 1989 63F J Z4105 1989 64M A Z4106 1990 65F C Z1599 1993 66F A Z6557 1996 67F C Z6543 1996 68F A Z6552 1996 69M A Z6556 1996 70F C Z6550 1996 71F A Z6555 1996 72F A Z6544 1996 73M A Z6546 1996 74F A Z6547 1996 75M J Z6548 1996 76M A Z6541 1996 77F J Z6553 1996 78F A Z6554 1996 79F A Z6545 1996 80M C Z6549 1996 81
YESF A Dl99425 Mystic 1998 82
YES M A Dl576 SPAWARS 1999 83
YESF A Z13086
DMSO, formalin 1999
84
YESEg1102-1 7/10/01 85
YESEg1102-2 7/14/01 86
YES Severe emaciation and encephalitis. M J ErC91 5/11/99 87
YES Severe emaciation and gut infection.M J ErC94 6/26/99 88
YESM J SYGM9925 7/20/99 89
YESM J SYGM9926 7/20/99 90
YES F A 98-1453 1998 91YES F A 99-1712 1999 92
YESM A 4538 1999 93
human HTLV-I associated chronic ATLL leukemia with skin lesions, skin tumor biopsy.
Psoriasis, acute lesion biopsy. SWFSC
Wild pilot whales, North Atlantic, live strandings followed by rehabilitation in captivity, acute dolphin pox infection. Acute infected lesion biopsy.
short-finned pilot whale
G. macrorhynchus
gray whale E. robustus
Wild gray whales, live strandings, San Francisco.
Necropsy specimens.
A pod of wild belugas was cut off by the rapid formation of new ice during their summer migration at Husky Lake, North West Territories, Canada. The belugas
were trapped in a progressively closing ice hole (savssat ) for over 4 weeks. All the animals were severely emaciated and their skin was discolored. They were all killed
together by aboriginal hunters and skin samples were collected.
A semi-domesticated beluga, chronic pleuritis and fungal infection. Acute fungal lesion biopsy.
A semi-domesticated beluga, fungal encephilitis. Necropsy specimen.
Wild spotted dolphins found drowned in nets during purse-seine tuna fishery, eastern tropical Pacific (ETP). The dolphins may have been repeatedly
captured in tuna fishing nets before.
U
beluga D. leucas
Wild, apparently healthy belugas killed in an aboriginal subsistence hunt (5-30 min chase), Canada
A
Stranded wild common dolphins, high morbillivirus titres; Southern California.
northern right whale E. glacialis
Wild NARW, shipstrike trauma, found dead a week later, severely emaciated and infected. Welfleet, Massachusetts.
A wild NARW, dubbed Churchill, was observed entangled in a fishing line, emaciated, with infected wound, near Boston, in June 2001. Biopsied twice during rescue efforts in July. Found dead, discolored, severely emaciated, systemically
infected, in September.
U
pantropical spotted dolphin
S. attenuata
Class-ification
SpecimensST
RE
SSED
bottlenose dolphin T. truncatus
Semi-domesticated bottlenose dolphins under veterinary
care. Necropsy specimens.
Lab Code Preservation
formalin
Sudden idiopathic calf death
common dolphin D. delphis
SWFSC
Mystic
formalin
frozen, formalin
formalin
frozen, formalin
formalin
frozen, formalin
formalin
Species Gender Age
Health history related to physiological stress
Provider Sampling Date ID #
YES
DMSO, formalin
SPAWARS
SWFSC
Table 2b. Reference specimens classified as stressed. DMSO, formalin, frozen, SWFSC: see Table 2a. SPAWARS: US Navy Marine Mammal Program, 49620 Beluga Rd. San Diego, CA, USA. Mystic: Mystic Aquarium, Mystic, CT, USA
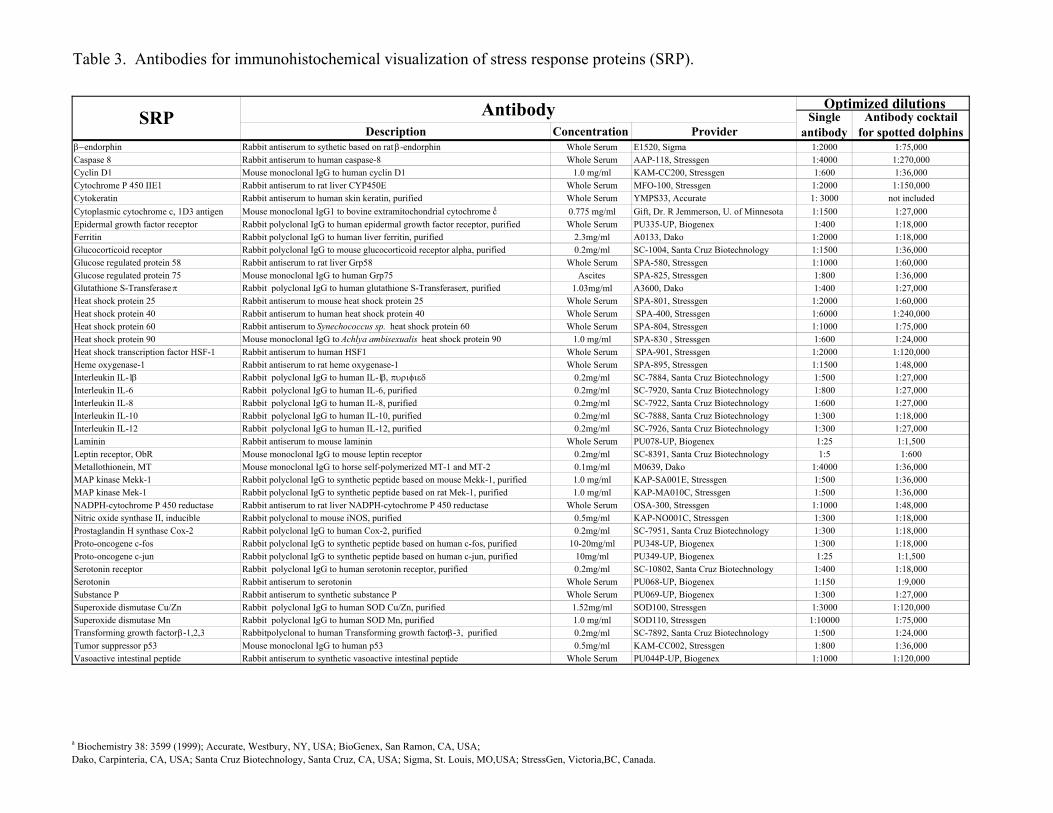
Table 3. Antibodies for immunohistochemical visualization of stress response proteins (SRP).
Description Concentration Providerβ−endorphin Rabbit antiserum to sythetic based on rat β-endorphin Whole Serum E1520, Sigma 1:2000 1:75,000Caspase 8 Rabbit antiserum to human caspase-8 Whole Serum AAP-118, Stressgen 1:4000 1:270,000Cyclin D1 Mouse monoclonal IgG to human cyclin D1 1.0 mg/ml KAM-CC200, Stressgen 1:600 1:36,000Cytochrome P 450 IIE1 Rabbit antiserum to rat liver CYP450E Whole Serum MFO-100, Stressgen 1:2000 1:150,000Cytokeratin Rabbit antiserum to human skin keratin, purified Whole Serum YMPS33, Accurate 1: 3000 not includedCytoplasmic cytochrome c, 1D3 antigen Mouse monoclonal IgG1 to bovine extramitochondrial cytochrome ca 0.775 mg/ml Gift, Dr. R Jemmerson, U. of Minnesota 1:1500 1:27,000Epidermal growth factor receptor Rabbit polyclonal IgG to human epidermal growth factor receptor, purified Whole Serum PU335-UP, Biogenex 1:400 1:18,000Ferritin Rabbit polyclonal IgG to human liver ferritin, purified 2.3mg/ml A0133, Dako 1:2000 1:18,000Glucocorticoid receptor Rabbit polyclonal IgG to mouse glucocorticoid receptor alpha, purified 0.2mg/ml SC-1004, Santa Cruz Biotechnology 1:1500 1:36,000Glucose regulated protein 58 Rabbit antiserum to rat liver Grp58 Whole Serum SPA-580, Stressgen 1:1000 1:60,000Glucose regulated protein 75 Mouse monoclonal IgG to human Grp75 Ascites SPA-825, Stressgen 1:800 1:36,000Glutathione S-Transferase π Rabbit polyclonal IgG to human glutathione S-Transferase π, purified 1.03mg/ml A3600, Dako 1:400 1:27,000Heat shock protein 25 Rabbit antiserum to mouse heat shock protein 25 Whole Serum SPA-801, Stressgen 1:2000 1:60,000Heat shock protein 40 Rabbit antiserum to human heat shock protein 40 Whole Serum SPA-400, Stressgen 1:6000 1:240,000Heat shock protein 60 Rabbit antiserum to Synechococcus sp. heat shock protein 60 Whole Serum SPA-804, Stressgen 1:1000 1:75,000Heat shock protein 90 Mouse monoclonal IgG to Achlya ambisexualis heat shock protein 90 1.0 mg/ml SPA-830 , Stressgen 1:600 1:24,000Heat shock transcription factor HSF-1 Rabbit antiserum to human HSF1 Whole Serum SPA-901, Stressgen 1:2000 1:120,000Heme oxygenase-1 Rabbit antiserum to rat heme oxygenase-1 Whole Serum SPA-895, Stressgen 1:1500 1:48,000Interleukin IL-1β Rabbit polyclonal IgG to human IL-1β, πυριφιεδ 0.2mg/ml SC-7884, Santa Cruz Biotechnology 1:500 1:27,000Interleukin IL-6 Rabbit polyclonal IgG to human IL-6, purified 0.2mg/ml SC-7920, Santa Cruz Biotechnology 1:800 1:27,000Interleukin IL-8 Rabbit polyclonal IgG to human IL-8, purified 0.2mg/ml SC-7922, Santa Cruz Biotechnology 1:600 1:27,000Interleukin IL-10 Rabbit polyclonal IgG to human IL-10, purified 0.2mg/ml SC-7888, Santa Cruz Biotechnology 1:300 1:18,000Interleukin IL-12 Rabbit polyclonal IgG to human IL-12, purified 0.2mg/ml SC-7926, Santa Cruz Biotechnology 1:300 1:27,000Laminin Rabbit antiserum to mouse laminin Whole Serum PU078-UP, Biogenex 1:25 1:1,500Leptin receptor, ObR Mouse monoclonal IgG to mouse leptin receptor 0.2mg/ml SC-8391, Santa Cruz Biotechnology 1:5 1:600Metallothionein, MT Mouse monoclonal IgG to horse self-polymerized MT-1 and MT-2 0.1mg/ml M0639, Dako 1:4000 1:36,000MAP kinase Mekk-1 Rabbit polyclonal IgG to synthetic peptide based on mouse Mekk-1, purified 1.0 mg/ml KAP-SA001E, Stressgen 1:500 1:36,000MAP kinase Mek-1 Rabbit polyclonal IgG to synthetic peptide based on rat Mek-1, purified 1.0 mg/ml KAP-MA010C, Stressgen 1:500 1:36,000NADPH-cytochrome P 450 reductase Rabbit antiserum to rat liver NADPH-cytochrome P 450 reductase Whole Serum OSA-300, Stressgen 1:1000 1:48,000Nitric oxide synthase II, inducible Rabbit polyclonal to mouse iNOS, purified 0.5mg/ml KAP-NO001C, Stressgen 1:300 1:18,000Prostaglandin H synthase Cox-2 Rabbit polyclonal IgG to human Cox-2, purified 0.2mg/ml SC-7951, Santa Cruz Biotechnology 1:300 1:18,000Proto-oncogene c-fos Rabbit polyclonal IgG to synthetic peptide based on human c-fos, purified 10-20mg/ml PU348-UP, Biogenex 1:300 1:18,000Proto-oncogene c-jun Rabbit polyclonal IgG to synthetic peptide based on human c-jun, purified 10mg/ml PU349-UP, Biogenex 1:25 1:1,500Serotonin receptor Rabbit polyclonal IgG to human serotonin receptor, purified 0.2mg/ml SC-10802, Santa Cruz Biotechnology 1:400 1:18,000Serotonin Rabbit antiserum to serotonin Whole Serum PU068-UP, Biogenex 1:150 1:9,000Substance P Rabbit antiserum to synthetic substance P Whole Serum PU069-UP, Biogenex 1:300 1:27,000Superoxide dismutase Cu/Zn Rabbit polyclonal IgG to human SOD Cu/Zn, purified 1.52mg/ml SOD100, Stressgen 1:3000 1:120,000Superoxide dismutase Mn Rabbit polyclonal IgG to human SOD Mn, purified 1.0 mg/ml SOD110, Stressgen 1:10000 1:75,000Transforming growth factor β-1,2,3 Rabbitpolyclonal to human Transforming growth factor β-3, purified 0.2mg/ml SC-7892, Santa Cruz Biotechnology 1:500 1:24,000Tumor suppressor p53 Mouse monoclonal IgG to human p53 0.5mg/ml KAM-CC002, Stressgen 1:800 1:36,000Vasoactive intestinal peptide Rabbit antiserum to synthetic vasoactive intestinal peptide Whole Serum PU044P-UP, Biogenex 1:1000 1:120,000
AntibodySRP Single antibody
Antibody cocktail for spotted dolphins
Optimized dilutions
a Biochemistry 38: 3599 (1999); Accurate, Westbury, NY, USA; BioGenex, San Ramon, CA, USA;Dako, Carpinteria, CA, USA; Santa Cruz Biotechnology, Santa Cruz, CA, USA; Sigma, St. Louis, MO,USA; StressGen, Victoria,BC, Canada.
Specimen ID 63-66 43 54 53 61 57 67 44 51 52 68 69 70 88 62 71 72 73 60 87 50 91 74 92 58 45 84 75 76 77 90 78 79 85 86 89 46 82 47 80 56 59 48 55 81 49 93 83
Poly-SRP 0 0 0 1 1 1 1 1 1 1 1 1 1 2 1 1 2 2 2 2 2 2 2 2 2 2 2 2 2 2 2 2 2 2 3 3 3 2 3 3 3 3 3 3 3 3 3 3 65HSF-1 0 0 0 1 0 1 1 1 1 0 2 1 1 2 1 1 1 2 0 2 1 2 2 2 3 2 1 2 2 2 2 3 2 3 3 2 3 2 3 2 2 2 1 3 2 2 3 3 57
SOD Mn 0 0 0 0 0 0 2 1 2 3 1 2 2 1 0 2 2 1 0 1 0 1 1 1 1 3 1 2 2 2 3 2 2 3 3 2 3 2 3 1 2 2 2 1 2 0 2 3 51β endorphin 0 1 1 1 2 2 0 1 0 0 1 0 1 3 3 0 0 1 3 2 1 1 1 2 2 2 1 1 0 1 2 2 2 2 2 3 2 1 3 2 3 3 0 1 1 2 3 2 50SOD Cu/Zn 0 0 0 1 0 1 2 1 1 3 1 0 2 2 0 2 2 0 0 2 1 0 1 0 3 2 2 2 1 0 2 2 2 1 2 1 2 2 2 1 3 3 2 2 2 1 3 3 48
Mek 0 0 1 1 1 1 1 3 1 1 2 1 1 1 2 1 0 1 1 1 2 1 2 1 2 2 1 2 1 2 1 1 1 1 0 0 2 1 2 2 2 2 3 2 1 3 3 3 48GR 0 1 0 0 1 1 0 3 1 2 0 0 1 1 2 2 1 0 2 0 2 2 1 2 2 2 2 0 2 1 2 1 1 2 2 1 1 1 2 2 2 2 2 1 2 2 1 2 45
HO-1 0 0 0 2 1 1 2 1 0 0 1 2 1 1 1 2 1 1 0 1 0 0 2 0 0 0 2 1 2 1 1 1 1 3 3 1 0 3 2 1 3 3 3 2 2 0 1 3 42Ferritin 0 0 0 1 1 1 0 1 1 2 1 0 1 1 1 1 1 2 2 2 1 0 1 0 2 2 0 1 2 1 2 1 1 0 0 1 2 2 3 2 2 3 2 2 2 1 2 2 42
Caspase 8 0 0 0 0 1 1 1 0 2 1 1 2 1 0 1 1 1 2 2 1 1 2 2 2 1 2 1 1 1 1 1 1 1 2 2 0 0 2 1 2 2 2 1 2 2 1 2 2 41Hsp40 0 0 0 1 0 0 1 1 0 0 1 1 2 1 0 2 2 2 0 3 1 1 1 1 1 0 2 2 1 2 1 2 2 1 1 3 1 1 1 2 1 1 1 2 2 1 2 3 40Hsp25 0 0 0 1 0 1 1 2 0 0 2 1 1 1 0 2 1 2 1 1 1 0 0 0 1 1 2 1 1 2 1 1 1 1 1 0 2 2 1 2 1 1 3 2 2 3 1 3 38
CYP450 red 0 1 0 1 1 1 0 1 0 0 0 1 0 1 1 2 0 0 1 1 0 1 2 2 2 2 1 0 1 1 1 1 1 1 1 2 3 1 2 0 1 2 2 2 2 3 2 3 38SP 0 1 1 0 1 1 1 0 2 2 0 1 1 2 0 0 1 1 2 3 2 2 0 2 1 1 1 1 0 0 2 2 2 1 1 2 1 1 1 1 1 1 0 0 1 1 3 3 38Ser 0 0 0 0 0 1 0 0 2 1 0 1 1 2 2 0 1 0 1 1 3 1 2 1 1 1 0 1 2 1 1 3 1 1 1 2 1 2 1 1 2 2 0 2 2 2 3 0 38MT 0 0 1 1 0 1 2 2 2 1 1 1 1 0 0 1 1 1 0 0 1 0 0 0 1 0 2 1 1 1 1 2 2 1 1 1 3 2 2 1 2 2 2 2 0 0 2 3 37
Hsp90 0 0 0 0 0 0 1 2 2 1 1 2 1 1 0 1 1 1 0 2 1 2 0 2 1 1 1 1 2 1 1 2 2 0 0 1 0 1 2 1 0 0 0 1 1 3 3 2 34VIP 0 0 0 1 0 2 0 0 1 1 1 1 1 1 1 0 1 1 2 1 1 1 3 1 1 0 1 0 0 1 1 1 1 2 2 2 0 1 0 2 2 1 0 2 1 1 3 1 33
Cyt c-ID3 0 0 0 0 1 0 0 0 0 1 1 0 1 0 2 0 1 2 2 1 1 2 1 2 0 1 1 1 2 2 1 1 1 1 0 0 0 1 1 2 0 1 2 1 2 2 2 2 32Mekk 0 0 0 0 1 0 0 0 1 1 0 0 1 1 2 0 1 0 1 0 2 2 1 1 1 2 1 2 0 1 1 1 2 1 1 1 0 1 1 1 1 1 1 2 0 1 3 3 31
CYP450E 0 0 0 0 1 0 1 0 0 0 1 1 1 1 1 1 1 0 1 1 0 1 1 1 0 1 2 2 1 1 1 1 2 1 1 3 0 1 0 1 0 1 1 2 2 1 1 3 30IL-6 0 0 0 0 0 0 1 0 1 1 2 1 1 1 0 2 1 2 1 1 1 1 2 1 2 0 1 2 2 2 1 0 1 0 0 1 1 1 0 2 1 1 1 0 1 0 1 1 30ObR 0 0 0 0 0 0 0 0 0 0 0 2 0 1 0 0 2 1 1 2 0 1 1 2 1 1 1 2 2 1 2 3 0 1 2 2 1 0 1 2 0 0 0 0 3 1 2 0 29iNOS 0 0 0 0 0 1 0 1 1 1 0 0 0 1 1 0 1 0 0 0 1 1 0 1 2 1 2 1 0 1 1 0 0 1 2 1 2 1 2 0 2 2 2 1 1 2 1 1 28Grp75 0 0 0 0 0 1 0 0 0 0 0 0 1 0 0 1 1 0 1 0 0 1 1 1 1 1 0 0 1 1 0 1 1 2 2 0 3 1 1 1 2 2 3 1 1 1 2 2 27
SrR 0 0 0 0 0 1 0 0 1 1 2 0 0 1 0 0 2 1 0 1 1 1 1 1 0 1 1 0 0 0 2 2 1 1 1 1 1 1 1 2 1 0 0 2 1 1 2 1 26IL-12 0 0 0 2 0 0 0 0 0 0 0 0 1 0 0 0 1 1 0 0 1 2 2 2 1 1 1 0 0 0 1 1 1 1 2 2 1 1 1 0 1 1 1 1 2 3 1 1 26
Cyclin D 0 1 1 1 1 0 -1 0 0 0 -1 -1 1 0 0 -1 -1 -1 0 2 0 0 -1 0 1 2 0 -1 -1 -1 1 -1 -1 1 0 2 2 0 0 -1 1 1 1 1 -1 2 1 0 26GST π 0 0 0 0 0 0 1 0 0 1 1 1 1 0 0 1 0 1 1 0 1 0 0 0 1 1 1 1 1 1 1 0 0 0 0 1 2 1 2 1 1 1 3 1 2 2 2 1 26c-fos 0 0 0 0 1 0 0 0 1 1 0 0 1 0 2 0 0 0 1 0 2 0 0 0 0 2 0 1 1 1 1 0 1 1 0 1 0 1 2 1 1 1 1 2 1 3 2 2 25
Cox-2 0 0 0 0 0 0 2 0 0 0 2 2 0 0 0 2 0 1 0 0 0 1 1 1 1 0 0 1 2 2 1 0 1 1 2 1 0 0 1 1 1 1 0 2 1 2 1 0 24TGF-β 0 0 0 0 0 0 0 0 1 1 1 0 0 0 1 1 1 1 2 0 1 1 1 1 1 0 0 1 1 2 1 0 0 1 1 2 1 1 0 1 1 1 1 0 1 0 1 1 23Hsp60 0 0 0 1 0 0 0 1 0 0 0 1 1 0 1 1 1 1 0 0 0 0 0 0 1 0 1 2 1 1 0 1 1 1 1 0 0 1 0 1 1 1 1 1 1 1 1 2 21IL-1β 0 0 0 0 0 0 0 0 0 0 0 0 0 1 0 0 0 0 1 1 1 2 0 2 0 0 2 0 0 0 1 1 1 1 1 1 2 1 0 0 0 0 1 1 0 1 2 1 18c-jun 0 0 0 0 0 0 0 0 1 1 0 0 0 0 2 0 0 1 0 0 2 0 0 0 0 2 1 1 1 1 0 0 1 0 0 0 0 0 1 1 1 1 1 1 1 2 1 1 18IL-8 0 0 0 0 0 1 0 0 0 0 0 0 0 0 1 0 0 0 2 0 0 2 0 2 1 0 1 1 1 0 0 0 1 1 2 0 1 1 0 0 1 1 2 0 0 1 1 1 18
Grp58 0 0 0 0 1 0 0 1 0 0 0 0 0 0 1 0 1 0 2 1 1 1 1 1 0 0 1 0 0 1 0 0 1 1 1 0 0 1 0 0 0 0 1 1 1 1 2 2 18IL-10 0 0 0 0 1 0 0 1 0 0 0 0 0 0 1 0 0 1 1 0 1 0 0 0 0 1 0 0 1 0 1 1 0 0 0 1 1 0 1 1 1 1 1 0 1 2 0 3 16EGFR 0 0 0 1 0 0 0 0 0 0 0 0 0 0 0 0 1 0 0 0 1 0 0 0 0 1 1 1 1 0 1 1 1 0 0 1 1 2 0 1 0 0 1 1 0 1 1 2 15
Laminin 0 0 0 0 1 0 0 0 0 0 0 1 0 1 0 1 0 1 0 1 0 0 2 0 0 0 1 1 1 2 0 1 1 1 1 0 0 0 0 1 0 0 0 0 1 1 0 0 14p53 0 0 0 0 0 0 0 0 0 0 0 0 0 0 0 0 0 1 0 0 0 0 1 0 0 0 1 1 0 1 0 0 0 1 0 0 0 1 0 1 0 0 1 1 2 0 1 2 11
PIa % 0 4 4 # # # # # # # # # # # # # # # # # # # # # # # # # # # # # # # # # # # # # # # # # # # # #
SCALE
SPECIMENS
SRP Relative expression level of SRP PIb
%
known diseased
normal pool
Ice hole Drowning in fishing net Accidental drowning Aboriginal hunt
-1
Fig. 6 SRP expression profiles in reference specimens. SRP expression levels in the stressed individuals (ID # 43-93) were visualized by immunohistochemical staining, and scored relative to a pool of 43 normal individuals. The scoring was based on 3-fold changes in the staining intensity, and ranged from 3-fold decreased to 27-fold increased. Using log3 transformation, the staining scores were converted to relative expression levels (REL) ranging from –1 to 3. The changes in SRP profiles for each specimen, and for each SRP, were represented using the perturbation index (PI %).The individual specimens and SRPs were ranked based on the PI values to facilitate recognition of stress-associated changes in the overall SRP expression pattern.
relative expression level0 1 2 3
27
APPENDIX - REVIEW RESPONSE S. Southern, Ph.D. April 25, 2002 Five reviewers (selected by an independent organization) examined this document (CIE-S08, January 24, 02) and submitted independent reports. The current version (version April 26, 02) attempts to address the concerns the reviewers directed to the new method for molecular analysis of stress. These concerns focused on specific details in two categories: methodological validation of SRP profiling, and validation of the interpretation of SRP profiles. The current version has been edited to acknowledge this, to explain several technical steps more clearly and to discuss the interpretative limitations. In addition, the reviewers' comments, and my responses are summarized below. Methodological validation of SRP profiling Comments R. Ortiz 1/ General methodological validation of SRP profiling. 2/ Validation of the cross-reactivity of anti-SRP antibodies with dolphin antigens. D. Martineau 1/ Validity of reference samples: different preservation, different species, different body sites. Suggested improvement: biopsies before and after stress from the same animal/species. 2/ The authors decided to measure gene expression at the protein level instead of the RNA level. To justify the choice they rationalize that the poor quality of dolphin skin RNA would not allow interpretable results. 3/ The effect of sample preservation. Luckily the reference specimens gave consistent results despite the different methods used for their preservation. 4/ The use of antibody cocktail. 5/ Optimization of the antibody concentrations. 6/ The cross-reactivity of anti-SRP antibodies with dolphin antigens. G.D. Bossart 1/ The effects of skin fixation-associated variables on the accuracy and validity of the immunohistochemical staining. 2/ General applicability of the staining technique for all 40 SRP antibodies, in particular antigen retrieval and reactivity with formalin-fixed tissues. 3/ General applicability of a standard image analysis protocol for measuring the immunohistochemical signal of SRP with different subcellular localization. 4/ The use of antibody cocktail: potential effects of cross-binding among the individual antibodies? 5/ To validate the technical parameters of SRP profiling, it was suggested to develop a laboratory animal model permitting experimental manipulation of critical variables. S. DeGuise 1/ Using the reference study to both define and validate the SRP stress markers. 2/ Validation of the cross-reactivity of anti-SRP antibodies with dolphin antigens. 3/ The use of antibody cocktail. 4/ Reproducibility of the subjective classification of SRP expression in the spotted dolphins. Dr. J. Mann 1/ Classification of SRP profiles in the large sample of spotted dolphins into normal/altered, rather than using a continuous scale.
28
Responses Definition of the 40 stress response proteins (SRP) as stress markers. Analysis of proteins rather than mRNA, was chosen not only because we had to analyze preserved skin which did not have suitable RNA. Proteins, not RNA messages, are directly involved in the molecular pathways of the stress response process, and therefore proteins are more suitable proxy molecules for measuring physiological stress responses than mRNAs. The reference study was not used to define the SRP markers. Rather, the particular 40 SRP proteins were identified based on a review of medical literature. The SRPs were defined in separate, published studies, as proteins with known and well conserved functions in physiological stress responses of humans and other mammals (and other species, in many cases), as summarized in Table 3. Furthermore, all the SRPs were shown to be expressed in mammalian epidermal keratinocytes in previously published studies. Validity of the reference specimen set. The reference set of specimens was assembled with a goal to identify among the candidate SRP those that could discriminate between healthy and diseased cetaceans. In order to design a SRP panel constituting a broadly applicable generic stress marker, the discrimination would optimally be independent on the type of the stress, and the type of mammalian skin sample (species, gender, age, skin sampling site, and the initial preservation by freezing, formalin or DMSO). Therefore the reference specimens were chosen from several cetacean species and humans, both genders, different ages. In most cases, the precise skin sampling locations were not known, and were supposed to represent random sites on the dorsum and the head. We chose individuals exposed to a variety of physiological and pathological conditions in order to allow the identification of common, generic differences in the SRP expression pattern between the normal and stressed groups. It would have been optimal to have reference specimens from individuals biopsied at multiple standardized sites before and after stress, stored/fixed in a standard way. However, the scope of the study precluded obtaining such specimens. Instead, the study had to rely on gifts of differently fixed specimens obtained by opportunistic sampling. Preliminary results in humans, elephants and birds, with standardized specimens of skin and other tissues confirmed that the SRP panel can discriminate between healthy and diseased individuals (chronic infections, cancer). The effect of specimen preservation and fixation. The anti-SRP antibodies chosen for SRP profiling were known to react optimally with formalin-fixed tissues. To assure consistent immunohistochemical reactivity with the antibodies, all specimens were chemically standardized before his tological processing. Specimens initially stored in DMSO, formalin or frozen were transferred to fresh 10% normal buffered formalin, and fixed for at least 24 hrs before embedding in the paraffin blocks. Complex “banded” patterns of the altered SRP expression in spotted dolphins: processing artefacts? The hypothesis that the “banded” patterns of SRP expression, observed in the large sample of the spotted dolphins, are artefacts cannot be accepted at this time because of the following empirical observations. (1) Non-random distribution of the banded patterns: The normal, constitutive patterns of the SRP expression were not affected. Only the altered SRP profiles were more complex: ie “discontinuously altered/banded” in addition to “continuously altered”. (2) The same four types of the “banded” SRP profiles were observed in two very different groups of specimens, regarding processing/preservation: formalin-preserved jaws, and frozen biopsies post-fixed in formalin. (3) The banded profiles were consistently observed with different markers, and at distant sections. (4) Significant correlation between the frequency of the banded patterns and the history of the exposure to the fishing operations both in the jaw section specimens, and in the biopsy specimens. Specific detection of cetacean antigens using cross-reactive anti-SRP antibodies. The anti-SRP antibodies used in our study (Table 2) were well-characterized, commercially available reagents identified based on a review of technical literature. We selected such antibodies that were
29
designed to recognize highly conserved SRP epitopes, as documented by actually observed, published specific cross-reactivity against homologous SRP antigens in different tissues of humans and mice (and other species, in many cases). When possible, we have chosen rabbit polyclonal antibodies that recognized multiple epitopes, rather then monoclonal antibodies, to further increase the probability of specific cross-reactivity with cetacean proteins. The antibody design and the empirically validated pan-mammalian cross-reactivity of these antibodies strongly suggested that a homologous protein would be recognized in other mammalian species, including cetaceans. To eliminate non-specific cross-reactivity in our experiments, the concentrations of the individual antibodies were optimized by multi-step titrations using skin specimens from the 8 reference species. To control for non-specific staining we used negative control antibodies: commercial non-immune rabbit sera and epitope-matched mouse IgGs. Detailed molecular identification of the cross-reactive antigens was not carried out for several reasons. (1) Within a scope of this study, knowledge of the precise molecular identity of the cetacean antigens was not required. It was sufficient to establish empirically that a cross-reacting cetacean antigen was useful for discriminating between healthy and diseased individuals. (2) Precise molecular characterization of the cross-reactive cetacean antigens was not technically possible with the majority of the reference specimens because formalin and DMSO fixed tissues were not suitable for W. blotting and cDNA analysis. (3) The limited scope of this study precluded the development and use of cloned cultured cetacean cells as an alternative route to characterize the SRP antigens in cetaceans. Optimization of antibody concentrations and the use of control antibodies. The concentrations of all the individual antibodies were optimized using multi-step titrations on positive cetacean and human tissues (Table 2). To control for non-specific staining we used negative control antibodies (commercial non-immune rabbit sera and epitope-matched mouse IgGs). To assess tissue preservation, the expression of keratin (ubiquitous keratinocyte protein) was visualized in all specimens, and was determined to be consistent. In following experiments, visualization of keratin and SOD Mn, an easily detectable SRP, were used as positive control staining. The poly-SRP antibody cocktail. The goal of the mandated study was a high throughput molecular analysis of stress in a large number of specimens. To compress the staining procedure, and still retain the broad functional potential of multiple stress markers, we implemented a cocktail of all the individual antibodies. The use of cocktail antibodies requires a careful design and empirical validation of specific reactivity. Cocktail antibodies are used routinely in medical diagnostics, for example for rapid identification of HIV-1, 2 positive blood in the VA Hospital in San Diego (Abbott Diagnostics HIV-1,2 kit: see a letter from the director of the VA Blood bank). Based on the experience from previous studies (eg. SO Southern, J. Human Virol 1998, 1:328), highly compatible primary antibodies (see below) were used to design the poly-SRP cocktails. The optimal dilutions of antibodies for the cocktail use were established empirically, starting with the optimized concentrations of the individual antibodies. At first we designed a generic cocktail, applicable to different mammalian species. Such cocktail contained all antibodies at 40-fold lower concentrations than the optimized single antibody concentrations. This cocktail for used to analyze all reference specimens. The empirical results of this analysis showed that this cocktail revealed 45 altered SRP profiles (perturbation index>14%), and thus provided 88% identification of the stressed individuals. Then we designed a cocktail specifically tailored for highly specific staining of the spotted dolphin specimens (Table 2). This cocktail contained antibodies whose concentrations were optimized separately, and were 30-60-fold more diluted than the optimal single concentrations (Table 2). The use of this tailored cocktail antibody allowed a rapid and inexpensive screening of SRP profiles in over 1000 specimens, within 5 months. While analysis of the individual SRP markers would provide much more accurate results, it would require a 40-fold larger time, personnel and money budget, which was not available. The empirical results of this reference study, and other studies demonstrate the utility of well designed cocktail antibodies, while the precise reaction mechanism of their immunoreactivity remains to be elucidated. General applicability of a standard immunohistochemical staining procedure for all SRP antigens. We selected such mouse or rabbit commercial antibodies that were known to recognize SRP antigens under common reaction conditions, and whose binding could be visualized using a common detection procedure.
30
1/ Reactive with formalin-fixed, paraffin-embedded tissues (tested empirically with cetaceans). 2/ Requiring or not affected by citrate antigen retrieval. 3/ Requiring pretreatment with goat serum to block non-specific binding. 4/ Specific immunochemical binding at 4°C, in 16 hrs. 5/ Detection of the primary antibody using either of two reagents, reacting under the same conditions (mouse or rabbit links). 6/ Detection of the secondary antibody using a common reagent (AP-label). 7/ Visualization of the antibody-link-label sandwich using a common reagent (a red pigment Fuchsin). The compatible properties of the anti-SRP antibodies provided basis for the use of a standard staining procedure with all the individual antibodies, and with the poly-SRP antibody cocktail. General applicability of the image analysis-based quantification for all SRP antigens. The image analysis measures the density of the immunohistochemical signal in a selected area. In our study, we selected the entire epidermis as the area of interest, and quantified signal deposition within all subcellular and extracellular compartments within that area. Classification of SRP profiles into normal and altered rather than using a continuous expression level scale. Based on the results of the reference study, we planned to use a continuous scale based on SRP levels measured by the computerized image analysis. However, when we stained the large sample of the spotted dolphins, we discovered that while the normal SRP profiles resembled the reference specimens, the altered SRP profiles were much more complex, and contained about 4 types of expression patterns with discountinuous layers of higher and lower staining (banded patterns). We had no means to objectively assess these complex patterns (development of new image analysis program for a complex pattern recognition would take over one year). Therefore we had to use the simple normal/altered classification. Reproducibility of the normal/altered classification in the spotted dolphins. As described in the report, a high reproducibility of the normal/altered SRP profile classification was demonstrated by a blinded repeated analysis of 200 specimens (137/158=87% duplicated classification, Spearman rank correlation test rs=0.999). This level of reproducibility is sufficient for a population survey. Validation of SRP techniques using cultured cetacean cells or a laboratory animal model. Within the constraints of the mandated study, it was not possible to implement cell culture experiments, or a laboratory animal model. Interpretation of SRP profiles Comments G.D. Bossart 1/ The effect of the skin sampling sites. 2/ Interpretation of SRP profiles in the cetaceans when the information on the patho-physiological mechanisms of SRP expression is limited. 3/ Prognostic significance of the observed SRP profiles needs to be assessed. 4/Suggesting the use of a captive experimental cetacean population to provide information on the dynamics of SRP expression in normal and diseased cetaceans, such as necessary for diagnostic and prognostic interpretation of SRP profiles. J. Mann 1/ Resolving the relation between SRP profile and skin sampling site. R. Ortiz 1/ The effects of sun exposure. 2/ The effect of the skin sampling sites.
31
D. Martineau 1/ The effects of solar exposure on the SRP profiles in the skin. Differences in solar exposure for different body sites (dorsum and jaws less exposed that dorsal fin). S. DeGuise 1/ Effects of the skin sampling sites. 2/ Interpretation of SRP profiling when the information on the dynamics of the SRP expression is limited. 3/Interpretation of the SRP profiles in the CHESS recaptures. RESPONSES The effect of skin sampling sites. The reference skin specimens were obtained by opportunistic sampling of mostly wild, free-ranging cetaceans. While providing very valuable field situation specimens, this approach precluded precise choice and even knowledge of the sampling sites. Based on color pattern, shape and morphology, the reference specimens were from different sites on the dorsum and the head. Since this is a common situation in field sampling of wild cetaceans, we aimed to develop a stress-detection method which would not be dependent the precise sampling site location. In the reference study, the type of SRP expression profile (normal or altered) was clearly and consistently related to the health of the sampled individuals rather than to the (presumably random) sampling sites. In the large sample of spotted dolphins, the sampling procedure was most consistent in the fishery mortalities (jaws skin), less in the biopsies from bow-riding animals (random sites on the dorsum). In CHESS, specimens were collected in several ways. The majority of specimens were from the dorsal fin (222/242), 20 were from the dorsum. The frequencies of the normal and altered SRP profiles were significantly different in specimens from the dorsal fin and the dorsum. However, firm conclusions cannot be drawn from the differences between the dorsal and dorsal fin specimens from CHESS due to the small number of the dorsal specimens and potential confounding variables related to these specimens (geographical location, previous stress exposure). Therefore, the relationship between the skin sampling site, and the type of SRP profile needs to be investigated rigorously in future studies with a specifically designed sampling procedure. Limited information on the patho-physiological mechanisms of SRP expression in cetaceans. The relationship between diverse manifestations of pathology in cetaceans and SRP expression was established in the reference study of 49 killed or diseased cetaceans, including two diseased wild spotted dolphins and seven wild spotted dolphins killed in the fishing nets (Table 1).In addition, three humans with well characterized clinical diseases were included for comparison. Limited information on the dynamics of SRP expression in cetaceans. Within the scope of this study it was not possible to investigate the dynamics of SRP expression. In a related stydy we have shown that altered SRP profiles can be induced in directly stimulated skin within 30 minutes (SO Southern and V Morhenn, JAAD, submitted 2002). Prognostic significance of SRP profiles. In a related study, SRP profiling was applied to blinded blood and skin specimens from 3 healthy and 2 diseased semi-domesticated bottlenose dolphins (SOS, unpublished results). Altered SRP profiles were found only in the blood and the skin from the diseased dolphins. The blood specimens from the two diseased dolphins were obtained one day or one month before death, respectively. The skin specimens from the diseased dolphins were obtained during necropsy. These results suggest that SRP profiling of blood could have prognostic utility as a generic indicator of compromised health. Interpretation of SRP profiles in the CHESS recaptures. Full interpretation of SRP profiles in CHESS recaptures is not possible without a better understanding of the SRP expression dynamics during rapidly repeated stressful impacts. The effect of sun exposure. Within the scope of this study, it was not possible to investigate the effect of the sun exposure.