Embed Size (px)
Citation preview
Available online at www.scholarsresearchlibrary.com
Scholars Research Library
Archives of Applied Science Research, 2012, 4 (4):1705-1715
(http://scholarsresearchlibrary.com/archive.html)
ISSN 0975-508X
CODEN (USA) AASRC9
1705 Scholars Research Library
Physico-chemical Characterization of Distillery Effluent and its Dilution Effect at Different Levels
*Farid Ansari, Ajay k. Awasthi and Bhawana P. Srivastava1
School of Environmental Biology, A.P.S University, Rewa (M.P.), India
1Department of Environmental Science, P.G. College, Ghazipur (U.P.), India _____________________________________________________________________________________________
ABSTRACT Effluent originating from distilleries known as spent wash leads to extensive water pollution. A study was conducted to know the quality of effluent generated from the distillery, for the purpose of proper treatment and dilution of effluent before discharge in water stream or on land. Physico-chemical characteristics of distillery effluent samples such as colour, odour, Total Solids, Total dissolved solids, Total Suspended Solids, pH, Electrical Conductivity, Total hardness, Calcium, Magnesium, Alkalinity, Chloride, Dissolved Oxygen, Biological Oxygen Demand, Chemical Oxygen Demand, Ammonical Nitrogen, Total Phosphorus, and Total Potassium were analysed and it was observed that the characteristics of spent wash and PTDE (primary treated distillery effluent) have high load of chemical and organic pollutants. But when PTDE was diluted with 50% and 75% of water, all the values of physicochemical properties were decreased. The decrease in these values show that the toxicity of distillery effluent decreases with increasing dilution. Thus the characteristics of spent wash and PTDE do not allow its discharge into a waterbody, hence it requires treatment and dilution before discharge. . Key words: Distillery effluent, Physico-chemical properties, PTDE.
_____________________________________________________________________________________________
INTRODUCTION
Distillery spent wash is perceived as one of the serious pollution problems of the countries producing alcohol from the fermentation and subsequent distillation of sugar cane molasses. The distillery spent wash is characterised as one of the caramelized and recalcitrant wastes containing extremely high COD, BOD, inorganic solids, color and low in pH (1, 2). In a developing country like India, distillery industries have become a major source of pollution, as 88% of its raw materials are converted into waste and discharged into the water bodies (3), causing water pollution. The disposal of large quantities of biodegradable waste without adequate treatment results in significant environmental pollution. This is the major source of aquatic and soil pollution. The discharge of wastewaters from distilleries is becoming increasingly restricted as pressures from environmental regulations increase and as awareness of the negative impacts of seasonal discharges of water containing high nutrient and organic loadings into water courses spreads (4). At present, there are 285 distilleries in India that are producing 2.7 billion liters of alcohol and generating 40 billion liters of wastewaters annually (5). Distilleries, the alcohol producing industries, are one of the major polluting industries. A typical cane molasses based distillery generates 15 L of spent wash per litre of ethanol produced (6).
Farid Ansari et al Arch. Appl. Sci. Res., 2012, 4 (4):1705-1715 ______________________________________________________________________________
1706 Scholars Research Library
The post methanation distillery effluent (PME) produced from the treatment is characterised by high biological oxygen demand (BOD) and chemical oxygen demand (COD), intense brown colour and high salt levels apart from being rich in plant nutrients. Though the biomethanation of distillery effluent under anaerobic conditions brings down its BOD load from around 50,000 mg /l to 8,000-5,000 mg/l, due to their high organic load and salts, further treatment is still needed. If these effluents are discharged to water streams, the suspended solids present in the effluent would impart turbidity in water, reduce light penetration and impair biological activity of aquatic life. Hence an economically viable and environmentally safe means of disposal is needed to handle such large volumes of PME (7). Analysis on physicochemical characteristics of distillery waste has been carried out, (8, 9, 10) which stated that molasses is the most common raw material used in distilleries for bio-ethanol production. After alcohol distillation, huge volume of darkish coloured spent wash remains in the stills. The wastewater generally known as ‘spent wash’ is one of the most difficult waste products to dispose off, because of low pH and dark brown colour. It has high chemical oxygen demand (COD) and biological oxygen demand (BOD), causing pollution in the receiving water. The Distillery effluent i.e. spent wash is of extremely polluting nature. There have been also numerous studies done on impact of distillery effluent on soil and water quality (11, 12, 13, 14, 15). Therefore, the main objectives of the present study are to evaluate the dilution effect of different application rates of distillery effluent.
MATERIALS AND METHODS
The sampling and analysis of various physico-chemical properties has been done to understand the composition of distillery effluent. The effluent samples were collected from Lord’s distillery Ltd., Nandgaj, Ghazipur, U.P., India, samples were stored in dark place and the physico-chemical analysis of spent wash (distillery effluent), Primary treated distillery effluent (PTDE) and its dilution at different levels was studied i.e. its dilution with 50% and 75% of water were analysed for selected relevant physico-chemical parameters according to internationally accepted procedures and standard methods. (16).
RESULTS AND DISCUSSION
The physicochemical properties of spent wash, PTDE (Primary Treated Distillery Effluent), PTDE diluted with 50% water and PTDE diluted with 75% of water was studied. Chemical composition such as colour, odour, Total Solids (TS), Total dissolved solids (TDS), Total Suspended Solids (TSS), pH, Electrical Conductivity (EC), Total hardness, Calcium(Ca), Magnesium (Mg), Alkalinity, Chloride (Cl), Dissolved Oxygen (D.O), Biological Oxygen Demand (BOD), Chemical Oxygen Demand (COD), Ammonical Nitrogen, Total Phosphorus, and Total Potassium were analysed and tabulated (Table 1). The data revealed great variation at different dilution levels of effluent. The spent wash and PTDE (Primary Treated Distillery Effluent) shows the higher values at all physicochemical parameters. All the values decreased with increasing dilution whereas dissolved oxygen was increased. Colour The colour of spent wash was found dark brown. The colour of spent wash is suspected due to presence of a derivative of caramelized sugar formed during the distillation, termed melanoidin (9). The colour of PTDE (Primary Treated Distillery Effluent) was reddish brown while when it was diluted with 50% of water it turned brownish in colour and changed to light brown colour in PTDE diluted with 75% of water. Odour Odour of the distillery effluent was offensive. Odourous compounds from distillery waste water mainly consist of volatile fatty acids such as butyric and valeric acids that have a high odour index. Distillery has distinct organic compositions. Various anaerobic bacteria ferment these compounds and generate products such as volatile fatty acids for example glycerol is fermented into butyric acid by clostridium butyricum (17). The offensive odour of effluent was also reported (8). Odour of the PTDE, PTDE diluted with 50% of water and PTDE diluted with 75% of water was also offensive. Total Solids The total solids of spent wash were 42400.2 mg/l, but when it was treated, the value decreased. Total solids are the residues that include both dissolved solids and suspended solids. Distillery effluents contain huge amount of solids.
Farid Ansari et al Arch. Appl. Sci. Res., 2012, 4 (4):1705-1715 ______________________________________________________________________________
1707 Scholars Research Library
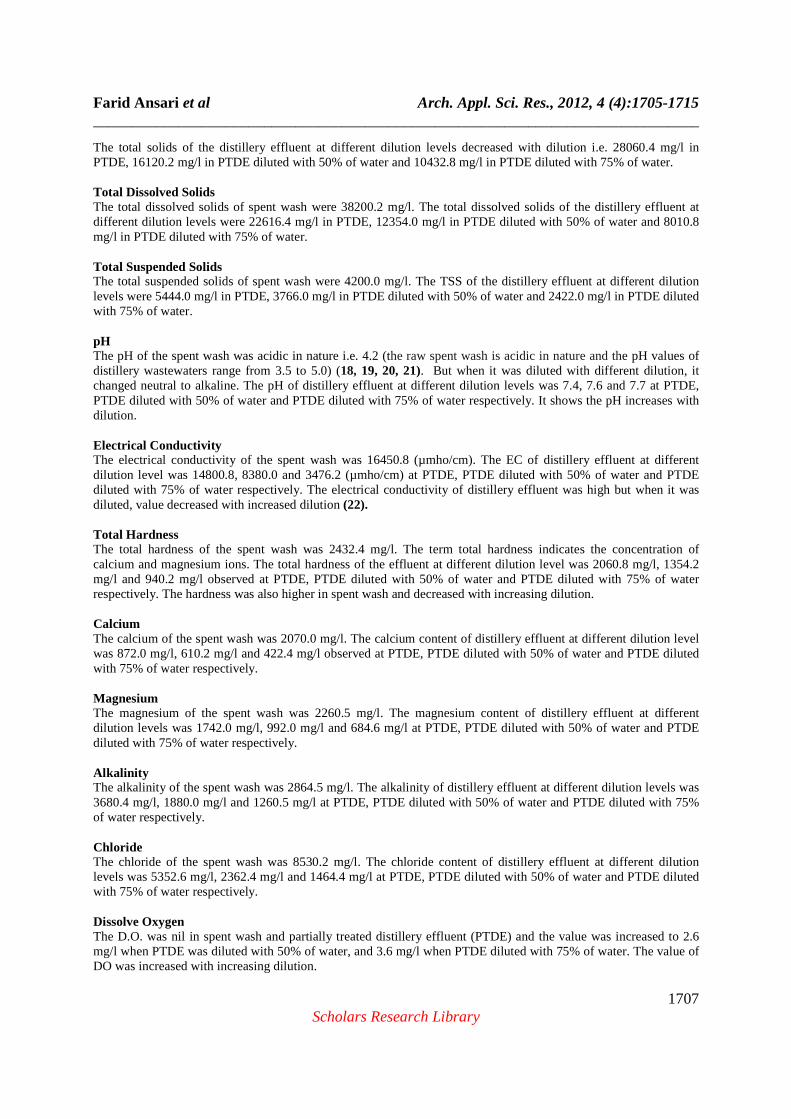
The total solids of the distillery effluent at different dilution levels decreased with dilution i.e. 28060.4 mg/l in PTDE, 16120.2 mg/l in PTDE diluted with 50% of water and 10432.8 mg/l in PTDE diluted with 75% of water. Total Dissolved Solids The total dissolved solids of spent wash were 38200.2 mg/l. The total dissolved solids of the distillery effluent at different dilution levels were 22616.4 mg/l in PTDE, 12354.0 mg/l in PTDE diluted with 50% of water and 8010.8 mg/l in PTDE diluted with 75% of water. Total Suspended Solids The total suspended solids of spent wash were 4200.0 mg/l. The TSS of the distillery effluent at different dilution levels were 5444.0 mg/l in PTDE, 3766.0 mg/l in PTDE diluted with 50% of water and 2422.0 mg/l in PTDE diluted with 75% of water. pH The pH of the spent wash was acidic in nature i.e. 4.2 (the raw spent wash is acidic in nature and the pH values of distillery wastewaters range from 3.5 to 5.0) (18, 19, 20, 21). But when it was diluted with different dilution, it changed neutral to alkaline. The pH of distillery effluent at different dilution levels was 7.4, 7.6 and 7.7 at PTDE, PTDE diluted with 50% of water and PTDE diluted with 75% of water respectively. It shows the pH increases with dilution. Electrical Conductivity The electrical conductivity of the spent wash was 16450.8 (µmho/cm). The EC of distillery effluent at different dilution level was 14800.8, 8380.0 and 3476.2 (µmho/cm) at PTDE, PTDE diluted with 50% of water and PTDE diluted with 75% of water respectively. The electrical conductivity of distillery effluent was high but when it was diluted, value decreased with increased dilution (22). Total Hardness The total hardness of the spent wash was 2432.4 mg/l. The term total hardness indicates the concentration of calcium and magnesium ions. The total hardness of the effluent at different dilution level was 2060.8 mg/l, 1354.2 mg/l and 940.2 mg/l observed at PTDE, PTDE diluted with 50% of water and PTDE diluted with 75% of water respectively. The hardness was also higher in spent wash and decreased with increasing dilution. Calcium The calcium of the spent wash was 2070.0 mg/l. The calcium content of distillery effluent at different dilution level was 872.0 mg/l, 610.2 mg/l and 422.4 mg/l observed at PTDE, PTDE diluted with 50% of water and PTDE diluted with 75% of water respectively. Magnesium The magnesium of the spent wash was 2260.5 mg/l. The magnesium content of distillery effluent at different dilution levels was 1742.0 mg/l, 992.0 mg/l and 684.6 mg/l at PTDE, PTDE diluted with 50% of water and PTDE diluted with 75% of water respectively. Alkalinity The alkalinity of the spent wash was 2864.5 mg/l. The alkalinity of distillery effluent at different dilution levels was 3680.4 mg/l, 1880.0 mg/l and 1260.5 mg/l at PTDE, PTDE diluted with 50% of water and PTDE diluted with 75% of water respectively. Chloride The chloride of the spent wash was 8530.2 mg/l. The chloride content of distillery effluent at different dilution levels was 5352.6 mg/l, 2362.4 mg/l and 1464.4 mg/l at PTDE, PTDE diluted with 50% of water and PTDE diluted with 75% of water respectively. Dissolve Oxygen The D.O. was nil in spent wash and partially treated distillery effluent (PTDE) and the value was increased to 2.6 mg/l when PTDE was diluted with 50% of water, and 3.6 mg/l when PTDE diluted with 75% of water. The value of DO was increased with increasing dilution.
Farid Ansari et al ______________________________________________________________________________
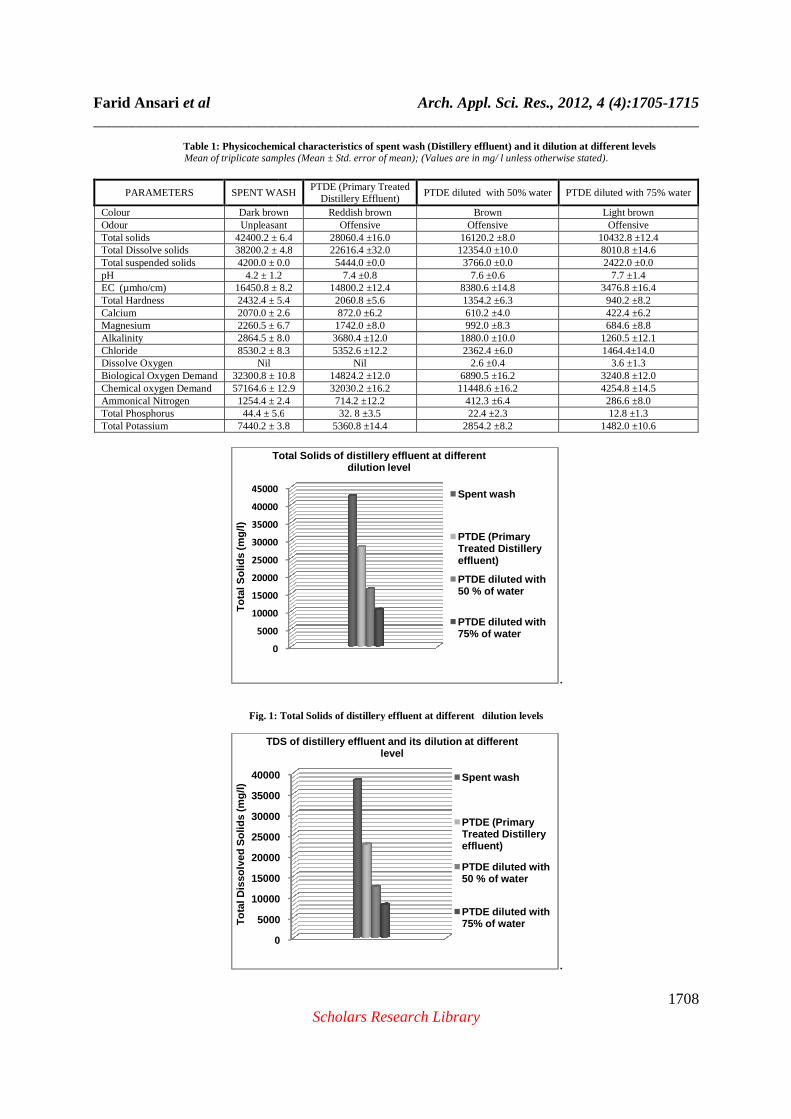
Table 1: Physicochemical characteristics of spent wash (Distillery effluent) and it dilution at different levelsMean of triplicate samples
PARAMETERS SPENT WASH
Colour Dark brownOdour UnpleasantTotal solids 42400.2 ± 6.4Total Dissolve solids 38200.2 ± 4.8Total suspended solids 4200.0 ± 0.0pH 4.2 ± 1.2EC (µmho/cm) 16450.8 ± 8.2Total Hardness 2432.4 ± 5.4Calcium 2070.0 ± 2.6Magnesium 2260.5 ± 6.7Alkalinity 2864.5 ± 8.0Chloride 8530.2 ± 8.3Dissolve Oxygen Nil Biological Oxygen Demand 32300.8 ± 10.8Chemical oxygen Demand 57164.6 ± 12.9Ammonical Nitrogen 1254.4 ± 2.4Total Phosphorus 44.4 ± 5.6Total Potassium 7440.2 ± 3.8
Fig. 1: Total Solids of distillery
0
5000
10000
15000
20000
25000
30000
35000
40000
45000
Tot
al S
olid
s (m
g/l)
Total Solids of distillery effluent at different
0
5000
10000
15000
20000
25000
30000
35000
40000
Tot
al D
isso
lved
Sol
ids
(mg/
l)
TDS of distillery effluent and its dilution at diff erent
Arch. Appl. Sci. Res., 2012, 4 (4):______________________________________________________________________________
Scholars Research Library
Table 1: Physicochemical characteristics of spent wash (Distillery effluent) and it dilution at different levelsMean of triplicate samples (Mean ± Std. error of mean); (Values are in mg/ l unless otherwise stated)
SPENT WASH PTDE (Primary Treated
Distillery Effluent) PTDE diluted with 50% water
Dark brown Reddish brown Brown Unpleasant Offensive Offensive
42400.2 ± 6.4 28060.4 ±16.0 16120.2 ±8.0 38200.2 ± 4.8 22616.4 ±32.0 12354.0 ±10.0 4200.0 ± 0.0 5444.0 ±0.0 3766.0 ±0.0
4.2 ± 1.2 7.4 ±0.8 7.6 ±0.6 16450.8 ± 8.2 14800.2 ±12.4 8380.6 ±14.8 2432.4 ± 5.4 2060.8 ±5.6 1354.2 ±6.3 2070.0 ± 2.6 872.0 ±6.2 610.2 ±4.0 2260.5 ± 6.7 1742.0 ±8.0 992.0 ±8.3 2864.5 ± 8.0 3680.4 ±12.0 1880.0 ±10.0 8530.2 ± 8.3 5352.6 ±12.2 2362.4 ±6.0
Nil 2.6 ±0.4 32300.8 ± 10.8 14824.2 ±12.0 6890.5 ±16.2 57164.6 ± 12.9 32030.2 ±16.2 11448.6 ±16.2 1254.4 ± 2.4 714.2 ±12.2 412.3 ±6.4 44.4 ± 5.6 32. 8 ±3.5 22.4 ±2.3
7440.2 ± 3.8 5360.8 ±14.4 2854.2 ±8.2
Fig. 1: Total Solids of distillery effluent at different dilution levels
Total Solids of distillery effluent at different dilution level
Spent wash
PTDE (Primary Treated Distillery effluent)
PTDE diluted with 50 % of water
PTDE diluted with 75% of water
0
5000
10000
15000
20000
25000
30000
35000
40000
TDS of distillery effluent and its dilution at diff erent level
Spent wash
PTDE (Primary Treated Distillery effluent)
PTDE diluted with 50 % of water
PTDE diluted with 75% of water
Arch. Appl. Sci. Res., 2012, 4 (4):1705-1715 ______________________________________________________________________________
1708
Table 1: Physicochemical characteristics of spent wash (Distillery effluent) and it dilution at different levels ; (Values are in mg/ l unless otherwise stated).
PTDE diluted with 75% water
Light brown Offensive
10432.8 ±12.4 8010.8 ±14.6 2422.0 ±0.0
7.7 ±1.4 3476.8 ±16.4 940.2 ±8.2 422.4 ±6.2 684.6 ±8.8
1260.5 ±12.1 1464.4±14.0
3.6 ±1.3 3240.8 ±12.0 4254.8 ±14.5 286.6 ±8.0 12.8 ±1.3
1482.0 ±10.6
.
.
Farid Ansari et al ______________________________________________________________________________
Fig. 2: Total Dissolved Solids of distillery effluent at different dilution levels
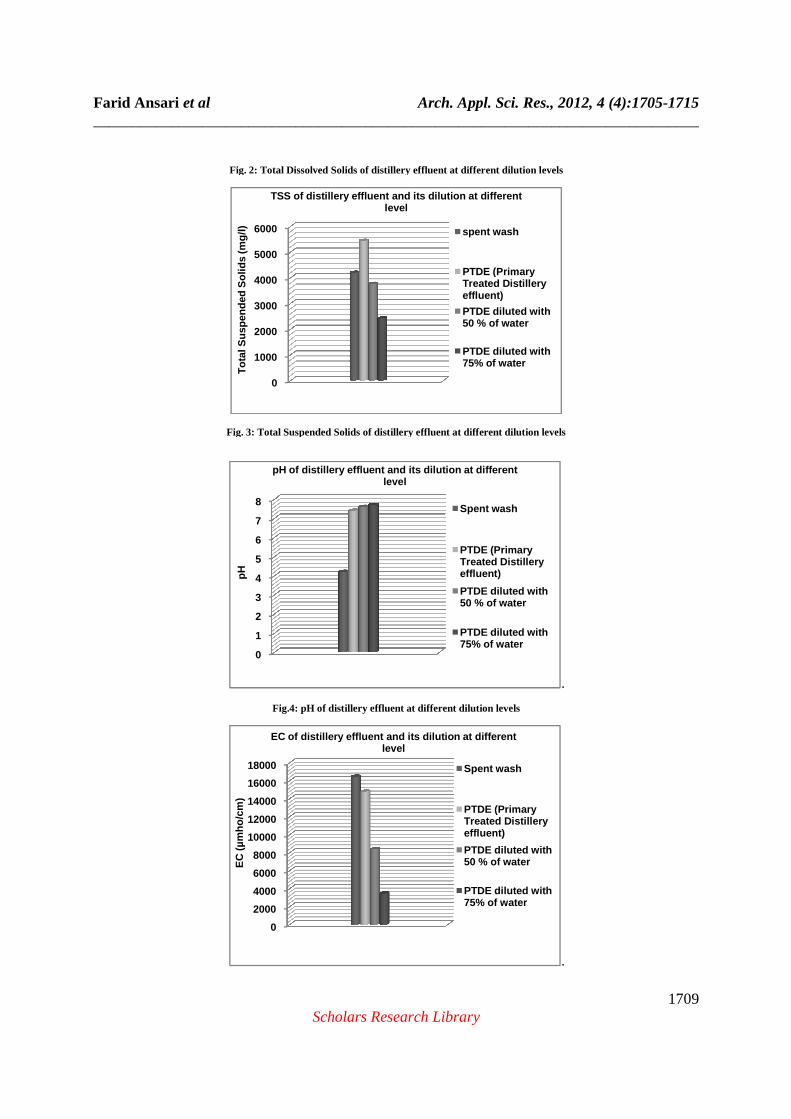
Fig. 3: Total Suspended Solids of distillery effluent at different dilution levels
Fig.4: pH of distillery effluent a
0
1000
2000
3000
4000
5000
6000T
otal
Sus
pend
ed S
olid
s (m
g/l)
TSS of distillery effluent and its dilution at diff erent
0
1
2
3
4
5
6
7
8
pH
pH of distillery effluent and its dilution at diffe rent
0
2000
4000
6000
8000
10000
12000
14000
16000
18000
EC
(µm
ho/c
m)
EC of distillery effluent and its dilution at diffe rent
Arch. Appl. Sci. Res., 2012, 4 (4):______________________________________________________________________________
Scholars Research Library
Fig. 2: Total Dissolved Solids of distillery effluent at different dilution levels
Fig. 3: Total Suspended Solids of distillery effluent at different dilution levels
Fig.4: pH of distillery effluent at different dilution levels
TSS of distillery effluent and its dilution at diff erent level
spent wash
PTDE (Primary Treated Distillery effluent)
PTDE diluted with 50 % of water
PTDE diluted with 75% of water
pH of distillery effluent and its dilution at diffe rent level
Spent wash
PTDE (Primary Treated Distillery effluent)
PTDE diluted with 50 % of water
PTDE diluted with 75% of water
EC of distillery effluent and its dilution at diffe rent level
Spent wash
PTDE (Primary Treated Distillery effluent)
PTDE diluted with 50 % of water
PTDE diluted with 75% of water
Arch. Appl. Sci. Res., 2012, 4 (4):1705-1715 ______________________________________________________________________________
1709
Fig. 2: Total Dissolved Solids of distillery effluent at different dilution levels
Fig. 3: Total Suspended Solids of distillery effluent at different dilution levels
.
.
Farid Ansari et al ______________________________________________________________________________
Fig. 5: Electrical conductivity of distillery effluent at different dilution levels
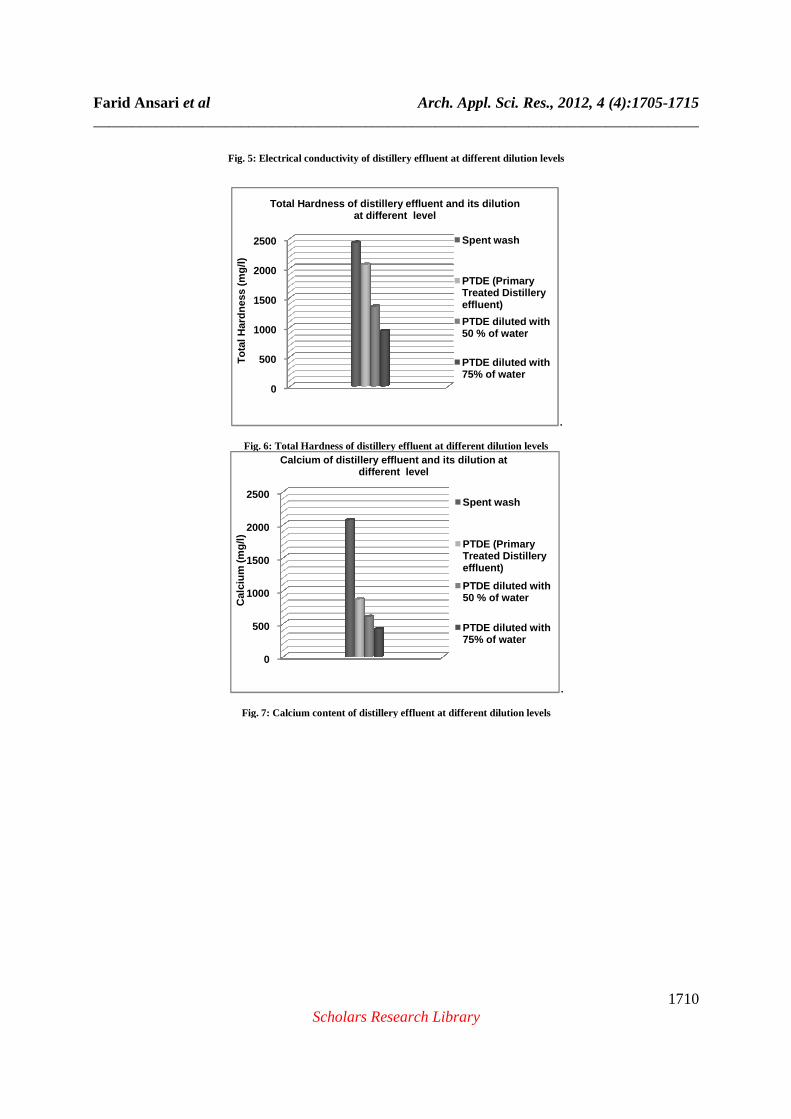
Fig. 6: Total Hardness of distillery effluent at different dilution levels
Fig. 7: Calcium content of distillery effluent at
0
500
1000
1500
2000
2500T
otal
Har
dnes
s (m
g/l)
Total Hardness of distillery effluent and its dilut ion
0
500
1000
1500
2000
2500
Cal
cium
(mg/
l)
Arch. Appl. Sci. Res., 2012, 4 (4):______________________________________________________________________________
Scholars Research Library
Fig. 5: Electrical conductivity of distillery effluent at different dilution levels
Fig. 6: Total Hardness of distillery effluent at different dilution levels
Fig. 7: Calcium content of distillery effluent at different dilution levels
Total Hardness of distillery effluent and its dilut ion at different level
Spent wash
PTDE (Primary Treated Distillery effluent)
PTDE diluted with 50 % of water
PTDE diluted with 75% of water
Calcium of distillery effluent and its dilution at different level
Spent wash
PTDE (Primary Treated Distillery effluent)
PTDE diluted with 50 % of water
PTDE diluted with 75% of water
Arch. Appl. Sci. Res., 2012, 4 (4):1705-1715 ______________________________________________________________________________
1710
Fig. 5: Electrical conductivity of distillery effluent at different dilution levels
.
.
Farid Ansari et al ______________________________________________________________________________
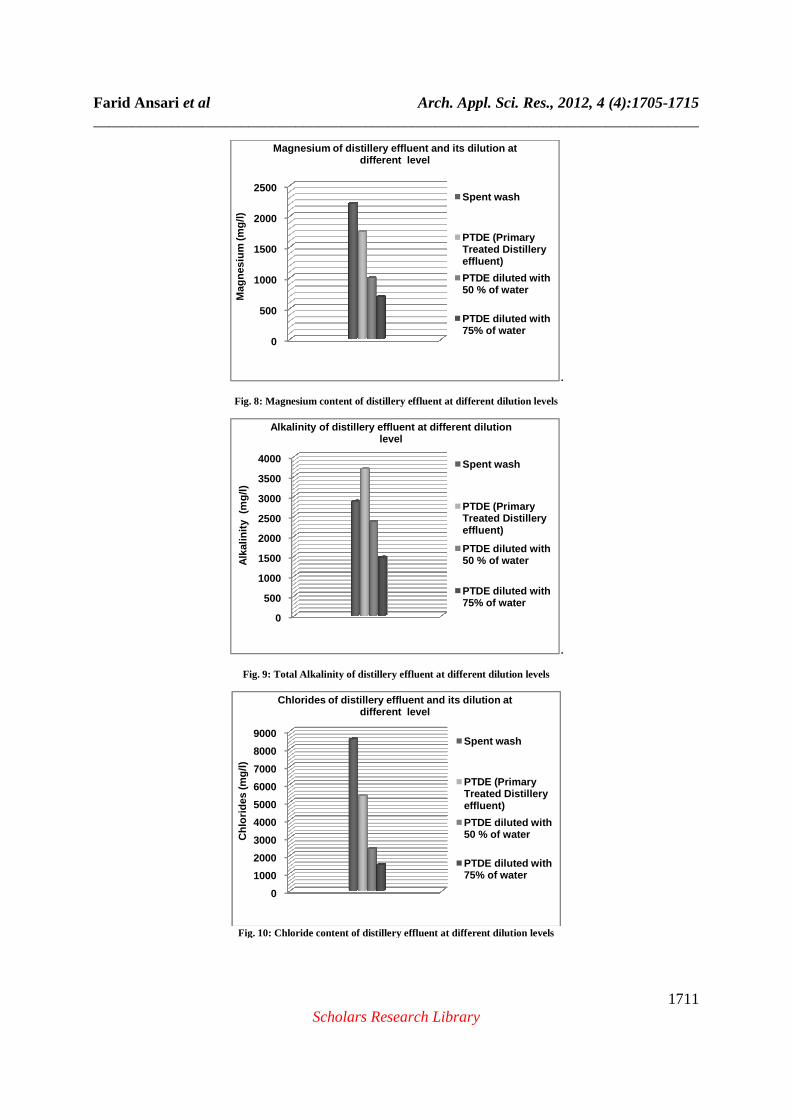
Fig. 8: Magnesium content of distillery effluent at different dilution levels
Fig. 9: Total Alkalinity of distillery effluent at different dilution levels
Fig. 10: Chloride content of distillery effluent at differen
0
500
1000
1500
2000
2500
Mag
nesi
um (m
g/l)
Magnesium of distillery effluent and its dilution a t
0
500
1000
1500
2000
2500
3000
3500
4000
Alk
alin
ity
(mg/
l)
Alkalinity of distillery effluent at different dilu tion
0
1000
2000
3000
4000
5000
6000
7000
8000
9000
Chl
orid
es (m
g/l)
Chlorides of distillery effluent and its dilution a t
Arch. Appl. Sci. Res., 2012, 4 (4):______________________________________________________________________________
Scholars Research Library
Fig. 8: Magnesium content of distillery effluent at different dilution levels
Fig. 9: Total Alkalinity of distillery effluent at different dilution levels
Fig. 10: Chloride content of distillery effluent at different dilution levels
Magnesium of distillery effluent and its dilution a t different level
Spent wash
PTDE (Primary Treated Distillery effluent)
PTDE diluted with 50 % of water
PTDE diluted with 75% of water
0
500
1000
1500
2000
2500
3000
3500
4000
Alkalinity of distillery effluent at different dilu tion level
Spent wash
PTDE (Primary Treated Distillery effluent)
PTDE diluted with 50 % of water
PTDE diluted with 75% of water
Chlorides of distillery effluent and its dilution a t different level
Spent wash
PTDE (Primary Treated Distillery effluent)
PTDE diluted with 50 % of water
PTDE diluted with 75% of water
Arch. Appl. Sci. Res., 2012, 4 (4):1705-1715 ______________________________________________________________________________
1711
.
Fig. 8: Magnesium content of distillery effluent at different dilution levels
.
Farid Ansari et al ______________________________________________________________________________
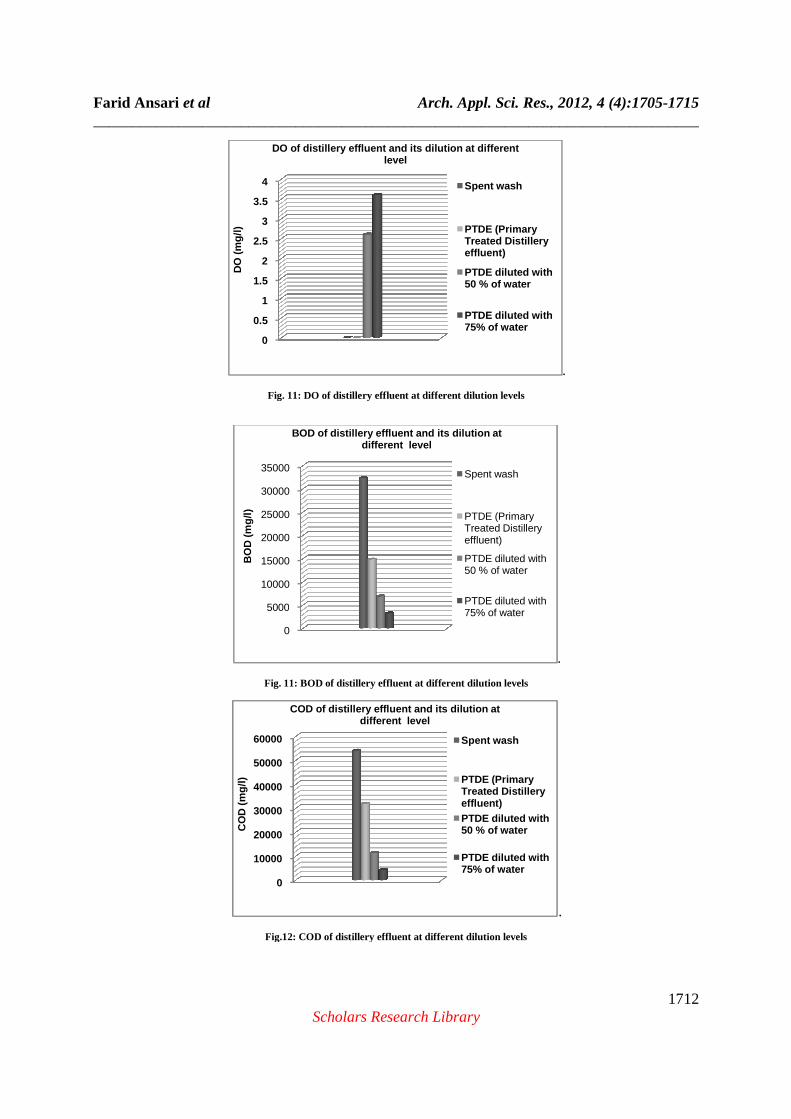
Fig. 11: DO of distillery effluent at different dilution levels
Fig. 11: BOD of distillery effluent at different dilution levels
Fig.12: COD of distillery effluent at different dilution levels
0
0.5
1
1.5
2
2.5
3
3.5
4
DO
(m
g/l)
DO of distillery effluent and its dilution at diffe rent
5000
10000
15000
20000
25000
30000
35000
BO
D (
mg/
l)
0
10000
20000
30000
40000
50000
60000
CO
D (
mg/
l)
Arch. Appl. Sci. Res., 2012, 4 (4):______________________________________________________________________________
Scholars Research Library
Fig. 11: DO of distillery effluent at different dilution levels
Fig. 11: BOD of distillery effluent at different dilution levels
Fig.12: COD of distillery effluent at different dilution levels
DO of distillery effluent and its dilution at diffe rent level
Spent wash
PTDE (Primary Treated Distillery effluent)
PTDE diluted with 50 % of water
PTDE diluted with 75% of water
0
5000
10000
15000
20000
25000
30000
35000
BOD of distillery effluent and its dilution at different level
Spent wash
PTDE (Primary Treated Distillery effluent)
PTDE diluted with 50 % of water
PTDE diluted with 75% of water
0
10000
20000
30000
40000
50000
60000
COD of distillery effluent and its dilution at different level
Spent wash
PTDE (Primary Treated Distillery effluent)PTDE diluted with 50 % of water
PTDE diluted with 75% of water
Arch. Appl. Sci. Res., 2012, 4 (4):1705-1715 ______________________________________________________________________________
1712
.
.
.
Farid Ansari et al ______________________________________________________________________________
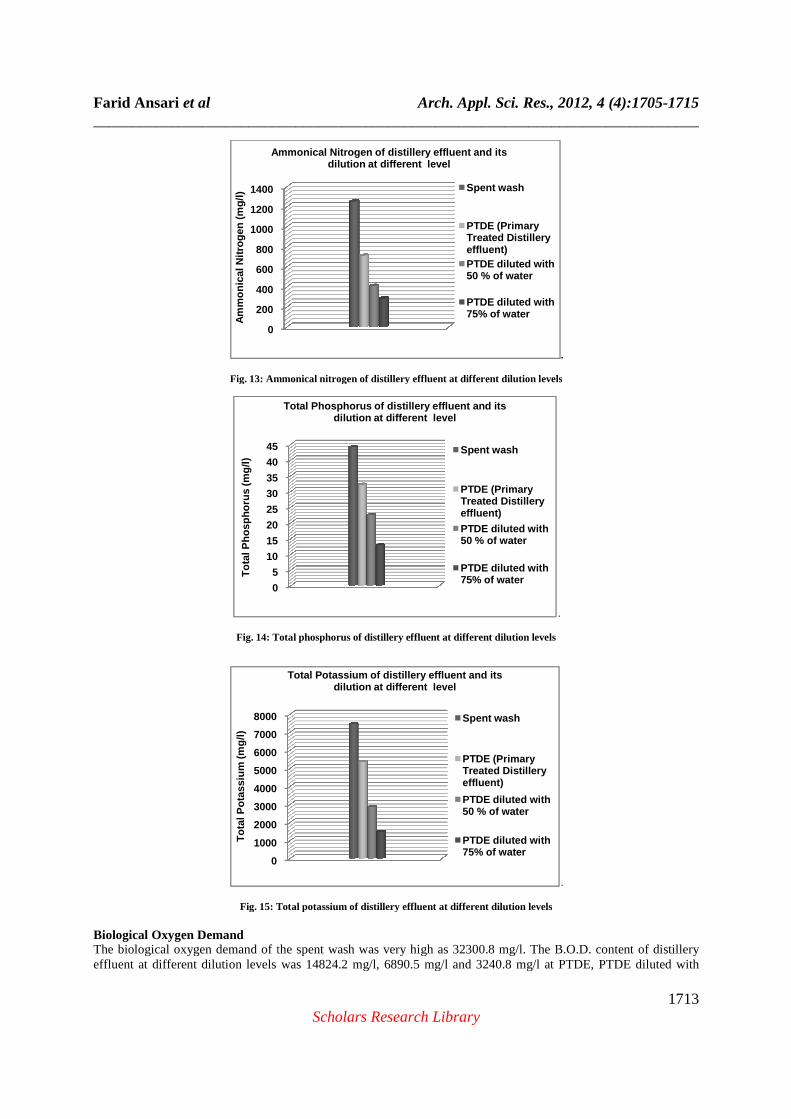
Fig. 13: Ammonical
Fig. 14: Total phosphorus of distillery effluent at different dilution levels
Fig. 15: Total potassium of distillery effluent at different dilution levels Biological Oxygen Demand The biological oxygen demand of the spent wash was very high as 32300.8 mg/l. The B.O.D. content of distillery effluent at different dilution levels was 14824.2 mg/l, 6890.5 mg/l and 3240.8 mg/l at PTDE, PTDE diluted with
0
200
400
600
800
1000
1200
1400
Am
mon
ical
Nitr
ogen
(mg/
l)
Ammonical Nitrogen of distillery effluent and its
0
5
10
15
20
25
30
35
40
45
Tot
al P
hosp
horu
s (m
g/l)
0
1000
2000
3000
4000
5000
6000
7000
8000
Tot
al P
otas
sium
(mg/
l)
Arch. Appl. Sci. Res., 2012, 4 (4):______________________________________________________________________________
Scholars Research Library
Fig. 13: Ammonical nitrogen of distillery effluent at different dilution levels
Fig. 14: Total phosphorus of distillery effluent at different dilution levels
Fig. 15: Total potassium of distillery effluent at different dilution levels
biological oxygen demand of the spent wash was very high as 32300.8 mg/l. The B.O.D. content of distillery effluent at different dilution levels was 14824.2 mg/l, 6890.5 mg/l and 3240.8 mg/l at PTDE, PTDE diluted with
Ammonical Nitrogen of distillery effluent and its dilution at different level
Spent wash
PTDE (Primary Treated Distillery effluent)PTDE diluted with 50 % of water
PTDE diluted with 75% of water
Total Phosphorus of distillery effluent and its dilution at different level
Spent wash
PTDE (Primary Treated Distillery effluent)
PTDE diluted with 50 % of water
PTDE diluted with 75% of water
Total Potassium of distillery effluent and its dilution at different level
Spent wash
PTDE (Primary Treated Distillery effluent)
PTDE diluted with 50 % of water
PTDE diluted with 75% of water
Arch. Appl. Sci. Res., 2012, 4 (4):1705-1715 ______________________________________________________________________________
1713
.
nitrogen of distillery effluent at different dilution levels
.
.
biological oxygen demand of the spent wash was very high as 32300.8 mg/l. The B.O.D. content of distillery effluent at different dilution levels was 14824.2 mg/l, 6890.5 mg/l and 3240.8 mg/l at PTDE, PTDE diluted with
PTDE diluted with
PTDE diluted with
Farid Ansari et al Arch. Appl. Sci. Res., 2012, 4 (4):1705-1715 ______________________________________________________________________________
1714 Scholars Research Library
50% of water and PTDE diluted with 75% of water respectively. The value of BOD decreased with increasing dilution. Chemical Oxygen Demand The chemical oxygen demand of the spent wash was very high as 54164.6 mg/l. The C.O.D. content of distillery effluent at different dilution levels was 32030.2 mg/l, 11448.6 mg/l and 4254.8 mg/l at PTDE, PTDE diluted with 50% of water and PTDE diluted with 75% of water respectively. Ammonical Nitrogen The ammonical nitrogen of the spent wash was 1254.4 mg/l. Similarly result reported that the spent wash contains a very high content of organic nitrogen and nutrients (23). The ammonical nitrogen of distillery effluent at different dilution levels was 714.2 mg/l, 412.3 mg/l and 286.6 mg/l at PTDE, PTDE diluted with 50% of water and PTDE diluted with 75% of water respectively. Total Phosphorus The total phosphorus of the spent wash was 44.4 mg/l. The total phosphorus of distillery effluent at different dilution levels was 32.8 mg/l, 22.4 mg/l and 12.8 mg/l at PTDE, PTDE diluted with 50% of water and PTDE diluted with 75% of water respectively. Total Potassium The total potassium of the spent wash was very high as 7440.2 mg/l. The total potassium content of distillery effluent at different dilution levels was 5360.8 mg/l, 2854.2 mg/l and 1482.0 mg/l at PTDE, PTDE diluted with 50% of water and PTDE diluted with 75% of water respectively.
CONCLUSION
The study reveals that the physicochemical characteristics of spent wash and PTDE (primary treated distillery effluent) have high load of pollutants. The effluent was reddish brown in colour. Odour of samples was alcoholic in nature. It is one of the most complex and cumbersome waste having very high value of solids, electrical conductivity, hardness, calcium and magnesium compounds, chlorides, BOD and COD content and highly acidic pH, while D.O. was found Nil and contains high organic load of nutrient elements such as nitrogen, potassium and phosphorus. When PTDE was diluted with 50% and 75% of water, all the values of physicochemical properties were decreased. The decrease in these values show that the toxicity of distillery effluent decreases with increasing dilution. Thus the characteristics of spent wash and PTDE do not allow its discharge into a water body, hence it requires treatment and dilution before discharge.
REFERENCES
[1] Shin, H.S.; Bae, B.U.; Lee, J.J.; Paik; B.C.,Water Science Technology, 1992, 25 (7), 361-371. [2] Saha, N.K.; Balakrishnan, M. and Batra, V.S., Resource. Conservation Recycling, 2005, 43, 163–174. [3] Jain N, Nanjundaswamy C, Minocha, A, K and Verma C, L., Indian Journal of Experimental Biology, 2001, 39, 490-492. [4] Pant, D. and Adholeya, A., Bioresource Technology, 2007, Vol. 98, pp. 2321-2334. [5] Raghukumar, C.; Mohandass, C.; Kamat, S.; Shailaja, M.S., Enzyme Microbiolog Technology, 2004, 35, 197-202. [6] Rajor, A. Kalia, P and Mathur, R, P., Research Journal Chemistry Environment, 2003, 7(2) 59-75. [7] Joshi, H. C., Pathak, H., Choudhary, A., Kalro, N., Problems and prospects fertilizer News. 1996, 41: 41-47. [8] Ansari, Farid., Awasthi, K. Ajay., Kumar, P. and Mishra, Neelam, International Journal of Applied Environmental Sciences, 2010, Volume 5, Number 5 pp. 741–748. [9] Ramchandra and Pandey, P.K., Indian Journal of Environmental Protection, 2000, 21: 134-137. [10] Vasanthy, M., Thamaraiselvi, C. and Velmurugan, R., Journal of Industrial Pollution Control, 2004, 20 (1) 125-130, Enviromedia. [11] Kumar, Anil., Singh, Yashpal., Joshi, B.D. and Rai, J.P.N., Indian journal of ecology. 2003, 30(1): 7-12. [12] Khan, S.N. and Srivastava, J., International conference on plant and environmental pollution.26-30 November (ICPEP 96) Lucknow, India 1996. [13] Joshi H.C,. Bioenergy News, 1999, 3(3), 10-15.
Farid Ansari et al Arch. Appl. Sci. Res., 2012, 4 (4):1705-1715 ______________________________________________________________________________
1715 Scholars Research Library
[14] Barauah, A.K., Sharma, R.N. and Borach, G.C., Indian journal of Environmental Health. 1993, 35(4): 228-239. [15] Dikshit, P.R. and Khatik, S.K.,. Journal of industrial pollution. Control, 2000, 16(1): 81-93. [16] APHA, AWWA, Standard methods for the examination of water and waste (17) 1995, Washington. [17] Colin, T., Bories, A., Lavigne, C. and Moulin, G., Current Microbiology, 2001 43, 238– 243. [18] Quinn, J. P. and Marchant, R., Water Research, 1980, 14: 545-551. [19] Sheehan, G. J. & Greenfield, P.F., Water Research, 1980, 14, 257-277. [20] Rajeshwari, K, V., Balakrishnan, M., Kansal, A., Lata, K. & Kishore,V, V, N., Renewable Sustainable Energy Reviews, 2000, 4, 135-156. [21] Goodwin, J.A.S., Finlayson, J.M. & Low, E.W., Bioresource Technology, 2001, 78, 155-160. [22] Chidankumar, C. S., Chandraju, S. and Nagendraswamy, R., World Applied Science Journal, 2009, 6 (9): 1270-1273. [23] Ramadurai R, Gearard E,J, SISSTA Sugar Journal, 1994, 20: 129-131.