Embed Size (px)
Citation preview

HAL Id: tel-01080753https://tel.archives-ouvertes.fr/tel-01080753v1
Submitted on 6 Nov 2014 (v1), last revised 7 Mar 2015 (v2)
HAL is a multi-disciplinary open accessarchive for the deposit and dissemination of sci-entific research documents, whether they are pub-lished or not. The documents may come fromteaching and research institutions in France orabroad, or from public or private research centers.
L’archive ouverte pluridisciplinaire HAL, estdestinée au dépôt et à la diffusion de documentsscientifiques de niveau recherche, publiés ou non,émanant des établissements d’enseignement et derecherche français ou étrangers, des laboratoirespublics ou privés.
Characterization of physico-chemical environment ofCo-based multilayer mirrors working in the soft x-ray
and EUV rangesYanyan Yuan
To cite this version:Yanyan Yuan. Characterization of physico-chemical environment of Co-based multilayer mirrors work-ing in the soft x-ray and EUV ranges. Other [cond-mat.other]. UPMC, 2014. English. �tel-01080753v1�

Université Pierre et Marie Curie
Ecole doctorale 388
Laboratoire de Chimie-Physique-Matière et Rayonnement
Characterization of physico-chemical environment of
Co-based multilayer mirrors
working in the soft x-ray and EUV ranges
Par Yanyan YUAN
Thèse de doctorat de Chimie Physique et Chimie Analytique
Dirigée par Philippe Jonnard
Présentée et soutenue publiquement le 02 octobre 2014
Devant un jury composé de :
Dr. Franck Delmotte Rapporteur
Pr. Wanqi Jie Rapporteur
Pr. Jean-Michel Mariot Examinateur
Dr. Claude Merlet Examinateur
Dr. Emmanuel Nolot Examinateur
Dr. Philippe Jonnard (director of thesis)

Acknowledgements
Time always goes by so fast. Three years have passed since I came to Paris. I am very
grateful to many peoples who helped me a lot during my doctoral research life and who made
pleasant my stay in Paris.
I firstly would like to give my sincere thanks to Alain Dubois, director of our lab
LCPMR (Laboratoire de Chimie Physique - Matière et Rayonnement), who accepted me
warmly in the laboratory. I am also very grateful for his help in my daily life.
I am very thankful to my supervisor Philippe Jonnard who helped me many things not
only in research but also in my daily life. His patience and encouragement always give me
confidence during my work. He always corrects very carefully and efficiently everything I
wrote during my Ph.D. work, gives advices and makes useful comments. He taught me the
ability to do independent the research. I am very happy and lucky to work with him not only
for his kind teaching but also for his wide range of knowledge. I give him all my deepest
respect and gratitude.
I would particularly like to give my gratitude to Karine Le Guen, my other supervisor,
who gave me great help for treating data and who corrects carefully the manuscript. Her
kindness and seriousness at work affect me a lot.
I would particularly like to thank Jean-Michel André who made me a lot of useful
suggestions. His encouragement and humor always convey me the message that nothing is
difficult.
I would like to thank all the people who collaborate with our team. Without them I
could not able to obtain so fruitful results and finish my thesis on time. I thank warmly
Zhanshan Wang and Jingtao Zhu, the IPOE (Institute of Precision Optical Engineering,
Tongji Univeristy, China) for the samples and the important suggestions for the study of Co-
based multilayers.
I would like to express my thanks to Christian Mény, from the IPCMS (Institut de
Physique et Chimie des Matériaux de Strasbourg), who helped us to do the NMR
experiments. He made many useful suggestions and interesting discussion. I also give my
special thanks to Corinne Ulhaq, from the IPMCS, for her help doing the TEM experiments
and for useful and fruitful discussions.
I would like to thank Imène Esteve, from the IMPMC (Insitut de Minéralogie et de
Physique des Milieux Condensés, UPMC), who helped us to prepare many FIB samples.
I would like to thank Angelo Giglia, Nicola Mahne and Stefano Nannarone, from the

BEAR beamline at the ELETTRA synchrotron radiation facility (Trieste Italy) for the help
doing the experiments and the data analysis, and for the useful discussions.
I am grateful to my previous supervisor Wanqi Jie, from the Northwest Polytechinical
University in China, who recommended me to the LCPMR. This opportunity is an important
turning point in my life. I also would like to thank him for accepting my PhD work report.
I would like to give my thanks to all the members of the committee for the critical
reading of manuscript. M. Claude Merlet, M. Emmanuel Nolot, M. Franck Delmotte, M. Jean-
Michel Mariot.
Thanks also to all the members of our Lab, LCPMR who give the friendly study
environment. I specially thank: Anzar, Ahmed, Bharati, Cédric, Grégory, Jonathan, Nicolas,
Rajash, Selma, Tatiana, Yuchun, .... All of them gave me great help in my life and make me
have colorful life in Paris.
I give my great thanks to my family, especially my parents who always give me great
supports and confidence. I also thank my husband Shaofeng Zhang who gives me all his love.

I
Contents
Chapter 1 Multilayer mirrors in the soft x-ray and extreme ultraviolet ranges ................ 1
1.1 Soft x-ray and extreme ultraviolet light ........................................................................... 1
1.2 Multilayer mirrors ............................................................................................................ 2
1.2.1 Theory and principle of multilayer mirrors ............................................................... 3
1.2.2 Design of multilayer mirrors for the soft x-ray and EUV ranges .............................. 5
1.3 Applications of multilayer mirrors ................................................................................... 7
1.3.1 Astronomical observation with multilayer mirrors ................................................... 7
1.3.2 Extreme ultraviolet lithography ................................................................................ 8
1.3.3 Photoemission microscope ........................................................................................ 8
1.3.4 X-ray standing wave .................................................................................................. 9
1.3.5 Other applications ..................................................................................................... 9
1.4 Multilayer fabrication ..................................................................................................... 10
1.5 Thermal stability of multilayer mirrors .......................................................................... 11
1.6 Development of tri-layer multilayer optics .................................................................... 12
1.7 Proposal of Co-based multilayers .................................................................................. 13
1.8 Outline ............................................................................................................................ 14
Chapter 2 Analysis techniques .............................................................................................. 15
2.1 X-ray reflectometry in hard x-ray range ........................................................................ 15
2.2 X-ray diffraction (XRD) ................................................................................................. 16
2.3 Reflectivity with synchrotron radiation .......................................................................... 17
2.3.1 Description of the BEAR beamline ......................................................................... 17
2.3.2 Experiments at the BEAR beamline ........................................................................ 17
1) Reflectivity measurements ........................................................................................... 18
2) Rocking curve (off-specular) measurements ............................................................... 18
3) Fluorescence measurement induced by x-ray standing wave ...................................... 19
2.4 Reflectivity with MONOX apparatus ............................................................................ 20
2.5 X-ray emission spectroscopy (XES) .............................................................................. 21
2.5.1 The principle of XES ............................................................................................... 21
2.5.2 Description of IRIS setup ........................................................................................ 22
2.6 Nuclear magnetic resonance (NMR) spectroscopy ........................................................ 24
2.7 Time-of-flight secondary ion mass spectrometry (ToF-SIMS) ...................................... 25
2.8 Transmission electron microscopy ................................................................................. 26
2.8.1 Principle of TEM ..................................................................................................... 26
2.8.2 Preparation of sliced sample ................................................................................... 27

II
2.8.3 Description of the TEM experiments ...................................................................... 28
Chapter 3 Study of Co/Mo2C multilayers ............................................................................ 30
3.1 Investigation of the reflectivity of Co/Mo2C multilayer upon thermal treatment .......... 32
3.1.1 Introduction ............................................................................................................. 32
3.1.2 Experimental details ................................................................................................ 32
3.1.3 Results and discussion ............................................................................................. 33
3.1.4 Conclusions ............................................................................................................. 37
3.2 Evaluation of structure and optical parameters of Co/Mo2C multilayer upon annealing
.............................................................................................................................................. 38
3.2.1 Introduction ............................................................................................................. 38
3.2.2 Results and discussion ............................................................................................. 38
1) Fitting of reflectivity curves ......................................................................................... 38
2) Enhanced Fluorescence by XSW ................................................................................. 41
3) Simulation of the electric field within the multilayer stack ......................................... 43
3.2.3 Conclusions ............................................................................................................. 44
3.3 Observation of the first buried interfaces within Co/Mo2C multilayers studied by soft x-
ray standing wave enhanced photoemission spectroscopy .................................................. 45
3.3.1 Introduction ............................................................................................................. 45
3.3.2 Results and discussion ............................................................................................. 45
3.3.3 Conclusions ............................................................................................................. 51
3.4 Interface analysis of heat-treated Co/Mo2C multilayers ................................................ 52
3.4.1 Introduction ............................................................................................................. 52
3.4.2 Experimental methods ............................................................................................. 52
3.4.3 Results and discussion ............................................................................................. 53
1) X-ray emission spectroscopy ....................................................................................... 53
2) Zero-field nuclear magnetic resonance spectroscopy .................................................. 54
3) X-ray diffraction .......................................................................................................... 55
4) Time of flight-secondary ions mass spectroscopy ....................................................... 56
5) Transmission electron microscopy .............................................................................. 59
3.4.4 Discussion ............................................................................................................... 60
3.4.5 Conclusions ............................................................................................................. 63
Chapter 4 Study of Co/Mo2C/Y multilayers ........................................................................ 64
4.1 Optical and structural characterization of the Co/Mo2C/Y system ................................ 66
4.1.1 Introduction ............................................................................................................. 66
4.1.2 Experimental details ................................................................................................ 66
4.1.3. Results and discussion ............................................................................................ 67
1) X-ray reflectometry at 0.154 nm .................................................................................. 67
2) Extreme ultra-violet reflectivity with synchrotron radiation ....................................... 69

III
3) Zero-field nuclear magnetic resonance spectroscopy .................................................. 72
4) X-ray diffraction .......................................................................................................... 73
4.1.4 Discussion ............................................................................................................... 74
4.1.5 Conclusions ............................................................................................................. 76
4.2 Transmission electron microscopy observation of Co/Mo2C/Y system ........................ 78
4.2.1 Introduction ............................................................................................................. 78
4.2.2 Experimental details ................................................................................................ 78
4.2.3 Results and discussion ............................................................................................. 78
1) Scanning transmission electron microscopy ................................................................ 78
2) In-depth intensity profiles ............................................................................................ 80
3) Energy dispersive x-rays spectrometry (EDS) ............................................................. 83
4) High-resolution images and selected-area electron diffraction ................................... 85
4.2.4 Conclusions ............................................................................................................. 89
Chapter 5 Conclusions and perspectives .............................................................................. 90
Appendix І: Miedema’s model .............................................................................................. 92
References ........................................................................................................................... 94
Appendix П: other publications .......................................................................................... 100


Chapter 1 Multilayer mirrors in the soft x-ray and extreme ultraviolet ranges
1
Chapter 1 Multilayer mirrors in the soft x-ray and extreme ultraviolet
ranges
Multilayer mirrors consisting of two materials with high and low atomic numbers are
studied since a long time. They are used in space telescopes, x-ray microscopes, extreme
ultraviolet (EUV) photolithography, synchrotron radiation beamlines, electron microprobes
and so on. The physico-chemical environment of the multilayer interfaces plays an important
role in the optical applications. Interdiffusion and formation of compounds at the interfaces
could degrade the optical performance of multilayer mirrors. Therefore in this thesis we study
the optical performance and interface properties of Co-based multilayers upon annealing by
combining non-destructive and destructive methods.
1.1 Soft x-ray and extreme ultraviolet light
X-rays are invisible by human eyes and have shorter wavelength (higher energy) than
visible light. Figure 1.1 shows the portion of the electromagnetic spectrum extending from the
infrared to the x-ray region. The EUV extends from the photon energy of about 30 eV to
about 250 eV; the soft x-rays range extends from the about 250 to several keV. These spectral
regions cover the main atomic absorption edges of some low and intermediate atomic number
elements. For example, the C K, O K, Co L, Si K edges are located in the EUV and soft x-ray
ranges. This makes the x-rays a sensitive tool for elemental and chemical identification.
Figure 1.1 Electromagnetic spectrum from the infrared to the x-ray region.
Soft x-ray and EUV rays, owing to their short wavelength, can be used to see small
structures as in optical microscopy and also to write smaller patterns as in photolithography.
Light sources such as synchrotron radiation facilities and free electron lasers are high
brightness source. However this in turn requires high quality optics to develop their beamlines.

Chapter 1 Multilayer mirrors in the soft x-ray and extreme ultraviolet ranges
2
1.2 Multilayer mirrors
In the soft x-ray and EUV ranges, the refractive index of all the materials is close to
one; all the materials have very low reflectivity excepting at very grazing angle (total external
reflection). For example, at the wavelength of 30 nm the reflectivity of a single layer at
normal incidence is the order of 10-2
and it decreases rapidly at shorter wavelengths. In order
to manipulate soft x-ray and EUV light, we need to use special optical elements. Conventional
optical elements, such as lenses or single thin layer coated mirrors (single reflection), cannot
meet the requirement of the high reflectivity at normal incidence. An exception for achieving
high reflectivity is the total external reflection of the x-rays at very grazing incident angle. But
the shortcoming of these optics is their low luminosity. Otherwise their application is limited
in the range of short wavelengths.
A multilayer mirror can provide high reflectivity based on the diffraction principle. It
can be described as an analogy of single crystal. The multilayer mirror can meet the
requirements of some application wavelength in the soft x-ray and EUV ranges by adjusting
the period thickness. Figure 1.2 shows a scheme of a multilayer mirror. It is a periodic stack
of layers consisting of at least two alternating materials, in which one material has a high
atomic number as an absorber and the other has low atomic number as a spacer. Multilayer
mirror reflectivity derives from the interference of x-rays coherently scattered from the
interfaces between the constituent materials. In this structure, the incident beam is reflected at
interface, while the rest penetrates deeper into the stack and is partly reflected at other
interfaces. All partly reflected coherent beams interfere with each other. If for example at
normal incidence the optical thickness (the product of the refractive index and the geometrical
thickness) of all the layers, when not taking into account the absorption, is exactly equal to a
quarter of the wavelength of the incoming light (“quarter-wave stack”), all the beams add up
constructively and a high reflectivity can be obtained.
Figure 1.2 Scheme of a multilayer mirror.
Chapter 1 Multilayer mirrors in the soft x-ray and extreme ultraviolet ranges
3
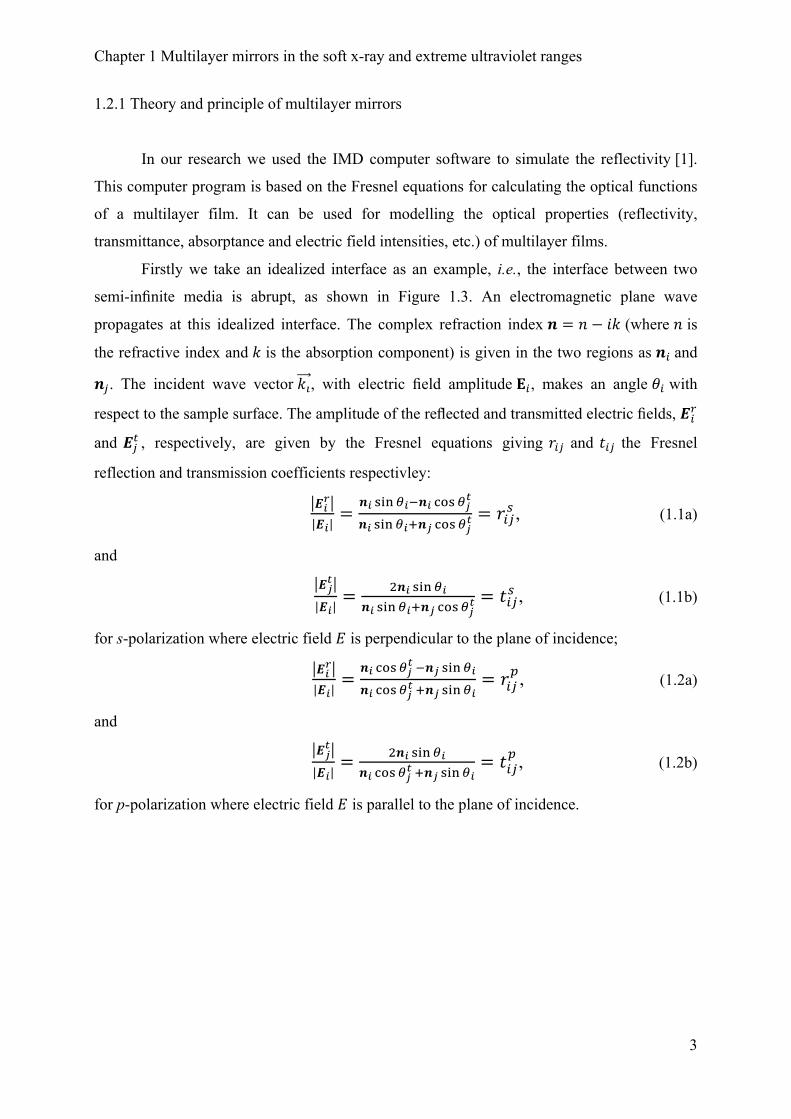
1.2.1 Theory and principle of multilayer mirrors
In our research we used the IMD computer software to simulate the reflectivity [1].
This computer program is based on the Fresnel equations for calculating the optical functions
of a multilayer film. It can be used for modelling the optical properties (reflectivity,
transmittance, absorptance and electric field intensities, etc.) of multilayer films.
Firstly we take an idealized interface as an example, i.e., the interface between two
semi-infinite media is abrupt, as shown in Figure 1.3. An electromagnetic plane wave
propagates at this idealized interface. The complex refraction index ! = ! − !" (where ! is
the refractive index and ! is the absorption component) is given in the two regions as !! and
!!. The incident wave vector !!, with electric field amplitude !!, makes an angle !! with
respect to the sample surface. The amplitude of the reflected and transmitted electric fields, !!!
and !!! , respectively, are given by the Fresnel equations giving !!" and !!" the Fresnel
reflection and transmission coefficients respectivley:
!!
!
!!
=!! !"#!!!!! !"#!!
!
!! !"#!!!!! !"#!!!= !!"
! , (1.1a)
and
!!!
!!
=!!! !"#!!
!! !"#!!!!! !"#!!!= !!"
! , (1.1b)
for s-polarization where electric field ! is perpendicular to the plane of incidence;
!!
!
!!
=!! !"#!!
!!!! !"#!!
!! !"#!!!!!! !"#!!
= !!"!
, (1.2a)
and
!!!
!!
=!!! !"#!!
!! !"#!!!!!! !"#!!
= !!"!
, (1.2b)
for p-polarization where electric field ! is parallel to the plane of incidence.

Chapter 1 Multilayer mirrors in the soft x-ray and extreme ultraviolet ranges
4
Figure 1.3 Diagram of a plane wave incident at the interface between two materials with
different refractive indices.
We now consider a plane wave incident on a multilayer stack with a period thickness
of d. There is a series of N layers (N+1 interfaces), where the ith
layer has thickness di, optical
constant !!, as shown in Figure 1.4. The vacuum and the substrate have the optical constants
!! and !!, respectively.
Figure 1.4 Diagram of a multilayer stack with period thickness of d containing N layers,
where the optical constants, the thickness and the propagation angles of the ith
layer are !!, !!,
and !!, respectively. The ambient (i.e., the region above the film) has optical constants !! and
the substrate has optical constants !!.
The net reflection !! and transmission coefficient !! of the ith
layer are given by:
!! =!!"!!!!
!!!!
!!!!"!!!!!!
!, (1.3a)
!! =!!"!! !
!!!!
!!!!"!!!!!!
!, (1.3b)
where !! = 2!!!!! sin!! /!, and !!" and !!" are given by the equations (1.1) and (1.2). Thus,
the procedure to compute the net reflection (r) and transmission (t) coefficients for the

Chapter 1 Multilayer mirrors in the soft x-ray and extreme ultraviolet ranges
5
multilayer stack is to use equations (1.3) recursively, starting at the bottom-most layer, i.e.,
i=N, j=s. The reflectivity R for the whole multilayer structure is given by:
! = !!! (1.4)
In the simulation, interface imperfections (interdiffusion and interface roughness) can
be taken into account. Interface quality of multilayers is an important factor for the optical
performance of multilayer mirrors.
Here we give one example: the reflectivity of a Co/Mo2C multilayer with 30 bilayers
of 4.10 nm period thickness, which will be studied in this thesis. We suppose that the
interfaces between layers are ideal, i.e. no interdiffusion and interlayers. The roughness of the
substrate is assumed to be 0.50 nm. The calculated reflectivity as a function of grazing angle
with s-polarization at the wavelength of 1.59 nm is shown in Figure 1.5. As we can see the
value of reflectivity is about 45% at the grazing angle of 11°. In addition we can also make
simulation of the reflectivity as a function of photon energy, parameters of each layer and
period.
Figure 1.5 Calculated reflectivity of a Co/Mo2C multilayer with s-polarization at the
wavelength of 1.59 nm.
1.2.2 Design of multilayer mirrors for the soft x-ray and EUV ranges
In multilayer mirrors, if we neglect the refraction effect, maximum of reflectivity
occurs when its period d satisfies the general Bragg law:
2! sin! = !" (1.5)
where p is an integer, ! the wavelength of incidence beam, d the period thickness within the
multilayer, ! the angle between the incident beam and sample surface. In order to achieve
high reflectivity of a multilayer mirror in the soft x-ray and EUV ranges, the selection of

Chapter 1 Multilayer mirrors in the soft x-ray and extreme ultraviolet ranges
6
materials and matching of material pairs in one period is critical. In the case of normal
incidence, the thickness of the individual layers should be equal to half of the period thickness
without taking into account absorption. When taking into account the absorption, the
thickness of the most absorbing layer should be reduced to improve the reflectivity in the
premise of keeping the period thickness constant.
In 1972, Spiller built a multilayer structure which consisted of two materials with
different refractive indices, in which one is the spacer and one is the absorber [2]. The basic
design idea is to locate the stronger absorber in very thin layers into the nodes of desired wave
field which is generated within the periodic structure and fill the remaining space with a
material with very low absorption. A reasonable reflectivity higher than 25% was obtained in
the range 5-50 nm. Since then a lot of research works have been done for the design and
improvement of reflectivity of multilayer mirrors. In 1992, Yamamoto et al. reported an
optical criterion for selecting a proper pair of materials for designing a multilayer with high
reflectivity [3]. This method can provide an effective means for attaining the absolute
maximum reflectance on a layer-by-layer basis and also give clear insight into the evolution
of the amplitude reflectance of a multilayer. In 2001, Larruquert proposed a general theory of
sub-quaterwave multilayers for more than two materials with highly absorbing materials to
improve the reflectance of the multilayer mirror [4]. His theory provides an accurate approach
for designing a new concept of multilayer mirrors with more than two materials. Since then,
the design theory for multilayer in the soft x-ray and EUV has been developed by
Larruquert [5–10].
The multilayer mirrors can meet the requirements of the different application
wavelengths by adjusting the period thickness. In designing multilayer mirrors an important
parameter is the ratio Г of high Z (atomic number) material thickness !! to the total period
! = !! + !!, !! is the thickness of the low Z material.
H
H L
d
d dΓ =
+ (1.6)
In general the best case is when the low Z material acts simply as a “spacer”, with as
little absorption as possible. In fact, the optical constants of the low Z material should be as
small as possible to provide the greatest refractive index contrast with respect to that of high Z
material. To obtain strong enough scattering, we can minimize the absorption by reducing the
thickness of the high Z layer to have the large optical contrast. Vinogradov has found, for
normal incidence, an optimized value Γ!"#
given by [11]
Chapter 1 Multilayer mirrors in the soft x-ray and extreme ultraviolet ranges
7
tan( ) Lopt opt
H L
k
k kπ π
⎡ ⎤Γ = Γ +⎢ ⎥
−⎣ ⎦ (1.7)
where Lk and
Hk represent the absorptive components of refractive index for the low (L) Z
and high (H) Z materials, respectively.
1.3 Applications of multilayer mirrors
Multilayer mirrors have the great advantage of being adaptable to curved surfaces,
enabling their use as reflective optics in soft x-ray and EUV microscopes and telescopes. In
addition they provide a modest well-defined spectral bandpass with a relatively high
throughput, which open up many additional applications. Mo/Si multilayers, as a widely
studied structure, have been used successfully in a number of satellite instruments [12,13]
over the past years to provide high reflectance in the 13-30 nm wavelength range. In the
following we will give some examples of application of multilayer mirror in scientific
research and industry.
1.3.1 Astronomical observation with multilayer mirrors
Multilayer mirrors working at normal incidence have been used to obtain high-
resolution astronomical images. The images of the Sun and the solar corona obtained at
nominal 17.3 nm wavelength are presented in Fig 1.6 (a) and (b). They were obtained using a
rocket-launched Cassegrain telescope with Mo/Si-coated mirrors [14,15] and Mo2C/Si
multilayer mirrors. The advantages of multilayer mirrors for solar observations are
summarized as follows: (1) compared to grazing incidence optics, normal incidence
multilayer mirrors have lower scattering, suffer less from geometrical aberrations, are less
expensive to fabricate and easier to mount and align, and can be made more compact.
Consequently, it is possible to approach the resolution limit imposed by diffraction for such
systems. The combination of filled apertures and high reflection efficiencies provides high
sensitivity optical systems in a compact package. (2) The compact nature and the low cost of
multilayer telescopes capable of high resolution observation permit the use of multiple
telescope and therefore the observation of plasma over a broad range of temperatures, even in
a compact rocket borne instrument package. (3) The spectral resolving capability of
multilayer mirrors is a powerful analytical tool [16]. Hence the multilayer mirrors provide a
powerful diagnostic tool capable of achieving high spatial resolution, broad wavelength
coverage, and moderate spectral resolution.

Chapter 1 Multilayer mirrors in the soft x-ray and extreme ultraviolet ranges
8
(a) (b)
Figure 1.6 EUV images of the Sun (a) and of solar flare (b) at the wavelength of 30.4 nm.
1.3.2 Extreme ultraviolet lithography
Lithography is a technique widely used in the semiconductor industry to copy patterns
for manufacturing processors and memory devices for modern computing systems.
Photolithography systems have progressed from blue wavelengths (436 nm) to UV (365 nm)
to deep-UV (248 nm) to today’s mainstream high-resolution wavelength of 193 nm. The
appearance of multilayer mirrors provides the capability of decreasing the critical dimension
in high volume manufacturing. The advantage of EUV is the continuation of optical
techniques at a significantly reduced wavelength, permitting the achievement of small feature
size with modest numerical aperture and large depth of focus. Up to now the wavelength in
13.5 nm is realized by the Mo/Si multilayers which have obtained the reflectivity of order
70% [17].
1.3.3 Photoemission microscope
A photoemission microscope is a valuable tool, which combines high spectral and
spatial resolutions, to measure surface composition, including elemental concentration and
chemical bonding of heterogeneous surfaces. In a photoemission microscope equipped with a
multilayer mirror, the emission of photoelectrons is caused by focusing photons of specified
energy onto a sample. This kind of multilayer optical system is known as a Schwarzschild
objective [18]. The Mo/Si (photoemission at 91.8 eV) and Ru/B4C [19] (photoemission at
130 eV) multilayer mirrors have already been employed.

Chapter 1 Multilayer mirrors in the soft x-ray and extreme ultraviolet ranges
9
1.3.4 X-ray standing wave
An x-ray standing wave (XSW) is formed by the superposition of two coherent plane
waves. The XSW technique is in essence an x-ray interference technique. Within the wave
field, x-ray intensity is spatially modulated. Knowing the exact pattern and position of an x-
ray interference field and being able to manipulate it in space, information about the real
space distribution of inelastically scattering objects can be obtained. In the case of atomic
distributions, which are the most important application of the XSW technique, the photo-
absorption or subsequent decay channels (such as photoelectrons, Auger electrons, and x-ray
fluorescence) serve as marker signals upon shifting the wave field in space. A strong signal
indicates that the maxima of the wave field are on atomic positions in the crystal [20].
Based on the above description, the XSW is becoming a potential technique for
studying the buried nanometre scale interfaces as it is non-destructive. It can be used to
determine the position of impurity atoms within a single crystal or adsorbed onto a crystal
surface. The conventional method for generating XSW is to use dynamical Bragg diffraction
from perfect crystals. This technique has proven to be very accurate in determining the
distance separating adsorbate atoms from the surface-bulk-lattice atoms. However, the XSW,
generated by the reflection of an x-ray beam from a periodic multilayer, can be used to
accurately locate a layer of heavy atoms embedded in a low-Z thin film, which is deposited on
the periodic multilayer [21]. Yang et al. have studied the Fe/Cr interfaces deposited on the top
of a B4C/W multilayer by using the XSW generated by the B4C/W multilayer. They pointed
out that this standing wave-plus-wedge would have a range of applications for the
characterization of nanostructures and their interfaces [22].
In this thesis, we will present XSW results on the Co-based multilayers. We will study
the first buried layer and interface properties of the Co/Mo2C multilayers by using x-ray
fluorescence and photoelectron and fluorescence spectroscopies respectively.
1.3.5 Other applications
Now the multilayer mirrors are used in the synchrotron radiation and free electron
laser beam beamlines. They are exposed in vacuum to high-intensity extreme ultraviolet or
soft x-ray radiation. In particular the development of free electron lasers puts forward to the
high requirement for multilayer optics. High power load can induce interdiffusion at the
interfaces and degrade the optical performance of multilayer mirrors. The stability of sharp
interfaces upon time is vital for maintaining the reflectivity. This will be described in the

Chapter 1 Multilayer mirrors in the soft x-ray and extreme ultraviolet ranges
10
Section 1.5. Furthermore, other applications (plasma diagnostic, polarization studies of
magnetic materials, x-ray microprobe) can be realized by the development of multilayer
optics.
1.4 Multilayer fabrication
The quality of interfaces is the most important parameter for the performance of
multilayer optics. The limit on the quality of interfaces is determined by the size of the atoms.
Perfect interface would require that the growth of one atomic plane start only when the
previous plane is completely filled. The accurate control of the period and the quality of the
each layer are of major importance for the optical properties. This requires a good control of
the fabrication techniques used for depositing the multilayers.
Three fabrication techniques are widely used to deposit multilayer mirrors: ion beam
sputtering [23], electron beam evaporation [24–27] and magnetron sputtering [28,29]. Among
them, magnetron sputtering technique is commonly used as if has proved to be successful for
preparing multilayer thin films. This technique allows the deposition of metals, alloys,
ceramic and polymer thin films. There are two types of sputtering: direct current (DC) and
radio frequency (RF) sputtering. DC magnetron sputtering is usually used to deposit the
conductive materials and RF magnetron sputtering for the deposition of conductors,
semiconductors and insulating materials. During the sputtering, a magnetic field is applied
around the target to enhance the efficiency of the initial ionization process. It can generate
plasma at lower pressures which reduces both background gases incorporation in the growing
film and energy losses in the sputtered atom through gas collisions. Furthermore, the
advantages of accurate control of thickness for each layer and growth of smooth interfaces
make it an excellent method for improving the quality of thin film within the multilayers.
Ogura et al. have compared these fabrication techniques by taking Mo/Si multilayer thin film
as an example and found that best reflectivity is obtained by using the radio-frequency
magnetron sputtering [30]. In 2002, Bajt et al. reported a reflectivity of 70% for the Mo/Si
multilayer deposited by the magnetron sputtering [17]. Many materials and multilayers have
been successfully deposited using this method [31–37]. All samples in our work are deposited
by DC magnetron sputtering technique in Tongji university of China.
The instrument has two vacuum chambers which are separated by a valve. One is the
depositing chamber, the other one for transferring samples. When depositing the multilayer
thin film, the targets are mounted at the bottom and the substrates are placed above the targets.

Chapter 1 Multilayer mirrors in the soft x-ray and extreme ultraviolet ranges
11
The working gas is argon with the purity of 99.999%. In the sputtering process, the substrate
was rotated and kept to be above of different targets with different exposure times until the
deposition of the desired multilayer thin film structure.
1.5 Thermal stability of multilayer mirrors
We have mentioned in section 1.2 that the high reflectivity of multilayer optics
requires a high optical contrast between layers, minimal absorption in the low-Z material and
thin high-Z layer (thin absorber layer). In addition, the interface properties between layers
play an important role during application. Namely when the multilayer mirrors are used at
synchrotron radiation or free electron laser facility, they need to endure high photon fluxes
and long working time. Therefore it is necessary to study the physico-chemical environment
of interfaces in the multilayer structure to improve optical performance. The following
requirements are necessary for achieving good optical performance: interfaces which are
chemically stable with time, present minimal interdiffusion, minimal interfacial roughness (no
crystallite formation within the layers), thermal stability during illumination and uniform
coating thickness. In the following we will discuss the research progress about interface
properties in the multilayer optics.
As a classic example, the thermal stability of the Mo/Si multilayers used in the EUV
range has been widely studied [26,38–42]. Moreover the Mo/Si multilayers are expected to
show a rapid degradation under EUV exposure. The reasons for causing a decrease of the
optical contrast in the multilayers are due to the oxidation of surface, interdiffusion and
formation of compounds at the interfaces. The basic physics about the evolution of
interfacical structure upon the thermal treatment have also been studied by many researchers.
Bajt et al. reported a transition from amorphous to crystalline of the Mo layer as a function of
its thickness [23]. It was found that the Mo layer structure is amorphous when the thickness is
less than 2 nm, while it is polycrystalline when thicker than 2 nm. In 2002, Yulin et al.
reported that the interlayer transition zones existed in the Mo/Si multilayer and proposed a
model for explaining a transition from asymmetrical to symmetrical for these interlayers. In
that model, they pointed out that the formation of interlayer transition zones at the Mo-on-Si
interface is controlled by the surface diffusion of Si atoms on the growing Mo surface layers,
and at the Si-on-Mo interface the interlayer transition zones formation is determined by the
diffusion of Si atoms in textured Mo grains [43].

Chapter 1 Multilayer mirrors in the soft x-ray and extreme ultraviolet ranges
12
Based on amount of studies about interdiffusion mechanism, researchers have also
studied how to reduce the interdiffusion during deposition and upon thermal treatment for
improving the thermal stability. The use of heating substrate to 150 or175°C during
deposition is reported for smoothing the interfaces and leading to the enhancement of
reflectivity [24]. Addition of inactive material, such as C and B4C, into the Mo/Si multilayer
have also improved the thermal stability [25,41,44,45]. Braun et al. have compared the Mo/Si
multilayers with and without C and B4C barrier layers prepared with pulsed laser deposition
and magnetron sputtering [46]. With B4C and C barrier layers at the interfaces, interdiffusion
was reduced. The resulting EUV reflectivity was improved up to 69.8% (λ=13.42 nm, α=1.5°)
and 71.4% (λ=12.52 nm, α=22.5°).
1.6 Development of tri-layer multilayer optics
Bi-layer multilayers have been studied for many years and some of them have
achieved high optical performances in the soft x-ray and EUV ranges as well as good thermal
stability. However, the highest theoretical reflectance of multilayer mirrors is limited because
of the absorption of materials over these spectral regions. Tri-layer multilayers, resulting from
the addition of a third layer into bi-layer [33,37,47,48], were proposed with the aim of
improving the optical performance and thermal stability. Firstly for the theoretical calculation,
in 2002 Larruquert proposed sub-quarterwave multilayer mirrors with more than two different
materials that exhibit a remarkable reflectivity enhancement [47]. It is reported that the
highest possible reflectivity is obtained by selecting the most suitable materials arranged in
the correct sequence. Some kinds of examples illustrate the benefit of sub-quarterwave
multilayer coatings for high reflectance in the EUV range. Meltchakov reported that the Al-
based tri-layer multilayers Al/Mo/SiC and Al/Mo/B4C, have a normal incidence reflectance of
55% at 17 nm, 50% at 21 nm, 42% at 30 nm. Moreover the introduction of the stable
materials C and B4C reduces the interfacial roughness [49]. Furthermore, Gautier et al. have
experimentally demonstrated the reflectivity enhancement with tri-layer B4C/Mo/Si
multilayers [50].
In addition to the enhancement of reflectance of multilayer with a third layer inserted
into two layers in one period, there are other purposes for the multilayer, such as enhancement
of stability and distinction of different interfaces behaviour upon thermal treatment. The
former one was demonstrated by the introduction of B4C into the Mo/Si multilayer for
improving the thermal stability [41]. The latter has also been demonstrated to be effective for
Chapter 1 Multilayer mirrors in the soft x-ray and extreme ultraviolet ranges
13
discerning the interface behaviour in some multilayers. For example, in the case of the Mg/Co
multilayer with an insertion of Zr material as a third layer, the reflectance increases up to 50%
from the original value of 42.6% and an asymmetrical effect was observed: sharp Zr-on-Co
interface and intermixing Co-on-Zr interface [37,48].
Yttrium is a promising material for application in the multilayer and can provide good
thermal stability. Indeed, Bosgra has reported that a 0.2 nm thick Y layer significantly reduces
the silicon diffusion towards Mo in the B4C/Mo/Y/Si system [51]. A theoretical study of the
Y-based multilayers, for example, Pd/Y, Ag/Y, Mo/Y, Nb/Y, has shown that the combination
of yttrium and these materials could give normal incidence peak reflectivity ranging from 50%
to 65% in the 8-13 nm range [52]. The study of Mo/Y multilayer demonstrated that this stack
is stable up to 400°C [53].
In this thesis, tri-layer systems with an insertion of Y material into Co/Mo2C system
are designed to work in the EUV range at near normal incidence. This is based on the study of
bi-layer Co/Mo2C multilayers, for which we cannot distinguish the effect of Co-on-Mo2C and
Mo2C-on-Co interfaces on the reflectivity. After the insertion of Y materials, the theoretical
reflectance is improved up to 54% from 45% (bilayer multilayers).
1.7 Proposal of Co-based multilayers
Most multilayer systems cannot attain the reflection and resolution requirements given
by simulation because of the interdiffusion and chemical reaction between two adjacent layers
and large roughness of each layer. Some strategies have been used to prevent the
interdiffusion (mentioned in section 1.6). However, sometimes this is accompanied by a
decrease of reflectivity [54]. Therefore it is necessary to find out suitable materials for making
an efficient combination and carry out the systematic analysis of the interfaces in the
multilayers for EUV and soft x-ray ranges.
Co is an appropriate material for interface studies since it can form sharp interface
with a number of materials, for example, Mg, C, Mo, Zr and B4C. In addition, its promising
optical performance has been confirmed by the Co/Mg system [36]. Furthermore, the melting
point of Co is high (1768 K) and thus can stay up in a harsh working environment such as
synchrotron beamlines or space environment. Moreover, the low price of Co makes it easily
available.

Chapter 1 Multilayer mirrors in the soft x-ray and extreme ultraviolet ranges
14
As Co is a ferromagnetic material, Co-based multilayers can be analysed by magnetic
techniques, i.e. magneto-optical Kerr effect and nuclear magnetic resonance spectroscopy
(NMR). Such studies can help us to understand the Co atom behaviour in the multilayer.
This work aims not only at designing and fabricating new optical elements to face
development of sources and applications in the EUV and soft x-ray ranges, but also at
developing a methodology devoted to the analysis of interface in these multilayer structures in
order to improve their optical properties by combining simulations and experiments. We also
expect to prepare new Co-based multilayers with not only outstanding optical properties but
also good stability in some harsh working environment.
We firstly design the Co/Mo2C multilayers working in the soft x-ray range at grazing
incidence and study their thermal behaviour upon annealing up to 600°C for one hour. We use
some non-destructive methods to characterize the optical and structural properties. The
reflectivity data in the hard x-ray range (0.154 nm) are used to obtain the structural
parameters (thickness, density and interface roughness of each layer), the reflectivity data
obtained in the soft x-ray range (1.59 nm) are being used to obtain the interface structure. X-
ray emission spectroscopy and x-ray diffraction combined to calculation of enthalpy of
intermixing are used to explain the interface behaviour upon the annealing. Then we introduce
a third material (Y) into the bi-layer Co/Mo2C multilayer to discern the Co-on-Mo2C and
Mo2C-on-Co interface effects on the optical performance. The theoretical reflectivity is foun
to be enhanced up to 54% (original 45%). The same characterization methods are used on the
tri-layer systems.
1.8 Outline
The contents include five chapters in this thesis. Chapter 1 introduces the research
background of multilayer mirrors. Chapter 2 describes the characterization techniques non-
destructive and destructive methods related to the study of optical performance and of
interface properties of the multilayer stack. We will introduce some. Chapter 3 is about the
study of Co/Mo2C multilayers. The studies of tri-layer Co/Y/Mo2C systems are discussed in
the chapter 4. Chapter 5 summarizes the whole research results and draws attention to future
research.

Chapter 2 Analysis techniques
15
Chapter 2 Analysis techniques
In this chapter we will present the main characterization methods used in our work. Basic
principle of each technique and description about experiments as well as setup will be
presented.
2.1 X-ray reflectometry in hard x-ray range
X-ray reflectometry (XRR) is a non-destructive and non-contact technique for
thickness determination between 2-200 nm with a precision of about 0.1-0.3 nm. This method
can also be employed to determine the roughness of thin films and the density of a material
which is calculated from the electron density. The principle of x-ray reflectometry setup is
shown in Figure 2.1. An x-ray tube produces x-rays; a monochromator gives a
monochromatic light; a slit is mounted after it collimates the light beam. A slit is also
mounted before the detector for minimizing the aberration. In XRR measurements the
intensity of the x-ray beam reflected by a sample as a function of the grazing angle is
monitored. The mode of operation is θ-2θ mode in which the incident angle is always half of
the diffraction angle, i.e., the specular reflection condition is satisfied. The reflectivity, which
is defined as a ratio between the intensity of reflected beam and that of incident beam, is
related to the value of refractive index and x-ray wavelength. Structural parameters of
multilayers can be obtained by fitting the reflectivity data. Informations provided by the x-ray
reflectivity curves are shown in Figure 2.2. From the reflectivity curves, we can obtain
information on the thickness, the density and the roughness of each layer.
Figure 2.1 XRR reflectometry setup.

Chapter 2 Analysis techniques
16
Figure 2.2 Informations provided by the x-ray reflectivity profile.
In this work, all the hard x-ray reflectivity measurements were performed with Cu Kα
emission line (0.154 nm, 8048 eV) in Tongji University (China) with a reflectometer. The
incident beam is monochromatized with a Si (220) crystal. The angular resolution is 5/1000°.
The reflected beam travels through two slits and the photons are counted by a scintillation
detector. The alignment is checked for each sample. After that we performed the fitting of
reflectivity curves with Bede Refs software (genetic algorithm) [55] to estimate the thickness
of individual layer and interface roughness as well as density of materials.
2.2 X-ray diffraction (XRD)
X-ray diffraction as a non-destructive technique is commonly used to determine the
structural properties of solid materials. Diffraction effects are observed when electromagnetic
radiation impinges on periodic structures with geometrical variations on the length scale of
the wavelength of the radiation. The interatomic distances in crystals and molecules amount
to 0.15-0.4 nm which correspond in the electromagnetic spectrum at of x-rays having photon
energies between 3 and 8 keV. Analysis of diffraction peak can provide the following
information: identification of compound or phase, crystallinity, strain, crystallite size,
orientation.
In this work all the XRD experiments were performed by using a PANalytical
X’Pert Pro diffractometer with Cu Kα radiation (0.154 nm) from an x-ray tube operating at
45 kV and 40 mA. The scan angle range starts at 10° and ends 80° with a step of 0.01°. The
XRD patterns of the reference of Co/C multilayers were also performed as a comparison to
the results of the Co/Mo2C multilayers.

Chapter 2 Analysis techniques
17
2.3 Reflectivity with synchrotron radiation
2.3.1 Description of the BEAR beamline
The BEAR (Bending magnet for Emission, Absorption and Reflectivity) [56]
beamline is installed at the right exit of the 8.1 bending magnet at Elettra, Trieste in Italy. The
beamline is designed to satisfy the following requirements: (a) a spectral range of
approximately 3-1600 eV, (b) an energy resolution ≥ 3000 over the whole energy range, (c) a
final spot size of the order of 10×100 µm2 and (d) the availability of elliptically polarized
radiation with the possibility of ellipticity selection from linear to near circular polarization,
all with an appreciable flux (Figure 2.3). The functions of the beamline can be employed to
determine the performance of optical elements (e.g. mirrors and multilayers), optical devices
and detectors.
The beamline is equipped with a device for selecting the polarization of light. There
are three monochromators. Their parameters are listed in Table 2.1.
Table 2.1 Parameters of monochromators.
Grating Energy range Resolving power
G 1200 40-1600 eV 3000 @ 400 eV
G 1800 200-1600 eV 5000 @ 400 eV
GNIM 3-50 eV 2000 @ 20 eV
Figure 2.3 Experimental photon flux on the sample (E=2.4 GeV, elettra current 100 mA,
vertical slits = 100 µm)

Chapter 2 Analysis techniques
18
2.3.2 Experiments at the BEAR beamline
1) Reflectivity measurements
The measurements of reflectivity at the soft x-ray and EUV ranges can be made by
scanning the photon energy at a fixed incidence angle or by angle scanning at fixed photon
energy. During the experiment, the incident and reflected photon flux are collected by a
silicon photodiode connected to a picoammeter. A tungsten grid continuously measures the
flux after the monochromator to take into account any variation of the current in the storage
ring.
To perform a reflectivity measurement, we firstly measured the currents (!!!) in the
photodiode corresponding to the direct incident beam and the electron current (!!!) in the
tungsten grid. Then, the currents (!!!) in the photodiode corresponding to the reflected beam
and the electron current (!!!) in the grid were measured. The absolute reflectivity is calculated
by the ratio of the two currents of the reflected and direct incident beams normalized to the
electron current in the tungsten grid:
! =
!!!!!!"!!!!!!!"!
!!!!!!"!!!!!!!"!
(2.1)
where !!" and !!" correspond to the average background noise intensity from the measuring
system. The error on the reflectivity value is about ±1%. All the experiments were performed
with s-polarization radiation.
2) Rocking curve (off-specular) measurements
Rocking curve analysis is a good method to study the degree of preferred orientation
in the crystals. This method is performed by rocking the sample (ω scan) while the detector is
kept a fixed angle of 2θ with respect to the incident beam to record the diffraction intensities
from the preferentially-oriented lattice planes. This method can also be applied to study
multilayers. The scheme of this measurement is shown in the Figure 2.4.

Chapter 2 Analysis techniques
19
Figure 2.4 Scheme of rocking curves measurements.
When a multilayer structure is characterized by this method, it yields wide rocking
curves compared to the perfect crystal. Lateral and vertical correlation lengths of the
roughness of layers can be obtained by fitting the rocking curves. Before doing this
experiment, we first need to determine the position of the Bragg peaks by making angle scan
with fixed photon energy. Then we fix this angle between incidence beam and sample surface
and rotate the sample around this Bragg angle. In this work, we performed rocking curves
measurements for the Co/Mo2C system to observe the lateral and vertical correlation lengths
of the roughness layers upon annealing.
3) Fluorescence measurement induced by x-ray standing wave
It is known that a periodic multilayer illuminated under Bragg conditions is an XSW
generator because of the strong interference between the incident and reflected waves (Figure
2.5). This standing wave field can be used to excite or generate the emission of photoelectrons,
Auger electrons or characteristic x-ray emissions of elements from a thin sample deposited
onto the multilayer or from the multilayer itself. X-ray photoemission spectroscopy (XPS)
studies photoelectrons whose mean free path at some hundreds of eV is about 1~2 nm, while
fluorescence detects photons coming from some hundreds of nanometers and thus is sensitive
to many buried interfaces. Fluorescence requires doing the modelization of the whole sample,
while XPS allows investigating in particular the first interface and then it is a good choice for
the analysis of the evolution of the multilayer capping layer. In this specific case, XSW is a
Chapter 2 Analysis techniques
20
powerful technique to investigate the internal modifications of the multilayer induced by
thermal treatment.
Figure 2.5 Scheme of x-rays standing wave [57].
In this thesis, we used the standing wave XPS to study the evolution of first buried
interface between capping layer B4C and first Mo2C layer of the samples annealed at different
temperature. We also used the x-ray standing wave technique to explore the study of either
the center of the layers or their interfaces and obtain the depth distribution of the various
species in the sample.
2.4 Reflectivity with MONOX apparatus
The MONOX apparatus consists of three different parts located in separated vacuum
chambers [58]. A scheme is shown in Figure 2.6. The first part is an x-ray tube; the second
one is a two-crystal monochromator and the third one is the θ-2θ goniometer. The whole
apparatus works under a pressure of 5×10⁻⁷
Torr.
The radiation used for the experiments is either the Bremsstrahlung coming from a
target of high atomic number (tungsten, gold, …) or a characteristic emission line: K line of
light element (B to Si), Lα line of transition elements (Cr to Pd). Thus, these lines cover the
spectral range between 12.9 and 0.3 nm. The maximal excitation conditions in the x-ray tube
are 10 kV, 100 mA.
There are three working modes: spectrometric mode, dispersion mode and
reflectometric mode. In our case, we used the reflectometric mode working the Lα line
emission of copper (1.33 nm). Two W/C multilayer mirrors are used as monochromators. We
firstly need to do alignment and put the detector in the centre of incident beam from the
monochromator. We measure the intensity of incident beam !!. After that we place the sample
at the position where the detector receives the intensity of !! 2. Then we make the alignment

Chapter 2 Analysis techniques
21
of sample, which means that the surface of the sample is coincidence with the plane of
incident beam. We noted down the height of sample. Once again we measure the intensity of
incident beam !! without sample and then we put the sample on the right position and
measure the reflected intensity. The reflectivity is obtained by making the ratio between the
reflected and incident intensities. The error on the reflectivity is less than 5%.
Figure 2.6 Scheme of the reflectometry MONOX in the reflectometric mode.
2.5 X-ray emission spectroscopy (XES)
2.5.1 The principle of XES
X-ray emission spectroscopy (XES) is a technique to study the electronic structure of
bulk sample. It can probe the depth information up to few hundreds nanometres without
sample damage. The schematic of the principle is shown in Figure 2.7. When high energy
photons or electrons ionize atoms in a target sample, an x-ray emission process can be
described as the transition of a valence electron or an electron from high energy level into a
core hole. Local density of states for one type of atom can be measured separately from the
others because the core states are well separated in energy. Electrons transitions between
empty and filled levels are determined by the quantum selection rules. For the most intensive
x-ray lines the electrical dipole transitions are followed:
∆! = ±1; ∆! = 0 ,±1
where l and j are the orbital quantum number and total angular momentum quantum number
respectively.

Chapter 2 Analysis techniques
22
Figure 2.7 Principle of XES.
X-ray emission spectra reflect partial occupied density of electronic states. The
position of peak and its chemical shift, the shape of spectrum as well as any satellites are
important characteristics for analysing buried interfaces within the sample. The probed
thickness can be determined by selecting the incident electron energy. In our experiment, we
used the Monte Carlo CASINO program [59] to simulate the depth distribution of ionizations
in a material subjected to electron bombardment and hence to determine the probed thickness.
A model of the emission study is created and allows us to choose the angle and the
appropriate incident electron energy.
2.5.2 Description of IRIS setup
Experimental setup IRIS (instrument for research on interface and surface) consists of
three main chambers [60]:
(1) Preparation chamber: it is equipped with slot to insert devices for preparing thin layers.
heating, annealing, cleaning samples. The chamber is connected to another chamber
where the samples can be stored.
(2) Source chamber: In this chamber, there is an electron gun to bombard the sample
which is the radiation source. The energy and the incident angle of electron beam
determine the penetration depth of the electrons in the sample. The inclination angle of
the sample is the results of compromise between maximizing of probed thickness and
minimization of the phenomenon of reabsorption. The kinetic energy of the electrons
may vary from 0 to 10 keV. We work with high focusing voltage that adjusts the size
of the beam on the sample. The electron current density can be set from 0
to10 mA/cm2. A sample holder cooled by water is used.

Chapter 2 Analysis techniques
23
(3) Spectrometer chamber: The scheme of the spectrometer is shown in Figure 2.8(a).
This room is equipped with dispersive spectrometer and curved crystal working in
reflection mode. The focusing spectrometer is of Johann type [61], whose principle is
shown schematically in Figure 2.8(b).
(a)
(b)
Figure 2.8 Scheme of the IRIS spectrometer (a) and principle of the Johann-type spectrometer
(b).
In Figure 2.6(b), the beam reflected by the bend cylindrically (2R) crystal is focused
on a cylinder of radius R, which is called focusing cylinder. The radius of curvature of 2R is
500 mm. The detector, placed behind an adjustable slit, is a gas (90% Ar and 10% CH4) flow
meter operating in the Geiger field.

Chapter 2 Analysis techniques
24
2.6 Nuclear magnetic resonance (NMR) spectroscopy
Nuclear magnetic resonance (NMR) spectroscopy is based on the fact that nuclei of
atoms have magnetic properties that can be utilized to yield chemical information. Quantum
mechanically subatomic particles (protons, neutrons and electrons) have spin. In some atoms
(12
C, 16
O, 32
S) these spins are paired and cancel out each other so that the nucleus of the atom
has no overall spin. However, in many atoms (1H,
13C,
31P,
59Co), the nucleus does possess an
overall spin. To determine the spin of a given nucleus one can use the following rules: if the
number of neutrons and the number of protons are both even, the nucleus has no spin. If the
numbers of neutrons plus the number of protons is odd, then the nucleus has half-integer spin
(i.e. 1/2, 3/2, 5/2). If the number of neutrons and the number of protons are both odd, then the
nucleus has an integer spin (i.e. 1, 2, 3).
The NMR allows the observation of specific quantum mechanical magnetic properties
of the atomic nucleus. There are two possible measurement techniques. One is the
conventional NMR where the sample needs to be placed in a high magnetic field. The applied
magnetic field serves several purposes. Most nuclei have two states: spin-up and spin-down.
When nuclei are placed in a magnetic field, the spin-down state is at a higher energy level
than the spin-up state. The sample is excited by radio waves and then we measure the energy
absorbed or emitted when nuclei flip between the two states. The same nuclei in different
parts of a molecule have slightly different transition frequencies. Thus measuring these
frequencies allows determining the environment of particular atoms in the molecule. The
other one is the zero-field NMR; in this mode no external field is applied and the nuclei are
excited by the oscillation of the hyperfine field which is created by the spontaneous magnetic
moment in the magnetic materials.
The direct yield of a zero-field NMR experiment in magnetic materials is the
hyperfine field produced by the electron spin polarization at the observed nuclei. As such, the
measurement provides a direct insight, element and site specific, onto the electron moment
values and possible magnetic structure. The hyperfine field is sensitive to the local
environment of atoms, which can be used to study the local atomic structure of individual
layers and the interfaces topology of metallic multilayers and superlattices. Indeed, the
hyperfine field distribution (the NMR spectrum) reflects the occurrence probability
distribution of all nearest neighbour configurations in the samples (each configuration giving
rise to a characteristic line in the spectrum). In our work we use zero-field NMR to
characterize the Co-based multilayers. In multilayers where there are several mixed planes at

Chapter 2 Analysis techniques
25
interfaces. The analysis of the interface concentration profile yields also the average hyperfine
field for each atomic plane. This reflects the magnetization profile at the interfaces.
In this work, all the NMR experiments are carried out on the home-made NMR
instrument in IPCMS (Institut de Physique et Chimie des Matériaux de Strasbourg). A
spectrometer with 20-750 MHz wide band is used to receive the signal. To improve the
sensitivity, the measurement temperature is 2 K for all the multilayers and 4.2 K for the
disordered alloy reference. We measured the spin echo intensity of Co atoms surrounded by
others atoms in the Co/Mo2C and Co/Y/Mo2C systems. Meanwhile the NMR spectra of some
references Co3Mo, CoMo1 %( at.) disordered alloys and Co/C multilayers were measured.
2.7 Time-of-flight secondary ion mass spectrometry (ToF-SIMS)
Time-of-flight secondary ion mass spectrometry (ToF-SIMS) is a surface-sensitive
analytical method that uses a focused and pulsed particle beam (typically Cs or Ga) to sputter
chemical species on a material surface. The resulting secondary ions are then accelerated into
a flight path on their way towards a detector. The lighter ones arrive before the heavier ones.
Their mass is determined by measuring their time of flight from the sample surface to the
detector and a mass spectrum is recorded. There are three different modes of analysis in ToF-
SIMS: (a) mass spectra are acquired to determine the elemental and molecular species on a
surface; (b) images are acquired to visualize the distribution of individual species on the
surface; and (c) depth profiles are used to determine the distribution of different chemical
species as a function of depth.
Figure 2.9 shows the principle of the ToF-SIMS for the mode (c). Extremely short ion
pulses with duration below 1 nanosecond are applied for high mass resolution analysis. These
ion pulses are formed from a continuous beam by a pulsing unit and can be compressed in
time by electro dynamic fields (bunching). The pulsed beam can be focused to a small spot to
invesitgate a small area of interest and can be rastered to determine the lateral distribution of
elements and molecules. During the drift time of the secondary ions, the extraction field is
switched off and low energy electrons are used to compensate for any surface charging caused
by primary or secondary particles. Thus all types of bulk insulators can be analyzed without
any problems. The time during which the extraction field is switched off can also be used to
apply low energy ion beams for sample erosion. In this case the low energy beam forms a
sputter crater, the center of which is analyzed by the pulsed beam (dual beam mode).

Chapter 2 Analysis techniques
26
Figure 2.9 Scheme of the ToF-SIMS instrument.
In this work all the ToF-SIMS experiments described were carried out in LPCS
(Laboratoire de Physique et Chimie des Surfaces) of ENSCP (Ecole Nationale Superieure de
Chimie de Paris) on the ToF-SIMS 5 apparatus (ION-TOF GmbH). All the samples were
analyzed by ToF-SIMS instrument working in the dual-beam mode. The sputtering was
performed using a 1 keV (59 nA) Cs+ ion beam, rastered over an area of 300 µm × 300 µm. A
pulsed 25 keV Bi+ primary ion source at a current of 1.3 pA (high current bunched mode),
rastered over a scan area of 100 µm × 100 µm, was used as the analysis beam. The raster of
the analysis beam was centred inside the etching one. Both ion beams were impinging the
sample surface forming an angle of 45° and were aligned in such a way that the analyzed ions
were taken from the center of the sputtered crater. Both positive and negative ions were
recorded. In this work, only negative spectra are presented because they provided sufficient
information. The ToF-SIMS technique provides only a qualitative chemical analysis as the
relative concentrations does not correspond to the number of atoms in the multilayer (the
sputtering yields vary from one element to another as well as from one matrix to another).
2.8 Transmission electron microscopy
2.8.1 Principle of TEM
The transmission electron microscopy (TEM) can be applied to investigate some
parameters of multilayer thin film: layer thickness, crystallographic orientation in and out of
the plane of films, physical roughness, chemical interdiffusion, grain size and orientation,

Chapter 2 Analysis techniques
27
atomic-scale structure and so on. High-resolution transmission electron microscopy (HRTEM)
imaging is a type of phase-contrast imaging and can reveal crystalline defects, second-phase
or amorphous layers and atomic-resolution structure across boundaries, as well as information
on the topography of the interface, provided that it is properly aligned in the direction of the
electron beam. Otherwise, the selected-area electron diffraction (SAED) can be performed
inside HRTEM image to obtain the crystallinity of samples.
Scanning transmission electron microscopy (STEM) is a modification of the normal
technique in which a nanometer-sized electron beam is focused and scanned point by point
across the sample in a raster. In the STEM mode, an annulus-detector with a large hole in the
centre is employed to exclude the coherently diffracted beams scattered at low angles. In this
case, the images formed from the incoherently scattered electrons are known as high-angle
annular dark-field images (HAADF). Because the image intensity depends only on the atomic
number and thickness of the sample, the images can be interpreted directly and chemical
concentrations of heavy species can be accurately estimated. In the STEM mode, we also
performed energy dispersive spectroscopy (EDS) line profile, which is a tool for element
analysis or chemical characterization, to determine the composition of layers in one period.
2.8.2 Preparation of sliced sample
It is known that the preparation of thin film slices for the TEM observation is difficult
because the sample is thin and easy to destroy. Moreover diffusion can be introduced during
the preparation, in particular when using a mechanical polishing method, in the step of
annealing the stacks (“sandwich” sample) for hardening the glue. This is bad for preparing the
as-deposited sample (deposited at room temperature). In our case, we use two methods to
make the slices for the TEM observation. In the case of the as-deposited sample, in order to
avoid the introduction of diffusion, we use focused ion beam (FIB) to cut the slices with the
thickness of about 60 nm. Others samples with thermal treatment are prepared by the
combination of mechanical polishing and ion milling.
Regarding the FIB method, a finely focused ions beam (usually gallium) is operated at
low beam current for imaging or high beam current for site specific sputtering or milling. In
our case, we first deposited a thin carbon rich platinum film to protect the sample surface
against ion-beam damage. Then a thick platinum layer was deposited to protect the sample
against ion milling damage. A first cross-section of the multilayers was cut and observed by
scanning electron microscopy. A lamella, whose size is approximately 10 µm×4 µm with a

Chapter 2 Analysis techniques
28
thickness of about 1 µm, was excavated. Then it was lifted out using a micromanipulator and
glued to a copper grid. A SEM image is shown in Figure 2.10. Finally, the lamella was
polished by using ion milling to a thickness of about 60 nm, giving the electron transparency
needed for TEM. Further thinning to about 30 nm in a Gatan Precison Ion Polishing System
operating at 1 kV was performed to meet the requirement of the high resolution imaging
experiment.
Figure 2.10 Scheme of a lamella lifting-out using a micromanipulator.
For the annealed samples, we used the mechanical polishing method combing the ion
milling to prepare the slices. Firstly we need to prepare a sandwich stack using the glue M-
Bond 610 to bond two small pieces (with the size of about 3 mm×5 mm) together via the way
of face to face. After we put the sandwich stack in an oven about 2.5 h at 130°C. Then the
sandwich stack was glued on a holder and then we used a precision diamond wire saw to cut
the sandwich into some slices with thickness of about 750 µm. Then we glued the slices onto
another holder and polished both sides until the thickness decrease down to be about of 30 µm.
Last we unglued the polished slices and used the ion milling to thin it up to get a small hole.
2.8.3 Description of the TEM experiments
In our work, all FIB experiments described were carried out on the equipment NEON
40 BSE (FIB/TEM Cross Beam®, Carl Zeiss) of IMPMC (Institut de Minéralogie et de
Physique des Milieux Condensés). All the TEM and STEM experiments were performed on
the equipment Jeol 2100F in IPCMS (Institut de Physique et Chimie des Matériaux de
Strasbourg). The applied voltage is 200 kV. The image resolution in TEM and STEM is
0.2 nm and 0.11 nm, respectively.

Chapter 2 Analysis techniques
29
Table 2.2 lists all the analysis techniques used in our work and their advantages and
disadvantages.
Table 2.2 Analysis techniques used in our work.
Technique Principle Obtained information Advantages Disadvantages
XRR
Constructive
interference of x-
ray beam
Layer thickness of thin
film and multilayer
Surface and interface
roughness
Density of material
Non-contact,
non-
destructive
Average
information of
the whole
multilayer
XRD
x-ray diffraction
from the
crystalline
structures
Crystalline structure Non-
destructive
Average
information of
the whole
multilayer
XPS-XSW
X-ray
interferometric
method
combining
diffraction
surfaces and interfaces
properties on the atomic
scale
Non-
destructive,
elemental
specific
Average
information
over 1 nm
XES Electron induced
x-ray emission
Chemical state of bulk
material
Non-
destructive,
elemental
specific
Average
information
NMR
Magnetic
properties of
atomic nuclei
Atom local chemical
environment
Non-
destructive
Average
information
ToF-SIMS
Ions sputter and
ionize material
from surface, with
mass measured
using mass
spectrometer
In-depth intensity High material
selectivity
Limited in-
depth
information,
destructive
TEM
Transmitted
energetic
electrons are
imaged
Cross-section of
multilayer structure
High in-depth
resolution
Intensity scale
has no
calibration,
destructive
HAADF-
STEM
Measurement of
high angle
scattered
electrons
Cross-section of
multilayer structure
Sensitive to
atomic
number
Limited to
high-Z
material

Chapter 3 Study of Co/Mo2C multilayers
30
Chapter 3 Study of Co/Mo2C multilayers
In this chapter we discuss the optical performances and interface properties of
Co/Mo2C multilayers upon thermal treatment. We firstly investigate the reflectivity of
Co/Mo2C multilayer upon annealing from 200°C to 600°C for one hour, with an interval of
100°C. This is described in the section 3.1. The reflectivity was measured at hard x-ray range
at grazing incidence angle for checking the periodic structure of the Co/Mo2C multilayer stack.
Then we measured the reflectivity in application wavelength of 1.59 nm at grazing incidence
angle of 11°.
In section 3.2, we fitted all the reflectivity data to evaluate the structural and optical
parameters of multilayers. In the section 3.3 and 3.4, we investigate the interface changes of
the Co/Mo2C multilayers upon annealing by combing non-destructive and destructive
methods. We observe the evolution of the first buried interfaces upon annealing by using soft
x-ray standing wave enhanced x-ray photoemission spectroscopy. In section 3.4 we present
interface properties within the multilayer stack by using XES, ToF-SIMS, NMR and TEM
techniques. Meanwhile we also calculate mixing enthalpy to interpret the interface change
phenomenon.

Chapter 3 Study of Co/Mo2C multilayers
31
The contents of this chapter are based on the following papers:
3.1 Investigation of reflectivity of Co/Mo2C multilayer upon thermal treatment. Yanyan Yuan,
Karine Le Guen, Jean-Michel André, Zhanshan Wang, Haochuan Li, Jingtao Zhu , Philippe
Jonnard. SPIE Proceedings, 85501U-85501U-6. (2012).
3.2 Co/Mo2C multilayer as x-ray mirror: Optical and thermal performances. Yanyan Yuan,
Karine Le Guen, Jean-Michel André, Zhanshan Wang, Haochuan Li, Jingtao Zhu, Christian
Mény, Angelo Giglia, Stefano Nannarone, Philippe Jonnard. Physica Status Solidi(B), 251,
(4) 803-808 (2014).
3.3 Interface analysis of heat-treated Co/Mo2C multilayer. Yanyan Yuan, Karine Le Guen,
Jean-Michel André, Christian Mény, Corinne Ulhaq, Anouk Galtayries, Jingtao Zhu,
Zhanshan Wang, Philippe Jonnard. Submitted.
3.4 Thermal effects on Co/Mo2C multilayer mirrors studied by soft x-ray standing wave
enhanced photoemission spectroscopy. Angelo Giglia, S. Mukherjee, N. Mahne, Stefano
Nannarone, Philippe Jonnard, Karine Le Guen, Yanyan Yuan, Jean-Michel André, Zhanshan
Wang, Haochuan Li, Jingtao Zhu. SPIE Proceeding, 87770I-87770I-10 (2013).
3.5 Co/Mo2C mirror as studied by x-ray fluorescence and photoelectron spectroscopies
induced by x-ray standing waves. Philippe Jonnard, Karine Le Guen, Yanyan Yuan, J Jean-
Michel André, S. Mukherjee, Angelo Giglia, Stefano Nannarone, N. Mahne, Zhanshan Wang,
Haochuan Li, Jingtao Zhu. SPIE Proceedings, 85501D-85501D-6. (2012).

Chapter 3 Study of Co/Mo2C multilayers
32
3.1 Investigation of the reflectivity of Co/Mo2C multilayer upon thermal treatment
3.1.1 Introduction
Co-based multilayer mirrors can have a high reflectivity. For example the Co/Mg
multilayer has a reflectivity higher than 50% at 25 nm wavelength at the angle of 45° [36,37].
In order to meet the needs of light sources working in the soft x-ray range, the Co/Mo2C
multilayer is proposed. Its theoretical reflectivity is 45% at 778 eV close to the Co L3
absorption edge. It has been reported that a Mo2C layer inserted into the Mo/Si multiyear as a
barrier layer can improve its thermal stability up to 600°C [62]. Recently the optical
properties of the B4C/Mo2C multilayer have been studied [63] and have given evidence of
abrupt interfaces with respect to the B4C/Mo multilayer where interlayers were detected. The
standard enthalpies of formation of α-Mo2C compound is ΔHfo(298.15 K)=-(6.37 ±
0.73) kcal.mol−1
[64]. This indicates that Mo2C possesses a good thermal stability and is a
good barrier candidate in the multilayer stacks.
Recently, some results on the thermal stability of the Mo/Si and Co/Mg systems have
been reported. Stearns and Petford-Long reported that the reflectivity and period thickness of
the Mo/Si multilayer decrease with increasing temperature because of interdiffusion of Mo
and Si atoms at the interfaces [42,65]. Hu et al. showed that the thermal treatment have an
influence on reflectivity for the Co/Mg system [66]. In this work, we focus on the influence of
annealing temperature on reflectivity of Co/Mo2C samples and try to find relationship
between structural parameters and annealing temperature.
3.1.2 Experimental details
We first made simulations for obtaining the optimized parameters using optical
constants from CXRO [67], thickness of each layer and period number giving a high
reflectivity. A roughness of 0.5 nm of Si substrate was taken into account, but no interfacial
roughness and interdiffusion between Co and Mo2C layers. The multilayer period and the Γ
ratio between the thickness of Mo2C layer and the period were varied from 1 to 20 nm and
from 0.1 to 0.9, respectively. A maximum reflectivity of 45% with a grazing angle of 11° was
obtained at 1.59 nm (778 eV) when the period is equal to 4.10 nm and the Γ ratio to 0.36
(dCo=2.60 nm and dMo2C=1.50 nm). This photon energy is close to that of the Co L3 absorption
edge.

Chapter 3 Study of Co/Mo2C multilayers
33
The Co/Mo2C multilayers were deposited on the polished Si (100) wafers substrate
with a surface roughness of 0.40 nm rms. The base pressure was 10-5
Pa before deposition.
The sputtering gas was argon (99.999% purity) at a constant working pressure of 0.1 Pa. The
power applied to sputtering target was 40 W for Co and 60 W for Mo2C. Six samples with an
area of 20 x 20 mm2 were deposited separately on the Si wafer under the same conditions.
From one sample to another a small variation of the period can exist. The bi-layer number for
each sample was 30. The first layer on the substrate is the Co one. To prevent oxidation, a
3.50 nm thick B4C capping layer was deposited.
To investigate the thermal behaviour of Co/Mo2C multilayer, five samples were
annealed at 200°C, 300°C, 400°C, 500°C and 600°C for one hour in a furnace with a base
pressure of 3.0×10⁻⁴
Pa. After annealing, the samples were cooled down to room temperature
naturally.
3.1.3 Results and discussion
1) X-ray reflectivity at 0.154 nm
The reflectivity curves of the Co/Mo2C multilayers with different annealing
temperatures up to 500°C are presented in Figure 3.1 on a logarithmic scale. Four well-
defined Bragg peaks are observed in all the probed range. They are almost the same from
room temperature to 400°C, which indicates that the Co/Mo2C multilayer is stable up to
400°C. However, at 500°C, the 4th
Bragg peak almost disappears. This phenomenon could be
due to a change of the interface structure. Some parameters such as the period and interfacial
roughness, deduced from the fit of the XRR curves, are listed in Table 3.1, except density.
The density ratio, which is the density of the layer with respect to the bulk value, is
determined with a 15% uncertainty and within this uncertainty there is no significant density
change as a function of annealing. These fits were done using a bi-layer model, by
considering only Co and Mo2C layers in one period. The measured periods are in good
agreement with the aimed value of 4.10 nm but vary slightly from one sample to another one
(see the column before annealing) because the sample have been prepared separately. The
densities of the layer are close to those of the bulk materials taking into account the
uncertainty. The roughness of the Mo2C layers is small (0.25 nm) and independent of the
annealing temperature. The fitted value of the roughness of the Co layer fluctuates largely
with the annealing temperature between 0.3 and 0.8 nm, which is considered to be large with
respect to the thickness of the Co layer ~2.60 nm. The roughness of the Mo2C layers is

Chapter 3 Study of Co/Mo2C multilayers
34
smaller than that of the Co layers. This means that Co-on-Mo2C and Mo2C-on-Co interfaces
are asymmetrical. This asymmetry has also been reported in Co/Mg and Mo/Si
systems [43,48,68,69].
Figure 3.1 Reflectivity curves as a function of grazing angle measured at 0.154 nm of
Co/Mo2C multilayers annealed at different temperatures. Data of the samples annealed at 200,
300, 400 and 500°C are shifted vertically for the sake of clarity.
Table 3.1 Structural parameters derived from the fit of the XRR curves measured at 0.154 nm.
Sample
Period d
(nm)
before
annealing
Period d
(nm)
after
annealing
Thickness/Roughness (nm)
(±0.05 nm)
B4C Co Mo2C
As-
deposited 4.20 - 3.60/0.56 2.65/0.32 1.55/0.26
200°C 4.08 4.08 3.62/0.55 2.66/0.40 1.42/0.25
300°C 4.17 4.18 3.31/0.56 2.93/0.82 1.25/0.26
400°C 4.15 4.12 3.92/0.81 2.86/0.33 1.26/0.21
500°C 4.12 4.09 3.36/0.62 2.99/0.71 1.10/0.22
600°C 4.17 4.13 2.89/0.54 2.47/0.38 1.66/0.22
2) X-ray reflectivity with synchrotron radiation
First the samples were measured at the designed Bragg angle of 11° in the photon
energy range of 745-805 eV. Reflectivity as a function of the annealing temperature is shown
in Figure 3.2. The curves present two main peaks, one close to the Co L3 edge and the other
close to the Co L2 edge. It can be seen that the maximum of reflectivity, happening for the
sample annealed at 300°C, is 27.4% at 776.56 eV, which has a 1.54 eV shift with respect to
the Co L3 absorption edge at 778.1 eV. The maximum of reflectivity as well as its photon
energy vary to some extent with the different annealing temperatures. For the samples
10-7
10-6
10-5
10-4
10-3
10-2
10-1
100
101
102
103
104
105
106
Inte
nsity (
a.u
.)
543210
Incidence grazing angle (°)
as-deposited
300°C
400°C
500°C
200°C
experimental data fit

Chapter 3 Study of Co/Mo2C multilayers
35
annealed at 200, 400, 500 and 600°C, the photon energy corresponding to the maximum
reflectivity are very close to Co L3 edge. In order to move away from the Co L3 edge, some
measurements for the samples annealed from 200 to 600°C were also performed at a grazing
angle of 11.25°. In this case too, the best reflectivity takes place on the sample annealed at
300°C. It is noted that a transition between annealing temperature of 500 and 600°C occurs,
where the reflectivity decreases from about 25% to 20%.
Figure 3.2. Reflectivity as a function of energy at Bragg angles of 11° and 11.25° for the
Co/Mo2C multilayers as-deposited and annealed from 200 to 600°C.
Figure 3.3 shows the reflectivity for all the samples up to the fourth Bragg peak in the
θ-2θ mode in the range of 5-55°, where the photon energies used are determined according to
the maximum of the curves obtained at the grazing angle of 11°. It can be seen that the
differences between samples are more evident in terms of reflectivity and angular position at
large angles. Detailed position and corresponding reflectivity of the four Bragg peaks are
collected in Table 3.2. It is noticed that the reflectivity of the fourth Bragg peak for all the
samples is less than 0.1%. In addition, except for the first peak, the other three Bragg peaks
are surrounded by shoulders. This phenomenon is due to some contribution of the diffuse
scattering. This was checked on one sample: in the same experimental conditions, we used a
detector with a smaller angular acceptance than the one used to measure the sample annealed
at 200°C and obtained the reflectivity curve without shoulders (not shown).

Chapter 3 Study of Co/Mo2C multilayers
36
Figure 3.3 Evolution of reflectivity curves as a function of grazing angle at ~ 778eV photo
energy (in the θ-2θ mode) for the Co/Mo2C multilayers.
Table 3.2 Position and reflectivity of the four Bragg peak of the Co/Mo2C multilayers.
Sample Position of the Bragg peak / Reflectivity (%)
1st 2nd 3rd 4th
As-deposited 10.9° / 26.7 22.3° / 2.7 34.7° / 0.05 49.55° / 0.05
200°C 11.2° / 20.9 23.0° / 2.6 35.7° / 0.08 51.25° / 0.06
300°C 11.0° / 27.0 22.6° / 2.8 35.2° / 0.07 50.25° / 0.03
400°C 11.0° / 27.3 22.7° / 2.4 35.5° / 0.09 50.75° / 0.02
500°C 11.2° / 24.5 22.9° / 1.5 35.8° / 0.11 51.23° / 0.01
600°C 11.0° / 23.6 22.6° / 0.9 35.2° / 0.13 50.25° / 0.01
To investigate the lateral and vertical correlation length of roughness of annealed
samples, off-specular measurements are also done. The evolution of the first and second
Bragg peaks as a function of annealing temperature is presented in Figure 3.4 on a logarithmic
scale. Concerning the first Bragg peak, the wing on the right of the Co/Mo2C_600°C sample
goes up towards high angles. For the second Bragg peak, the wing on the right of the
Co/Mo2C_300°C sample slightly goes up towards high angles. For other samples, no
significant evolution of the curves as a function of annealing temperature takes place, except a
slight change at both sides for the Co/Mo2C_500°C sample. It is suggested that the lateral and
vertical correlation length of roughness of samples annealed at 500°C and 600°C is slightly
larger than that of other samples. In all cases the changes are small and indicate no large
variation of the lateral and vertical correlation length of roughness in the Co/Mo2C system as

Chapter 3 Study of Co/Mo2C multilayers
37
upon annealing. The slight change of lateral and vertical length of roughness should be
responsible for the decrease of reflectivity upon annealing.
Figure 3.4 Off-specular reflectivity curves around the first and second Bragg peak for the
Co/Mo2C samples annealed at different temperatures.
3.1.4 Conclusions
The simulated reflectivity of Co/Mo2C multilayer is 45% with a grazing angle of 11°
in the soft x-ray range around the Co L3 absorption edge. These multilayers are fabricated
then annealed up to 600°C and their reflectivity is characterized. The x-ray reflectivity results
show that the multilayers possess good thermal stability. The multilayer period derived from
the fit of XRR curves is in good agreement with the designed one. The reflectivity obtained
using synchrotron radiation in the soft x-ray range shows that the highest reflectivity,
occurring on the sample annealed at 300°C, is about 27%. When the temperature goes up to
500°C, the reflectivity slightly decreases to 25% and then drops to 20% at 600°C. Off-
specular reflectivity curves are also reported and show no significant changes, again showing
the good thermal stability of the stack. From all above results, it is clear that this multilayer
can work up to 600°C.

Chapter 3 Study of Co/Mo2C multilayers
38
3.2 Evaluation of structure and optical parameters of Co/Mo2C multilayer upon annealing
3.2.1 Introduction
We firstly characterize the optical performance of Co/Mo2C multilayer with the
combination of three methods: (1) XRR at 0.154 nm to determine the structural parameters of
multilayer; (2) soft x-ray reflectometry (SXR) at 1.59 nm and 1.33 nm, i.e. close to and far
from the Co L3 absorption edge, to investigate the optical performances; (3) enhanced
fluorescence by x-ray standing wave (EFXSW) to confirm the usefulness of the stack model.
The value of the EUV optical index of nano-films in the vicinity of the absorption edges is
known to have a large uncertainty. In fact, its accurate determination is required in order to
calculate the optical performance of various optical films such as the proposed Co/Mo2C
multilayer. Thus, in addition to studying the optical performance of Co/Mo2C multilayers in
both hard and soft x-ray regions, we show in this part that it is possible to determine the
optical index (n-ik) of a Co nano-film in the Co/Mo2C multilayer system near the Co L3 edge
by combining these three methods.
X-ray reflectometry is a well-established technique to determine the characteristics
(thickness, density, optical index) of thin films [37]. EFXSW in the soft-x-ray range is only in
its early stage compared to the hard x-ray range [70]. Recently our team has developed a
model based on the emission of a radiating dipole embedded in a multilayer structure to
describe the EFXSW [71].
In this part we also explore the interface by simulating the electric field within the
stack. It is known that in the x-ray standing wave technique excitation of the atoms of the
stack is maximum at depths corresponding to the nodes of the electric field while it is kept at
minimum at the antinodes of the field. This excitation can be at the origin of characteristic
emission (or fluorescence) or of photoelectron emission. By slightly varying the angle around
the Bragg angle, the position of the nodes and antinodes of the electric field moves and it is
possible to probe either the center of the layers or their interfaces and so to obtain the depth
distribution of the various species of the sample with a sub-nanometer depth resolution.
3.2.2 Results and discussion
1) Fitting of reflectivity curves

Chapter 3 Study of Co/Mo2C multilayers
39
XRR reflectivity at hard x-rays has been described in the section 3.1.3 and gives the
structural parameters.
SXR measurements in the Co L3 region (1.59 nm) were performed at the BEAR
beamline [56] at the Elettra synchrotron radiation center using s-polarized light. The photon
energy was calibrated by x-ray photoemission spectroscopy (XPS) using as a gold reference.
Since in the vicinity of Co L3 absorption edge the refractive index of the Co nano-film may be
strongly modified different from the tabulated bulk value, the real and imaginary parts of the
Co refraction index have been considered as variables in the SXR fitting.
To confirm the description of each layer (thickness and roughness), reflectivity
measurements around the first Bragg peak for samples annealed from 200 to 600°C
temperatures were performed at 1.33 nm. They are presented in Figure 3.5. It can be noticed
that the maximum position varies to some extent with the annealing temperatures, as has
already been observed in the hard x-ray range (Figure 3.1). Within the experimental
uncertainty, the values of period and roughness derived from the fit of the curves obtained at
1.33 nm are in agreement with those from the curves measured at 0.154 nm.
We use the structural parameters of the stacks taken from the fits of the reflectivity
curves (both at 0.154 and 1.33 nm) to fit SXR curves by adjusting the optical indices, real and
imaginary parts, of cobalt considering only a bi-layer system, i.e. Co and Mo2C layers,
without interlayers. The optical constants of the other materials Mo2C and B4C are kept fixed
to their tabulated values [67] since these materials have no absorption edge in this spectral
region.
Figure 3.5 Reflectivity curves measured at 1.33 nm (Cu Lα emission) of Co/Mo2C multilayers
annealed from 200 to 600°C.
8
6
4
2
0
x1
0-3
10.510.09.59.08.5Grazing angle (°)
6
4
2
x1
0-3
6
4
2
x1
0-3
4
3
2
1
x1
0-3
5
4
3
2
1
0
x1
0-3
R
efle
ctivity
200°C
300°C
400°C
500°C
600°C experimental data
fit
First Bragg peak

Chapter 3 Study of Co/Mo2C multilayers
40
Figure 3.6 Comparison between soft x-ray reflectivity curves (black lines) and fit (red lines)
using the parameters from XRR fit for as-deposited and 600°C annealed sample.
The corresponding reflectivity curves and fit results are presented in Figure 3.6 for the
as-deposited and 600°C annealed samples. The variations of the Co optical indices n and k
with respect to the CXRO ( the center for x-ray optics) database [67] are listed in Table 3.3. It
can be seen, the imaginary part k for both samples has to be modified significantly to obtain a
good agreement, while the real part n is almost equal to the value from the CXRO database
and needs only to be adjusted slightly. The same has been done for the reflectivity curve of
the 200°C annealed sample. This leads to a 33% reduction of the imaginary part of the Co
index (Table3.3). This means that the absorption in Co layers is much smaller than expected
from the tables.
Table 3.3 Variations of the optical complex index n-ik of Co, with respect to the CXRO
database required in order to fit the soft x-ray reflectivity curves obtained around 778 eV
(1.59 nm).
Sample n (% of tabulated
value)
k (% of
tabulated value)
As-
deposited 99.96 24.0
200°C 99.98 33.0
600°C 100.0 40.0
It can be seen in Figure 3.7 that the database value does not take into account the fine
structure of the absorption coefficient in the vicinity of the Co L2,3 edge; in the database the
absorption profile is represented by a single jump and the Co L2 edge does not exist. It is
surprising to see that the imaginary part of the index deduced from the absorption
experiment [72] should be higher than that from the database while in our analysis it is the
10-7
10-6
10-5
10-4
10-3
10-2
10-1
Reflectivity
5040302010
Grazing angle (°)
10-8
10-7
10-6
10-5
10-4
10-3
10-2
10-1
As-deposited
experimental data
fit
600°C

Chapter 3 Study of Co/Mo2C multilayers
41
contrary. However, the experimental curve in Figure 3.7 is obtained for bulk Co and is
probably not fully representative of Co nano-film owing to some possible change of density
or of chemical state if some intermixing exists with the Mo2C layers. Let us note also that a
slight error in the photon energy calibration can affect significantly the imaginary part of the
Co optical index.
Figure 3.7 Comparison of the imaginary part of the Co optical index in the vicinity of the L2,3
edge, deduced from absorption measurement (dotted line) and from the CXRO database (solid
line). The two vertical bars indicate the photon energies used to perform the XSW
measurements (right: sample annealed at 200°C; left: sample annealed at 600°C).
The reflectivity curves are well reproduced by the fits only to the low angle side
(Figure 3.6). This is probably due to the fact that the simulations are made by considering the
bi-layer model without the presence of any interfacial compound. Actually, formation of an
interfacial compound should be considered as one reason for the variation of the imaginary
part of the Co optical index upon annealing (see Table 3.3).
2) Enhanced Fluorescence by XSW
EFXSW is based on the system of standing waves obtained within a periodic
multilayer structure in the Bragg diffraction regime. The peaks of electric field intensity can
be localized in the regions of interest of the multilayer structure by adjusting the grazing angle
of the incident excitation radiation. This radiation can give rise to fluorescence radiation
coming mainly from the regions of the intensity peaks of the excitation radiation. This kind of
experiment can be carried out with different geometries. In the present work we have adopted
the so-called de Boer configuration [73] where only the incident excitation radiation
0.000
0.002
0.004
0.006
0.008
770 780 790 800
X-ray absorption measurementCXRO database
k
Photon energy (eV)

Chapter 3 Study of Co/Mo2C multilayers
42
undergoes Bragg diffraction. In our experiment the excitation radiation is around 778.3 eV for
the 200°C annealed sample and 777.6 eV for the 600°C annealed sample. With a SDD
detector [74], we record the intensity of the Co Lα emission line at 776.4 eV versus the
grazing angle in the range 8-13° around the first Bragg peak (11°). The results are displayed
in Figure 3.8. Curves of the samples annealed at 200 and 600°C are obtained at different
incident photon energies and thus show different intensities. Indeed for the sample annealed at
600°C the absorption coefficient is low, as indicated by the vertical bars in Figure 3.7, thus
leading to a low generation of Co L3 ionizations and consequently a lower number of Co Lα
photons. Another effect is the small angular shift of the first Bragg peak, as indicated by the
vertical bars in Figure 3.8, leading to a small angular shift of the XSW curves.
Figure 3.8 EFXSW curves of the samples annealed at 200 and 600°C versus the grazing angle;
the recorded radiation is the Co Lα line. Full red circles: sample annealed at 200°C; open blue
squares: sample annealed at 600°C. The vertical bars indicate the position of the first Bragg
peak. Red bar: sample annealed at 200°C; blue bar: sample annealed at 600°C.
By means of the model given in Ref. [71], we have fitted the EFXSW curves using a
bi-layer model as for the reflectivity fitting. Figure 3.9 shows the results: for the
Co/Mo2C_200°C annealed sample (Figure 3.9(a)). The tabulated value of the Co refractive
index does not allow us to fit the experimental curve but using the tabulated value of the real
part of the refractive index and 25% of the tabulated value of the imaginary part allows us to
obtain an agreement provided one smoothens the theoretical results to take into account the
aperture of the detector. This analysis is in agreement with the results of the reflectivity
measurements. The same fitting procedure was performed with the Co/Mo2C_600°C annealed
sample (Figure 3.9(b)), and the best fit was obtained when 40% of the tabulated value of the
imaginary part of the Co optical index is used.

Chapter 3 Study of Co/Mo2C multilayers
43
Figure 3.9 Comparison of the experimental (points) and simulated EFXSW curves (lines) for
the samples annealed at 200°C (a) and 600°C (b); simulation with tabulated optical index of
Co (blue dotted line); simulations with the imaginary part deduced from reflectivity
measurements, without smoothing (black dashed line) and smoothing (black solid line).
Let us note that the simulation for the 600°C annealed sample seems better than the
one for the 200°C annealed sample. This is probably due to the fact the simulations are made
by considering the bi-layer model without interfacial mixing as also suggested in preceding
part. Actually, the formation of an interfacial compound could be considered as one reason for
the variation of the imaginary part of Co upon annealing (see Table 3.3).
3) Simulation of the electric field within the multilayer stack
All the following simulations were performed by using the optical constants of the
CXRO. Let us note that the incident photon energy is very close to the Co L3 edge. No
interfacial roughness has been considered. We present the depth distributions of the electric
field intensity by the radiation in the capping layer and the two top periods of the stack.
The electric field is calculated with the IMD code [1]. In Figure 3.10, the depth
variation of the field is shown for three different angles: the Bragg angle and plus and minus
one degree with respect to this angle. One can see the periodic oscillation of the electric field
having the periodicity of the stack. The maximum of intensity is obtained for the Bragg angle.
As a function of the depth, the field intensity decreases. When the grazing angle equals the
Bragg angle, the maximum of the field lies in the Co layer close to the Co-on-Mo2C interface,
while minimum is close to the Mo2C-on-Co interfaces. In the case of our sample the
maximum of field is within the superficial boron carbide layer. When the angle shifts by one
degree, the position of the maximum moves to the center of the Co or Mo2C layers. In this
case, both depth distributions of the field are almost in phase opposition. It is possible to put
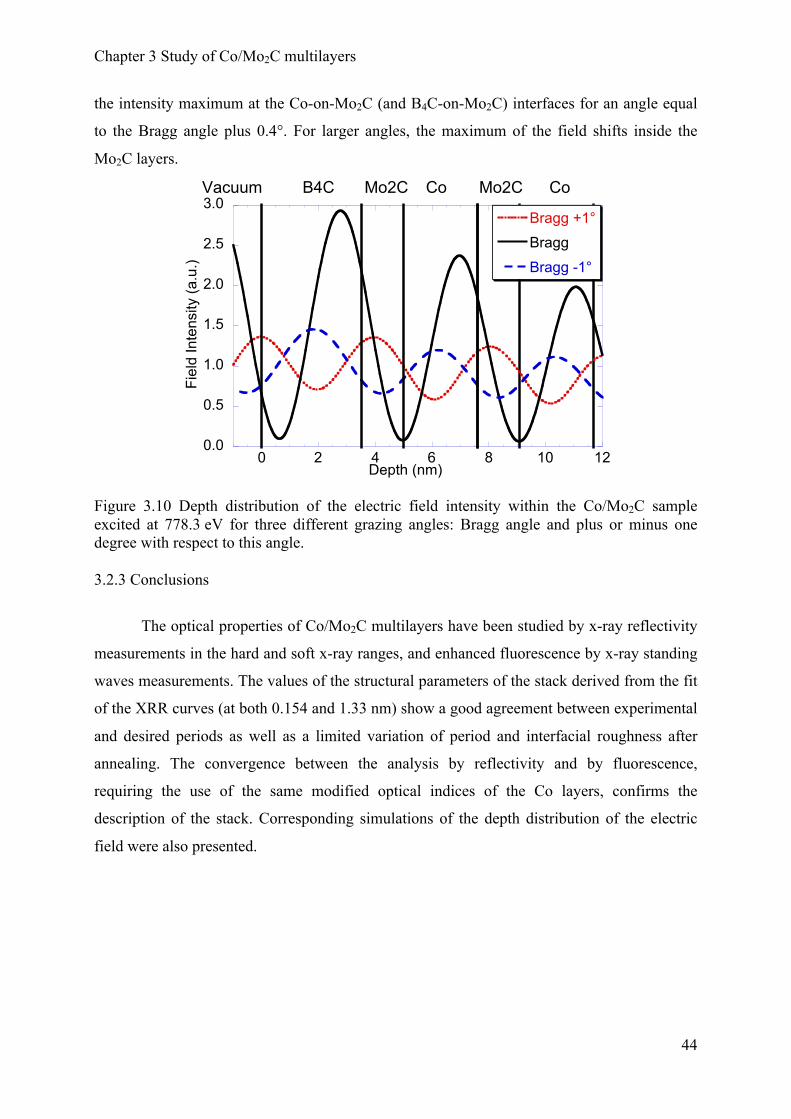
Chapter 3 Study of Co/Mo2C multilayers
44
the intensity maximum at the Co-on-Mo2C (and B4C-on-Mo2C) interfaces for an angle equal
to the Bragg angle plus 0.4°. For larger angles, the maximum of the field shifts inside the
Mo2C layers.
Figure 3.10 Depth distribution of the electric field intensity within the Co/Mo2C sample
excited at 778.3 eV for three different grazing angles: Bragg angle and plus or minus one
degree with respect to this angle.
3.2.3 Conclusions
The optical properties of Co/Mo2C multilayers have been studied by x-ray reflectivity
measurements in the hard and soft x-ray ranges, and enhanced fluorescence by x-ray standing
waves measurements. The values of the structural parameters of the stack derived from the fit
of the XRR curves (at both 0.154 and 1.33 nm) show a good agreement between experimental
and desired periods as well as a limited variation of period and interfacial roughness after
annealing. The convergence between the analysis by reflectivity and by fluorescence,
requiring the use of the same modified optical indices of the Co layers, confirms the
description of the stack. Corresponding simulations of the depth distribution of the electric
field were also presented.
0.0
0.5
1.0
1.5
2.0
2.5
3.0
0 2 4 6 8 10 12
Bragg +1°
Bragg
Bragg -1°
Fie
ld In
ten
sity (
a.u
.)
Depth (nm)
Vacuum B4C Mo2C Co Mo2C Co
Chapter 3 Study of Co/Mo2C multilayers
45
3.3 Observation of the first buried interfaces within Co/Mo2C multilayers studied by soft x-
ray standing wave enhanced photoemission spectroscopy
3.3.1 Introduction
Standing wave enhanced x-ray photoemission spectroscopy is a powerful sampling
depth spectroscopic technique, in particular for interferential multilayer mirrors [75,76]. It is
based on the analysis of photoelectrons excited in the standing wave field that is created
inside the periodic multilayer at the incidence angle that gives constructive interference. By
rotating the sample around the resonant angular position, the standing wave moves vertically
along the normal of the sample, exciting selectively the emitting atoms/molecules at different
depths. Taking into account that the period of the standing wave is equal to the period of the
multilayer sample, this technique can be sensitive to 1/10 of the period; then to some
nanometers in case of soft x-ray optics, change of period by some tens of nanometers.
In this part we focus on the evolution of the first buried interfaces of a B4C capped
Co/Mo2C multilayer mirror induced by annealing up to 600°C. We performed the soft x-ray
XSW spectroscopy of the Mo 3d, B 1s, C 1s, O 1s core levels by using a photon energy close
to that of the Co L2,3 edge and corresponding to the first Bragg peak of the multilayer.
3.3.2 Results and discussion
The Co/Mo2C multilayer annealed at 200°C and 600°C was studied by x-ray
photoemission spectroscopy in correspondence to the first Bragg peak at a grazing angle of 11°
with photon energy of 776 eV. The XSW analysis associated with XPS spectroscopy revealed
to be useful for the analysis of the first interface Mo2C-on-B4C. The Mo2C/B4C system seems
very promising for the development of soft x-ray multilayers [63], having Mo2C optical
properties very close to Mo but being more thermally stable and having lower mechanical
stress.
A first overview photoelectron spectrum has been obtained on the both samples at 45°
and the electron analyzer in normal emission. The XPS spectra peaks of B 1s, Mo 3d3/2 and
3d5/2, C 1s, O 1s are shown in Figure 3.11. The binding energy is located at 188.5 eV for B 1s
(a), at 231.8 eV and 228.5eV for Mo 3d3/2 and 3d5/2 (b), at 285 eV for C 1s (c) and at 532 eV
for O 1s (d). The monochromator energy was calibrated with the same incident photon energy
the Au 4f spectrum of a clean gold film.

Chapter 3 Study of Co/Mo2C multilayers
46
Figure 3.11 B 1s (a), Mo 3d (b), C 1s (c) and O 1s (d) XPS spectra of the multilayer samples
annealed at 200 and 600°C. The ratios between integral areas of B 1s, Mo 3d, C 1s and O 1s
XPS spectra between Co/Mo2C_200°C and Co/Mo2C_600°C samples are 0.92, 0.46, 1.3 and
1.43 respectively.
A quantitative analysis has been done by comparing the XPS intensities coming from
Co/Mo2C_200°C and Co/Mo2C_600°C samples. It shows that the thermal treatment at 600°C
induces an intensity increase of Mo 3d of about 2.2 times. The B 1s signal intensity remains
almost constant for both samples, while the signals coming from O and C in the
Co/Mo2C_600°C sample decrease a factor of 1.3 and 1.4 respectively with respect to that of
the Co/Mo2C_200°C sample. The O 1s spectrum of Co/Mo2C_200°C sample presents a peak
at 540 eV that can be referred to solvents such as ethylic alcohol.
The same XPS analysis has been done corresponding to the maximum of reflectivity at
the onset of Co L3 edge with photon energy of 776 eV, around the Bragg peak at grazing

Chapter 3 Study of Co/Mo2C multilayers
47
angle of 11°. Figure 3.12 presents the comparison between the reflectivity curves of
Co/Mo2C_200°C and Co/Mo2C_600°C samples which show their maximum at about 11.2°
and 11.05° respectively with a peak value of 0.21 and 0.24 respectively. The reflectivity of
the sample annealed at 200°C is lowest due to variation of the period of the as-deposited
multilayers, whose Bragg condition is too close to the Co L3 absorption edge.
Figure 3.12 Reflectivity of the Co/Mo2C_200°C and Co/Mo2C_600°C samples as a function
of the grazing incidence angle.
Simulations of electric field inside the samples have been performed with the OPAL
code, assuming abrupt interfaces [77]. The calculation of the energy loss inside the structure
from the electromagnetic wave is shown in Figure 3.13. According to simulations, the
increment of the incidence angle moves the position of the standing wave towards buried
depths of about 1 nm for one degree. As can be seen in Figure 3.13, the position of the
reflectivity peaks can be used as a reference for the movement of the standing wave inside the
sample.
Figure 3.13 Calculation of the energy loss inside the Co/Mo2C_200°C and Co/Mo2C_600°C
samples.

Chapter 3 Study of Co/Mo2C multilayers
48
XPS spectra have been acquired with a step of 0.075° from 8° to 14°. For each
spectrum, a quantitative analysis was performed with a MATLAB automatic procedure. The
spectrum has been fitted, after subtracting a linear background, to the sum of Gaussian curves
with amplitude, energy center and full width at half maximum as fitting parameters (Figure
3.14). The quantitative analysis of the spectra has been done by taking the integral of the
Gaussian curves, after subtracting the background. The analysis of the binding energy show
for both samples a drift of about 1 eV when going from normal to grazing angles, that could
be ascribed to the change of the light penetration depth inside the sample and to the
enhancement of the oxidation of the sample at the surface.
The Mo 3d XPS spectra of the Co/Mo2C_200°C sample (Figure 3.14 (a)) are
characterized by a doublet peak separated by 3.2 eV. Thus the quantitative analysis of Mo 3d
has been done by fitting the spectra with two doublet components, with the doublet given by
the sum of two Gaussian peaks with a shift of 3.2 eV and with fixed intensity ratio of 3/2
between the Mo 3d5/2 and Mo 3d3/2 components. According to the Ref. [78], the first doublet
can be ascribed to Mo-Mo and Mo-C bonds of Mo2C, while the shoulder component shifted
by 1.5eV corresponds to an oxidized state. The intensities of the two contributions as a
function of the grazing angle are shown in Figure 3.14 (b). A qualitative investigation of the
data shows that there is a strong variation of the intensity of the XPS peaks corresponding to
the Bragg resonance. The angular positions of the Mo-C peaks are shifted about 0.35° with
respect to the reflectivity peak. This is well consistent with simulations, showing that at the
Bragg peak the maximum of intensity falls at 0.4 nm from the first interface between B4C and
Mo. The fact that the angular position of the peaks is the same for both samples indicates that
the first interface between Mo2C and B4C is quite stable up to 600°C.
The angular position of the maximum of Mo-O component shifts by about 0.4° and 0.2°
to the low angles with respect to that of the Mo-C component for Co/Mo2C_200°C and
Co/Mo2C_600°C samples, respectively. This indicates that the Mo-O component, buried
0.2 nm over the interface in the Co/Mo2C_200°C sample, moves 0.2 nm towards the surface
in the Co/Mo2C_600°C sample and then that the 600°C annealing induces a progressive
oxidation of about 0.2 nm of the first interface Mo-C-B4C interface.

Chapter 3 Study of Co/Mo2C multilayers
49
Figure 3.14 Mo 3d XPS count rate and fitting curves of the Co/Mo2C_200°C sample (a),
intensity of the fitting Gaussian components of the Mo 3d spectra of the Co/Mo2C_200°C and
Co/Mo2C_600°C sample (b). Vertical bars are positioned at the Bragg peaks.
Figure 3.15 (a) show the B 1s XPS spectra peak of the Co/Mo2C_200°C sample. It is
comprised of a main peak located at 188.5 eV and a shoulder with a shift of 2 eV towards
high energies. According to the Ref. [79], the main peak can be ascribed to B-B and B-C
bonds of pure B4C, while the shoulder at 190.5 eV can be ascribed to B-C-O and B-O bonds
present in an oxidation B4C layer. The analysis has been done by fitting the spectra with two
Gaussian components. The two components for both spectra show an important angular
modulation of the signal, as shown in Figure 3.15 (b). The position of the B-C peak decreases
at higher angles due to the progressive shift of the standing wave to more buried depths. The
slope minimum is positioned in the Co/Mo2C_200°C sample exactly at the Bragg angle and
shift by 0.2° toward high angle for the Co/Mo2C_600°C sample. This indicates that high
thermal annealing induces a diffusion of B4C towards the interface with depth of about 0.2 nm.
Figure 3.15 B 1s XPS count rate and fitting curves of the Co/Mo2C_200°C sample (a),
intensity of the fitting Gaussian components of the B 1s spectra of the Co/Mo2C_200°C and
Co/Mo2C_600°C sample (b).

Chapter 3 Study of Co/Mo2C multilayers
50
The O 1s XPS spectra of the Co/Mo2C_200°C sample, shown in Figure 3.16 (a),
present a main peak located at about 532 e, a small shoulder located at about 529.5 eV present
at the left side of the main peak and a third peak located at 539.5 eV. The third peak is
definitely less intense in the Co/Mo2C_600°C sample. According to Ref. [79], the main peak
at 532 eV can be assigned to the oxidation of the surface boron carbide and the shoulder at
529.5 eV to the oxidation of the buried Mo2C layer [80]. Both spectra show an important
signal modulation of the intensity of the main peak relative to oxidized B4C corresponding to
the Bragg peak. The modulation of the signal for the two samples is very different, indicating
a progressive shift of the O 1s signal towards higher depths. The phase variation between the
O 1s curves is about 0.9°, indicating a progressive oxidation of 1.0 nm of the B4C capping
layer. The intensity of the shoulder relative to oxidized Mo is low and does not allow us to
evaluate eventual modulations.
Figure 3.16 O 1s XPS count rate and fitting curves of the Co/Mo2C_200°C sample (a),
intensity of the fitting Gaussian components of the O 1s spectra of the Co/Mo2C_200°C and
Co/Mo2C_600°C sample (b).
The C 1s XPS spectra of the Co/Mo2C_200°C sample, shown in Figure 3.17 (a), are
characterized by a main peak located at about 285 eV and three shoulders respectively located
at around 283 eV, 288 eV and 294 eV. According to Refs. [78,79], the peak at 283 eV can be
ascribed to carbide related to B-C bonds of pure B4C or Mo-C bonds of pure Mo2C, the peak
at 285 eV to surface graphitized carbon and the peak at 288 eV can be ascribed to B-C-O
bonds of oxidized B4C. The peak at 294 eV can be ascribed to C-O bands of oxidation of B4C.
The quantitative analysis of C 1s for the Co/Mo2C_200°C and Co/Mo2C_600°C sample
samples has been done by fitting the spectra with respectively three and four Gaussian
components peaks at 283, 285, 288 and 294 eV. The analysis of the C 1s peaks confirms the
previous analysis. The evolution of the carbide is very close to that of the B 1s component and
indicates the diffusion of B4C induced at 600°C annealing. It is not possible to distinguish in

Chapter 3 Study of Co/Mo2C multilayers
51
this case the contribution of Mo2C, but being very low signal coming from buried Mo2C; it
does not modify significantly the evolution of the intensity. The evolution of the graphitized
carbon, as expected, is very close to that of the O 1s component and confirms that thermal
annealing induces a progressive oxidation of about 1 nm of the capping layer.
Figure 3.17 C 1s XPS count rate and fitting curves of the Co/Mo2C_200°C sample (a),
intensity of the fitting Gaussian components of the C 1s spectra of the Co/Mo2C_200°C and
Co/Mo2C_600°C sample (b).
3.3.3 Conclusions
We studied the first buried Mo2C-on-B4C interface by using soft x-ray standing wave
enhanced photoemission from the Mo 3d, B 1s, C 1s, O 1s core levels by using a photon
energy close to the Co L3 edge and corresponding to the first Bragg peak of in the Co/Mo2C
multilayer. Samples annealed at 200°C and 600°C have been studied. The experimental
results have been compared with simulations to obtain information on the chemical state (e.g.
oxidation state) and interface morphology in terms of profiles of distribution of elements and
interdiffusion of B, oxidized B and C in the interface region. The results show the good
stability of the Mo2C-on-B4C interface upon annealing and the good protective action of the
B4C capping layer. The analysis showed no significant increase of the Mo2C-on-B4C interface
width, with only a small oxidation of 0.2 nm of the buried Mo2C first layer. The increase of
the surface carbide layer has been quantified to about 1.0 nm. The results confirm the
usefulness of XSW for this kind analysis of multilayer optics.

Chapter 3 Study of Co/Mo2C multilayers
52
3.4 Interface analysis of heat-treated Co/Mo2C multilayers
3.4.1 Introduction
The evolution of interface structure upon annealing has been widely studied. In Mo/Si
multilayers, it has been reported that the reflectivity decreases upon annealing owing to the
increase of interdiffusion at interfaces [81]. The Co/C multilayers showed an enhanced
reflectivity at annealing temperatures lower than 250°C due to phase separation [82].
Moreover a backward diffusion of two elements, from their mixtures to the pure elements, at
the interfaces was also observed in the Co/Au, Co/Ag, Co/C and CoN/CN multilayers
annealed up to 250°C [83–86].
In this part, we study the change of the interface properties of the Co/Mo2C multilayer
with the annealing temperature. The interface structure is studied by combining both non-
destructive methods (x-ray emission spectroscopy (XES), nuclear magnetic resonance (NMR)
spectroscopy, x-ray diffraction (XRD)) and destructive methods (time-of-flight secondary
ions mass spectroscopy (ToF-SIMS) and transmission electron microscopy (TEM)). The
comparison of the XES Co/Mo2C multilayer spectra with that of reference samples, a Mo2C
thin film and Co/C multilayer, is used to determine the chemical state of the C atoms within
the stack. NMR spectra of a Co3Mo disordered alloy and two Co/C multilayers (as-deposited
and 600°C) were also measured for reference. The depth distribution of the Co/Mo2C
multilayers was investigated using a ToF-SIMS instrument working in the dual-beam mode.
We also performed the XRD and TEM measurements to check the phase structure and
interface morphology of the Co/Mo2C samples annealed at different temperatures.
3.4.2 Experimental methods
We prepared some reference samples for helping the interface study of the Co/Mo2C
multilayer. A reference Mo2C thin film, with a thickness of about 60 nm, was deposited onto a
silicon substrate using the same deposition conditions as the Mo2C layers of the Co/Mo2C
multilayer. Three Co/C multilayers with the thickness of 2.0 nm for both Co and C layers in
one period were deposited on a silicon substrate using the same conditions as for the
Co/Mo2C multilayers. Two of them were annealed at 300°C and 600°C for one hour in a
furnace with a base of pressure of 3.0×10⁻⁴
Pa.
The C Kα emission (2p – 1s transition) from the Co/Mo2C multilayers and the
reference samples (Mo2C thin film and Co/C multilayer) was analysed. Graphite was also
Chapter 3 Study of Co/Mo2C multilayers
53
used as a reference material. The Mo valence states have not been studied since the
corresponding emission (Mo Lβ2, 4d – 2p3/2 transition), accessible with our spectrometer, is
not very sensitive to the chemical state of the molybdenum atoms. The same is true with the
Co atoms [87].
3.4.3 Results and discussion
1) X-ray emission spectroscopy
The C Kα emission bands emitted by the as-deposited and annealed at 600°C
Co/Mo2C multilayers as well as the Mo2C, graphite and Co/C multilayers references (for this
latter, as-deposited and annealed at 600°C), are presented in Figure 3.18. The spectrum of the
Co/Mo2C annealed at 300°C is the same as that of the as-deposited sample and is thus not
shown here. The spectra of the Co/Mo2C annealed at 400 and 500°C are not shown here as
they are the same as that of Co/Mo2C annealed at 600°C (Figure 3.18 (a)).
Figure 3.18 C Kα emission bands emitted by the as-deposited and annealed at 600°C
Co/Mo2C multilayers as well as the thin film Mo2C, graphite (a) and by (as-deposited and
annealed at 600°C) Co/C references, graphite and amorphous carbon from Refs.[87,88] (b).
Regarding the Co/C reference multilayers, the spectrum of the as-deposited Co/C
sample should be similar to one of the amorphous carbons if no interaction takes place within
the structure. The comparison with the spectra of amorphous C from Refs. [88,89] shows that
this is not the case (Figure3.18 (b)). This indicates that, in the as-deposited Co/C system,
some interaction exists between the C and Co atoms leading to intermixing between C and Co
layers. The consequence is a change in the density of C (and Co) valence states and thus in the
shape of the C Kα emission band. With respect to as-deposited Co/C, the spectrum of Co/C
annealed at 600°C shows a significant broadening and is close to that of graphite. These
results suggest that the Co and C atoms are intermixed within the as-deposited Co/C, while

Chapter 3 Study of Co/Mo2C multilayers
54
the annealing at 600°C induces the demixing of Co and C atoms and the "graphitization" of C
layers.
The spectrum of as-deposited Co/Mo2C is the same as that of both as-deposited Co/C
and of the Mo2C references. Thus the chemical state of the C atoms is not distinguishable in
this sample: the carbon atoms exist either in the form of Co and C mixture or in the form of
Mo2C compound or in both forms. Following annealing at 400°C and above, the spectra of
the Co/Mo2C multilayers show a slight broadening towards the high photon energy side. This
suggests that a slight change of the chemical state of the C atoms takes place from 400°C.
2) Zero-field nuclear magnetic resonance spectroscopy
NMR spectra of all Co/Mo2C multilayers as a function of the annealing temperature
are presented in Figure 3.19. It can be seen that the spectra of the as-deposited and 200°C
samples consist of a wide structure without any extra feature. For the 300, 400, 500 and
600°C annealed samples, a well-defined line is observed at around 221 MHz. This intense line
corresponds to bulk Co with an hcp-like structure [90]. However the frequency is lower than
the one expected for well crystallized hcp Co. As suggested in Ref. [91], this is most probably
due to the presence of a large amount of stacking faults within the layer. Regarding the as-
deposited and 200°C annealed samples the absence of a well-defined feature indicates that
most of Co atoms are mixed with other atoms (Mo or C). From 300°C, the intensity of the
221 MHz line increases with the annealing temperature while the low frequency (<220 MHz)
contributions stay almost unchanged. This indicates that the total amount of ferromagnetic Co
atoms as well as pure Co increase from 300°C and above. From the phase diagram of Co-Mo
system showing the existence of several ordered phases, it is unlikely that annealing the
samples result in a phase separation between Co and Mo. Therefore the strong intermixing
revealed by the as-deposited NMR spectra is more likely a mixing of Co and C atoms. Since
the Co carbides are not stable, the carbon atoms separate from Co-C mixed region upon
annealing. This phenomenon has also been reported by H. Bai et al. [85].
To check this interpretation, we measured the NMR spectrum of a reference Co3Mo
disordered alloy, as well as the spectra of the Co/C multilayers as-deposited and annealed at
600°C (Figure 3.20). The spectra of the Co3Mo disordered alloy and of the Co/C as-deposited
multilayer show a low frequency signal (<220 MHz) without bulk Co peak. However in both
cases the detailed shape of the NMR spectra is different from that of the Co/Mo2C as-
deposited sample. More interestingly, the spectrum of the Co/C sample annealed at 600°C
shows an intense peak at about 220 MHz that can be attributed to hcp-like Co. This behaviour
Chapter 3 Study of Co/Mo2C multilayers
55
is very similar to the one of the Co/Mo2C annealed multilayers. Therefore this strongly
suggests that the phase separation observed after annealing of the Co/Mo2C samples is due to
the incorporation of C onto the Co layers of the as-deposited samples, the molybdenum
staying outside the Co layer. The difference between the Co/Mo2C and Co/C multilayers is
attributed to the fact that the carbon content in the Co layer is different in the Co/C and
Co/Mo2C multilayers.
50 100 150 200 250
0.000
0.002
0.004
0.006
A s ‐depos ited
200°C
300°C
400°C
500°C
600°C
Spin echo intensity(a.u.)
F requenc y(MHz)
221 MHz
Figure 3.19 NMR spectra of the Co/Mo2C multilayers as a function of the annealing
temperature.
50 100 150 200 250
Spin echo intensity(a.u.)
F requenc y (MHz)
220MH z
C o/C _600°C
C o/Mo2C _600°C
C o3Mo reference
C o/C _as ‐depos ited
C o/Mo2C _as depos ited
0
Figure 3.20 NMR spectra of as-deposited and annealed at 600°C Co/Mo2C, compared to the
NMR spectra of Co3Mo disordered alloy and as-deposited and annealed at 600°C Co/C
references.
3) X-ray diffraction
The x-ray diffraction patterns of the as-deposited and 200°C to 600°C annealed
Co/Mo2C samples are presented in Figure 3.21 (a). A broad and low intensity Bragg peak is
observed at around 44° which corresponds to the Co (111) or Co3Mo (002) phases. The

Chapter 3 Study of Co/Mo2C multilayers
56
intensity of this feature increases slightly from the as-deposited sample to 500°C annealed
sample. After annealing at 600°C, the intensity increases much more showing a significant
structural change. This phenomenon can be related to the recrystallization of the Co layers
owing to the demixing of Co and C atoms after annealing or the crystallization of the
disordered Co3Mo mixture after annealing at high temperature.
In order to explain the change between Co and C layers upon annealing, we performed
the XRD patterns of the Co/C multilayers (Figure 3.21 (b)). There is no intense peak to be
seen. This means that the Co/C multilayers are mainly amorphous and the Co layers are not
crystallized. It should be noted that the thickness of Co layer in one period is about 2 nm. So
the probability of forming a crystalline phase in the stack is low.
38 40 42 44 46 48 50
600°C
500°C
400°C
300°C
Intensity(a.u.)
2 T heta (°)
C o(111)or C o3Mo(002)
As ‐depos ited
200°C
(a)
20 30 40 50 60
Intensity (a.u.)
2 Theta (°)
S i(103)
As ‐depos ited
300°C
600°C
C o/C multilayer(b)
Figure 3.21 Diffraction patterns of the Co/Mo2C samples: as-deposited, annealed at 200°C,
300°C, 400°C, 500°C and 600°C (a) and of the Co/C multilayers: as-deposited, 300 and
600°C (b).
4) Time of flight-secondary ions mass spectroscopy
Shown in Figure 3.22 are the ToF-SIMS depth profiles of C- ions of the as-deposited,
300 and 600°C Co/Mo2C samples. The amplitude of the signal in the middle of the profile is
normalized to unity to show the relative contrast of the ion signal. Then, for the sake of clarity,
the curves of 300°C and 600°C annealed samples are arbitrarily shifted. The periodic
modulation of C- ions signal gives evidence of the periodic structure of the multilayer. There
are only 29 periods for these three samples from the outermost period to the substrate,
meaning that the 30th
period is chemically modified. At the stack/substrate interface, this
period is mixed with the Si substrate and the C- profile presents a low amplitude signal at the
end of the profile.

Chapter 3 Study of Co/Mo2C multilayers
57
Figure 3.22 ToF-SIMS depth profiles of the C- ions for the as-deposited, 300°C and 600°C
annealed Co/Mo2C samples (Cs+, 1 keV, 59 nA).
The C-, Co
-, O
-, CoO
-, B
- and MoO2
- profiles toward the air/stack and stack/substrate
interfaces for the as-deposited, 300 and 600°C annealed samples are presented in Figure 3.23.
From the O- depth profiles, it can be deduced that oxidation took place at both interfaces.
Oxidation at the air/stack interface is due to the atmospheric contamination of the surface
layers during storage in air and transfer. Oxidation at the stack/substrate interface is due to the
native oxide on the silicon substrate. Similar phenomena were reported in Al/Mo/SiC
multilayers [33]. The oxidation of the first Mo2C layer in the stack was also reported by
Giglia et al. [92] and in the previous section. At the stack/substrate interface, the O- profile for
the 300°C and 600°C annealed samples is sharper than that of the as-deposited sample. This is
probably caused by the diffusion of oxygen atoms from the substrate into the stack after
annealing. We did not get the information about the combination between O and Mo atoms as
no difference in the MoO2- profile can be found when the annealing temperature is varied.
The oxidation at the stack/substrate interface explains why the 30th
period is not well detected.
Furthermore, in the case of as-deposited and 300°C annealed samples, the signal of the
CoO- ions at the air/stack and stack/substrate interfaces is more intense than in that of the
600°C annealed sample. For 600°C annealed sample, the signal of the CoO- ions is not
detected at the air/stack interface. Firstly, this indicates that Co layers are oxidized at
temperatures lower than 300°C and that the Co oxide decomposes at high temperature. The C-
and B- profiles do not show any significant change in the three samples.
3.0
2.5
2.0
1.5
1.0
0.5
0.0
No
rm I
nte
nsit
y (
a.u
.)
6005004003002001000
Sputtering time (s)
Surface Substrate
As-deposited
300°C
600°C
1
10 20
10 20
29
29
C-
1

Chapter 3 Study of Co/Mo2C multilayers
58
Figure 3.23 ToF-SIMS depth profiles of the C-, Co
-, O
-, CoO
-, B
- and MoO2
- ions at the
air/stack and stack/substrate interfaces domains for as-deposited (a), 300 (b) and 600°C (c)
annealed samples.
Figure 3.24 (a) shows the ToF-SIMS depth profiles of the Co-, CoMo
- and C
- ions of
the 600°C annealed sample. The Mo- profile follows the C
- profile (not shown). The C
- profile
displays a symmetrical shape and is almost in the opposite phase with respect to the Co-
profile. The Co- depth profile displays some shoulders which correspond to the maxima in the
CoMo- depth profile. This is attributed to a matrix effect since for ultra-thin layers it is not
possible to reach a steady sputtering regime before the end of the period. Figure 3.24 (b)
shows the comparison of the Co- and C
- ions profiles of the as-deposited and 600°C annealed
samples. Both ions profiles are normalized to unit for the sake of clarity. We cannot observe
any significant changes in the Co- depth profile between as-deposited and 600°C annealed
samples. The same situation is recorded for the C- depth profile except a slightly better
contrast for the sample annealed at 600°C with respect to the as-deposited sample.

Chapter 3 Study of Co/Mo2C multilayers
59
Figure 3.24 ToF-SIMS depth profiles of the Co-, CoMo
- and C
- ions for the 600°C annealed
sample (a) and comparison of depth profiles of the Co- and C
- ions for the as-deposited and
600°C annealed samples (b). ToF-SIMS depth profiles of Co- and CoMo
- ions are shifted
vertically for clarity.
5) Transmission electron microscopy
Figures 3.25 (a) and (b) show the HAADF and bright-field images of the Co/Mo2C as-
deposited sample, respectively. The HAADF image shows a nice periodic multilayer structure
since the individual layers are smooth. In the bright field image, Co layers appear bright and
Mo2C layers dark. We observe the appearance of dark areas in some Co layers, which
suggests the presence of some crystallites. In the high-resolution image shown in Figure 3.25
(c), we can observe the lattice fringes within the Co layers and at the interfaces, even if the
contrast between Co and Mo2C layers is poor, owing to their close mean atomic number.
Selected-area diffraction, shown in Figure 3.25 (d), gives evidence of mainly amorphous
structure in the stack. This observation is in agreement with the results of XRD. It is noted
that crystallites in the thin film cannot be detected with the XRD technique.
2.5
2.0
1.5
1.0
0.5
0.0
Inte
nsity (
a.u
.)
200180160140120100
Sputtering time (s)
Surface Substrate
(a)Co
- 600°C
CoMo-
5th
C-
2.0
1.5
1.0
0.5
0.0
Inte
nsity (
a.u
.)
200180160140120100
Sputtering time (s)
Surface Substrate
(b)
Co-
5th
C-
as-deposited 600°C

Chapter 3 Study of Co/Mo2C multilayers
60
Figure 3.25 Transmission electron microscopy of the Co/Mo2C as-deposited sample: HAADF
(a) and bright field image (b); high-resolution image (c) and selected-area diffraction (d).
3.4.4 Discussion
From the preceding analysis, it follows that the enhancement of ferromagnetic Co
signal above 300°C should be primary ascribed to a separation of Co and C atoms at the
interfaces. In the Co-C binary phase diagram, there is no stoichiometric compound resulting
from the reaction between Co and C [93]. In the Co-Mo binary phase diagram, Co3Mo, and
Co7Mo6 (µ and δ phase) are mentioned [94,95]. The Co-C-Mo ternary phase diagram gives
two ternary compounds Mo3Co3C and Mo6Co6C but there is a small possibility for their
formation in the Co/Mo2C multilayer because of their high formation temperature [96].
Otherwise, the XRD results show that no significant Co3Mo crystallites can be formed from
as-deposited to 500°C annealed samples. Therefore, we can deduce that intermixing takes
place for the as-deposited and 200°C annealed samples with a limitation of the Co3Mo
compound.

Chapter 3 Study of Co/Mo2C multilayers
61
Based on the Miedema’s macroscopic atom model [97], we can calculate the mixing
enthalpy of the Co-Mo and Co-C systems to confirm our results. The Miedema’s atom model
is described in appendix І. According to this model, which have been able to calculate the
enthalpy values for binary alloys, the calculated mixing enthalpy of Co-Mo system is shown
in Figure 3.26. It is always negative. This indicates that the Co and Mo compounds can easily
form. Moreover the mixing enthalpy decreases when the mole fraction of Mo changes from 0
to 0.45. However the ratio of atomic fraction between Co and Mo in the Co/Mo2C multilayer
stack is about 3:1 and thus the Mo atomic fraction is 0.25 (according to the designed thickness
of each layer). This means that the formation enthalpy of the Co and Mo compound always
decreases even if all Co atoms react with all Mo atoms in the Co/Mo2C multilayer, or in other
words, once Co and Mo compounds are formed and they cannot easily separate.
Figure 3.26 Simulated mixing enthalpy of the Co-Mo system.
The loss of the ferromagnetic Co signal in NMR could be ascribed to a disordered
mixture at the interface, such as CoxCy. Moreover, mixing enthalpy calculations in Ref. [98]
indicate that the Co-C system separates easily into two phases. This is testified by the NMR
results of the reference Co/C multilayers. From the change of the chemical state of C atoms
upon annealing and the increase of ferromagnetic Co signal above 300°C, we should pay
attention to the change of formation enthalpy for Mo-C mixing system.
The calculated mixing enthalpy of the Mo-C system is presented in Figure 3.27. We
can see that it is negative at C mole fraction below 0.45 and after increases sharply. In the
Co/Mo2C stack, the atomic fraction of Mo to C in the Mo2C layer is designed to be 2 (C mole
fraction is 0.33). That is to say, the Mo2C compound shows small possibility of phase

Chapter 3 Study of Co/Mo2C multilayers
62
separation. Moreover the thermal stability of Mo2C has been already demonstrated [63,99].
Regarding the results mentioned above, we infer that there is a possibility of excess C atoms
existing in the multilayer. Actually, this is demonstrated by the x-ray photoemission
spectroscopy results of thin film Mo2C, which gives the atomic ratio of 0.5 between Mo and C
atoms, i.e. MoC2.
Figure 3.27 Simulated mixing enthalpy for the Mo-C system.
Based on all the described results, we conclude that the Co atoms in the Co layers are
mixed with C atoms to form disordered alloy for as-deposited and 200°C annealed Co/Mo2C
samples. After annealing at 300°C and above, Co and C atoms demix from their mixed
regions and progress crystallization of Co layers take place upon annealing. However the
direction of demixing may not follow the growth direction of thin layers but other directions,
such as a direction parallel to the surface. This means that separated Co and C atoms do not
necessarily go back to their original layers. This phenomenon explains the decrease of the
reflectivity of the multilayer after annealing which is discussed in the Section 3.2.
A scheme of diffuse processing in the Co/Mo2C multilayer upon annealing is shown in
Figure 3.28. In the as-deposited sample, the interdiffusion between Co and C atoms exists at
the interfaces. The C atoms diffuse into the Co layer in a disorder way and destroy the pure
Co layer. After annealing, the Co and C atoms separate from their mixed region and both
atoms show a partial order arrangement, but the C atoms still stay in the Co layer. This
explains why we can obtain a ferromagnetic Co signal of the Co/Mo2C multilayer after
annealing by NMR spectroscopy.

Chapter 3 Study of Co/Mo2C multilayers
63
Note that the fact that Co and C atoms do not form a compound is in agreement with
results of the Section 3.2 where we fitted the EUV data taking into account the formation of
CoxCy compounds and no improvement was obtained. Therefore the results are not shown in
the Section 3.2. This indicates that only a small number of C atoms go into the Co layer and
this makes the Co layer lose ferromagnetic Co signal. However the whole periodic structure is
not destroyed. The TEM image and ToF-SIMS profile also demonstrate the periodic structure
of the multilayer.
Figure 3.28 Scheme of the diffusion in the Co/Mo2C multilayer upon annealing.
3.4.5 Conclusions
The interfacial and structural properties of Co/Mo2C multilayers with annealing were
characterized by the XES, NMR, ToF-SIMS, XRD and TEM. The Co/Mo2C multilayers show
a periodic structure, the Co and Mo2C layers in the stack being mainly amorphous. The
formation of oxide layers at both air/stack and stack/substrate interfaces are observed by the
ToF-SIMS. According to TEM results, some crystallites are present in the as-deposited
samples. The C Kα emission spectra of the Co/Mo2C multilayers annealed at 400°C and
above show a slight broadening with respect to that of the as-deposited sample, suggesting a
slightly change of the carbon chemical state. The NMR spectra demonstrate a demixing
phenomenon between Co and C in the multilayer stack after annealing. Comparing the NMR
spectroscopy results of the Co/Mo2C multilayers with these of the Co/C reference multilayers,
we find that Co and C mix together after deposition and then, after annealing at 300°C and
above, Co and C demix from their mixed regions and Co layers show progress crystallization
upon annealing. The Miedema’s model is used to calculate the mixing enthalpy and accounts
for the phenomenon of phase separation of the Co-C system.

Chapter 4 Study of Co/Mo2C/Y multilayers
64
Chapter 4 Study of Co/Mo2C/Y multilayers
In this Chapter, we present the optical performance and interface properties of
Co/Mo2C/Y tri-layer systems upon annealing. Two systems Co/Mo2C/Y and Co/Y/Mo2C, are
designed for working in the EUV range at near normal incidence. In Section 4.1 we
investigate the structural and optical properties of both systems by combing the XRR, NMR
and XRD techniques. Two fitting models are used to fit the reflectivity data and explain the
changes of the interface width in these systems upon annealing. Section 4.2 presents the TEM
observation for both systems after annealing. We analyzed the intensity profiles extracted
from the bright field images and obtain information on the interface width.

Chapter 4 Study of Co/Mo2C/Y multilayers
65
The contents of this chapter are based on the following papers:
4.1 Yanyan Yuan, Karine Le Guen, Jean-Michel André, Zhanshan Wang, Jingtao Zhu,
Christian Mény, Philippe Jonnard.Optical and structural characterization of the Co/Mo2C/Y
system. Applied Surface Science. In press.
4.2 Yanyan Yuan, Karine Le Guen, Jean-Michel André, Zhanshan Wang, Jingtao Zhu,
Corinne Ulahq, Christian Mény, Philippe Jonnard. Transmission electron microscopy
observation of Co/Mo2C/Y system. In preparation.
Chapter 4 Study of Co/Mo2C/Y multilayers
66
4.1 Optical and structural characterization of the Co/Mo2C/Y system
4.1.1 Introduction
In the Chapter 3 we studied the optical performance of Co/Mo2C multilayer. In this bi-
layer system, we cannot know clearly which interface, Co-on-Mo2C or Mo2C-on-Co, has
more influence on the optical performance. Thus in order to distinguish the two interfaces
contributions and improve the optical performance, we insert a third layer, yttrium, into the
Co/Mo2C multilayer stack. Two types of multilayers are formed: Co/Mo2C/Y with interfaces
Mo2C-on-Co, Y-on-Mo2C and Co-on-Y; Co/Y/Mo2C with interfaces Co-on-Mo2C, Y-on-Co
and Mo2C-on-Y.
The deposition order of the Y layer in the system cannot only significantly affect the
reflectivity but also the interfacial diffusion, as reported in the Co/Mg system with an
insertion of Zr layer [48]. The two designed systems Co/Mo2C/Y and Co/Y/Mo2C present a
theoretical reflectivity of 54% and 11% at near normal incidence, respectively. The reason for
the significant difference of reflectivity is the difference of the phase of beam reflected at each
interface. By changing the order of the material reflected beams go from a constructive
interference scheme to a destructive interference scheme.
4.1.2 Experimental details
The Co/Mo2C/Y and Co/Y/Mo2C systems were deposited by direct-current magnetron
sputtering. The substrates were sliced and polished Si (100) wafers, with surface roughness of
0.4 nm (rms) determined by atomic force microscopy in the range of 10-2
to 10 µm-1
spatial
frequencies. The designed period is 7.71 nm and the thickness of Co, Mo2C and Y layer was
1.00 nm, 2.67 nm and 4.04 nm, respectively. The base pressure was 10-5
Pa before deposition.
The working gas was argon (99.999% purity) at a constant working pressure of 0.1 Pa. The
number of periods is 30. There were six 10×10 mm2 substrate sections cleaved from a single
wafer for each system. Then six multilayers were deposited separately in the same conditions.
The first layer on the substrate for the Co/Mo2C/Y and Co/Y/Mo2C systems was the Co and
Mo2C layer, respectively. With our notation, the layers are indicated from the substrate
toward the surface. A 3.5 nm-thick B4C capping layer was deposited to prevent oxidation.
Five as-deposited samples of each system were annealed at 200, 300, 400, 500 and 600°C
during one hour under high vacuum to study their thermal behaviour.

Chapter 4 Study of Co/Mo2C/Y multilayers
67
First these two systems were characterized by the x-ray reflectometry (XRR) using Cu
Kα wavelength (0.154 nm) to check their quality. Then we measured the reflectivity with s-
polarized radiation at the application wavelength of 14.6 nm on the BEAR beamline at the
Elettra synchrotron radiation facility [56]. The photon energy was calibrated by the Si 2p3/2
binding energy at 99.2 eV. The reflectivity curves were obtained at the angle of 4° off-normal
incidence. We also performed the zero-field NMR spectroscopy for these samples. To identify
the phase present in our systems as a function of the annealing temperatures, we performed x-
ray diffraction of the Co/Mo2C/Y (as-deposited, 300 and 600°C) and Co/Y/Mo2C (as-
deposited) samples with Cu Kα radiation (0.154 nm).
4.1.3. Results and discussion
1) X-ray reflectometry at 0.154 nm
We show in Figure 4.1 the XRR curves of the Co/Mo2C/Y and Co/Y/Mo2C systems
before and after annealing. Six well-defined peaks are observed for both systems, indicating
that these multilayers possess a well-defined periodic structure. After 400°C annealing the
peak positions of the Co/Mo2C/Y multilayers shift toward high angles, which implies a period
decrease according to the Bragg law. Concerning the Co/Y/Mo2C systems, it is observed that
the Bragg peak position of the 600°C annealed sample significantly shift toward high angles.
We performed the fit of the XRR data with Bede Refs software (genetic algorithm) [55]
using a tri-layer model (no interlayer is taken into account). A good agreement between fitted
and experimental curves is obtained. As an example, we show in Figure 4.2 the results for the
Co/Mo2C/Y multilayers as-deposited and annealed at 600°C. The structural parameters are
listed in Table 4.1, except density. The density ratio, which is the density of the layer with
respect to the bulk value, is determined with a 15% uncertainty and within this uncertainty
there is no significant density change as a function of annealing. The period variation of each
sample is plotted in Figure 4.3 as a function of the annealing temperature. Δd represents the
period change before and after annealing. It can be seen that the period change of the
Co/Mo2C/Y system decreases quickly with temperature and then increases gently from 400°C.
The period of the Co/Y/Mo2C system decreases gradually upon annealing. Both systems show
compressed periods after annealing. This phenomenon can be explained by the interdiffusion
between two layers with the formation of compounds. Moreover the crystallization induced
by annealing can also effect the variation of period.

Chapter 4 Study of Co/Mo2C/Y multilayers
68
Figure 4.1 Reflectivity curves at 0.154 nm of the Co/Mo2C/Y and Co/Y/Mo2C systems before
and after annealing as a function of the grazing angle. For the sake of clarity, spectra of the
sample annealed at 200, 300, 400, 500 and 600°C as well as corresponding as-deposited
samples are shifted vertically.
Table 4.1 Structural parameters extracted from the fit of the XRR curves measured at
0.154 nm.
T/°C Sample
Period / nm
Before /after
annealing
Thickness / roughness nm (±0.05 nm)
B4C Co Mo2C Y
200°C Co/Mo2C/Y 7.56 / 7.55 3.02 2.00/1.00 1.32/0.33 4.23/0.29
Co/Y/Mo2C 7.52 / 7.55 3.96 0.89/0.55 2.91/1.03 3.75/0.30
300°C Co/Mo2C/Y 7.52 / 7.48 3.48 1.21/0.33 2.06/0.31 4.21/0.31
Co/Y/Mo2C 7.55 / 7.55 3.60 1.99/0.62 1.39/1.30 4.17/0.30
400°C Co/Mo2C/Y 7.59 / 7.39 3.77 0.90/0.12 2.22/0.26 4.27/0.72
Co/Y/Mo2C 7.41 / 7.41 3.37 1.91/0.44 1.31/0.97 4.19/0.38
500°C Co/Mo2C/Y 7.55 / 7.37 3.55 1.05/0.04 2.15/0.28 4.17/0.68
Co/Y/Mo2C 7.52 / 7.49 3.76 1.26/0.41 2.04/0.94 4.19/0.30
600°C Co/Mo2C/Y 7.59 / 7.46 3.10 1.94/0.96 1.38/0.33 4.14/0.36
Co/Y/Mo2C 7.46 / 7.37 3.90 1.70/0.31 1.71/0.12 3.96/0.67
Figure 4.2 Comparison of experimental and fitted data of the as-deposited and 600°C
annealed Co/Mo2C/Y samples. Curves of 600°C annealed sample are shifted vertically for the
sake of clarity.

Chapter 4 Study of Co/Mo2C/Y multilayers
69
Figure 4.3 Variation Δd of the period of the Co/Mo2C/Y and Co/Y/Mo2C systems upon
annealing with respect to the value of the as-deposited sample.
2) Extreme ultra-violet reflectivity with synchrotron radiation
Shown in Figure 4.4 (a) and (c) are the reflectivity measurements of the two systems
performed at the application wavelength of 14.6 nm for as-deposited and annealed at 300 and
600°C samples. In Figure 4.4 (b) and (d) we present the evolution of the reflectivity values as
a function of the annealing temperature. As can be seen the Co/Mo2C/Y multilayer achieves a
reflectivity of 27.5% with as-deposited sample; after annealing the reflectivity linearly
decreases to 17% at 600°C. The reflectivity of the Co/Y/Mo2C system is low, less than 2.5%.
This value is about 4 times smaller than the theoretical reflectivity (about 11%). One reason
for the loss of reflectivity may be the high sensitivity of Y to atomic oxygen: present in the
vacuum system during deposition. Montcalm [100]pointed that when the base pressure is
above 10-6
Pa, oxygen contamination of the Y layer leads to a decrease of reflectivity 3.2%
with respect to the value obtained with a base pressure of 10-8
Pa. In addition the deposition
order of the Y layer is an important factor, which can cause an asymmetrical interface width.
It should be noted that the reflectivity of the Co/Y/Mo2C sample increases slightly after
400°C. This could be related to the creation of compound or mixtures which changes the
optical contrast in the stack.
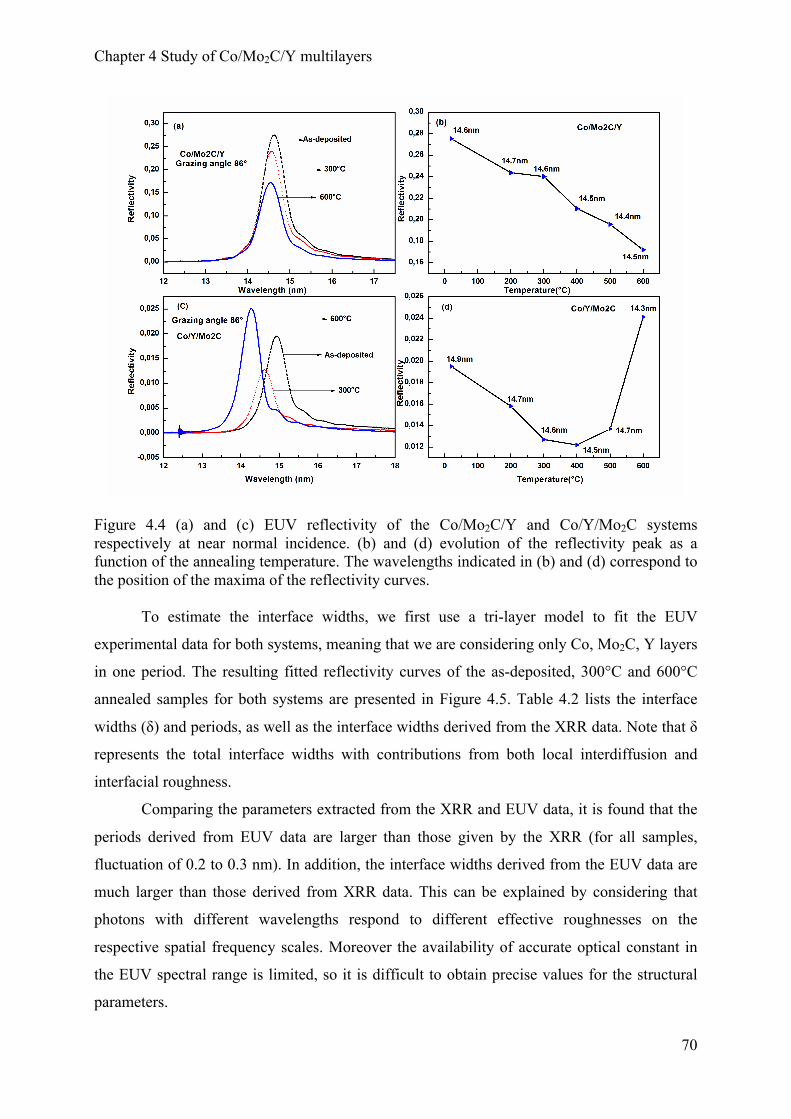
Chapter 4 Study of Co/Mo2C/Y multilayers
70
Figure 4.4 (a) and (c) EUV reflectivity of the Co/Mo2C/Y and Co/Y/Mo2C systems
respectively at near normal incidence. (b) and (d) evolution of the reflectivity peak as a
function of the annealing temperature. The wavelengths indicated in (b) and (d) correspond to
the position of the maxima of the reflectivity curves.
To estimate the interface widths, we first use a tri-layer model to fit the EUV
experimental data for both systems, meaning that we are considering only Co, Mo2C, Y layers
in one period. The resulting fitted reflectivity curves of the as-deposited, 300°C and 600°C
annealed samples for both systems are presented in Figure 4.5. Table 4.2 lists the interface
widths (δ) and periods, as well as the interface widths derived from the XRR data. Note that δ
represents the total interface widths with contributions from both local interdiffusion and
interfacial roughness.
Comparing the parameters extracted from the XRR and EUV data, it is found that the
periods derived from EUV data are larger than those given by the XRR (for all samples,
fluctuation of 0.2 to 0.3 nm). In addition, the interface widths derived from the EUV data are
much larger than those derived from XRR data. This can be explained by considering that
photons with different wavelengths respond to different effective roughnesses on the
respective spatial frequency scales. Moreover the availability of accurate optical constant in
the EUV spectral range is limited, so it is difficult to obtain precise values for the structural
parameters.

Chapter 4 Study of Co/Mo2C/Y multilayers
71
Figure 4.5 Comparison of experimental and fitted data for as-deposited, annealed at 300 and
600°C of the Co/Mo2C/Y and Co/Y/Mo2C systems. The incident angle is at 4° from normal.
Table 4.2. Interface widths (δ), period and thicknesses of the Co/Mo2C/Y and Co/Y/Mo2C
systems (as-deposited and annealed at 300 and 600°C) fitted with tri-layer model. The
uncertainty of interface width is about 0.05 nm.
T/°C Sample Period/nm
δCo-on-Mo2C
δY-on-Co
δMo2C-on-Y
/ nm
EUV/XRR
δMo2C-on-Co
δCo-on-Y
δY-on-Mo2C
/ nm
EUV/XRR
dCo/nm dMo2C/nm dY/nm
As-
deposited
Co/Mo2C/Y 7.76
--
--
--
1.05 / 0.98
0.65 / 0.30
1.65 / 0.35
1.20 2.61 3.95
Co/Y/Mo2C 7.97
1.15 / 0.95
1.30 / 0.57
1.26 / 0.39
--
--
--
1.30 2.67 4.00
300°C
Co/Mo2C/Y 7.74
--
--
--
0.94 / 0.33
1.30 / 0.31
1.15 / 0.31
1.24 2.53 3.97
Co/Y/Mo2C 7.77
1.00 / 1.30
1.27 / 0.62
1.27 / 0.30
--
--
--
1.32 2.50 3.95
600°C
Co/Mo2C/Y 7.74
--
--
--
1.00 / 0.96
2.00 / 0.36
1.30 / 0.33
1.20 2.59 3.95
Co/Y/Mo2C 7.56
1.00 / 1.20
1.01 / 0.31
1.33 / 0.67
--
--
--
1.23 2.38 3.95
The evolution of interface widths upon annealing allows assessing the thermal stability
of the multilayers. The interface widths of the Mo2C-on-Co and Co-on-Mo2C interfaces
derived from XRR and EUV data for all samples are close to the thickness of the Co layers

Chapter 4 Study of Co/Mo2C/Y multilayers
72
(designed to be 1.0 nm), those values derived from XRR data are larger than that of the Y-on-
Co, Co-on-Y, Mo2C-on-Y and Y-on-Mo2C interfaces. This implies that the Co layers are
probably mixed completely with other layers to form compounds or mixtures in the stack. In
addition, based on fitted parameters from the EUV data for the Co/Mo2C/Y multilayer, the
δMo2C-on-Co value stays close to 1.0 nm while δCo-on-Y value increases upon annealing and the
δY-on-Mo2C value slightly decreases upon annealing. At the opposite, in the Co/Y/Mo2C
multilayer, the three values of interface width δ do not significantly depend on annealing: this
indicates that the interdiffusion strongly takes place at the deposition time and thus there is no
more evolution of interdiffusion as a function of annealing temperature. This also illustrates
that the diffusion at the Y-on-Co and Mo2C-on-Y interfaces in the Co/Y/Mo2C multilayer is
easier than at the Co-on-Y and Y-on-Mo2C interfaces in the Co/Mo2C/Y multilayer.
3) Zero-field nuclear magnetic resonance spectroscopy
NMR spectra of the Co/Mo2C/Y as-deposited sample and two references, Co3Mo and
CoMo1% (atomic ratio) disordered alloys, are presented in Figure 4.6. All spectra are
normalized to their integrated area. The spectra of the samples annealed from 200 to 600°C
for the Co/Mo2C/Y and Co/Y/Mo2C systems show no signal (and thus, not are shown here).
The multilayer NMR spectrum shows no bulk Co peak (intense peak at 217 MHz for fcc Co)
but only a low frequency signal (<200 MHz). This demonstrates that the Co layers are
strongly mixed with the other atoms of the multilayer stack. In order to probe the influence of
the vicinity of Mo atoms on the resonance frequency of Co we have measured the reference
sample CoMo1%. As in Ref. [90,101] the peak at 176 MHz is attributed to the presence of
one Mo atom within the 12 first neighbors of a fcc Co atoms. This shows that the frequency
shift due to the presence of Mo atoms is very strong and explains why the NMR signal
obtained for the multilayer is mainly found at rather low frequencies. It can be seen that the
spectrum of the Co/Mo2C/Y as-deposited sample is very close to the one of bulk Co3Mo
disordered alloy. These observations strongly suggest that the Co layers are fully mixed with
Mo and that the Mo concentration in Co is of the order of 25at%. But we cannot get a
conclusive result: indeed if the Co atoms were totally surrounded by other atoms such as Y
atoms, no ferromagnetic signal would also be measured. At the present time, NMR spectra of
CoxYy compounds are unavailable.

Chapter 4 Study of Co/Mo2C/Y multilayers
73
Figure 4.6 NMR spectra of the Co/Mo2C/Y as-deposited sample and two reference samples
Co3Mo and CoMo1% (atomic ratio) disordered alloys.
4) X-ray diffraction
The XRD patterns of the Co/Mo2C/Y as-deposited, 300 and 600°C samples and the
Co/Y/Mo2C as-deposited samples are presented in Figure 4.7. A series of weak peaks are
detected in the 2θ=10-80° range for the Co/Mo2C/Y multilayer. The peak at 30° probably
corresponds to Y (002) [53,102,103] or Co3Mo (101). It is found that the intensity of this peak
decreases upon annealing, no peak shift being observed, which indicates that the pure Y
layers react upon annealing with atoms from the others layers. Another possible reason for the
decrease of the pure Y intensity is the interfacial diffusion during the annealing or amorphous
phase formation. The peak at 44° may be the combination of several phases, i.e. Co3Mo (002)
or Co2Y (222) or Co5Y (111) phase. The peak at 49° may correspond to MoC (101). The
compounds produced from Mo and Y are not easy to form because of their positive heat of
mixing being +26 kJ/mol [104] and consequently we exclude this possibility. From NMR
spectra, we know that there is no pure Co layer left in the stack and the NMR spectrum of the
Co/Mo2C/Y as-deposited sample is the same as that of the Co3Mo reference. Hence we
assume that the Co3Mo disordered alloy is formed at the interfaces. However, the combination
of the Co and Y atoms is also possible. The peaks around at 40° and 48° are unidentified. The
Co/Y/Mo2C as-deposited sample does not show intense peaks: this sample is mainly
amorphous.

Chapter 4 Study of Co/Mo2C/Y multilayers
74
Figure 4.7 X-ray diffraction patterns of the Co/Mo2C/Y as-deposited, 300 and 600°C samples
and the Co/Y/Mo2C as-deposited sample.
4.1.4 Discussion
From XRD and NMR results, a four-layer model is proposed to fit the EUV
reflectivity data. An interfacial reaction is considered and the model structure is designed as
Si/[Co3Mo/MoC/Y/Co2Y]30/Y2O3/YC2/B4C and Si/[Co2Y/Y/MoC/Co3Mo]30/B4C for the
Co/Mo2C/Y and Co/Y/Mo2C multilayers respectively. The fitting procedure is performed
using the Levenberg-Marquardt (MINIPACK-1) algorithm within IMD software [1]. The
thickness of the Y2O3 and YC2 layers is assumed to be 1.0 nm. We used the density of bulk
Co3Mo, Co2Y, Y2O3 and YC2 in the fits. Original Mo2C layers are modified as MoC layers
due to the Co3Mo formation. The parameters (thickness and interface width) derived from
these fits are collected in Table 4.3 for the Co/Mo2C/Y system. Figure 4.8 (a) shows the
resulting fitted spectra compared to those measured for the Co/Mo2C/Y (as-deposited and
annealed samples at 300 and 600°C). With respect to tri-layer model, this new set of fitted
reflectivity curves including surface oxidation layer and interlayers exhibits a slight
improvement, especially for as-deposited sample.
The interface widths are large with respect to the thickness of the Co3Mo and Co2Y
layer. Let us consider the atomic number per mole !!
0
i i i
i
i
s dN N
M
ρ ⋅ ⋅=
(4.1)

Chapter 4 Study of Co/Mo2C/Y multilayers
75
where !! is the Avogadro number, !! the layer density, !! the area of each layer, !! the
thickness of each layer and !! the atomic weight and subscript ! represents the type of the
atom. We can obtain the atomic ratio ! from
i
j
Nn
N=
(4.2)
where ! and ! represent the different atoms. Taking the Co/Mo2C/Y 600°C annealed sample as
an example, the thickness of Co, Mo2C and Y layer being 1.94 nm, 1.38 nm and 4.14 nm,
respectively (see Table 4.1), the atomic ratios of Co to Mo and Co to Y are 2.4 and 1.4,
respectively. This means that only a small amount of the Co3Mo and Co2Y compounds can be
formed by consuming the whole Co layers in one period.
In the case of the Co/Y/Mo2C multilayer, the fitted spectra with the four-layer model
are worse than that obtained from the tri-layer model (not shown here). In addition it is
mentioned that there is no peak found in the XRD pattern. This means that there is no (or few)
crystalline phase in the stack. However one possibility could exist: the formation of different
compounds. Thus a new model, Si/[Co2Y/Y2C/MoC]30/B4C, is proposed for fitting the EUV
reflectivity data of the Co/Y/Mo2C multilayer. The comparison of experimental and fitted (tri-
layer and a new model) reflectivity curves of the Co/Y/Mo2C multilayer (as-deposited and
annealed at 300 and 600°C) are shown in the Figure 4.8 (b). One can see that the fitted curves
obtained by using both models are close to the experimental curves. The parameters of each
layer are listed in the Table 4.3. The results show that the thickness of the MoC and Y2C layer
are stable and that of the Co2Y varies upon the annealing. Furthermore, the interface width of
the MoC-on-Y2C is very close the Y2C thickness. This indicates that a strong interdiffusion
takes place at the interfaces.
The two different fitting models of the Co/Mo2C/Y and Co/Y/Mo2C systems give a
good agreement with respect to the experimental data. This indicates that the formation of
compound or solid solution is dependent on the deposition order of the layers and also shows
that the formation of Co3Mo is located at the Mo2C-on-Co interface rather than at the Co-on-
Mo2C interface.

Chapter 4 Study of Co/Mo2C/Y multilayers
76
Figure 4.8 (a) Comparison of experimental and fitted (tri- and four-layer models) reflectivity
curves of the Co/Mo2C/Y multilayer (as-deposited and annealed at 300 and 600°C) and (b)
comparison of experimental and fitted (tri-layer and the new model) reflectivity curves of the
Co/Y/Mo2C multilayer (as-deposited and annealed at 300 and 600°C).
Table 4.3 Parameters of four-layer model to fit the Co/Mo2C/Y multilayer and of tri-layer
model to fit the Co/Y /Mo2C multilayer.
Sample Thickness / interface width /nm (±0.10 nm)
Co3Mo MoC Y Co2Y
As-deposited 1.50 / 0.60 2.10 / 0.84 3.05 / 0.70 1.10 / 0.50
Co/Mo2C/Y 300°C 1.50 / 0.80 2.10 / 1.02 3.12 / 0.85 1.01 / 0.50
600°C 1.50 / 0.85 2.06 / 1.62 3.05 / 1.00 1.10 / 0.50
MoC Y2C Co2Y
As-deposited 2.00 / 0.30 2.25 / 2.00 3.72 / 0.38
Co/Y/Mo2C 300°C 2.00 / 0.30 2.25 / 2.00 3.52 / 1.15
600°C 2.00 / 0.30 2.00 / 2.00 3.57/ 0.30
4.1.5 Conclusions
The optical and interfacial properties Co/Mo2C/Y and Co/Y/Mo2C systems were
investigated by a combination of reflectivity, XRD and NMR measurements. The results
showed that the Co/Mo2C/Y multilayers present a well-defined periodic structure; a peak
reflectivity of 27.5% at 14.6 nm at near normal incidence in the extreme ultraviolet was
obtained, while the Co/Y/Mo2C multilayer showed a poor reflectivity 2.5%. NMR spectra
results showed that there is no pure Co layer left in the stack since the Co layers are strongly
mixed with other layers in both systems. XRD patterns indicate that the crystalline phases in
the Co/Mo2C/Y multilayer are different from that in the Co/Y/Mo2C multilayer.

Chapter 4 Study of Co/Mo2C/Y multilayers
77
Based on the NMR and XRD results, we fitted the EUV data using different models
for two systems which take into account the formation of the Co3Mo, Co2Y and Y2C
compounds or solid solution. The Si/[Co3Mo/MoC/Y/Co2Y]30/Y2O3/YC2/B4C model to fit the
Co/Mo2C/Y multilayer and the Si/[Co2Y/Y2C/MoC]30/B4C model to fit the Co/Y/Mo2C
multilayer obtained the best agreement with the experiment spectra. Comparison of those
fitted results showed that the interdiffusion accompanied with the formation of compounds or
solid solution is responsible for the degradation of the reflectivity. These two systems with
different interfaces orders probably show the formation of different compounds or solid
solutions.

Chapter 4 Study of Co/Mo2C/Y multilayers
78
4.2 Transmission electron microscopy observation of Co/Mo2C/Y system
4.2.1 Introduction
The accurate observation of the interfacial structure in a multilayer stack is necessary
for improving the optical performance. An estimation of the interface width is generally
provided by the fit of hard x-ray reflectivity data. Cross-sectional transmission electron
microscopy can reveal the microstructure of the multilayers. Kessels [105] has reported that
the interface roughness, interlayer and the distribution of component in the multilayer can be
accurately estimated based on the analysis of the cross-sectional transmission electron
microscopy image.
In this part, we focus on the interfaces of the Co/Mo2C/Y and Co/Y/Mo2C tri-layer
multilayers. Using transmission electron microscopy and scanning transmission electron
microscopy (STEM) as well as energy dispersive spectrometry obtained in the STEM mode,
we observe the interface change in both systems. Intensity profile extracted from the bright
field image is used to analyze the interface width. We compare the interface behavior of each
system annealed at 300 and 600°C.
4.2.2 Experimental details
The preparation of sample cross-section has been described in the Chapter 2. The
lamellas of the cross-section of the Co/Mo2C/Y multilayers were measured. The STEM
images were generated by scanning the focused beam. High angle-annular dark field
(HAADF) image can be obtained simultaneously with bright field image, which known as Z-
contrast image. EDS was performed when working in the STEM mode and used to confirm
the constituent of each layer in one period. In-depth intensity profiles along the layers were
extracted from the bright field images in a rectangle plot by using Digital Micrograph
software to obtain the interface information. The thickness of periods and interfacial widths
were estimated through the intensity profile by the rule of 15-85%.
4.2.3 Results and discussion
1) Scanning transmission electron microscopy
Shown in Figure 4.9 are the HAADF images of the Co/Mo2C/Y_as-deposited, 300°C
and 600°C, Co/Y/Mo2C_300°C and 600°C annealed samples. All samples show a periodic

Chapter 4 Study of Co/Mo2C/Y multilayers
79
structure. About Co/Mo2C/Y multilayer, for the as-deposited sample, we can see a sharp
contrast at the interfaces in the Figure 4.9 (a). After annealing at 300°C, the interfaces show
no sharp contrast. This means that interdiffusions take place between layers and decrease the
Z-contrast. However at 600°C, the contrast at interfaces becomes clear. This suggests a slight
increase of Z-contrast between layers. For the Co/Y/Mo2C_300 and 600°C multilayers, layers
present sharp Z-contrast and clear interfaces, shown in Figure 4.9 (d) and (e). There are no
significant change of interfaces between 300 and 600°C annealed samples.
Figure 4.9 HAADF images of the multilayer samples: Co/Mo2C/Y_as-deposited (a) and
Co/Mo2C/Y_300°C (b), Co/Mo2C/Y_600°C (c), Co/Y/Mo2C_300°C (d), Co/Y/Mo2C_600°C
(e).
In the HAADF image, the contrast depends on the average atomic number of the
element, the bright regions correspond to the high atomic number element. In our case, the
average atomic number of Co, Mo2C and Y is 27, 30 and 39, respectively. Thus if no
interaction between layers take place the bright regions should indicate the Y layers in the
stack. In the Co/Mo2C/Y system the deposition order of layers from the substrate are Co,
Mo2C, Y and Mo2C, Co, Y for the Co/Y/Mo2C system. Therefore the first bright regions
should correspond to the Co and Mo2C layers and the dark region should indicate the Y layer.
The reason for this reverse contrast is probably due to the interdiffusion with formation of

Chapter 4 Study of Co/Mo2C/Y multilayers
80
some compounds. We find that the all multilayer stacks only have two layers in one period.
This is not in agreement with designed structure tri-layers in one period. This suggests that
strong intermixing takes place between two layers of them and changes the average atomic
number. In the Section 4.1, we have mentioned that both systems show a slight improvement
for fitting the extreme ultraviolet reflectivity data at application wavelength when taking into
account interdiffusion and creation of interfacial compound.
2) In-depth intensity profiles
We extract the in-depth intensity profile of multilayers along a few periods from the
bright field image of each sample. They are shown in Figure 4.10. The intensity of in-depth
intensity profile is related to the density of material and thickness of sample. Variations of
peak intensity are observed and caused by a variation of thickness of the cross-sectional
lamella samples when thinning them by using ion milling. All the maxima are normalized to
unity. Peaks correspond to the bright layer which is the position of Y layers in the stack. The
period thickness is determined by calculating the distance between two peaks. In order to
minimize the aberration, we take the average value obtained over almost all the periods of
stack. Hence, the thickness of one period is listed in Table 4.4. Comparing the fitted period
value derived from the hard x-ray reflectivity data; these results show a slight variation.
To obtain the detailed information of each layer in one period and interface between
layers, in-depth intensity profile of one period is magnified and shown in Figure 4.10 (b), (d),
(f), (h), (j) for all samples. The thickness of bright region can be determined by calculating the
full width at half maxima in the intensity profile. The thickness value is also listed in
Table 4.4. These values are close to the designed thickness of Y layer. The Mo2C and Co
layers in all samples mixed and thus cannot be discerned. The thickness of these mixed layers
is obtained by subtracting the Y layer thickness from the period, see Table 4.4. These values
are slightly difference from the fitted values derived from the XRR data.
In-depth intensity profiles of all samples exhibit an asymmetric shape and can be used
to obtain the interface width. For the Co/Mo2C/Y_as-deposited multilayer, the interface width
of the Y-on-Mo2C is determined to be 1.12 nm and slightly smaller than that of Co-on-Y
interfaces 1.33 nm. The interface width of both interfaces shows a slight variation upon
annealing. For the Co/Y/Mo2C multilayers, the interface widths of the Mo2C-on-Y and Co-
on-Y interfaces are determined to be 1.11 nm and 0.97 nm at 300°C. At 600°C, both interface
widths increase and the value of Y-on-Co interfaces is larger than that of Mo2C-on-Y
interface.

Chapter 4 Study of Co/Mo2C/Y multilayers
81
Table 4.4 Structural parameters of the Co/Mo2C/Y and Co/Y/Mo2C multilayers determined
from the in-depth intensity profile. The uncertainty of the interface width is about 0.1 nm.
Parameters
Co/Mo2C/Y Co/Y/Mo2C
As-
deposited 300°C 600°C 300°C 600°C
Period (±0.20 nm)-
intensity profile 7.68 7.48 7.66 7.61 7.65
Period (±0.05 nm)-
XRR fitting 7.67 7.48 7.46 7.55 7.37
dY 3.89 4.10 4.10 4.09 3.92
d Co+Mo2C 3.98 3.38 3.56 3.52 3.73
δ Y-on-Mo2C 1.12 1.36 1.20 -- --
δ Co-on-Y 1.33 1.17 1.30 -- --
δ Mo2C-on-Y -- -- -- 1.11 1.27
δ Y-on-Co -- -- -- 0.97 1.67

Chapter 4 Study of Co/Mo2C/Y multilayers
82
Figure 4.10 Bright field images and in-depth intensity profiles of few periods of the multilayer
stacks in the STEM mode. (a), (c), (e) (g) and (i) correspond to the Co/Mo2C/Y_as-deposited,
Co/Mo2C/Y_300°C, Co/Mo2C/Y_600°C, Co/Y/Mo2C_300°C, Co/Y/Mo2C_600°C,
respectively. The thickness of one period layers and interfacial widths are indicated. (b), (d),
(f), (h) and (j) are the detail of in-depth intensity profile.

Chapter 4 Study of Co/Mo2C/Y multilayers
83
3) Energy dispersive x-rays spectrometry (EDS)
Figure 4.11(a), (b), (c), (d) and (e) show EDS line-profiles performed in the HAADF-
STEM mode of the Co/Mo2C/Y_as-deposited, Co/Mo2C/Y_300°C, Co/Mo2C/Y_600°C,
Co/Y/Mo2C_300°C and Co/Y/Mo2C_600°C samples, respectively. By combining the
HAADF image and the EDS line profile, we find that the Y layers do correspond to the dark
regions. The Mo2C and Co layers correspond to the bright region. About the Co/Mo2C/Y_as-
deposited sample, in Figure 4.11(a), the Mo concentration profile shows a shoulder close to
the Co layers and corresponding to the maximum of the Co concentration profile. This
suggests that the Co layers do mix with Mo2C layers. The decreasing part of Mo and Co
concentration profiles is related to the increase part of Y concentration profile. This suggests
that a part Y layers mixed with Mo2C and Co layers. The Co/Mo2C/Y_300°C sample presents
the same behavior. For the Co/Mo2C/Y_600°C sample, in Figure 4.11(c), the shoulder in the
Mo concentration profile disappears. Its increasing part corresponds to the maximum of the
Co concentration profile. This suggests that interdiffusion between Mo2C and Co layers is
aggravated at 600°C.
For the Co/Y/Mo2C_300°C sample, in Figure 4.11(d), the decreasing part of the Mo
concentration profile corresponds to the maximum of the Co concentration profile and the
increasing part of the Y concentration profile. This suggests that the interdiffusion between
Mo2C and Co layers is stronger than that of between Mo2C and Y layers. The decreasing part
of the Co concentration profile corresponds to the increasing part of the Y concentration
profile. At 600°C, Figure 4.11(e), the maximum of the Mo concentration profile corresponds
to the maximum of the Co concentration profile and minimum of the Y concentration profile.
This suggests that the interdiffusion between Mo2C and Co layers increases at high
temperature. A large overlap between the Mo and Y concentration profiles suggests an
interdiffusion between the Mo2C and Y layers. However the interdiffusion between the Mo2C
and Y layers is probably due to the interaction between Y and C atoms at the interfaces.

Chapter 4 Study of Co/Mo2C/Y multilayers
84

Chapter 4 Study of Co/Mo2C/Y multilayers
85
Figure 4.11 HAADF images and EDS line-profiles of the multilayer samples: Co/Mo2C/Y_as-
deposited (a), 300°C (b) and 600°C (c), Co/Y/Mo2C_300°C (d) and 600°C (e).
4) High-resolution images and selected-area electron diffraction
Shown in Figure 4.12 are the high-resolution images and selected-area electron
diffraction (SAED) of both Co/Mo2C/Y and Co/Y/Mo2C systems. Figure 4.12(a) is related to
the Co/Mo2C/Y_as-deposited sample. We find that in the high-resolution image there are
some lattice fringes with different orientation which correspond to the crystallized regions in
the bright Y layers. This indicates that the Y layers are polycrystalline. Mo2C and Co do not
show significant lattice fringes and are amorphous. We observe a diffraction ring and some
bright spots in the SAED which probably corresponds to some crystallites. For the
Co/Mo2C/Y_300°C annealed sample, Figure 4.12(b), the lattices fringes become clear within
the Y layers, but the interfaces are not sharp which means a strong intermixing. Figure 4.12(c)
shows image of the Co/Mo2C/Y_600°C annealed sample and its substrate. We find that the
interfaces become clearer and shaper than that of the Co/Mo2C/Y_300°C annealed sample and
show a wavy shape. Some crystallites grow within the Y layers. Otherwise the substrate-on-
layers interface shows an interlayer with a thickness of 2.0 nm. This is probably due to the
formation of silicon oxide or intermixing between Si substrate and its nearest Co layer.
For the Co/Y/Mo2C system, high-resolution images and SAED patterns have been
recorded. Figure 4.12(d) and (e) correspond to the Co/Y/Mo2C_300 and 600°C annealed
samples, respectively. We find that lattice fringes are visible within the Y layers for both
samples and at 600°C they are also observed at the interfaces (marked in red box). In Figure
4.12(d), an interlayer with thickness of about 1.15 nm is observed at the substrate-on-layers
interface. SAED patterns without substrate corresponding to the Co/Y/Mo2C_300 and 600°C
annealed samples are also shown in Figure 4.12(d) and (e), respectively.
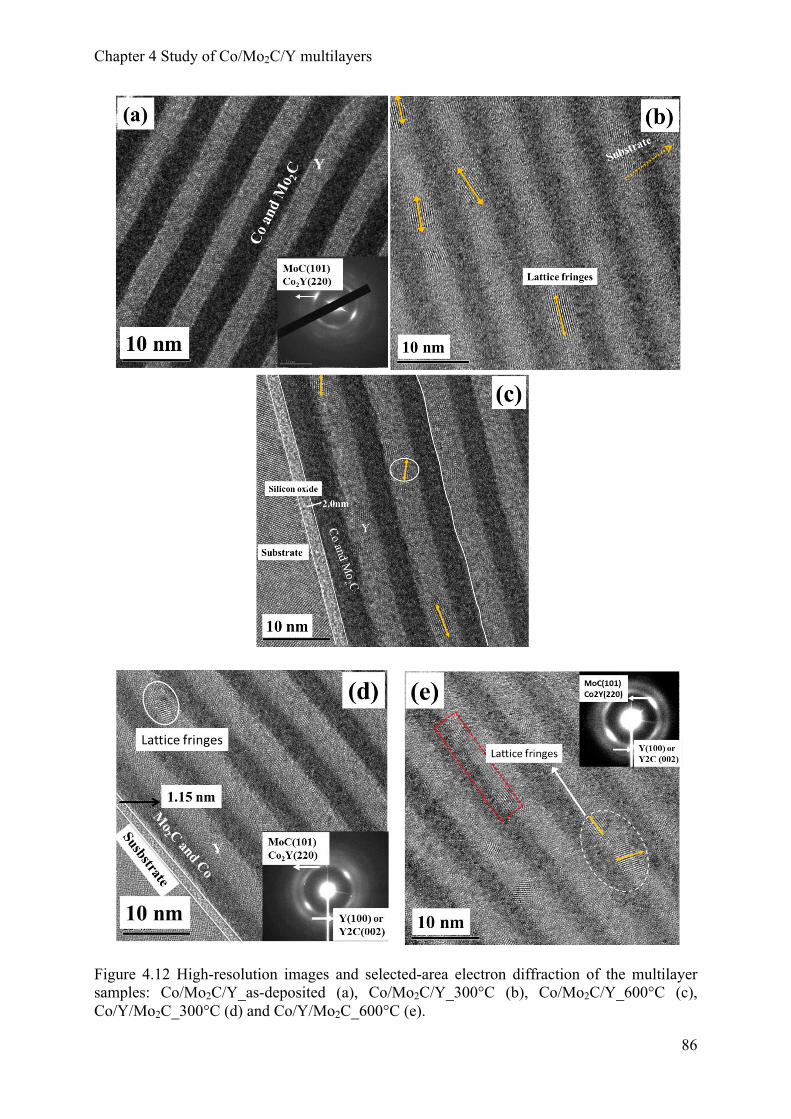
Chapter 4 Study of Co/Mo2C/Y multilayers
86
Figure 4.12 High-resolution images and selected-area electron diffraction of the multilayer
samples: Co/Mo2C/Y_as-deposited (a), Co/Mo2C/Y_300°C (b), Co/Mo2C/Y_600°C (c),
Co/Y/Mo2C_300°C (d) and Co/Y/Mo2C_600°C (e).

Chapter 4 Study of Co/Mo2C/Y multilayers
87
A series of diffraction rings are observed for both samples. In both SAED patterns, the first
ring (counted from center) is not homogeneous and is accompanied by some bright spots,
which are due to the presence of small crystallites. The second ring appears without bright
spots. This suggests that the multilayer structure is a combination of amorphous and some
crystallized zones. This is accordance with the presence of lattice fringes with different
orientations in the layers.
Comparing the high-resolution images of the Co/Mo2C/Y and Co/Y/Mo2C systems,
we find that the lattice fringes exist in Y layers for both systems. Some crystallites are formed
across the Y layers. The lattice spacing in the crystallites is determined to be about 0.3 nm
from the high-resolution image, which is consistent with the result of electron diffraction.
To give a clear description of multilayer structure, we present in Figure 4.13 two
diffusion pictures based on the preceding observation for both systems after annealing. Figure
4.13(a) represents the diffusion of the Co/Mo2C/Y multilayer stack. Co and Mo2C layers are
partly mixed and cannot be discerned in one period as the formation of mixture with average
atomic number close to that of Co or Mo2C. Crystallites with different sizes appear in the Y
layers. Regarding the Co/Y/Mo2C_600°C multilayer, crystallites appear not only in the Y
layers but also at the Mo2C-on-Y interfaces and the corresponding diffusion picture is shown
in Figure 4.13(b). Considering the impossibility to form a Y and Mo compound, these
crystallites are probably related with the disorder alloys or compound between Y and C atoms.
This explains the proposal of fitting model for Co/Y/Mo2C multilayer. This demonstrates that
the intermixing easily takes place when Mo and C atoms are deposited on the Y layers.
The presence of the crystallites can affect the interdiffusion and the formation of
interlayers. From the thermodynamic point of view, the free energy of crystallite decreases
with respect to that of amorphous structure and thus this can cause the decrease of driving
force for the interdiffusion. This suggests that the interdiffusion between Y and nearest Mo2C
layers is suppressed when Mo and C atoms are deposited on the Y layers. Hence, at 600°C,
the value of Mo2C-on-Y interfaces is smaller than that of Y-on-Co interfaces.

Chapter 4 Study of Co/Mo2C/Y multilayers
88
Figure 4.13 Scheme of diffusion of the Co/Mo2C/Y multilayers (a) and Co/Y/Mo2C
multilayer (b) after annealing.
The interface width obtained from the intensity profile is different from the value
derived from the fitting of x-ray reflectivity data. The reason is that the fitting values
represent the evaluation of interface width for the whole stack, while the values from the
intensity profile only represent the small part from the stack. From the HAADF image, we
only see two layers in one period, and Co and Mo2C layers are not distinguishable. Noting
that the average atomic numbers of Co (27) and Mo2C (30) are close, if Co and Mo2C layers
are mixed they could form some intermixtures having an average atomic number close to the
ones of Co or Mo2C. For example, the average atomic number of Co3Mo is 30. Consequently,
they cannot be recognized. It should be kept in mind that the interdiffusion is observed in the
annealed samples. However, the interdiffusion could also be introduced during deposition
where re-sputtering can occur. In the case of Co/Mo2C/Y system, after the deposition of a Co
layer, the Mo2C layer begins to grow on the deposited Co layer. Owing to the bombardment
of the energetic atoms, the arrival Mo and C atoms replace or mix with the Co atoms. After
annealing, the interdiffusion aggravates. This is demonstrated by the observation of interface
width of the Co/Mo2C/Y_300 and 600°C samples.

Chapter 4 Study of Co/Mo2C/Y multilayers
89
The observation of interdiffusion between Co and Y and Mo2C layers through the
TEM techniques also validate the results reported in the Section 4.1, which present no pure
Co in both systems after annealing.
4.2.4 Conclusions
The interfacial properties of Co/Mo2C/Y and Co/Y/Mo2C systems upon annealing
have been studied by using transmission electron microscopy. The HAADF-STEM images
show that all samples display two layers in one period, indicating that Co, Mo2C and Y layers
intermix before and after annealing. Co and Mo2C layers cannot be distinguished in one
period. From the high-resolution TEM image, we observe some crystallites in the Y layers
within all the samples. Furthermore the Co/Y/Mo2C sample annealed at 600°C shows some
crystallites at the interfaces. The quantitative in-depth intensity profiles of multilayer structure
extracted from the bright field images were analyzed to evaluate the interface widths of Co-
on-Y, Y-on-Mo2C, Y-on-Co and Mo2C-on-Y interfaces. They show different evolutions upon
annealing in both systems. TEM and in-depth intensity profiles provide a direct observation of
interface width and is good supplementary method for observing interface structure in the
multilayer stacks.

Chapter 5 Conclusions and perspectives
90
Chapter 5 Conclusions and perspectives
In this thesis we focused on the characterization of physico-chemical environment of
Co-based multilayers. Two systems, Co/Mo2C and Co/Mo2C/Y, have been studied by
combining non-destructive and destructive methods to investigate their interface properties.
The observation of interface changes of both systems upon annealing is important for
improving their optical performance.
We firstly investigated the optical performance and interface properties of Co/Mo2C
multilayers designed to work in the soft x-ray range at grazing incidence angle. The results
show that these multilayers can work up to 600°C. Then we measured the reflectivity at the
application wavelength of 1.59 nm. The best reflectivity (27%) was obtained for the
Co/Mo2C_300°C sample; the reflectivity was found to decrease to 20% annealed at 600°C.
We performed soft x-ray standing wave enhanced x-ray photoemission spectroscopy
to observe the evolution of the first buried interfaces of a B4C capped Co/Mo2C multilayer
mirror induced by annealing up to 600°C. Samples annealed at 200°C and 600°C have been
studied. The results show the good stability of the Mo2C-on-B4C interface upon annealing and
the good protective action of the B4C capping layer. The analysis shows no significant
increase of the Mo2C-on-B4C interface, with only a small oxidation of 0.2 nm of the buried
Mo2C first layer. XES and NMR results show for the as-deposited sample that Co atoms
mixed with C atoms coming from the Mo2C layer. After sample annealed at 300°C and above,
we observed that a demixing between Co and C atoms takes place. The calculation of mixing
enthalpy, using Miedema’s model, confirms phase separation of the Co-C system. However,
we should keep in mind that the Co and C atoms separated from their mixed region do not go
back their original layers. This means that there are no sharp interfaces between layers after
annealing. Co and C atoms are still in their original mixed region but show a short range order
after annealing. This can reduce the multilayer optical contrast and explains why the
reflectivity decreases after annealing. For this system, there are two interfaces: Co-on-Mo2C
and Mo2C-on-Co. New work is needed to make clear the effect of both interfaces on the
optical performance.
We designed tri-layer Co/Mo2C/Y systems with an insertion of a third material (Y)
into the Co/Mo2C multilayer. Two systems were designed with different interface orders:
Co/Mo2C/Y and Co/Y/Mo2C. Both systems show compressed periods after annealing. At
application wavelengths, the Co/Mo2C/Y multilayers show a high reflectivity (27.5%) for as-
deposited sample; then the reflectivity gradually decreases upon annealing. However the

Chapter 5 Conclusions and perspectives
91
Co/Y/Mo2C multilayers show a poor reflectivity. NMR spectroscopy indicates that there are
no pure Co layers left in both systems. But the NMR spectrum of the as-deposited
Co/Mo2C/Y sample is the same as that of the Co3Mo disordered alloy, indicating alloy is
formed at the Mo2C-on-Co interface. High-resolution transmission electron microscopy
shows that only two layers are observed in one period and the Co and Mo2C layers cannot be
recognized because of their close average atomic numbers. There are some crystallites in the
Y layers in both annealed systems. Furthermore, we observed some crystallites at the
interfaces of the Co/Y/Mo2C systems. Through analyzing the intensity profile extracted from
the bright field images we obtained the detailed description of interface width.
From the study of Co-based multilayers, we find that the interface properties of buried
structures can be well investigated by combing some non-destructive methods: XRR, XES
and NMR. This is a good example for analyzing buried interfaces within other systems.
Furthermore, the x-ray standing wave field generated by a multilayer structure has been
preliminary studied. The x-ray photoemission spectroscopy enhanced by XSW has been
successfully used to analyze the first buried interfaces. A model for analyzing the internal
interfaces within the multilayer stack is developed by using enhanced inflorescence by XSW.
The corresponding simulations of the depth distributions of the electric field and the energy
loss of the radiation were presented. This method would be a powerful tool for analyzing the
samples without damage.
Further experiments are needed to improve the interdiffusion mechanism in the Co-
based multilayers. For the Co/Mo2C multilayers, in order to identify the interdiffusion of Mo
and C components into the Co layers and to study the formation of compounds in the stack,
this could be realized by preparing a series of samples: Co/Mo and Co/C thin layer with
different thickness of Mo an C layers when thickness of Co layers are fixed or preparing
disordered alloys, and by performing the NMR spectroscopy, XES and near edge x-ray
absorption fine structure spectroscopy (NEXAFS) experiments. Concerning the Co/Mo2C/Y
system, in order to identify the formation of CoxYy, YxCy compounds, some reference CoxYy
and YxCy disordered alloys or Co/Y and Y/C thin layers should be prepared and NMR, XES
and NEXAFS used to improve the analysis of the Co/Mo2C/Y system.

Appendix І
92
Appendix І: Miedema’s model
The mixing enthalpy of the Co-Mo system, made of two transition metals, can be
expressed as:
( )
31
31
2
31
31
232
2
−−+
⎥⎦
⎤⎢⎣
⎡⎟⎠⎞⎜
⎝⎛ −+−−
=ΔCo
ws
Mo
ws
Co
ws
Mo
wsCoMoalloyMo
Mo
CoMo
nn
nnP
QVfPc
H
φφ (1.1)
where
S
Co
Mo
Co Cf = for non-ordered alloys
( )( )281S
Co
S
Mo
S
Co
Mo
Co CCCf += for ordered alloys
( )3232
32
CoCoMoMoMoMo
S
MoVcVcVcc +=
( )3232
32
CoCoMoMoCoCo
S
CoVcVcVcc +=
P=14.1, Q/P=9.4 V2/(d.u.)
2/3
Here, Coc and
Moc are the mole fraction (
Coc +
Moc =1),
oCV and
MoV are the atomic volumes of
Co and Mo, respectively, φ the electronegativity of components Co and Mo and wsn the
electron density at the first Wigner-Seitz boundary. The electron densities are usually given in
terms of density units (d.u.), 1 d.u.=6.75×10²²
electron/cm3. S
CoC and S
MoC are the surface
densities of Co and Mo atoms, respectively. !!"!" represents the degree to which an atomic cell
of Mo is in contact with dissimilar atomic cell of Co on average within the alloy. When we
calculate the atomic volume in the alloy, the atomic volumes of Co and Mo atoms are
approximated to be the same one. In equation (1.1), the first term is negative and proportional
to the square of difference in the electronegativity parameters and therefore the charge
transfer between Co and Mo. This part shows the tendency for compound formation. The
second term which is positive stands for the discontinuity in electron density at the Wigner-
Seitz boundary of Co and Mo atoms. This part shows the tendency of phase separation.
Another effect, which has to be considered, is the volume change of the constituents
Co and Mo that occurs due to charge transfer when the alloy is formed. The charge transfer
occurring between dissimilar atomic cells depends on the difference of the electronegative
parameters of Co and Mo. An empirical relationship for volume change has been established
( )[ ]CoMo
Mo
CopureMoalloyMo afVV φφ −+⋅= 132
32
(1.2)
where a is a constant equal to 0.04 for Mo and 0.1 for Co [106].

Appendix І
93
Table 1 Values of φ , wsn and V for calculating the mixing enthalpy of the Co-Mo system.
Element φ (V) wsn (d.u.) V (cm
3/mol)
Co 5.10 7.00 6.7
Mo 4.37 8.46 9.4
For the Mo-C system, the enthalpy change can be expressed as:
( ) ( )
( )[ ]metalelementCC
ws
Mo
ws
Mo
ws
C
wsMoCMoMoCC
C
MoC
CCHcnn
P
Rnn
P
QVcVcfPc
H →Δ+
+
⎥⎦
⎤⎢⎣
⎡−⎟
⎠⎞⎜
⎝⎛ −+−−+
=Δ −−31
31
2
31
31
232
32
2 φφ (1.3)
( )3232
32
CCMoMoMoMo
S
MoVcVcVcc +=
( )3232
32
CCMoMoCC
S
CVcVcVcc +=
P=14.1, Q/P=9.4 V2/(d.u.)
2/3 R/P=2.1 V
2
Here ( )metalmentCCH →Δ
ele stands for the transformation enthalpy of C into a metallic state
and the third term in the equation (1.3) represents a hybridization contribution and favors a
tendency of phase separation. For carbon, the corresponding transformation energy equals the
heat of fusion, 100 kJ/mol. To improve the agreement between predicted and experimental
values, the transformation energy has been changed to 180 kJ/mol [107].
As mentioned above, we need to consider the volume change of the C and Mo constituents
that occurs due to charge transfer when the alloy is formed. The relation is expressed as:
( )[ ]MoC
C
MopureCalloyC afVV φφ −+⋅= 132
32
(1.4)
where a is a constant equal to 0.04 for carbon.
It should be noted that in this model we did not calculate Gibbs free energy so entropy
is not taken into account.

References
94
References
1. D. L. Windt, "IMD - Software for modeling the optical properties of multilayer films,"
Comput. Phys. 12, 360–370 (1998).
2. E. Spiller, "Low-Loss Reflection Coatings Using Absorbing Materials," Appl. Phys. Lett.
20, 365–367 (1972).
3. M. Yamamoto and T. Namioka, "Layer-by-layer design method for soft-x-ray multilayers,"
Appl. Opt. 31, 1622–1630 (1992).
4. J. I. Larruquert, "General theory of sub-quarterwave multilayers with highly absorbing
materials," J. Opt. Soc. Am. A Opt. Image Sci. Vis. 18, 2617–2627 (2001).
5. J. I. Larruquert, "Layer-by-layer design method for multilayers with barrier layers:
application to Si/Mo multilayers for extreme-ultraviolet lithography," J. Opt. Soc. Am. A Opt.
Image Sci. Vis. 21, 1750–1760 (2004).
6. J. I. Larruquert, "Inreflectance: a new function for the optimization of multilayers with
absorbing materials," J. Opt. Soc. Am. A Opt. Image Sci. Vis. 22, 1607–1614 (2005).
7. J. I. Larruquert, "New layer-by-layer multilayer design method," J. Opt. Soc. Am. A Opt.
Image Sci. Vis. 19, 385–390 (2002).
8. J. I. Larruquert, "Reflectance enhancement in the extreme ultraviolet and soft x rays by
means of multilayers with more than two materials," J. Opt. Soc. Am. A Opt. Image Sci. Vis.
19, 391–397 (2002).
9. J. I. Larruquert, "Reflectance optimization of inhomogeneous coatings with continuous
variation of the complex refractive index," J. Opt. Soc. Am. A Opt. Image Sci. Vis. 23, 99–
107 (2006).
10. J. I. Larruquert, "Can multilayers be optimized sequentially when radiation is partially
polarized?," J. Opt. Soc. Am. A Opt. Image Sci. Vis. 23, 1967–1970 (2006).
11. A. V. Vinogradov and B. Y. Zeldovich, "X-ray and far uv multilayer mirrors: principles
and possibilities," Appl. Opt. 16, 89–93 (1977).
12. J.-P. Delaboudinière, G. E. Artzner, J. Brunaud, A. H. Gabriel, J. F. Hochedez, F. Millier,
X. Y. Song, B. Au, K. P. Dere, R. A. Howard, R. Kreplin, D. J. Michels, J. D. Moses, J. M.
Defise, C. Jamar, P. Rochus, J. P. Chauvineau, J. P. Marioge, R. C. Catura, J. R. Lemen, L.
Shing, R. A. Stern, J. B. Gurman, W. M. Neupert, A. Maucherat, F. Clette, P. Cugnon, and E.
L. V. Dessel, "EIT: Extreme-ultraviolet Imaging Telescope for the SOHO mission," Sol. Phys.
162, 291–312 (1995).
13. J. F. Seely, C. M. Brown, D. L. Windt, S. Donguy, and B. Kjornrattanawanich, "Normal-
Incidence Efficiencies of Multilayer-Coated Laminar Gratings for the Extreme-Ultraviolet
Imaging Spectrometer on the Solar-B Mission," Appl. Opt. 43, 1463–1471 (2004).
14. A. B. C. Walker, J. F. Lindblom, R. H. O’Neal, R. B. Hoover, and T. W. Barbee,
"Astronomical observations with normal incidence multilayer optics: recent results and future
prospects," Phys. Scr. 41, 1053 (1990).
15. "http://www.nasa.gov/mission_pages/iris/multimedia/sun-by-trace.html#.Upid9SfjPh8,".
16. A. B. Walker Jr, J. F. Lindblom, T. W. Barbee Jr, and R. B. Hoover, "Soft X-ray Images
of the Solar Corona with a Normal-Incidence Cassegrain Multilayer Telescope," Science 241,
1781–1787 (1988).
17. S. Bajt, J. B. Alameda, J. Barbee, W. M. Clift, J. A. Folta, B. Kaufmann, and E. A. Spiller,
"Improved reflectance and stability of Mo-Si multilayers," Opt. Eng. 41, 1797–1804 (2002).
18. M. Kado, K. Yamashita, M. Ohtani, K. A. Tanaka, R. Kodama, S. Kitamoto, T.
Yamanaka, and S. Nakai, "Development of a Schwarzschild-type x-ray microscope," Opt.
Lett. 16, 109–111 (1991).

References
95
19. J. B. Kortright, E. M. Gullikson, and P. E. Denham, "Masked deposition techniques for
achieving multilayer period variations required for short-wavelength (68-A) soft-x-ray
imaging optics," Appl. Opt. 32, 6961–6968 (1993).
20. J. Zegenhagen and A. Kazimirov, The X-Ray Standing Wave Technique: Principles and
Applications, Vol. 7. (2010).
21. M. J. Bedzyk, G. M. Bommarito, and J. S. Schildkraut, "X-ray standing waves at a
reflecting mirror surface," Phys. Rev. Lett. 62, 1376–1379 (1989).
22. S.-H. Yang, B. S. Mun, N. Mannella, S.-K. Kim, J. B. Kortright, J. Underwood, F.
Salmassi, E. Arenholz, A. Young, Z. Hussain, M. A. V. Hove, and C. S. Fadley, "Probing
buried interfaces with soft x-ray standing wave spectroscopy: application to the Fe/Cr
interface," J. Phys. Condens. Matter 14, L407 (2002).
23. S. Bajt, D. G. Stearns, and P. A. Kearney, "Investigation of the amorphous-to-crystalline
transition in Mo/Si multilayers," J. Appl. Phys. 90, 1017–1025 (2001).
24. A. Kloidt, K. Nolting, U. Kleineberg, B. Schmiedeskamp, U. Heinzmann, P. Müller, and
M. Kühne, "Enhancement of the reflectivity of Mo/Si multilayer x‐ray mirrors by thermal
treatment," Appl. Phys. Lett. 58, 2601–2603 (1991).
25. H. Takenaka and T. Kawamura, "Thermal stability of Mo/C/Si/C multilayer soft x-ray
mirrors," J. Electron Spectrosc. Relat. Phenom. 80, 381–384 (1996).
26. H.-J. Voorma, E. Louis, N. B. Koster, and F. Bijkerk, "Temperature induced diffusion in
Mo/Si multilayer mirrors," J. Appl. Phys. 83, 4700–4708 (1998).
27. M. H. Modi, G. S. Lodha, M. Nayak, A. K. Sinha, and R. V. Nandedkar, "Determination
of layer structure in Mo/Si multilayers using soft X-ray reflectivity," Phys. B-Condens.
Matter 325, 272–280 (2003).
28. R. S. Rosen, D. S. P. Vernon, G. Stearns, M. A. Viliardos, M. E. Kassner, and Y. Cheng,
"Silicide layer growth rates in Mo/Si multilayers," Appl. Opt. 32, 6975–6980 (1993).
29. T. Feigl, H. Lauth, S. Yulin, and N. Kaiser, "Heat resistance of EUV multilayer mirrors
for long-time applications," Microelectron. Eng. 57–58, 3–8 (2001).
30. S. Ogura, M. Niibe, Y. Watanabe, M. Hayashida, and T. Iizuka, "Comparison Among
Multilayer Soft X-Ray Mirrors Fabricated By Electron Beam, Dc-, Rf-Magnetron Sputtering
And Ion Beam Sputtering Deposition," Proc.SPIE, 140–149 (1988).
31. T. Feigl, S. Yulin, N. Benoit, and N. Kaiser, "EUV multilayer optics," Microelectron. Eng.
83, 703–706 (2006).
32. P. Jonnard, K. Le Guen, M.-H. Hu, J.-M. André, E. Meltchakov, C. Hecquet, F. Delmotte,
and A. Galtayries, "Optical, chemical and depth characterization of Al/SiC periodic
multilayers," Proc.SPIE, 73600O-73600O-9 (2009).
33. M.-H. Hu, K. Le Guen, J.-M. André, P. Jonnard, E. Meltchakov, F. Delmotte, and A.
Galtayries, "Structural properties of Al/Mo/SiC multilayers with high reflectivity for extreme
ultraviolet light," Opt. Express 18, 20019–20028 (2010).
34. Q. Zhong, Z. Zhang, J. Zhu, Z. Wang, P. Jonnard, K. Le Guen, Y. Yuan, J.-M. André, H.
Zhou, and T. Huo, "The thermal stability of Al(1%wtSi)/Zr EUV mirrors," Appl. Phys. -
Mater. Sci. Process. 109, 133–138 (2012).
35. Q. Zhong, Z. Zhang, J. T. Zhu, Z. S. Wang, P. Jonnard, K. Le Guen, Y. Y. Yuan, J.-M.
Andre, H. Zhou, and T. Huo, "The thermal stability of Al(1%wtSi)/Zr EUV mirrors," Appl.
Phys. -Mater. Sci. Process. 109, 133–138 (2012).
36. K. Le Guen, M.-H. Hu, J.-M. André, P. Jonnard, S. K. Zhou, H. C. Li, J. T. Zhu, Z. S.
Wang, and C. Meny, "Development and Interfacial Characterization of Co/Mg Periodic
Multilayers for the EUV Range," J. Phys. Chem. C 114, 6484–6490 (2010).
37. K. Le Guen, M.-H. Hu, J.-M. André, P. Jonnard, S.-K. Zhou, H.-C. Li, J.-T. Zhu, Z.-S.
Wang, N. Mahne, A. Giglia, and S. Nannarone, "Introduction of Zr in nanometric periodic
Mg/Co multilayers," Appl. Phys. Mater. Sci. Process. 102, 69 (2011).

References
96
38. R. S. Rosen, M. A. Viliardos, M. E. Kassner, D. G. Stearns, and S. P. Vernon, "Thermal
stability of Mo/Si multilayers," SPIE Proc. 212–220 (1992).
39. T. Böttger, D. C. Meyer, P. Paufler, S. Braun, M. Moss, H. Mai, and E. Beyer, "Thermal
stability of Mo/Si multilayers with boron carbide interlayers," Thin Solid Films 444, 165–173
(2003).
40. V. V. Kondratenko, Y. P. Pershin, O. V. Poltseva, A. I. Fedorenko, E. N. Zubarev, S. A.
Yulin, 1. V. Kozhevnikov, S. I. Sagitov, V. A. Chirkov, V. E. Levashov, and A. V.
Vinogradov, "Thermal stability of soft x-ray Mo-Si and MoSi2-Si multilayer mirrors," Appl.
Opt. 32, 1811–1816 (1993).
41. S. L. Nyabero, R. W. E. van de Kruijs, A. E. Yakshin, E. Zoethout, and F. Bijkerk,
"Thermally induced interface chemistry in Mo/B4C/Si/B4C multilayered films," J. Appl. Phys.
112, 054317–054317–5 (2012).
42. D. G. Stearns, M. B. Stearns, Y. Cheng, J. H. Stith, and N. M. Ceglio, "Thermally induced
structural modification of Mo‐Si multilayers," J. Appl. Phys. 67, 2415–2427 (1990).
43. S. Yulin, T. Feigl, T. Kuhlmann, N. Kaiser, A. I. Fedorenko, V. V. Kondratenko, O. V.
Poltseva, V. A. Sevryukova, A. Y. Zolotaryov, and E. N. Zubarev, "Interlayer transition zones
in Mo/Si superlattices," J. Appl. Phys. 92, 1216–1220 (2002).
44. A. Patelli, J. Ravagnan, V. Rigato, G. Salmaso, D. Silvestrini, E. Bontempi, and L. E.
Depero, "Structure and interface properties of Mo/B4C/Si multilayers deposited by rf-
magnetron sputtering," Appl. Surf. Sci. 238, 262–268 (2004).
45. I. Nedelcu, R. W. E. van de Kruijs, A. E. Yakshin, and F. Bijkerk, "Microstructure of
Mo/Si multilayers with B4C diffusion barrier layers," Appl. Opt. 48, 155–160 (2009).
46. S. Braun, H. Mai, M. Moss, R. Scholz, and A. Leson, "Mo/Si Multilayers with Different
Barrier Layers for Applications as Extreme Ultraviolet Mirrors," J. Appl. Phys. 41, 4074
(2002).
47. J. I. Larruquert, "Reflectance enhancement in the extreme ultraviolet and soft x rays by
means of multilayers with more than two materials," J. Opt. Soc. Am. A 19, 391–397 (2002).
48. K. Le Guen, M.-H. Hu, J.-M. André, S. K. Zhou, H. C. Li, J. T. Zhu, Z. S. Wang, C.
Meny, A. Galtayries, and P. Jonnard, "Observation of an asymmetrical effect when
introducing Zr in Mg/Co multilayers," Appl. Phys. Lett. 98, 251909–251909–3 (2011).
49. E. Meltchakov, A. Ziani, F. Auchere, X. Zhang, M. Roulliay, S. De Rossi, C. Bourassin-
Bouchet, A. Jérome, F. Bridou, F. Varniere, and F. Delmotte, "EUV reflectivity and stability
of tri-component Al-based multilayers," Proceeding SPIE 816819–816819 (2011).
50. J. Gautier, F. Delmotte, M. Roulliay, F. Bridou, M.-F. Ravet, and A. Jérome, "Study of
normal incidence of three-component multilayer mirrors in the range 20-40 nm," Appl. Opt.
44, 384–390 (2005).
51. J. Bosgra, E. Zoethout, A. M. J. van der Eerden, J. Verhoeven, R. W. E. van de Kruijs, A.
E. Yakshin, and F. Bijkerk, "Structural properties of subnanometer thick Y layers in extreme
ultraviolet multilayer mirrors," Appl. Opt. 51, 8541–8548 (2012).
52. C. Montcalm, B. T. Sullivan, M. Ranger, J. M. Slaughter, P. A. Kearney, C. M. Falco, and
M. Chaker, "Mo/Y multilayer mirrors for the 8-12 nm wavelength region," Opt. Lett. 19,
1004–1006 (1994).
53. P. Gupta, T. P. Tenka, S. Rai, M. Nayak, and G. S. Lodha, "Interface smoothing of soft x-
ray Mo/Y multilayer mirror by thermal treatment," J. Phys. Appl. Phys. 40, 6684–6689 (2007)
54. P. Jonnard, H. Maury, K. Le Guen, J.-M. André, N. Mahne, A. Giglia, S. Nannarone, and
F. Bridou, "Effect of B4C diffusion barriers on the thermal stability of Sc/Si periodic
multilayers," Surf. Sci. 604, 1015–1021 (2010).
55. M. Wormington, C. Panaccione, K. M. Matney, and D. K. Bowen, "Characterization of
structures from X-ray scattering data using genetic algorithms," Philos. Trans. R. Soc. Lond.
Ser. Math. Phys. Eng. Sci. 357, 2827–2848 (1999).

References
97
56. S. Nannarone, F. Borgatti, A. DeLuisa, B. P. Doyle, G. C. Gazzadi, A. Giglia, P. Finetti,
N. Mahne, L. Pasquali, M. Pedio, G. Selvaggi, G. Naletto, M. G. Pelizzo, and G. Tondello,
"The BEAR Beamline at Elettra," AIP Conf. Proc. 705, 450–453 (2004).
57.http://www2.lbl.gov/Science-Articles/Archive/sb/Oct-2004/1-ALS-What-Lies
Beneath.html
58. J.-M. André, A. Avila, R. Barchewitz, R. Benbalagh, R. Delaunay, D. Druart, P. Jonnard,
and H. Ringuenet, "MONOX: a characterization tool for the X-UV range," Eur. Phys. J. Appl.
Phys. 31, 147–152 (2005).
59. D. Drouin, A. R. Couture, D. Joly, X. Tastet, V. Aimez, and R. Gauvin, "CASINO V2.42:
a fast and easy-to-use modeling tool for scanning electron microscopy and microanalysis
users," Scanning 29, 92–101 (2007).
60. C. Bonnelle, F. Vergand, P. Jonnard, J.-M. André, P. F. Staub, P. Avila, P. Chargelègue,
M.-F. Fontaine, D. Laporte, P. Paquier, A. Ringuenet, and B. Rodriguez, "Instrument for
research on interfaces and surfaces," Rev. Sci. Instrum. 65, 3466–3471 (1994).
61. H. H. Johann, "Die Erzeugung lichtstarker Röntgenspektren mit Hilfe von
Konkavkristallen," Z. Für Phys. 69, 185–206 (1931).
62. T. Feigl, S. Yulin, N. Kaiser, and R. Thielsch, "Magnetron sputtered EUV mirrors with
high thermal stability," Proc. SPIE, 3997, 420–430 (2000).
63. F. Choueikani, F. Bridou, B. Lagarde, E. Meltchakov, F. Polack, P. Mercere, and F.
Delmotte, "X-ray properties and interface study of B4C/Mo and B4C/Mo2C periodic
multilayers," Appl. Phys. A 111, 191–198 (2013).
64. G. K. Johnson, W. N. Hubbard, and E. K. Storms, "The enthalpies of formation of Mo2C(c)
and Mo3C2(c) by fluorine bomb calorimetry," J. Chem. Thermodyn. 9, 1021–1026 (1977).
65. A. K. Petford-Long, Amanda K, M. B. Stearns, C.-H. Chang, S. R. Nutt, D. G. Stearns, N.
M. Ceglio, and A. M. Hawryluk, "High resolution electron microscopy study of x-ray
multilayer structures," J. Appl. Phys. 61, 1422 –1428 (1987).
66. M.-H. Hu, K. Le Guen, J.-M. André, S. K. Zhou, H. C. Li, J. T. Zhu, Z. S. Wang, C.
Meny, N. Mahne, A. Giglia, S. Nannarone, I. Estève, M. Walls, and P. Jonnard, "Investigation
of the thermal stability of Mg/Co periodic multilayers for EUV applications," Appl. Phys. A
106, 737–745 (2011).
67. "http://henke.lbl.gov/optical_constants/," http://henke.lbl.gov/optical_constants/.
68. G. A. Valkovskiy, M. V. Baidakova, P. N. Brunkov, S. G. Konnikov, M. A. Yagovkina,
and J. M. Zadiranov, "Study of roughness in multilayer Mo-Si mirrors," Phys. Status Solidi -
Appl. Mater. Sci. 208, 2623–2628 (2011).
69. M. Nayak, G. S. Lodha, and R. V. Nandedkar, "X-ray reflectivity investigation of
interlayer at interfaces of multilayer structures: application to Mo/Si multilayers," Bull. Mater.
Sci. 29, 693–700 (2006).
70. M. K. Tiwari and K. J. S. Sawhney, "Structural characterization of thin layered materials
using x-ray standing wave enhanced elastic and inelastic scattering measurements," J. Phys.
Condens. Matter 22, 175003 (2010).
71. J.-M. André, K. Le Guen, and P. Jonnard, "Oscillating dipole model for the X-ray
standing wave enhanced fluorescence in periodic multilayers," Spectrochim. Acta Part B At.
Spectrosc. 85, 55–61 (2013).
72. http://forge.epn-campus.eu/projects/ppm.
73. D. de Boer, "Glancing-incidence x-ray fluorescence of layered materials," Phys. Rev. B
44, 498–511 (1991).
74."http://www.elettra.trieste.it/images/Documents/BEAR/files/guide_fluorescence_detector.
pdf,".
75. S. Döring, F. Schönbohm, D. Weier, F. Lehmkühler, U. Berges, M. Tolan, C. S. Fadley,
and C. Westphal, "Standing-wave excited photoemission experiments on Si/MoSi2 multilayer

References
98
mirrors in the soft x-ray regime: An analytical modeling approach," J. Appl. Phys. 106,
124906 (2009).
76. N. Mahne, A. Giglia, L. Sponza, A. Verna, and S. Nannarone, "Soft-X study of buried
interfaces in stratified media," seventh international conference on thin film physics and
applicatons, international society for optics and photonics, 79951S–79951S–9 (2010).
77. N. Mahne, A. Giglia, S. Nannarone, J. Bertoli, V. Mattarello, and V. Rigato, "Quantitative
modelization of particle emission from excited solids: application to spectroscopic diagnostics
of buried interfaces in multilayeR," Proc. SPIE 65860V-65860V-10 (2007).
78. P. Reinke and P. Oelhafen, "The molybdenum–carbon interface: formation and electronic
structure of the carbide layer," Surf. Sci. 468, 203–215 (2000).
79. L. G. Jacobsohn, R. K. Schulze, M. E. H. Maia da Costa, and M. Nastasi, "X-ray
photoelectron spectroscopy investigation of boron carbide films deposited by sputtering," Surf.
Sci. 572, 418–424 (2004).
80. S. S. Perry and G. A. Somorjai, "Reaction layer formation and fracture at chemically
vapor deposited diamond/metal interfaces," J. Vac. Sci. Technol. Vac. Surf. Films 12, 1513–
1518 (1994).
81. V. I. T. A. de Rooij-Lohmann, A. E. Yakshin, R. W. E. van de Kruijs, E. Zoethout, A. W.
Kleyn, E. G. Keim, M. Gorgoi, F. Schäfers, H. H. Brongersma, and F. Bijkerk, "Enhanced
diffusion upon amorphous-to-nanocrystalline phase transition in Mo/B4C/Si layered systems,"
J. Appl. Phys. 108, 014314–014314–5 (2010).
82. H. L. Bai, E. Y. Jiang, C. D. Wang, and R. Y. Tian, "Enhancement of the reflectivity of
soft-x-ray Co/C multilayers at grazing incidence by thermal treatment," J. Phys. Condens.
Matter 8, 8763 (1996).
83. F. J. A. den Broeder, D. Kuiper, A. P. van de Mosselaer, and W. Hoving, "Perpendicular
Magnetic Anisotropy of Co-Au Multilayers Induced by Interface Sharpening," Phys. Rev.
Lett. 60, 2769–2772 (1988).
84. S. Luby and E. Majkova, "Tailoring of multilayer interfaces by pulsed laser irradiation,"
Appl. Surf. Sci. 248, 316–322 (2005).
85. H. L. Bai, E. Y. Jing, and C. D. Wang, "Interdiffusion in Co/C soft X-ray multilayer
mirrors," Thin Solid Films 286, 176–183 (1996).
86. H. L. Bai, E. Y. Jiang, and C. D. Wang, "Interdiffusion in CoN/CN soft X-ray multilayer
mirrors," Thin Solid Films 304, 278–285 (1997).
87. K. Le Guen, M.-H. Hu, J.-M. André, P. Jonnard, Z. Wang, J. Zhu, A. Galtayries, C. Mény,
E. Meltchakov, C. Hecquet, and F. Delmotte, "Characterization of EUV periodic multilayers,"
X-Ray Spectrom. 40, 338–342 (2011).
88. V. R. Galakhov and S. N. Shamin, "Ultrasoft X-ray spectroscopy with variation of the
electron excitation energy as a method for analyzing thin films and solid/solid interfaces,"
Bull. Russ. Acad. Sci. Phys. 73, 896–898 (2009).
89. S. Hosokawa, H. Sato, Y. Wang, E. Ohata, and A. Fukushima, "Soft X-ray emission study
of nano-structured carbon," J. Electron Spectrosc. Relat. Phenom. 137–140, 235–237 (2004).
90. M. Malinowska, C. Mény, E. Jedryka, and P. Panissod, "The anisotropic first-neighbour
contribution to the hyperfine field in hexagonal-close-packed Co: a nuclear magnetic
resonance study of diluted alloys and multilayers," J. Phys. Condens. Matter 10, 4919–4928
(1998).
91. S. Zoll, A. Dinia, J. P. Jay, C. Mény, G. Z. Pan, A. Michel, L. El Chahal, V. Pierron-
Bohnes, P. Panissod, and H. A. M. Van den Berg, "Influence of the growth technique on the
coupling and magnetoresistance of Co/Ru sandwiches," Phys. Rev. B 57, 4842–4848 (1998).
92. A. Giglia, S. Mukherjee, N. Mahne, S. Nannarone, P. Jonnard, K. Le Guen, Y.-Y. Yuan,
J.-M. André, Z.-S. Wang, H.-C. Li, and J.-T. Zhu, "Thermal effects on Co/Mo2C multilayer

References
99
mirrors studied by soft x-ray standing wave enhanced photoemission spectroscopy," Proc.
SPIE, 87770I-87770I-10 (2013).
93. K. Ishida and T. Nishizawa, "The C-Co (Carbon-Cobalt) system," J. Phase Equilibria 12,
417–424 (1991).
94. C. P. Heijwegen and G. D. Rieck, "Determination of the phase diagram of the Mo-Co
system using diffusion couples," J. Common Met. 34, 309–314 (1974).
95. K. P. Gupta, "The Co-Mo-W system (Cobalt-Molybdenum-Tungsten)," J. Phase
Equilibria 23, 274–275 (2002).
96. J. M. Newsam, A. J. Jacobson, L. E. McCandlish, and R. S. Polizzotti, "The structures of
the η-carbides Ni6Mo6C, Co6Mo6C, and Co6Mo6C2," J. Solid State Chem. 75, 296–304 (1988).
97. N. Das, J. Mittra, B. S. Murty, S. K. Pabi, U. D. Kulkarni, and G. K. Dey, "Miedema
model based methodology to predict amorphous-forming-composition range in binary and
ternary systems," J. Alloys Compd. 550, 483–495 (2013).
98. H.-L. Bai, E.-Y. Jiang, R.-Y. Tian, and C.-D. Wang, "Aging effect of Co/C soft X-ray
multilayer mirrors," Chin. Sci. Bull. 42, 454–457 (1997).
99. C. C. Tripathi, M. Kumar, and D. Kumar, "Atom beam sputtered Mo2C films as a
diffusion barrier for copper metallization," Appl. Surf. Sci. 255, 3518–3522 (2009).
100. C. Montcalm, B. T. Sullivan, S. Duguay, M. Ranger, W. Steffens, H. Pépin, and M.
Chaker, "In situ reflectance measurements of soft-x-ray/extreme-ultraviolet Mo/Y multilayer
mirrors," Opt. Lett. 20, 1450–1452 (1995).
101. C. Meny, E. Jedryka, and P. Panissod, "Satellite structure of 59
Co NMR spectra in some
Co alloys," J. Phys. Condens. Matter 5, 1547–1556 (1993).
102. Y. G. Chen and B. X. Liu, "Amorphous films formed by solid‐state reaction in an
immiscible Y–Mo system and their structural relaxation," Appl. Phys. Lett. 68, 3096 (1996).
103. B. Kjornrattanawanich and S. Bajt, "Structural Characterization and Lifetime Stability of
Mo/Y Extreme-Ultraviolet Multilayer Mirrors," Appl. Opt. 43, 5955–5962 (2004).
104. B. X. Liu and Z. J. Zhang, "Interface-generated vitrification in the Y - Mo system with a
small positive heat of mixing," J. Phys. Condens. Matter 8, L165–L171 (1996).
105. M. J. H. Kessels, F. Bijkerk, F. D. Tichelaar, and J. Verhoeven, "Determination of in-
depth density profiles of multilayer structures," J. Appl. Phys. 97, 093513–093513–8 (2005).
106. A. R. Miedema, P. F. de Châtel, and F. R. de Boer, "Cohesion in alloys - fundamentals of
a semi-empirical model," Phys. BC 100, 1–28 (1980).
107. A. K. Niessen and A. R. Miedema, "The “Macroscopic Atom” Model: An Easy Tool to
Predict Thermodynamic Quantities - Springer," Thermochem. Alloys 286, 29–54 (1989).

Appendix П
100
Appendix П: other publications
Publications as co-author:
[1]. Qi Zhong, Zhong Zhang, Wenbin Li, Jingtao Zhu, Zhanshan Wang, Philippe Jonnard,
Karine Le Guen, Yanyan Yuan, Jean-Michel André, Hongjun Zhou, and Tonglin Huo. Al/Zr
multilayer mirror and its thermal stability for EUV application. Journal of Physics: conference
series 425,152010 (2013).
[2]. Qi Zhong, Wenbin Li, Zhong Zhang, Jingtao Zhu, Qiushi Huang, Haochuan Li, Zhanshan
Wang, Philippe Jonnard, Karine Le Guen, Yanyan Yuan, Jean-Michel André, Hongjun Zhou,
and Tonglin Huo. Opical performance, structure and thermal stability of Al(1wt.-%Si)/Zr and
Al/Zr multilayers designed for the 17-19nm range. Chinese Optics Letters, 11, S10603
(2013).
[3]. Qi Zhong, Zhong Zhang, Jingtao Zhu, Zhanshan Wang, Philippe Jonnard, Karine Le
Guen, Yanyan Yuan, Jean-Michel André, Hongjun Zhou, and Tonglin Huo. The thermal
stability of Al(1%wtSi)/Zr EUV mirrors. Applied Physics A-Materials Science & Processing.
1, 133-138 (2012).

Appendix П
101
We also participated in the study of Al/Zr systems. This system was mainly studied by
the Tongji University of Shanghai collaborating with our team. The Al-based systems were
developed to work at the near normal incidence in the range of 17-19 nm. Al can be a good
spacer in the multilayer structure owing to its low absorption. Al/Zr multilayer has shown
promising optical performance in the EUV region. We studied the optical properties and
thermal stability of two kinds of Al/Zr (Al(1%wtSi)/Zr and Al(pure)/Zr) multilayers with the
same period number. Al(1%wtSi) layers were deposited by using the Al target with 1%
weight ratio of Si. They were prepared by using DC magnetron sputtering. We used the non-
destructive, XRR, XRD, EUV, XES and destructive, TEM characterization techniques to
investigate optical performance and thermal stability of both systems. All these techniques
were also employed in the characterization of Co-based multilayer.
The Al/Zr (Al(1%wtSi)/Zr and Al(pure)/Zr) multilayers showed different optical and
structural performances because of the presence of silicon in the Al layers. The thermal
stability of the two systems annealed up to 500°C was investigated. They show the first
significant structural changes after annealing at 250°C. The interlayers were transformed from
symmetrical to asymmetrical, where the Zr-on-Al interlayers are thicker than the Al-on-Zr
interlayers. In order to verify the reaction temperature of the transformation in two systems, a
detailed annealed procedure was performed. The results show that at low temperature the
interfaces consist of amorphous Al-Zr alloy, then at 295°C for Al(pure)/Zr and 298°C for
Al(1wt.-%Si)/Zr, they transform to polycrystalline Al-Zr alloy. This can decrease the surface
roughness and smooth the interfaces. Above 300°C, the interdiffusion becomes larger, which
can enlarge the differences between Zr-on-Al and Al-on-Zr interlayers.
Based on these analyses, it is demonstrated that the doping of Si into the Al layers can
smooth the interfaces, disfavor the crystallization of Al layer and consequently results in an
increase of reflectivity of the (Al(1%wtSi)/Zr multilayer with respect to the (Al(pure)/Zr
multilayer.

Appendix П
102

Appendix П
103

Appendix П
104

Appendix П
105

Appendix П
106

Appendix П
107

Appendix П
108

Appendix П
109

Appendix П
110

Appendix П
111

Appendix П
112
Appendix П
113

Appendix П
114
Appendix П
115

Appendix П
116

117
Caracterisation de l’environnement physico-chimique de miroirs
multicouches à base de cobalt travaillant dans les domaines des rayons X
mous et de l’extrême ultraviolet
Résumé:
Dans ce travail, nous nous concentrons sur la caractérisation de l'environnement
physico-chimique des éléments présents dans des multicouches à base de cobalt qui travaillent
dans les domaines des rayons X mous et extrême ultra-violet (EUV). L'observation des
modifications des interface des deux systèmes Co/Mo2C et Co/Mo2C/Y lors du recuit est
important pour l'amélioration de leurs performance optique. Ils ont été étudiés en combinant
des méthodes non destructives, spectroscopie d'émission des rayons X, résonance magnétique
nucléaire, réflectométrie de rayons X et des méthodes destructrices, spectrrométrie de masse
d’ions secondaires par temps de vol et la Microscopie électronique en transmission pour
étudier leurs propriétés interfaciales. Ce travail vise non seulement à la conception et la
fabrication de nouveaux éléments optiques pour faire face au développement des sources et
des applications dans les demaines des rayons X mous et l’EUV, mais aussi à développer une
méthodologie combinant des simulations et des expérimentations consacrée à l'analyse des
interfaces dans structures multicouches afin d'améliorer leur propriétés optiques.
Mots clés : multicouches à base de cobalt, Optique des rayons X et extrême ultraviolet, Réflectométrie
des rayons X (XRR), Spectroscopie d’Emission-X (XES), interfaces, diffusion, Spectroscopie de
Résonance Magnétique Nucléaire (RMN), Spectrrométrie de Masse d’Ions Secondaires par Temps de
Vol (ToF-SIMS), Microscopie Electronique en Transmission (TEM).
Characterization of physico-chemical environment of Co-based multilayers
mirrors working in the soft x-ray and EUV ranges
Abstract:
In this work, we focus on the characterization of physico-chemical environment of the
element present in Co-based multilayers working in the soft x-ray and EUV ranges. The
observation of interface changes of both systems Co/Mo2C and Co/Mo2C/Y upon annealing is
important for improving their optical performance. They were studied by combining non-
destructive methods, x-ray emission spectroscopy, nuclear magnetic resonance spectroscopy,
x-ray reflectometry and destructive methods, time-of-flight secondary ions mass spectroscopy
and transmission electron microscopy to investigate their interface properties. This work aims
not only at designing and fabricating new optical elements to face the development of sources
and applications in the EUV and soft x-ray ranges, but also at developing a methodology
combining simulations and experiments devoted to the interface analysis in these multilayer
structures in order to improve their optical properties.
Keywords: Co-based multilayer, x-rays and EUV optics, X-ray Reflectometry (XRR), X-ray Emission
Spectroscopy(XES), interfaces, diffusion, Nuclear Magnetic Resonance spectroscopy (NMR), Time-
of-Flight Secondary Ion Mass Spectroscopy (ToF-SIMS), Transmission electron spectroscopy (TEM).