Embed Size (px)
Citation preview
Open Access Journal of Agricultural Research ISSN: 2474-8846
Physico-Chemical Characterization of Soils for Fertilizer Recommendations for Some Districts in Bench-Maji Zone, South West, Ethiopia J Agri Res
Physico-Chemical Characterization of Soils for Fertilizer
Recommendations for Some Districts in Bench-Maji Zone,
South West, Ethiopia
Abitew M1* and Kebebew S2
1Horticulture Department, Debremarkos University, Ethiopia
2Horticulture Department, Wolkitie University, Ethiopia
*Corresponding author: Masresha Abitew Tarekegn, Horticulture Department, College
of Agriculture and Natural Resources, Debremarkos University, Ethiopia, Tel: +251-910211292; Fax: +251-587711764, E-
mail: [email protected]
Abstract
Understanding the characteristics of soils is prerequisite for designing appropriate management strategies towards
natural resource management for sustainable development. The study was therefore carried out at four districts in
Bench-Maji Zone with the objectives of determining soil physical and chemical characteristics for determining the
recommended rate of N and P fertilizer. The representative soil profiles for each site were opened. A total of 16 surface
and profile soil samples were collected for characterization of selected physicochemical properties of soils. The soil
characteristics employed during characterization and classification were soil texture, bulk density, porosity, soil color,
consistence, pH, organic carbon, total nitrogen, organic matter, C:N, available phosphorus, exchangeable bases, CEC, ECEC,
PBS, ESP, EC and available micronutrients. The soil morphological and chemical properties were characterized and the
recommended rates of N and P fertilizers for the districts were determined using NuMaSS (version 2.2) software. The
NuMaSS nutrient diagnosis result showed that, high probabilities of P and N deficiencies were observed in almost all
districts. It can thus be generalized that the soils of the districts have serious nutrient limitations. The prediction of
fertilizer requirement by NuMaSS showed, recommended amount of P for maize crop ranged from 0 kg P/ha to 67 kg
P/ha. Highest dose of P (67 kg P/ha) was required for soil of North-Bench followed by 52 kg P/ha for soils of Gurafarda,
47 kg P/ha for Soils of Debub-bench and no P required for soil of Jemu. The recommended amount of N for soils of
Gurafarda, Debub-Bench, North-Bench and Jemu were 0 kg N/ha, 98 kg N/ha, 68 kg N/ha and 69 kg N/ha respectively. In
addition, soil of Gurafarda, Debub-Bench, Jemu had no exchangeable Ca2+, Mg2+ and K+ problems. However, the soil of
North-Bench had low Ca2+, medium Mg2+ and deficient to marginal K+ contents. Besides to nutrient recommendation,
other management activity for the amelioration of these acidic soils is advisable. In general, management activities for
these soils; should be practiced, and the strategies for which should be determined according to the crops being grown.
Keywords: Characterization; Nutrient Status; Fertilizer Recommendation
Research Article
Volume 2 Issue 2
Received Date: February 03, 2017
Published Date: February 20, 2017

Open Access Journal of Agricultural Research
Abitew M and Kebebew S. Physico-Chemical Characterization of Soils for Fertilizer Recommendations for Some Districts in Bench-Maji Zone, South West, Ethiopia. J Agri Res 2017, 2(2): 000128.
Copyright© Abitew M and Kebebew S.
2
Abbreviations
Av.P: Available Phosphorus; BD: Bulk Density; BMZ: Bench-Maji Zone; CEC: Cation Exchange Capacity; CSA: Central Statistical Agency; DTPA: Diethylene triamine penta acetic Acid; EC: Electrical Conductivity; ECEC: Effective Cation Exchange Capacity; ESP: Exchangeable Sodium Percentage; FAO: Food and Agriculture Organization; NuMaSS: Nutrient Management Support System; OC: Organic Carbon; OM: Organic Matter; PBS: Percentage Base Saturation; SNNPR: South Nations Nationality and People Region; TN: Total Nitrogen; TP: Total Porosity; USDA: United State Department Of Agriculture; WRB: World Reference Base
Introduction
As agricultural production clearly depends upon the soil resources, the inherent characteristics of the soil greatly affect agricultural productivity of the country. Understanding soil properties and their productiveness under different land use systems has proved useful for sustainable development and efficient utilization of limited land resources [1]. Likewise, soil is an important non-renewable land resource determining the agricultural potential of a given area [2]. On the other hand, soil degradation and nutrient depletion caused by a number of socio-economic factors and other related inappropriate farming practices reduced productive capacity of the soil these have gradually increased and become serious threats to agricultural productivity [3]. This challenge will continue to exist as time goes and as population increases and the needs become increasingly complex. The rate of soil degradation is related to the management system, soil properties, vegetation, topography of the area, and the prevailing climatic condition [4]. Soil fertility depletion is the fundamental bio-physical cause for declining per capita food production in sub- Saharan African countries in general [5] and in Ethiopia in particular. Nutrient balance calculations for countries and also showed that Ethiopia was among the countries with the highest rates of net nutrient losses [6]. The annual nutrient deficit is estimated at 41 kg N, 6 kg P and 26 kg K ha -1. Thus, there is an urgent need to improve soil fertility and nutrient management in the country. Some research results showed that the success in soil management to maintain soil quality depends on the understanding of how soils respond to agricultural use
and practices over time [7]. Sustaining soil and environmental qualities is the most effective method for ensuring sufficient food supply to support life [8]. The quality of soil is controlled by its physical, chemical and biological components and by their interactions [9] and maintaining soil quality mainly depends on the knowledge of the physicochemical properties of a given soil [10]. This implies that understanding the characteristics of soils is prerequisite for designing appropriate management strategies thereby solving many challenges that the Ethiopians are facing in the crop and livestock production sectors and in their efforts towards natural resource conservation and management for sustainable development. However, understanding or assessing soil fertility status is difficult because most soil chemical properties either change very slowly or have large seasonal fluctuations; in both cases, it requires long-term research commitment [11]. Results of physical and chemical tests are quality indicators which provide information about the capacity of soil to supply mineral nutrients. Thus depletion of soil nutrient is a reversible constraint as long as soil test based fertilizer application is in place [12]. Even though, understanding soil physical, chemical and biological characteristics is a vital role in production and productivity of the agricultural sector on sustainable basis, there is no much information about the soils of the selected districts as a whole. In addition, the soil physical and chemical characteristics, fertility status and soil analysis based fertilizer recommendation of in the study areas are not yet investigated. Furthermore, farmers usually apply blanket recommendation of fertilizer in the study area irrespective of soil types and agro-ecology. Hence this paper aims to facilitate the recommendation of ways of managing such inherent constraints so as to maximize the productive potentials of these soils. Therefore, characterization and/or evaluation of soil properties is a master key for describing and understanding the status and qualities of the major nutrients in soils [13]. Therefore, there is a need to characterize soils to generate such information for improving productivity of crops in the districts in general. Therefore, this research was conducted with the following objectives;
Objectives:
1) Determining agriculturally important physical, chemical and morphological characteristics of soils of the selected districts, 2) Determining the recommended amount of N and P fertilizer for the of the districts

Open Access Journal of Agricultural Research
Abitew M and Kebebew S. Physico-Chemical Characterization of Soils for Fertilizer Recommendations for Some Districts in Bench-Maji Zone, South West, Ethiopia. J Agri Res 2017, 2(2): 000128.
Copyright© Abitew M and Kebebew S.
3
Materials and Methods
Description of the Study Area
The study was conducted at the four districts in Bench-Maji Zone (BMZ) during the 2013/2014 main cropping season. Bench-Maji Zone is situated in Southern Nations, Nationalities and People Regional State (SNNPR) in Southwestern part of Ethiopia. It is 560 km in the southwest direction of Addis Ababa. Geographically;
Bench-Maji Zone is located at 60052”N to 70 N latitude and 35.50021” E longitude with altitude ranging from 1400-2500 meters above sea level (masl). Bench-Maji Zone has a total estimated area of 19,252.00 square kilometer (sq.km). The area is characterized by diverse physio-geographic features with high and rugged mountains, flat topped plateau, deep gorges, incised river valleys and rolling plains (figure 1).
Figure 1: Location map of the study areas.
Soil Sampling and Sample Preparation
Prior to profile opening, a representative composite surface soil samples were collected randomly from the surface (0-20 cm depth) soils of each districts to determine the different physical and chemical properties of soils. Then, the representative soil profiles (1m X 1m X 1.5m) for each district were opened. The soil profiles were described at the field for morphological properties and samples were taken on genetic horizon basis for characterization of selected physicochemical properties. A total of 16 surface and profile soil samples were collected from the study areas and bagged, labeled and transported to the laboratory for preparation and analysis of selected soil physical and chemical properties. The soil samples were then air dried, mixed well, grounded, and passed through 2mm sieve and the laboratory analysis was conducted using the following standard procedures.
Soil Laboratory Analysis
Soil analysis was conducted at JIJE Analytical Testing Service Laboratory in Addis Ababa to determine selected physical and chemical properties, such as soil texture, bulk density, porosity, soil color, consistence, pH, OC, TN, OM, C:N, AP, exchangeable bases, CEC, ECEC, PBS, ESP, EC and available micronutrients. Particle size distribution was determined by the FAO hydrometer method [14] and the texture class name was identified on the basis of United State Department of Agriculture (USDA) textural triangle. Bulk density (BD) was determined from disturbed (bulk) soil samples collected from each horizon. The average soil particle density (PD) (2.65 g cm-3) was used for estimating total porosity as follows: Total porosity (%) = [1–(BD ⁄ PD)] x 100(1)

Open Access Journal of Agricultural Research
Abitew M and Kebebew S. Physico-Chemical Characterization of Soils for Fertilizer Recommendations for Some Districts in Bench-Maji Zone, South West, Ethiopia. J Agri Res 2017, 2(2): 000128.
Copyright© Abitew M and Kebebew S.
4
Soil color was described using the Munsell Soil Color Chart and the pH of the soils was determined in H2O (pH-H2O) and KCl (pH-KCl) using 1:2.5 soil to solution ratio using pH meter as outlined by Van Reeuwijk [15]. Organic carbon (OC) was determined by the wet acid dichromate digestion method [16] and soil organic matter (OM) will be calculated by multiplying percent OC by a factor of 1.724 whereas total nitrogen was analyzed by the Kjeldahl digestion followed by ammonium distillation and titrimetric determinations [17]. Analysis of available phosphorus was conducted following the procedure of the Bray-I method of extraction [18] using ascorbic acid as a reactant in the presence of antimony and determined spectrophotometer. Total exchangeable bases (Ca, Mg, K and Na) in the soil were extracted after leaching the soils with ammonium acetate (NH4OAc) solution at pH 7.0 [19]. Amounts of Ca2+ and Mg2+ in the leachate were analyzed by atomic absorption spectrophotometer and K+ and Na+ were analyzed by flame photometer. Cation exchange capacity (CEC) was determined at soil pH level of 7 after displacement by using 1N ammonium acetate method, thereafter, was estimated titrimetrically by distillation of ammonium that was displaced by sodium [20]. Percent base saturation (PBS) was calculated by dividing the sum of the base forming cations (Ca, Mg, Na and K) by the CEC of the soil and multiplying by 100. Available micronutrients (Fe, Mn, Zn, and Cu) were extracted with DTPA (DTPA Extract Flame AAS) as described by Lindsay and Norvell [21]. Electrical conductivity (EC) contents of the soils were analyzed using FAO- conductivity-water extract.
Statistical Analysis The data were analyzed using descriptive statistics and Nutrient Management Support System (NuMaSS) version 2.2 software. The soil morphological and chemical properties were characterized and the recommended amounts of N and P fertilizers across the four districts were determined using Nutrient Management Support System (NuMaSS) version 2.2 software.
Results and Discussions
Morphological Features and Description
Soils of Gurafarda (Kuja Pedon): Color at the surface soil might be accumulation leave liters of the area whereas, the change to subsurface soils due to drainage problem of iron oxides. The soil of Gurafarda had hard (dry), soft (moist), very sticky and moderate plastic (wet) consistencies at the surface horizons and changed to very hard, hard, and non-sticky and non-plastic in the lower subsoil horizons. This change may be due to differences in the clay and OM contents. Soils of Debub-Bench (Kersheka Pedon): The moist soil color at the surface were light reddish brown (2.5YR 7/3) and light red (2.5YR 6/6). But both the bottom subsurface horizon had the same red color (Table 1). In general the soil color changed slightly from light reddish brown topsoil to light red and then to red subsoil. From the data below at Debub-Bench the soil consistencies changed from slightly hard to moderate hard consistency (dry), very friable to friable (moist), and slightly sticky and slightly plastic to sticky and plastic through the profile.
Soil depth (cm) Color
Consistency
Dry Moist Wet
Stickiness Plastic
Soils of Gurafarda (Kuja- Pedon) 0-30(Surface soil) 2.5YR 3/1 Hard Soft Very sticky Moderate plastic
30-65 2.5YR 4/2 Hard Slightly hard Very sticky Moderate plastic
65-110 2.5YR 5/4 Very hard Moderate Hard Slightly sticky Slightly plastic
110- 140 2.5YR 6/6 Very hard Hard Non sticky Non plastic Soils of D. bench (Kersheka-Pedon)
0-30(Surface soil) 2.5YR 7/3 Slightly hard Very friable Slightly sticky Slightly plastic 30-50 2.5YR 6/6 Moderate hard Very friable Slightly sticky Slightly plastic
50-105 2.5YR 5/6 Moderate hard Friable Slightly sticky Slightly plastic 105-135 2.5YR 5/8 Slightly hard Friable Sticky Plastic
Soils of N. Bench (Zashi -Pedon)
0-30(Surface soil) 2.5YR 6/2 Loose Very friable Slightly sticky Very plastic
30-55 2.5YR 4/3 Slightly hard Very friable Moderate sticky plastic
Open Access Journal of Agricultural Research
Abitew M and Kebebew S. Physico-Chemical Characterization of Soils for Fertilizer Recommendations for Some Districts in Bench-Maji Zone, South West, Ethiopia. J Agri Res 2017, 2(2): 000128.
Copyright© Abitew M and Kebebew S.
5
55-98 2.5YR 7/2 Slightly hard Very Friable Very sticky Slightly plastic 98- 145 2.5YR 7/8 Moderate hard Firmed Moderate sticky Slightly plastic
Soils of Jemu (Bass-Pedon)
0-30(Surface soil) 2.5YR 4/4 hard Firmed Sticky Slightly plastic
30-57 2.5YR 4/3 hard Firmed Sticky Slightly plastic 57-117 2.5YR 4/8 hard Very firmed Slightly sticky Slightly plastic
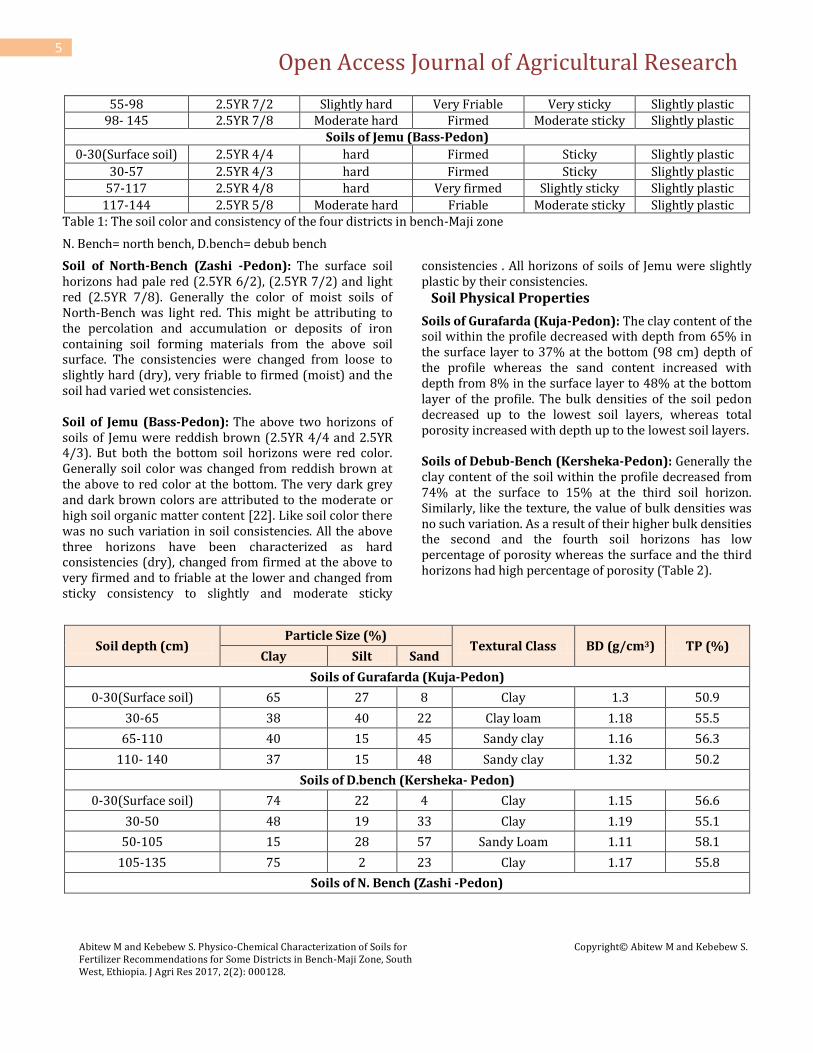
117-144 2.5YR 5/8 Moderate hard Friable Moderate sticky Slightly plastic Table 1: The soil color and consistency of the four districts in bench-Maji zone
N. Bench= north bench, D.bench= debub bench
Soil of North-Bench (Zashi -Pedon): The surface soil horizons had pale red (2.5YR 6/2), (2.5YR 7/2) and light red (2.5YR 7/8). Generally the color of moist soils of North-Bench was light red. This might be attributing to the percolation and accumulation or deposits of iron containing soil forming materials from the above soil surface. The consistencies were changed from loose to slightly hard (dry), very friable to firmed (moist) and the soil had varied wet consistencies. Soil of Jemu (Bass-Pedon): The above two horizons of soils of Jemu were reddish brown (2.5YR 4/4 and 2.5YR 4/3). But both the bottom soil horizons were red color. Generally soil color was changed from reddish brown at the above to red color at the bottom. The very dark grey and dark brown colors are attributed to the moderate or high soil organic matter content [22]. Like soil color there was no such variation in soil consistencies. All the above three horizons have been characterized as hard consistencies (dry), changed from firmed at the above to very firmed and to friable at the lower and changed from sticky consistency to slightly and moderate sticky
consistencies . All horizons of soils of Jemu were slightly plastic by their consistencies.
Soil Physical Properties
Soils of Gurafarda (Kuja-Pedon): The clay content of the soil within the profile decreased with depth from 65% in the surface layer to 37% at the bottom (98 cm) depth of the profile whereas the sand content increased with depth from 8% in the surface layer to 48% at the bottom layer of the profile. The bulk densities of the soil pedon decreased up to the lowest soil layers, whereas total porosity increased with depth up to the lowest soil layers. Soils of Debub-Bench (Kersheka-Pedon): Generally the clay content of the soil within the profile decreased from 74% at the surface to 15% at the third soil horizon. Similarly, like the texture, the value of bulk densities was no such variation. As a result of their higher bulk densities the second and the fourth soil horizons has low percentage of porosity whereas the surface and the third horizons had high percentage of porosity (Table 2).
Soil depth (cm) Particle Size (%)
Textural Class BD (g/cm3) TP (%) Clay Silt Sand
Soils of Gurafarda (Kuja-Pedon)
0-30(Surface soil) 65 27 8 Clay 1.3 50.9
30-65 38 40 22 Clay loam 1.18 55.5
65-110 40 15 45 Sandy clay 1.16 56.3
110- 140 37 15 48 Sandy clay 1.32 50.2
Soils of D.bench (Kersheka- Pedon)
0-30(Surface soil) 74 22 4 Clay 1.15 56.6
30-50 48 19 33 Clay 1.19 55.1
50-105 15 28 57 Sandy Loam 1.11 58.1
105-135 75 2 23 Clay 1.17 55.8
Soils of N. Bench (Zashi -Pedon)

Open Access Journal of Agricultural Research
Abitew M and Kebebew S. Physico-Chemical Characterization of Soils for Fertilizer Recommendations for Some Districts in Bench-Maji Zone, South West, Ethiopia. J Agri Res 2017, 2(2): 000128.
Copyright© Abitew M and Kebebew S.
6
0-30(Surface soil) 38 2 60 Sandy clay 1.07 59.6
30-55 31 7 62 Sandy clay loam 0.95 64.2
55-98 60 20 20 Clay 1.07 59.6
98- 145 79 15 6 Clay 0.99 62.6
Soils of Jemu (Bass-Pedon)
0-30(Surface soil) 44 9 47 Sandy clay 1.16 56.2
30-57 50 22 28 Clay 1.17 55.8
57-117 64 30 6 Clay 1.14 57
117-144 77 20 3 Clay 1.17 55.8
Table 2: Selected physical properties of the four districts in bench-Maji zone.
BD= bulk density, TP= total porosity, N. Bench= north bench, D.bench= debub bench Soil of North-Bench (Zashi-Pedon): Soil of North-Bench was found to contain more than 60% of sand at the upper two surface horizons. The soils at subsurface layers were dominant in clay but accumulation of silt was observed with a simultaneous decrease in sand content. Higher content of finer fractions (silt +clay) in lower depths might be due to the translocation of finer particles from the surface horizons and subsequent illuviation in sub surface horizons. These observations are in accordance with the results of Khan and Chatterjee [23]. Bulk density ranged from 0.95 to 1.07 g/cm3.
Soil of Jemu (Bass-Pedon): High amount of clay translocation was observed in the soil of Jemu, as evidenced by considerable increase in the clay content with an increase in depth. Clay content in the soil ranged from 44 to 77% and increased with depth. The accumulation of clay in the subsurface horizon could have been contributed by the in situ synthesis of secondary clays, the weathering of primary minerals in the B horizon, or the residual concentration of clays from the selective dissolution of more soluble minerals of coarser grain sized in the B horizon [24]. The bulk densities values increased with soil depth. The lower and higher bulk densities of the surface and subsurface soil layers might be the high soil organic matter, porosity and less disturbance of the subsurface soil. The total porosity (TP) was ranged from 55.8 at the subsurface to 56-57% at the soil surface. Higher OM content in the surface horizons makes soils loose, porous and well aggregated, thereby reducing bulk density and increasing total soil porosity.
Soil Chemical Properties and Soil Health
Soil Reaction (Soil pH): The vertical distribution of soil pH values for the four districts was characterized by an erratic trend from the top to bottom horizons, perhaps coinciding with different farming activities, vegetation cover, climate, and depositional regimes of the soil parent material. The soil of Gurafarda was characterized as slightly acidic which is ideal for most crop growth and nutrients availability as per the rating indicated by Tekalign [25]. The soil pH in soils of Debub-Bench ranged from moderately acidic (5.6) to neutral (6.78) by Tekalign. Unlike to soil pH of the remaining districts, the soil pH of North -Bench was strongly acidic as per rating by Tekalign[25]. Generally pH of soil of north-Bench was declining toward very strongly acid levels. This could be an indication of high leaching intensity of bases and their probable replacement by acid forming elements that are caused by the high amount of rainfall [26]. According to Tekalign [25] the soil pH of Jemu was classified as moderately acidic soil. In this pH range, optimum plant growth can be obtained as most plants are tolerant of a pH range of 5.5-6.5 which is near neutral pH range [27]. Generally all the soils were acidic, having a pH (H20) value <7.0 and base saturation <100% [28]. The acidic nature of these districts could be attributed partly to the high precipitation in the areas (Table 3). It has been reported that in regions of high rainfall, soils, become acidic by the leaching away of the basic cations by rainwater and the replacement of many of them by H+ [29].

Open Access Journal of Agricultural Research
Abitew M and Kebebew S. Physico-Chemical Characterization of Soils for Fertilizer Recommendations for Some Districts in Bench-Maji Zone, South West, Ethiopia. J Agri Res 2017, 2(2): 000128.
Copyright© Abitew M and Kebebew S.
7
Soil depth (cm) pH H2O (1:2.5) pH KCl EC (dS/m) ESP (%)
Soils of Gurafarda (Kuja-Pedon)
0-30(Surface soil) 6.5 4.77 0.03 0.8787
30-65 6.6 5.72 0.27 0.7649
65-110 6.4 5.1 0.07 0.3937
110- 140 6.2 4.59 0.04 0.8482
Soils of D.bench (Kersheka-Pedon)
0-30(Surface soil) 5.6 4.38 0.03 0.354
30-50 6.78 5.56 0.05 0.2953
50-105 6.5 5.44 0.07 0.2512
105-135 5.6 4.36 0.03 0.3743
Soils of N. Bench ( Zashi-Pedon )
0-30(Surface soil) 5.2 4.05 0.03 0.3223
30-55 5.12 3.93 0.03 0.1328
55-98 5.15 4.1 0.01 0.2783
98- 145 5.3 5.05 0.02 0.6331
Soils of Jemu (Bass-Pedon)
0-30(Surface soil) 5.94 4.75 0.05 0.188
30-57 5.75 4.68 0.06 0.3628
57-117 5.81 4.51 0.03 0.2368
117-144 5.94 4.77 0.03 0.2302
Table 3: Soil pH, electrical conductivity and exchangeable sodium percentage values for the four districts of bench-Maji zone.
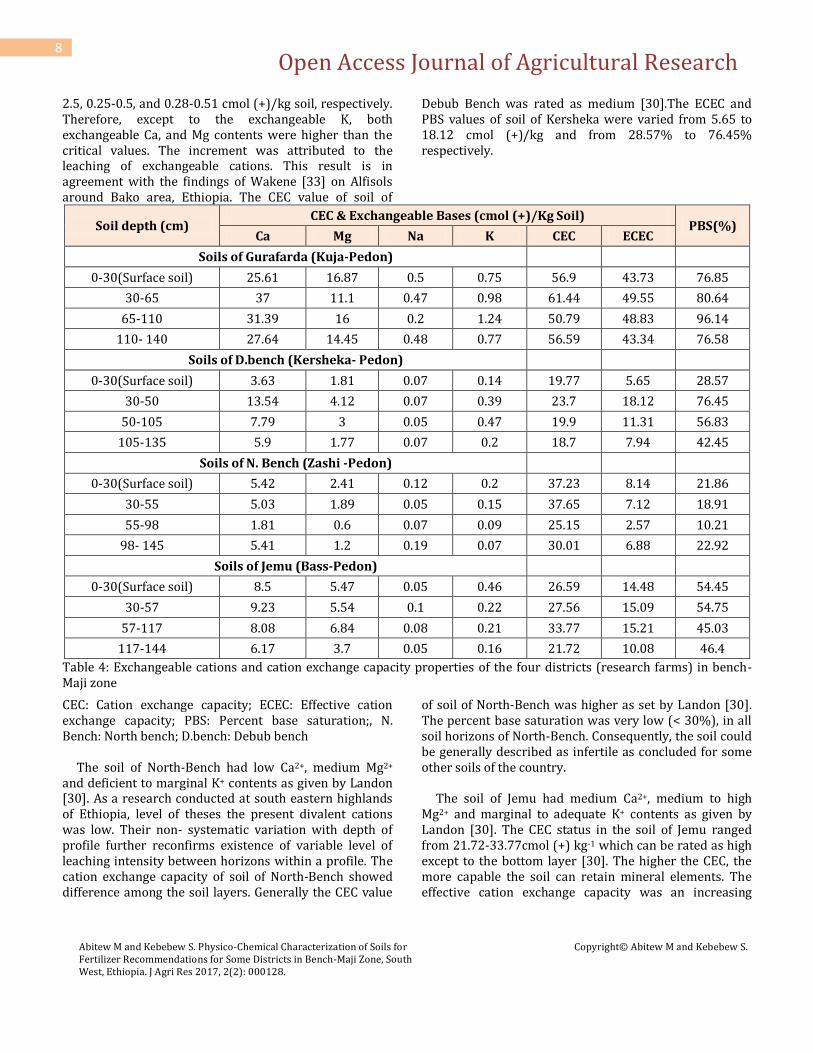
EC: Electrical conductivity; ESP: Exchangeable sodium percentage; dS: decisemeen; m: meter; N. Bench: North bench; D.bench: Debub bench The Electrical Conductivity (EC) and Exchangeable Sodium Percentage (ESP): The Electrical conductivity (EC) of soil of Gurafarda and soils of Debub-Bench was varied from 0.03 to 0.27 dS/m and from 0.03 to 0.07 ds/m respectively. Similarly the EC values of soil of North-Bench and Soils of Jemu was ranged from 0.01 to 0.03 ds/m and from 0.03 to 0.06 ds/m respectively. As the rate given by FAO (2006), all soils of the four districts were not salty as the electrical conductivity (EC) values were less than 0.75 ds/m. Similarly the ESP values were less than 15% therefore all soils of the four districts were not sodic. Exchangeable Cations and Cation Exchange Capacity Properties of Soils: Soil of Gurafarda had the highest levels of exchangeable Ca, Mg, Na, K, effective cation exchange capacity and cation exchange capacity.
According to Landon [30], exchangeable Ca, and Mg was categorized as very high which implies that returns are less likely optimized with additions of magnesium as external inputs in the form of fertilizers. Based on the classification set by Landon (1991), soil of Gurafarda is rich exchangeable potassium content. The cation exchange capacity (CEC) of soils ranges from 5 to 40 cmol(+)/kg the rate set by Landon [30].Thus soil of Gurafarda was therefore characterized as very high soil CEC values. More over the percent base saturation through soil of Gurafarda was higher. Soils having greater than 50% base saturation are considered as high based on the concept indicated by [31]. The soil of Debub Bench through all the profile was dominated by Ca followed by Mg, K and Na. Thus as the nutrient rate by Landon [30] , the soil had medium to high Ca and Mg contents and the K content was ranged from marginal to adequate content (Table 4). Furthermore, according to Sims [32] the range of critical values for optimum crop production for Ca, Mg and K are from 1.25-
Open Access Journal of Agricultural Research
Abitew M and Kebebew S. Physico-Chemical Characterization of Soils for Fertilizer Recommendations for Some Districts in Bench-Maji Zone, South West, Ethiopia. J Agri Res 2017, 2(2): 000128.
Copyright© Abitew M and Kebebew S.
8
2.5, 0.25-0.5, and 0.28-0.51 cmol (+)/kg soil, respectively. Therefore, except to the exchangeable K, both exchangeable Ca, and Mg contents were higher than the critical values. The increment was attributed to the leaching of exchangeable cations. This result is in agreement with the findings of Wakene [33] on Alfisols around Bako area, Ethiopia. The CEC value of soil of
Debub Bench was rated as medium [30].The ECEC and PBS values of soil of Kersheka were varied from 5.65 to 18.12 cmol (+)/kg and from 28.57% to 76.45% respectively.
Soil depth (cm) CEC & Exchangeable Bases (cmol (+)/Kg Soil)
PBS(%) Ca Mg Na K CEC ECEC
Soils of Gurafarda (Kuja-Pedon)
0-30(Surface soil) 25.61 16.87 0.5 0.75 56.9 43.73 76.85
30-65 37 11.1 0.47 0.98 61.44 49.55 80.64
65-110 31.39 16 0.2 1.24 50.79 48.83 96.14
110- 140 27.64 14.45 0.48 0.77 56.59 43.34 76.58
Soils of D.bench (Kersheka- Pedon)
0-30(Surface soil) 3.63 1.81 0.07 0.14 19.77 5.65 28.57
30-50 13.54 4.12 0.07 0.39 23.7 18.12 76.45
50-105 7.79 3 0.05 0.47 19.9 11.31 56.83
105-135 5.9 1.77 0.07 0.2 18.7 7.94 42.45
Soils of N. Bench (Zashi -Pedon)
0-30(Surface soil) 5.42 2.41 0.12 0.2 37.23 8.14 21.86
30-55 5.03 1.89 0.05 0.15 37.65 7.12 18.91
55-98 1.81 0.6 0.07 0.09 25.15 2.57 10.21
98- 145 5.41 1.2 0.19 0.07 30.01 6.88 22.92
Soils of Jemu (Bass-Pedon)
0-30(Surface soil) 8.5 5.47 0.05 0.46 26.59 14.48 54.45
30-57 9.23 5.54 0.1 0.22 27.56 15.09 54.75
57-117 8.08 6.84 0.08 0.21 33.77 15.21 45.03
117-144 6.17 3.7 0.05 0.16 21.72 10.08 46.4
Table 4: Exchangeable cations and cation exchange capacity properties of the four districts (research farms) in bench-Maji zone
CEC: Cation exchange capacity; ECEC: Effective cation exchange capacity; PBS: Percent base saturation;, N. Bench: North bench; D.bench: Debub bench The soil of North-Bench had low Ca2+, medium Mg2+ and deficient to marginal K+ contents as given by Landon [30]. As a research conducted at south eastern highlands of Ethiopia, level of theses the present divalent cations was low. Their non- systematic variation with depth of profile further reconfirms existence of variable level of leaching intensity between horizons within a profile. The cation exchange capacity of soil of North-Bench showed difference among the soil layers. Generally the CEC value
of soil of North-Bench was higher as set by Landon [30]. The percent base saturation was very low (< 30%), in all soil horizons of North-Bench. Consequently, the soil could be generally described as infertile as concluded for some other soils of the country. The soil of Jemu had medium Ca2+, medium to high Mg2+ and marginal to adequate K+ contents as given by Landon [30]. The CEC status in the soil of Jemu ranged from 21.72-33.77cmol (+) kg-1 which can be rated as high except to the bottom layer [30]. The higher the CEC, the more capable the soil can retain mineral elements. The effective cation exchange capacity was an increasing

Open Access Journal of Agricultural Research
Abitew M and Kebebew S. Physico-Chemical Characterization of Soils for Fertilizer Recommendations for Some Districts in Bench-Maji Zone, South West, Ethiopia. J Agri Res 2017, 2(2): 000128.
Copyright© Abitew M and Kebebew S.
9
trend through soil profile of soil of Jemu except the bottom horizon. The percent base saturation of this soil ranged from 45.03% at horizon two to 54.75% at horizon one which indicates a high fertility of the soil because many of the bases those contribute to it, are plant nutrients.
Available Phosphorus, Organic Carbon, Total Nitrogen, and Organic Matter
Soils of Gurafarda (Kuja-Pedon): The available phosphorus content ranged from 3.89 mg/kg, to 124.58 mg/kg. According to Havlin [34], the available P contents of the soils ranged from low to high. According to Landon [30] the categories for the organic carbon content was ranged from low to medium. The high organic carbon content at the surface layers of the soil was due to the accumulation of organic matter in surface horizon and recycling of organic matter, might be due to litter fall [35]. According to Havlin [34] total N contents of the soils ranged from medium to high.
Soils of Debub-Bench (Kersheka-Pedon): The distribution of available P with soil depth ranged from 1.14 mg/kg (very low) in the bottom soil layer to 4.32 mg/kg (low) in the surface soil. The low available P seems to be related mainly to the presence of low pH status of the soil. According to Havlin [34], the available P contents of the soils ranged from very low to low. As per the rating given by Landon [30], the OC content ranged from low (1.38%) at the surface to medium (5.98%) in the subsurface horizon. The results are in accordance with the findings of Wakene and Heluf [33] and Tuma [36] who reported that intensive and continuous cultivation forced oxidation of OC and thus resulted in reduction of TN. Accordingly the total nitrogen (TN) content of the soil ranged from 0.12% at the surface to 0.39% in the subsurface. According to Havlin [34], the TN content of the soils is categorized as low to high rate. The distribution pattern of TN with soil depth was similar to that of OM (Table 5).
Soil depth (cm) Av.P (mg/Kg) OC (%) TN (%) OM % C/N ratio
Soils of Gurafarda (Kuja-Pedon)
0-30(Surface soil) 3.89 2.52 0.14 4.34 18
30-65 124.58 9.2 0.44 15.86 20.9
65-110 92.54 6.49 0.33 11.18 19.66
110- 140 6.61 2.66 0.14 4.58 19
Soils of D.bench (Kersheka-Pedon)
0-30(Surface soil) 4.32 1.38 0.12 2.37 11.5
30-50 2.81 4.67 0.28 8.05 16.67
50-105 3.37 5.98 0.39 10.3 15.33
105-135 1.14 2.16 0.17 3.72 12.7
Soils of N. Bench ( Zashi-Pedon )
0-30(Surface soil) 2.27 8.28 0.46 14.27 18
30-55 5.39 8.57 0.49 14.77 17.48
55-98 0.09 1.66 0.13 2.86 12.76
98- 145 0.4 0.85 0.08 1.46 10.62
Soils of Jemu (Bass-Pedon)
0-30(Surface soil) 41.96 5.75 0.32 9.91 17.96
30-57 9.87 4.67 0.26 8.05 17.96
57-117 0.69 3.46 0.19 5.96 18.21
117-144 0.87 1.86 0.13 3.2 14.3
Table 5: Available Phosphorus, Organic Carbon, Total Nitrogen and Organic Matter properties of the four districts in bench-Maji zone.

Open Access Journal of Agricultural Research
Abitew M and Kebebew S. Physico-Chemical Characterization of Soils for Fertilizer Recommendations for Some Districts in Bench-Maji Zone, South West, Ethiopia. J Agri Res 2017, 2(2): 000128.
Copyright© Abitew M and Kebebew S.
10
Soil of North-Bench (Zashi-Pedon): The available phosphorus content varied widely from 0.09 to 5.39 mg/Kg. Therefore, as the rate given by Havlin [34], the available phosphorus was categorized very low to low content. The low organic matter content coupled with the highly acidic conditions of may explain the low available P levels in the soils [37]. The organic carbon content in the surface soil (8.28%) and first horizon (8.57%) was medium but low in the second (1.66%) and third soil horizons (0.85%) as the range given by Landon [30]. The total nitrogen content was generally varied from 0.08% in the bottom layer to 0.49% in the first horizon. Thus according to Havlin [33], the TN content was categorized as low to high rate. The organic matter content of the soil showed similar trend with the TN content of soil. Furthermore, the carbon to nitrogen ratio (C: N) generally higher than the common range of 8:1-15:1 for arable soils as proposed by Brady [37]. Soil of Jemu (Bass-Pedon): The contents of available phosphorus through soil profile were ranged from 0.69 to 41.96 mg/Kg. As the rate given by Havlin [33], the available phosphorus for the lower two soil horizons were very low but the upper two soil horizons had high phosphorus contents. The organic carbon was varied from 1.86 to 5.75%. Generally the carbon content was decreased with depth. According to Landon [30], the high carbon content thus categorized as medium carbon content. But the lowest two soil horizons contained 3.46 and 1.86% both of which were rated as low content. Similarly the total nitrogen and the organic matter content of soils of Jemu showed decline trends with an increase soil depth. According to Havlin [33], the TN
content of soil of the above two soil horizons is categorized as high rate but the TN content in the bottom soil layer was grouped as low.
Available Micronutrients Properties of Soils
Soils of Gurafarda (Kuja-Pedon): Soils of Gurafarda had the higher levels of available Mn and Fe than the Cu and Zn. An erratic trend with increasing depths was observed in the first horizon. Generally the tables below demonstrated that surface soils contain higher concentration of manganese than the lowest subsurface soil. Similarly the concentrations of Fe ranged from 27.26 mg/Kg at the surface soil to 42.14 mg/Kg at the first horizon. The Fe concentration in the surface soil was very low than the remaining horizons. The available Cu concentrations of the profile ranged from 0.52 mg/Kg to 0.59 mg/Kg and the concentrations of Zn was varied from 3.1 to 1.03 mg/Kg. Soils of Debub-Bench (Kersheka-Pedon): In all horizons of the profile the proportions of the available Mn>Fe>Zn>Cu were the predominant micronutrients in the exchange sites of colloidal materials (Table 6). The higher concentration (138.7 mg/Kg) of Mn was recorded in second horizon followed by the surface soil with 60.1 mg/Kg Mn concentration of the entire soil profile. The concentrations of Fe varied from 11.34 at the lowest soil layer to 29.9 mg/Kg at the second horizon. The concentrations of Zn and Cu were far lower than the concentrations of Mn and Fe in all soil horizons within a profile.
Soil depth (cm) Available Micronutrients (mg/Kg)
Mn Fe Cu Zn
Soils of Gurafarda (Kuja-Pedon)
0-30(Surface soil) 36.56 27.26 0.59 1.09
30-65 24.12 42.14 0.52 3.1
65-110 36.76 39.88 0.56 1.9
110- 140 16.34 30.52 0.54 1.03
Soils of D.bench (Kersheka-Pedon)
0-30(Surface soil) 60.1 12.66 0.62 0.66
30-50 13.98 22.9 1.41 2.04
50-105 138.7 29.9 1.35 3.46
105-135 56.1 11.34 0.92 8.98

Open Access Journal of Agricultural Research
Abitew M and Kebebew S. Physico-Chemical Characterization of Soils for Fertilizer Recommendations for Some Districts in Bench-Maji Zone, South West, Ethiopia. J Agri Res 2017, 2(2): 000128.
Copyright© Abitew M and Kebebew S.
11
Soils of N. Bench ( Zashi-Pedon )
0-30(Surface soil) 57.1 38.9 1.78 1.32
30-55 47.3 34.8 1.76 3.3
55-98 16.16 15.52 0.45 0.32
98- 145 0.58 3.02 0.11 0.5
Soils of Jemu (Bass-Pedon)
0-30(Surface soil) 96 73.52 3.6 0.54
30-57 41.5 52.5 3.33 0.69
57-117 50.24 26.74 2.83 0.66
117-144 29.56 8.2 1.08 0.32
Table 6: Available micronutrients properties of the four research farms in bench-Maji zone.
Soil of North-Bench (Zashi-Pedon): The concentrations of most micronutrients of the soils decreased from the surface horizons to the subsurface horizons. The highest levels of Mn (57.1 mg/kg), Cu (1.78 mg /kg) and Fe (38.9 mg/kg) contents were registered at the surface soil but the lowest levels of Mn (0.58 mg/kg), Cu (0.11 mg /kg) and Fe (3.02 mg/kg) contents were registered at the lowest subsurface soil. Soil of Jemu (Bass-Pedon): Significant variations in the concentrations of the different micronutrients (Mn, Fe, Cu and Zn) were observed in soil of Jemu than other soils of the districts. The highest levels of available Mn (96 mg/kg), Fe (73.52 mg/kg), and Cu (3.6 mg/kg) concentrations were observed on the surface soil. However, the highest concentrations of available zinc (0.69 mg/kg) were observed on soils of the first followed by 0.66 mg/kg concentration in the second horizons of the profile.
Fertilizer Recommendation for Soil of the Research Farms Numass Diagnosis of Results of N and P Deficiency Probability: For N and P recommendation by NuMaSS software, we assumed that maize was used as the intended crop with target yield of 3221 kg/ha (~3t/ha). We further assumed that the critical Al saturation for maize crop was 20% (as permissible acid saturation recommended by Farina [38] for major crops grown in Ethiopia) and no organic amendment and lime was used. NuMaSS nutrient diagnosis result in the table below showed that, high probabilities of phosphorous and nitrogen deficiencies were observed in almost all sites. There was a strong probability (78%) of a phosphorus deficiency in the soil of Gurafarda but there was a strong likelihood that nitrogen was not limiting. Similarly at soils
of Debub-Bench there was a moderate probability of phosphorus (63%) but strong probability of nitrogen (85%) deficiency. The soil of North-Bench was diagnosed as there were a strong probability of phosphorus (96%) and nitrogen (87%) deficiencies. But there was a moderate probability (66%) of a nitrogen deficiency for soils of Jemu and there was a strong likelihood that phosphorus was not limiting. It can thus be generalized; the different soils of the four districts have serious nutrient limitations. Deficiency Probability
Soil profile Phosphorus Deficiency
Nitrogen Deficiency
Acidity Problem
Soils of Gurafarda (Kuja-Pedon)
0.78 0.02 0.52
Soils of D.bench (Kersheka-Pedon)
0.63 0.85 0.52
Soil of North-Bench (Zashi-Pedon)
0.96 0.87 0.88
Soils of Jemu (Bass-Pedon)
0.21 0.66 0.74
Table 7: NuMaSS Diagnosis Results of N and P Deficiency Probability of the four research farms in Bench-Maji Zone.
Probability values range between 0.00 and 1.0. A probability of 0.5 indicates equal likelihood that there is or is not a N, P and acidity problem (Table 7). A probability of > 0.5 indicates a probable deficiency of N, P and an acidic condition. A probability of < 0.5 indicates that a condition where N, P and acidity are not a problem. Nitrogen and Phosphorous Fertilizer Recommendation: The prediction of fertilizer requirement by NuMaSS showed that the recommended amount of phosphorous for maize crop ranged from 0 kg
Open Access Journal of Agricultural Research
Abitew M and Kebebew S. Physico-Chemical Characterization of Soils for Fertilizer Recommendations for Some Districts in Bench-Maji Zone, South West, Ethiopia. J Agri Res 2017, 2(2): 000128.
Copyright© Abitew M and Kebebew S.
12
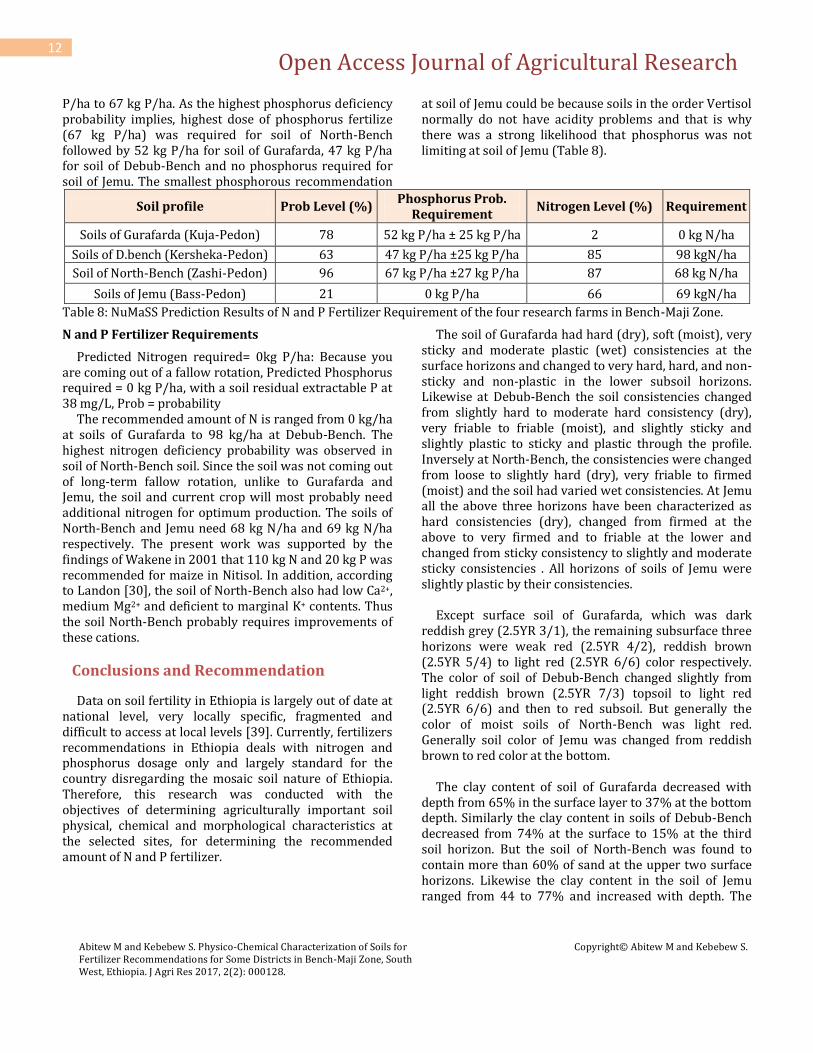
P/ha to 67 kg P/ha. As the highest phosphorus deficiency probability implies, highest dose of phosphorus fertilize (67 kg P/ha) was required for soil of North-Bench followed by 52 kg P/ha for soil of Gurafarda, 47 kg P/ha for soil of Debub-Bench and no phosphorus required for soil of Jemu. The smallest phosphorous recommendation
at soil of Jemu could be because soils in the order Vertisol normally do not have acidity problems and that is why there was a strong likelihood that phosphorus was not limiting at soil of Jemu (Table 8).
Soil profile Prob Level (%) Phosphorus Prob.
Requirement Nitrogen Level (%) Requirement
Soils of Gurafarda (Kuja-Pedon) 78 52 kg P/ha ± 25 kg P/ha 2 0 kg N/ha
Soils of D.bench (Kersheka-Pedon) 63 47 kg P/ha ±25 kg P/ha 85 98 kgN/ha
Soil of North-Bench (Zashi-Pedon) 96 67 kg P/ha ±27 kg P/ha 87 68 kg N/ha
Soils of Jemu (Bass-Pedon) 21 0 kg P/ha 66 69 kgN/ha
Table 8: NuMaSS Prediction Results of N and P Fertilizer Requirement of the four research farms in Bench-Maji Zone.
N and P Fertilizer Requirements
Predicted Nitrogen required= 0kg P/ha: Because you are coming out of a fallow rotation, Predicted Phosphorus required = 0 kg P/ha, with a soil residual extractable P at 38 mg/L, Prob = probability The recommended amount of N is ranged from 0 kg/ha at soils of Gurafarda to 98 kg/ha at Debub-Bench. The highest nitrogen deficiency probability was observed in soil of North-Bench soil. Since the soil was not coming out of long-term fallow rotation, unlike to Gurafarda and Jemu, the soil and current crop will most probably need additional nitrogen for optimum production. The soils of North-Bench and Jemu need 68 kg N/ha and 69 kg N/ha respectively. The present work was supported by the findings of Wakene in 2001 that 110 kg N and 20 kg P was recommended for maize in Nitisol. In addition, according to Landon [30], the soil of North-Bench also had low Ca2+, medium Mg2+ and deficient to marginal K+ contents. Thus the soil North-Bench probably requires improvements of these cations.
Conclusions and Recommendation
Data on soil fertility in Ethiopia is largely out of date at national level, very locally specific, fragmented and difficult to access at local levels [39]. Currently, fertilizers recommendations in Ethiopia deals with nitrogen and phosphorus dosage only and largely standard for the country disregarding the mosaic soil nature of Ethiopia. Therefore, this research was conducted with the objectives of determining agriculturally important soil physical, chemical and morphological characteristics at the selected sites, for determining the recommended amount of N and P fertilizer.
The soil of Gurafarda had hard (dry), soft (moist), very sticky and moderate plastic (wet) consistencies at the surface horizons and changed to very hard, hard, and non-sticky and non-plastic in the lower subsoil horizons. Likewise at Debub-Bench the soil consistencies changed from slightly hard to moderate hard consistency (dry), very friable to friable (moist), and slightly sticky and slightly plastic to sticky and plastic through the profile. Inversely at North-Bench, the consistencies were changed from loose to slightly hard (dry), very friable to firmed (moist) and the soil had varied wet consistencies. At Jemu all the above three horizons have been characterized as hard consistencies (dry), changed from firmed at the above to very firmed and to friable at the lower and changed from sticky consistency to slightly and moderate sticky consistencies . All horizons of soils of Jemu were slightly plastic by their consistencies. Except surface soil of Gurafarda, which was dark reddish grey (2.5YR 3/1), the remaining subsurface three horizons were weak red (2.5YR 4/2), reddish brown (2.5YR 5/4) to light red (2.5YR 6/6) color respectively. The color of soil of Debub-Bench changed slightly from light reddish brown (2.5YR 7/3) topsoil to light red (2.5YR 6/6) and then to red subsoil. But generally the color of moist soils of North-Bench was light red. Generally soil color of Jemu was changed from reddish brown to red color at the bottom. The clay content of soil of Gurafarda decreased with depth from 65% in the surface layer to 37% at the bottom depth. Similarly the clay content in soils of Debub-Bench decreased from 74% at the surface to 15% at the third soil horizon. But the soil of North-Bench was found to contain more than 60% of sand at the upper two surface horizons. Likewise the clay content in the soil of Jemu ranged from 44 to 77% and increased with depth. The

Open Access Journal of Agricultural Research
Abitew M and Kebebew S. Physico-Chemical Characterization of Soils for Fertilizer Recommendations for Some Districts in Bench-Maji Zone, South West, Ethiopia. J Agri Res 2017, 2(2): 000128.
Copyright© Abitew M and Kebebew S.
13
bulk densities of the soil of Gurafarda decreased up to the lowest soil layers, whereas total porosity increased with depth. The bulk density of soil of Debub-Bench was no such variation. The bulk densities values of the soils of Jemu increased with soil depth. The chemical nature of soils of Gurafarda, Debub-Bench and Jemu were characterized as slightly acidic, moderately acidic to neutral and moderately acidic respectively. Unlike the soil reaction of North-Bench was strongly acidic. All soils of the four districts were not salty as the EC values were less than < 0.75 ds/m. Similarly the exchangeable sodium percentage values were <15% therefore all soils of the districts were not sodic. Soil of Gurafarda had the highest levels of exchangeable Ca, Mg, Na, K. Soil of Debub-Bench had medium to high Ca and Mg contents and the K content was ranged from marginal to adequate content. Unlike the soil of North-Bench had low Ca2+, medium Mg2+ and deficient to marginal K+ contents. However, the soil of Jemu had medium Ca2+, medium to high Mg2+ and marginal to adequate K+ contents. The CEC values of soil of Gurafarda were characterized as very high (5 to 40 cmol(+)/kg). The CEC value of soil of Debub-Bench was rated as medium (18.7 to 23.7 cmol(+)/kg.) Generally the CEC value of soil of North-Bench was higher. The CEC status in the soil of Jemu ranged from 21.72-33.77cmol (+) kg-1 which can be rated as high except to the bottom layer. The available P contents of soils of Gurafarda ranged from low to high but the available P content in Debub-Bench and North-Bench was categorized very low to low content. But the contents of available P in the soil of jemu ranged from very low to high phosphorus contents. The organic carbon content of soils of Gurafarda and Debub-Bench was ranged from low to medium. Similarly the organic carbon content of soil of North-Bench was low to medium .But the carbon content in soil of Jemu was categorized as medium. The total N contents of the soils of Gurafarda and Debub-Bench ranged from medium to high and from low to high rate respectively. The TN content of North-Bench is categorized as low to high rate. The OM content of the soil also showed similar trend with the TN content. Furthermore, the carbon to nitrogen ratio (C: N) of soil of North-Bench, generally higher than the common range of 8:1-15:1 for arable soils. Similarly the total nitrogen and the organic matter content of soils of Jemu showed decline trends with an increase soil depth. The chemical analysis results of soil samples showed that soils of Gurafarda had the higher levels of available
Mn and Fe than Cu and Zn. In the soils of Debub-Bench, the proportions of the available Mn>Fe>Zn>Cu were the predominant micronutrients. Generally, the concentration of available Mn in soil of Debub-Bench was comparatively higher than soils of Gurafarda. The highest levels of available Mn, Fe, and Cu concentrations were observed on the surface soil of Jemu. Lastly, NuMaSS nutrient diagnosis result showed that, high probabilities of P and N deficiencies were observed in almost all districts. Results of probability calculation revealed that there was a strong probability of P deficiency in the soil of s Gurafarda but N was not limiting. Similarly there was a moderate and strong probability of P and N deficiency respectively at soils of Debub-bench. The soil of North-Bench was diagnosed as there were strong probabilities of P and N deficiencies. But there was a moderate probability of N deficiency for soils of Jemu and P was not limiting. The prediction of fertilizer requirement by NuMaSS showed that the recommended amount of phosphorous for maize crop ranged from 0 kg P/ha to 67 kg P/ha. Highest dose of phosphorus (67 kg P/ha) was required for soil of North-Bench followed by 52 kg P/ha for soils of Gurafarda, 47 kg P/ha for soils of Debub-Bench and no phosphorus required for soil of Jemu. The recommended amount of N for soils of Gurafarda, Debub-Bench, North-Bench and Jemu were 0 kg N/ha, 98 kg N/ha, 68 kg N/ha and 69 kg N/ha respectively. According to Landon [30], soil of Gurafarda, Debub-Bench, Jemu had no exchangeable Ca2+, Mg2+ and K+ problems. However, the soil of North-Bench had low Ca2+, medium Mg2+ and deficient to marginal K+ contents. Also NuMaSS nutrient diagnosis result showed that, high probabilities of P and N deficiencies were observed in almost all districts. It can thus be generalized, the different soil of the four districts have serious nutrient limitations. Besides to nutrient recommendation, other management activity for the amelioration of these acidic soils is advisable. However, their economic rates of fertilizer and lime applications would have to be assessed to achieve sustainable crop yields. In general, management activities for these soils; should be practiced, and the strategies for which should be determined according to the crops being grown.
Acknowledgements
We are very much indebted to our colleagues, who have been helping, encouraging and supporting us in one
Open Access Journal of Agricultural Research
Abitew M and Kebebew S. Physico-Chemical Characterization of Soils for Fertilizer Recommendations for Some Districts in Bench-Maji Zone, South West, Ethiopia. J Agri Res 2017, 2(2): 000128.
Copyright© Abitew M and Kebebew S.
14
way or another. Our special thanks go to Mr. Getaneh Awulabachew, Mr. Tewodros Biru and Mr. Wondewosen Wondimu, for their wholehearted assistance and contribution during field data collection. We especially would like to thank Mr. Girma Wolde for his material support and endless contributions for the success of this study. We also would like to thank Mr. Bisirat Shimelis for his great help by sketching the digital map of the study areas Thanks are also to all concerned the regions’ community at large, for their field work.
References
1. Buol SW, Southard RJ, Grahm RC, Daniel PA (2003) Soil Genesis and Classification 5th ed. Iowa State University Press. Ames, USA 550-555.
2. Ayele T, Tanto T, Ayana M (2013) Rating and Correlating Physicochemical Properties of Eutric Vertisols in Abaya Chamo Lake basin, South-west Ethiopia. Intl J Agron Plant Prod 4(S): 3559-3568.
3. Fassil K, Charles Y (2009) Soil Fertility Status and Numass Fertilizer Recommendation of Typic Hapluusterts in the Northern Highlands of Ethiopia. World Applied Sciences Journal 6(11): 1473-1480.
4. Prasad R, James Power F (1997) Soil Fertility management for sustainable Agriculture. Lewis Publisher. Boca Raton, New York Printed-Hall Inc USA: 392.
5. Sanchez PA, Buresh RJ, Calhoon F (1997) Replenishing soil fertility in Africa. Soil Science Society of America Spec. Public No. 51, Madison, USA: 251.
6. Stoorvogel JJ, Smaling EMA (1990) Assessment of soil nutrient depletion in Sub-Saharan Africa: 1983-2000. Report 28, DLO Winand Staring Center for Integrated Land, Soil and Water Research (SC-DLO), Wageningen, Netherlands.
7. Wakene N, Heluf G (2001) Assessment of Important Physicochemical Properties of Dystric Udalf (Dystric Nitosols) under different Management Systems in Boko Area, Western Ethiopia. MSc Thesis, Alemaya University, Ethiopia: 93.
8. Soares JLN, Espindola CR, Pereira WLM (2005) Physical properties of soils under Soil acidity effects
on nutrient use efficiency in exotic maize genotypes. Plant and Soil 192: 9-13.
9. Papendick, Parr (1992) Amer Journal of Alternative Agric Journal 7(1,2): 2.
10. Achalu C, Heluf G, Kibebew K, Abi T (2012) Status of selected physicochemical properties of soils under different land use systems of Western Oromia, Ethiopia. Journal of Biodiversity and Environmental Sciences 2(3): 57-71.
11. Taye B, Yifru A (2010) Assessment of soil fertility status with depth in wheat growing highlands of southeast Ethiopia. World Journal of Agricultural Sciences 6(5): 525-531.
12. Fassil K, Charles Y (2009) Soil Fertility Status and Numass Fertilizer Recommendation of Typic Hapluusterts in the Northern Highlands of Ethiopia. World Applied Sciences Journal 6(11): 1473-1480.
13. Geissen V, Sánchez-Hernández R, Kampichler C, Sepulveda-Lozada A (2009) Effects of land-use change on some properties of tropical soils: An example from Southeast Mexico. Geoderma 151(3-4): 87-97.
14. Bouyoucos GJ (1951) A re-calibration of the hydrometer methods for making mechanical analysis of soils. Agronomic Journal 43: 434-438.
15. Van Reeuwijk LP (1993) Procedures for soil analysis, (3rd) ed. International Soil Reference and Information Center (ISRIC), Wageningen, the Netherlands: 34.
16. Walkley A, Black CA (1934) An examination of different methods for determining soil organic matter and the proposed modification by the chromic acid titration method. Soil Science 37: 29-38.
17. Bremner JM, Mulvaney CS (1982) Total nitrogen. In: Page AL (eds.) Method of Soil Analysis. Agron. No. 9. Amer Soc Agron Madison, WI, USA, pp 595-624.
18. Olsen SR, Cole V, Walanbe CV, Dean LA (1954) Estimation of Available phosphorus in soils by extraction with Sodium Bicarbonate. USA Circular: 939.
19. Sahlemedhin S, Bekele T (2000) Procedures for soil and plant analysis. National Soil Research Center,

Open Access Journal of Agricultural Research
Abitew M and Kebebew S. Physico-Chemical Characterization of Soils for Fertilizer Recommendations for Some Districts in Bench-Maji Zone, South West, Ethiopia. J Agri Res 2017, 2(2): 000128.
Copyright© Abitew M and Kebebew S.
15
Ethiopian Agricultural Research Organization, Addis Ababa, Ethiopia: 110.
20. Chapman HD (1965) Cation exchange capacity. In: Black CA (ed.) Methods of Soil Analysis Part II, pp. 891-901. Agronomy series number 9, American Society of Agronomy, Madison, Wisconsin
21. Lindsay WL, Norvell WA (1978) Development of a DTPA soil test for zinc, iron, manganese and copper. Soil Science Society of American Journal 42: 421-428.
22. Asmamaw L, Mohammed A (2012) Characteristics and Classification of the Soils of Gerado Catchment, North Eastern Ethiopia. Ethiopian Journal of Natural Resources (EJNR) 12(1): 1-22
23. Khan SK, Chatterjee AK (2001) Effect of continuous rice cropping on changes in pedon characteristics in an Ustalf. J Indian Soc Soil Sci 49(2): 368-370.
24. Abayneh E, Ashenafi A (2006) Soils of Sinnana Agricultural Research Center. National Soil Research Center- Soil Survey and Land Evaluation Section. Addis Ababa, Ethiopia: 44.
25. Tekalign T (1991) Soil, plant, water, fertilizer, animal manure and compost analysis. Working document No, 13. International Livestock Research Center for Africa (ILCA), Addis Ababa.
26. Shimelis D, Mohammed H (2007) Characteristics and Classification of the Soils of Tenocha-Wenchacher Micro-Catchment, South –West Shewa, Ethiopia. Ethiopian Journal of Natural Resources (EJNR) 9(1): 37-62.
27. Bohn HL, McNeal BL, Oconnor GA (2001) Soil Chemistry. 3rd edition, John Willey and Sons Inc. New York.
28. Coleman NT, GW Thomas (1967) Basic Chemistry in Soil Acidity Agro Monograph No. 12 ASA Madison, Wisconsin: 1-41.
29. Onwueme IC, TD Sinha (1991) Field Crop Production in Tropical Africa: Principles and Practice. CTA, Ede, the Netherlands.
30. Landon JR (1991) Booker Tropical Soil Manual: a handbook for soil survey and agricultural land evaluation in the tropics and subtropics. (eds.) John Wiley & Sons Inc, New York.
31. FAO (Food and Agriculture Organization) (2006) Guidelines for soil description. FAO, Rome. Italy.
32. Sims JT (2000) Soil fertility evaluation. In: Sumner ME (Ed.), Handbook of Soil Science. CRC Press, Boca Raton, FL D-113-D-127.
33. Wakene N, Heluf G (2001) Assessment of Important Physicochemical Properties of Dystric Udalf (Dystric Nitosols) under different Management Systems in Boko Area, Western Ethiopia. MSc Thesis, Alemaya University, Ethiopa: 93.
34. Havlin JL, Beaton JD, Tisdale SL, Nelson WL (1999) Soil fertility and fertilizers. Prentice Hall, New Jersely 83(2): 345-355.
35. Ashok K (1998) Studies on the properties of an Alfisols under selected forest plantations. MSc (Agri.) Thesis, submitted to Univ Agric Sci Bangalore (India).
36. Tuma A (2007) Effect of Fruit Based Land Use Systems on Soil Physicochemical Properties: The Case of Smallholders Farming Systems in Gamo Gofa, Southern Ethiopia. MSc thesis, Hawassa University, Hawassa, Ethiopia: 115.
37. Brady NC (1990) The Nature and Properties of Soils, 10th edn. Collier Macmillan Publishers, London, UK. pp. 83-97.
38. Farina MPW, Chanon P (1991) A field comparison of lime requirement indices for maize. Plant and soil 134: 127-135.
39. IFPRI (International Food Policy Research Institute) (2010) Fertilizer and Soil Fertility Potential in Ethiopia Constraints and Opportunities for Enhancing the System. Addis Ababa, Ethiopia: 42.