Embed Size (px)
Citation preview

i
SYNTHESIS AND PHYSICO-CHEMICAL
CHARACTERIZATION OF NOVEL CERIA BASED
MATERIALS AND APPLICATION FOR LOW
TEMPERATURE SOLID OXIDE FUEL CELLS
by
CHIMA BENJAMIN NJOKU
Submitted in fulfillment of the academic requirements for the degree of Doctor of
Philosophy in the School of Chemistry and Physics,
University of KwaZulu-Natal, Durban
December 2015
As the candidate’s supervisor, I have approved this thesis for submission.
Supervisor:
Signed: ……………………….. Name: Patrick G. Ndungu Date: 10/12/2015
Co-Supervisor:
Signed: ……………………….. Name: Bernard O. Owaga Date: 10/12/2015

ii
ABSTRACT
The sol-gel technique is a simple method used to synthesize complex metal oxide
formulations. This technique was used to synthesize all the perovskite material used in this
research. The crystalline nano-structures and compositions were characterized by high
resolution transmission electron microscopy and X-ray diffraction. The textural
characteristics and particle morphology were respectively characterized by Nitrogen
sorption at 77.5 K and scanning electron microscopy. The electrochemical properties were
characterised by using a NUVANTTM
Powerstat 05 potentiostat/galvanostat and a Kittec
Squadro muffle furnace to regulate the operating temperature, with air and hydrogen as the
gases used.
Porous iridium oxide, with samarium doped ceria (SDC) material was synthesized withnon-
ionic, anionic and cationic surfactant and calcined 950 °C for 4 hours. The study showed
that the nature of the surfactant changed the particle morphology, pore diameter, pore size,
crystallite size, surface area and electrochemical properties. Perovskite materials were
made and applied as cathode materials for low temperature – intermediate temperature
solid oxide fuel cells and the materials were calcined at temperatures of 800 °C, 900
°C, and 1000 °C. The performance of the perovskite materials was measured from 300
°C – 500 °C using the SOFC testing equipment. Ce0.8Sm0.2Fe0.9Ir0.03Co0.07O3-δ cathode
showed promising performance, with maximum power density of 0.400 W/cm2, and
corresponding area specific resistance (ASR) of 0.247 Ω cm2
at 500 °C for the sample
calcined at 1000 °C.
In this study, the cathode Ce0.8Sr0.2Fe0.9Ir0.1O3-δ perovskite exhibited a power density of
0.483 W/cm2
and ASR of 0.342 Ω cm2. The cathode Ce0.8Sr0.2Fe0.9Ir0.04Co0.06O3-δ
perovskite produced a power density of 0.471 W/cm2 and ASR value of 0.349 Ω cm
2.
In this study, the adaptability of sol gel technique was employed to prepare the cathode
Ce0.8Sm0.2IryCo1-yO3-δ (y = 0.03 - 0.04) materials. The iridium nanoparticle was varied
to test the performance of the perovskite. The cathode composition for y = 0.03
produced a maximum power density of 0.287 W/cm2 when measured at 500 °C for the
iii
perovskite calcined at 800 °C and y = 0.04 generated a power density of 0.222 W/cm2
at 500 °C for the perovskite calcined at 1000 °C.
Finally, the structure directing properties of Pluronic F-127 was added in different
masses to SDC electrolyte material. Results showed that the nature of surfactant
influences the particle morphology, pore diameter, pore size, crystallite size, surface area
and electrochemical properties. An investigative study was conducted on possible
electrolytes for low temperature SOFCs to find the best. These are Ce1-xSmxO2 (x = 0.1
- 0.4) compositions, Ce0.8Sm0.2O2/Na2CO3, Ce0.8Sm0.2O2/LiCO3 and Ce0.8Sm0.2O2/Na2CO3
/LiCO3 composite using sol-gel technique. It was discovered that Ce0.8Sm0.2O2/Na2CO3/
LiCO3 electrolyte composites generated the highest current density and power density
of 0.249 W/cm2, hence it can be said they perform better at low temperature conditions.

iv
PREFACE
The experimental work described in this thesis was carried out in the School of Chemistry
and Physics, University of KwaZulu-Natal, Durban, from February 2013 to June 2015,
under the supervision of Professor Patrick G. Ndungu and co-supervisor Dr. Bernard
Omondi Owaga.
These studies represent original work by the author and have not otherwise been submitted
in any form for any degree or diploma to any tertiary institution. Where use has been made
of the work of others it is duly acknowledged in the text.

v
DECLARATION 1 - PLAGIARISM
I, Njoku Chima Benjamin declare that
1. The research reported in this thesis, except where otherwise indicated is my original
research.
2. This thesis has not been submitted for any degree or examination at any other
university.
3. This thesis does not contain other persons’ data, pictures, graphs or other information,
unless specifically acknowledged as being sourced from other persons.
4. This thesis does not contain other persons' writing, unless specifically acknowledged as
being sourced from other researchers. Where other written sources have been quoted,
then:
a. Their words have been re-written but the general information attributed to them has
been referenced
b. Where their exact words have been used, then their writing has been placed in
italics and inside quotation marks, and referenced.
5. This thesis does not contain text, graphics or tables copied and pasted from the Internet,
unless specifically acknowledged, and the source being detailed in the thesis and in the
References sections.
Signed
………………………………………………………………………………
vi
DECLARATION 2 - PUBLICATIONS
DETAILS OF CONTRIBUTION TO PUBLICATIONS that form part and/or include research
presented in this thesis (include publications, submitted, in press and published and give details of
the contributions of each author to the experimental work and writing of each publication)
Publication 1
Njoku, C.B, Ndungu, P.G, Effect of non-ionic, anionic and cationic surfactants on the sol
gel synthesis of IrO/Ce0.8Sm0.2O2 nanocomposite for solid oxide fuel cell application.
Journal of Fuel Cell Science & Technology, 2014. DOI: 10.1115/1.4027366.
Contributions: I carried out the experimental work, characterized the perovskite materials, applied it
as electrodes in LTSOFC and prepared the manuscript. These were achieved under the supervision
of my supervisors (co-authors).
Publication 2
Njoku, C.B, Ndungu, P.G, Synthesis and characterization of novel Ce0.8Sm0.2Fe0.9Ir0.03
Co0.07O3−δ perovskite material and possible application as a cathode for low – intermediate
temperature SOFCs. Materials Research Bulletin, 2015, 68, 100-108,
Contributions: I carried out the experimental work, Characterizations and prepared the manuscript
under the guidance of my supervisors (co-authors). My supervisors corrected, compiled and
submitted the manuscript.
Publication 3
Njoku, C.B, Omondi, B, Ndungu, P.G, Characterization and electrochemical properties of
Ce0.8Sr0.2Fe0.9Ir0.04Co0.06O3-δ (CSFIC) cathode material for application in low temperature
SOFC. ECS Trans. 2015, 68 (1), 903-917.
Contributions: I carried out the experimental work, Characterizations and prepared the manuscript
under the guidance of my supervisors (co-authors). My supervisors corrected, compiled and
submitted the manuscript.

vii
Publication 4
Njoku, C.B, Omondi, B, Ndungu, P.G, Physical chemical properties of Ce0.8Sm0.2IryCo1-y
O3-δ (y = 0.03 - 0.04) and preliminary testing as cathode material for low temperature
SOFC. Materials Research Bulletin, submitted.
Contributions: I carried out the experimental work, characterizations and prepared the manuscript
under the guidance of my supervisors (co-authors). My supervisors corrected, compiled and
submitted the manuscript.
Publication 5
Njoku, C.B, Omondi, B, Ndungu, P.G, Evaluation of novel nanophase Ce0.8Sr0.2Fe0.9Ir0.1
O3-δ as cathode material for low temperature SOFC. Nanomaterials for Electrocatalysis and
Electrochemical Energy Applications accepted.
Contributions: I carried out the experimental work, Characterizations and prepared the manuscript
under the guidance of my supervisors (co-authors). My supervisors corrected, compiled and
submitted the manuscript.
Signed:
…………………………………………………………..

viii
CONFERENCE CONTRIBUTIONS
1. POSTER PRESENTATION
Njoku, C.B, Omondi B, Ndungu, P.G, Characterization and electrochemical properties
of Ce0.8Sr0.2Fe0.9Ir0.04Co0.06O3-δ (CSFIC) cathode material for application in low
temperature SOFC (Presented at the South African Chemical Society (SACI) confer-
ence at Elangeli Sun Hotel, November 29 – December 4, 2015, Durban, South Africa).
2. POSTER PRESENTATION
Njoku, C.B, Omondi B, Ndungu, P.G, Characterization and electrochemical properties
of Ce0.8Sr0.2Fe0.9Ir0.04Co0.06O3-δ (CSFIC) cathode material for application in low
temperature SOFC (Presented at the ECS conference on Electrochemical Energy
Conversion & Storage with SOFC-XIV, July 26 - 31, 2015, Glasgow, Scotland).
3. ORAL PRESENTATION
Njoku, C.B, Ndungu, P.G, Effects of surfactant on the sol gel formation of iridium
oxide with samarium doped ceria for SOFC application (Presented at the College of
Agriculture, Engineering and Science research day 2014, Westville Campus UKZN).
4. POSTER PRESENTATION
Njoku, C.B, Ndungu, P.G, Effects of surfactant on the sol gel formation of iridium
oxide with samarium doped ceria for SOFC application (Presented at the Catalysis
Society of South Africa (CATSA2013), 17th
- 20th
November, 2013, Wild Coast Sun
Hotel, Durban South Africa).

ix
TABLE OF CONTENTS
ABSTRACT ..................................................................................................................... ii
PREFACE ........................................................................................................................ iv
DECLARATION 1 - PLAGIARISM............................................................................... v
DECLARATION 2 - PUBLICATIONS ......................................................................... vi
CONFERENCE CONTRIBUTIONS ........................................................................... viii
TABLE OF CONTENTS ................................................................................................ ix
ACKNOWLEDGEMENTS .......................................................................................... xvi
ABBREVIATIONS ...................................................................................................... xvii
CHAPTER 1.................................................................................................................... 1
INTRODUCTION .......................................................................................................... 1
1.0 Background of study ................................................................................................. 1
1.1 Cations used in perovskite compositions ................................................................. 2
1.2 Methods of improving the properties of Perovskites ............................................... 3
1.2.1 Addition of Surfactant .......................................................................................... 3
1.2.2 The Sol gel Method .............................................................................................. 4
1.3 Problem Statement ..................................................................................................... 4
1.4 Hypothesis ................................................................................................................. 5
1.5 Aim & Objectives ...................................................................................................... 5
1.6 Thesis Overview ........................................................................................................ 6
References ........................................................................................................................ 8
CHAPTER 2.................................................................................................................. 11
Literature review .......................................................................................................... 11
1.0 Introduction ............................................................................................................. 11
1.1 Types of SOFC ........................................................................................................ 13
1.2 Materials used for SOFC components ..................................................................... 17
1.2.1 Anodes ................................................................................................................ 17
1.2.2 Structure of Anodes ............................................................................................ 18
1.2.3 Materials used as Anodes ................................................................................... 19
1.2.3.1 Nickel based anodes .................................................................................... 19
1.2.3.2 Ceria based anodes ...................................................................................... 21
x
1.2.3.3 Alternative anode compositions .................................................................... 22
1.3 Electrolytes .............................................................................................................. 23
1.3.1 Structure of Electrolytes ..................................................................................... 24
1.3.2 Materials used as electrolyte .............................................................................. 25
1.3.2.1 Ceria based electrolyte ................................................................................ 25
1.3.2.2 Ceria- based nanocomposite ....................................................................... 25
1.3.2.3 Ceria oxide nanocomposites ....................................................................... 26
1.3.2.4 Ceria carbonate nanocomposite .................................................................. 26
1.4 Cathodes .................................................................................................................. 27
1.4.1 Structures of the Cathode ..................................................................................... 28
1.4.2 Materials used as cathode ..................................................................................... 29
1.4.2.1 Ferrites ............................................................................................................ 29
1.4.2.2 Cobaltites ........................................................................................................ 30
1.4.2.3 Iridates ............................................................................................................ 32
1.4.3 Composite cathodes used for LT SOFC ............................................................... 34
1.5 Mathematical models for Polarization .................................................................... 35
1.5.1 Polarizations ......................................................................................................... 35
1.5.1.1 Ohmic polarization ......................................................................................... 36
1.5.1.2 Concentration polarization ............................................................................. 36
1.5.1.3 Activation polarization .................................................................................. 37
1.5.1.4 Open Circuit Voltage ..................................................................................... 38
1.6.0 Synthesis of perovskites ........................................................................................ 38
1.6.1 The Sol gel method ............................................................................................... 38
1.6.2 Utilisation of Surfactants ...................................................................................... 40
1.6.2.1 Types of surfactant ........................................................................................ 41
1.7 Summary .................................................................................................................. 41
References ...................................................................................................................... 42
CHAPTER 3.................................................................................................................. 63
Effect of non-ionic, anionic and cationic surfactantson the Sol gel synthesis of
IrO/Ce0.8Sm0.2O2-δ nanocomposite for SOFC application ........................................ 63
Summary ......................................................................................................................... 63
Abstract ........................................................................................................................... 63
1.0 Introduction .............................................................................................................. 64

xi
2.0 Materials and Method ............................................................................................. 64
2.1 IrO/Ce0.8Sm0.2O2-δ Preparation ............................................................................... 65
2.2 IrO/Ce0.8Sm0.2O2-δ without surfactant .................................................................... 65
2.3 Characterization ..................................................................................................... 66
3.0 Results and Discussion ............................................................................................ 67
3.1 FTIR ....................................................................................................................... 67
3.2 XRD ....................................................................................................................... 69
3.3 HRTEM.................................................................................................................. 71
3.4 SEM ....................................................................................................................... 72
3.5 Nitrogen Adsorption/Desorption (BET) ................................................................ 73
3.6 Electrochemical properties ..................................................................................... 74
3.6.1 Polarization ..................................................................................................... 76
3.6.2 Power density ................................................................................................. 83
4.0 Conclusion ............................................................................................................... 83
Acknowledgement .......................................................................................................... 84
References ...................................................................................................................... 84
CHAPTER 4.................................................................................................................. 87
Physical chemical properties of Ce0.8Sm0.2IryCo1-yO3-δ (y = 0.03 - 0.04) and
preliminary testing as cathode material for low temperature SOFC ..................... 87
Summary ......................................................................................................................... 87
Abstract ........................................................................................................................... 87
1.0 Introduction .............................................................................................................. 88
2.0 Experimental methods ............................................................................................. 89
2.1 Material synthesis .................................................................................................. 89
2.2 Characterization ..................................................................................................... 90
2.3 Button cell fabrication............................................................................................ 91
2.4 Electrochemical performance test .......................................................................... 91
3.0 Results and discussions ........................................................................................... 92
3.1 Powder X-ray diffraction analysis ......................................................................... 92
3.2 FTIR analysis ......................................................................................................... 94
3.3 Raman analysis ...................................................................................................... 95
3.4 HRTEM analysis .................................................................................................... 98
3.5 SEM Observations ................................................................................................. 99

xii
3.6 Electrochemical properties ................................................................................... 100
3.6.1 Polarization curve ......................................................................................... 100
3.6.2 Area specific resistance ................................................................................ 103
4.0 Conclusions ............................................................................................................ 107
Acknowledgements ...................................................................................................... 107
References .................................................................................................................... 107
CHAPTER 5 ............................................................................................................... 112
Synthesis and characterization of novel Ce0.8Sm0.2Fe0.9Ir0.03Co0.07O3-δ
perovskite material and possible application as cathode for low-intermediate
temperature SOFCs .................................................................................................. 112
Summary ...................................................................................................................... 112
Abstract ........................................................................................................................ 112
1.0 Introduction ............................................................................................................ 113
2.0 Experimental Methods .......................................................................................... 114
2.1 Synthesis of Nanocrystalline Materials ............................................................... 114
2.2 Characterization ................................................................................................... 115
2.3 Single Cell fabrication ......................................................................................... 116
2.4 Electrochemical Performance test ........................................................................ 116
3.0 Results and Discussion ........................................................................................ 116
3.1 Raman Characterizations ..................................................................................... 116
3.2 FTIR Analysis ...................................................................................................... 118
3.3 XRD Analysis ...................................................................................................... 119
3.4 Thermogravimetric Analysis ............................................................................... 122
3.5 SEM Observations ............................................................................................... 123
3.6 HRTEM Observations ......................................................................................... 126
3.7 Textural Characterizations of the calcined Materials .......................................... 128
3.8 Electrochemical Properties .................................................................................. 129
3.8.1 Polarization Curves....................................................................................... 129
3.8.2 Power Density............................................................................................... 132
4.0 Conclusions ........................................................................................................... 133
Acknowledgements ...................................................................................................... 134
References .................................................................................................................... 134

xiii
CHAPTER 6................................................................................................................ 137
Evaluation of novel nanophase Ce0.8Sr0.2Fe0.9Ir0.1O3-δ as cathode material for low
temperature SOFC ..................................................................................................... 137
Summary ....................................................................................................................... 137
Abstract ......................................................................................................................... 137
1.0 Introduction ........................................................................................................... 138
2.0 Experimental Methods .......................................................................................... 139
2.1 Powder synthesis .................................................................................................. 139
2.2 Characterization ................................................................................................... 140
2.3 Button cell fabrication.......................................................................................... 140
2.4 Electrochemical performance test ........................................................................ 140
3.2 Raman analysis .................................................................................................... 142
3.3 XRD analysis ....................................................................................................... 144
3.4 HRTEM analysis .................................................................................................. 146
3.5 SEM observations ................................................................................................ 147
3.6 Thermogravimetric analysis................................................................................. 148
3.7 Electrochemical Properties .................................................................................. 150
3.7.1 Polarization Curve ........................................................................................ 150
3.7.2 Area specific resistance ................................................................................ 152
4.0 Conclusions ............................................................................................................ 153
Acknowledgements ...................................................................................................... 153
References .................................................................................................................... 153
CHAPTER 7................................................................................................................ 158
Characterisation and Electrochemical Properties of Ce0.8Sr0.2Fe0.9Ir0.04Co0.06O3-δ
(CSFIC) Cathode Material for Application in Low Temperature SOFC ............ 158
Summary ....................................................................................................................... 158
Abstract ......................................................................................................................... 158
2.0 Experimental methods .......................................................................................... 160
2.1 Cell fabrication..................................................................................................... 160
2.2 Characterization ................................................................................................... 161
2.3 Electrochemical characterisation ......................................................................... 162
3.0 Results and Discussion .......................................................................................... 162
3.1 Powder XRD analysis .......................................................................................... 162
xiv
3.2 FTIR analysis ....................................................................................................... 164
3.4 HRTEM observations .......................................................................................... 167
3.5 SEM observations ................................................................................................ 168
3.6 Thermogravimetric analysis................................................................................. 169
3.7 Electrochemical properties ................................................................................... 171
3.7.1 Polarisation curve ......................................................................................... 171
3.7.2 Area Specific Resistance .............................................................................. 173
4.0 Conclusions ............................................................................................................ 174
Acknowledgements ...................................................................................................... 174
References .................................................................................................................... 174
CHAPTER 8................................................................................................................ 179
Effects of surfactant on the performance of samarium doped ceria (Ce0.8Sm0.2O2)
perovskites as electrolyte for low temperature SOFC application ....................... 179
Summary ....................................................................................................................... 179
Abstract ......................................................................................................................... 179
1.0 Introduction ........................................................................................................... 180
2.0 Experimental Methods .......................................................................................... 181
2.1 Starting materials ................................................................................................. 181
2.2 Preparation of Ce0.8Sm0.2O2 with surfactant ........................................................ 181
2.3 Preparation of Ce0.8Sm0.2O2 without surfactant ................................................... 181
2.4 Characterization ................................................................................................... 182
2.5 Single cell fabrication .......................................................................................... 183
2.6 Electrochemical characterisation ......................................................................... 183
3.0 Results and discussion ......................................................................................... 184
3.1 Powder XRD analysis .......................................................................................... 184
3.2 Raman analysis .................................................................................................... 186
3.3 HRTEM analysis .................................................................................................. 187
3.4 SEM analysis ....................................................................................................... 188
3.5 Surface area analysis (BET) ................................................................................. 190
3.6 Electrochemical properties ................................................................................... 191
3.6.1 Polarisation graph ........................................................................................ 191
3.6.2 Area Specific Resistance .............................................................................. 193
4.0 Conclusions ............................................................................................................ 195
xv
Acknowledgements ...................................................................................................... 195
References .................................................................................................................... 195
CHAPTER 9................................................................................................................ 200
Comparative study of the properties of Ce1-XSmXO2 (x = 0.1 - 0.4),
Ce0.8Sm0.2O2/Na2CO3, Ce0.8Sm0.2O2/ LiCO3 and Ce0.8Sm0.2O2 / Na2CO3/LiCO3
electrolytes for application in low temperature SOFC ........................................... 200
Summary ....................................................................................................................... 200
Abstract ......................................................................................................................... 200
1.0 Introduction ........................................................................................................... 201
2.0 Experimental Methods .......................................................................................... 202
2.1. Synthesis of electrolyte material .......................................................................... 202
2.2. Characterization ................................................................................................... 203
2.3. Single Cell fabrication ......................................................................................... 204
2.4. Electrochemical Performance test ........................................................................ 204
3.0 Results and discussions ........................................................................................ 205
3.1 Powder XRD analysis .......................................................................................... 205
3.2 Raman analysis .................................................................................................... 206
3.3 HRTEM observations .......................................................................................... 208
3.4 SEM Observations ............................................................................................... 209
3.5 Nitrogen desorption /absorption Analysis ........................................................... 210
3.6.0 Electrochemical properties .................................................................................. 213
3.6.1 Polarisation Curve ....................................................................................... 213
3.6.2 Power density ............................................................................................... 215
3.6.3 Area specific resistance ................................................................................ 216
4.0 Conclusions ........................................................................................................... 217
Acknowledgements ...................................................................................................... 218
References .................................................................................................................... 218
CHAPTER 10.............................................................................................................. 221
Conclusions and Future work ................................................................................... 221
1.0 Conclusions ........................................................................................................... 221
2.0 Future work ........................................................................................................... 223

xvi
ACKNOWLEDGEMENTS
My profound gratitude goes to the Almighty God, for his protection, divine guidance and
direction during the period of my research.
I also want to appreciate the School of Chemistry and Physics, College of Agriculture
Engineering and Science, University of KwaZulu-Natal and staff for providing a
comfortable environment, well equipped laboratories and state of the art instruments to
carry out my research. I would like to thank the following organizations, ESKOM-TESP
and NRF South Africa (Thuthuka Grant No: 76318) for their financial support.
I want to appreciate my supervisors Professor Patrick G. Ndungu, who has been a father,
academic mentor and teacher. I have learnt a lot through his guidance and supervision and
Dr. Bernard Omondi for his guidance and academic mentorship in making my study a
success.
I want to thank my research group members namely Ekemena, Gumbi, Nteseng, Darrel,
Tsithole, Tonde, Kudzai and all my friends for their contributions academically towards the
progress of my research. I also want to appreciate Dr. Olushola Ogunnubi for introducing
me to this university and for his brotherly support.
Finally, I want to appreciate my parents (Mr. & Mrs Obinna Njoku), my siblings (Adaku,
Chukwudi, Prince and Chika), Mrs Christabel Babazim and Mrs Nkechi Onuorah for their
financial, emotional support and encouragement towards my academic achievements.

xvii
ABBREVIATIONS
Abbreviations Meanings ASR Area Specific resistance
CeO2 Cerium Oxide
cm Centimetres
D Scherer Constant
Ea Activation energy of conduction (eV)
FTIR Fourier transform Infrared spectroscopy
FWHM Full width at half maximum (degree)
GDC
YDC
Gadolina doped ceria
Yttria doped ceria
Hrs Hours
HRTEM High resolution transmission electron microscopy
IrO2 Iridium oxide
ITSOFC Intermediate temperature solid oxide fuel cell
k Boltzmann constant (J K-1
)
kHz KiloHertz
kV KiloVolts
L Electrolyte thickness (cm)
LSCF La0.6Sr0.4Co0.2Fe0.8O3
LTSOFC Low temperature solid oxide fuel cell
M Metal
mA Milliamperes
mins Minutes
ml Millilitres
mW Milliwatts
NANOCOFC
WGS
LSGM
Multifunctional nanocomposites for advanced fuel
cell technology
Water gas stream
La0.8Sr0.2Gd0.2M0.8
NiO Nickel Oxide
R Cell resistance (Ω)
rpm Rates per minutes
S Electrode area of the electrolyte surface (cm2)
SDC Samarium doped ceria
SEM Scanning electron microscopy
SOFC Solid oxide fuel cell
SrCoO2 Strontium cobalt oxide
T Absolute temperature (K)

xviii
TEC Thermal Expansion Coefficient
TGA Thermogravimetric analysis
Ton Tonnes
XRD
YDC
X- ray diffraction
Yttria doped ceria

1
CHAPTER 1
INTRODUCTION
1.0 Background of study
Solid oxide fuel cells (SOFCs) are electrochemical devices used to generate electricity and
have been considered to be ideal as a future power source because of the overall high
energy efficiency, potentially long operational lifetime and flexibility in the fuels they use
[1]. SOFCs operating temperature has been a major interest for research in the last decade,
the drive has been towards the reduction of its operating temperatures, cost and
maintenance. High operating temperature limits certain properties of solid oxide fuel cells
[2, 3]. A major limitation is the interdiffusion between the electrode and electrolyte
boundaries causing separate layer formation within the cells. This causes strain and cracks
to the cell because of the variation in the thermal expansion coefficient between the cells
and densification of the electrodes.
Reducing the operating temperature of SOFCs has certain advantages. It broadens the
choices for electrodes and electrolyte materials, reduces production and application cost
and improves the overall lifetime and stability of the fuel cell. The reduction of the
operating temperatures of fuel cells can be achieved either by reducing the electrolyte
thickness or by using highly conductive electrolytes and electrodes such as perovskites.
Perovskite-type complex oxides are functional inorganic materials for application as
electrode and electrolyte materials in SOFCs, gas sensors, memory devices (RAM),
superconductors, and as catalysts. Perovskite materials possess excellent electromagnetic
properties and can accommodate a large content of oxygen vacancies, which makes some
of them good oxygen ionic conductors. Perovskite structures with the general formula
ABX3, contain A sites, B sites and the X sites. The A site usually contains metal ions
(cations) that have larger sizes than the cations in the B site which can allow for first row
transition elements to be introduced in the lattice. The X site is usually occupied by oxygen

2
anions. For the purpose of this study both the A and B cations adopt a trivalent state, with
the A cations being restricted to rare earth metals. Metal like ceria can exist in the cerous,
cerium (III), and ceric, cerium (IV), oxidation states [4]. Both oxidation states of cerium
strongly absorb ultraviolet light and have two characteristic spectrophotometric absorbance
peaks [5]. The unusual catalytic behaviour involved with nanoceria and other rare earth
metals is believed to be due to oxygen vacancy sites on the lattice surface. These are
characterized by cerium (III) atoms situatedat the center of the vacancy, surrounded by
adjacent cerium (IV) atoms or the metals in tetravalent state [6].
1.1 Cations used in perovskite compositions
Perovskite compositions can contain different metal ions when used for SOFCs as shown in
Figure 1 representing the schematic diagram of the metal ions used in this study for
perovskite structures.
Figure 1: Schematics of compositions under study.
Cobalt containing compounds possess adequate linear thermal expansion coefficient, high
electrical conductivity, magnetic and catalytic properties. Cobalt containing perovskites
have the ability to adopt several oxidations and spin states, in various oxygen environments
which accounts for the richness of their physical properties [2, 3]. When strontium fully
occupies the A sub-lattice of perovskites, SrCoO3 perovskite is formed which corresponds
to a cubic perovskite. SrCoO3-y belongs to a family of non-stoichiometric perovskites with
high oxygen mobility at room temperature [7, 8]. SrCoO3-y perovskites are used as cathodes
ABO3
Ce3+, Sm3+, Sr3+ Fe3+, Ir3+, Co3+

3
for SOFCs because of their high oxygen permeability values which have been shown to be
greater than those of yttria stabilized zirconia (YSZ) [9].
Ceria has been effective in ceria based electrodes because of its high catalytic activity in
oxygen combustion reactions [10 - 12], usually with the combination of samarium,
gadolinium or any rare earth metals. For example, when ceria is doped samarium as SDC,
they have been used as solid electrolytes because of their high ionic conductivity in low
temperature SOFCs (LTSOFCs) [13 - 15]. Addition of sodium carbonates to SDC
electrolyte increases the oxygen ion conductivity and improves the thermal stability of the
nanostructure. The addition also improves the densification of the solid electrolyte layer to
prevent any gas leakage and enhances its electrochemical performance at lower
temperatures [16 - 18].
Ferrites provide stability in SOFCs cathodes and are also known to be substantially superior
in electronic and ionic conductivity. Ferrites also have good thermal expansion coefficient
under SOFC cathodic conditions whileiridium oxide can be reliable, for its electrocatalytic
activities for oxygen reduction and when used in perovskites contributes to an increased
conductivity of the material [19, 20].
1.2 Methods of improving the properties of Perovskites
1.2.1 Addition of Surfactant
Surfactants are compounds that lower the surface tension or interfacial tension between two
liquids or between a liquid and a solid. Surfactants are classified according to their polar
head groups.Polar heads with no charge groups are called non-ionic, while those that carry
charge on their heads are called ionic surfactants. The ionic ones can be anionic when the
polar heads are negatively chargedor cationic ifpositively charged.
During the formation of perovskites, the textural properties and morphology can be
modulated by using surfactants while keeping the other processing parameters such as the
solvents constant. Particle sizes for example can be controlled either by preventing or
promoting coalescence of the droplets during their gelation which can be influenced by the

4
nature of the surfactant. There are no simple selection rules that can be applied to predict
which surfactant will give a particular particle size, but research has proven that surfactant
structure can provide better stabilization of the micelle walls, reduction in the inter-droplet
exchange, resulting in the production of smaller particles and smaller crystals [21] and the
avoidance of the aggregation of the metallic nanoparticles into matrices [22]. with
appropriate pore diameter, high surface areas and a better access to the active sites [23 -
25]. These properties play a major role in determining the nature, number of active sites,
and the activity of the perovskite.
1.2.2 The Sol-gel Method
Sol-gel method was utilised in this study. This technique is an adaptable and relatively
simple method easily modified to synthesize complex metal oxide formulations
(perovskites) with controlled structure [26, 27]. These materials are produced by two
methods, the hydrolysis of the metal alkoxide precursor and its condensation [28] or by the
aggregation of aqueous colloidal dispersions containing discrete sol particles. The
mechanism of sol-gel transformation, structure and interactions in the colloidal gel state has
led to the development of materials with tailored microstructure [29, 30].
1.3 Problem Statement
Solid oxide fuel cells offer more advantages than traditional energy conversion systems.
The advantages include high efficiency, reliability, modularity, fuel adaptability, clean and
minimal emission of pollutants, quiet and vibration-free operation eliminating noise.
Although the originally developed SOFCs operated primarily in the temperature range of
900 to 1000 °C, it has been shown that at these temperatures they undergo high degradation
especially of component materials, and slow start up and cool down times are observed. It
is as such imperative that the fuel cell operation is optimized by reducing the SOFC
operating temperature range between 300 – 600 °C. This would allow the use of a wide set
of materials, that are less demanding on the seals and the balance of plant components,
simplifies thermal management, helps in faster start up and cool down time, and results in
less degradation of cell and stack material.

5
1.4 Hypothesis
In this study the hypothesis is made that perovskite materials fabricated, would exhibit high
and promising performances as electrodes and electrolytes when applied to Low
Temperature Solid Oxide Fuel Cells (LTSOFC) that work within 300 – 600 °C. These
would be comparable to performances by perovskite materials recorded in the literature.
1.5 Aim & Objectives
The aim of this study is to develop novel nanocomposite approach to design and fabricate
ceria based perovskite materials that can be applied as electrodes and electrolytes for Low
temperature solid oxide fuel cells. This was achieved by the following objectives:
1. To synthesize IrO/Ce0.8Sm0.2O2 perovskites with anionic, cationic and ionic
surfactants as anodes for LTSOFC using sol gel technique.
2. To characterize the anode material using XRD, Raman spectroscopy, FTIR
spectroscopy, SEM, HRTEM and Textural analysis (BET) and evaluate its
electrochemical performance using SOFCs setup.
3. To synthesize novel Ce0.8Sm0.2IryCo1-yO3-δ (0.03–0.04) and Ce0.8Sm0.2Fe0.9Ir0.03Co0.07
O3-δ perovskites that would function as cathodes for LTSOFC and ITSOFC using
sol-gel technique.
4. To characterize Ce0.8Sm0.2IryCo1-yO3-δ (0.03 – 0.04) and Ce0.8Sm0.2Fe0.9Ir0.03Co0.07
O3-δ materials using XRD, Raman spectroscopy, FTIR spectroscopy, SEM and
HRTEM and to evaluate its electrochemical performances using SOFCs testing setup
5. To synthesize Ce0.8Sr0.2Fe0.9Ir0.1O3-δ and Ce0.8Sr0.2Fe0.9Ir0.03Co0.07O3-δ perovskite that
would function as cathodes for LTSOFC using sol gel technique.
6. To characterize Ce0.8Sr0.2Fe0.9Ir0.1O3-δ and Ce0.8Sr0.2Fe0.9Ir0.03Co0.07O3-δ cathode
materials using XRD, Raman spectroscopy, FTIR spectroscopy, SEM, HRTEM,
Textural analysis (BET) and TGA and to evaluate the electrochemical performances
of the cathode materials using SOFC setup.
7. To synthesize Ce0.8Sm0.2O2 with pluronic F-127 surfactant that would function as
electrolyte for LTSOFC using sol gel technique.
6
8. To characterize Ce0.8Sm0.2O2 + pluronic F-127 nanomaterial using XRD, Raman
spectroscopy, SEM, HRTEM and Textural analysis (BET) and to evaluate the
electrochemical performance of the electrolytes using SOFC setup.
9. To synthesize Ce0.8Sm0.2O2 (x = 0.1 – 0.4), Ce0.8Sm0.2O2/Na2CO3, Ce0.8Sm0.2O2/
LiCO3, Ce0.8Sm0.2O2/Na2CO3/LiCO3 that would function as cathodes for LTSOFC
using sol gel technique.
10. To characterize Ce0.8Sm0.2O2 (x = 0.1 – 0.4), Ce0.8Sm0.2O2/Na2CO3, Ce0.8Sm0.2O2/
LiCO3, Ce0.8Sm0.2O2/Na2CO3/LiCO3 electrolytes using XRD, Raman spectroscopy,
FTIR spectroscopy, SEM, HRTEM and textural analysis (BET) and to evaluate the
electrochemical performances of the electrolytes
1.6 Thesis Overview
This thesis consists of ten chapters which are discussed below. The novel part about this
research is the synthesis of the electrode and electrolyte materials using sol gel synthesis
that involves the integration of structure directing agents (surfactants), the aging and drying
time and the solvent to metal oxide ratio. The study also integrated the use of a rare metal
like Iridium in synthesizing the electrode materials forming a combination of perovskite
structures that are novel, efficient and exhibited promising performance.
Chapter 1 covers the background of the study.
Chapter 2 covers the Literature review on the components of a SOFC, the mechanisms,
types and the structures of the anode, cathode and electrolytes. It also includes other
components like interconnectors and mathematical parameters used in SOFC models.
Chapter 3 describes the effects of the templating and structural directing properties of ionic,
anionic and cationic surfactants on the perovskite materials made as electrodes. This work
has been published.
Chapter 4 shows a study of the effects of varying the composition of iridium on the
structural, textural, morphological and electrochemical properties of novel Ce0.8Sm0.2IryCo1-
7
yO3-δ (y = 0.03 - 0.04) perovskite that was applied as cathode in LTSOFC. This work is
under review.
Chapter 5 integrates the synthesis, characterisation and electrochemical performances of
novel Ce0.8Sm0.2Fe0.9Ir0.03Co0.07O3-δ perovskite material applied as cathode for LTSOFCs.
This work has been published.
Chapter 6 covers the study on the structural, textural, morphological and electrochemical
properties of a novel Ce0.8Sr0.2Fe0.9Ir0.1O3-δ perovskite applied as cathode for LTSOFCs.
This work has been published.
Chapter 7 includes the method of preparation, characterisation and electrochemical
performance of novel Ce0.8Sr0.2Fe0.9Ir0.04Co0.06O3-δ (CSFIC) material applied as cathode for
LTSOFCs. This work has been published.
Chapter 8 describes the effect of the structural directing properties of surfactant on the
structural, textural, physical and morphological properties of samarium doped ceria
(Ce0.8Sm0.2O2) and to investigate, if the addition of surfactant improves the electrochemical
performance of the electrolyte when applied in LTSOFCs.
Chapter 9 presents a comparative study of the different electrolytes that work best in
LTSOFCs conditions and to investigate the electrolyte that exhibits the maximum
electrochemical performance when tested.
Chapter 10 gives the conclusion, and further work that can be done following this study.

8
References
1. Hans-Rudolf, W., & Andrei, B. (2004). Minerals: Their Constitution and Origin.
New York, NY: Cambridge University Press.
2. Li, Z. C., & Bergman, B. (2005). Electrical properties and ageing characteristics of
BaTiO3 ceramics doped by single dopants. Journal of the European Ceramic
Society, 25(4), 441- 445.
3. Luxová, J., Šulcová, P., & Trojan, M. (2008). Study of perovskite compounds.
Journal of Thermal Analysis and Calorimetry, 93(3), 823-827.
4. Jiang, L. Q., Guo, J. K., Liu, H. B., Zhu, M., Zhou, X., Wu, P., & Li, C. H. (2006).
Prediction of lattice constant in cubic perovskites. Journal of Physics and Chemistry
of Solids, 67(7), 1531-1536.
5. Hu Z.Y., Haneklaus S., Sparovek G., Schnug E. (2006). Rare earth elements in
soils. Commun Soil Sci Plan, 37 (9–10), 1381–1420.
6. Heckert, E. G., Karakoti, A. S., Seal, S., & Self, W. T. (2008). The role of cerium
redox state in the SOD mimetic activity of nanoceria. Biomaterials, 29(18), 2705-
2709.
7. Esch, F., Fabris, S., Zhou, L., Montini, T., Africh, C., Fornasiero, P., & Rosei, R.
(2005). Electron localization determines defect formation on ceria substrates.
Science, 309(5735), 752-755.
8. Zhu, W., Lü, Z., Li, S., Wei, B., Miao, J., Huang, X., Chen, K., Ai, N., & Su, W.
(2008). Study on Ba0.5Sr0.5Co0.8Fe0.2O3−δ–Sm0.5Sr0.5CoO3−δ composite cathode
materials for IT-SOFCs. Journal of Alloys and Compounds, 465(1), 274-279.
9. Njoku, C. B., & Ndungu, P. G. (2015). Synthesis and characterization of novel
Ce0.8Sm0.2Fe0.9Ir0.03Co0.07O3−δ perovskite material and possible application as a
cathode for low–intermediate temperature SOFCs. Materials Research Bulletin, 68,
100-108.
10. Chen, D., & Jiao, X. (2000). Solvothermal synthesis and characterization of barium
titanate powders. Journal of the American Ceramic Society, 83(10), 2637-2639.
9
11. Zhang, L., Lan, R., Kraft, A., & Tao, S. (2011). A stable intermediate temperature
fuel cell based on doped-ceria–carbonate composite electrolyte and perovskite
cathode. Electrochemistry Communications, 13(6), 582-585.
12. Goodenough, J. B., & Huang, Y. H. (2007). Alternative anode materials for solid
oxide fuel cells. Journal of Power Sources, 173(1), 1-10.
13. Beresnev, S. M., Kuzin, B. L., & Bronin, D. I. (2007). Nickel-cermet anode for fuel
cells with the LSGM electrolyte. Russian Journal of Electrochemistry, 43(8), 883-
887.
14. Dalslet, B., Blennow, P., Hendriksen, P. V., Bonanos, N., Lybye, D., & Mogensen,
M. (2006). Assessment of doped ceria as electrolyte. Journal of Solid State
Electrochemistry, 10(8), 547-561.
15. Tsipis, E. V., Kharton, V. V., & Frade, J. R. (2007). Electrochemical behavior of
mixed-conducting oxide cathodes in contact with apatite-type La10Si5AlO26.5
electrolyte. Electrochimica acta, 52(13), 4428-4435.
16. Grgicak, C. M., Green, R. G., & Giorgi, J. B. (2008). SOFC anodes for direct
oxidation of hydrogen and methane fuels containing H2S. Journal of Power
Sources, 179(1), 317-328.
17. Steele, B. C. (1999). Fuel-cell technology: Running on natural gas. Nature,
400(6745), 619-621.
18. Schober, T., & Ringel, H. (2004). Proton conducting ceramics: recent advances.
Ionics, 10(5-6), 391-395.
19. Schober, T. (2005). Composites of ceramic high-temperature proton conductors
with inorganic compounds. Electrochemical and Solid-State Letters, 8(4), A199-
A200.
20. Uvarov, N. F., Ponomareva, V. G., & Lavrova, G. V. (2010). Composite solid
electrolytes. Russian Journal of Electrochemistry, 46(7), 722-733.
21. Adler, S. B. (2004). Factors governing oxygen reduction in solid oxide fuel cell
cathodes. Chemical Reviews, 104(10), 4791-4844.
22. Guo, W., Liu, J., Jin, C., Gao, H., & Zhang, Y. (2009). Electrochemical evaluation
of La0.6Sr0.4Co0.8Fe0.2O3−δ–La0.9Sr0.1Ga0.8Mg0.2O3−δ composite cathodes for La0.9Sr0.1
10
Ga0.8Mg0.2O3−δ electrolyte SOFCs. Journal of Alloys and Compounds, 473(1), 43-
47.
23. Qiang, F., Sun, K., Zhang, N., Zhu, X., Le, S., & Zhou, D. (2007). Characterization
of electrical properties of GDC doped A-site deficient LSCF based composite
cathode using impedance spectroscopy. Journal of Power Sources, 168(2), 338-345.
24. Blennow, P., Hjelm, J., Klemensø, T., Ramousse, S., Kromp, A., Leonide, A., &
Weber, A. (2011). Manufacturing and characterization of metal-supported solid
oxide fuel cells. Journal of Power Sources, 196(17), 7117-7125.
25. Shen, C., & Shaw, L. L. (2010). FTIR analysis of the hydrolysis rate in the sol–gel
formation of gadolinia-doped ceria with acetylacetonate precursors. Journal of Sol-
gel Science and Technology, 53(3), 571-577.
26. Brasil, M. C., Benvenutti, E. V., Gregório, J. R., & Gerbase, A. E. (2005). Iron
acetylacetonate complex anchored on silica xerogel polymer. Reactive and
Functional Polymers, 63(2), 135-141.
27. Sharma, M., & Jeevanandam, P. (2011). Synthesis of magnesium oxide particles
with stacks of plate’s morphology. Journal of Alloys and Compounds, 509(30),
7881-7885.
28. Mastuli, M. S., Ansari, N. S., Nawawi, M. A., & Mahat, A. M. (2012). Effects of
cationic surfactant in sol-gel synthesis of nano sized magnesium oxide. APCBEE
Procedia, 3, 93-98.
29. Lou, Z., Peng, J., Dai, N., Qiao, J., Yan, Y., Wang, Z., Wang, J., & Sun, K. (2012).
High performance La3Ni2O7 cathode prepared by a facile sol–gel method for
intermediate temperature solid oxide fuel cells. Electrochemistry Communications,
22, 97-100.
30. Ermokhina, N. I., Nevinskiy, V. A., Manorik, P. A., Ilyin, V. G., Shcherbatyuk, N.
N., Klymchyuk, D. O., & Puziy, A. M. (2012). Synthesis of large-pore mesoporous
nanocrystalline TiO2 microspheres. Materials Letters, 75, 68-70.

11
CHAPTER 2
Literature review
1.0 Introduction
Solid oxide Fuel cells are promising power generation systems of high efficiency through
the conversion of fuel gases by electrochemical reactions. Electrical energy is produced in
the process and steam and heatare giving off as byproducts [1, 2]. The general advantages
of solid oxide fuel cells are reflected by the following desirable characteristics, high energy
conversion efficiency, low emissions of pollutants, low noise or vibrations, efficient
reduction of greenhouse gas (CO2) formation at the source compared to low-efficiency
devices; and provides simple conversion of chemical energy to electrical energy. Other
advantages include fuel flexibility and existing infrastructure of hydrocarbon fuel supplies,
co-generation ability [3 - 8].
SOFCs have been applied in auxiliary power units of vehicles, stationary power generation
used to power homes, industries, offices and malls and in the production of heat engines
that also act as power generating devices. The power generation outputs are within 100 W
to 2 MW with high efficiency. For example, an Australian company, Ceramic Fuel Cell
Ltd. in 2009 produced SOFCs that work with efficiency of 60 % [9]. SOFCs are used in the
production of on-board auxiliary power units for heavy duty trucks, recreational vehicles
and luxury automobiles that run on electrical power and vehicles that use pure hydrogen as
fuel source. For example a 5 kW auxiliary power unit was successfully developed by
Delphi Corporation, which runs on gasoline or diesel through its reformation by partial
catalytic oxidation. Delphi worked on improving the auxiliary units over the years by
reduction of its mass, volume and compatibility with automotive requirements, faster start
up time and improved thermal cycling tolerance [10 - 12].
Over the years, the development of SOFCs has been within the operating temperature range
of 900 to 1000 °C normally referred to as high temperature SOFCs (HTSOFCs). The

12
development of HTSOFCs is accompanied by the release of exhaust heat, which in turn can
be used for cogeneration of energy when integrated with a gas turbine to increase the total
efficiency of the engine capacity system [13]. However, SOFCs operating at these high
temperatures come with disadvantages, which are highdegradation of fuel cell component
materials, slow start up and cool down times and thermal compatibility of component
materials [14, 15]. Based on these disadvantages studies on low temperature SOFCs
(LTSOFCs) have become an area of intensive researchwith the focus on developing SOFCs
that operate between 300 - 600 °C [16]. The advantages of reducing SOFCs temperature
makes it possible to use less expensive materials, to suppress degradation caused by the
high operating temperatures and by thermal cycling, to facilitate miniaturization, quicker
start up and cool down time and to improve the efficiency of the SOFC system [17 - 19].
LTSOFCs have disadvantages which includes decrease in electrical conductivity and
electrode kinetics during operation. One way to minimize these losses is using electrolytes
with high ionic conductivity or by using thin electrolytes and alternative cell materials and
designs, which are the main areas of current investigation [20]. SOFCs comprise of three
key components, the electrolyte, cathode and anode, a schematic representation is shown in
Figure 1.
Figure 1: A Schematic diagram of an SOFC mechanism.
Oxygen Ions
Oxidant
By product
Fuel
Load e-
Anode Cathode Electrolyte By product
e-

13
In SOFCs, the electrolyte layer is required to be compact while providing a pathway for ion
transport. It is inserted between two porous electrodes called the anode and cathode, where
the fuel oxidation reaction and the oxygen reduction reaction occur respectively. In SOFC
device, hydrogen molecules (as fuel gas) dissociate and release electrons at the anode, these
electrons migrate to the surface of the anode and move to the cathode along the external
circuit, while the oxygen molecules from the cathode side are separated and ionized by the
electrons to form oxygen ions. When the ions combine with the electrons, the oxygen ions
are then transported to the cathode/electrolyte interfaces which are then incorporated into
the electrolyte. They move continuously from the electrolyte to the anode/electrolyte
interface, and then eventually to the reaction site. The half - cell reaction for the electrode
processes are shown the equation below [21].
The half - cell oxidation reaction that occurs at the anode is:
(1)
The half – cell reduction reaction that occurs at the cathode is:
(2)
The reaction of these ions with the electrons generates electricity and produces water in the
form of steam at the triple phase boundary (TPB) (where the ions, electrons and the gas
phase meet). The water then flows to the surface of the anode and diffuses into the bulk gas
of the exhausted fuel. The electron transport in the external circuit generates electricity and
heat. Whereas for some composite electrolytes and perovskite electrode materials that
exhibit mixed ionic and electronic conductivity in the fuel cell condition, water is produced
both at the anode and cathode chambers of the cell [22, 23].
1.1 Types of SOFC
SOFCs are classified based on operating temperatures, electrolytes used, its combination
with other components such as gas turbines and the electrochemical processes involved.
SOFCs that operate at a temperature range, between 300 – 600 °C are called low

14
temperature SOFCs (LTSOFCs) [24]. Development of low temperature SOFCswould
mitigate degradation, reduce sealing problems, encourage the use of less expensive
materials, reduce production cost (e.g., ferritic stainless steels for interconnect), improve
response to rapid start-up and repeat thermal cycling from ambient to operating
temperatures [25 - 27].
SOFCs that operate between 600 and 800 °C are called Intermediate temperature SOFCs
(ITSOFCs). The push for high performance ITSOFCs has been an area of focus in most
research and development for the past decades. The electrodes used in ITSOFCs should
possess adequate porosity for gas transport, high electrical conductivities, long-term
stability and good compatibility with the electrolyte. There are factors that govern the
electrode performance which includes the electronic resistivities of the electrocatalysts,
overpotentials associated with charge-transfer at the electrocatalyst/electrolyte gas-phase
boundaries, the ionic resistivity of the electrolyte, and rates of transport of gases through
the porous electrodes. It has also been reported that slow interfacial (charge-transfer)
reaction rate at the electrocatalyst/electrolyte interfaces often limits performance. One area
of focus is the cathode material, it has been established that the oxygen reduction reaction is
responsible for most of the limitation in performance, so the catalytic activity of the
cathode is being studied and enhanced through various techniques, including catalyst
impregnation to improve ITSOFCs [28 – 31].
SOFCs that operate in the temperature range of 800 to 1000 °C and above are called high
temperature SOFCs (HTSOFCs). HTSOFCs exhibit high capabilities for the internal
reformation of hydrocarbon fuels for example, natural gas. Such high temperature SOFCs
also provide high quality exhaust heat for cogeneration, which when pressurized, can be
integrated with a gas turbine to further increase the overall efficiency of the power system
[32]. Fuel cells operating at high temperatures place considerable restrictions on the
materials that can be used in both the cell construction and in the balance of plant materials,
mismatch in thermal expansion coefficient (TEC) between the cell materials leading to
cracking, slow startup and long cool down times.

15
Solid oxide fuel cell can also be combined with a gas turbine called SOFC-GT [33 - 37].
Such systems have been evaluated by Siemens Westinghouse and Rolls Royce as a means
to achieve higher operating efficiencies by running the SOFC under pressure. SOFC - GT
systems typically includes the anodic and cathodic atmosphere recirculation, thus
increasing its efficiency. Theoretically, the combination of the SOFC and a gas turbine can
produce overall results of high electrical and thermal efficiency. Palsson et al. [32] reported
a maximum efficiency of 65 % lower heating value (LHV) obtained at a pressure ratio of 2,
developed from a two dimensional, steady-state SOFC model and a combined system
containing an external pre-reforming and recirculation of anode gases. GT–SOFC system
comprises of six parts: air compressor, high temperature SOFC, combustor, recuperator,
gas turbine and power turbine. Generally, SOFC can be attached to gas turbines in two
different ways: indirect (Figure 2) and direct combinations. For indirect, the combustor of
the gas turbine is substituted with a heat exchanger wherein air from the compressor is
heated up by the fuel cell exhaust (Figure 2). Under the indirect SOFC–GT hybrid system,
the SOFC can be operated at atmospheric conditions [38]. A schematic diagram is shown in
Figure 2.
Figure 2: Schematics of combined gas turbine power plant with SOFC (Indirect).
16
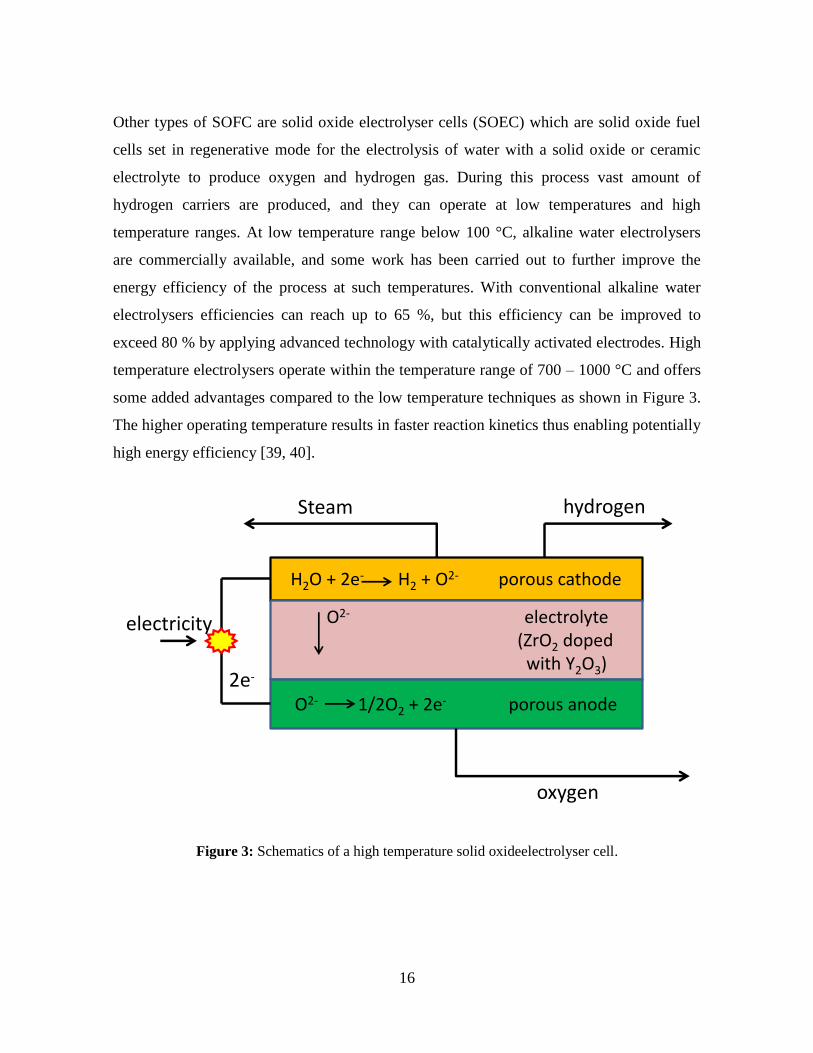
Other types of SOFC are solid oxide electrolyser cells (SOEC) which are solid oxide fuel
cells set in regenerative mode for the electrolysis of water with a solid oxide or ceramic
electrolyte to produce oxygen and hydrogen gas. During this process vast amount of
hydrogen carriers are produced, and they can operate at low temperatures and high
temperature ranges. At low temperature range below 100 °C, alkaline water electrolysers
are commercially available, and some work has been carried out to further improve the
energy efficiency of the process at such temperatures. With conventional alkaline water
electrolysers efficiencies can reach up to 65 %, but this efficiency can be improved to
exceed 80 % by applying advanced technology with catalytically activated electrodes. High
temperature electrolysers operate within the temperature range of 700 – 1000 °C and offers
some added advantages compared to the low temperature techniques as shown in Figure 3.
The higher operating temperature results in faster reaction kinetics thus enabling potentially
high energy efficiency [39, 40].
Figure 3: Schematics of a high temperature solid oxideelectrolyser cell.
H2O + 2e- H2 + O2- porous cathode
O2- electrolyte (ZrO2 doped
with Y2O3)
O2- 1/2O2 + 2e- porous anode
Steam hydrogen
oxygen
electricity
2e-

17
1.2 Materials used for SOFC components
1.2.1 Anodes
SOFC anodes are generally porous ceramic-metallic (cermet) composites of an electrolyte
(e.g. CeO2) and a metal such as nickel (Ni). The metal acts as a catalyst to promote fuel
oxidation, and serves as an electronic conductor, while CeO2 acts as a conductor of O2- ions
into the porous anode. This process extends the triple phase boundary (TPB) region, and
provides a structural support to prevent the sintering of nickel [41, 42]. The electrolyte aids
to balance the thermal-expansion coefficients of the anode and electrolyte, deterring
cracking and leakage produced by thermal cycling [43]. An anode works as a catalyst for
light hydrocarbon of fuels like methane (CH4), pure hydrogen (H2), mixture of carbon
monoxide (CO), hydrogen, diesel, gasoline and the reformation of fuels into hydrogen. The
electrochemical process at the anode comprises of the diffusion of oxygen ions through the
electrolyte to oxidize the hydrogen fuel at the anode side, and produces heat, water and
electricity in the process [44, 45]. The electrochemical reactions at the anode are shown in
the equations below.
The overall anode half-cell oxidation reactions for four typical fuels are [45],
(3)
(4)
(a) (5)
(6)
where el = electrolyte, a = anode, g = gas.
The anode and materials must possess some distinguishable properties to be compatible
with other components in an SOFC system. Anodes must have high electronic and ionic
conductivity for improved transport of ions and electrons. They must possess reducing
abilities for fuel oxidation and the porosity of the ceramic anode layer must be pronounced
18
for free flow of gases and electrons to the active sites [46 - 49]. The thermal expansion
coefficient must be compatible with that of the cathode and electrolyte to avoid high
polarisation loss and cracking of the cells.
1.2.2 Structure of Anodes
In recent years the development of anodes has focused on nickel because of its abundance
and availability. The thermal expansion for nickel (13.3 x 10⁻⁶
/C) is higher than YSZ (10 x
10-6
/C) or doped ceria in it pure form, which makes it difficult to pair. Pairing them makes
nickel to sinter and close off its porosity at high operating temperatures. This problem has
been solved by making anode composites with electrolyte material. The electrolyte
composites provide structural support for Ni-particles prevents closure of the pores and
improves anode to electrolyte adhesion [43].
In addition, anode should be porous when fabricated. The microstructure must have lots of
chemical and electrochemical reaction sites to promote charge transfer. They must also
possess high solid-phase connectivity for electron, ion conduction and connected pore
network to reduce limitations of mass transport [44 - 46]. SOFC anodes must also be
chemically, mechanically compatible and stable under fabrication and operating conditions.
They can be fabricated by impregnating the electrolyte with Ni or NiO e.g Ni-YSZ or Ni-
GDC or SDC to extend the TPB into the bulk space of the anode. Another method is by
infiltrating other electrolytes to the anode cermet e.g Ni-YSZ/SDC to improve the ionic and
catalytic activities of the anode [50 - 55].
However, anodes can be applied to fuel cell by using powder technology processes. These
techniques are used for the addition of Ni slurries over the cell and the electrolyte
composite by electrochemical vapour deposition, or Ni - YSZ/SDC slurry is applied and
sintered [56]. Another approach of using NiO - YSZ/SDC slurries is by freeze-drying
approach to form porous structures without the use of fillers. Freeze dry process is done by
applying the slurry through a dipping process and then freeze-dried which is then allowed
to sublime. Due to the crystallization of water the resulting pore structures formed are
neatly aligned allowing the passage of gases to and from the electrolyte/anode interface.

19
The fineness of the pore structure is easily controlled by adjusting the solid contents and
water content of the slurry [57]. The anodes in powder form can also be applied unto the
electrolyte by pellet formation. The anode powder is added unto the electrolyte in a pellet
chamber and pressure is then exerted to form a disc. Moreover the thickness of the anode
slurry depends on the structural configuration of the cell, for anode supported cells the
anode cermet is thicker than that of electrolyte supported cells which is showed in Figure 5.
Figure 4: The schematics of (a) Anode supported cell configuration and (b) The electrolyte
supported cell configuration.
1.2.3 Materials used as Anodes
1.2.3.1 Nickel based anodes
Nickel has been proven to be the best metallic conductor and is used as metallic anodes.
Nickel is a superb catalyst for hydrocarbon fuel reforming, variability, and cracking, which
causes rapid carbon deposition inside SOFC anodes, producing coking and deactivation at
desired operating temperatures [58]. To some degree, the optimization of SOFC operating
conditions can avoid carbon deposition. For instance, carbon deposition can be suppressed
by increasing steam content through steam reforming and water gas stream (WGS)
reactions. Likewise, carbon deposition on many oxides can also be prevented by reducing
the operating temperature below 750 °C which helps to restrict CH4 dissociation [59, 60].
Nickel combined with electrolytes to form anode cermet such as Ni-YSZ/SDC has been
explored because of its advantage over other metal anode cermets. This is because during
thermal cycling the porous layer of other metals detach from the electrolyte material due to
Ni-GDC anode
GDC electrolyte
Cathode(a) (b)
20
the disparity in their thermal expansion coefficient, leading to an increase in electrode
resistance. This can be controlled by sintering fine grained metal/electrolyte cermet such as
nickel based anodes, because, it is less volatile, chemically stable, affordable and has high
catalytic activity [60]. For example Zhan et al. [61] reported a power density of 1.00 W/cm2
for NiO-SDC anode, using H2 + 3 % H2O fuel composition at 600 °C and 0.60 W/cm2 at
590 °C using 6 % iso-C8H18 + 94 % air. Njoku et al. [62, 63] recorded a power density of
0.47 W/cm2 at 500 °C for NiO-SDC anode and 0.40 W/cm
2 at 500 °C in pure hydrogen.
Zha et al. [61] also investigated Ni-GDC anode at 600 °C and recorded a power density of
0.60 W/cm2, 0.519 W/cm
2 and 0.433 W/cm
2 for H2, CH4 and C3H8 fuel gas respectively.
Further studies have also been done on infiltrating electrolytes into the anode cermets using
Ni, Ru, Cu, YSZ, gadolinium doped ceria (CGO), on different fuel sources to improve its
performance [61]. For example Hibino et al. [64] reported that Ru-Ni-GDC anode in Ru-
Ni-GDC/GDC/SSC cell exhibited power densities of 0.769 W/cm2 for H2 gas, 0.750 W/cm
2
for Dry CH4, 0.716 W/cm2 for dry C2H6 and 0.648 W/cm
2 for dry C3H8 respectively at 600
°C. Also recent work done with nanostructured barium-oxide/nickel (BaO/Ni) anode
interface produced by vapor deposition of BaO into Ni-YSZ has shown to be effective for
carbon removal [65]. The BaO/Ni-YSZ anode exhibited stability during operation and high
power density of 0.88 W/cm2 for CO, 0.70 W/cm
2 C3H8 and gasified carbon fuels at
temperatures below 750 °C, with no observable microstructural change and minimal carbon
build up [65, 66].
Testing was also done for methane (CH4) oxidation over the catalysts comprising of Cu,
bimetallic Cu– Ni, and Ce (Ln)O2-, where (Ln = Gd or Tb), because copper is preferred for
the conversion of hydrocarbon fuels, due to its resistance to carbon deposition. Ceria-based
oxides (Ce1-xGdxO2-δ or GDC) are commonly used because ceria is a superb electrocatalyst
for CH4 and a good oxygen-ion conductor at reduced temperatures [60]. It was discovered
that Ni-ceria cermets suffer from dimensional instabilities caused by the local oxygen
partial pressure p(O2) variations and minor TEC mismatch [61]. Therefore the combination
of one redox-stable phase with moderate thermal expansion can be used to avoid the
resultant increase in anodic polarization.

21
1.2.3.2 Ceria based anodes
Ceria-based anode materials were first tried out in SOFCs in the 1960s due to a number of
reasons. They are known to have high catalytic activity in oxygen combustion reactions,
especially in carbon oxidation which is beneficial to fuel cells which use biogas as fuel. In
addition, the reduced form of CeO2- and its derivatives have a substantial mixed oxygen
ionic and electronic conductivity. The enhancement of its transport properties and
reducibility can be made possible by acceptor-type doping (positive charge carriers that
influence the properties of the material) [67, 68], which improve the electrode performance.
For example, high power density was reported for Ce1-xSmxO2- (x = 0 – 0.4) anodes with
YSZ electrolyte at 800 – 1000 C in humidified hydrogen for x = 0.2 [69]. On the other
hand, no carbon deposition was detected on Ce0.6Gd0.4O2−δ electrode after testing the cell
for 1,000 hrs at 1000°C. The steam to carbon ratio was 0.3. The electrocatalytic activity of
gadolinium-doped ceria without extra additives was found to be insufficient to provide
direct CH4 oxidation [70].
Ohmic losses and current restriction is another phenomena of ceria solid solutions which
can be solved by the introduction of additional metal components. Comparative tests
carried out reported that electrode layers containing nickel and various mixed conducting
components such as Ni(Ca;Gd)(Co;Mg)O3- perovskites or Gd2Ti2O7- pyrochlore exhibit a
lower performance than those with ceria. For instance the overpotential of 95 wt % Ni – 5
wt % Ce0.8Ln0.2O2- (Ln = Sm, Gd) anodes in contact with La0.8Sr0.2Gd0.2M0.8 (LSGM) were
marginallylower for Ln = Sm. Through the test, conclusions were drawn on the role of
ceria-based additives [71]. Ceria based components have increasing impacts with
decreasing temperature which are crucial under the LT SOFC operating conditions [72].
Further improvement on ceria based components has been targeted at infiltrating nano-
crystalline ceria onto the anode cermet surface. This combination can enhance the exchange
rates between the solid electrolyte and electrode enlargement at the triple phase boundary
(TPB), the surface area of the electrodes, provide a better contact between particle
components and increase its tolerance towards sulphur poisoning [73, 74].
22
1.2.3.3 Alternative anode compositions
Recently, studies have been done on Cu-cerium oxide anode and discovered to be a
possible alternative to nickel in LT SOFCs for the oxidation of hydrocarbons. It was
discovered that copper is a superb current conductor but a weak catalyst for hydrocarbon
reactions.Hence cerium oxide is added as a matrix to improve its hydrocarbon oxidation
process. It has been reported that Cu-cerium oxide anodes are compatible with cerium
oxide electrolytes in fuel cells andinitial results using a wide range of hydrocarbon fuels
were promising [75]. For example Heet al. [75] reported that Cu-Ce0.8Sm0.2O2-α exhibited a
maximum power density of 285 and 408 mW/cm2 at 550 and 600 C respectively. Zha et al.
[76] examined CuO-GDC anode and reported power densities of 275 mW/cm2, 200
mW/cm2
and 175 mW/cm2 at 600 °C in H2, CH4 and C3H8 fuel atmosphere. Ma et al. [77]
reported a power density of 285 mW/cm2
and 408 mW/cm2 at 550 °C and 600 °C for CuO-
SDC anode.
Researches have also shown that the addition of iridium to anode cermets enables internal
reformation of hydrocarbons, and thus allows SOFCs to run on more conventional fuels [78
- 79]. For instance, Ir/CGO was used in reforming of ethanol, for CGO sample. Ethanol
conversion remained constant at around 100 % during 25 hrs time of streaming (TOS). The
main products formed were H2, CO, CH4, and CO2. The addition of Ir to CGO enhances
ethanol dehydrogenation rate, as observed for noble metal catalysts which promotes steam
reformation of methane [80]. Other alternative anode cermets are shown in Table 2.
Perovskite related structures have also been used as alternative anode materials primarily
because of its extensive cation substitution and good transport properties compared
tospinel, fluorites, pyrochlores, C-type oxides, or garnets. The materials were compared
during fabrication and SOFC operation, using the following conditions. Inspecting the O2
partial pressure stability limits, by checking its electronic conduction and stability in
oxidizing atmospheres which showed that the thermodynamic stability of magnetite,
cobaltite, and ferrite based compounds were limited under anodic conditions. A variety of
other compounds, such as rare earth vanadates and molybdates, displayed attractive

23
properties in reducing environments, but undergo phase changes leading to the formation of
materials with low conductivity [81, 82].
Compounds of ternary oxides utilized as parent compositions in developing anodes are
limited, especially those of Cr and Ti containing compounds. One good parent material,
LaCrO3 has been studied as alternative anodes in the reformation of hydrocarbon fuels and
deposition of carbon as shown in Table 1 [83, 84]. For many other perovskites, the
dominant p-type (positively charged) doping, electronic conductivity and electrocatalytic
activity of lanthanum chromite has been enhanced by the substitution of La3+
with alkaline-
earth cations. For example, (La, A) CrO3- (A = Ca, Sr) anodes were reported to oxidize
methane without coking at temperatures above 490 C, showing promise as candidates for
hydrocarbon fuelled SOFCs [85, 86].
Table 1: Alternative SOFC anode materials and their components.
Composition Temperature
T (K)
Conductivity
α x 106 (K
-1)
Reference
Ni - 16.5 [87]
Zr0.85Y0.15O2 303 – 1273 10.9 [87]
Ni-Zr0.85Y0.15O2 (40 – 60 vol. %) 303 – 1273 12.6 [87]
Zr0.94Y0.06O2 298 – 1273 10.5 [87]
Ni-Zr0.94Y0.06O2 (30- 70 vol. %) 298 – 1273 12.7 [87]
Ni- Zr0.94Y0.06O2 (40 – 60 vol.%) 298 – 1273 13.1 [87]
Ni-Zr0.94Y0.06O2 (45-55 vol.%) 298 – 1273 13.3 [87]
La0.9Sr0.1CrO3 303 – 1273 10.7 [88]
La0.79Sr0.20CrO3 623 – 1273 11.1 [88]
La0.7Ca0.3Cr0.5Ti0.5O3 303 – 1273 10.1 [88]
[La0.75Sr0.25]0.95Cr0.5Mn0.5O3 373 – 923 10.8 [89]
Nb-SrTiO3 623 – 923 - [90]
1.3 Electrolytes
Electrolytes are ceramics with a dense layer that promotes the conduction of oxygen ions.
In high temperature SOFCs the transportation of oxygen ion is maintained sufficiently for a
good performance [91]. When the operating temperature is lowered to about 600 °C, the

24
electrolyte begins to exhibit high resistances in its ionic transport and this affects the total
performance [92, 93]. Standard electrolyte materials that have been used are yttria
stabilized zirconia (YSZ) (often the 8 % form Y8SZ), scandia stabilized zirconia (ScSZ)
(usually 9 mol % Sc2O3 – 9ScSZ) and doped ceria mixed with gadolinium or samarium
(GDC/SDC) [88 - 90]. The electrolyte material has a vital effect on the cell performance. It
has been discovered that unfavourable reactions occur between YSZ electrolytes and
modern cathodes such as LSCF, which can be prevented by using ceria diffusion barriers
that are <100 nm [94, 95].
Present endeavours are now geared towards maintaining a high level of oxygen ion
conductivity in SOFCs at lower temperatures less than 500 C which would broaden the
material choices for SOFCs and solve many existing problems [96]. These problems can be
solved by certain processing techniques which are thin film deposition, reduction in the
electrolyte resistance and the migration distance of oxygen ions which produce grain
structures that are less resistive, such as columnar grain structure. This micro-structure can
be controlled by using nanocrystalline fine grains to achieve "fine-tuning" of the electrical
properties and to build composites with large interfacial areas which have been reported to
exhibit remarkable electrical properties.
1.3.1 Structure of Electrolytes
Electrolytes must be dense to avoid short circuiting of the reacting gases migrating through
it. The thickness of the electrolyte should be 150 µm depending on the configuration of
the cell, it can also be slim as possible to reduce resistive losses in the cell. Other materials
used have to be thermally, chemically and structurally stable over a wide range of
temperatures. The oxygen ions formed from the conversion of molecular oxygen migrates
through the electrolyte to the anode side of the cell. This migration is encouraged by high
ionic conductivity and no electrical conductivity possessed by the electrolyte. Electrolytes
can also be mixed with two or more materials/phases called composite electrolytes or
heterogeneous doped materials or dispersed electrolytes [97 – 99]. They are characterised
by high conductivity and improved mechanical strength which occurs through interfaces

25
but at significantly lower temperatures [97 – 101]. The electrolyte properties can be
controlled by varying the conductance type, which are very flexible.
1.3.2 Materials used as electrolyte
1.3.2.1 Ceria based electrolyte
Ceria based electrolyte exhibits high ionic conductivity at temperatures lower than 700 C.
The reduction in temperature has provided many options for combination and availability
of materials used as electrolytes. The disadvantage is that electrolytes are susceptible to
reduction at the anode (fuel) side, when operating at lower temperatures. The ionic
conductivity is also hindered by the resistance within the grain boundaries. Several studies
to develop compositions that solve these problems of resistance have been conducted [102
– 104].
1.3.2.2 Ceria based nanocomposite
Generally, the ionic conduction in single-phase electrolyte materials follows the oxygen
vacancy mechanism. However, the limited oxygen vacancies (limited charge carriers) and
the long transport ion distance (high activation energy) restrict the final ionic conductivity.
Although the oxygen vacancy concentration can be enhanced with the increase of the
doping content, there is an optimal value, above which the oxygen sublattice ordering
caused by the defect association or interaction may reduce and subsequently affect the
electrical conductivity.
In recent years, a series of functional two-phase ceria salts nanocomposite materials have
been exploited to overcome the low ionic conductivity of the single-phase electrolyte
materials [104, 105]. Two kinds of nanocomposites will be described in detail, one is the
ceria carbonate nanocomposite electrolyte, and the other is ceria oxide nanocomposites.
Ceria carbonate has been exploited for its properties and electrochemical performance,
while the ceria-oxide composites need to be further developed for advanced applications.

26
1.3.2.3 Ceria oxide nanocomposites
The ceria oxides in composite electrolytes are SDC, GDC or YDC. The ionic conductivities
of these composite electrolytes are much higher than those of the single-phase doped ceria
or zirconia oxides. Taking the doped ceria - Na2CO3 as an example, its ionic conductivity
can reach 0.1 S cm-1
around 300 °C, which is two orders of magnitude higher than that of
single phase SDC material. The super ionic phase transition is highly dependent on the
composition and the operational conditions, such as the temperature raising rate and the
applied gas atmosphere. While Zajac et al. [105] reported Y2O3-SDC material displayed
enhanced conductivity than SDC alone at all temperatures.
1.3.2.4 Ceria carbonate nanocomposite
Ceria-based nanocomposites have been developed as promising electrolyte candidates for
LTSOFCs due to their enhanced ionic conductivity and fuel cell performance [106].
Among these composite electrolytes, doped ceria-carbonate shows the most promising
potential compared with other doped ceria salt composites, and this has led to worldwide
interest with great progress on both the ceria carbonate composite themselves, high
performance fuel cells and electrode development [107, 108]. The composite designed and
fabricated, uses the interface as an express path for ionic conduction. Recently, some new
composite electrolytes with unique nanostructures, for example, core-shell SDC/Na2CO3
nanocomposite [109] and SDC nanowires have been designed by novel nanocomposite
approach and are dominant factors for ion transport in these materials. Furthermore, it has
been reported that the SDC-carbonate composites possess hybrid O2-
/H conduction property
[110, 111].
The proton and oxygen ion conduction behaviours of SDC/Na2CO3 nanocomposite
electrolyte conduction mechanism have been studied [109]. The result revealed that the
proton conduction accounts for the notable ionic conductivity and fuel cell performance of
SDC/Na2CO3 nanocomposite. This indicates that interface in the composite electrolyte,
supplies high conductive paths for proton transport. An empirical “swing model” has been
proposed for the mechanism of superior protonic conduction, as the secondary phase in

27
composite electrolyte, Na2CO3 performs several crucial functions in SDC/Na2CO3
nanocomposite. That enhance the ionic conductivity, thermal stability of the nanostructure,
improves the densification of the solid electrolyte to prevent any gas leakage and supresses
the electronic conductivity of the parent electrolyte material to improve the performance of
single cells [112].
The above characteristics of the second phase require a homogeneous distribution of
Na2CO3 inclusion in the composite. However, by the current use of dry mixing and wet
mixing methods for composite fabrication, it is difficult to control the homogeneity of
Na2CO3 phase in the SDC/Na2CO3 composite, since nucleation and crystal growth of
Na2CO3 phase cannot be prevented. These drawbacks may be prevented by using
techniques that has been advocated for chemical processes capable of producing pure,
chemically homogeneous and ultrafine powders.
The electrolyte functions of ceria-carbonate nanocomposites have been demonstrated by
many groups for low temperature SOFCs with excellent fuel cell performance. For
example, fuel cells using Ni based electrodes and SDC (Li/Na)2CO3 composite electrolyte
reached a power density of 1085 mW/cm2
and an open circuit voltage (OCV) higher than
1.0 V using hydrogen as the fuel and air as the oxidant [113]. Higher performance of 1200
mW/cm2
was also achieved when the air was replaced with the O2/CO2 mixed gas at 600 °C
[114, 115]. More importantly, a recent work by Huang et al. [116] reported a high
performance can be obtained with the nanocomposite homogeneous SDC/Na2CO3 prepared
by a simple one-step co-precipitation method at low temperatures. The improved
performance and the reduced material and system preparation process makes ceria
carbonate nanocomposite more valuable for practical applications.
1.4 Cathodes
A Cathode is an electrode where reduction of oxygen occurs electrochemically and can be
shown by an elementary reaction to SOFC cathode must possess the following: high
catalytic activity for oxygen molecule dissociation and oxygen reduction, high electronic

28
conductivity, chemical and dimensional stability in environments encountered during cell
fabrication and cell operation as shown in Equation 7. Thermal expansion compatibility
with other cell components, and minimum reactivity with the electrolyte and inter
connection are also considered. It must also be stable with porous microstructure so that
gaseous oxygen can readily diffuse through it to the cathode/electrolyte interface [117,
118].
1.4.1 Structures of the Cathode
In cathodic environment oxygen diffuses from air toward the solid electrolyte near the
triple phase boundary through the pores in the electrode structure which are not rate
limiting in modern electrodes. During the diffusion process, impedance can occur but to
reduce this impedance during gas diffusion, the outer layers must be made of coarse grains
and large pores and close to the solid electrolyte finer grains and smaller pores. The
reduction process in cathodes is characterized by the absorbance of oxygen molecules on
the solid electrolyte, which are separated into two adsorbed atoms. These atoms diffuse on
the solid electrolyte toward the metal and toward the triple phase boundary, where they
combine with two electrons while entering the solid electrolyte [119 - 122]. The overall
reaction can be described by Equation 7 [119];
The overall reaction is written in the kroger - vink notation. Kröger–Vink notation is a set
of conventions that are used to describe electric charge and lattice position for point defect
species in crystals. It is primarily used for ionic crystals and is particularly useful for
describing various defect reactionssuch as:
(7)
where, and
represent an oxide ion vacancy and an oxide ion respectively. The rate
of diffusion in the gas phase or along the grain boundaries depends on the morphology that
might be different for different experiments and the charge transfer reaction rate which is
dependent on the composition of the electrode. For LTSOFCs alternative cathode materials
with high oxide ion diffusion rates and faster oxygen reduction kinetics at the
cathode/electrolyte interface have been developed [121].

29
However, the thermal expansion coefficients for different cathode materials vary. For
example TEC for cobaltites are much higher than that of electrolytes. This affects the
electrical conductivities of the materials by lowering them. Nevertheless, promising results
have been reported using these materials, though in many cases the improved cathodic
performance is found to decrease during the cell lifetime as a result of chemical or
microstructural instability [122]. The cathode materials used in LT SOFCs are discussed in
the next section [119].
1.4.2 Materials used as cathode
1.4.2.1 Ferrites
These iron-containing oxide phases are stable under the SOFC cathodic conditions and
display substantial electronic or mixed conductivity. These primarily include perovskites
like LnAFeO3-α and their derivatives existing as LnAFeO systems, A2Fe2O5±δ brown
millerites, (Ln, A)3Fe5O12±δ garnets in the systems with relatively small Ln3+
cations [123,
124], Popper series like (Ln, A)n+1FenO3, and a variety of other intergrowth compounds
such as Sr4Fe6O13±δ [125]. Cerium oxide pseudobinaries like CoFe2O4 comprising of (Ln,
A)FeO3 and (Ln, A)(Fe, M)O3, is that derivatives which are characterized with large solid
solution domains which facilitate cation interdiffusion. When compared to manganite
electrode materials, one disadvantage of ferrites are they possess high chemical expansion.
Chemical expansion is the spatial dilation of materials that occurs when their composition
changes. When this dilation is caused by a gradual, iso-structural increase in the lattice
parameter with composition, it is related to the composition change by stoichiometric
expansion coefficient [126]. This results in increasing apparent thermal expansion
coefficient (TECs) due to losses at elevated temperatures. This may lead to thermal and
mechanical incompatibility with common solid electrolytes which can be reduced by using
dopants like Ga, Al, Ti, Cr and Ni in La(Fe, Ni)O3 based perovskites and (La0.6, A0.4)1-
xFe0.8M0.2O3 where (A = Sr, Ca, M = Cr, Mn, Co, Ni) [126, 127, 103].
One attractive example of ferrites that has been widely used is La1-xSrxFe1-yCoyO3 (LSFC)
where (x = 0.2 – 0.5 and y = 0.2) system [128, 129], where moderate dopant additions

30
provide a significant enhancement in the total conductivity and electrochemical properties
of LSFCs. These are considered as good cathode materials for LT SOFCs with ceria based
electrolytes. The cathodic overpotential of porous La0.6Sr0.4Fe0.8Co0.2O3 layers in contact
with Ce0.8Sm0.2O2 is 10 – 40 times lower than those of La0.82Sr0.18Fe0.8MnO3/YSZ at 700 –
900 °C [128]. The difference increases with reducing temperature, while the polarization
resistance of La0.6Sr0.4Fe0.8Co0.2O3 double layer cathode comprising of a thick layer and a
thin dense film, applied onto 10 and 20 mol % CGO was reported to exhibit values of 0.5 Ω
cm2
at 500 °C [130]. Other examples of ferrite cathodes reported with low area specific
resistance (ASR) values at 600 °C is La0.6Sr0.4Co0.8Fe0.2O3-δ reported ASR of 0.048 Ω cm2,
La0.6Sr0.4Co0.2 Fe0.8O3-δ exhibited an ASR of 0.25 Ω cm2, Ba0.25La0.25Sr0.5Co0.2Fe0.8O3-δ
exhibited an ASR of 0.038 Ω cm2, La0.6Sr0.4Co0.2Fe0.8O3-δ + Ce0.8Gd0.2O1.9 showed an ASR
of 0.16 Ω cm2
and Ba0.25La0.25 Sr0.5Co0.2Fe0.8O3-δ + Ce0.8Gd0.2O1.9 exhibited an ASR of 0.076
Ω cm2 [131, 132, 133].
1.4.2.2 Cobaltites
Cobaltite based perovskites, offer considerably better cathodic and transport properties,
compared to higher thermal and chemical expansion which limits their compatibility with
solid oxide electrolytes. These cobaltites include derivatives of δ-Bi2O3, Bi2VO5-δ, and
La2Mo2O9-δ [134 – 137]. They also exhibit substantially lower TECs, relatively high mixed
conductivity and fast exchange kinetics which has attracted significant interests in layered
cobaltites such as perovskites like (Ln, Sr)CoO3-δ and their solid solutions. The oxidation
state of Co cations is often more stable when compared with disordered perovskite
analogues such as (LnBaCo2O5) (Ln = Pr, Gd – Ho, Y), (LnBaCo4O7) (Ln = Dy – Yb, Y),
and also Ruddlesden–Popper type (Ln, A)4Co3O10 and (Ln,A)2CoO4-δ (Ln = La – Nd)
existing at moderately reduced oxygen pressures [136 – 139].
Perovskite like (Ln; A)CoO3-δ exhibit greater hole delocalization and ion mobility at low
temperatures. Introduction of Ln-site vacancies in the composition leads to decrease in
ionic and electronic transport [140]. These defects from the cation deficiency are governed
by particular charge compensation mechanisms dependent on the Ln/A ratio, temperature,
31
and oxygen pressure. Cobaltite perovskite have a lower thermodynamic stability and are
less tolerant to cation non-stoichiometry when compared to manganite and ferrites [141,
142]. For example La2-xSrxCoO4±δ (x = 0.7 – 1.0) composition, exhibited a total
conductivity of 150 S cm-1
above 600 °C in air, which are comparable to that of K2NiF4
type nickelates which was 80 – 100 S cm-1
and the highest level of oxygen ionic transport
was exhibited by La1-xSrxCoO3-δ composition when x = 0.65 – 0.70 [99,141,142].
Bi2O3containing materials for perovskite-type phases derived from A(Co, Fe)O3-δ (A = Sr,
Ba) also exhibit high electrical conductivity. They are associated with limitations
experimentally and during partial conductivity measurements which arise from local
vacancy ordering in the oxygen sublattice, cation demixing under non-equilibrium
conditions and phase separation in low temperatures. These cobaltite compositions are
affected by the cobaltite thermodynamic properties, the tolerance factors, the A-site cation
radii and the materials microstructure [142], while Ba2+
doping has a positive impact on the
oxygen reduction kinetics as established by numerous researchers [143 - 150].
Solid electrolyte additions comparable to the percolation threshold are hardly expected to
decrease the average TECs down to any acceptable level [151, 152]. In cobaltites there are
no direct correlations between the bulk transport properties and electrocatalytic behaviours
of cobalt-containing electrodes, which are often visible when compared to other different
groups of the electrode materials [153]. For instance, the maximum power density of
LSGM based SOFCs with (La, Sr)MO3-δ cathodes at 1000 °C increased in the sequence M
= Cr<Mn<Fe<Co [154, 155] and similar trends are known for the electronic conductivity,
oxygen ion diffusivity, and anion deficiency. On the contrary, the lowest polarization
resistance in (Ln,Sr)CoO3 based series was repeatedly found for the compositions where
Ln3+
cation radius is smaller than that of La3+
, including Sm, Nd, or Pr [143, 144, 153, 155].
For Y0:8Ca0:2Co1-xFexO3-δ perovskite that are stable in air at x = 0.1 – 0.7, the
electrochemical activity is low comparable to manganite electrodes a poor performance was
also reported for Y0.9Co0.5Mn0.5O3-δ [156]. The observed tendencies show that, in addition
to the species occupying cobalt and oxygen sublattices, the cathodic kinetics are

32
significantly influenced by specific electrocatalytic properties of lanthanide cations or
surface clusters comprising Ln3+
.
These conclusions are in agreement with numerous experimental and theoretical results
demonstrating that the performance of cobaltite and ferrite electrodes are essentially
governed by the exchange processes at the electrode and electrolyte surfaces and by ion
transfer across the cathode/electrolyte interface [157, 158]. The role of bulk ionic transport
in the electrode material crystal lattice seems important, but less critical with respect to
these steps. Due to the very high electronic conductivity, the hole transport may not be rate
limiting and exhibit no correlations with the electrochemical behaviour which makes it
suitable for LTSOFCs. More examples of cobaltites with their power densities are shown in
Table 2.
Table 2: Examples of the maximum power density in H2 fuelled SOFC with cobaltite cathodes.
Cathodes Electrolyte
Thickness(µm)
Anode Temperature
(°C)
Max.Power
Density(W/cm2)
Reference
La0.9Sr0.1CoO3 YSZ/0.5 Ni 1000 0.39 [155]
La0.9Sr0.1CoO3 LSGM/0.5 Ni 1000
800
0.93
0.38
[155]
[154]
La0.6Sr0.4CoO3 LSGM/0.5 Ni 1000
800
0.71
0.21
[155]
La0.6Sr0.4CoO3 LSGM/0.5 Co 1000 0.53 [155]
La0.2Sr0.8CoO3 LSGM/0.5 Ni 800 0.44 [159]
La0.2Ca0.8CoO3 LSGM/0.5 Ni 800 0.46 [159]
La0.4Ba0.6CoO3 LSGMC/0.4 Ni 600 0.12 [159]
La0.2Ba0.8CoO3 LSGM/0.5 Ni 800 0.52 [159]
Sm0.6Sr0.4CoO3 LSGM/0.5 Ni 800 0.44 [155]
Sm0.5Sr0.5CoO3 LSGM/0.5 Ni 800
600
0.53
0.08
[142]
[154]
Sm0.5Sr0.5CoO3 CGO/0.03 Ni/CGO 600 0.27 [142]
1.4.2.3 Iridates
Iridates are reputed for high metallic conductivity and electrocatalytic activities [160, 161].
Iridium containing perovskites possess good chemical and physical properties such as high
resistance to corrosion, solubility in mineral acids like aqua regia and resistance to other

33
molten metals and silicates at high temperatures. It also has a very high melting point, high
modulus of elasticity, modulus of rigidity, good stability in air and a very low figure for
Poisson’s ratio (the relationship of longitudinal to lateral strain) which signifies a high
degree of stiffness and resistance [162 - 166].
Iridates combine with perovskite ABO3 and ABO2 (where A = Ln (lanthanides) and B =
Cu, Ni, Co, Fe, Mn, platinum metals (Pt, Ir). For example derivatives like IrMnO3 are stable
below 900 – 1100 °C operating temperatures. Lu et al. [167] reported that Ir0.5Mn0.5O2
cathode material exhibited power densities of 43.2 and 80.7 mW/cm2 at 600 °C and 700 °C
respectively. IrO/YSZ has also been reported as suitable cathodes for SOFC applications
within 300 – 600 °C [168]. IrO2/YSZ composites are reported of single-phase particles,
between 4 and 10 nm in size, with an excellent polarization resistance (Rp) of 21 – 968 Ω
cm2 at low temperatures within 300 – 500 °C. IrO2/YSZ electrodes experience structural
and morphological changes at high temperatures triggered by cathodic polarization above
500 °C. This behaviour could enhance the electrochemical performance of the electrode
[169].
The extensive substitution of the Ir sublattice in Ln(Ce, Sm, Sr) (Ir, M)O3 (M = Ti, Co, Ga,
Fe, Ni) containing 5 – 10 % iridium forms the perovskite type Ln1-xAxIr1-yFeyO3-δ (x = 0.1 -
0.01). When iridates are doped with ceria there is a formation of ceria interlayer that helps
to decrease cathodic polarization and makes it suitable for LTSOFCs. For example
Ce0.8Sm0.2Fe0.9Ir0.03Co0.07O3-δ and Ce0.8Sr0.2Fe0.9Ir0.04Co0.06O3-δ exhibited ASR values of
0.247 Ω cm2
and 0.349 Ω cm2
at 500 °C [63, 64], Ln2-xAxMyIr1-yO4 series (x = 0.1 – 1.4)
where A = Sr, x ≤ 1.0, A = Ba, x ≤ 0.5, A = Sm, y ≤ 0.1, M = Fe, x = 0.2 and Co at y ≥ 0.1,
where y = 0.1 – 1.0 for M = Cu at x = 0.1 [170 - 173]. Properties of iridates can also be
improved by surface modification with metal oxides which improve surface oxygen
exchange, for example in La2IrO4 where lanthanides determine its ionic conductivity.
Substitution of iridium with higher valence cation in the sublattice increases interstitial
concentration and ionic transport at low temperatures [173].

34
1.4.3 Composite cathodes used for LT SOFC
1.4.3.1 NANOCOFC approach
NANOCOFC are multifunctional nanocomposites for advanced fuel cell technology.
Electrodes based on metal oxides (Ni- Cu-Zn- oxide) and samarium doped ceria (SDC)
have been used as cathodes. Composites formed high homogeneous distribution of the
particle material which enhances the catalytic properties, electronic conductivity and
reduces the cathodic overpotential when applied in LTSOFC. For example LiNiCuZn-
Oxides – NSDC reached a power output of 730 mW/cm2 at 550 °C [174, 175].
Pr2NiO4-Ag composite based on ceria-carbonate composite electrolyte are nitrate
compounds with doped silver metal. This composition displays acceptable electrocatalytic
activity towards O2 reduction reaction at a temperature of 500 – 600 °C [170, 176].
Lithiated NiO (LiNiOx) has an electrocatalytic activity toward oxygen reduction reaction
and PrNiO4 possess high oxygen diffusion, surface exchange coefficient, and the largest
amount of interstitial oxygen. The integration of these specific features to form LiNiOx –
PrNiO4 nanomaterial and the effective dissolution of Ni in the perovskite lattice gives rise
to a high and stable performance. It has an improved maximum power density of 695
mW/cm2 achieved at 600 °C [177]. Composite material of LiNiCuZn – Oxides, Gd2O3 and
Sm doped CeO2 composited with Na2CO3 (LiNiCuZn oxides-NGSDC), exhibit an OCV of
1.05 V and maximum power density of 800 mW/cm2
[178, 179, 106]. LiNiOCuFeCo on
ceria carbonate electrolyte gives maximum power density of 380 W/cm2
at 560 °C [180].
The research to find suitable cathode materials for LTSOFCs still continues by the
combination of the different materials and compounds of the groups of nickel, cobalt,
copper and iron.
35
1.5 Mathematical models for Polarization
1.5.1 Polarizations
Polarization or overpotential, are irreversible losses in voltage due to imperfections in
materials microstructure and design of the fuel cell. Polarization losses results from ohmic
resistance of oxygen ions conducting through the electrolyte, electrochemical activation
barriers at the anode and cathode. Finally concentration polarizations are due to inability of
gases to diffuse at high rates through the porous anode and cathode (shown as ηA for the
anode and ηC for cathode). The overall polarisation losses can be calculated using Equation
[181].
(8)
where, Eo is the Nernst potential of the reactants, Rw is the Thevenin equivalent resistance
value of the electrically conducting portions of the cell, ηcathode and ηanode are the
remaining difference between the actual cell voltage and the Nernst potential.
In SOFCs, it is often important to focus on the ohmic and concentration polarizations since
high operating temperatures experience little activation polarization. However, as the lower
limit of SOFC operating temperature approaches 600 °C, these polarizations do become
important [182]. SOFC cell voltage can be calculated using the Equation itself. The results
agree with particular experimental data where adequate factors are obtained and do not
agree with original experimental working parameters [183]:
(9)
where, Esofc is the Cell voltage, Emax is the maximum voltage given by the Nernst equation
Imax is the maximum current density (for given fuel flow), ηf is Fuel utilization factor, r1 is
the ionic specific resistance of the electrolyte and r2 is the electric specific resistance of the
electrolyte.

36
There are many parameters which impact cell working conditions, e.g. electrolyte material,
electrolyte thickness, cell temperature, inlet and outlet gas compositions at anode and
cathode, and electrode porosity. The flow in these systems is often calculated using the
Navier-Stroke Equation.
1.5.1.1 Ohmic polarization
Ohmic losses in a SOFC results from ionic conductivity through the electrolyte which is a
function of the crystal structure and atoms involved. However, to maximize the ionic
conductivity, several methods were used when operating SOFCs, at high temperatures that
can significantly decrease the ohmic losses. Substitution doping methods can also be used
to improve the structure and control defect concentrations, which play a major role in
increasing the conductivity. Another way to decrease ohmic resistance is to decrease the
thickness of the electrolyte layer. The relationship between ohmic specific resistance of the
electrolyte as a function of temperature can be described by this Equation [181]:
(10)
where, δ is electrolyte thickness and σ is ionic conductivity. The ionic conductivity of the
solid oxide is defined by this Equation [181].
(11)
where, σo and E is the factors depended on electrolyte material, T is electrolyte
temperature and R is the ideal gas constant.
1.5.1.2 Concentration polarization
The concentration polarization is the result of practical limitations on mass transport within
the cell, and represents the voltage loss due to spatial variations in reactant concentration at
the chemically active sites. This situation arises when the reactants in electrochemical
reactions are consumed faster than the diffusion into the porous electrode, and can also be

37
caused by variation in bulk flow composition. This results from the consumption of
reacting species causing a drop in the reactant concentration as it travels along the cell,
which causes a drop in the local potential near the end of the cell.
The concentration polarization occurs in both the anode and cathode. The anode can be
particularly problematic, as the oxidation of the hydrogen produces steam, which further
dilutes the fuel stream as it travels along the length of the cell. This polarization can be
mitigated by reducing the reactant utilization fraction or increasing the electrode porosity,
but these approaches each have significant design trade-offs.
1.5.1.3 Activation polarization
Activation polarization results from the kinetics involved with the electrochemical
reactions. Each reaction has a certain activation barrier that must be overcome in order to
proceed and this barrier leads to the polarization. The activation barrier results from slow
but complex electrochemical reaction at the electrode surface which is responsible for the
polarization. Activation polarization is calculated using Butler-Volmer equation shown as
Equation 12 [181]:
(12)
where, R is gas constant, T is operating temperature, β is electron transfer coefficient, z is
electron associated with the electrochemical reaction, F is Faraday's constant, i is operating
current density and io is the exchange current density. Activation polarizations can be
modified by microstructural optimization, length of the triple phase boundary, which is the
length where porous, ionic, electronic conducting pathways and gas phase meet. This
directly relates to the electrochemically active length in the cell, the larger the length, the
more the reactions can occur and thus reduces activation polarisation at TPB.

38
1.5.1.4 Open Circuit Voltage
Open-circuit voltage (abbreviated as OCV or VOC) is the difference of electric potential
between two terminals of a device when disconnected from any circuit. There is no external
load connected. No external electric current flows between the terminals.
The Nernst open circuit cell voltage VOC can be evaluated at a corrected average operating
temperature TSOFC, i.e. the average between the mixed anode and cathode inlet flow (∼900
K) and the outlet of the SOFC at 1173 K. The OCV can be calculated using Equation (13).
Voc
(13)
where F = 6.023 × 1023
× 1.602 × 10−19
C mol−1
is the Faraday constant, 2 is the number of
e− produced per H2 mole that reacts through reaction of which the molar Gibbs free energy
change is expressed as ΔG∘ = ΔH∘ − TSOFC ΔS∘, calculated at TSOFC and reference pressure.
Finally,
are the SOFC exit partial pressures of the participating
components in reaction [184]. Using the above partial pressures and temperature data, a
FORTRAN calculator can be used to estimate the overpotentials due to ohmic (VOHM),
activation (VACT) and polarization (VPO) losses.
1.6 Synthesis of perovskites
1.6.1 The Sol - gel method
Sol-gel technique is adopted because it is a less complicated synthesis procedure. It is cost
effective and the synthesis can be carried out at room temperature. Also in this technique
the synthesized perovskite are of high purity, homogenous and the size and morphology of
the material can be regulated [185, 186].
The sol-gel technique involves two processes namely, hydrolysis and polycondensation
reaction of the metal precursors, usually inorganic metal salts or metal organic compounds.
39
During hydrolysis, the gel is formed when there is a complete polymerization and loss of
solvent from the reaction (sol) [187]. In a typical synthesis of perovskite material, the metal
precursors, alcohol, acid/water, and surfactants are mixed together in a reactor and allowed
to stir for a particular period of time depending on the material. A densely cross-linked
three-dimensional structure forms a perovskite gel after stirring for a period varying from
30 mins to several hours depending on the sample.
Hydrolysis Reaction
(14)
(15)
The Reaction for equation 15 continues to form M (OH) n
Polycondensation Reactions
(16)
(17)
Where M represents the metal salts and ROH is the OH group. The reaction mechanism for
the hydrolysis is illustrated by the flow diagram illustrating steps in the sol-gel technique is
shown in Figure 6 [188, 189].
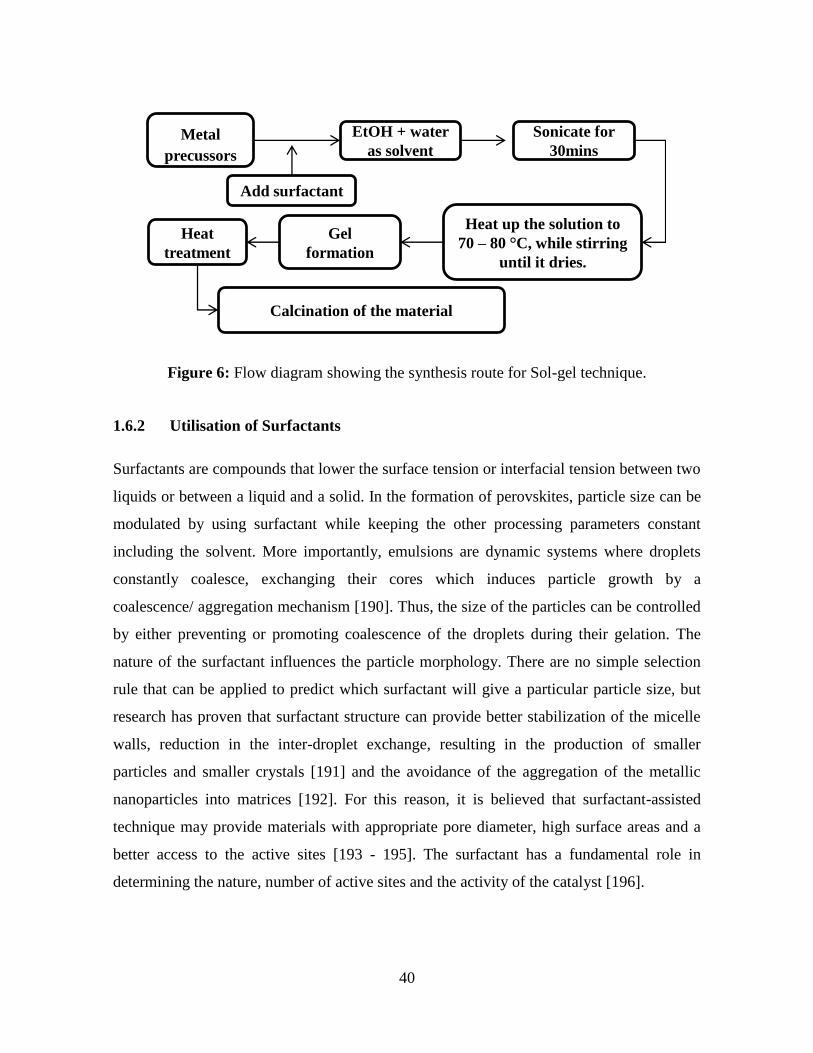
40
Figure 6: Flow diagram showing the synthesis route for Sol-gel technique.
1.6.2 Utilisation of Surfactants
Surfactants are compounds that lower the surface tension or interfacial tension between two
liquids or between a liquid and a solid. In the formation of perovskites, particle size can be
modulated by using surfactant while keeping the other processing parameters constant
including the solvent. More importantly, emulsions are dynamic systems where droplets
constantly coalesce, exchanging their cores which induces particle growth by a
coalescence/ aggregation mechanism [190]. Thus, the size of the particles can be controlled
by either preventing or promoting coalescence of the droplets during their gelation. The
nature of the surfactant influences the particle morphology. There are no simple selection
rule that can be applied to predict which surfactant will give a particular particle size, but
research has proven that surfactant structure can provide better stabilization of the micelle
walls, reduction in the inter-droplet exchange, resulting in the production of smaller
particles and smaller crystals [191] and the avoidance of the aggregation of the metallic
nanoparticles into matrices [192]. For this reason, it is believed that surfactant-assisted
technique may provide materials with appropriate pore diameter, high surface areas and a
better access to the active sites [193 - 195]. The surfactant has a fundamental role in
determining the nature, number of active sites and the activity of the catalyst [196].
Metal
precussors
EtOH + water
as solvent
Heat up the solution to
70 – 80 C, while stirring
until it dries.
Add surfactant
Heat
treatment
Gel
formation
Calcination of the material
Sonicate for
30mins

41
1.6.2.1 Types of surfactant
Surfactants are classified according to polar head groups. Surfactants with no charge group
in its head are called non-ionic and surfactants that carry charge on its head are called ionic
surfactants. The one with negative charge on its head is called anionic surfactant and if the
charge is positive it is called cationic surfactant.
Anionic surfactant: They contain anionic functional groups at their head, such as sulfates
and sulfonate, phosphate and carboxylate. Prominent alkyl sulfates include ammonium
lauryl sulfate, sodium lauryl sulfate andsodium dodecyl sulfate (SDS).
Cationic surfactant: They are pH dependent primary, secondary or tertiary amines:
Primary and secondary amines become positively charged at pH less than 10.For example,
alkyltrimethylammonium salts, cetyl trimethylammonium bromide (CTAB), cetyl trimethyl
ammonium chloride (CTAC), cetyl pyridinium chloride (CPC), benzalkonium chloride
(BAC) and benzethonium chloride (BZT).
Nonionic surfactants: Many long chain alcohols exhibit some surfactant properties.
Prominent surfactants among these are the fatty alcohols, cetyl alcohol, stearyl alcohol and
cetostearyl alcohol and oleyl alcohol, polyoxyethylene glycol, polyoxypropylene glycol and
glucosides.
1.7 Summary
In conclusion, to develop LTSOFCs there are several steps involved.Firstly you need to
decrease the area specific resistance of the cells by using electrolyte materials with higher
ionic conductivity and secondly to improve the electrode performance. The electrode
performance can thus be enhanced by improving the architecture of the material, proper
selection of the structural composition of the electrode material, the method of preparation
and controlling the morphology of the material and the particle sizes by using surfactants.
To further control the morphology and particle sizes, the nano size approach has been used
to make nanoparticle sizes called nanomaterials.

42
The ionic conductivity of the electrolyte can be improved by two ways that follow the
nanotechnology approach and composite approach. For nanostructured ionic conductors,
grain growths are repressed effectively by integrating another phase into the interparticle
region. For nanostructured composite materials, the grain boundary or interface conduction
is dominant in overall transport, which contributes to an enhancement in conductivity. Thus
the nanocomposite approach was introduced to fabricate the electrolyte and to further
enhance the electrode performance, macroporous materials were fabricated.
References
1. Steele, B. C., & Heinzel, A. (2001). Materials for fuel-cell technologies. Nature,
414(6861), 345-352.
2. Yang, L., Wang, S., Blinn, K., Liu, M., Liu, Z., Cheng, Z., & Liu, M. (2009).
Enhanced sulfur and coking tolerance of a mixed ion conductor for SOFCs:
BaZr0.1Ce0.7Y0.2–xYbxO3–δ. Science, 326 (5949), 126-129.
3. Wolf, S., Adam, R., Fuhrmann, L., Ansar, S. A., & Friedrich, K. A. (2013).
Characterization of electrolyte layers of plasma-sprayed metal supported solid
oxide fuel cells. Solid State Ionics, 243, 30-35.
4. Zuo, P., Fu, Z., & Yang, Z. (2013). First-principles study on the mechanism of
coking inhibition by the Ni (111) surface doped with IB-group metals at the anode
of solid oxide fuel cells. Journal of Power Sources, 242, 762-767.
5. Hwang, C. S., Tsai, C. H., Yu, J. F., Chang, C. L., Lin, J. M., Shiu, Y. H., &
Cheng, S. W. (2011). High performance metal-supported intermediate temperature
solid oxide fuel cells fabricated by atmospheric plasma spraying. Journal of Power
Sources, 196(4), 1932-1939.
6. Singhal, S. C., & Kendall, K. (Eds.). (2003). High-temperature solid oxide fuel
cells: fundamentals, design and applications: fundamentals, design and
applications. Elsevier.
7. Williams, M. C., Strakey, J., & Sudoval, W. (2006). US DOE fossil energy fuel
cells program. Journal of Power Sources, 159(2), 1241-1247.

43
8. Lee, Y. C., Hung, I. M., Chang, S. L., Ciou, C. J., & Wu, J. S. (2011). The effects
of doped Nd on conductivity and phase stability of BaCe0.8Y0.2O3−δ-based
electrolyte for solid oxide fuel cell. Journal of the European Ceramic Society,
31(16), 3137-3143.
9. Bhattacharyya, D., & Rengaswamy, R. (2009). A review of solid oxide fuel cell
(SOFC) dynamic models. Industrial & Engineering Chemistry Research, 48(13),
6068-6086.
10. Chen, H., Cong, T. N., Yang, W., Tan, C., Li, Y., & Ding, Y. (2009). Progress in
electrical energy storage system: A critical review. Progress in Natural Science,
19(3), 291-312.
11. Williams, M. C., Strakey, J. P., & Surdoval, W. A. (2005). The US department of
energy, office of fossil energy stationary fuel cell program. Journal of Power
Sources, 143(1), 191-196.
12. Steinberger-Wilckens, R. (2011). European SOFC technology-status and trends.
ECS Transactions, 35(1), 19-29.
13. Stevenson, J. W., Armstrong, T. R., Carneim, R. D., Pederson, L. R., & Weber, W.
J. (1996). Electrochemical Properties of Mixed Conducting Perovskites
La1−xMxCo1−yFeyO3−δ (M= Sr, Ba, Ca). Journal of the Electrochemical Society,
143(9), 2722-2729.
14. Sarasketa-Zabala, E., Otaegi, L., Rodriguez-Martinez, L. M., Alvarez, M. A.,
Burgos, N., Castro, F., & Villarreal, I. (2012). High temperature stability of porous
metal substrates under highly humidified hydrogen conditions for metal supported
Solid Oxide Fuel Cells. Solid State Ionics, 222, 16-22.
15. Fan, L., Zhu, B., Chen, M., Wang, C., Raza, R., Qin, H., Wang, X., & Ma, Y.
(2012). High performance transition metal oxide composite cathode for low
temperature solid oxide fuel cells. Journal of Power Sources, 203, 65-71.
16. Shao, Z., & Haile, S. M. (2004). A high-performance cathode for the next
generation of solid-oxide fuel cells. Nature, 431(7005), 170-173.
17. Park, S., Vohs, J. M., & Gorte, R. J. (2000). Direct oxidation of hydrocarbons in a
solid-oxide fuel cell. Nature, 404(6775), 265-267.

44
18. Moon, J. W., Hwang, H. J., Awano, M., & Maeda, K. (2003). Preparation of NiO–
YSZ tubular support with radially aligned pore channels. Materials letters, 57(8),
1428-1434.
19. Matsuzaki, Y., & Yasuda, I. (2001). Dependence of SOFC cathode degradation by
chromium-containing alloy on compositions of electrodes and electrolytes.
Journal of the Electrochemical Society, 148(2), A126-A131.
20. Tucker, M. C. (2010). Progress in metal-supported solid oxide fuel cells: A
review. Journal of Power Sources, 195(15), 4570-4582.
21. Kuhn, M., & Napporn, T. W. (2010). Single-chamber solid oxide fuel cell
technology from its origins to today’s state of the art. Energies, 3(1), 57-134.
22. Yano, M., Kawai, T., Okamoto, K., Nagao, M., Sano, M., Tomita, A., & Hibino,
T. (2007). Single-chamber SOFCs using dimethyl ether and ethanol. Journal of the
Electrochemical Society, 154(8), B865-B870.
23. Morel, B., Roberge, R., Savoie, S., Napporn, T. W., & Meunier, M. (2007).
Catalytic activity and performance of LSM cathode materials in single chamber
SOFC. Applied Catalysis A: General, 323, 181-187.
24. Zhu, B., Fan, L., & Lund, P. (2013). Breakthrough fuel cell technology using
ceria-based multi-functional nanocomposites. Applied Energy, 106, 163-175.
25. Liu, M., Lynch, M. E., Blinn, K., Alamgir, F. M., & Choi, Y. (2011). Rational
SOFC material design: new advances and tools. Materials today, 14(11), 534-546.
26. Wachsman, E. D., & Lee, K. T. (2011). Lowering the temperature of solid oxide
fuel cells. Science, 334(6058), 935-939.
27. Yamamoto, O. (2000). Solid oxide fuel cells: fundamental aspects and prospects.
Electrochimica Acta, 45(15), 2423-2435.
28. Steele, B. C., & Heinzel, A. (2001). Materials for fuel-cell technologies. Nature,
414(6861), 345-352.
29. Adler, S. B. (2004). Factors governing oxygen reduction in solid oxide fuel cell
cathodes. Chemical reviews, 104(10), 4791-4844.
30. Sun, C., Hui, R., & Roller, J. (2009). Cathode materials for solid oxide fuel cells: a
review. J Solid State Electrochem, 14(7), 1125-1144.
45
31. Ding, D., Li, X., Lai, S. Y., Gerdes, K., & Liu, M. (2014). Enhancing SOFC
cathode performance by surface modification through infiltration. Energy &
Environmental Science, 7(2), 552-575.
32. Palsson, J., Selimovic, A., & Sjunnesson, L. (2000). Combined solid oxide fuel
cell and gas turbine systems for efficient power and heat generation. Journal of
Power Sources, 86(1), 442-448.
33. Khandkar, A., Hartvigsen, J., & Elangovan, S. (2000). A techno-economic model
for SOFC power systems. Solid State Ionics, 135(1), 325-330.
34. Tanaka, K., Wen, C., & Yamada, K. (2000). Design and evaluation of combined
cycle system with solid oxide fuel cell and gas turbine. Fuel, 79(12), 1493-1507.
35. Riensche, E., Achenbach, E., Froning, D., Haines, M. R., Heidug, W. K., Lokurlu,
A., & Von Andrian, S. (2000). Clean combined-cycle SOFC power plant—cell
modelling and process analysis. Journal of Power Sources, 86(1), 404-410.
36. Costamagna, P., Magistri, L., & Massardo, A. F. (2001). Design and part-load
performance of a hybrid system based on a solid oxide fuel cell reactor and a
micro gas turbine. Journal of Power Sources, 96(2), 352-368.
37. Choudhury, A., Chandra, H., & Arora, A. (2013). Application of solid oxide fuel
cell technology for power generation—A review. Renewable and Sustainable
Energy Reviews, 20, 430-442.
38. Schiller, G., Ansar, A., Lang, M., & Patz, O. (2009). High temperature water
electrolysis using metal supported solid oxide electrolyser cells (SOEC). Journal
of Applied Electrochemistry, 39(2), 293-301.
39. Janssen, H., Emonts, B., Groehn, H. G., Mai, H., Reichel, R., & Stolten, D. (2001).
High-pressure electrolysis–the key technology for efficient H2 production.
Hypothesis IV, proceedings, 1, 9-14.
40. Brandon, N. P., Skinner, S., & Steele, B. C. (2003). Recent advances in materials
for fuel cells. Annual Review of Materials Research, 33(1), 183-213.
41. Jasinski, P., Suzuki, T., Petrovsky, V., & Anderson, H. U. (2005). Nanocomposite
nickel ceria cermet with low nickel content for anode-supported SOFCs.
Electrochemical and Solid-State Letters, 8(4), A219-A221.
46
42. Hao, X., Han, D., Wang, J., Liu, Y., Rooney, D., Sun, W., Qiao, J., Wang, Z., &
Sun, K. (2015). Co-tape casting fabrication, field assistant sintering and evaluation
of a coke resistant La0.2Sr0.7TiO3–Ni/YSZ functional gradient anode supported
solid oxide fuel cell. International Journal of Hydrogen Energy, 40(37), 12790-
12797.
43. Soltanzadeh, M. (2010). Modelling Triple Phase Boundary (TPB) in Solid Oxide
Fuel Cell (SOFC) Anode.
44. Frandsen, H. L., Ramos, T., Faes, A., Pihlatie, M., & Brodersen, K. (2012).
Optimization of the strength of SOFC anode supports. Journal of the European
Ceramic Society, 32(5), 1041-1052.
45. Hanna, J., Lee, W. Y., Shi, Y., & Ghoniem, A. F. (2014). Fundamentals of electro
and thermochemistry in the anode of solid-oxide fuel cells with hydrocarbon and
syngas fuels. Progress in Energy and Combustion Science, 40 74 -111.
46. Fu, Q. X., Mi, S. B., Wessel, E., & Tietz, F. (2008). Influence of sintering
conditions on microstructure and electrical conductivity of yttrium-substituted
SrTiO 3. Journal of the European Ceramic Society, 28(4), 811-820.
47. Gauckler, L. J., Beckel, D., Buergler, B. E., Jud, E., Muecke, U. P., Prestat, M.,
Rupp, M., & Richter, J. (2004). Solid oxide fuel cells: systems and materials.
CHIMIA International Journal for Chemistry, 58(12), 837-850.
48. Tao, S., & Irvine, J. T. (2004). Discovery and characterization of novel oxide
anodes for solid oxide fuel cells. The Chemical Record, 4(2), 83-95.
49. Gorte, R. J., Kim, H., & Vohs, J. M. (2002). Novel SOFC anodes for the direct
electrochemical oxidation of hydrocarbon. Journal of Power Sources, 106(1), 10-
15.
50. Timurkutluk, B., Timurkutluk, C., Mat, M. D., & Kaplan, Y. (2011).
Anode‐supported solid oxide fuel cells with ion conductor infiltration.
International Journal of Energy Research, 35(12), 1048-1055.
51. Tsipis, E. V., Kharton, V. V., Bashmakov, I. A., Naumovich, E. N., & Frade, J. R.
(2004). Cellulose-precursor synthesis of nanocrystalline Ce0.8Gd0.2O2−δ for SOFC
anodes. Journal of Solid State Electrochemistry, 8(9), 674-680.
47
52. Hari, J., & Pukanzsky, B. (2011). Nanocomposites: Preparation, structure,
properties (pp. 109-142). M. Kutz (Ed.). Elsevier Inc.: Waltham, MA, USA.
53. Sholklapper, T. Z., Kurokawa, H., Jacobson, C. P., Visco, S. J., & De Jonghe, L.
C. (2007). Nanostructured solid oxide fuel cell electrodes. Nanoletters, 7(7), 2136-
2141.
54. Ding, D., Zhu, W., Gao, J., & Xia, C. (2008). High performance electrolyte-coated
anodes for low-temperature solid oxide fuel cells: Model and Experiments.
Journal of Power Sources, 179(1), 177-185.
55. Liu, Z., Liu, B., Ding, D., Liu, M., Chen, F., & Xia, C. (2013). Fabrication and
modification of solid oxide fuel cell anodes via wet impregnation/infiltration
technique. Journal of Power Sources, 237, 243-259.
56. Brinkman, H. W., Meijerink, J., De Vries, K. J., & Burggraaf, A. J. (1996).
Kinetics and morphology of electrochemical vapour deposited thin zirconia/yttria
layers on porous substrates. Journal of the European Ceramic Society, 16(6), 587-
600.
57. Van der Haar, L. M., & Verweij, H. (2000). Homogeneous porous perovskite
supports for thin dense oxygen separation membranes. Journal of Membrane
Science, 180(1), 147-155.
58. Bouwmeester, H. J. M., & Burgraaf, A. J. Dense ceramic membranes for oxygen
separation, Burggraaf AJ, Cot L., Fundamentals of Inorganic Membrane Science
and Technology, 1996, 435-528.
59. Steele, B. C. H. (2000). Appraisal of Ce1−yGdyO2−y/2 electrolytes for IT-SOFC
operation at 500 °C. Solid State Ionics, 129(1), 95-110.
60. Young, J. L., Molero, H., & Birss, V. I. (2014). The effect of pre-oxidation
treatments on the oxidation tolerance of Ni-yttria-stabilized zirconia anodes in
solid oxide fuel cells. Journal of Power Sources, 271, 538-547.
61. Zhan, Z., & Barnett, S. A. (2006). Operation of ceria-electrolyte solid oxide fuel
cells on iso-octane–air fuel mixtures. Journal of Power Sources, 157(1), 422-429.
62. Njoku, C. B., & Ndungu, P. G. (2015). Synthesis and characterization of novel
Ce0.8Sm0.2Fe0.9Ir0.03Co0.07O3−δ perovskite material and possible application as a

48
cathode for low–intermediate temperature SOFCs. Materials Research Bulletin,
68, 100-108.
63. Njoku, C., Omondi, B. O., & Ndungu, P. (2015). Characterisation and
Electrochemical properties of Ce0.8Sr0.2Fe0.9Ir0.04Co0.06O3-δ (CSFIC) cathode
material for Application in Low Temperature SOFC. ECS Transactions, 68(1),
903-917.
64. Hibino, T., Hashimoto, A., Yano, M., Suzuki, M., & Sano, M. (2003). Ru-
catalyzed anode materials for direct hydrocarbon SOFCs. Electrochimica Acta,
48(17), 2531-2537.
65. Yang, L., Choi, Y., Qin, W., Chen, H., Blinn, K., Liu, M., Liu, P., Bai, J., Tyson,
T. A., & Liu, M. (2011). Promotion of water-mediated carbon removal by
nanostructured barium oxide/nickel interfaces in solid oxide fuel cells. Nature
Communications, 2, 357.
66. Chiba, R., Yoshimura, F., & Sakurai, Y. (2002). Properties of La1− ySryNi1−xFe xO3
as a cathode material for a low-temperature operating SOFC. Solid State Ionics,
152, 575-582.
67. Wilson, J. R., Kobsiriphat, W., Mendoza, R., Chen, H. Y., Hiller, J. M., Miller, D.
J., Thornton,K., Voorhees, P. W., Adler, B. S., & Barnett, S. A. (2006). Three-
dimensional reconstruction of a solid-oxide fuel-cell anode. Nature Materials,
5(7), 541-544.
68. Uchida, H., Suzuki, H., & Watanabe, M. (1998). High‐Performance Electrode for
Medium‐Temperature Solid Oxide Fuel Cells Effects of Composition and
Microstructures on Performance of Ceria‐Based Anodes. Journal of the
Electrochemical Society, 145(2), 615-620.
69. Marina, O. A., Bagger, C., Primdahl, S., & Mogensen, M. (1999). A solid oxide
fuel cell with a gadolinia-doped ceria anode: preparation and performance. Solid
State Ionics, 123(1), 199-208.
70. Tsipis, E. V., Kharton, V. V., Bashmakov, I. A., Naumovich, E. N., & Frade, J. R.
(2004). Cellulose-precursor synthesis of nanocrystalline Ce0.8Gd0.2O2−δ for SOFC
anodes. Journal of Solid State Electrochemistry, 8(9), 674-680.

49
71. Tsipis, E. V., Kharton, V. V., & Frade, J. R. (2005). Mixed conducting
components of solid oxide fuel cell anodes. Journal of the European Ceramic
Society, 25(12), 2623-2626.
72. Kharton, V. V., Viskup, A. P., Naumovich, E. N., & Tikhonovich, V. N. (1999).
Oxygen permeability of LaFe1−xNixO3−δ solid solutions. Materials Research
Bulletin, 34(8), 1311-1317.
73. Kharton, V. V., Viskup, A. P., Figueiredo, F. M., Naumovich, E. N., Shaulo, A. L.,
& Marques, F. M. B. (2002). Electrochemical properties of Pr-doped Ce(Gd)O2−δ.
Materials Letters, 53(3), 160-164.
74. Park, S., Vohs, J. M., & Gorte, R. J. (2000). Direct oxidation of hydrocarbons in a
solid-oxide fuel cell. Nature, 404(6775), 265-267.
75. He, S., Li, R., Ge, L., Chen, H., & Guo, L. (2013). Preparation and
characterization of Cu–SDC anodes for low-temperature solid oxide fuel cell.
Journal of Alloys and Compounds, 576, 242-246.
76. Zha, S., Moore, A., Abernathy, H., & Liu, M. (2004). GDC-based low-temperature
SOFCs powered by hydrocarbon fuels. Journal of the Electrochemical Society,
151(8), A1128-A1133.
77. Ma, Y., Wang, X., Li, S., Toprak, M. S., Zhu, B., & Muhammed, M. (2010).
Samarium‐Doped Ceria Nanowires: Novel Synthesis and Application in
Low‐Temperature Solid Oxide Fuel Cells. Advanced Materials, 22(14), 1640-
1644.
78. Skarmoutsos, D., Tsoga, A., Naoumidis, A., & Nikolopoulos, P. (2000). 5 mol %
TiO2-doped Ni–YSZ anode cermets for solid oxide fuel cells. Solid State Ionics,
135(1), 439-444.
79. Tietz, F. (1999). Thermal expansion of SOFC materials. Ionics, 5(1-2), 129-139.
80. Postole, G., Girona, K., Toyir, J., Kaddouri, A., & Gélin, P. (2012). Catalytic
Steam Methane Reforming Over Ir/Ce0.9Gd0.1O2–x: Resistance to Coke Formation
and Sulfur Poisoning. Fuel Cells, 12(2), 275-287.

50
81. Kharton, V. V., Naumovich, E. N., Tikhonovich, V. N., Bashmakov, I. A.,
Boginsky, L. S., & Kovalevsky, A. V. (1999). Testing tubular solid oxide fuel
cells in nonsteady-state conditions. Journal of Power Sources, 79(2), 242-249.
82. Gorte, R. J., Park, S., Vohs, J. M., & Wang, C. (2000). Anodes for direct oxidation
of dry hydrocarbons in a solid‐oxide fuel cell. Advanced Materials, 12(19), 1465-
1469.
83. Vernoux, P. (1997). Lanthanum chromite as an anode material for solid oxide fuel
cells. Ionics, 3(3-4), 270-276.
84. Tu, H. Y., Takeda, Y., Imanishi, N., & Yamamoto, O. (1999). Ln0.4Sr0.6Co0.8Fe0.2
O3−δ (Ln = La, Pr, Nd, Sm, Gd) for the electrode in solid oxide fuel cells. Solid
State Ionics, 117(3), 277-281.
85. Bronin, D. I., Kuzin, B. L., Yaroslavtsev, I. Y., & Bogdanovich, N. M. (2006).
Behavior of manganite electrodes in contact with LSGM electrolyte: the nature of
low electrochemical activity. Journal of Solid State Electrochemistry, 10(8), 651-
658.
86. Hussain, A. M., Høgh, J. V., Jacobsen, T., & Bonanos, N. (2012). Nickel-ceria
infiltrated Nb-doped SrTiO3 for low temperature SOFC anodes and analysis on gas
diffusion impedance. International Journal of Hydrogen Energy, 37(5), 4309-
4318.
87. Wendy, L., (2009). Mechanical properties of Sc0.1Ce0.01Zr0.89O2 electrolyte
material for intermediate temperature solid oxide fuel cells. Master's thesis, Texas
A&M University.
88. Butz, B., Kruse, P., Störmer, H., Gerthsen, D., Müller, A., Weber, A., & Ivers-
Tiffée, E. (2006). Correlation between microstructure and degradation in
conductivity for cubic Y2O3-doped ZrO2. Solid State Ionics, 177(37), 3275-3284.
89. Zhang, S. L., Li, C. X., Li, C. J., Yang, G. J., & Han, Z. H. (2013). Scandia-
stabilized zirconia electrolyte with improved interlamellar bonding by high-
velocity plasma spraying for high performance solid oxide fuel cells. Journal of
Power Sources, 232, 123-131.

51
90. Wang, X., Ma, Y., Li, S., Kashyout, A. H., Zhu, B., & Muhammed, M. (2011).
Ceria-based nanocomposite with simultaneous proton and oxygen ion conductivity
for low-temperature solid oxide fuel cells. Journal of Power Sources, 196(5),
2754-2758.
91. Fergus, J. W. (2006). Electrolytes for solid oxide fuel cells. Journal of Power
Sources, 162(1), 30-40.
92. Wang, S. F., Yeh, C. T., Wang, Y. R., & Wu, Y. C. (2013). Characterization of
samarium-doped ceria powders prepared by hydrothermal synthesis for use in
solid state oxide fuel cells. Journal of Materials Research and Technology, 2(2),
141-148.
93. Xu, D., Liu, X., Wang, D., Yi, G., Gao, Y., Zhang, D., & Su, W. (2007).
Fabrication and characterization of SDC–LSGM composite electrolytes material in
IT-SOFCs. Journal of Alloys and Compounds, 429(1), 292-295.
94. Singhal, S. C., & Kendall, K. (Eds.). (2003). High-temperature solid oxide fuel
cells: fundamentals, design and applications: fundamentals, design and applica-
tions. Elsevier.
95. Rambabu, B., Ghosh, S., & Jena, H. (2006). Novel wet-chemical synthesis and
characterization of nanocrystalline CeO2 and Ce0.8Gd0.2O1.9 as solid electrolyte for
intermediate temperature solid oxide fuel cell (IT-SOFC) applications. Journal of
Materials Science, 41(22), 7530-7536.
96. Schober, T., & Ringel, H. (2004). Proton conducting ceramics: recent advances.
Ionics, 10(5-6), 391-395.
97. Schober, T. (2005). Composites of ceramic high-temperature proton conductors
with inorganic compounds. Electrochemical and Solid-State Letters, 8(4), A199-
A200.
98. Uvarov, N. F., Ponomareva, V. G., & Lavrova, G. V. (2010). Composite solid
electrolytes. Russian Journal of Electrochemistry, 46(7), 722-733.
99. Murtanto, T. B., Natori, S., Nakamura, J., & Natori, A. (2006). Ac conductivity
and dielectric constant of conductor-insulator composites. Physical Review B,
74(11), 115-206.

52
100. Bhattacharyya, A. J., & Maier, J. (2004). Second Phase Effects on the
Conductivity of Non‐Aqueous Salt Solutions: “Soggy Sand Electrolytes”.
Advanced Materials, 16(9‐10), 811-814.
101. Brett, D. J., Atkinson, A., Brandon, N. P., & Skinner, S. J. (2008). Intermediate
temperature solid oxide fuel cells. Chemical Society Reviews, 37(8), 1568-1578.
102. Ma, Y., Wang, X., Khalifa, H. A., Zhu, B., & Muhammed, M. (2012). Enhanced
ionic conductivity in calcium doped ceria–carbonate electrolyte: a composite
effect. International Journal of Hydrogen Energy, 37(24), 19401-19406.
103. Wang, X., Ma, Y., Li, S., Zhu, B., & Muhammed, M. (2012). SDC/Na2CO3
nanocomposite: new freeze drying based synthesis and application as electrolyte in
low-temperature solid oxide fuel cells. International Journal of Hydrogen Energy,
37(24), 19380-19387.
104. Guo, M., Lu, J., Bi, Q., & Luo, M. (2010). Effect of Optical Absorbance on the
Raman Spectra of Ce0.9Tb0.1O2−δ Solid Solution. ChemPhysChem, 11(8), 1693-
1699.
105. Zając, W., Świerczek, K., & Molenda, J. (2007). Thermochemical compatibility
between selected (La, Sr)(Co, Fe, Ni)O3 cathodes and rare earth doped ceria
electrolytes. Journal of Power Sources, 173(2), 675-680.
106. Jing, Y., Ma, Y., Patakangas, J., Zhu, B., Johnsson, M., Cura, M. E., & Lund, P.
(2014). Enhanced conductivity of SDC based nanocomposite electrolyte by spark
plasma sintering. International Journal of Hydrogen Energy, 39(26), 14391-
14396.
107. Raza, R., Ma, Y., Wang, X., Liu, X., & Zhu, B. (2010). Study on nanocomposites
based on carbonate @ ceria. Journal of Nanoscience and Nanotechnology, 10(2),
1203-1207.
108. Lessing, P. A. (2007). A review of sealing technologies applicable to solid oxide
electrolysis cells. Journal of Materials Science, 42(10), 3465-3476.
109. Zhu, B., & Mat, M. D. (2006). Studies on dual phase ceria-based composites in
electrochemistry. International Journal of Electrochemical Sciences, 1(8), 383-
402.

53
110. Rajesh, S., Macedo, D. A., & Nascimento, M. (2013). Composite Electrolytes and
electrodes for Intermediate Temperature Hybrid Fuel Cells.
111. Wang, X., Ma, Y., Li, S., Zhu, B., & Muhammed, M. (2012). SDC/Na2CO3
nanocomposite: new freeze drying based synthesis and application as electrolyte in
low-temperature solid oxide fuel cells. International Journal of Hydrogen Energy,
37(24), 19380-19387.
112. Yin, S., Zeng, Y., Li, C., Chen, X., & Ye, Z. (2013). Investigation of Sm0.2Ce0.8
O1.9/Na2CO3 Nanocomposite electrolytes: Preparation, Interfacial Micro structures,
and Ionic Conductivities. ACS Applied Materials & Interfaces, 5(24), 12876 -
12886.
113. Yokokawa, H., Sakai, N., Horita, T., Yamaji, K., Brito, M. E., & Kishimoto, H.
(2008). Thermodynamic and kinetic considerations on degradations in solid oxide
fuel cell cathodes. Journal of Alloys and Compounds, 452(1), 41-47.
114. Huang, J., Yang, L., Gao, R., Mao, Z., & Wang, C. (2006). A high-performance
ceramic fuel cell with samarium doped ceria–carbonate composite electrolyte at
low temperatures. Electrochemistry Communications, 8(5), 785-789.
115. Zhu, B. (2011). Nanocomposites for advanced fuel cell technology. Journal of
Nanoscience and Nanotechnology, 11(10), 8873-8879.
116. Huang, J., Mao, Z., Liu, Z., & Wang, C. (2007). Development of novel low-
temperature SOFCs with co-ionic conducting SDC-carbonate composite
electrolytes. Electrochemistry Communications, 9(10), 2601-2605.
117. Maguire, E., Gharbage, B., Marques, F. M. B., & Labrincha, J. A. (2000). Cathode
materials for intermediate temperature SOFCs. Solid State Ionics, 127(3), 329-335.
118. Gorte, R. J. (2005). Recent developments towards commercialization of solid
oxide fuel cells. AIChE Journal, 51(9), 2377-2381.
119. Yamamoto, O. (2000). Solid oxide fuel cells: fundamental aspects and prospects.
Electrochimica Acta, 45(15), 2423-2435.
120. Zhao, H., Huo, L., & Gao, S. (2004). Electrochemical properties of LSM–CBO
composite cathode. Journal of Power Sources, 125(2), 149-154.
54
121. Goodenough, J. B., & Cooper, S. L. (2001). Localized to itinerant electronic
transition in perovskite oxides (Vol. 98). Springer Science & Business Media.
122. Fruth, V., Popa, M., Calderon-Moreno, J., Tenea, E., Anastasescu, M., Osiceanu,
P., Anghel, E., Predoana, L., Malic, B., & Zaharescu, M. (2010). Perovskite type
nanopowders and thin films obtained by chemical methods. Processing and
Application of Ceramics, 4(3), 167-182.
123. Kharton, V. V., Shaula, A. L., Naumovich, E. N., Vyshatko, N. P., Marozau, I. P.,
Viskup, A. P., & Marques, F. M. B. (2003). Ionic Transport in Gd3Fe5O12-and Y3
Fe5O12-Based Garnets. Journal of the Electrochemical Society, 150(7), J33-J42.
124. Patrakeev, M. V., Leonidov, I. A., Kozhevnikov, V. L., & Kharton, V. V. (2004).
Ion–electron transport in strontium ferrites: relationships with structural features
and stability. Solid State Sciences, 6(9), 907-913.
125. Kharton, V. V., Kovalevsky, A. V., Avdeev, M., Tsipis, E. V., Patrakeev, M. V.,
Yaremchenko, A. A., Naumovich, E. N., & Frade, J. R. (2007). Chemically
induced expansion of La2NiO4+ δ-based materials. Chemistry of Materials, 19(8),
2027-2033.
126. Marrocchelli, D., Chatzichristodoulou, C., & Bishop, S. R. (2014). Defining
chemical expansion: the choice of units for the stoichiometric expansion
coefficient. Physical Chemistry Chemical Physics, 16(20), 9229-9232.
127. Tsipis, E. V., & Kharton, V. V. (2008). Electrode materials and reaction
mechanisms in solid oxide fuel cells: a brief review. Journal of Solid State
Electrochemistry, 12(11), 1367-1391.
128. Kindermann, L., Das, D., Nickel, H., Hilpert, K., Appel, C. C., & Poulson, F. W.
(1997). Chemical Compatibility of (La0.6Ca0.4)xFe0.8M0.2O3 with Yttria‐Stabilized
Zirconia. Journal of the Electrochemical Society, 144(2), 717-720.
129. Philippeau, B., Mauvy, F., Nicollet, C., Fourcade, S., & Grenier, J. C. (2015).
Oxygen reduction reaction in Pr2NiO4+δ/Ce0.9Gd0.1O1.95 and La0.6Sr0.4Co0.2Fe0.8
O3−δ/La0.8Sr0.2Ga0.8Mg0.2O2.80 half cells: an electrochemical study. Journal of Solid
State Electrochemistry, 19(3), 871-882.
55
130. Riza, F., Ftikos, C., Tietz, F., & Fischer, W. (2001). Preparation and
characterization of Ln0.8Sr0.2Fe0.8Co0.2O3−x (Ln= La, Pr, Nd, Sm, Eu, Gd). Journal
of the European Ceramic Society, 21(10), 1769-1773.
131. Marinha, D., Dessemond, L., Cronin, J. S., Wilson, J. R., Barnett, S. A., &
Djurado, E. (2011). Microstructural 3D reconstruction and performance evaluation
of LSCF cathodes obtained by electrostatic spray deposition. Chemistry of
Materials, 23(24), 5340-5348.
132. Ried, P. (2009). Development of Solid Oxide Fuel Cell cathodes for operation at
600° C.
133. Yin, J. W., Yin, Y. M., Lu, J., Zhang, C., Minh, N. Q., & Ma, Z. F. (2014).
Structure and Properties of Novel Cobalt-Free Oxides NdxSr1–xFe0.8Cu0.2O3−δ (0.3
≤ x ≤ 0.7) as Cathodes of Intermediate Temperature Solid Oxide Fuel Cells. The
Journal of Physical Chemistry C, 118(25), 13357-13368.
134. Jiang, S. P. (2002). A comparison of O 2 reduction reactions on porous (La, Sr)
MnO3 and (La, Sr)(Co, Fe)O3 electrodes. Solid State Ionics, 146(1), 1-22.
135. Al Daroukh, M., Vashook, V. V., Ullmann, H., Tietz, F., & Raj, I. A. (2003).
Oxides of the AMO3 and A2MO4-type: structural stability, electrical conductivity
and thermal expansion. Solid State Ionics, 158(1), 141-150.
136. Kharton, V. V., Tsipis, E. V., Yaremchenko, A. A., Marozau, I. P., Viskup, A. P.,
Frade, J. R., & Naumovich, E. N. (2006). Oxygen permeability, electronic
conductivity and stability of La0.3Sr0.7CoO3-based perovskites. Materials Science
and Engineering: B, 134(1), 80-88.
137. Kostogloudis, G. C., Ftikos, C., Ahmad-Khanlou, A., Naoumidis, A., & Stöver, D.
(2000). Chemical compatibility of alternative perovskite oxide SOFC cathodes
with doped lanthanum gallate solid electrolyte. Solid State Ionics, 134(1), 127-138.
138. Tsipis, E. V., Kharton, V. V., & Frade, J. R. (2006). Transport properties and
electrochemical activity of YBa (Co, Fe)4O7 cathodes. Solid State Ionics, 177(19),
1823-1826.
139. Barilo, S. N., Shiryaev, S. V., Bychkov, G. L., Shestak, A. S., Zhou, Z. X.,
Hinkov, V., Plakhty, V. P., Chernenkov, P. Y., Gavrilov, S. V., Baran, M.,
56
Szymczak, R., Sheptyakov, R., & Szymczak, H. (2006). Crystal growth and giant
magnetoresistance of rare earth layered cobaltites. Rev. Adv. Mater. Sci, 12, 33-45.
140. Raveau, B., & Seikh, M. (2012). Cobalt oxides: from crystal chemistry to physics.
John Wiley & Sons.
141. Morin, F., Trudel, G., & Denos, Y. (1997). The phase stability of La0.5Sr0.5CoO3−δ.
Solid State Ionics, 96(3), 129-139.
142. Tsipis, E. V., & Kharton, V. V. (2008). Electrode materials and reaction
mechanisms in solid oxide fuel cells: a brief review. Journal of Solid State
Electrochemistry, 12(11), 1367-1391.
143. Baumann, F. S., Fleig, J., Cristiani, G., Stuhlhofer, B., Habermeier, H. U., &
Maier, J. (2007). Quantitative comparison of mixed conducting SOFC cathode
materials by means of thin film model electrodes. Journal of the Electrochemical
Society, 154(9), B931-B941.
144. Peña-Martínez, J., Marrero-López, D., Pérez-Coll, D., Ruiz-Morales, J. C., &
Núñez, P. (2007). Performance of XSCoF (X= Ba, La and Sm) and LSCrX′ (X′=
Mn, Fe and Al) perovskite-structure materials on LSGM electrolyte for IT-SOFC.
Electrochimica acta, 52(9), 2950-2958.
145. Wan, J. H., Yan, J. Q., & Goodenough, J. B. (2005). LSGM-based solid oxide fuel
cell with 1.4 W/cm2 power density and 30 day long-term stability. Journal of the
Electrochemical Society, 152(8), A1511-A1515.
146. Uchida, H., Arisaka, S. I., & Watanabe, M. (2002). High Performance Electrode
for Medium-Temperature Solid Oxide Fuel Cells: Control of Microstructure of La
(Sr)CoO3 Cathodes with Highly Dispersed Pt Electrocatalysts. Journal of the
Electrochemical Society, 149(1), A13-A18.
147. Simner, S. P., Shelton, J. P., Anderson, M. D., & Stevenson, J. W. (2003).
Interaction between La(Sr)FeO3 SOFC cathode and YSZ electrolyte. Solid State
Ionics, 161(1), 11-18.
148. Chen, Z., Ran, R., Zhou, W., Shao, Z., & Liu, S. (2007). Assessment of
Ba0.5Sr0.5Co1−y FeyO3−δ (y = 0.0 – 1.0) for prospective application as cathode for

57
IT-SOFCs or oxygen permeating membrane. Electrochimica Acta, 52(25), 7343-
7351.
149. Bronin, D. I., Kuzin, B. L., Sokolova, Y. V., & Polyakova, N. V. (2000). Reaction
of Cobalt-containing Materials with Solid Electrolyte Based on Lanthanum
Gallate. Russian journal of applied chemistry of zhurnal prikladnoi khimii, 73(9),
1557-1560.
150. Kuzin, B. L., Bogdanovich, N. M., Bronin, D. I., Yaroslavtsev, I. Y., Vdovin, G.
K., Kotov, Y. A., Bagazeev, A. I.,Medvedev, A. I., Murzakaev, A. M.,
Timoshenkova, O. P., & Stol’Ts, A. K. (2007). Electrochemical properties of
cathodes made of (La, Sr)(Fe, Co)O3 containing admixtures of nanoparticles of
cupric oxide and intended for fuel cells with a solid electrolyte based on ceric
oxide. Russian Journal of Electrochemistry, 43(8), 920-928.
151. Zhou, W., Shao, Z., Ran, R., Chen, Z., Zeng, P., Gu, H., Jin, W., & Xu, N. (2007).
High performance electrode for electrochemical oxygen generator cell based on
solid electrolyte ion transport membrane. Electrochimica Acta, 52(22), 6297-6303.
152. Zhu, X. D., Sun, K. N., Zhang, N. Q., Chen, X. B., Wu, L. J., & Jia, D. C. (2007).
Improved electrochemical performance of SrCo0.8Fe0.2O3−δ – La0.45Ce0.55O2−δ
composite cathodes for IT-SOFC. Electrochemistry Communications, 9(3), 431-
435.
153. Serra, J. M., Vert, V. B., Betz, M., Haanappel, V. A. C., Meulenberg, W. A., &
Tietz, F. (2008).Screening of A-Substitution in the System A0.68Sr0.3Fe0. 8Co0.2O3−δ
for SOFC Cathodes. Journal of the Electrochemical Society, 155(2), B207-B214.
154. Ishihara, T., Honda, M., Shibayama, T., Furutani, H., & Takita, Y. (1998). An
intermediate temperature solid oxide fuel cell utilizing superior oxide ion
conducting electrolyte, doubly doped LaGaO3 perovskite. Ionics, 4(5-6), 395-402.
155. Ishihara, T., Kilner, J. A., Honda, M., & Takita, Y. (1997). Oxygen surface
exchange and diffusion in the new perovskite oxide ion conductor LaGaO3.
Journal of the American Chemical Society, 119(11), 2747-2748.

58
156. Lee, H. Y., Jang, J. H., & Oh, S. M. (1999). Cathodic Activity and Interfacial
Stability of Y0.8Ca0.2Co1−xFexO3/YSZ Electrodes for Solid Oxide Fuel Cells.
Journal of the Electrochemical Society, 146(5), 1707-1711.
157. Steele, B. C. H. (1995). Interfacial reactions associated with ceramic ion transport
membranes. Solid State Ionics, 75, 157-165.
158. Fleig, J. (2002). On the width of the electrochemically active region in mixed
conducting solid oxide fuel cell cathodes. Journal of Power Sources, 105(2), 228-
238.
159. Ishihara, T., Fukui, S., Nishiguchi, H., & Takita, Y. (2002). Mixed electronic-
oxide ionic conductor of BaCoO3 doped with La for cathode of intermediate-
temperature-operating solid oxide fuel cell. Solid State Ionics, 152, 609-613.
160. Kimura, T., & Goto, T. (2005). Ir –YSZ nano-composite electrodes for oxygen
sensors. Surface and Coatings Technology, 198(1), 36-39.
161. Musić, S., Popović, S., Maljković, M., Skoko, Z., Furić, K., & Gajović, A. (2003).
Thermochemical formation of IrO2 and Ir. Materials letters, 57(29), 4509-4514.
162. Nakamura, T., Petzow, G., & Gauckler, L. J. (1979). Stability of the perovskite
phase LaBO3 (B = V, Cr, Mn, Fe, Co, Ni) in reducing atmosphere I. Experimental
results. Materials Research Bulletin, 14(5), 649-659.
163. Ai, N., Chen, K., & Jiang, S. P. (2013). A fundamental study of infiltrated CeO2
and (Gd,Ce)O2 nanoparticles on the electrocatalytic activity of Pt cathodes of solid
oxide fuel cells. Solid State Ionics, 233, 87-94.
164. Haanappel, V. A. C., Rutenbeck, D., Mai, A., Uhlenbruck, S., Sebold, D.,
Wesemeyer, H., Rowekamp, B., & Tietz, F. (2004). The influence of noble-metal-
containing cathodes on the electrochemical performance of anode-supported
SOFCs. Journal of Power Sources, 130(1), 119-128.
165. Erning, J. W., Hauber, T., Stimming, U., & Wippermann, K. (1996). Catalysis of
the electrochemical processes on solid oxide fuel cell cathodes. Journal of Power
Sources, 61(1), 205-211.

59
166. Babaei, A., Zhang, L., Liu, E., & Jiang, S. P. (2011). Performance and stability of
La0.8Sr0.2MnO3 cathode promoted with palladium based catalysts in solid oxide
fuel cells. Journal of Alloys and Compounds, 509(14), 4781- 4787.
167. Liu, B., Gu, Y., Kong, L., & Zhang, Y. (2008). Evaluation of nano-structured Ir0.5
Mn0.5O2 as a potential cathode for intermediate temperature solid oxide fuel cell.
Journal of Power Sources, 185(2), 946-951.
168. Wang, S., Kato, T., Nagata, S., Honda, T., Kaneko, T., Iwashita, N., & Dokiya, M.
(2002). Performance of a La0.6Sr0.4Co0.8Fe0.2O3 – Ce0.8Gd0.2O1.9–Ag Cathode for
Ceria Electrolyte SOFCs. Solid State Ionics, 146(3), 203-210.
169. Torres-Huerta, A. M., Vargas-García, J. R., & Domínguez-Crespo, M. A. (2007).
Preparation and characterization of IrO2 –YSZ nanocomposite electrodes by
MOCVD. Solid State Ionics, 178(29), 1608-1616.
170. Fan, L., Chen, M., Wang, C., & Zhu, B. (2012). Pr2NiO4 – Ag composite cathode
for low temperature solid oxide fuel cells with ceria-carbonate composite
electrolyte. International Journal of Hydrogen Energy, 37(24), 19388-19394.
171. Huang, J., Gao, R., Mao, Z., & Feng, J. (2010). Investigation of La2NiO4+ δ-based
cathodes for SDC–carbonate composite electrolyte intermediate temperature fuel
cells. International Journal of Hydrogen Energy, 35(7), 2657-2662.
172. Gao, Z., Mao, Z., Wang, C., & Liu, Z. (2010). Preparation and characterization of
La1−xSrxNiyFe1−yO3−δ cathodes for low-temperature solid oxide fuel cells.
International Journal of Hydrogen Energy, 35(23), 12905-12910.
173. Qin, H., Zhu, B., Raza, R., Singh, M., Fan, L., & Lund, P. (2012). Integration
design of membrane electrode assemblies in low temperature solid oxide fuel cell.
International Journal of Hydrogen Energy, 37(24), 19365-19370.
174. Zhao, Y., He, J., Fan, L., Ran, W., Zhang, C., Gao, D., Wang, C., & Gao, F.
(2013). Synthesis and characterization of hierarchical porous LiNiCuZn-oxides as
potential electrode materials for low temperature solid oxide fuel cells.
International Journal of Hydrogen Energy, 38(36), 16558-16562.
175. Tan, W., Fan, L., Raza, R., Khan, M. A., & Zhu, B. (2013). Studies of modified
lithiated NiO cathode for low temperature solid oxide fuel cell with ceria-

60
carbonate composite electrolyte. International Journal of Hydrogen Energy, 38(1),
370-376.
176. Ahmad, S., Bakar, M. S. A., Rahman, H. A., & Muchtar, A. (2014). Brief Review:
Electrochemical Performance of LSCF Composite Cathodes--Influence of Ceria-
Electrolyte and Metals Element. Applied Mechanics & Materials, (695).
177. Kharton, V. V., Nikolaev, A. V., Naumovich, E. N., & Vecher, A. A. (1995).
Oxygen ion transport and electrode properties of La(Sr)MnO3. Solid State Ionics,
81(3), 201-209.
178. Kharton, V. V., Yaremchenko, A. A., & Naumovich, E. N. (1999). Research on
the electrochemistry of oxygen ion conductors in the former Soviet Union. II.
Perovskite-related oxides. Journal of Solid State Electrochemistry, 3(6), 303-326.
179. Plumejeau, S., Alauzun, J. G., & Boury, B. (2015). Hybrid metal oxide@
biopolymer materials precursors of metal oxides and metal oxide-carbon
composites. Journal of the Ceramic Society of Japan, 123(1441), 695-708.
180. Cheng, J., Navrotsky, A., Zhou, X. D., & Anderson, H. U. (2005). Enthalpies of
Formation of LaMO3 Perovskites (M = Cr, Fe, Co, and Ni). Journal of Materials
Research, 20(01), 191-200.
181. Milewski, J., & Miller, A. (2006). Influences of the type and thickness of
electrolyte on solid oxide fuel cell hybrid system performance. Journal of Fuel
Cell Science and Technology, 3(4), 396-402.
182. Huo, H. B., Zhu, X. J., & Cao, G. Y. (2006). Nonlinear modelling of a SOFC stack
based on a least squares support vector machine. Journal of Power Sources,
162(2), 1220-1225.
183. Santarelli, M., Leone, P., Calì, M., & Orsello, G. (2007). Experimental evaluation
of the sensitivity to fuel utilization and air management on a 100kW SOFC
system. Journal of Power Sources, 171(1), 155-168.
184. De Groot A., Advanced exergy analysis of high temperature fuel cell systems.
PhD Thesis, Energy Research Centre of the Netherlands, Petten; 2004.

61
185. Yu, H., Ouyang, S., Yan, S., Li, Z., Yu, T., & Zou, Z. (2011). Sol–gel
hydrothermal synthesis of visible-light-driven Cr-doped SrTiO3 for efficient
hydrogen production. Journal of Materials Chemistry, 21(30), 11347-11351.
186. Amar, I. A., Lan, R., & Tao, S. (2015). Synthesis of ammonia directly from wet
nitrogen using a redox stable La0.75Sr0.25Cr0.5Fe0.5O3−δ – Ce0.8Gd0.18Ca0.02O2−δ
composite cathode. RSC Advances, 5(49), 38977-38983.
187. Ghosh, S., & Dasgupta, S. (2010). Synthesis, characterization and properties of
nanocrystalline perovskite cathode materials. Mater. Sci.-Poland, 28(2), 427-438.
188. Shimizu, Y., & Murata, T. (1997). Sol–Gel Synthesis of Perovskite‐Type
Lanthanum Manganite Thin Films and Fine Powders Using Metal Acetylacetonate
and Poly (vinyl alcohol). Journal of the American Ceramic Society, 80(10), 2702-
2704.
189. Ahmad, A. L., Idrus, N. F., & Othman, M. R. (2005). Preparation of perovskite
alumina ceramic membrane using sol–gel method. Journal of Membrane Science,
262(1), 129-137.
190. Virkar, A. V., Chen, J., Tanner, C. W., & Kim, J. W. (2000). The role of electrode
microstructure on activation and concentration polarizations in solid oxide fuel
cells. Solid State Ionics, 131(1), 189-198.
191. Murray, E. P., Sever, M. J., & Barnett, S. A. (2002). Electrochemical performance
of (La, Sr)(Co, Fe)O3 – (Ce, Gd)O3 composite cathodes. Solid State Ionics, 148(1),
27-34.
192. Keller, A. A., Wang, H., Zhou, D., Lenihan, H. S., Cherr, G., Cardinale, B. J.,
Miller, R., & Ji, Z. (2010). Stability and aggregation of metal oxide nanoparticles
in natural aqueous matrices. Environmental Science & Technology, 44(6), 1962-
1967.
193. Lowe, A. B., Sumerlin, B. S., Donovan, M. S., & McCormick, C. L. (2002). Facile
preparation of transition metal nanoparticles stabilized by well-defined (co)
polymers synthesized via aqueous reversible addition-fragmentation chain transfer
polymerization. Journal of the American Chemical Society, 124(39), 11562-11563.
62
194. Xuan, W., Zhu, C., Liu, Y., & Cui, Y. (2012). Mesoporous metal–organic
framework materials. Chemical Society Reviews, 41(5), 1677-1695.
195. Chen, D., Cao, L., Huang, F., Imperia, P., Cheng, Y. B., & Caruso, R. A. (2010).
Synthesis of monodisperse mesoporous titania beads with controllable diameter,
high surface areas, and variable pore diameters (14−23 nm). Journal of the
American Chemical Society, 132(12), 4438-4444.
196. Frenzer, G., & Maier, W. F. (2006). Amorphous porous mixed oxides: Sol-gel
ways to a highly versatile class of materials and catalysts. Annu. Rev. Mater. Res.,
36, 281-331.

63
CHAPTER 3
Effect of non-ionic, anionic and cationic surfactantson the Sol gel
synthesis of IrO/Ce0.8Sm0.2O2-δ nanocomposite for SOFC application
Summary
This chapter has been published in the Journal of Fuel Cell Science & Technology and has
been structured according to the journal’s format. This chapter has also been reformatted to
incorporate further comments and corrections by the examiners.
Abstract
The sol-gel technique is a versatile and relatively simple method easily adapted to
synthesize complex metal oxide formulations. The sol-gel technique takes advantage of the
structural directing properties and templating characteristics of non-ionic, anionic and
cationic surfactant to produce porous Iridium oxide, with samarium doped ceria (SDC)
nanoparticles. The nanopowders were calcined at a temperature of 950 °C, and the
crystalline nanostructures and compositions were characterized by high resolution
transmission electron microscopy and X-ray diffraction. Textural characteristics and
particle morphology were respectively characterized by Nitrogen sorption at 77.5 K and
scanning electron microscopy. The electrochemical properties were characterised by using
a Kittec Squadro muffle furnace and SOFC testing equipment, with air and hydrogen as the
gases used. The nature of the surfactant influenced particle morphology, pore diameter,
pore size, crystallite size, surface area and electrochemical properties.
Keywords: Surfactant, Sol-gel technique, Nanoparticles, YSZ electrolyte, Samaria doped
ceria, Iridium oxide, Electrochemical properties, Solid Oxide fuel cell, Anode and
Perovskite.
64
1.0 Introduction
Sol-gel synthesis is a promising method toproduce oxide ceramic materials [1] with
controlled structure and composition for many applications [2, 3]. This method is simple
cost-effective, high yielding final product and has a low reaction temperature [3, 4]. It is an
efficient way to prepare samarium doped ceria nanoparticles with Iridium oxide [5],
because it synthesizes monodispersed particles, with controllable sizes in the nanometer
scale. This method also regulates particle interactions at certain stages of material
formation, and is necessary for the perfect structure of material [6].
The surfactant-assisted technique is thus suitable to provide materials with appropriate pore
diameter, high surface areas and a better access to active sites [7 - 9]. The properties of
surfactants influences particle morphology and no simple selection rule can be applied to
predict which surfactant will give a particular particle size. Their structures, stabilization of
the micelle walls and reduced inter-droplet exchange, produces smaller particles, crystals
and prevents metallic nanoparticles aggregation into matrices [10].
The surfactants used in these methods are Pluronic P123 block copolymer, Pluronic F-127
block copolymer [11 - 14], Sodium dodecyl sulfate (SDS), Cetyltrimethyl ammonium
bromide (CTAB) and Polyethylene glycol (PEG). The materials formed were used in low
temperature solid oxide fuel cells application.
2.0 Materials and Method
Cerium (III) acetylacetonate hydrate (Ce(acac)3) 99.9 % purity and Samarium (III)
acetylacetonate hydrate (Sm(acac)2) 99.9 % purity, were purchased from Aldrich
Chemicals USA. Surfactants, Pluronic F-127 powder (bio reagent, suitable for cell culture),
PEG, Pluronic P123, SDS and CTAB were purchased from Sigma Life Science Germany.
Iridium (III) acetylacetonate (Ir(acac)3) was purchased from Industrial Analytical
Chemicals pty South Africa. These chemical reagents were used as acquired from their
commercial sources without further purification.

65
2.1 IrO/Ce0.8Sm0.2O2-δ Preparation
The materials and mass used are 0.724 g of Ce(acac)3, 0.200 g of Sm(acac)2, 0.021 g of Ir
(acac)3 and 5 wt % (2.5 g) of surfactants. These were added to 40 ml of ethanol and 10 ml
of deionized water as solvents, the mixture was sonicated for 30 mins. This was then stirred
on a hot plate for 30 mins at a temperature of 80 °C, to form a sol. The hydrolysis,
condensation, solvent evaporation occurred rapidly and a collapse of the gel network
followed. The sol was dried in an oven for 18 hrs and calcined in a Kittec Squadro muffle
Furnace for 4 hrs at 950 °C. This method was applied to all the materials made with each
surfactant.
2.2 IrO/Ce0.8Sm0.2O2-δ without surfactant
The materials and mass used are 0.7240 g of Ce (acac)3, 0.200 g of Sm (acac)2 and 0.0218 g
of Ir (acac)3. These were added to 40 ml of ethanol and 10 ml of deionized water as solvents
and the mixture was sonicated for 30 mins. The mixture was stirred on a hot plate for 2 hrs
at a temperature of 80 °C. The hydrolysis, condensation and solvent evaporation was
sluggish. The sample was dried in an oven for 18 hrs and then was calcined in a kittec
squadro muffle furnace for 4 hrs at 950 °C. The summary and synthesis processes are
shown in Table 1 below.
Table 1: The summary and processes used for synthesis conditions.
Sample ID Mass of sample
(5wt %)
Surfactant
Name
Type
F-127 2.5g Pluronic F-127 Non-IONIC
P123 2.5g Pluronic P123 Non-IONIC
PEG 2.5g PolyethyleneGlycol Non-IONIC
SDS 2.5g SodiumDodecylSulphate ANIONIC
CTAB 2.5g CetylTriammoniumBromide CATIONIC
WS Not added No Surfactant −

66
2.3 Characterization
The crystal structure, crystal size, lattice spacing and the phase present in the powder were
analyzed with X-ray Diffraction (XRD). This instrument (Phillips PW3710) works with
voltage and current settings of 30 kV and 35 mA respectively and uses Cu-Kα radiation
(1.5406 ) for qualitative analysis, the XRD diffractogram were recorded between the
intervals of 5 at a scan speed of 2 . The mean crystallite sizes ‘D’ were
determined according to the Scherrer equation:
(1)
Where is Xray wavelength (1.5406 Å), β is the full width at half maximum of the
diffraction line and is the diffraction angle. The functional group analysis was performed
by Fourier Transform Infrared Spectroscopy (FTIR). The Lattice Fringes and diffraction
patterns were carried out by the High resolution transmission electron microscopy (HR-
TEM). Scanning electron microscopy (SEMX130) was used to characterize the
morphology and grain size of the powder; the samples were coated with gold before the
examination.
N2 adsorption- desorption, was done using the Tri-Star II3020 V1.03 to find the surface
area, pore size, pore volume, and the pore size distribution of the different materials. The
samples were degassed using the degassing instrument at 90 °C for 1 hr and 200 °C for 5
hrs. The samples were then analyzed with the Tristar II3020 V1.03 using Nitrogen at 77 K,
to obtain the analysis. The kittec Squadro muffle furnace, a Powerstat 05 potentiostat and
galvanostat were used to measure the current and voltage from the cell with a maximum
voltage of 10 V and a current of 3 A. The ionic conductivity was calculated thus [15].
(2)
67
where, l is the electrolyte thickness, S is electrode area of the electrolyte surface and R is
resistance in ohms (cell resistance). The activation energy was calculated using it in the
Arrhenius plot, which is:
(3)
Where Ea is the activation energy of conduction, T is the absolute temperature, σo is the pre-
exponential factor and k is the Boltzmann Constant. The galvanostatic and potentiostatic
durability testing was carried out in order to assess the long - term static stability of the cell.
Testing was carried out at low fuel consumption of (H2 + 3 % H2O) and an oxygen
utilization of (<10 %), at 300 °C – 500 °C and at voltages within 0.1 – 1.2 V [16].
3.0 Results and Discussion
3.1 FTIR
Figure 1, shows the Infrared Spectroscopy investigation on the functionalization and
vibration modes of IrO/Ce0.8Sm0.2O2-δ nanocomposite produced and calcined at 950 oC. The
surfactants were burnt off at this temperature leaving the metal composite. Surfactant
addition caused shifts in the spectra peaks observed. The perovskite metals with F-127
showed absorbance peaks at 476.06 cm-1
indicates the formation of spinel metals and
1026.51 cm-1
are the M-O-M stretching vibrations of the metal oxide.
The absorbance peaks exhibited by P123 surfactant at 1526.95 cm-1
are H-O-H bending
modes indicating the presence of absorbed water in the sample and the peak at 3421.10 cm-
1 are M-OH stretching vibrations of the perovskites [17]. The perovskite metal formation
from the PEG surfactant application displayed absorbance peaks at 1562.95 cm-1
and
3421.10 cm-1
also. The CTAB application revealed absorbance peaks at 471.86 cm-1
which
is a characteristic band of spinel structures indicating the formation of a spinel metal. At
1054.82 cm-1
the absorbance band revealed the M-O-M stretching vibrations and at 3163.58
cm-1
, the M-OH stretching vibrations of the perovskite metals.

68
Figure 1: The FTIR spectra of (a) SDS (b) F127 (c) CTAB (d) P123 (e) PEG and (f ) WS,
surfactants added to IrO/Ce0.8Sm0.2O2-δ calcined at 950 °C.
Absorbance peaks at 589.63 cm-1
, 610.96 cm-1
, 635.10 cm-1
and 992.03 cm-1
for the SDS
application revealed characteristic absorbance bands of spinel structures which indicates the
formation of spinel metals which are caused by vibrations of the tetrahedral sites of the
metal – oxygen bond and absorption bands. The sample without surfactant showed
absorbance peaks at 528.90 cm-1
, 926.67 cm-1
, 1017.54 cm-1
, 1258.47 cm-1
, 1375.10 cm-1
,
1513.09 cm-1
, 1579.09 cm-1
and 3151.99 cm-1
. The peaks displayed at 528.90 cm-1
are
absorbance bands which are common characteristics of spinel structure representing the
spinel metals formation, which are suspected bonds of iridium oxide metal, 926.67 cm-1
-
1579.09 cm-1
absorbance peaks represents the M-O-M stretching vibrations of the enol and
keto tautomer of SDC metals.
Metal acac consists of keto and enol tautomers and the replacement of the enolic hydrogen
atom of acac by a metal cation, as shown in Figure 2. This produces a six membered
metallocycle, shifting the keto–enol equilibrium in favor of the chelated enolate anion

69
formed in metal acetylacetonate complexes. The chelation of the acac ligands to transition
metal ions as shown in Figure 2 will result in the displacement of the acac group carbonyl
stretching bond. Many researchers have recorded this phenomenon with different transition
metals, although the extent of shifting is different for different transition metals [17 - 19].
The characteristic absorbance of the metals shifts to the lower frequency region in all the
cases is similar to what was observed in this study.
Figure 2: Schematic of the chelation of the acac ligands to transition metal ions
3.2 XRD
Figure 3 confirms the structural phase of Cerium oxide (CeO2) peaks for the WS, PEG, F-
127, P123 and CTAB. For SDS sample it revealed two phases namely CeO2 and Sm2O3
peaks. The diffractogram showed the same structure, except that of the SDS surfactant,
where the structure was not totally formed as a result of its effect on the materials. The
structural pattern decreased in peak intensity from left to right as the angle 2 increased,
with very sharp peaks. The structure system was cubic that corresponds to an FCC lattice.
The X-ray diffraction peaks were located at 2 values of 28.50°, 34.67°, 40.12°, 47.19°,
53.92°, 58.63°, 65.89°, 69.17°, 76.25°, 78.61°, 83.32°, 87.87° and 94.48° which are

70
indexed respectively as (111), (200), (220), (311), (222), (400), (331), (420), (422) and
(511).
Figure 3: X-ray Diffraction pattern of (a) F127 (b) SDS (c) PEG (d) P123 (e) CTAB (f)
WS, surfactants added to IrO/Ce0.8Sm0.2O2-δ and calcined at 950 °C.
The average crystallite sizes are 30.96 nm for F127, 32.96 nm for P123, 36.66 nm for PEG,
43.11 nm for CTAB, 98.61 nm for SDS and 34.06 nm for the samples without surfactant
(WS). The crystallite sizes were calculated from the Scherrer equation, using the most
intense peak which confirmed the crystalline nature of the samples, because the peak
intensities varied for the different surfactants. This was confirmed by the variance in the
crystallite sizes, showing the effects of the surfactants on the sample. The crystallite sizes
corresponded with the particle sizes from the HRTEM images, confirming the lateral
relationship between the particle sizes of the sample and its crystallite size, confirming the
surfactants effect.
20 40 60 80 100
(f)
(e)
(d)
(c)
(b)
In
ten
sit
y
2()
11
1
20
0 22
0
31
12
22
40
0
33
14
20
42
2
51
1
(a)

71
3.3 HRTEM
Figure 4 shows the low magnification, lattice fringes and diffraction patterns of
IrO/Ce0.8Sm0.2O2-δ effects of the different surfactants on the sample. The low magnification
of the image revealed the scattering, separation, shape, sizes of the particles and their
formation.The uniformity of the spherical and rectangular shapes in the primary particles
are evidence of surfactant effects. The sample particle sizes were in the range of 3.55 -
30.38 nm for F127; 2.63 - 30.49 nm for P123; 2.73 - 51.997 nm for PEG; 1.82 - 67.96 nm
for CTAB; 1.73 - 79.59 nm for SDS and 3.42 - 66.56 nm for WS.
Figure 4: The Low magnification, Lattice fringes and diffraction patterns of (a) F127
(b) SDS(c) CTAB (d) PEG (e) P123 (f) WS, surfactants added toIrO/Ce0.8Sm0.2O2-δand Calcined
at 950 °C.
72
These correspond with the crystallite sizes in the XRD data and the varying particle sizes
which confirm the effect of the surfactants. The lattice fringes also showed varying
distances between the crystal layers, 0.126 nm (321) for PEG; 0.152 nm (311) for CTAB;
0.124 nm (331) for F127; 0.142 nm (310) for P123; 0.181 nm (400) for WS and the
particles for SDS were rectangular. The values in brackets are the Miller indices for the
crystal layer distance, as shown in Figure 4 below.
3.4 SEM
The morphology for F-127 surfactant as shown in Figure 5(a), illustrated that the metals
accumulated together in an agglomerate formation with large pore sizes in existence,
between the particles. In Figure 5(b), the effect of CTAB displayed morphology of a fine
particle combination and agglomerate formation with pore spaces. Figure 5(c) showed the
effect of SDS on the sample, the morphology revealed large smooth aggregate surfaces
with smaller loose particles.The morphology of PEG effects revealed a gel like structure
with smooth surfaces separated by pores as shown in Figure 5(d). The P123 effects
illustrated, fine particles held together by strong and weak bonds in existence between the
metal combination to form agglomerates and aggregates as shown in Figure 5(e).
The image of the nanoparticles prepared without surfactants, revealed tiny particle
separations to form bigger loosely packed particles, these particles bond and grew
asymmetrically to form agglomerates as shown in Figure 5(f).Surfactants addition produces
particle separation and formation of loosely coherent secondary particles called
agglomerates. Finely divided porous solids formed by this method are distinguished by
large surface to volume ratios, enhanced chemical reactivity, higher adsorption capacity
and lower sintering temperature. IrO/Ce0.8Sm0.2O2-δ prepared using Pluronic F-127 and
CTAB as surfactants observed from figure 5 revealed low conglomerations but a wide size
distribution.
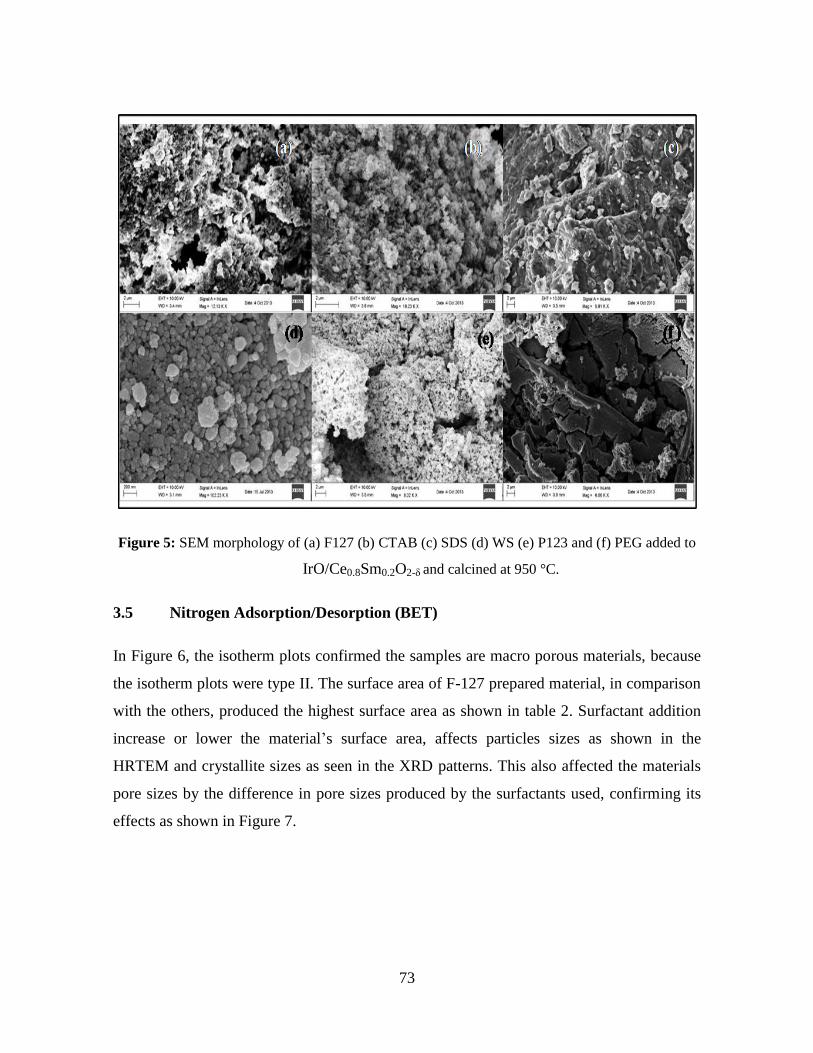
73
Figure 5: SEM morphology of (a) F127 (b) CTAB (c) SDS (d) WS (e) P123 and (f) PEG added to
IrO/Ce0.8Sm0.2O2-δ and calcined at 950 °C.
3.5 Nitrogen Adsorption/Desorption (BET)
In Figure 6, the isotherm plots confirmed the samples are macro porous materials, because
the isotherm plots were type II. The surface area of F-127 prepared material, in comparison
with the others, produced the highest surface area as shown in table 2. Surfactant addition
increase or lower the material’s surface area, affects particles sizes as shown in the
HRTEM and crystallite sizes as seen in the XRD patterns. This also affected the materials
pore sizes by the difference in pore sizes produced by the surfactants used, confirming its
effects as shown in Figure 7.

74
Figure 6: Isotherm plots for (a) WS (b) F127 (c) CTAB (d) P123 (e) PEG and (f) SDS added to
IrO/Ce0.8Sm0.2O2 and calcined at 950 °C.
Table 2: The Surface Area, Pore diameter, Pore volume and Crystallite size of (a) F127 (b) CTAB
(c) PEG (d) WS (e) P123 and (f) SDS, added to IrO/Ce0.8Sm0.2O2 and calcined at 950 °C.
Sample ID
Surface area
(m2/g)
Pore diameter
(nm)
Pore volume
(cm3/g)
Crystallite size
(nm)
F127 17.514 37.5 0.1641 33.87
CTAB 9.7064 27.8 0.0678 46.65
PEG 7.6359 29.5 0.0546 39.61
WS 5.5301 39.9 0.0552 43.85
P123 4.4621 32.5 0.0363 35.64
SDS 1.2478 18.58 0.0111 98.61
3.6 Electrochemical properties
The single cell was tested using Nuvant potentiostat and galvanostat connected to a Kittec
Squadro muffle furnace device. Compressed air with flow rate of 50 m3/min and humidified
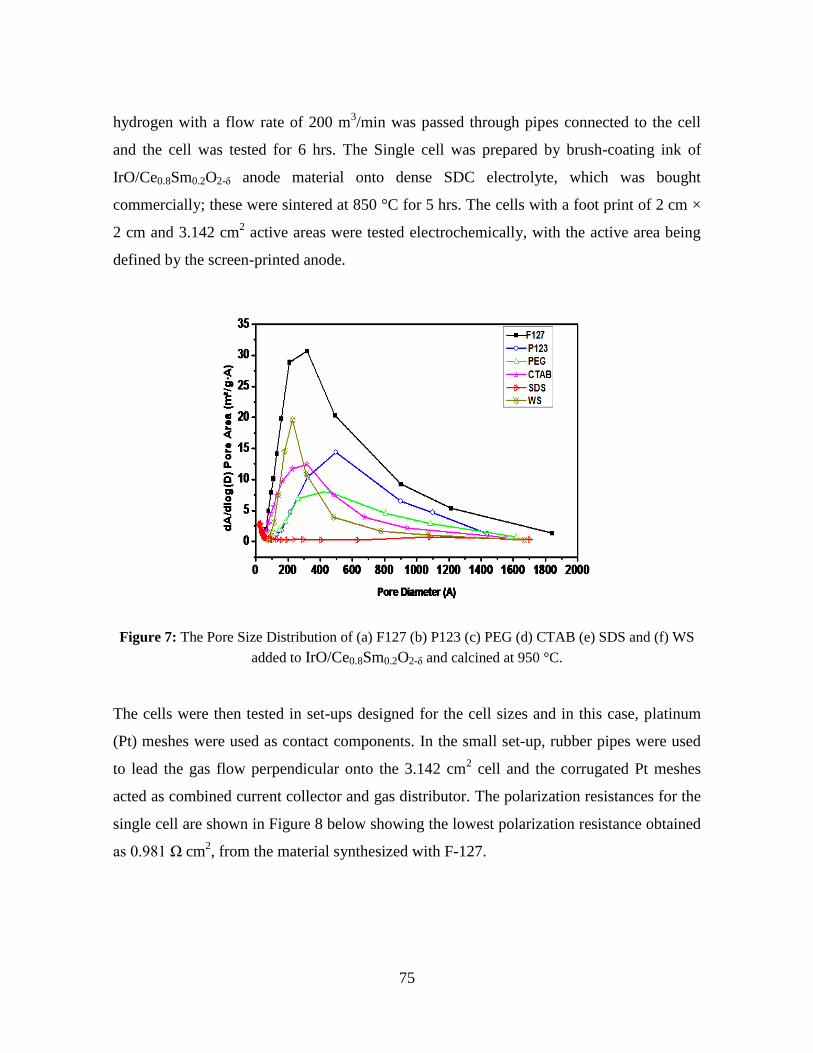
75
hydrogen with a flow rate of 200 m3/min was passed through pipes connected to the cell
and the cell was tested for 6 hrs. The Single cell was prepared by brush-coating ink of
IrO/Ce0.8Sm0.2O2-δ anode material onto dense SDC electrolyte, which was bought
commercially; these were sintered at 850 °C for 5 hrs. The cells with a foot print of 2 cm ×
2 cm and 3.142 cm2 active areas were tested electrochemically, with the active area being
defined by the screen-printed anode.
Figure 7: The Pore Size Distribution of (a) F127 (b) P123 (c) PEG (d) CTAB (e) SDS and (f) WS
added to IrO/Ce0.8Sm0.2O2-δ and calcined at 950 °C.
The cells were then tested in set-ups designed for the cell sizes and in this case, platinum
(Pt) meshes were used as contact components. In the small set-up, rubber pipes were used
to lead the gas flow perpendicular onto the 3.142 cm2 cell and the corrugated Pt meshes
acted as combined current collector and gas distributor. The polarization resistances for the
single cell are shown in Figure 8 below showing the lowest polarization resistance obtained
as 0.981 Ω cm2, from the material synthesized with F-127.

76
Figure 8: The Polarization resistance graph of (a) PEG (b) F127 (c) WS (d) CTAB (e) P123 and
(f) SDS added to IrO/Ce0.8Sm0.2O2-δ and calcined at 950 °C.
3.6.1 Polarization
The anodic polarization dependences for IrO/SDC synthesized with different surfactants are
shown in Figures 9 - 14. These were obtained in humidified hydrogen and compressed air
at the temperature intervals extending from 300 °C – 500 °C. At the cell temperature of 500
°C the current density was lower compared to the current density of 300 °C – 400 °C but
produced a higher power density because of its low polarization losses and anodic
overvoltage as shown in the graph. The ohmic overpotential is the internal resistance of the
cell which can be estimated from the effective distance between the cells components
coupled with the conductivity. The ohmic overpotential decreased, when the cell testing
temperature increased from 300 - 500 °C, confirming a high resistance at lower
temperature. The concentration overpotential are losses observed when current flows
through the cell. This is more pronounced when fuel or oxidant gases with low purities are
fed in to the cell. These losses were insignificant in this reaction, confirming high purity of
the gases used and the concentration losses increased as the cell testing temperature
increased as shown in Figures 9 - 14.
1.3 1.4 1.5 1.6 1.7 1.8
-1
0
1
2
3
4
In R
p-1
(c
m2
)
1000/T(K-1
)
PEG
F127
WS
CTAB
P123
SDS

77
Figure 9: The polarisation curve, ohmic overpotential and concentration overpotential of PEG,
added to IrO/Ce0.8Sm0.2O2-δ and calcined at 950 °C.
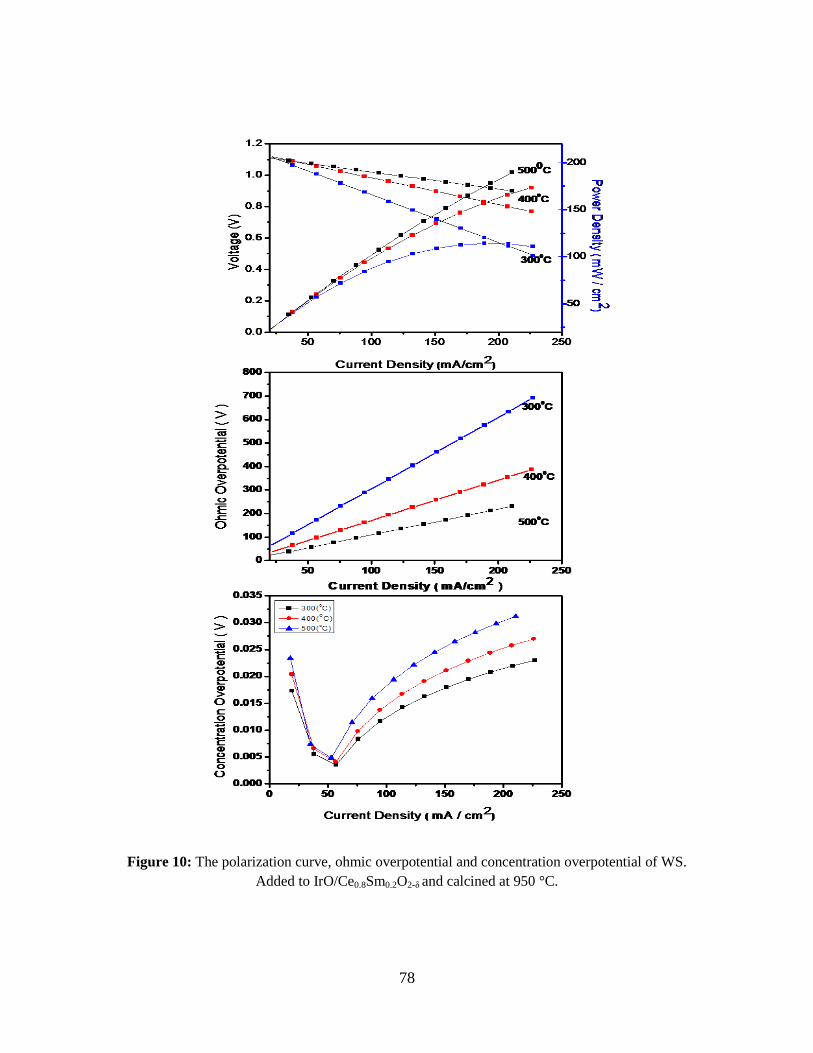
78
Figure 10: The polarization curve, ohmic overpotential and concentration overpotential of WS.
Added to IrO/Ce0.8Sm0.2O2-δ and calcined at 950 °C.

79
Figure11: The polarization curve, ohmic overpotential and concentration overpotential of CTAB
added to IrO/Ce0.8Sm0.2O2-δ and calcined at 950 °C.
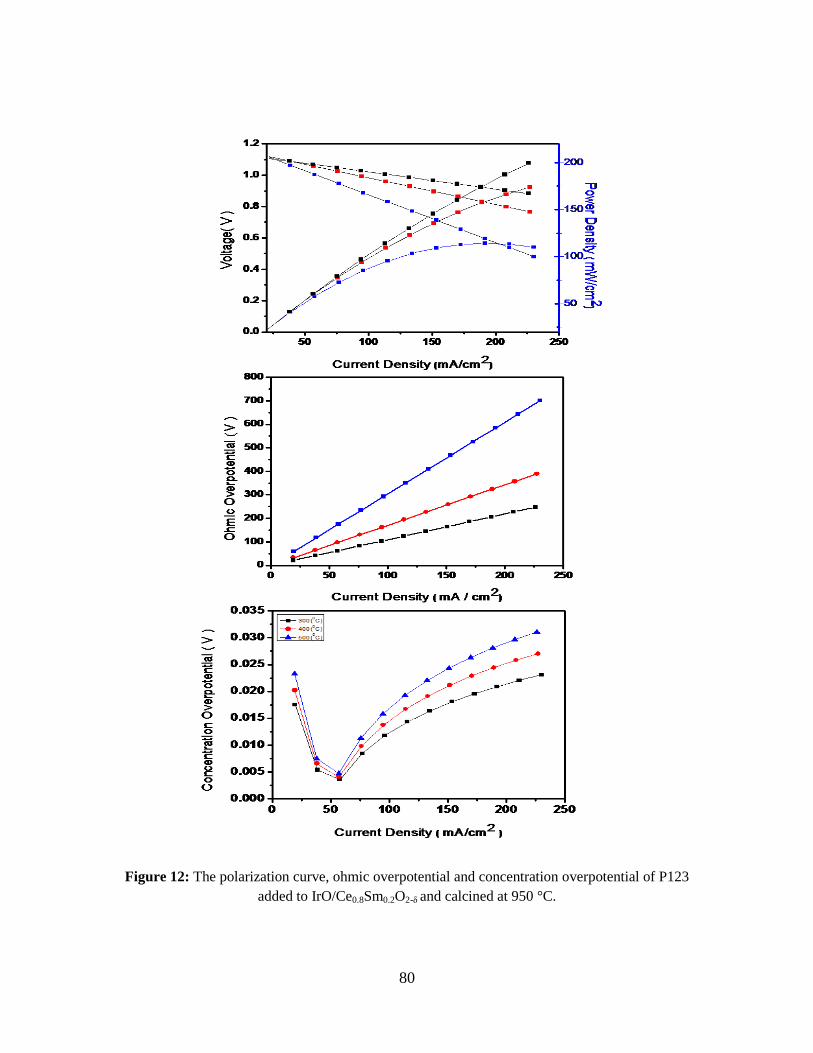
80
Figure 12: The polarization curve, ohmic overpotential and concentration overpotential of P123
added to IrO/Ce0.8Sm0.2O2-δ and calcined at 950 °C.

81
Figure 13: The polarization curve, ohmic overpotential and concentration overpotential of SDS
added to IrO/Ce0.8Sm0.2O2-δ and calcined at 950 °C.

82
Figure 14: The polarization curve, ohmic overpotential and concentration overpotential of F-127
added to IrO/Ce0.8Sm0.2O2-δ and calcined at 950 °C.

83
3.6.2 Power density
The power densities of the different samples are shown in Figure 15, extending from 300
°C – 500 °C. The maximum power densities were obtained at 500 oC with a maximum
value of 199 mW/cm2 obtained from the samples, which had F-127, CTAB and PEG added
to it.
Figure 15: The Power Density graph of (a) F127 (b) P123 (c). SDS (d).CTAB (e).WS and (f).PEG
added to IrO/Ce0.8Sm0.2O2-δ and calcined at 950°C.
4.0 Conclusion
The nature of the surfactant influenced particle morphology, pore diameter, pore size,
crystallite size, surface area and electrochemical properties. Surfactants addition caused a
reduction in the crystallite sizes. This reduction was caused by an increase in the XRD peak
intensities and a high, full width at half maximum value. Increase in the materials surface
area was influenced by F127, CTAB, PEG and reduced by SDS and P123 compared with
the sample without surfactant. The materials morphology changed from surfactant to

84
surfactant with varying porosity and particle sizes, resulting from a complete coalescing of
the substituent materials.
The materials were tested as anodes and the electrochemical properties obtained. These
properties are the power density, current density and polarization resistance. The results
obtained, are shown in the figures above. F127 surfactant displayed the highest power
density of 199 mW/cm2, a current density of 226 mA/cm
2 and low polarization resistance
of 0.981 Ω cm2. Nonionic and cationic surfactants are good for our material, because of its
surface area, low crystallite size, porous morphology and low polarization resistance. This
research has revealed that surfactants are essential for material boosting and increased
electrical performance in solid oxide fuel cell application.
Acknowledgement
The authors thank the University of KwaZulu-Natal, Westville campus for availability to
research facilities used in this research.
References
[1.] Kalita, S. J., Abhilasha B., Himesh A. B.,2007 "Nanocrystalline calcium phosphate
ceramics in biomedical engineering." Materials Science and Engineering: C 27.3:
pp. 441-449.
[2.] Lou, Z., Peng, J., Dai, N.,Qiao, J., Yan,Y., Wang, Z., Wang, J., Sun, K., 2012,
"High performance La3Ni2O7 cathode prepared by a facile sol-gel method for
intermediate temperature solid oxide fuel cells"Electrochem. Commun., 22: pp. 97–
100.
[3.] Mastuli, M. S., Ansaria, N. S., Nawawia, M. A., Maria, A., 2012, "Effects of cat
ionic surfactant in sol-gel synthesis of nano-sized Magnesium Oxide". APCBEE
Procedia., 3: pp. 93 – 98.
[4.] Lou, Z., Qiao, J., Yan, Y., Peng, J., Wang, Z., Jiang, T., Sun, K., 2012, "Synthesis
and characterization of aluminum-doped perovskites as cathode materials for
intermediate temperature solid oxide fuel cells " Electrochem. Commun., 37: pp.
11345-11350.

85
[5.] Ermokhina, N. I., Nevinsky, V. A., Manorik, P. A., Ilyin, V. G., Shcherbatyuk, N.
N., Klymchuk, D. O., Puziy, A. M., 2012, "Synthesis of large-pore mesoporous
nano crystalline TiO2 microspheres" Materials Letters ., 75: pp. 68–70.
[6.] Parada, K. T., Aguilar, G. V., Mantilla, A.,Valenzuela, M. A., Hernández, E., 2013,
"Synthesis and characterization of Ni/Ce–SiO2 and Co/Ce–TiO2 catalysts for
methane decomposition." Fuel cell., 110 : pp. 70–75.
[7.] Chen, L. F., Wang, J. A., Norena, L. E., Aguilar, J., Navarrete, J., Salas, O., 2007,
"Synthesis and physicochemical properties of Zr–MCM-41 mesoporous molecular
sieves and Pt/H3PW12O40/Zr–MCM- 41 catalysts." . J Solid State Chem., 180: pp.
2958–2972.
[8.] Gonzalez, O. A., Valenzuela, M. A., Wang, J. A., 2006, "Catalytic decomposition of
methane over cerium-doped Ni catalysts, in the book ‘‘The hydrogen cycle
generation, storage and Fuel cells". Materials research society symposia
proceedings. MRS., 885: pp. 223–238.
[9.] Schacht, P., Ramirez, S., Ancheyta, J., 2009, "CoMo/Ti–MCM-41/alumina
catalysts: properties and activity in the hydrodesulfurization (HDS) of dibenzo
thiophene (DBT)". Energy Fuels., 23: pp. 4860 – 4865.
[10.] Das, S. K., Bhunia, M. K., Sinha, A. K., Bhaumik, A., 2009, "Self-assembled
mesoporous zirconia and sulfated zirconia nanoparticles synthesized by triblock
copolymer as template" . J. Phys. Chem., 113: pp. 8918–8923.
[11.] Liu, S. G., Wang, H., Li, J. P., Zhao, N., Wei, W., Sun, Y. H., 2007, "A facile route
to synthesize mesoporous zirconia with ultra high thermal stability,". Mater. Res.
Bull., 42: pp. 171–176.
[12.] Wang, K., Morris, M. A., Holmes, J. D., Yu, J., Xu, R., 2009, "Thermally stable
nanocrystallised mesoporous zirconia thin films," Micropor. Mesopor. Mater., 117:
pp. 161–164.
[13.] Duan, G., Zhang., C. A., Li, X., Yang, L., Lu, X., 2008, "Preparation and
characterization of mesoporous zirconia made by using a poly (methylmethacrylate)
template ". Nanoscale Res. Lett., 3: pp. 118–122.
86
[14.] Chen, Y., Lunsford, S. K., Song, Y., Ju, H., Falaras, P., likodimos, V., Kontos,
A.G., Dionysiu, D. D., 2011, "Synthesis, characterization and electrochemical
properties of mesoporous zirconia nanomaterials prepared by self-assembling sol–
gel method with Tween 20 as a template", .Chem. Eng. J., 170: pp. 518–524.
[15.] Okkay, H., Bayramoglu, M., Öksüzömer, M. F, 2013, "Ce0.8Sm0.2O1.9 synthesis for
solid oxide fuel cell electrolyte by ultrasound assisted co-precipitation method."
Ultrasonics Sonochemistry., 20: pp. 978–983.
[16.] Blennow, P., Hjelm, J. Klemens, T., Ramousse, S., Kromp, A., Leonide, A., Weber,
A., 2011,"Manufacturing and characterization of metal-supported solid oxide fuel
cells". Journal of Power Sources., 196: pp. 7117–7125.
[17.] Shen, C., Shaw, L. L., 2010, "FTIR analysis of the hydrolysis rate in the sol–gel
formation of gadolinia-doped ceria with acetylacetonate precursors". J Sol-gel Sci
Technol., 53: pp. 571–577.
[18.] Brasil, M. C., Benvenutti, E. V., Gregorio, J. R., Gerbase, A. E., 2005, "Iron
acetylacetonate complex anchored on silica xerogel polymer". React Funct Polym.,
63: pp. 135–141.
[19.] Krunks, M., Oja, I., Tonsuaadu, K., EsSouni, M., Gruselle, M., Niinisto, L., 2005,
"Thermoanalytical study of acetaylacetonate-modified titanium (IV) isopropoxide as
a precursor for TiO2 films". J Therm Analysis Calorim., 80: pp. 483–488.

87
CHAPTER 4
Physical chemical properties of Ce0.8Sm0.2IryCo1-yO3-δ (y = 0.03 - 0.04)
and preliminary testing as cathode material for low temperature
SOFC
Summary
This chapter has been submitted to Materials Research Bulletin and has been structured
according to the journal’s format. This chapter has also been reformatted to incorporate
further comments and corrections by the examiners.
Abstract
A sol gel method was adapted to prepare Ce0.8Sm0.2IryCo1-yO3-δ (y = 0.03 and 0.04).
The materials were characterized using powder XRD, Raman and IR spectroscopy,
high resolution transmission electron microscopy and scanning electron microscopy.
The materials were then tested for applicability as a cathode in a solid oxide fuel cell.
The XRD data showed distinct peaks for samarium doped ceria and iridium oxide, and
Raman data confirmed there were perovskite and pyrochlore phases. When tested in a
SOFC button cell, the materials calcined at 1000 C had the highest power density of
0.287 W/cm2 and 0.222 W/cm
2 at 500 °C for the materials with y = 0.03 and 0.04
respectively.
Key words: Solid Oxide Fuel Cell, Iridium Oxide, Samarium doped Ceria, Oxides; sol-gel
chemistry; Raman Spectroscopy; X-Ray diffraction; electrochemical properties

88
1.0 Introduction
A Solid oxide fuel cell (SOFC) is an electrochemical device that generates electricity and
gives off heat as a by-product. SOFCs, have attracted significant attention for several years,
because of their high energy efficiency, excellent fuel flexibility, the growing global
demand for non-polluting energy conversion systems, and a need for devices that can
utilize renewable energy [1 - 4]. However SOFC systems, specifically those operating
above 800 °C, also have some disadvantages which include longer start-up and cool down
times, specialised and expensive balance of plant material, thermal management issues, and
degradation of cell and stack components. Thus the reduction of SOFC operating
temperature has become a key issue for the wide scale commercialization of these systems
and an area of intensive research [5].
The improvement in the activity of SOFCs that can operate in the temperature range of 300
to 600 °C has increased dramatically in the last few years; however, at lower temperatures
the electrolyte conductivity and electrode kinetics decrease significantly [6 - 8]. One way to
overcome these drawbacks is to design and synthesize alternative cell materials based on
cheaper precursors and using simpler methodologies [6, 8, 9]. In fact, the development of
good cathode materials for low temperature SOFCs remains as one of the main challenges
in this area, as its sensitivity affect the performance of low-temperature SOFCs.
The quest for low temperature SOFCs has led to the use of a mixture of electro-catalyst
electrolyte composites as cathode material. Jiang et al. [10] reported that an anode
supported fuel cell with a co-synthesized 70 wt. % Sm0.5Sr0.5CoO3 – 30 wt. % Sm0.2 Ce0.8
O1.9 (SSC – SDC 73) composite cathodes exhibited a peak power density of 924 mW/cm2
at 800 °C. Li et al. [11] exploited the fabrication of a porous SDC/SSC composite cathode
layer using environmentally friendly water-based ink. The results indicated that the cell
with the inkjet printing cathode layer exhibited fantastic electrochemical performance, with
a peak power density as high as 940 mW/cm2 at 750 °C. Wu et al. [12] reported a minimum
interfacial polarization resistance of 0.21 Ω cm2 and a power density of 0.24 W/cm
2 at 700
°C for Sm0.5Sr0.5CoO3-δ and BaCe0.8Sm0.2O3-δ composites. Wang et al. [13] reported a peak

89
power density of 382 mW/cm2 at 500 °C for Ba0.5Sr0.5Co0.8Fe0.2O3-δ + Sm0.2Ce0.8O1.9 (SDC)
composites. Nie et al. [14] also recorded an interfacial resistance of 0.44 Ω cm2 at 650 °C
and a current density of 400 mA/cm2 at 750 °C for La0.6Sr0.4Co0.2Fe0.8O3-δ + SDC.
In this study, we synthesized a novel composite cathode material from iridium and cobalt
oxide with Samaria-doped ceria (SDC) using a sol gel method. Samarium doped ceria tends
to have promising oxygen ion conductivity and good electronic properties at low
temperature [6, 9, 15 - 17]. Our previous work demonstrated the excellent potential that
iridium, cobalt, iron, and SDC mixed phase materials have as low temperature SOFC
materials [18]. In this work, the materials are iron free, and this is of interest since some
reports in the literature have shown that cobalt, without the presence of iron, can improve
the performance of mixed phase perovskite materials for low temperature SOFC
applications [19, 20].
2.0 Experimental methods
2.1 Material synthesis
Cobalt (II) acetylacetonate hydrate, (99 % purity), Samarium (III) acetylacetonate hydrate
(99.9 %), Cerium (III) acetylacetonate hydrate, (99.9 % purity), and Pluronic F-127 were
purchased from Sigma-Aldrich (Pty) Ltd, South Africa. Iridium (III) acetylacetonate
hydrate (98 % purity) was purchased from Alfa Aesar UK and these materials were used as
received.
The materials were weighed out in various masses to make the different stoichiometry
compositions. For the y = 0.04 composition, 0.0500 g iridium (III) acetylacetonate hydrate,
0.6481 g of Cerium (III) acetylacetonate hydrate, 0.2286 g of Samarium (III) acetyl aceton-
ate hydrate and 0.0394 g of Cobalt (II) acetylacetonate hydrate were used. For the y = 0.03
composition, the masses were 0.0379 g of Iridium (III) acetylacetonate hydrate, 0.6551 g of
Cerium (III) acetylacetonate hydrate, 0.2321 g of Samarium (III) acetylacetonate hydrate
and 0.0465 g of Cobalt (II) acetylacetonate hydrate. The various perovskite nanocomposite
compositions were prepared by weighing out the metal salts and adding a mixture of 50 ml

90
of ethanol and 15 ml of deionized water. The mixture was then placed in an ultrasound bath
(UMC 20, 50 kHz) and sonicated for 30 mins to dissolve all the solids. The mixture was
then heated up to 80 °C on a hot plate and stirred at 180 rpm for 30 mins, after which the
solution was put in a convection oven for 18 hours at 200 °C to dry completely. Samples
were made in triplicate. Samples were then calcined in a muffle furnace (Kittec Squadro
1350) at a heating rate 2 °C/min and a final hold time, at the final temperature for 10 hrs.
The samples were calcined at 800 °C, 900 °C, and 1000 °C respectively. The samples were
allowed to cool to ambient conditions and then used for further analysis.
The electrolyte (SDC) was synthesized by weighing out 0.200 g of samarium (III) acetyl
acetonate and 0.534 g of cerium (III) acetylacetonate into 50 ml of ethanol and 15 ml of
deionized water. The mixture was sonicated for 30 mins in an ultrasound bath (UMC 20, 50
kHz), and then placed on a hotplate and heated up to 80 °C at 120 rpm for 20 mins. The
sample was then calcined at 850 °C for 5 hrs at a heating rate of 2 °C/min in a muffle
furnace (Kittec Squadro 1350). The SDC material formed was then hand mixed with
sodium carbonate (Na2CO3) in the ratio of 60:40 % before use.
2.2 Characterization
Characterization of the samples was done using powder X-ray Diffraction (XRD), High
resolution transmission electron microscopy (HR-TEM), Raman spectroscopy and Fourier
transform infrared spectroscopy (FTIR), Scanning electron microscopy (SEM). The powder
patterns were recorded using Brucker D8 ADVANCE X-ray diffractometer equipped with a
CuKα radiation source operating at 40 kV and a wavelength of 1.5406 Å. For HR-TEM
small amounts of the samples were dispersed in ethanol and sonicated using an ultrasound
bath, then drop-dried onto a carbon coated copper TEM grid, and examined using a JOEL
2100 HRTEM (200 kV accelerating voltage, beam current of 110 and a current density
of 2.4 pA/cm2). For SEM analysis, small amounts of the powders were placed onto double
sided carbon tape that was firmly adhered to aluminium stubs and then the supported
powder samples were coated with gold for SEM observations on a ZEISS FEGSEM Ultra
Plus. For Raman analysis, the spectra were collected on a DeltaNu advantage 532™ Raman

91
Spectrometer (100 mWNd:YAG laser with an excitation wavelength of 532 nm). FTIR
analysis of the samples was done by using an ATR accessory in a Perkin Elmer 1200 FTIR.
2.3 Button cell fabrication
Anode powder consisting of 60 wt % NiO and 40 wt % SDC were mixed and pressed using
a 20 Ton press and a 13 mm die kit. The electrolyte powder (SDC + Na2CO3) was then
added on top of the anode disc, and then the cathode powder was placed on top of the
electrolyte powder and finally the materials were pressed together using 15 Ton pressure to
form a trilayer structure. Thus the button cell consisted of NiO-SDC|SDC + Na2CO3|
Ce0.8Sm0.2IryCo1-yO3-δ and the single cell had an active surface area of 1.342 cm2. The cell
was then heated up to 500 °C for 2 hrs at a heating rate of 5 °C/min in air to densify the
electrolyte. The sintering temperature was used because the addition of Na2CO3 to the
electrolyte improves its densification at lower temperatures [21].
2.4 Electrochemical performance test
The fabricated cells were mounted in an open flange test set-up from Fiaxell SOFC
Technologies™ with platinum mesh as the current collector and distributor connected to
the cells. The test-bed was placed on a Kittec Squadro muffle furnace and connected to a
steady flow of air on the cathode and humidified hydrogen gas on the anode side. Current
and voltage from the cells were measured with a Nuvant™ Powerstat potentiostat and
galvanostat. The measurements were taken between the temperatures of 300 °C - 500 °C
and the ionic conductivity was calculated using the Equation [22].
(1)
where, l is the electrolyte thickness, S is electrode area of the electrolyte surface and R is
resistance in ohms (cell resistance).
The activation energy and the Electrical conductivity were calculated using the Arrhenius
relationship in Equation 2 [22].

92
(2)
where, Ea is activation energy of conduction, T is absolute temperature, σo is pre-
exponential factor and k is the Boltzmann Constant. The Polarization curves were recorded
between 300 –500 °C and the potentiostatic durability testing was carried out in order to
assess long-term static stability of the cell.
3.0 Results and discussions
3.1 Powder X-ray diffraction analysis
Figure 1 shows representative XRD patterns of the perovskite material (y = 0.03 - 0.04)
composition, calcined at 800 °C, 900 °C and 1000 °C. The XRD pattern displayed
characteristic peaks for the cubic fluorite structure of SDC [22 - 24]. The SDC phases were
observed at 2θ values of 28.44°, 47.33°, 56.19°, 88.22° and 95.20° indexed to (111), (220),
(311), (422) and (511) respectively.
Iridium oxide structure peaks were noticed at 2θ values of 34.71°, 58.90°, 69.22° and
77.03° indexed to (101), (200), (301) and (310) respectively. For the CSIC samples after
calcination, the average lattice parameter for CeO2 phase and IrO2 phase are shown in
Table 1 using Rietveld, profile matching and integrated intensity refinement of X-ray
diffraction data (Full Prof. 2k (Version 5.70)). The lattice parameter of the cathode material
was different from the lattice parameter of CeO2 (JCPDS file No. 00-034-0394) which
confirms the formation of a new compound. There were no separate cobalt oxide peaks
observed, and this could be due to the cobalt ion substituting into either the iridium oxide or
the SDC phase. Previous work by Dreifus et al [26] has shown that Co2+
can substitute Ir4+
in the iridium oxide lattice and Yao et al. [27] reported on the formation of solid solution
with cobalt and SDC [26]. The crystallite sizes for the composites with y = 0.03 were
calculated to be 21.80 nm, 20.41 nm and 18.45 nm for the samples calcined at 1000 °C, 900
°C and 800 °C respectively. The composites with the y = 0.04 composition had crystallite
sizes of 22.32 nm, 21.09 nm, and 14.92 nm for the samples calcined at 1000 °C, 900 °C and

93
800 °C. In general, the crystallite sizes increased as the calcination temperature was
increased and is an expected result.
Figure 1: XRD patterns of the CSIC materials with y = 0.03 composition calcined at (i) 1000 °C
(ii) 900 °C and (iii) 800 °C, and the y = 0.04 composition calcined at (iv) 1000 °C (v) 900 °C and
(vi) 800 °C.
Figure 1b: The observed and calculated (Rietveld analysis) XRD patterns of A1 (y = 0.04) calcined
at 1000 °C.
20 40 60 80 100
(20
0)
(51
1)
(42
2)
(20
4)
(33
1)
(30
1)(3
11
)
(22
0)
(11
0)
(c)
(b)
(a)
(c)
(b)
y = 0.03
Inte
ns
ity
2 (degree)
y = 0.04
(a)
(11
1)

94
Table 1: The result of Rietveld refinement of XRD patterns of A1, B1, C1, A2, B2 and C2
Phases
(1000 °C)
Y = 0.04
(900 °C)
(800 °C)
(1000 °C)
Y =0.03
(900 °C)
(800°C)
(
CeO2
IrO2
5.427
5.128
5.428
5.135
5.432
5.130
5.427
5.129
5.443
5.128
5.431
5.131
Density
(g/cm3)
|CeO2
IrO2
7.131
6.562
7.330
6.537
7.114
6.555
7.133
6.561
7.070
6.562
7.050
6.560
Cell
volume
(cm3)
CeO2
IrO2
159.905
134.905
159.98
135.42
160.29
135.05
159.86
134.93
161.29
134.91
160.27
134.90
3.2 FTIR analysis
Figure 2 shows the FTIR spectra of composites with (a) y = 0.03 and (b) y = 0.04 calcined
at 800 C, 900 C and 1000 C respectively. The stretching vibrations observed in the
spectra between 1000cm-1
– 1100cm-1
were attributed to Ce-O-Ir or Sm-O-Co or Ce-O-Co
(M-O-M) stretching vibrations. Samarium doped ceria, after calcination, does not typically
display any FTIR peaks within the region 1000 – 1100 cm-1
[1]. The absorption bands ~470
– 680 cm-1
indicate the presence of metal oxides, these bands are usually observed with
perovskite structure containing materials with metals such as doped ceria [28 - 30].
According to Waldron [31], the vibration of a unit cell of the cubic spinel can be
constructed in the tetrahedral (A) sites and octahedral (B) sites. Therefore the absorption
bands at 554 cm-1
, 672 cm-1
, 673 cm-1
, 675 cm-1
, 670 cm-1
, 670 cm-1
and 666 cm-1
are
tentatively assigned to the vibrations of the tetrahedral metal – oxygen (M – O) bond and
the absorption band at 472 cm-1
, 474 cm-1
, 478 cm-1
, 480 cm-1
, 482 cm-1
and 488 cm-1
are
due to the metal–oxygen (M - O) vibrations in the octahedral sites. The change in band
positions is expected because of the variation in the compositionsof the materials and the
difference in the M+– O2
− distances in the tetrahedral and octahedral sites.
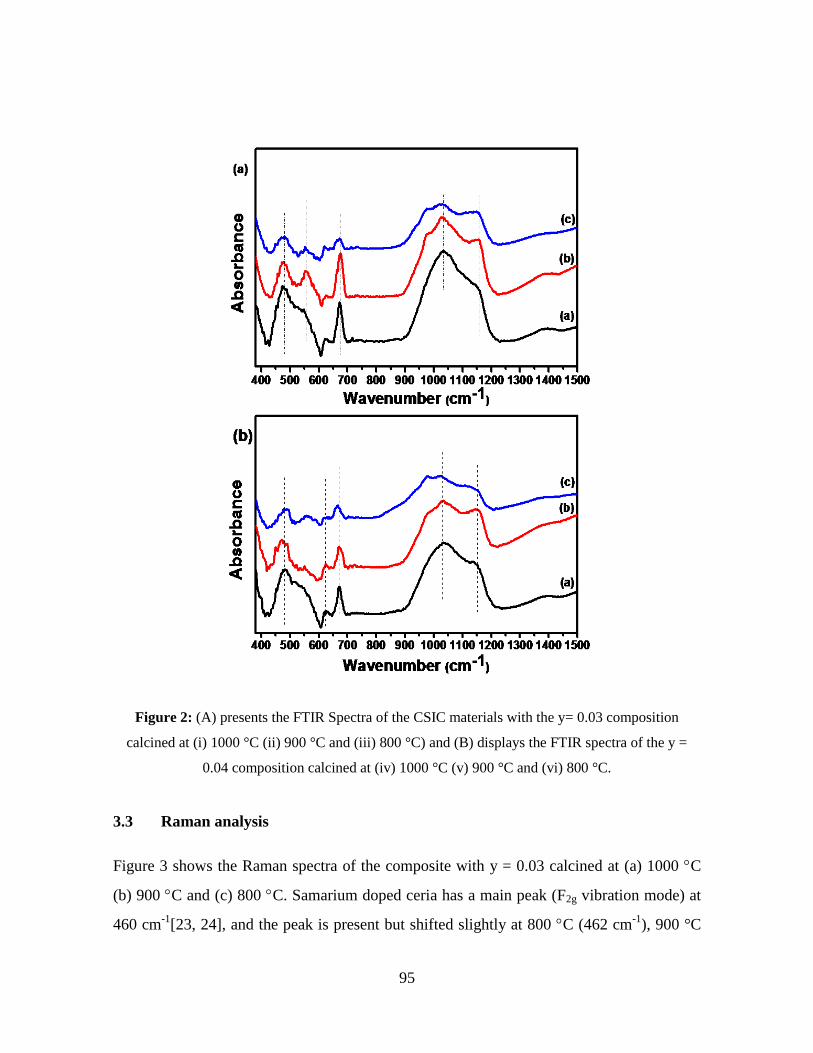
95
Figure 2: (A) presents the FTIR Spectra of the CSIC materials with the y= 0.03 composition
calcined at (i) 1000 °C (ii) 900 °C and (iii) 800 °C) and (B) displays the FTIR spectra of the y =
0.04 composition calcined at (iv) 1000 °C (v) 900 °C and (vi) 800 °C.
3.3 Raman analysis
Figure 3 shows the Raman spectra of the composite with y = 0.03 calcined at (a) 1000 C
(b) 900 C and (c) 800 C. Samarium doped ceria has a main peak (F2g vibration mode) at
460 cm-1
[23, 24], and the peak is present but shifted slightly at 800 C (462 cm-1
), 900 °C

96
(459 cm-1
), and 1000 °C (465 cm-1
). The red shift is indicative of changes within the SDC
fluorite structure; specifically, incorporation of Ce3+
cations and thus increase in oxygen
vacancies and defects [32]. Co3O4 A1g vibrational modes were observed at 686 cm-1
(800
°C), 691 cm-1
(900 °C), and 697 cm-1
(1000 °C).
These shifts with the Co3O4 A1g mode are attributed to the different calcination
temperatures. For the samples calcined at 800 °C, the minor peak at 314 cm-1
could indicate
that some small amount of the iridium and samarium may have formed a pyrochlore phase
[33], and the small peak at 818 cm-1
could be due to oxygen defects from the mixed phase
metal oxides [34]. The disappearance of the peak at 314 cm-1
at higher calcination
temperatures and the slight increase in the intensity of the peaks at 831 cm-1
(900 °C) and
826 cm-1
(1000 °C) are a further indication that the minor pyrochlore phase has transitioned
to a defect fluorite structure. Several authors have reported on pyrochlore to defective
fluorite transitions [34, 35].
The material with the composition y = 0.04 (Figure 3 (b)) showed similar peaks to the y =
0.03 composition at all temperatures except the sample calcined at 900 °C, which showed
an interesting transition. The F2g vibration mode around 460 cm-1
for samarium doped ceria
decreases substantially, and a new peak at 552 cm-1
is observed, which indicates the new
peak is not a simple substitution of the Ce4+
for trivalent cations in the SDC fluorite
structure, as was the case reported by Luo et al. [24]. Instead, the appearance of the peaks
at 552 and 831 cm-1
are indicative of pyrochlore phases due to the processing temperature
and iridium content.
This result further supports the earlier discussions regarding the pyrochlore to a defect
fluorite structure transition observed with the lower iridium content samples (y = 0.03).
Finally, regarding the Raman spectra, a pure pyrochlore structure has six Raman active
modes. These are, A1g, Eg and 4T2g [34, 35] and Hasegawa et al. [33] observed a weak T2g
Raman peak for SmIr2O7 pyrochlore at 549 cm-1
. The shift and increased intensity observed
with the sample y = 0.04 calcined at 900 C can be attributed to the presence of various
other dopant ions [35] and the complexity of the different phases present.
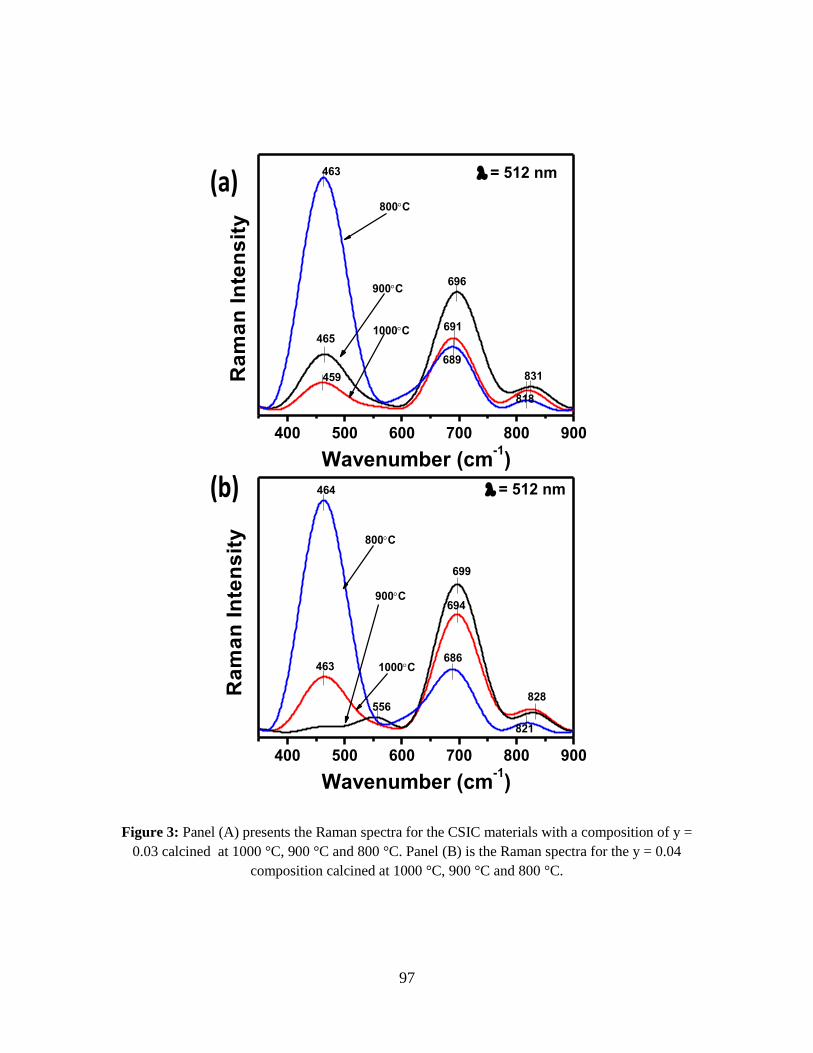
97
Figure 3: Panel (A) presents the Raman spectra for the CSIC materials with a composition of y =
0.03 calcined at 1000 °C, 900 °C and 800 °C. Panel (B) is the Raman spectra for the y = 0.04
composition calcined at 1000 °C, 900 °C and 800 °C.
400 500 600 700 800 900
1000C
900C
Ra
ma
n I
nte
ns
ity
Wavenumber (cm-1)
463
465
459
696
691
689
831
818
800C
= 512 nm(a)
400 500 600 700 800 900
= 512 nm
1000C
900C
Ra
ma
n I
nte
ns
ity
Wavenumber (cm-1)
464
463
699
694
686
828
821
800C
556
(b)

98
3.4 HRTEM analysis
Figure 4 shows the HRTEM images for the various samples. The morphology for all the
samples showed some differences in shape and sample contrast. Differences in contrast are
indicative of changes in amorphous and crystalline regions within the sample and the
differences seen with the HRTEM images as the samples are calcined form 800 - 1000 °C
can be attributed to changes in the materials crystalline phases, which correlates with the
phase changes noted and commented on in the Raman section.
Figure 4: HRTEM images with the lattice fringes and selected area electron diffraction
patterns for the CSIC materials with y = 0.03 calcined at (a) 1000 °C, (b) 900 °C, and (c)
800 °C. Images (d), (e), and (f) are for the y = 0.04 samples calcined at 1000, 900, and 800
°C respectively.
For Figure 4 (a) the measured distance between the fringes shown in the inset was 0.147
nm indexed to (310) plane, for Figure 4 (b) the fringes in the inset were 0.110 nm indexed
to (422) plane, and in Figure 4 (c) the distance between the fringes were 0.091 nm and
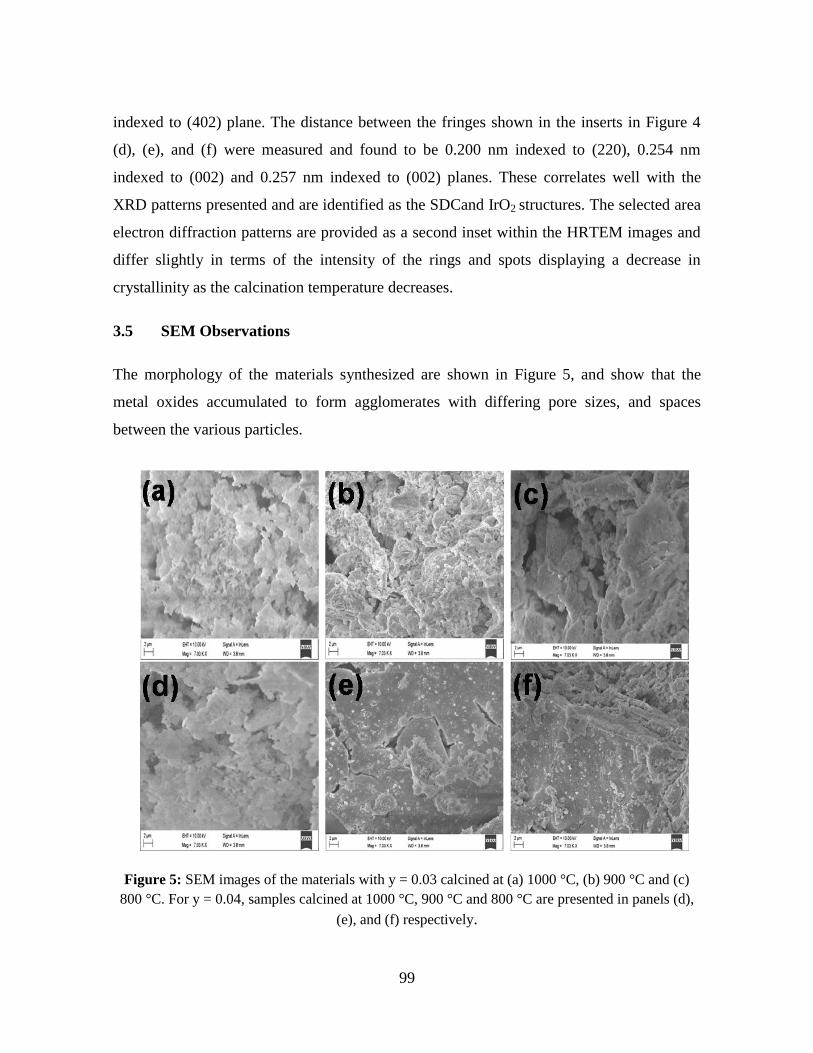
99
indexed to (402) plane. The distance between the fringes shown in the inserts in Figure 4
(d), (e), and (f) were measured and found to be 0.200 nm indexed to (220), 0.254 nm
indexed to (002) and 0.257 nm indexed to (002) planes. These correlates well with the
XRD patterns presented and are identified as the SDCand IrO2 structures. The selected area
electron diffraction patterns are provided as a second inset within the HRTEM images and
differ slightly in terms of the intensity of the rings and spots displaying a decrease in
crystallinity as the calcination temperature decreases.
3.5 SEM Observations
The morphology of the materials synthesized are shown in Figure 5, and show that the
metal oxides accumulated to form agglomerates with differing pore sizes, and spaces
between the various particles.
Figure 5: SEM images of the materials with y = 0.03 calcined at (a) 1000 °C, (b) 900 °C and (c)
800 °C. For y = 0.04, samples calcined at 1000 °C, 900 °C and 800 °C are presented in panels (d),
(e), and (f) respectively.

100
The displayed morphology of the particles show a general trend where the samples with y =
0.03 composition displayed bigger pore spaces with the calcination temperature decreasing
from 1000 °C (Figure 5 (a)), 800 °C (Figure 5 (c)). Whereas the y = 0.04 composition
showed a different trend with the smallest spaces between agglomerates observed with the
sample calcined at 900 °C (Figure 5 (e)), and the largest spaces seen with the sample
calcined at 1000 °C (Figure 5 (d)). This observation can be attributed to the change in the
materials phases as per the Raman observations and discussion.
3.6 Electrochemical properties
The materials electrochemical properties were then tested by using the NiO/SDC as the
anode SDC/NaCO3 as the electrolyte and CSIC as cathode in a SOFC button cell. The
asymmetric cell was tested using a Kittec Squadro device. Compressed air with flow rate of
50 m3/min and humidified hydrogen with a flow rate of 200 m
3/min was passed through the
cell and the cell was tested for 14 hrs.
3.6.1 Polarization curve
Recently, Hanna et al. [4] reviewed in detail the current state of knowledge on the
electrochemical characterizations and physical-chemical property relationships regarding
SOFCs. One key aspect is polarization curves. Polarization curves provide crucial
fundamental information on how a system deviates from ideal behaviour and the potential
to utilize a material in a fuel cell. The polarization curves for the samples with y = 0.03 and
y = 0.04 compositions calcined at 800 °C - 1000 °C are shown in Figures 6 and 7
respectively. These were obtained in humidified hydrogen and compressed air at
temperature intervals of 300, 400 and 500 °C. From Figure 6 the values for the OCV
dropped, as expected, as the button cell was tested at 300, 400 and 500 °C respectively.
The lowest OCV value observed was 0.81 V with the sample calcined at 1000 °C and tested
at 500 °C (Figure 6), and the highest OCV value noted was 0.93 V with the sample calcined
at 900 °C and tested at 300 °C (Figure 7).

101
Figure 6: Polarisation curves for the y = 0.03 materials calcined at (a) 1000 °C, (b) 900 °C and (c)
800 °C all measured at 300 °C, 400 °C and 500 °C.
These values are below the theoretical Nernst potential, which can be attributed to either
the non-optimal partial pressures of the gases on the electrodes [4], the presence of pinholes
within the electrolyte or poorly formed electrolytes [11]. The polarization curves in Figure
6 show that the y = 0.03 compositions do not have any large differences in the gradients of
the voltage-current density curves at the three temperatures. However, there are some
differences at low current density, and since this the region of the polarization curve that is
dominated by losses due to activation overpotentials [4], the differences are ascribed to the
different temperatures.
100 200 300 400 500 600 700 800 9000.0
0.1
0.2
0.3
0.4
0.5
0.6
0.7
0.8
0.9
1.0
1.1
1.2
Current density (mAcm2)
Vo
lta
ge
(V
)
0
50
100
150
200
250
300 300(C)
Po
we
r d
en
sit
y (
mW
cm
2)
400(C) 500(C)
0.0
0.1
0.2
0.3
0.4
0.5
0.6
0.7
0.8
0.9
1.0
1.1
1.2
Vo
lta
ge
(V
)
0
50
100
150
200
250
300
350 300(C)
Po
we
r d
en
sit
y (
mW
cm
2)
100 200 300 400 500 600 700 800 900
Current density (mAcm2)
400(C) 500(C)
0.0
0.1
0.2
0.3
0.4
0.5
0.6
0.7
0.8
0.9
1.0
1.1
1.2 300(C)
Vo
latg
e (
V)
Current density(mAcm2)
0
50
100
150
200
250
300
Po
we
r d
en
sit
y (
mW
cm
2)
100 200 300 400 500 600 700 800 900
400(C) 500(C)
(i) (ii)
(iii)

102
Figure 7: Polarisation curve for the y = 0.04 materials calcined at (a) 1000 °C, (b) 900 °C
and (c) 800 °C all measured at 300 °C, 400 °C and 500 °C.
The maximum power densities for the y = 0.03 compositions were observed at 500 °C test
temperature and the values were 268.2 mW/cm2, 287.3 mW/cm
2, and 287.6 mW/cm
2 for
samples calcined at 1000, 900 and 800 °C respectively. The samples did show relatively
stable performance at 500 °C for 3600 mins. At low current densities, similar trends are
seen with the composition y = 0.04 materials (Figure 7). However, overall the samples with
y = 0.04 have a larger gradient with the voltage-current density curves. The decrease in the
central part of the polarization curve is usually ascribed to Ohmic losses [4], and the two
composition show some differences, with the y = 0.04 composition having larger
differences with calcination temperature, when compared to the y = 0.03 composition.
100 200 300 400 500 600 700 800 9000.0
0.1
0.2
0.3
0.4
0.5
0.6
0.7
0.8
0.9
1.0
1.1
1.2 300(C)
Current density (mAcm2)
Vo
lta
ge
(V)
0
50
100
150
200
250
300
Po
we
r d
en
sit
y (
mW
cm
2)
400(C) 500(C)
100 200 300 400 500 600 700 800 9000.0
0.1
0.2
0.3
0.4
0.5
0.6
0.7
0.8
0.9
1.0
1.1
1.2 300(C)
Vo
lta
ge
(V)
Current density (mAcm2)
0
50
100
150
200
250
Po
we
r d
en
sit
y (
mW
cm
2)
400(C) 500(C)
100 200 300 400 500 600 700 800 9000.0
0.1
0.2
0.3
0.4
0.5
0.6
0.7
0.8
0.9
1.0
1.1
1.2 300(C)
Vo
lta
ge
(V
)
Current density (mA cm2)
0
50
100
150
200
250
Po
we
r d
en
sit
y (
mW
cm
2)
400(C) 500(C)
(i) (ii)
(iii)

103
The decreased concentration of cobalt in the y = 0.04 composition clearly has a slight
detrimental effect on the performance of the SOFC electrode material. This is further
highlighted by the drop to zero voltage at 300 °C with the y = 0.04 composition (Figure 7),
and the non-zero value for the y = 0.03 materials. Furthermore, the observed power
densities were lower for the y = 0.04 composition, with values of 222.8 mW/cm2, 222.5
mW/cm2 and 222.6 mW/cm
2, for the samples calcined at 1000, 900, and 800 °C
respectively. Similar to the y = 0.03 composition, the samples with the y = 0.04
stoichiometry did show relatively stable performance for 3600 minutes.
However, it should be noted that a greater amount of cobalt, and less iridium, within these
SDC materials seems to decrease concentration polarzation losses. Liu et al. [17] reported
on micro-tubular SOFC systems with power densities of 50 mW/cm2 at 500 °C. Although
our current materials are a bit of an improvement on what has been reported, they still
showed a lower performance than our previous report of 400 mW/cm2 at 500 °C [18]. Thus
it would seem the removal of iron from the materials actually decreases performance.
3.6.2 Area specific resistance
Figure 8 shows the normalized area specific resistance (ASR) of the single cells for the
composites with y = 0.03 and 0.04. For each composition, the ASR decreased with an
increase in the SOFC test temperature. The area specific resistance can be related to the
material thickness and is a measure of the ionic and electronic conductivity [4]. The ASRs
are calculated from the slope of the substantial linear portion (in the centre) of the I-V
curve, where the Ohmic resistance is dominant [4]. The ASR is directly related to the
design of the cell, anode, electrolyte and cathode properties and the assembly process used
to make the single cell [4, 11]. The ASR values for the y = 0.03 (Figure 8 (A)) show some
slight differences between 300 to 500 C and this may imply the materials will have a
similar operational profile in a fully functional SOFC system. The ASR for the y = 0.04
composition (Figure 8 (B)) display some interesting variations. At the highest operating
temperatures, 500 °C, the sample calcined at 900 °C had the lowest ASR values. This can
be attributed to the mixed perovskite pyrochlore phase observed with the Raman analysis.

104
At the mid operating temperature in this study, 400 °C, the mixed phase materials have the
lower ASR, which are the materials with y = 0.04 calcined at 900 and 800 °C respectively.
It is only at the lowest temperature used to test SOFC viability did the sample calcined at
1000 °C have the lowest ASR. These observations suggest that the mixed phase materials
may have better oxygen ion conductivity at 500 °C, and 400 °C, and merits further
investigation.
The ASR values obtained in this work are compared with selected examples from the
literature, and the values are tabulated in Table 1. Using PrBaCo2O5+ x materials, Wang et
al. [20] reported on slightly lower ASR and power density values than those in the current
work, whereas Chen et al. [36] reported on a lower ASR, and a slightly lower power
density when compared to the best cathode in this work.
The lower ASR value in the work by Chen et al. [36] can be ascribed to the impregnation
technique used by the authors. Other examples with cobalt based cathode materials include
work by Peters et al. [37], Wang et al. [38] and Hayd et al. [19]. The higher ASR with the
work of Peters et al. is most likely due to the GCO/8YSZ electrolyte used, and the much
lower value with the work with Hayd et al. [19] can be due to the optimized microstructure
of the SOFC assembled in that body of work.

105
Figure 8: Panel (A) The Arrhenius plot of the ASR of the CSIC materials with y = 0.04 calcined at
(i) 1000 °C, (ii) 900 °C, and (iii) 800 °C. Panel (B) is a similar plot for the y = 0.03 materials
calcined at (i) 1000 °C, (ii) 900 °C, and (iii) 800 °C.
Figure 9 shows the SEM image of the button cell cross section before and after testing. The
electrolyte does show some porosity and this correlates well with the low OCV values
reported. However, one interesting aspect is the simple button cell assembly used in this

106
study produces comparable values, as shown in Table 1, and highlights that these cathode
materials can be optimized further in the SOFC assembly process.
Figure 9: SEM micrographs of the single cell of the material calcined at a 1000 °C (x = 0.03)
before (a) and after (a) cell testing at 500 °C.
Table 1: Comparison of the ASR values and power density obtained with the cathode materials
tested at 500 °C with selected materials from the literature.
ASR
(Ω cm2)
Power
Density
(W/cm2)
Cell Components References
Cathode Electrolyte Anode
0.54 0.20 PrBaCo2O5+ x SDC Ni-SDC 24
0.16 0.25 Impregnated
PrBaCo2O5+ x
SDC Ni-SDC 40
1.10 - La0.5Sr0.5CoO3-δ GCO/8YSZ Ni-SDC 41
0.60 - La0.5Sr0.5CoO3-δ GCO Ni-SDC 42
0.25 - La0.6Sr0.4CoO3-δ GCO Ni-SDC 23
0.79 0.24 Li-Ni-Co oxides SDC/Na2CO3 NiO 43
0.58 0.28 CSIC (1000 °C)
(y = 0.03)
SDC/Na2CO3 Ni-SDC This work
0.82 0.22 CSIC (1000 °C)
( y = 0.04)
SDC/Na2CO3 Ni-SDC This work
Cathode
Electrolyte
Anode
Cathode
Electrolyte
Anode

107
4.0 Conclusions
Sol gel technique was successfully adapted to synthesize a samarium doped ceria with
iridium and cobalt oxides. The powder XRD patterns did not show any distinct cobalt oxide
phases, but only samarium doped ceria and iridium oxide. The Raman data revealed that
these materials form complex oxide structures with perovskite, pyrochlore and defective
fluorite phases. The initial electrochemical tests showed slight differences in the maximum
power density for the different calcined samples. There were some small differences
between the different compositions, with the sample with the y = 0.03 composition calcined
at 800 °C having the highest power density of 287.6 mW/cm2 at 500 °C, and the sample
with y = 0.04 calcined at 1000 °C having a maximum power density of 222.7 mW/cm2 at
500 °C. The materials merit further investigation and optimisation studies using plasma
sintering, pore formers, thin electrolytes to improve the power density, and studies on their
performance with hydrocarbon based fuels should be carried out.
Acknowledgements
The authors thank the University of KwaZulu-Natal for a partial bursary support, ESKOM
- TESP and NRF South Africa (Thuthuka Grant No: 76318) for their support.
References
[1] A. Arabaci, Effect of Sm and Gd dopants on structural characteristics and ionic
conductivity of ceria, Ceram. Int., 2015, 41, 5836-5842.
[2] J. Liu, Z. Zhao, Y. Chen, C. Xu, A. Duan, G. Jiang, Different valent ions-doped cerium
oxides and their catalytic performances for soot oxidation, Catal. Today, 2011, 175, 117-
123.
[3] S. Wolf, R. Adam, L. Fuhrmann, S. A. Ansar, K. A. Friedrich, Characterization of
electrolyte layers of plasma-sprayed metal supported solid oxide fuel cells Solid State
Ionics, 2013, 243, 30-35.
108
[4] J. Hanna, W. Y. Lee, Y. Shi, A. F. Ghoniem, Fundamentals of electro-and
thermochemistry in the anode of solid-oxide fuel cells with hydrocarbon and syngas fuels,
Prog. Energy Combust. Sci., 2014, 40, 74-111.
[5] E. D. Wachsman, S. C. Singhal, Solid Oxide Fuel Cell Commercialization, Research
and Challenges, Electrochem. Soc. Interface, 2009, 18, 38-43.
[6] W. Tan, L. Fan, R. Raza, M. Ajmal Khan, B. Zhu, Studies of modified lithiated NiO
cathode for low temperature solid oxide fuel cell with ceria-carbonate composite
electrolyte, Int. J. Hydrogen Energy, 2013, 38, 370-376.
[7] Y. B. Go, A. J. Jacobson, Solid solution precursors to gadolinia-doped ceria prepared
via a low-temperature solution route, Chem. Mater., 2007, 19, 4702- 4709.
[8] K. T. Lee, E. D. Wachsman, Role of nanostructures on SOFC performance at reduced
temperatures, Mater. Res. Bull., 2014, 39, 783-791.
[9] C. Veranitisagul, A. Kaewvilai, W. Wattanathana, N. Koonsaeng, E. Traversa, A.
Laobuthee, Electrolyte materials for solid oxide fuel cells derived from metal complexes:
Gadolinia-doped ceria, Ceram. Int., 2012, 38, 2403-2409.
[10] W. Jiang, B. Wei, Z. Lü, Z. H. Wang, X. B. Zhu, L. Zhu, Co‐synthesis of
Sm0.5Sr0.5CoO3‐Sm0.2Ce0.8O1.9 composite cathode with enhanced electrochemical property
for intermediate temperature SOFCs, Fuel Cells, 2014, 14, 966-972.
[11] C. Li, H. Chen, H. Shi, M. O. Tade, Z. Shao, Green fabrication of composite cathode
with attractive performance for solid oxide fuel cells through facile inkjet printing, J. Power
Sources, 2015, 273, 465-471.
[12] T. Wu, R. Peng, C. Xia,Sm0.5Sr0.5CoO3−δ–BaCe0.8Sm0.2O3-δ composite cathodes for
proton-conducting solid oxide fuel cells, Solid State Ionics, 2008, 179, 1505-1508.
[13] K. Wang, R. Ran, W. Zhou, H. Gu, Z. Shao, J. Ahn, Properties and performance of
Ba0.5Sr0.5Co0.8Fe0.2O3−δ+Sm0.2Ce0.8O1.9 composite cathode, J. Power Sources, 2008,179, 60-
68.
[14] L. Nie, M. Liu, Y. Zhang, M. Liu, La0.6Sr0.4Co0.2Fe0.8O3−δ cathodes infiltrated with
samarium-doped cerium oxide for solid oxide fuel cells, J. Power Sources, 2010, 195,
4704-4708.

109
[15] V. Esposito, E. Traversa, Design of electroceramics for solid oxides fuel cell
applications: playing with ceria, J. Am. Ceram. Soc., 2008, 91, 1037-1051.
[16] N. Jaiswal, D. Kumar, O. Parkash, S. Upadhyay, Ca2+
and Sr2+
co-doped ceria/ carbon-
ates nanocomposites for low temperature solid oxide fuel cells: Composite effect, Ceram.
Int., 2015, 41, 15162-15169.
[17] J. Xiao, W. Sun, Z. Tao, Z. Zhu, W. Liu, Fabrication and electrochemical
characterization of anode‐supported microtubular solid oxide fuel cells based on
Ce0.8Sm0.2O2‐δ Electrolytes, Int. J. Appl. Ceram. Technol., 2012, 9, 1064-1070.
[18] C. B. Njoku, P. G. Ndungu, Synthesis and characterization of novel Ce0.8Sm0.2
Fe0.9Ir0.03Co0.07 O3−δ perovskite material and possible application as a cathode for low–
intermediate temperature SOFCs, Mater. Res. Bull., 2015, 68, 100-108.
[19] J. Hayd, L. Dieterle, U. Guntow, D. Gerthsen, E. Ivers-Tiffée, Nanoscaled
La0.6Sr0.4CoO3−δ as intermediate temperature solid oxide fuel cell cathode: Microstructure
and electrochemical performance, J. Power Sources, 2011, 196, 7263-7270.
[20] Y. Wang, H. Zhang, F. Chen, C. Xia, Electrochemical characteristics of nano-
structured PrBaCo2O5+x cathodes fabricated with ion impregnation process, J. Power
Sources, 2012, 203, 34-41.
[21] L. Zhang, R. Lan, A. Kraft, S. Tao, A stable intermediate temperature fuel cell based
on doped-ceria–carbonate composite electrolyte and perovskite cathode, Electrochem.
Commun., 2011,13, 582-585.
[22] H. Okkay, M. Bayramoglu, M. Faruk Öksüzömer, Ce0.8Sm0.2O1.9 synthesis for solid
oxide fuel cell electrolyte by ultrasound assisted co-precipitation method, Ultrason.
Sonochem., 2013, 20, 978-983.
[23] M. Guo, J. Lu, Y. Wu, Y. Wang, M. Luo, UV and visible raman studies of oxygen
vacancies in rare-earth-doped ceria, Langmuir, 2011, 27, 3872-3877.
[24] L. Li, F. Chen, J. Q. Lu, M. F. Luo, Study of defect dites in Ce1–xMxO2−δ (x = 0.2) solid
solutions using raman spectroscopy, J. Phys. Chem. A , 2011, 115, 7972-7977.
[25] M.Johnsson, P. Lemmens, Crystallography and chemistry of perovskites, Handbook of
magnetism and advanced magnetic materials (2007).

110
[26] D. Von Dreifus, A. J. A. de Oliveira, A. V. do Rosario, E. C. Pereira,Magnetic and
structural characterization of IrO2 and Co: IrO2 samples synthesized via pechini method, J
Supercond Nov Magn, 2013, 26, 2319-2321.
[27] H. C. Yao, X. L. Zhao, X. Chen, J. C. Wang, Q. Q. Ge, J. S. Wang, Z. J. Li, Processing
and characterization of CoO and Sm2O3 codoped ceria solid solution electrolyte, J. Power
Sources, 2012, 205, 180-187.
[28] A. Arabaci, Ö. Serin,Characterization of Sm-doped ceria ceramics synthesized by two
different methods, J. of Materi Eng and Perform, 2015, 24, 2730-2737.
[29] Y. Tao, J. Shao, J. Wang, W.G. Wang,Morphology control of Ce0.9Gd0.1O1.95
nanopowder synthesized by sol–gel method using PVP as a surfactant, J. Alloys Compd.,
2009, 484, 729-733.
[30] K. C. Anjaneya, G. P. Nayaka, J. Manjanna, G. Govindaraj, K. N. Ganesha,
Preparation and characterization of Ce1−xSmxO2−δ (x= 0.1– 0.3) as electrolyte material for
intermediate temperature SOFC, Solid State Sci., 2013, 26, 89-96.
[31] R. D. Waldron,Infrared spectra of ferrites, Phys. Rev., 1955, 99, 1727-1735.
[32] T. S. Nguyen, G. Postole, S. Loridant, F. Bosselet, L. Burel, M. Aouine, L. Massin, P.
Gelin, F. Morfin, L. Piccolo, Ultrastable iridium–ceria nanopowders synthesized in one step
by solution combustion for catalytic hydrogen production, J. Phys. Chem. A, 2014, 2,
19822-19832.
[33] T. Hasegawa, N. Ogita, K. Matsuhira, S. Takagi, M. Wakeshima, Y. Hinatsu, M.
Udagawa, Raman scattering study in iridium pyrochlore oxides, Journal of Physics:
Conference Series, 2010, 200, 012054.
[34] M. de los Reyes, K. R. Whittle, Z. Zhang, S. E. Ashbrook, M. R. Mitchell, L.Y. Jang,
G. R. Lumpkin, The pyrochlore to defect fluorite phase transition in Y2Sn2−xZrxO7, RSC
Adv., 2013, 3, 5090-5099.
[35] F. N. Sayed, V. Grover, K. Bhattacharyya, D. Jain, A. Arya, C. G. S. Pillai, A. K.
Tyagi, Sm2−xDyxZr2O7 pyrochlores: probing order−disorder dynamics and
multifunctionality, Inorg. Chem., 2011, 50, 2354-2365.
111
[36] D. Chen, R. Ran, K. Zhang, J. Wang, Z. Shao, Intermediate-temperature electro-
chemical performance of a polycrystalline PrBaCo2O5+δ cathode on samarium-doped ceria
electrolyte. J. Power Sources, 2009, 188, 96-105.
[37] C. Peters, A. Weber, E. Ivers-Tiffée,Nanoscaled (La0.5Sr0.5)CoO3−δ thin film cathodes
for SOFC application at 500 °C< T< 700 °C, J. Electrochem. Soc., 2008, 155, B730-B737.
[38] S. Wang, J. Yoon, G. Kim, D. Huang, H. Wang, A. J. Jacobson, Electrochemical
properties of nanocrystalline La0.5Sr0.5CoO3−x thin films, Chem. Mater., 2010, 22, 776-782.
112
CHAPTER 5
Synthesis and characterization of novel Ce0.8Sm0.2Fe0.9Ir0.03Co0.07O3-δ
perovskite material and possible application as cathode for low-
intermediate temperature SOFCs
Summary
This chapter has been published in Materials Research Bulletin and has been structured
according to the journal’s format. This chapter has also been reformatted to incorporate
further comments and corrections by the examiners.
Abstract
A novel perovskite material, Ce0.8Sm0.2Fe0.9Ir0.03Co0.07O3-δ was synthesized using a sol-
gel technique. The materials were calcined at temperatures of 800 °C, 900 °C, and
1000 °C. It was then characterized using X-ray diffraction, Raman and Infrared
spectroscopy, high resolution transmission electron microscopy and scanning electron
microscopy (SEM). The particle sizes and crystallite sizes increased with increasing
calcination temperature and formed perovskite type materials with some separate
Fe2O3, FeSmO2 and iridium oxide phases. The powders were used to assemble button
cells using samarium doped ceria as the electrolyte and NiO/SDC as the anode
materials. The electrochemical properties were investigated using a Fiaxell open
flanges test set-up and a Nuvant™ Powerstat-05 potentiostat/galvanostat. The
Ce0.8Sm0.2Fe0.9Ir0.03Co0.07O3-δ cathode material calcined at 1000 °C exhibited the most
promising performance, with a maximum power density of 0.400 W/cm2, a current
density of 0.8 A/cm2, and a corresponding area specific resistance of 0.247 Ω cm
2 at
500 °C. The button cells were reasonably stable over 15 hours.
Key words: A. Oxides, B. Chemical synthesis, C. Raman spectroscopy, X-ray diffraction,
D. Electrochemical properties.

113
1.0 Introduction
Solid oxide fuel cells (SOFCs) can be used as an alternative source of power generation.
The technology has several interesting features; such as, low to zero deleterious emissions,
proficient and adept generation processes. SOFCs have higher energy conversion
efficiencies and can be used for co-generation of heat and electricity as an added benefit
[1]. This has been drawing extensive attention for application in residential and commercial
properties, large-size stationary power facilities for suburban neighborhoods, auxiliary
power units for transportation vehicles [2 - 4] and with mobile applications where structural
sturdiness, thermal shock resistance with low internal temperature are essential [5, 6].
Great efforts have been made in the past years to reduce the operational temperature, the
cost of production and the plant component material hence the research drive to develop
SOFCs technologies for low-intermediate temperatures between 300 - 600 °C.
Low temperature SOFC performance can be enhanced by reducing the electrolyte thickness
and by developing new or alternative electrode materials with high ion and electronic
conductivity under reducing and oxidative conditions, and high catalytic activity for fuel
oxidation at relatively low temperatures [7 - 11] and to develop methods to minimize
energy losses in the system [12]. Other areas of research in reducing SOFC operational
temperatures includes the use of metal supported fuel cells and are beneficial due to its
minimal cost, high power, improved feasibility, superior thermal conductivity and faster
start-up time [13, 14].
In this study, porous composite of nickel oxide and samarium doped ceria was used as the
cermet anode, which contained a high volume fraction of Ni oxide to form the electronic
percolation path and expand the electrocatalytic active region in the electrode [15, 16].
Doped ceria was used as the electrolyte because of its compatibility with the cermet anode,
its high conductivity, mixed proton and oxygen ionic conductivityat low temperature
between (300 - 600 °C) [17 - 19]. Research reports on single cells using this electrolyte and
optimized electrodes, presented stable performance in 100 hrs non-stop measurement [20].
114
This study includes the addition of platinum group metals specifically iridium, whose use
as part of electrode materials are limited for example Huerta et al. [21], showed that the
electrochemical properties of iridium oxide on yttrium stabilized zirconia (YSZ) were
suitable for SOFC applications at the temperature range 573 – 873 K. In this study, a
composite of doped ceria (Ce0.8Sm0.2Fe0.9Ir0.03Co0.07O3-δ) was synthesized and tested as a
potential cathode material for SOFC. The perovskite nanocomposites was prepared using a
sol gel method, this technique is an adaptable and relatively simple method easily modified
to synthesize complex metal oxide formulations. The perovskite were further calcined at
800 – 1000 °C and the electrochemical performance was investigated using humidified
hydrogen and air as gases for the system.
2.0 Experimental Methods
2.1 Synthesis of Nanocrystalline Materials
Samarium (III) acetylacetonate hydrate (99.9 % purity), cobalt (II) acetylacetonate hydrate
(99 % purity),cerium (III) acetylacetonate hydrate (99.9 % purity), iron(III) acetylacetonate
(97 % purity) and Pluronic F-127 were purchased from Sigma-Aldrich (Pty) Ltd, South
Africa. Iridium (III) acetylacetonate hydrate (99.9 % purity), was purchased from Alfa
Aesar UK. These chemicals were used without further purification.
In a typical synthesis, 0.0758g of iridium (III) acetylacetonate hydrate (99.9 % purity),
1.3102 g of cerium (III) acetylacetonate hydrate (99.9 % purity), 1.1820 g of Iron (III)
acetylacetonate (99.9 % purity), 0.0930 g of Cobalt (II) acetylacetonate hydrate (99.9 %
purity), and 0.4640 g of samarium (III) acetylacetonate hydrate (99.9 % purity). Were
weighed and added into a mixture of 50 ml of ethanol and 15 ml of deionized water. Then
4.00 g of Pluronic F-127 was added to the mixture, and then the mixture was sonicated for
30 mins in an ultrasound bath (UMC 20, 50 kHz). The solution formed was then placed on
a hot plate and heated to 80 °C and stirred at 180 rpm for 30 minutes. The samples were
then dried for 18 hours in an oven at 200 °C and then calcined in a muffle furnace (Kittec
Squadro 1350) at a heating rate of 2 °C/min for 10 hours, to final temperatures of 800 °C,

115
900 °C, or 1000 °C. The Ce0.8Sm0.2Fe0.9Ir0.03Co0.07O3-δ (CSFIC) material formed was
then characterised before further use.
To synthesize the electrolyte, 0.200 g of samarium (III) acetylacetonate and 0.534 g of
cerium (III) acetylacetonate were mixed with a solution of ethanol (50 mL) and deionized
water (15 ml) in an ultrasound bath. After 30 minutes, the solution was heated on a
hotplate, while stirring, for 20 mins (120 rpm at 80 °C). Samples were then calcined at 850
°C for 5 hours at 2 °C/minute in a muffle furnace. The samarium doped ceria (SDC)
material formed was hand mixed with sodium carbonate (Na2CO3) in a mass ratio of 60:40
% to form SDC/Na2CO3 electrolyte.
2.2 Characterization
The structural properties of the perovskite nanocomposite were characterized using powder
X-ray diffraction (XRD), high resolution transmission electron microscopy (HR-TEM),
infrared and Raman spectroscopy, while the morphology was characterized using scanning
electron microscopy (SEM). The XRD patterns were obtained using Siemens D8 Advance
diffractometer with a Cu Kα radiation source operating at 40 kV and a wavelength of
1.5406 Å. For HRTEM analysis, small amounts of the samples were dispersed in ethanol
using an ultrasound bath, drop-dried onto a carbon coated copper TEM grid, and then
examined on a JOEL 2100 HRTEM (200 kV accelerating voltage, beam current of 110 µA
and a current density of 2.4 pA/cm2).
The powders were pressed onto carbon tape coated aluminium stubs and gold coated for
SEM observations on a ZEISS FEGSEM Ultra Plus. Infrared spectra were collected on a
Perkin Elmer 1200 FTIR and Raman analysis was done on a DeltaNu advantage 532™
Raman Spectrometer (100 mW Nd:YAG laser with an excitation wavelength of 532 nm).
The surface area, pore size, and pore volume were calculated from the nitrogen sorption
isotherms collected at 77 K, using a Micrometrics Tri-Star II 3030. The calcined materials
were degassed on a Micrometrics Flow Prep (060) under nitrogen flow at 90 °C for 1 hour
and 200 °C for 4 hours before analysis.

116
2.3 Single Cell fabrication
The cells were prepared by moulding the materials using a 20 ton press and a 1.3 cm
diameter die kit. The press was made from strong steel and the die kit was made from
stainless steel. For the CSFIC material, 0.1535 g of the sample was placed into the die kit
mould and 15 tons of pressure was then applied using the 20 ton press. A mass of 0.4500 g
of NiO-SDC was used to make the anode and 0.2100 g of SDC/Na2CO3 was used to
prepare the electrolyte using the same method. The discs had a total active area of 1.327
cm2. The electrolyte and anode discs were then heat treated to 1050 °C for 2 hours at a
heating rate of 5 °C/min, and the cathode materials to the sintering temperature used during
synthesis (e.g. materials calcined at 800 °C, were sintered at 800 °C), all without binders.
The electrolyte was estimated to be 0.03 mm thick, the cathode was 0.02 mm thick and the
anode was 0.045 mm thick.
2.4 Electrochemical Performance test
To test the electrochemical properties, the electrolyte disc was positioned between the
anode and cathode discs, and then placed in the open flange test set-up from Fiaxell SOFC
Technologies™. This set-up was designed for the cell sizes, and platinum meshes were
used as contact components, with the cell, to act as combined current collector and gas
distributor.The test-bed was placed in a Kittec Squadro muffle furnace and linked to
appropriate gas tight fittings for the delivery of humidified air and hydrogen gas to the cell.
The current and the voltage from the cells were measured with a Nuvant™ Powerstat 05
potentiostat and galvanostat. Polarization curves were recorded between 300 °C - 500 °C
with a fuel consisting of humidified hydrogen (4 – 20 % water) on the anode side and air on
the cathode side.
3.0 Results and Discussion
3.1 Raman Characterizations
The Raman spectra of the CSFIC perovskite material are shown in Figure 1 and have four
active Raman modes for the samples calcined at 1000 °C. The peak at 325 cm-1
is attributed
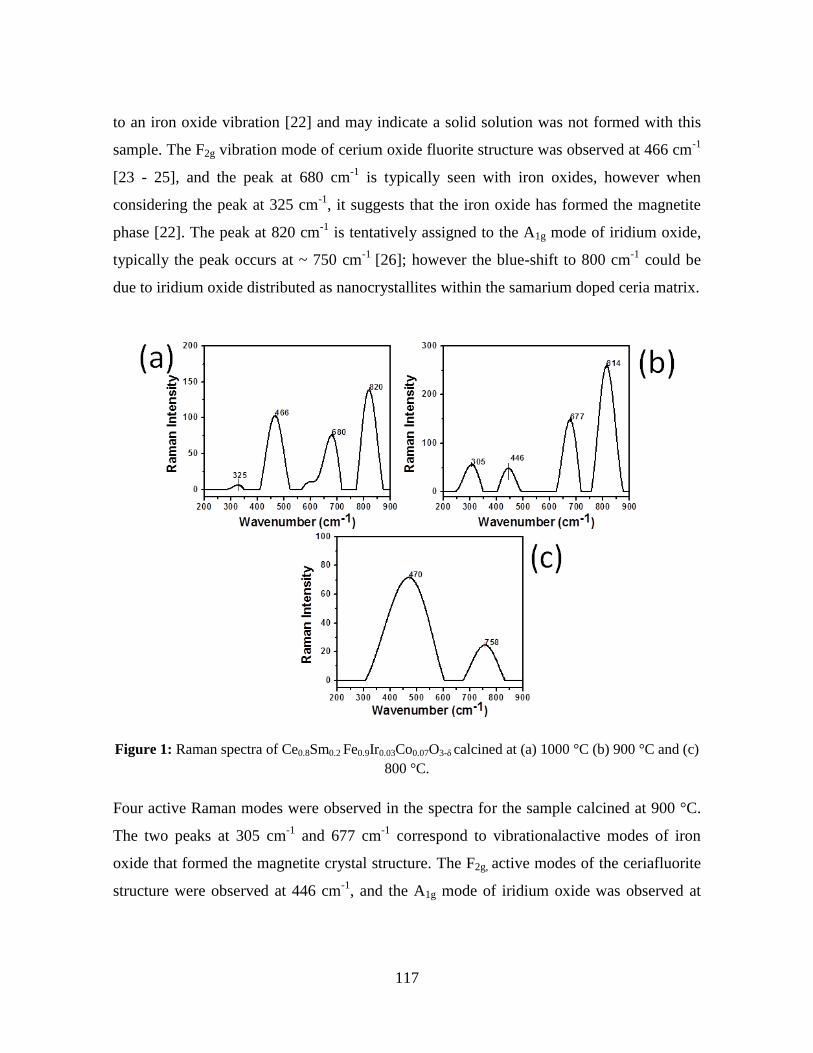
117
to an iron oxide vibration [22] and may indicate a solid solution was not formed with this
sample. The F2g vibration mode of cerium oxide fluorite structure was observed at 466 cm-1
[23 - 25], and the peak at 680 cm-1
is typically seen with iron oxides, however when
considering the peak at 325 cm-1
, it suggests that the iron oxide has formed the magnetite
phase [22]. The peak at 820 cm-1
is tentatively assigned to the A1g mode of iridium oxide,
typically the peak occurs at ~ 750 cm-1
[26]; however the blue-shift to 800 cm-1
could be
due to iridium oxide distributed as nanocrystallites within the samarium doped ceria matrix.
Figure 1: Raman spectra of Ce0.8Sm0.2 Fe0.9Ir0.03Co0.07O3-δ calcined at (a) 1000 °C (b) 900 °C and (c)
800 °C.
Four active Raman modes were observed in the spectra for the sample calcined at 900 °C.
The two peaks at 305 cm-1
and 677 cm-1
correspond to vibrationalactive modes of iron
oxide that formed the magnetite crystal structure. The F2g, active modes of the ceriafluorite
structure were observed at 446 cm-1
, and the A1g mode of iridium oxide was observed at

118
814 cm-1
. All the peaks at 900 °C are red-shifted when compared to the samples calcined at
1000 °C.
The perovskite material calcined at 800 °C exhibited two active bands at 472 cm-1
and 754
cm-1
which correspond to F2g active modes of ceria and the A1g mode of iridium oxide.
There was an observed shift in the Raman peaks of the materials, as the calcination
temperature increased, which corresponds to changes in the metal to oxygen bonds. Some
authors have noted when a larger ion like samarium substitutes for Ce4+
, the F2g active
modes of ceria will shift to lower values [24], and with our samples this is likely the case
with the samples calcined at 900 °C. At 800 °C and 1000 °C the Raman shifts to higher
values may indicate substitution of Ce4+
with smaller atomic mass cations (iron, cobalt, or
iridium) or some of the cerium in the +3 oxidation state. Further comments and correlations
on these observations are provided in the XRD section.
3.2 FTIR Analysis
Figure 2 shows the FTIR spectra of the CSFIC perovskite samples calcined at 800 °C, 900
°C, and 1000 °C. Absorbance peaks at 1508 cm-1
are attributed to C=O bonds from
carbonate impurities. Such residual carbon species have been observed before with
samarium doped ceria [27]. The peak at 1508 cm-1
was not present at higher calcination
temperatures (1000 °C) as a result of complete combustion. At all calcination temperatures,
the absorbance bands between 1000 - 1200 cm-1
are tentatively assigned to M-O-M bond
vibrations due to Ce-O-Fe, Ce-O-Co, Sm-O-Fe, or Sm-O-Co; however, previous work by
other authors has shown these bands can be due to M-OH bonds on the surface of iron ceria
oxide materials calcined at 673 K [28].
There was also a shift observed from 1021cm-1
– 1102 cm-1
for 800 °C to 1000 °C caused
by the M-O-M stretching vibration and the difference in the M+– O2
−– M
+ distances. The
peak observed at 972 cm-1
for samples calcined at 800 °C, 965 cm-1
for samples calcined at
900 and 1000 °C may be due to separate iron oxide phases dispersed in a ceramic matrix,
similar peaks have been observed in glasses containing iron and ceria [29].
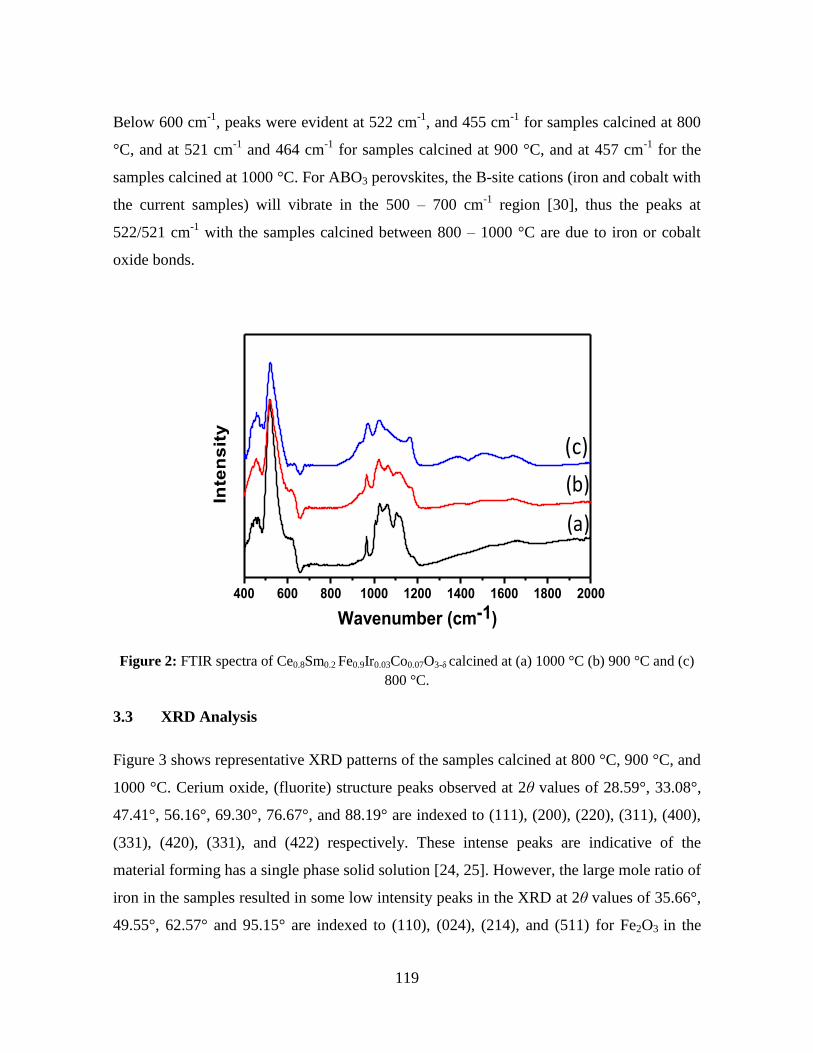
119
Below 600 cm-1
, peaks were evident at 522 cm-1
, and 455 cm-1
for samples calcined at 800
°C, and at 521 cm-1
and 464 cm-1
for samples calcined at 900 °C, and at 457 cm-1
for the
samples calcined at 1000 °C. For ABO3 perovskites, the B-site cations (iron and cobalt with
the current samples) will vibrate in the 500 – 700 cm-1
region [30], thus the peaks at
522/521 cm-1
with the samples calcined between 800 – 1000 °C are due to iron or cobalt
oxide bonds.
Figure 2: FTIR spectra of Ce0.8Sm0.2 Fe0.9Ir0.03Co0.07O3-δ calcined at (a) 1000 °C (b) 900 °C and (c)
800 °C.
3.3 XRD Analysis
Figure 3 shows representative XRD patterns of the samples calcined at 800 °C, 900 °C, and
1000 °C. Cerium oxide, (fluorite) structure peaks observed at 2θ values of 28.59°, 33.08°,
47.41°, 56.16°, 69.30°, 76.67°, and 88.19° are indexed to (111), (200), (220), (311), (400),
(331), (420), (331), and (422) respectively. These intense peaks are indicative of the
material forming has a single phase solid solution [24, 25]. However, the large mole ratio of
iron in the samples resulted in some low intensity peaks in the XRD at 2θ values of 35.66°,
49.55°, 62.57° and 95.15° are indexed to (110), (024), (214), and (511) for Fe2O3 in the
400 600 800 1000 1200 1400 1600 1800 2000
Inte
ns
ity
Wavenumber (cm-1)
(a)
(b)
(c)

120
magnetite crystal phase. This observation correlates with the Raman and FTIR
observations. Separate iron samarium oxide structure peaks were also noticed at 2θ values
of 40.89°, 58.93°, and 79.12° indexed to (022), (123), and (252) Miller indices.
Figure 3: The XRD diffractograms ofCe0.8Sm0.2 Fe0.9Ir0.03Co0.07O3-δ calcined at (a) 1000 °C (b) 900
°C and (c) 800 °C.
Iridium oxide peaks were not clearly identified since the peaks positions overlap with the
other phases identified, and the low stoichiometry used would imply a relatively low
intensity or formation of a solid solution with the samarium doped ceria. However, the
Raman peaks from 754 – 820 cm-1
did imply that the iridium oxide formed some separate
phases in the material.
For the CSFIC samples after calcination, the average lattice parameter for the predominant
CeO2 phase a is 5.372 0.44 Å, and the material is cubic was calculated by using the
equation:
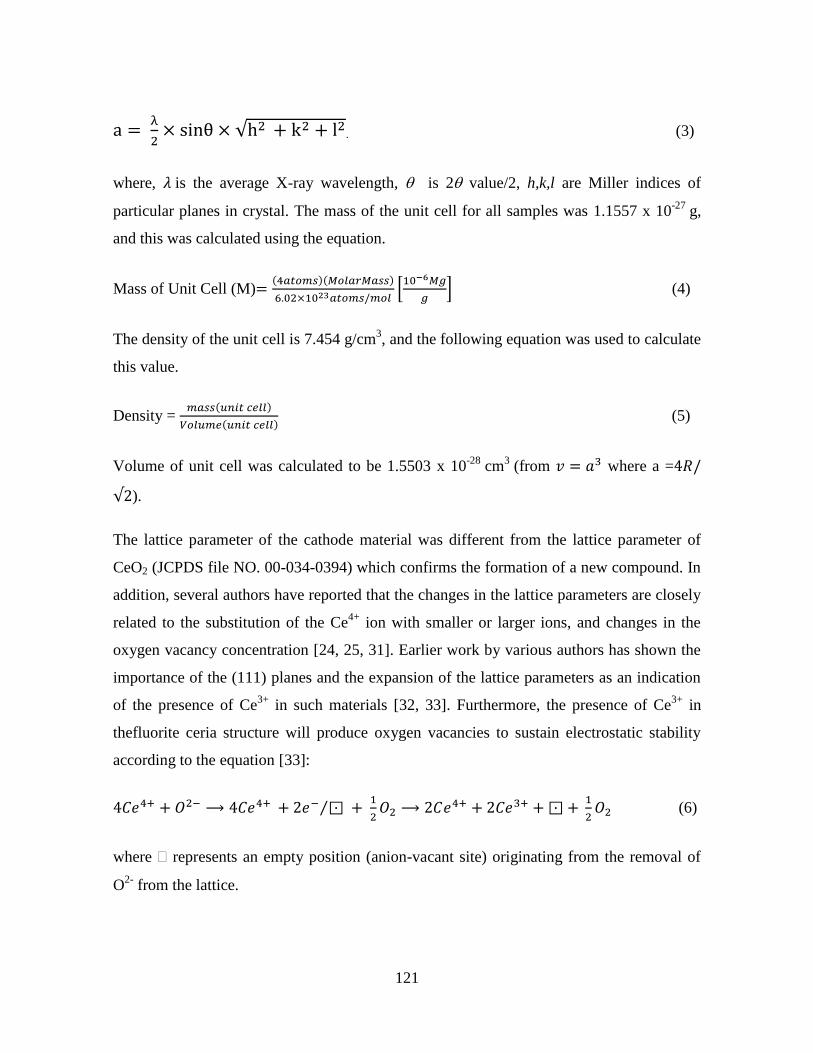
121
. (3)
where, is the average X-ray wavelength, is 2 value/2, h,k,l are Miller indices of
particular planes in crystal. The mass of the unit cell for all samples was 1.1557 x 10⁻²⁷
g,
and this was calculated using the equation.
Mass of Unit Cell (M)
(4)
The density of the unit cell is 7.454 g/cm3, and the following equation was used to calculate
this value.
Density =
(5)
Volume of unit cell was calculated to be 1.5503 x 10⁻²⁸
cm3
(from where a =
).
The lattice parameter of the cathode material was different from the lattice parameter of
CeO2 (JCPDS file NO. 00-034-0394) which confirms the formation of a new compound. In
addition, several authors have reported that the changes in the lattice parameters are closely
related to the substitution of the Ce4+
ion with smaller or larger ions, and changes in the
oxygen vacancy concentration [24, 25, 31]. Earlier work by various authors has shown the
importance of the (111) planes and the expansion of the lattice parameters as an indication
of the presence of Ce3+
in such materials [32, 33]. Furthermore, the presence of Ce3+
in
thefluorite ceria structure will produce oxygen vacancies to sustain electrostatic stability
according to the equation [33]:
(6)
where represents an empty position (anion-vacant site) originating from the removal of
O2-
from the lattice.

122
3.4 Thermogravimetric Analysis
Figure 4 shows the thermogravimetric analysis of the cathode material composite when
heated in air at 30 mL/min from 30 °C to 1000 °C at 10 °C/min. In the profile there was a
slow weight loss from 35 °C to 250 °C for the sample calcined at 1000 °C due to desorption
of carbon dioxide and a gradual weight loss from 250 °C to 900 °C. For the samples
calcined at 800 °C to 900 °C there was a gradual weight loss from 35 °C to 1000 °C
throughout the process. The weight changes of the samples were assumed to be mainly due
to the behaviour of lattice oxygen [34, 35], which can be represented by the equations [35]:
(7)
(8)
where and
represent an oxide ion vacancy and an oxide ion, respectively. In the
thermal profile the reactions of Co 4+
, Fe3+
and Ir4+
were more dominant in the sample [35,
36], because of the gradual weight loss. The weight losses were thermally induced by loss
of lattice oxygen which caused the formation of more oxygen vacancies. Furthermore, the
onset temperature of the lattice oxygen loss for the samples calcined at 800 °C and 900 °C
were lower than the samples calcined at 1000 °C and the weight loss of the samples
calcined at 800 °C and 900 °C were more than that calcined at 1000 °C. This could indicate
that the calcination temperature affects how the lattice oxygen can become more active at
lower process temperatures. Raman results did not reveal any magnetite peaks at 800 °C,
although XRD did show some phases at all calcination temperatures, thus the samples at
800 °C most likely had a significant amount of iron and cobalt substituted into the
samarium doped cerium lattice. Recent theoretical studies by Li et al. [37], showed that
more divalent ions substituted within the lattice of cerium oxide will reduce the mobility of
oxygen vacancies within the material.
At higher calcination temperatures the Raman and FTIR results clearly indicated separate
iron oxide phases and this would imply that the trivalent iron species is no longer within the
SDC lattice and the cobalt has remained substituted within the perovskite. As a result the
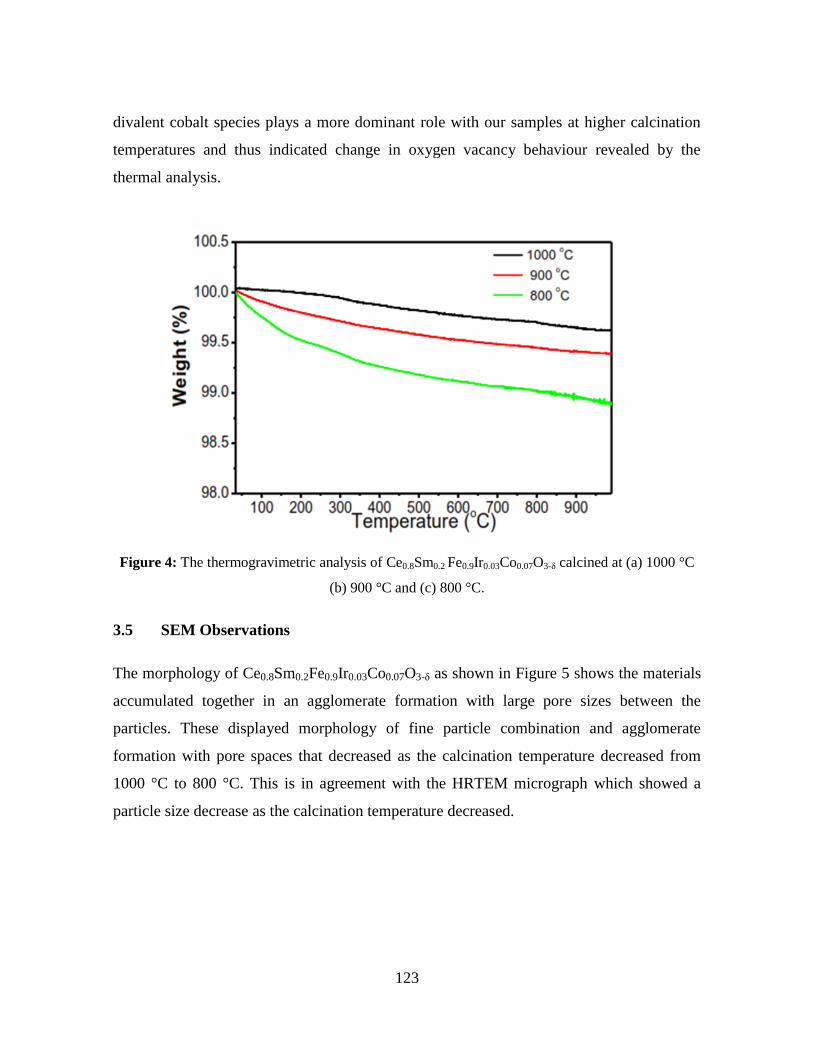
123
divalent cobalt species plays a more dominant role with our samples at higher calcination
temperatures and thus indicated change in oxygen vacancy behaviour revealed by the
thermal analysis.
Figure 4: The thermogravimetric analysis of Ce0.8Sm0.2 Fe0.9Ir0.03Co0.07O3-δ calcined at (a) 1000 °C
(b) 900 °C and (c) 800 °C.
3.5 SEM Observations
The morphology of Ce0.8Sm0.2Fe0.9Ir0.03Co0.07O3-δ as shown in Figure 5 shows the materials
accumulated together in an agglomerate formation with large pore sizes between the
particles. These displayed morphology of fine particle combination and agglomerate
formation with pore spaces that decreased as the calcination temperature decreased from
1000 °C to 800 °C. This is in agreement with the HRTEM micrograph which showed a
particle size decrease as the calcination temperature decreased.
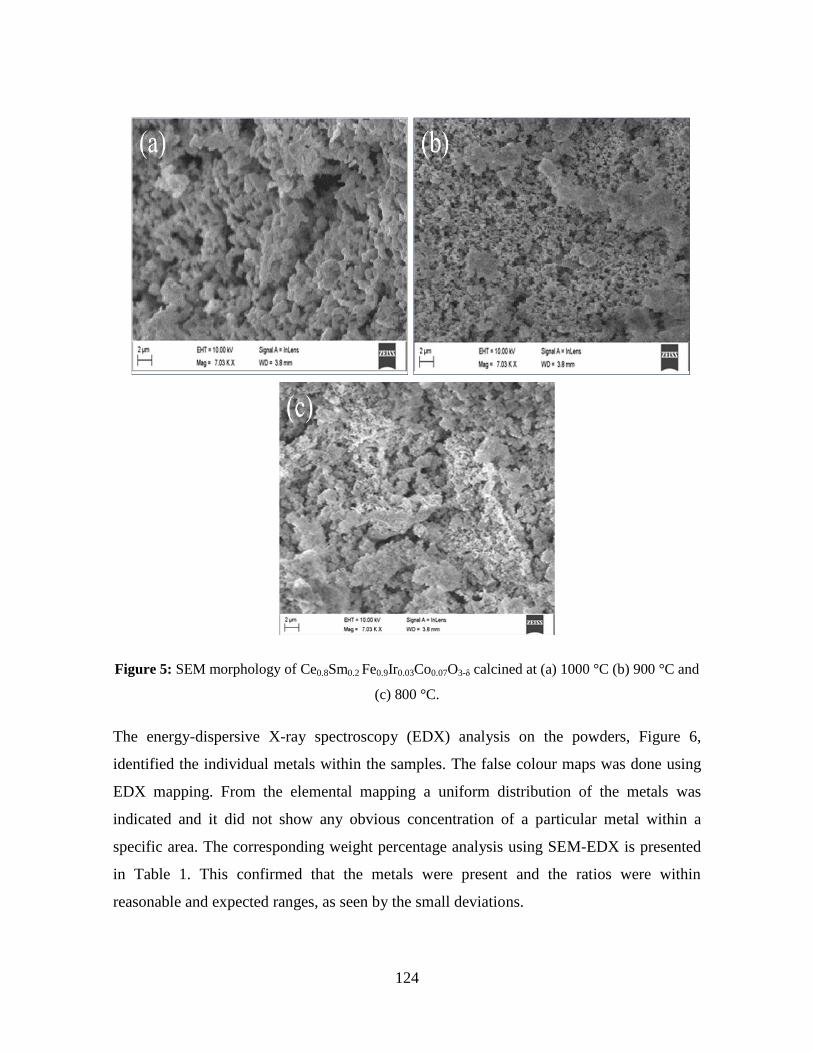
124
Figure 5: SEM morphology of Ce0.8Sm0.2 Fe0.9Ir0.03Co0.07O3-δ calcined at (a) 1000 °C (b) 900 °C and
(c) 800 °C.
The energy-dispersive X-ray spectroscopy (EDX) analysis on the powders, Figure 6,
identified the individual metals within the samples. The false colour maps was done using
EDX mapping. From the elemental mapping a uniform distribution of the metals was
indicated and it did not show any obvious concentration of a particular metal within a
specific area. The corresponding weight percentage analysis using SEM-EDX is presented
in Table 1. This confirmed that the metals were present and the ratios were within
reasonable and expected ranges, as seen by the small deviations.

125
Figure 6 : The EDX analysis of the representative sample calcined at 1000 °C.
Table 1: The SEM-EDX analysis results from a representative sample calcined at 1000 °C.
Element Measured (Wt %) Theoretical (Wt %)
Ce 46.38 44.78
Sm 17.85 12.01
Fe 17.00 20.08
Ir 1.26 1.65
Co 2.32 2.30
O 15.18 19.18

126
Figure 7: Imaging of Ce0.8Sm0.2 Fe0.9Ir0.03Co0.07O3-δ calcined at 1000 °C by EDX mapping.
3.6 HRTEM Observations
The various powders were examined by HRTEM, and representative images are presented
in Figures 8. The morphology for all the samples showed slight differences, specifically,
irregular shaped powders, especially, the samples calcined at 800 °C showed smaller
crystalline shapes. It was noted that the difference in the crystallite sizes were observed in
the XRD data which confirmed a decrease in crystal sizes as the calcination temperature
decreased from 1000 °C to 800 °C.

127
Figure 8: HRTEM Micrograph of Ce0.8Sm0.2 Fe0.9Ir0.03Co0.07O3-δ calcined at (a) 1000 °C (b) 900 °C
and (c) 800 °C.
The measured lattice distance between the fringes (inserted in Figure 8) were 0.134 nm
indexed to (400), 0.380 nm indexed to (211) and 0.125 nm indexed to (331) for 800 °C –
1000 °C samples respectively. These are linked to the XRD as Fe2O3 (magnetite) and CeO2
(fluorite) structures. The presence of CeO2 fluorite structure with the HRTEM observations,
correlate with the XRD analysis and indicates the samples have some concentration of
oxygen vacancies on the surface. The presence of oxygen vacanciesinfluences oxygen ion
diffusion paths through the electrode. The selected area electron diffraction patterns did not
show too much significant differences between the samples.
A3
(a) (b)
(c)

128
3.7 Textural Characterizations of the calcined Materials
The nitrogen sorption isotherm analysis on the samples at 800 C, 900 C and 1000 C are
shown in Figure 9. The sample calcined at 1000 C had the lowest surface area of 3.06
m2/g, the lowest average pore size (27.4 nm) and a low pore volume of 0.015 cm
3/g. The
surface area for the 900 C calcined samples was 6.56 m2/g, with an average pore size of
50.8 nm, and a pore volume of 0.068 cm3/g.
Figure 9: The thermogravimetric analysis of Ce0.8Sm0.2 Fe0.9Ir0.03Co0.07O3-δ calcined at (a) 1000 °C
(b) 900 °C and (c) 800 °C.
The materials observed in general, showed a decrease in the surface area as the calcination
temperature increased, the pore volume and pore size also increased. This is attributed to
the fact that the higher the calcination temperature the more compact the material becomes
hence the reduction of surface area with higher calcination temperature. Also heating to
high temperature might be too fast which causes agglomeration of the particles. In this case
it can be improved by changing the heating conditions.

129
3.8 Electrochemical Properties
3.8.1 Polarization Curves
The polarization curves for Ce0.8Sm0.2 Fe0.9Ir0.03Co0.07O3-δ calcined at 800 °C- 1000 °C are
shown in Figure 10. These were obtained in humidified hydrogen and compressed air in the
temperature interval of 300°C - 500°C.
Figure 10: The polarization curve of Ce0.8Sm0.2 Fe0.9Ir0.03Co0.07O3-δ calcined at (a) 1000 °C (b) 900
°C and (c) 800 °C.
The OCV values of the tested cells, as shown in Figure 10, decreased when measured from
300 – 500 °C and were stable at 0.87 V for more than 15 hours at 500 °C for all calcined
samples. This value is lower than the thermodynamic values calculated using the Nernst
equation, which can be attributed to the assembly and structure of the cell.
(a) (b)
(c)

130
Figure 11: The Open Cell Voltage of Ce0.8Sm0.2 Fe0.9Ir0.03Co0.07O3-δ calcined at 800 °C measured at
500 °C for 15 hours.
Gas crossover through the electrolyte can account for the lower OCV, and this can be due
to the cold powder compacting temperature used, which could leave residual pores and
result in leakage through any connected pores present. The polarization curves showed
slight changes for the different calcination temperatures and displayed a linear fall in the
voltage as the current densities increased. This is due to resistance to current flow within
the button cell. When current increases, the voltage drop increases as a result of kinetic and
ohmic losses within the cell. The power density increased with calcination temperatures.
This can be linked to the structural differences determined by XRD, HRTEM and Raman
spectroscopy. The presence of greater amount of oxygen vacancies, and Ce3+
within the
material framework can allow for improved oxygen reduction kinetics and maybe one of
the main reasons for the improved power density at 1000 °C.
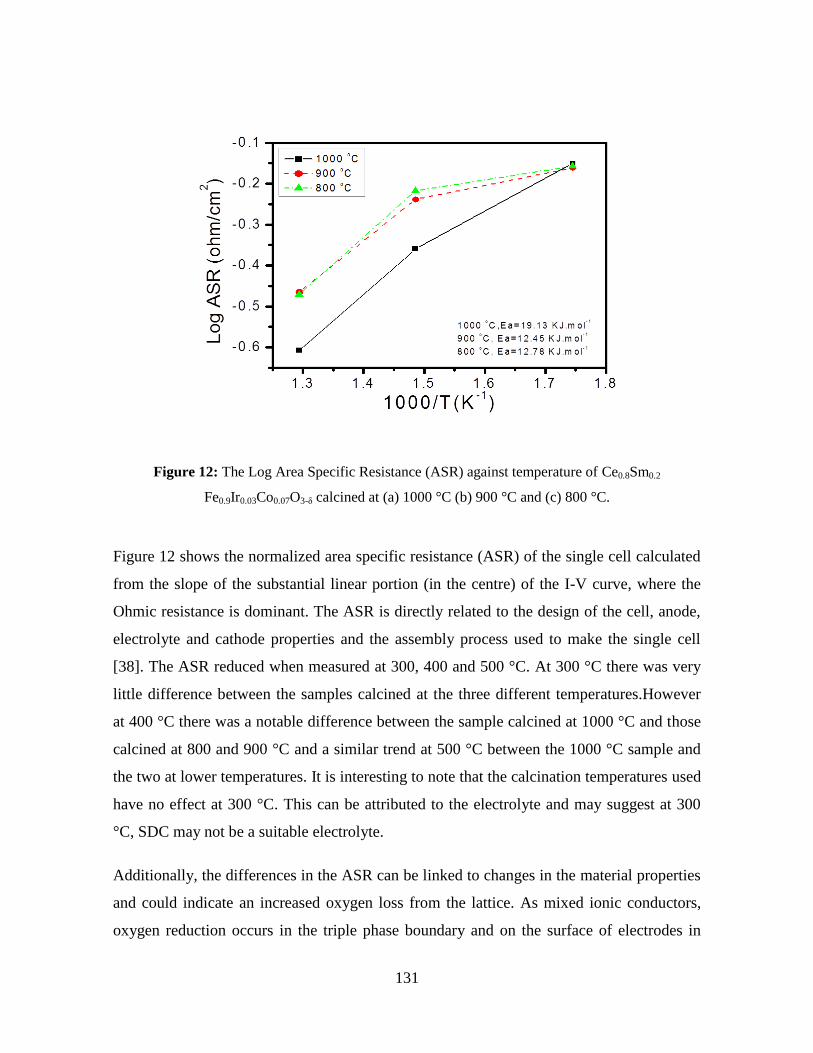
131
Figure 12: The Log Area Specific Resistance (ASR) against temperature of Ce0.8Sm0.2
Fe0.9Ir0.03Co0.07O3-δ calcined at (a) 1000 °C (b) 900 °C and (c) 800 °C.
Figure 12 shows the normalized area specific resistance (ASR) of the single cell calculated
from the slope of the substantial linear portion (in the centre) of the I-V curve, where the
Ohmic resistance is dominant. The ASR is directly related to the design of the cell, anode,
electrolyte and cathode properties and the assembly process used to make the single cell
[38]. The ASR reduced when measured at 300, 400 and 500 °C. At 300 °C there was very
little difference between the samples calcined at the three different temperatures.However
at 400 °C there was a notable difference between the sample calcined at 1000 °C and those
calcined at 800 and 900 °C and a similar trend at 500 °C between the 1000 °C sample and
the two at lower temperatures. It is interesting to note that the calcination temperatures used
have no effect at 300 °C. This can be attributed to the electrolyte and may suggest at 300
°C, SDC may not be a suitable electrolyte.
Additionally, the differences in the ASR can be linked to changes in the material properties
and could indicate an increased oxygen loss from the lattice. As mixed ionic conductors,
oxygen reduction occurs in the triple phase boundary and on the surface of electrodes in
132
this system which results from the increase in ionic conductivity of the electrodes. The
Oxygen absorbed is reduced to O2 ions and diffuses faster towards the electrode/electrolyte
and electrolyte interface as influenced by increase in O2 vacancies. The increase in the
oxygen diffusion leads to a reduction in ASR [39]. The change in porosity, surface area,
and pore volume with calcination temperature, and the overall morphology of the materials
will affect transport properties at the phase boundary. In this regard, the 1000 °C
calcination temperature is optimum for the materials reported here, and reduces the ASR
slightly when compared to the other calcination temperatures. Shin et al. [40], reported on
similar results, and found that with their samarium based materials for IT-SOFCs, the triple
phase boundary and necking structure was optimal at 1000 °C.
3.8.2 Power Density
The maximum power density for Ce0.8Sm0.2Fe0.9Ir0.03 Co0.07O3-δ samples calcined at 800°C,
900 °C and 1000 °C are shown in Table 2. The power density resultswere taken from 300
°C-500 °C. The maximum Power densities at 300 °C was 221.22 mW/cm2 and at 400 °C
was 330.16 mW/cm2 and 500 °C was 400.15 mW/cm
2. The highest power density was
exhibited by Ce0.8Sm0.2Fe0.9Ir0.03Co0.07O3-δ perovskite calcined at 1000 °C, when measured
at 500 °C and it portrayed a low area specific resistance.
At each test temperature, the samples calcined at 1000 °C had the largest power density.
However there was a marginal difference at 300 °C, a larger difference at 400 °C, and a
small difference at 500 °C. These results could have some implications for applications at
300 or 500 °C, were the calcination of the materials can be done at somewhat reduced
temperatures of 800 °C instead of 1000 °C using organic-metallic precursors in a sol-gel
process.
Another key implication from our results is the moderate power output from a non-ideal
single cell. Improvements can be achieved by using thin electrolyte and cathode layers and
using tape casting or dip coating methodologies to control and optimise adhesion between
the layers.
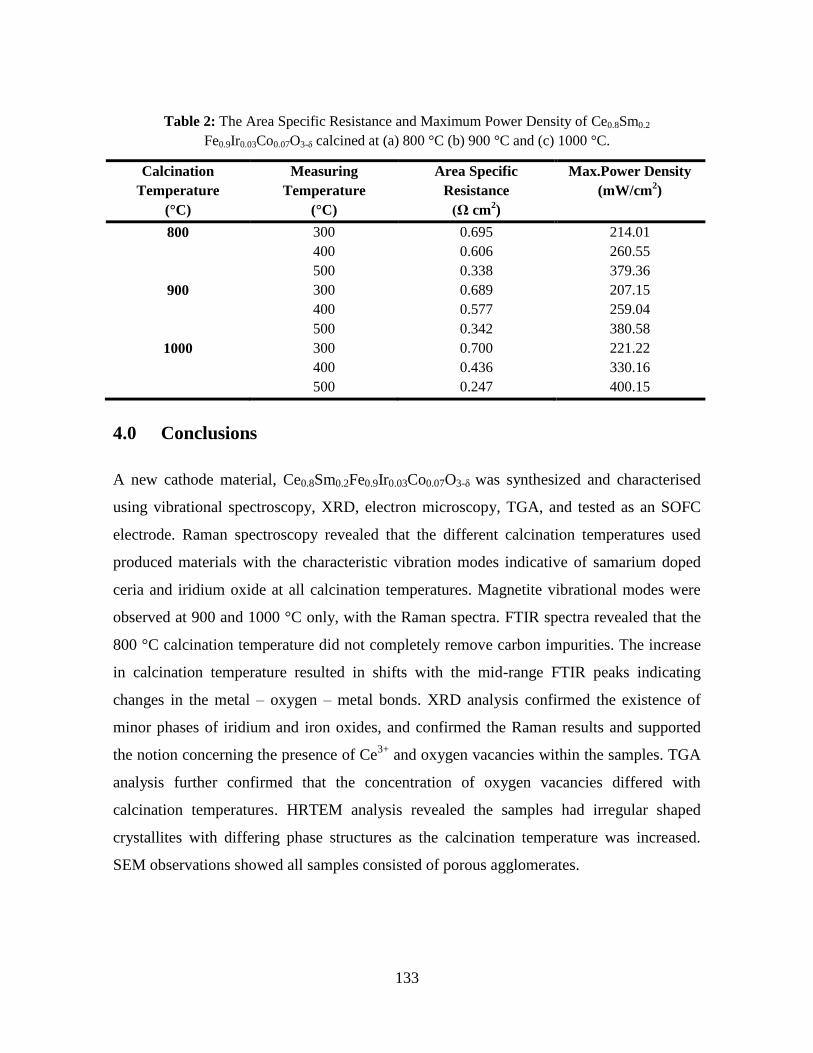
133
Table 2: The Area Specific Resistance and Maximum Power Density of Ce0.8Sm0.2
Fe0.9Ir0.03Co0.07O3-δ calcined at (a) 800 °C (b) 900 °C and (c) 1000 °C.
Calcination
Temperature
(°C)
Measuring
Temperature
(°C)
Area Specific
Resistance
(Ω cm2)
Max.Power Density
(mW/cm2)
800 300 0.695 214.01
400 0.606 260.55
500 0.338 379.36
900 300 0.689 207.15
400 0.577 259.04
500 0.342 380.58
1000 300 0.700 221.22
400 0.436 330.16
500 0.247 400.15
4.0 Conclusions
A new cathode material, Ce0.8Sm0.2Fe0.9Ir0.03Co0.07O3-δ was synthesized and characterised
using vibrational spectroscopy, XRD, electron microscopy, TGA, and tested as an SOFC
electrode. Raman spectroscopy revealed that the different calcination temperatures used
produced materials with the characteristic vibration modes indicative of samarium doped
ceria and iridium oxide at all calcination temperatures. Magnetite vibrational modes were
observed at 900 and 1000 °C only, with the Raman spectra. FTIR spectra revealed that the
800 °C calcination temperature did not completely remove carbon impurities. The increase
in calcination temperature resulted in shifts with the mid-range FTIR peaks indicating
changes in the metal – oxygen – metal bonds. XRD analysis confirmed the existence of
minor phases of iridium and iron oxides, and confirmed the Raman results and supported
the notion concerning the presence of Ce3+
and oxygen vacancies within the samples. TGA
analysis further confirmed that the concentration of oxygen vacancies differed with
calcination temperatures. HRTEM analysis revealed the samples had irregular shaped
crystallites with differing phase structures as the calcination temperature was increased.
SEM observations showed all samples consisted of porous agglomerates.
134
Polarization curves for the various samples revealed that the sample calcined at 1000 °C
produced the maximum power density of 400.15 mW/cm2 at 500 °C and had an area
specific resistance of 0.247 Ω cm2. The results show that this can be a very promising
material for SOFC cathodes operating at low – intermediate temperatures. Further
improvement in terms of electrochemical performance can be achieved using advanced
assembly processes such as spark sintering techniques or conventional tape casting
methodologies.
Acknowledgements
The authors thank the University of KwaZulu-Natal, for providing access to research
facilities used in this research. ESKOM-TESP and NRF of South Africa (Thuthuka
programme, Grant No: 76318) for research funds.
References
[1] P. Pramote, M. Hiroki, M. Toshiaki, E. Koichi, Journal of Power Sources, 204
(2012) 67 - 73.
[2] F. Liangdong, Z. Bin, C. Mingming, W. Chengyang, R. Rizwan, Q. Haiying, W.
Xuetao, W. Xiaodi, M. Ying, Journal of Power Sources, 203 (2012) 65 - 71.
[3] A. Atkinson, S. Barnett, R.J. Gorte, J.T.S. Irvine, A.J. McEvoy, M. Mogensen,
S.C. Singhal, J. Vohs, Nat Mater, 3 (2004) 17 - 27.
[4] W. Sea-Fue, H. Yung-Fu, L. Wan-Ju, K. Kiyoshi, Solid State Ionics, 247 – 248
(2013) 48 - 55.
[5] T. Chun-Huang, H. Chang-sing, C. Chun-Liang, Y. Jen-Feng, N. Sheng-Hui,
Journal of Power Sources, 197 (2012) 145 - 153.
[6] H. Rob, B. Jörg Oberste, D. P. Cyrille, Q. Wei, Y. Sing, L. Jean-Gabriel, M.
Christian, Journal of Power Sources, 191 (2009) 371 - 376.
[7] J. Jiangwei, C. Fanglin, X. Changrong, Electrochimica Acta, 136 (2014) 422 - 429.
[8] J. D. Nicholas, S. A. Barnett, Journal of the Electrochemical Society, 157 (2010)
B536 - B541.
[9] J. C. Ruiz-Morales, J. Canales-Vázquez, D. Marrero-López, J. T. S. Irvine, P.
Núñez, Electrochimica Acta, 52 (2007) 7217 - 7225.
135
[10] T. Ikebe, H. Muroyama, T. Matsui, K. Eguchi, Journal of the Electrochemical
Society, 157 (2010) B970 - B974.
[11] J. T. Vaughey, J. R. Mawdsley, T. R. Krause, Materials Research Bulletin, 42
(2007) 1963 - 1968.
[12] R. Vaßen, D. Hathiramani, J. Mertens, V.A.C. Haanappel, I.C. Vinke, Surface and
Coatings Technology, 202 (2007) 499 - 508.
[13] W. Zhenwei, B. Jörg Oberste, Y. Sing, D. P. Cyrille, Q. Wei, H. Rob, M. Radenka,
G. Dave, Journal of Power Sources, 176 (2008) 90 - 95.
[14] C.T. Michael, Y.L. Grace, P.J. Craig, C.D. Lutgard, J.V. Steven, Journal of Power
Sources, 175 (2008) 447 - 451.
[15] F. P. R. Nielson, M. V. M. S. Mariana, R. M. N. Octávio, M. R. V. Sônia, S.
Martin, Applied Catalysis A: General, 353 (2009) 305 - 309.
[16] H. Kishimoto, Y. P. Xiong, K. Yamaji, T. Horita, N. Sakai, M.E. Brito, H.
Yokokawa, Journal of Chemical Engineering of Japan, 40 (2007) 1178 - 1182.
[17] F. Liangdong, W. Chengyang, C. Mingming, D. Jing, Z. Jiaming, Z. Bin,
International Journal of Hydrogen Energy, 36 (2011) 9987 - 9993.
[18] W. Xiaodi, M. Ying, R. Rizwan, M. Mamoun, Z. Bin, Electrochemistry
Communications, 10 (2008) 1617 - 1620.
[19] L. Seung-Hwan, K. Hong-Ki, K. Seung-Hyun, L. Sung-Gap, L. Young-Hie,
Materials Research Bulletin, 58 (2014) 195 - 198.
[20] Z. Lei, L. Rong, K. Arno, T. Shanwen, Electrochemistry Communications, 13
(2011) 582 - 585.
[21] A. M. Torres-Huerta, J. R. Vargas-García, M. A. Domínguez-Crespo, Solid State
Ionics, 178 (2007) 1608 - 1616.
[22] M. Hanesch, Geophysical Journal International, 177 (2009) 941 - 948.
[23] N. Chaubey, B. N. Wani, S. R. Bharadwaj, M. C. Chattopadhyaya, Solid State
Sciences, 20 (2013) 135-141.
[24] K. Kuntaiah, P. Sudarsanam, B. M. Reddy, A. Vinu, RSC Advances, 3 (2013)
7953 - 7962.
136
[25] L. Li, F. Chen, J. Q. Lu, M. F. Luo, The Journal of Physical Chemistry A, 115
(2011) 7972 - 7977.
[26] A. V. Korotcov, Y. S. Huang, K. K. Tiong, D. S. Tsai, Journal of Raman Spectro
scopy, 38 (2007) 737 - 749.
[27] A. Kaddouri, S. Bassil, B. Béguin, P. Gélin, Journal of Sol-gel Science &
Technology, 67 (2013) 175 - 181.
[28] B. Chen, Z. Zhu, Y. Guo, Y. Qiu, J. Zhao, Journal of Colloid and Interface
Science, 398 (2013) 142-151.
[29] D. P. Singh, G. Pal Singh, Journal of Alloys and Compounds, 546 (2013) 224 -
228.
[30] C. Zeng, Y. He, C. Li, Y. Xu, Ceramics International, 39 (2013) 5765 - 5769.
[31] M. Guo, J. Lu, Y. Wu, Y. Wang, M. Luo, Langmuir, 27 (2011) 3872 - 3877.
[32] L. Chen, P. Fleming, V. Morris, J. D. Holmes, M. A. Morris, The Journal of
Physical Chemistry C, 114 (2010) 12909-12919.
[33] X. Liu, K. Zhou, L. Wang, B. Wang, Y. Li, Journal of the American Chemical
Society, 131 (2009) 3140 - 3141.
[34] A. Botea-Petcu, S. Tanasescu, V. Varazashvili, N. Lejava, T. Machaladze, M.
Khundadze, F. Maxim, F. Teodorescu, J. Martynczuk, Z. Yáng, L. J. Gauckler,
Materials Research Bulletin, 57 (2014) 184 - 189.
[35] L. Shuyan, L. Zhe, H. Xiqiang, W. Bo, S. Wenhui, Solid State Ionics, 178 (2007)
417 - 422.
[36] S. Zongping, X. Guoxing, T. Jianghua, D. Hui, Y. Weishen, Separation and
Purification Technology, 25 (2001) 419 - 429.
[37] Z. P. Li, T. Mori, J. Zou, J. Drennan, Materials Research Bulletin, 48 (2013) 807 -
812.
[38] U.F.C. Council, in: U.F.C.C.s.S.O.F.C.F. Group (Ed.), Washington DC, 2007.
[39] Z. Wenxia, L. Zhe, L. Shuyan, W. Bo, M. Jipeng, H. Xiqiang, C. Kongfa, A. Na,
S. Wenhui, Journal of Alloys and Compounds, 465 (2008) 274 - 279.
[40] I. Park, J. Choi, H. Lee, D. Shin, Ceramics International, 39 (2013) 5561 - 5569.

137
CHAPTER 6
Evaluation of novel nanophase Ce0.8Sr0.2Fe0.9Ir0.1O3-δ as cathode material
for low temperature SOFC
Summary
This chapter has been accepted by “Nanomaterials for Electrocatalysis and Electrochemical
Energy Applications” and has been structured according to the journal’s format. This
chapter has also been reformatted to incorporate further comments and corrections by the
examiners
Abstract
In this study, Ce0.8Sr0.2Fe0.9Ir0.1O3-δ (CSFI) perovskite type material was prepared by sol-gel
technique, characterised, and then tested as a cathode material for solid oxide fuel cells
operating between 300 – 500 °C. The materials were studied using X-ray diffraction,
Raman spectroscopy, Fourier transform infrared spectroscopy and thermogravimetric
analysis. The morphology was examined using scanning electron microscopy and high
resolution transmission electron microscopy. Samples showed changes in the overall
structure and defect chemistry with an increase in calcination temperature. When tested as
cathode materials, the material calcined at 1000 °C had the greatest performance at a test
temperature of 500 °C, with a current density of 774.47 mA/cm2, a power density of
483.07 mW/cm2 and an area specific resistance (ASR) of 0.342 Ω cm
2.
Keywords: Solid Oxide Fuel Cell, cerium oxide, Iridium oxide, perovskites, nano-
composites.

138
1.0 Introduction
Reduction in the operating temperature of Solid Oxide Fuel Cells (SOFCs) has been an
important area of research for a long time, because operating at high temperatures, over 800
°C, limits the use of SOFCs [1 - 4]. The advantages of operating SOFCs at low
temperatures include the reduction in cost, extension in the range of material selection and
a significant improvement in the operational lifespan of the system.
Various researchers have used mixed ionic and electronic conductors (MIECS) type
materials to reduce the operating temperature of SOFCs. The utilization of MIECs expands
the active electrochemical reaction sites from the traditional triple phase boundary (TPB) at
the solid electrolyte and electronic conductor electrode interface to the entire MIEC gas
interface [5]. One major perovskite and MIEC combination, is (LaSr)(CoFe)O3-δ (LSCF)
perovskite, which has been investigated as a cathode material operating at intermediate
temperatures with high catalytic activity promoted by rapid surface exchange kinetics [6].
Shao and Halle et al used strontium and iron in Ba0.5Sr0.5Co0.8Fe0.2O3-δ (BSCF) cathode
material at low temperature and it exhibited a high power output because of its high rate of
oxygen diffusion [7]. Zhu et al. [8] made composite cathodes of Ba0.5Sr0.5Co0.8Fe0.2O3−δ–x
Sm0.5Sr0.5CoO3−δ and tested them with samarium doped ceria electrolytes, and found the
performance was excellent at 550 °C due to excellent electronic conductivity and a high
concentration of oxygen vacancies. Colomer et al. [9] substituted cerium to make Sr0.8Ce0.2
Fe0.7Co0.3O3−δ cathode materials which showed enhanced oxygen ion diffusion and better
cathodic performance when compared with LSCF at 700 °C.
In this study, sol-gel method was developed to synthesize the cathode perovskite material
Ce0.8Sr0.2Fe0.9Ir0.1O3-δ (CSFI). Sol-gel processes are reliable techniques that are recurrently
used to produce oxide ceramic materials with controlled structure and composition for
SOFC application. This technique was also applied in the fabrication of the anode and
electrolyte used in this study. Porous composite of nickel oxide and samarium doped ceria
(NiO/SDC) was used as the anode, this contained a high volume fraction of nickel oxide to
SDC in the ratio 60:40 %. This aids in the formation of electronic percolation pathways and
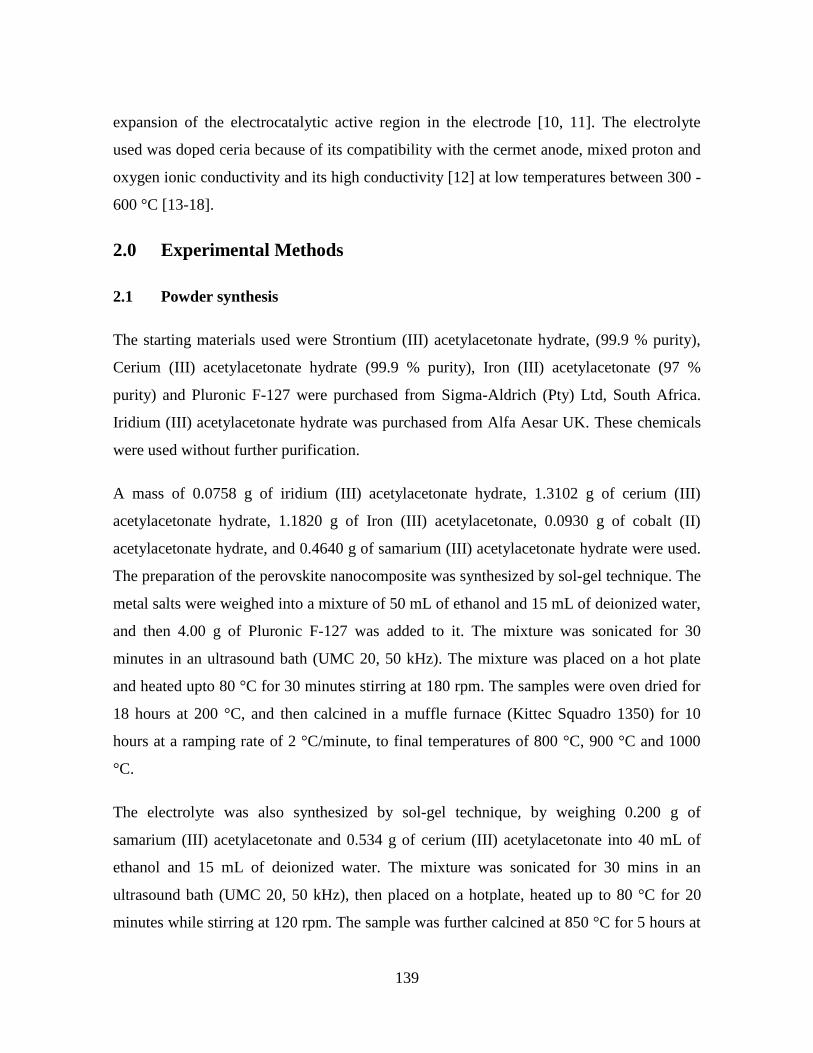
139
expansion of the electrocatalytic active region in the electrode [10, 11]. The electrolyte
used was doped ceria because of its compatibility with the cermet anode, mixed proton and
oxygen ionic conductivity and its high conductivity [12] at low temperatures between 300 -
600 °C [13-18].
2.0 Experimental Methods
2.1 Powder synthesis
The starting materials used were Strontium (III) acetylacetonate hydrate, (99.9 % purity),
Cerium (III) acetylacetonate hydrate (99.9 % purity), Iron (III) acetylacetonate (97 %
purity) and Pluronic F-127 were purchased from Sigma-Aldrich (Pty) Ltd, South Africa.
Iridium (III) acetylacetonate hydrate was purchased from Alfa Aesar UK. These chemicals
were used without further purification.
A mass of 0.0758 g of iridium (III) acetylacetonate hydrate, 1.3102 g of cerium (III)
acetylacetonate hydrate, 1.1820 g of Iron (III) acetylacetonate, 0.0930 g of cobalt (II)
acetylacetonate hydrate, and 0.4640 g of samarium (III) acetylacetonate hydrate were used.
The preparation of the perovskite nanocomposite was synthesized by sol-gel technique. The
metal salts were weighed into a mixture of 50 mL of ethanol and 15 mL of deionized water,
and then 4.00 g of Pluronic F-127 was added to it. The mixture was sonicated for 30
minutes in an ultrasound bath (UMC 20, 50 kHz). The mixture was placed on a hot plate
and heated upto 80 °C for 30 minutes stirring at 180 rpm. The samples were oven dried for
18 hours at 200 °C, and then calcined in a muffle furnace (Kittec Squadro 1350) for 10
hours at a ramping rate of 2 °C/minute, to final temperatures of 800 °C, 900 °C and 1000
°C.
The electrolyte was also synthesized by sol-gel technique, by weighing 0.200 g of
samarium (III) acetylacetonate and 0.534 g of cerium (III) acetylacetonate into 40 mL of
ethanol and 15 mL of deionized water. The mixture was sonicated for 30 mins in an
ultrasound bath (UMC 20, 50 kHz), then placed on a hotplate, heated up to 80 °C for 20
minutes while stirring at 120 rpm. The sample was further calcined at 850 °C for 5 hours at
140
a heating rate of 2 °C/minute in a muffle furnace (Kittec Squadro 1350). The SDC material
formed was hand mixed with sodium carbonate (Na2CO3) in the ratio of 60:40 %.
2.2 Characterization
The structural characteristics of the perovskite nanocomposite were characterized using
high resolution transmission electron microscopy, powder X-ray diffraction (XRD),
infrared and Raman spectroscopy, while the morphology was characterized using scanning
electron microscopy. Small amount of the samples for the HR-TEM analysis, were poured
in ethanol and sonicated for 5 minutes. It was then drop-dried onto a carbon coated copper
TEM grid and then examined on a JOEL 2100 HRTEM (200kV accelerating voltage, beam
current of 110 µA and a current density of 2.4 pA/cm2). The XRD patterns were obtained
using Siemens D8 Advance diffractometer with a Cu Kα radiation source operating at 40
kV and a wavelength of 1.5406 Å. Powders were pressed onto carbon tape placed onto
aluminium stubs and then gold coated for SEM observations on a ZEISS FEGSEM Ultra
Plus. The infrared spectra were collected on a Perkin Elmer 1200 FTIR and the Raman
analysis was done on a DeltaNu advantage 532™ Raman spectrometer (100 mW Nd:YAG
laser with an excitation wavelength of 532 nm). The thermogravimetric analysis (TGA)
was done using a Perkin Elmer simultaneous thermal analyser STA 6000.
2.3 Button cell fabrication
The asymmetric cell was prepared by weighing out 0.1535 g of the cathode material, and
0.2100 g of SDC/Na2CO3 into a 1.3 cm die kit, and then applying 15 Ton pressure. The
cylindrical pellet disc had a diameter of approximately 13 mm and 300 micrometre
thickness (100 micrometre cathode and 200 micrometer electrolyte). It was then heated
gently at 300 °C for 2 hrs at 5 °C/min to densify the cell.
2.4 Electrochemical performance test
The cell was tested in a Kittec Squadro muffle furnace from Fiaxell SOFC technologies. In
this set-up, platinum meshes were used as contacts, with the cell, to act as combined current

141
collector and gas distributor. Humidified hydrogen and compressed air were passed through
gas tight fittings, attached to the set up for the delivery of the gases to the cell. The current
and the voltage from the cells were then measured with a Nuvant™ Powerstat 05
potentiostat and galvanostat. The measurements were carried out at temperatures between
300 - 500 °C. The ionic conductivity was calculated using the following equations [19]:
(1)
where, l is the electrolyte thickness, S is electrode area of the electrolyte surface and R is
resistance in ohms (cell resistance).
(2)
where, R is the resistance (ASR), k is conductivity, l is the electrolyte thickness and A is
surface area [19].
(3)
where, Ea is activation energy of conduction, T is absolute temperature, σo is pre-
exponential factor and k is the Boltzmann Constant [19]. The Polarization curves were
recorded between 300 - 500 °C with a fuel consisting of hydrogen and 4 - 20 % of water on
the anode side and air on the cathode side. The long-time durability test was carried out in
order to assess long-term static stability of the cell for 15 hrs.
3.0 Results and Discussions
3.1 FTIR analysis
Figure 1 shows the FTIR spectra for the sample calcined at 800 °C. This showed
absorbance peaks at 425 cm-1
, 524 cm-1
, 588 cm-1
, 1023 cm-1
, 1072 cm-1
and 1448 cm-1
.
The spectra for the samples calcined at 900 °C displayed peaks at 425 cm-1
, 534 cm-1
, 592
cm-1
, 1031 cm-1
, 1074 cm-1
and 1448 cm-1
. Absorbance peaks for the samples calcined at

142
1000 °C were noted at 421 cm-1
, 539 cm-1
, 619 cm-1
, 1031 cm-1
, 1074 cm-1
and 1454 cm-1
.
The absorbance peaks generally for all the samples showed slight shifts to the right as the
calcination temperature increased. The representative peaks at 1448 -1454 cm-1
are
attributed to the C = O bonds from carbonate impurities from the precursor salts. The peaks
between 1072 – 1074 cm-1
and at 1023 – 1031 cm-1
are attributed to M-O-M stretching
vibrations.
Figure 1: The FTIR spectra of CSFI samples calcined at (a) 1000 °C (b) 900 °C and (c) 800 °C.
The peaks seen from 588 – 619 cm-1
are caused by the metal-oxygen vibrations in the
octahedral sites typically observed with spinel metals. Peaks indicative of the formation of
metal oxides were also observed between 524 – 539 cm-1
and 421 – 425 cm-1
caused by the
metal-oxygen bond vibrations of spinel structures in the tetrahedral sites. Similar
observations have been reported in the literature [20].
3.2 Raman analysis
The Raman spectra of the cathode material are presented in Figure 2. The sample calcined
at 800 °C had peaks at 255, 400, 508, 662, and 800 cm-1
. The peak at 255 cm-1
is attributed

143
to Eg active modes of Fe-O stretching mode of magnetite structure [21], the peak at 400
represents the F2g active modes of CeO2 fluorite structure and the peak at 508 cm-1
is
indicative of Ce4+
substituted by larger cations such as Ce3+
[22]. The peaks at 662 cm-1
and
800 cm-1
are attributed to A1g mode of Fe-O stretching modes of magnetite structure [21]
and A1g mode of iridium oxide [23, 24]. Peak shifts from those reported in the literature can
be attributed to the materials forming defective fluorite phases [25].
Figure 2: Raman Spectra of CSFIcalcined at (a) 800 °C (b) 900°C and (c) 1000 °C.
Spectra peaks for the sample calcined at 900 °C were observed at 257 cm-1
, 453 cm-1
, 649
cm-1
and 791 cm-1
. The large shift and increased intensity of the F2g active mode of CeO2
(453 cm-1
) indicates the materials have an overall structure similar to samarium doped
ceria; however the separate vibrations at 649 and 791 cm-1
for the iron and iridium oxide
metal-oxygen vibrations show that the calcination at 900 °C has not resulted in a solid
solution, but the materials still have separate iron and iridium oxide phases.
At 1000 °C, Raman peaks were observed at 297, 422, 660 and 800 cm-1
. Comparing the
samples calcined, there were red and blue shifts from the characteristic 460 cm-1
peak often
observed for the F2g mode of the CeO2 fluorite structure [22]. The shifts with the change in

144
calcination temperature can be attributed to changes in the metal to oxygen bonds [25, 26].
Some authors have noted that when larger ions are substituted for Ce4+
, the F2g active
modes of ceria shift to lower values [23 - 26]. These changes can be used as an indication
of defect sites within the ceria lattice, which may enhance the movement of oxygen anions
[27].
3.3 XRD analysis
Figure 3 shows the representative XRD patterns of the cathode perovskite nanoparticles for
the samples calcined at 800 °C, 900 °C and 1000 °C. The diffractogram revealed 3 phases
for CeO2 (fluorite cubic structure), Iron oxide (Fe2O3) hematite structure, and Iron
samarium oxide (FeSmO2) structure. The peaks observed for CeO2 phase were at 2θ values
of 28.56, 32.39, 33.17, 47.44, 56.55, 59.17, 63.28, 69.34, 76.77, 79.12, 88.38
and 95.50 indexed to 111, 110, 200, 220, 311, 222, 321, 400, 331, 420, 422 and 511 planes
respectively [28]. FeSmO2 structures revealed a phase of 301 at 2θ value of 69.34 [29],
other peaks due to the iron oxide in the magnetite crystal phase were observed as relatively
low intensity peaks at 2θ values of 63.16 and 95.15 indexed to 321 and 511 [24].
The average lattice parameter a is 5.4175 Å for CeO2 phase, 5.129 Å for FeSmO2 phase and
5.504 for Fe2O3 phase for the sample calcined at 1000 °C. The Bravais lattice is a face
centred cubic (FCC) unit cell. This was calculated using the equation [24]:
(4)
where, λ = X-ray wavelength and = 2 value/2, h, k, l values are Miller indices of
particular planes in the crystal. The mass of the unit cell for all samples was 1.3443 10-27
g for CeO2 phase and 1.3492 10-27
g for Fe2O3 phase. This was calculated using the
following equation:
Mass of Unit Cell (M)
(5)

145
The density of the cell is 7.41 g/cm3
for CeO2 phase and 6.562 g/cm3
for IrO2 phase, and the
following equation was used to calculate this value.
Mass density =
. (6)
Volume of unit cell was calculated to be 1.5984 10-28
cm3
for CeO2 phase and 0.8853
10-28
cm3 for the Fe2O3 phase (from where a = ). The full width at half
maximum (FWHM) in Table 1, increased as the calcination temperature increased. The
smaller the FWHM, the larger the crystallite size. Hence, the crystallite size increased with
decreasing calcination temperature from 1000 – 800 °C.
Table 1: The FWHM, Crystallite size, and Average particle size of CSFI calcined at (a) 800 °C (b)
900 °C and (c) 1000 °C.
Calcination
Temperature
(°C)
Full Width at Half
Maximum (FWHM)
(°)
Crystallite Size
(nm)
Particle Size
(nm)
800 0.1749 48.95 1.4 27.41
900 0.2278 37.59 0.87 22.98
1000 0.4381 19.54 0.30 19.58
The varying changes in the FWHM for (111) peak reveals a change in the lattice size. In
diffraction physics peak position are associated with lattice size, thus lattice expansion
results in a change in peak position. The evidence of lattice expansion and the existence of
large cations such as Ce3+
in this material [30]. In addition, once Ce3+
appears in the fluorite
ceria structure; oxygen vacancies will be produced to sustain electrostatic stability
according to the equation [30].
(7)
where represents an empty position (anion-vacant site) originating from the removal of
O2-
from the lattice.

146
Figure 3: XRD patterns of CSFI calcined at (a) 1000 °C (b) 900 °C and (c) 800 °C.
The presence of the (111) thermodynamic phase followed by the (110) promotes the
presence of oxygen vacancies, and (111) is the least active surface, followed by (100) and
(110) [30]. These active surfaces promote the removal of oxygen, there by creating oxygen
vacancies on the surface. The (111) plane, of the lattice expansion as per the FWHM
calculations (Table 1), and Raman analysis confirm the substitution of the Ce4+
with Ce3+
in
these materials, could enhance oxygen transport.
3.4 HRTEM analysis
Figure 4 presents representative transmission electron microscopy images for the samples
calcined at 800 °C - 1000 °C. The images show that the materials have irregular shapes that
varied in sizes with the change in calcination temperature. In diffraction physics peak
position are associated with lattice size, thus lattice expansion results in a change in peak
position.

147
Figure 4: The HRTEM micrographs of CSFI calcined at (a) 1000 °C (b) 900 °C and (c) 800 °C.
The Lattice fringes for the samples calcined at 800 °C predominantly exposes the {111}
planes of CeO2 fluorite structure and {200} planes of FeSmO2 structure for 900 °C and the
{420} planes of CeO2 structure for 1000 °C calcined samples. The selected diffraction
pattern differed slightly in terms of the lattice and the arrangements of the particles.
3.5 SEM observations
The morphology of CSFI, as shown in Figure 5, showed the agglomeration of nanoparticles
and the apparent voids between the particles changed with calcination temperature.
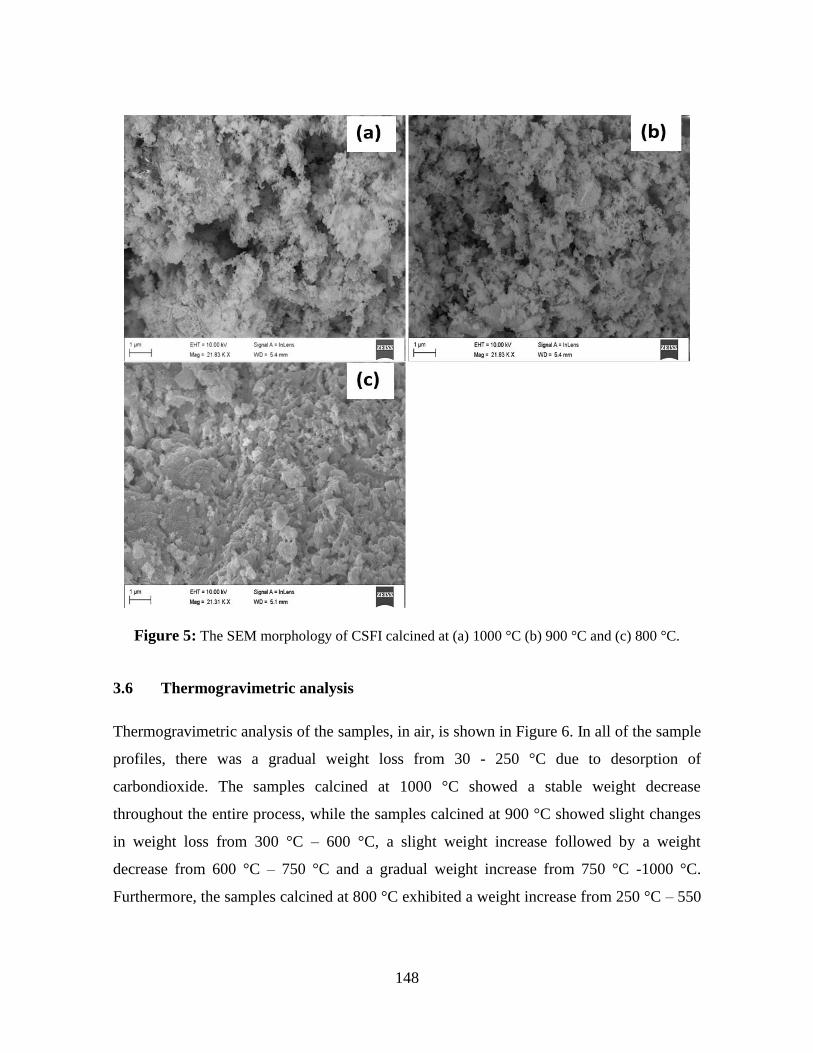
148
Figure 5: The SEM morphology of CSFI calcined at (a) 1000 °C (b) 900 °C and (c) 800 °C.
3.6 Thermogravimetric analysis
Thermogravimetric analysis of the samples, in air, is shown in Figure 6. In all of the sample
profiles, there was a gradual weight loss from 30 - 250 °C due to desorption of
carbondioxide. The samples calcined at 1000 °C showed a stable weight decrease
throughout the entire process, while the samples calcined at 900 °C showed slight changes
in weight loss from 300 °C – 600 °C, a slight weight increase followed by a weight
decrease from 600 °C – 750 °C and a gradual weight increase from 750 °C -1000 °C.
Furthermore, the samples calcined at 800 °C exhibited a weight increase from 250 °C – 550

149
°C followed by a gradual weight loss from 550 °C - 700 and a minimal weight increase
throughout the process.
Figure 6: The thermogravimetric analysis of CSFI calcined at (a) 1000 °C (b) 900 °C and
(c) 800 °C.
The weight changes of the samples were assumed to be mainly due to the removal of lattice
oxygen from the surface [31, 32, 33], which can be represented by the equations [32].
(8)
(9)
where and
are representatives of oxide ion vacancy and oxide ions, respectively.
Reduction reaction was more dominant in the samples calcined at a 1000 °C because of its
steady weight decrease throughout the process. These losses result from thermal induced
lattice oxygen loss caused by the increase in oxygen vacancies formation followed by a
change in the valence of Ir and Fe ions from IV to III to maintain electrical neutrality. Thus

150
at 900 °C there is rapid loss of lattice oxygen which led to faster decomposition, than the
other samples calcined at 800 °C and 1000 °C
3.7 Electrochemical Properties
The asymmetric cell comprised of NiO/SDC as anode, SDC/Na2CO3 as electrolyte and
CSFI as cathode was tested using a NuvantTM
Powerstat 05 potentiostat and galvanostat and
a Fiaxell SOFC Technologies™ open flange test set-up. Compressed air with a flow rate of
50 m3/min and humidified hydrogen with a flow rate of 200 m
3/min was passed through the
cell which was tested for 15 hrs.
3.7.1 Polarization Curve
Figure 7 shows the polarisation curves of CSFI cathode material calcined at 800 - 1000 °C.
Each cell was tested in the temperature intervals of 300 - 500 °C. From Figure 7, the
polarization curves revealed slight changes for the different materials and showed a linear
fall in voltage with increase in current densities. This resulted from the change in resistance
as current flows within the fuel cell. The drop in voltage increases as a result of kinetic and
Ohmic losses within the cell. The major cause of polarisation in the system is the ohmic
overpotential which result from the cell’s internal resistance.It can be estimated from the
effective distance between the cells components combined with the conductivity of the
electrolyte [34].
Ohmic Overpotential within the cell decreased when testing temperature increased from
300 °C - 500 °C, exposing a high resistance at lower temperature as shown in Figure 7.
Concentration losses were observed within the cell performance which occurs when current
flows through the cell. The Concentration Overpotential increased from 300 °C - 500 °C
resulting from the increase in diffusion of hydrogen ions and oxygen electrons from anode
to cathode interface, and vice versa which is negligible when quality pure gases are used.
The open cell voltage (OCV) values decreased with increasing measuring temperature. The
OCV value was stable at 0.89 V for more than 15 hours at 500 °C, which is lower than the
Nernst equation thermodynamic values. This was probably due to either gas crossover

151
between the composite electrolytes, thickness of the electrolyte, non-optimal pore
geometry, or the presence of pin holes.
Figure 7: The polarization curve of CSFI calcined at (a) 1000 °C (b) 900 °C (c) 800 °C.
The power density of CSFI samples calcined at 800°C, 900 °C and 1000 °C, were taken at
temperatures of 300 °C - 500 °C. The maximum power density at 300 °C was 308.56
mW/cm2, 400 °C was 365.79 mW/cm
2 and 500 °C was 483.07 mW/cm
2. The maximum
current densities were 776.77 mA/cm2, 776.87 mA/cm
2 and 774.47 mA/cm
2 respectively.
The maximum power density at 500 °C was exhibited by CSFI perovskite material calcined
at 1000 °C with a low polarization resistance.
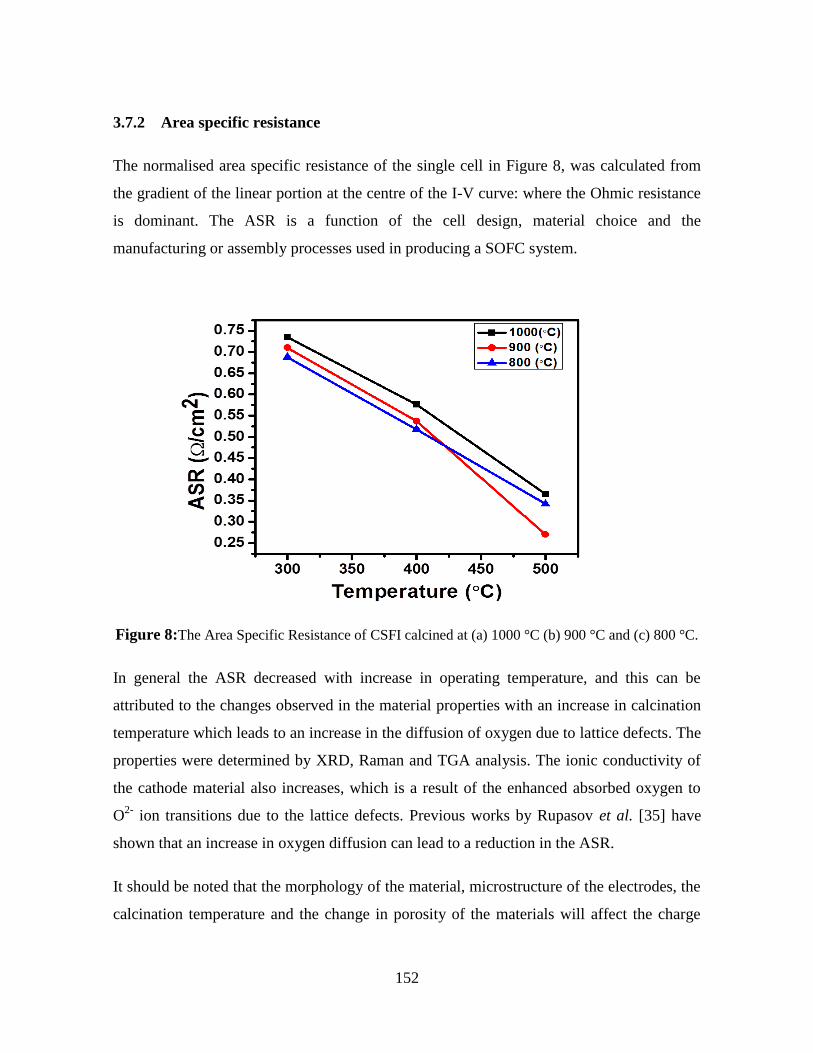
152
3.7.2 Area specific resistance
The normalised area specific resistance of the single cell in Figure 8, was calculated from
the gradient of the linear portion at the centre of the I-V curve: where the Ohmic resistance
is dominant. The ASR is a function of the cell design, material choice and the
manufacturing or assembly processes used in producing a SOFC system.
Figure 8:The Area Specific Resistance of CSFI calcined at (a) 1000 °C (b) 900 °C and (c) 800 °C.
In general the ASR decreased with increase in operating temperature, and this can be
attributed to the changes observed in the material properties with an increase in calcination
temperature which leads to an increase in the diffusion of oxygen due to lattice defects. The
properties were determined by XRD, Raman and TGA analysis. The ionic conductivity of
the cathode material also increases, which is a result of the enhanced absorbed oxygen to
O2-
ion transitions due to the lattice defects. Previous works by Rupasov et al. [35] have
shown that an increase in oxygen diffusion can lead to a reduction in the ASR.
It should be noted that the morphology of the material, microstructure of the electrodes, the
calcination temperature and the change in porosity of the materials will affect the charge

153
transfer properties at the phase boundaries [36]. In addition, Park et al. [36], showed that
samarium based materials calcined at 1000 °C were optimal in IT SOFCs, and our results
show a similar trend although that SOFC tests were conducted at lower temperatures of 500
°C.
4.0 Conclusions
The physical-chemical properties of CSFI cathode materials were analysed using X-ray
diffraction, Raman spectroscopy, Fourier transform infrared spectroscopy, electron
microscopy, and TGA. The X-ray diffraction showed FWHM values of 0.1749 nm, 0.2289
nm and 0.4381 nm and mean crystallite sizes of 46.85 nm, 35.97 nm, 18.71 nm for the
samples calcined at 800 °C, 900 °C and 1000 °C respectively. The Raman spectroscopy
revealed the presence of metal oxides in the dominant perovskite phase with the presence of
defect sites. The high resolution transmission electron microscopy revealed smaller particle
sizes as the calcination temperature decreased. The TGA showed changes in oxygen
transport with changes in the calcination temperature of the materials. The materials
potential for use in SOFCs at temperatures between 300 – 500 °C for the sample calcined at
1000 °C produced the maximum power density of 483.07 mW/cm2 at 500 °C powered for
15 hrs, and an area specific resistance of 0.342 Ω cm2.
Acknowledgements
The authors thank the University of KwaZulu-Natal for granting access to research
facilities, ESKOM-TESP and NRF THUTHUKA for their financial support.
References
1. H. Fukunaga, M. Koyama, N. Takahashi, C. Wen, K. Yamada, Reaction model of
dense Sm0.5Sr0.5CoO3 as SOFC cathode, Solid State Ionics. 132 (2000) 279-285.
2. T. Suzuki, M. Awano, P. Jasinski, V. Petrovsky, H.U. Anderson, Composite (La,
Sr)MnO3–YSZ cathode for SOFC, Solid State Ionics. 177 (2006) 2071-2074.
154
3. S.P. Jiang, W. Wang, Novel structured mixed ionic and electronic conducting
cathodes of solid oxide fuel cells, Solid State Ionics. 176 (2005) 1351-1357.
4. C. Xia, W. Rauch, F. Chen, M. Liu, Sm0.5Sr0.5CoO3 cathodes for low-temperature
SOFCs, Solid State Ionics. 149 (2002) 11-19.
5. B. Wei, Z. Lu, X. Huang, S. Li, G. Ai, Z. Liu, W. Su, Electrochemical
characteristics of Ba0.5Sr0.5Co0.8Fe0.2O3−δ–Sm0.2Ce0.8O1.9 composite materials for
low-temperature solid oxide fuel cell cathodes, Mater. Lett. 60 (2006) 3642 -
3646.
6. S. B. Adler, J. A. Lane, B. C. H. Steele, Electrode kinetics of porous mixed
‐conducting oxygen electrodes, J. Electrochem. Soc. 143 (1996) 3554-3564.
7. Z. P. Shao, S.M. Haile, A high-performance cathode for the next generation of
solid-oxide fuel cells, Nature. 431 (2004) 170-173.
8. W. Zhu, Z. Lu, S. Li, B. Wei, J. Miao, X. Huang, K. Chen, N. Ai, W. Su, Study on
Ba0.5Sr0.5Co0.8Fe0.2O3−δ–Sm0.5Sr0.5CoO3−δ composite cathode materials for IT-
SOFCs, J. Alloys Compd. 465 (2008) 274-279.
9. M. T. Colomer, B. C. H. Steele, J. A. Kilner, Structural and electrochemical
properties of the Sr0.8Ce0.1Fe0.7Co0.3O3−δ perovskite as cathode material for
ITSOFCs, Solid State Ionics. 147 (2002) 41-48.
10. L. Zhang, R. Lan, A. Kraft, S. Tao, A stable intermediate temperature fuel cell
based on doped-ceria–carbonate composite electrolyte and perovskite cathode,
Electrochem. Commun. 13 (2011) 582-585.
11. X. F. Sun, R..S.Guo, J. Li, Preparation and properties of yttrium-doped SrTiO3
anode materials, Ceram. Int. 34 (2008) 219-223.
12. H. Kishimoto, Y. P. Xiong, K. Yamaji, T. Horita, N. Sakai, M. E. Brito, H.
Yokokawa, Stability of Ni base anode for direct hydrocarbon SOFCs, J. Chem.
Eng. Jpn.40 (2007) 1178-1182.
13. N. F. P. Ribeiro, M. M. V. M. Souza, O. R. M. Neto, S. M. R. Vasconcelos, M.
Schmal, Investigating the microstructure and catalytic properties of Ni/YSZ
cermets as anodes for SOFC applications, Appl. Catal. A 353 (2009) 305.
155
14. J. Di, M. Chen, C. Wang, J. Zheng, L. Fan, B. Zhu, Samarium doped ceria–
(Li/Na)2CO3 composite electrolyte and its electrochemical properties in low
temperature solid oxide fuel cell, J. Power Sources 195 (2010) 4695-4699.
15. Q. L. Liu, K. A. Khor, S. H. Chan, High-performance low-temperature solid oxide
fuel cell with novel BSCF cathode, J. Power Sources 161, 1(2006) 123-128.
16. X. Wang, Y. Ma, R. Raza, M. Muhammed and B. Zhu, Novel coreshell
SDC/amorphous Na2CO3 nanocomposite electrolyte for low-temperature SOFCs,
Electrochem. Commun. 10 (2008) 1617-1620.
17. L. Fan, C. Wang, M. Chen, J. Di, J. Zheng, B. Zhu, Potential low-temperature
application and hybrid-ionic conducting property of ceria-carbonate composite
electrolytes for solid oxide fuel cells, Int. J. Hydrogen Energy 36 (2011) 9987-
9993.
18. M. Benamira, A. Ringuede, V. Albin, R. Vannier, L. Hildebrandt, C. Lagergren,
M. Cassir, Gadolinia-doped ceria mixed with alkali carbonates for solid oxide fuel
cell applications: I. A thermal, structural and morphological insight, J. Power
Sources, 196 (2011) 5546-5554.
19. H. Okkay, M. Bayramoglu, M.F. Öksüzömer, Ce0.8Sm0.2O1.9 synthesis for solid
oxide fuel cell electrolyte by ultrasound assisted co-precipitation method,
Ultrasonics Sonochemistry, 20 (2013) 978–983.
20. Y. Tao, J. Shao, J. Wang, W. G. Wang, Morphology control of Ce0.9Gd0.1O1.95
nanopowder synthesized by sol–gel method using PVP as a surfactant, J. Alloys
Compd. 484 (2009) 729-733.
21. O. N. Shebanova, P. Lazer, Raman spectroscopic study of magnetite (FeFe2O4): a
new assignment for the vibrational spectrum, J. Solid State Chem. 174 (2003) 424-
430.
22. M. Guo, J. Lu, Y. Wu, Y. Wang, M. Luo, UV and Visible Raman studies of
oxygen vacancies in rare-earth doped ceria, Langmuir. 27 (2011) 3872-77.
23. A. V. Korotcov, Y. S. Huang, K. K. Tiong, D. S. Tsai. Raman scattering
characterization of well-aligned RuO2 and IrO2 nanocrystals J. Raman Spectrosc.
38 (2007) 737-749.

156
24. C. B. Njoku, P. G. Ndungu, Synthesis and characterization of novel Ce0.8Sm0.2
Fe0.9Ir0.03Co0.07O3−δ perovskite material and possible application as a cathode for
low–intermediate temperature SOFCs, Mater. Res. Bull. 68 (2015) 100-108.
25. M. de los Reyes, K. R. Whittle, Z. Zhang, S. E. Ashbrook, M. R. Mitchell, L.-Y.
Jang, G. R. Lumpkin, The pyrochlore to defect fluorite phase transition in Y2Sn2-x
ZrxO7 RSC Advances 3 (2013) 5090-99.
26. Z. Wu, M. Li, J. Howe, H. M. Meyer, S. H. Overbury. Probing Defect Sites on
CeO2 Nanocrystals with Well-Defined Surface Planes by Raman Spectroscopy and
O2 Adsorption, Langmuir, 26 (2010) 16595-16606.
27. X Liu, K. Zhou, L. Wang, B. Wang, Y. Li, Oxygen Vacancy Clusters Promoting
Reducibility and Activity of Ceria Nanorods, J. Am. Chem. Soc. 131 (2009) 3140-
3141.
28. W. Yue, W. Zhou, Porous crystals of cubic metal oxides templated by cage-
containing mesoporous silica, Journal of Materials Chemistry17 (2007) 4947-
4952.
29. C. Felix, T. Maiyalagan, S. Pasupathi, B. J. Bladergroen, V. Linkov, Synthesis,
characteri- sation and evaluation of IrO2 based binary metal oxide electrocatalysts
for oxygen evolution reaction, Int. J. Electrochem. Sci., 7 (2012) 12064 – 1207.
30. D. P. Rupasov, A. V. Berenov, J. A. Kilner, S. Y Istomin, E. V. Antipov, Oxygen
diffusion in Sr0.75Y0.25CoO2.62, Solid State Ionics., 197 (2011) 18-24.
31. A. Botea-Petcu, S. Tanasescu, V. Varazashvili, N. Lejava, T. Machaladze, M.
Khundadze, F. Maxim, Thermodynamic data of Ba0.6Sr0.4Co0.8Fe0.2O 3−δ SOFC
cathode material, Materials Research Bulletin 57 (2014) 184-189.
32. Z. Wenxia, Z. Lü, S. Li, B. Wei, J. Miao, X. Huang, K. Chen, N. Ai, W. Su,
Study on Ba 0.5Sr0.5Co0.8Fe0.2O3−δ–Sm0.5Sr0.5CoO3−δ composite cathode materials
for IT-SOFCs, J. Alloys Compd. 465 (2008) 274-279.
33. R. Mueller, H. K. Kammler, K. Wegner, S. E. Pratsinis, OH surface density of
SiO2 and TiO2 by thermogravimetric analysis, Langmuir 19 (2003) 160-165.

157
34. X. Bingjun, Y. Bhawe, M. E. Davis, Spinel metal oxide-alkali carbonate-based,
low-temperature thermochemical cycles for water splitting and CO2 reduction,
Chemistry of Materials 25 (2013) 1564-1571.
35. D. P. Rupasov, A. V. Berenov, J. A. Kilner, S. Y. Istomin, E. V. Antipov, Oxygen
diffusion in Sr0.75Y0.25CoO2.62, Solid State Ionics 197 (2011) 18-24.
36. I. Park, J. Choi, H. Lee, D. Shin, Optimization of Sm0.5Sr0.5CoO3−δ–Sm0.2Ce0.8O2−δ
composite cathodes fabricated by electrostatic slurry spray deposition, Ceram. Int.
9 (2013) 5561-5569.
158
CHAPTER 7
Characterisation and Electrochemical Properties of
Ce0.8Sr0.2Fe0.9Ir0.04Co0.06O3-δ (CSFIC) Cathode Material for
Application in Low Temperature SOFC
Summary
This chapter has been published in the Electrochemical Society (ECS) Transactions and has
been structured according to the journal’s format. This chapter has also been reformatted to
incorporate further comments and corrections by the examiners
Abstract
In this study, the cathode CSFIC perovskite material has been prepared by Sol-gel
technique and then tested for their characteristic application in solid oxide fuel cell. The
crystal structure was tested using X-ray diffraction and the textural properties were tested
using Raman spectroscopy and Fourier transform infrared spectroscopy. The morphology
and microstructure was examined using scanning electron microscopy and high resolution
transmission electron microscopy. The power density, current density and the DC
polarization resistance were measured with a Nuvant TM
potentiostat and galvanostat from
Fiaxell SOFC technologies connected to the cell setup. These properties were tested for
their potential application in low temperature solid oxide fuel cells from 300 to 500 °C. It
exhibited a current density of 801.90 mA/cm2, a power density of 471.59 mW/cm
2 and an
area specific resistance (ASR) of 0.349 Ω cm2.
Keywords: Solid Oxide Fuel Cell, cerium oxide, Iridium oxide, perovskites, nano-
composites

159
1.0 Introduction
Solid oxide fuel cells (SOFCs) operating temperature has been a major interest for research
in the last decade, the drive being towards the reduction of the operating temperatures. This
is because of its cost and maintenance which has been of more importance. High operating
temperature limits certain properties of solid oxide fuel cells [1- 4]. A major one is the
Interdiffusion between the electrode and electrolyte boundaries causing sequestering layer
formation. This causes strain and cracks to the cell because of the variation in the thermal
expansion coefficient between the cells and densification of the electrodes.
On the other hand reducing the operating temperature of SOFCs has certain advantages; it
broadens the choices for electrodes and electrolyte materials, reduces production and
application cost, improves the overall lifetime and stability of the fuel cell. Several ways of
reducing the operating temperature, can be achieved either by reducing the electrolyte
thickness, or by using highly conductive electrolytes, such as doped ceria [5 – 9] as known
by various researchers. For example Xia et al. [4] reported that cells operated at
temperatures below 550 °C affected the performance of the cathode material especially
when used with samarium doped ceria (SDC) electrolyte because their activation energy
was very large.
However, this has aroused the interest of researchers to move to compounds with high ionic
conductivities such as cobalt containing perovskite; which displayed high concentration of
oxygen vacancy [10, 11]. Dusastre et al [12] reported on the effect of strontium on the
interfacial resistance properties of cobalt perovskites at 590 °C. Zhanget al. [13] reported
enhanced cathode conductivity and improved interfacial resistance less than 0.5 at 650 °C
for La0.6Sr0.4Co0.2Fe0.8O3 mixed with SDC-Ag. This was achieved due to an improved
microstructure and better adhesion on the electrolyte. Strontium doped samarium cobaltite
compounds mixed with samarium doped ceria (Sm0.5Sr0.5CoO3-SDC) have also been
reported as cathode material for low temperature and recorded an interfacial resistance of
0.18 Ω cm2
at 600 °C with the addition of 30 % SDC phase [14]. Shao et al. [14] reported

160
Ba0.5Sr0.5Co0.8Fe0.2O3-δ (BSCF) as cathode material for low temperature SOFC and it
exhibited high oxygen diffusivity and high power output.
Hence, in this study, the cathode material was made with cerium because of its high oxygen
ionic conduction properties and improved electrocatalytic activity. Iridium was also
introduced to improve the catalytic activity and the electrical conductivity of
Ce0.8Sr0.2Fe0.9Ir0.04Co0.06O3-δ (CSFIC) cathode material. Sol-gel technique was used to
synthesize the cathode material [16, 17], as it can be used to produce ceramic oxide
materials, with controlled structure and composition. It is simple, cost effective with high
yield at room temperature [18, 19].
2.0 Experimental methods
2.1 Cell fabrication
The metal precursors: Strontium (III) acetylacetonate hydrate (99.9 % purity), Cerium (III)
acetylacetonate hydrate, (99.9 % purity), Iron (III) acetylacetonate (97 % purity), Cobalt
(II) acetylacetonate hydrate and Pluronic F-127 were purchased from Sigma-Aldrich (Pty)
Ltd, South Africa. Iridium (III) acetylacetonate hydrate was purchased from Alfa Aesar
UK. The materials were used as purchased and the cathode material nanoparticles are
prepared by sol-gel technique with stoichiometric amounts of 0.0500 g of iridium (acac)3,
0.6481 g of cerium (acac)3, 0.1460 g of strontium (acac)3, 0.0468 g of cobalt (acac)2, and
0.5838 g of iron (acac)3, were weighed out into a mixture of 50 ml and 10 ml of ethanol and
deionized water respectively. The mixture was sonicated in an ultrasound bath (UMC 20,
50 kHz) for 30 mins and then heated to 80 °C to dry out the solvents on a hotplate while
stirring the mixture. A solid gel was formed after 30 mins at 80 °C and was allowed to dry
completely in an oven at 200 °C for 24 hours. Three different samples was made and then
calcined in a muffle furnace (Kittec Squadro 1350) at temperatures of 800 °C, 900 °C and
1000 °C respectively for 10 hours at a heating rate of 2 °C/min to form perovskites.
The electrolyte material (Ce0.8Sm0.2O2/Na2CO3) was also prepared by sol-gel synthesis and
the stoichiometric amounts of Cerium (acac)3 and Samarium (acac)2 were weighed out into
161
50 ml of ethanol and 15 ml of deionized water. The mixture was then sonicated in an
ultrasound bath (UMC 20, 50 kHz) for 30 mins and further allowed to dry on a hotplate
while stirring at 80 °C for a further 30 mins. The mixture was then dried in an oven for 2
hrs at 100 °C and calcined in a muffle furnace for 4 hrs at 800 °C at a heating rate of 2
°C/min. The powder was then mixed with sodium carbonate in the ratio of 60:40 wt %
electrolytes to Na2CO3. The electrolyte material was then combined with the cathode
material to make a double layer of cylindrical pellet (disc) 13 mm in diameter and 300 m
thickness (100 m cathode and 200 m electrolyte). This was fabricated by uniaxial
pressing the powder at 15 Ton pressure. The pellets made were then heated at 1050 °C for 2
hrs at 5 °C/min to densify the cell.
2.2 Characterization
The crystal structures of the perovskite nanocomposite were characterized using powder X-
ray diffraction (XRD). The X-ray diffractogram was obtained using Bruker D8 Advance
diffractometer with a Cu Kα radiation source operating at 40 kV and a wavelength of
1.5406 Å. High resolution transmission electron microscopy (HR-TEM) was used to obtain
the morphology and microstructure of the perovskites. In HRTEM analysis, small amounts
of the samples were poured in ethanol and sonicated for 5 mins, it was then drop-dried onto
a carbon coated copper TEM grid and then examined on a JOEL 2100 HRTEM (200 kV
accelerating voltage, beam current of 110 µA and a current density of 2.4 pA/cm2).
The perovskite powders were pressed onto carbon tape coated aluminium stubs and gold
coated for SEM observations on a ZEISS FEGSEM Ultra Plus. The Infrared spectra were
collected on a Perkin Elmer 1200 ATR - FTIR and the Raman analysis was done on a
DeltaNu advantage 532™ Raman Spectrometer (100mW Nd:YAG laser with an excitation
wavelength of 532 nm). The heat stability of the cathode nanocomposite was analysed by
thermogravimetric analysis using Perkin Elmer simultaneous thermal analyser STA 6000. It
was heated in air at 30 ml/min from 30 °C to 1000 °C at a ramping rate of 10 °C/min.

162
2.3 Electrochemical characterisation
The asymmetrical cells were tested at 300 to 500 °C in 20 % deionized H2O/H2 mixture and
air. A platinum mesh was placed on both sides of the electrode and used as a current
collector. The flow of gases was controlled by flow metres and the humidified gas was
bubbled through a water bottle. For each cycle the polarisation curve was collected at
constant voltage and current measurements were collected from a Nuvant™ Powerstat 05
potentiostat and galvanostat, attached to the SOFC device. The SOFC device measured the
polarisation resistance and the direct current (DC) conductivity of the material. The ionic
conductivity was calculated using the Equation below [20]:
(1)
where, L is electrolyte thickness, S is electrode area of the electrolyte surface and R is
resistance in ohms (cell resistance). The activation energy and the DC electrical
conductivity were calculated using the following Arrhenius relationship [21]:
(2)
where, Ea is activation energy of conduction, T is Absolute temperature, σ° is pre-
exponential factor and k = Boltzmann Constant.
3.0 Results and Discussion
3.1 Powder XRD analysis
Figure 3 shows the XRD diffractogram of the perovskite cathode materials calcined at 800
°C, 900 °C, and 1000 °C, exhibited 3 phases namely lattices of iron oxide (Fe2O3) hematite
structure, cerium oxide (cerianite) structure and iron samarium oxide (FeSmO2) structure
with peaks observed at 2θ values of 28.56°, 32.39°, 33.17°, 39.90°, 47.44°, 56.55°, 57.88°,
59.33°, 63.16°, 68.05°, 69.34°, 76.89°, 79.27°, 88.50° and 95.15° indexed to 111, 110, 200,
211, 220, 311, 018, 222, 321, 321, 410, 400, 331, 420, 422 and 511 respectively. The

163
average lattice parameter a is 5.43 Å for the predominant CeO2 phase and the Bravais
lattice is face centred cubic unit cell.
The diffractogram exhibited sharper peaks and the peak intensities increased with increase
in calcination temperature and decreased from the lowest to the highest 2θ values with the
111 peak as the most intense peak. This is because an increase in temperature increases the
intensity of the XRD peak. The full width at half maximum (FMWH), in Table 1 showed
increasing values with decrease in calcination temperature. This revealed that samples
calcined at 1000 °C exhibited larger crystallite size and the sample calcined at 800 °C
exhibited the smaller crystallite size. This can be confirmed on the HRTEM micrograph
which showed smaller particles at 800 °C.
Table 1: The crystallite size, and average particle size of CSFIC calcined at (a) 800 °C (b) 900 °C
and (c) 1000 °C.
Calcination Temperature
(°C)
Crystallite Size
(nm)
Average Particle
Size (nm)
800 27.32 0.63 20.04
900 47.104 1.25 39.05
1000 64.780 2.24 49.88
In recent times researchers have shown that the presence of 111 active peak is the least
active surface for the removal of oxygen [22]. The presence of the 111 plane and the lattice
expansions showed by the XRD analysis, proposes proof of the presence of Ce3+
in these
materials [23]. The presence of Ce3+
in fluorite ceria structure produces oxygen vacancies
to sustain electrostatic stability as shown in the Equation: [24]
(3)
where represents an empty position (anion-vacant site) originating from the removal of
O2-
from the lattice. The Raman spectra revealed the presence of large size oxygen vacancy

164
clusters through surface defects, which promotes the transformation of Ce4+
to Ce3+
for
CeO2- based materials.
Figure 1: XRD diffractogram of CSFIC calcined at (a) 1000 °C (b) 900 °C and (c) 800 °C.
3.2 FTIR analysis
Figure 2 shows the absorbance peaks at 1446.53 – 1454.45 cm-1
which are attributed to C =
O bonds from carbonate impurities for samarium doped ceria [25]. The bands at 1026.89
cm-1
and 1072.02 cm-1
were visible for the samples calcined at 800 °C. The wave numbers
at 1031.64 cm-1
and 1074.39 cm-1
were visible for the 900 °C calcined sample, 1029.26 cm
-1 and 1074.39 cm
-1 were visible for 1000 C.
These bands are attributed to the vibration of the metal (M) to oxygen bond, caused by the
M-O-M stretching vibration. The variations in the peaks mentioned above are as a result of
the difference in the M-O-M distances. Peaks were also evident at 419.58 cm-1
, 425.13 cm-
1, 419.58 cm
-1 for the samples calcined at 800 °C, 900 °C and 1000 °C respectively,
indicating the formation of spinel metals because these bands are common characteristics of
spinel structures.

165
Figure 2: FTIR Spectra of CSFICcalcined at (a) 800 °C (b) 900 °C and (c) 1000 °C.
This is caused by metaloxygen vibrations in the tetrahedral sites and the peaks observed at
534.59 cm-1
, 542.31 cm-1
and 588.24 cm-1
, 550.23 cm-1
and 590.61 cm-1
from 800 to 1000
°C are vibrations in the octahedral sites [26, 27]. According to Waldron [28], the vibration
of unit cell of the cubic spinel can be constructed in the tetrahedral (A) sites and octahedral
(B) sites. The change in band position is expected because of the difference in the M+– O2−
distances for the tetrahedral and octahedral sites. The deduction is also confirmed by XRD
analysis [27].
3.3 Raman analysis
The Raman spectra of the perovskite material shown in Figure 3 showed active Raman
peaks for the samples calcined at 1000 °C at 260 cm-1
, 381 cm-1
, 502 cm-1
, 639 cm-1
and
789 cm-1
. The peak at 260 cm-1
represent the Eg symmetrical bend of hematite structure [29
- 31]. The representative peak usually occurs at 245 cm-1
, indicating a blue shift due to a
change in the iron oxide phase. 381cm-1
and 639 cm-1
peaks represent the Eg stretching
modes of Fe-O magnetite structure and A1g of Fe-O stretching modes of magnetite structure
respectively [32]. This shows the formation of an iron oxide double crystal structure in the
166
material. A1g symmetry mode of CeO2 fluorite structure was observed at 789 cm-1
[29 - 31].
This is noticed by the intensity of the peak. The peak at 502 cm-1
signifies the Eg mode of
IrO2 rutile structure [33], however when IrO2 is mixed with CeO2 this peak occurs at 462
cm-1
[34] signifying the distribution of IrO2nanocrystallites within the samarium doped
ceria matrix.
The samples calcined at 900 °C displayed peaks at 251 cm-1
showing the Eg symmetrical
bend of hematite structure. The peaks at 378 cm-1
and 635 cm-1
represent the Eg stretching
modes of Fe-O magnetite structure and A1g of Fe-O stretching modes of magnetite
structure. Peaks at 500 cm-1
and 793 cm-1
signifies the Eg mode of IrO2 rutile structure and
A1g symmetry mode of CeO2 fluorite structure respectively. In comparison with the spectra
for 1000 °C there was shift to lower values indicating a redshift.
For 800 °C, peaks were observed at 798 cm-1
, 658 cm-1
, 519 cm-1
and 415 cm-1
and 262 cm-
1. The peaks at 658 cm
-1 and 415 cm
-1 denotes the A1g of Fe-O stretching modes of
magnetite structure and Eg stretching modes of Fe-O magnetite structure. Peaks at 798 cm-1
represent A1g symmetry mode of CeO2 fluorite structure. The peaks at 519 cm-1
and 262
cm-1
represents the Eg mode of IrO2 rutile structure and Eg symmetrical bend of hematite
structure respectively. When compared to the peaks for the sample calcined at 900 °C, there
was a shift to higher values. These variations occurred with the change in calcination
temperature. This is because the ordering level of the samples increased with increasing
calcination temperatures and the lattice becomes more perfect, leading to the change in the
position of the defect sites.
Furthermore, lowering of the peak intensities and the broadening of the peaks observed also
were as a result of the change in the calcination temperature and the presence of the
infiltrated metals in the CeO2 based material. This lowers the symmetry of the Ce-O bond,
which also corresponds to the decreasing concentration of the CeO2-type complex in the
sample. The surface defects present in these spectra, show linear clusters of oxygen
vacancies formed at the calcination temperatures used [35].
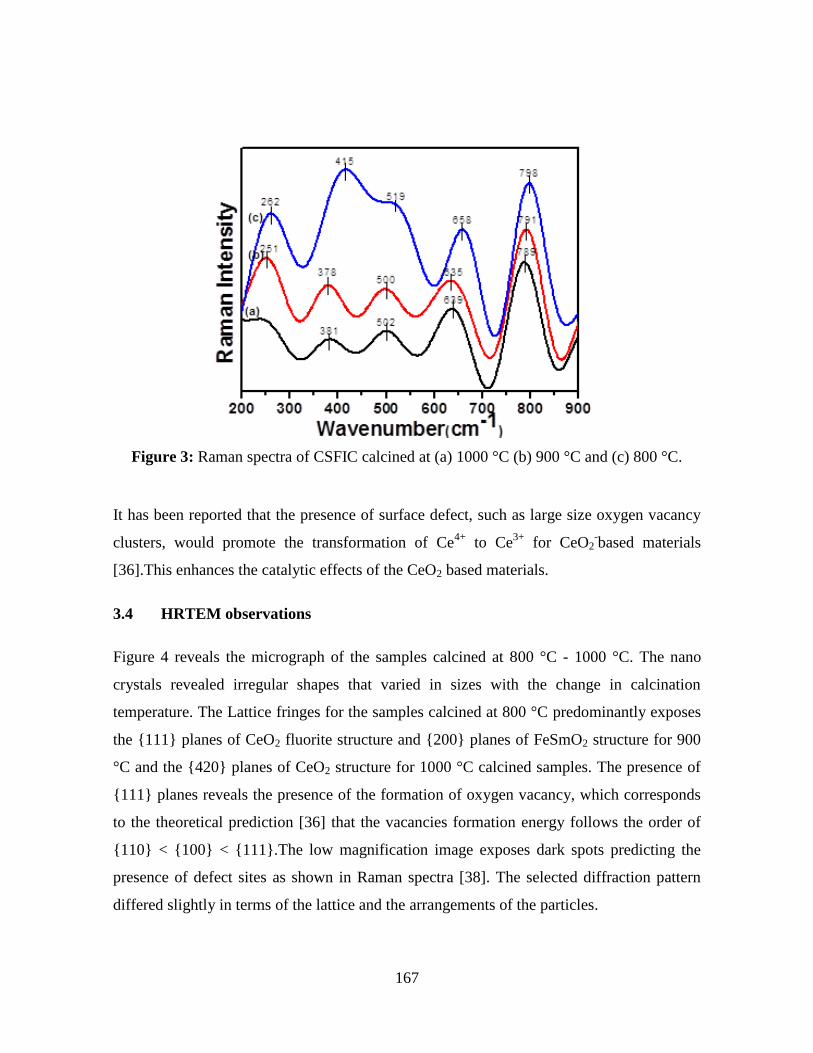
167
Figure 3: Raman spectra of CSFIC calcined at (a) 1000 °C (b) 900 °C and (c) 800 °C.
It has been reported that the presence of surface defect, such as large size oxygen vacancy
clusters, would promote the transformation of Ce4+
to Ce3+
for CeO2-based materials
[36].This enhances the catalytic effects of the CeO2 based materials.
3.4 HRTEM observations
Figure 4 reveals the micrograph of the samples calcined at 800 °C - 1000 °C. The nano
crystals revealed irregular shapes that varied in sizes with the change in calcination
temperature. The Lattice fringes for the samples calcined at 800 °C predominantly exposes
the {111} planes of CeO2 fluorite structure and {200} planes of FeSmO2 structure for 900
°C and the {420} planes of CeO2 structure for 1000 °C calcined samples. The presence of
{111} planes reveals the presence of the formation of oxygen vacancy, which corresponds
to the theoretical prediction [36] that the vacancies formation energy follows the order of
{110} < {100} < {111}.The low magnification image exposes dark spots predicting the
presence of defect sites as shown in Raman spectra [38]. The selected diffraction pattern
differed slightly in terms of the lattice and the arrangements of the particles.

168
Figure 4: The HRTEM micrograph of CSFIC calcined at (a) 1000 °C (b) 900 °C and
(c) 800 °C.
3.5 SEM observations
Figure 5 shows that the morphology of the cathode material revealing particles of different
sizes, assumed to be nanoparticles in agglomerate formation. The surfactant used increased
the agglomeration separation of the particles leading to bigger pore spaces, which
decreased as the calcination temperature decreased. These pore spaces formed allow the
diffusion of gases through the electrodes. The bigger the pore sizes the faster the rate of
diffusion which enhances the performance of the cathode material. This corroborates with

169
the HRTEM micrograph which revealed smaller particle sizes as the calcination
temperature decreased.
Figure 5: SEM morphology of CSFIC calcined at (a) 1000 °C (b) 900 °C and (c) 800 °C.
3.6 Thermogravimetric analysis
Figure 6 shows that the thermogravimetric analysis of the sample calcined at 1000 °C.
Showed a gradual weight loss from 30 °C - 250 °C due to desorption of carbondioxide
occurs. A gradual weight loss was observed from 30 °C – 250 °C then a minimal weight
increase from 250 °C to 400 °C and a weight loss from 400 °C – 1000 °C for the sample
calcined at 900 °C. The sample calcined at 800 °C showed a different routine from the
other samples, there was a gradual weight loss from 35 °C to 250 °C due to desorption of

170
physically absorbed water, then a weight increase from 250 °C – 550 °C , a gradual weight
loss from 550 °C - 750 °C and a small weight increase throughout the process.
Figure 6: The thermogravimetric analysis of CSFIC calcined at (a) 1000 °C (b) 900 °C and (c)
800 °C.
The weight changes of the samples were assumed to be mainly due to the behaviour of
lattice oxygen as indicated by the Equations [39]:
(4)
(5)
where Vooo
and Oox
represent oxide ion vacancy and oxide ions, respectively. Reduction
reaction was more dominant in the samples calcined at a 1000 °C because of its gradual
weight loss [40] throughout the process. This is as a result of thermal induced lattice
oxygen loss caused by the increase in oxygen vacancies formation complemented by a
change in the valence of Co and Fe ions from IV to III to maintain electrical neutrality. This
causes a shift in the equilibrium positions of equations 4 and 5 to the right accompanied by
a weight reduction. Furthermore, the starting temperature for lattice oxygen loss was earlier
(a)
(b)
(c)
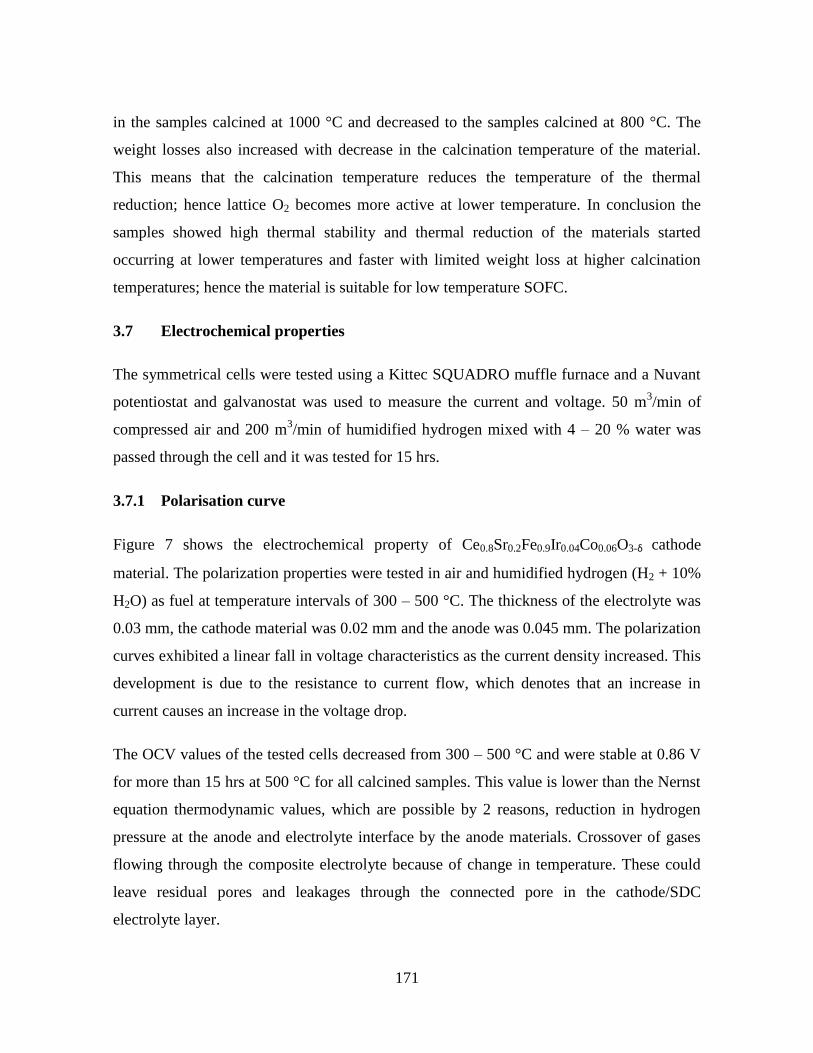
171
in the samples calcined at 1000 °C and decreased to the samples calcined at 800 °C. The
weight losses also increased with decrease in the calcination temperature of the material.
This means that the calcination temperature reduces the temperature of the thermal
reduction; hence lattice O2 becomes more active at lower temperature. In conclusion the
samples showed high thermal stability and thermal reduction of the materials started
occurring at lower temperatures and faster with limited weight loss at higher calcination
temperatures; hence the material is suitable for low temperature SOFC.
3.7 Electrochemical properties
The symmetrical cells were tested using a Kittec SQUADRO muffle furnace and a Nuvant
potentiostat and galvanostat was used to measure the current and voltage. 50 m3/min of
compressed air and 200 m3/min of humidified hydrogen mixed with 4 – 20 % water was
passed through the cell and it was tested for 15 hrs.
3.7.1 Polarisation curve
Figure 7 shows the electrochemical property of Ce0.8Sr0.2Fe0.9Ir0.04Co0.06O3-δ cathode
material. The polarization properties were tested in air and humidified hydrogen (H2 + 10%
H2O) as fuel at temperature intervals of 300 – 500 °C. The thickness of the electrolyte was
0.03 mm, the cathode material was 0.02 mm and the anode was 0.045 mm. The polarization
curves exhibited a linear fall in voltage characteristics as the current density increased. This
development is due to the resistance to current flow, which denotes that an increase in
current causes an increase in the voltage drop.
The OCV values of the tested cells decreased from 300 – 500 °C and were stable at 0.86 V
for more than 15 hrs at 500 °C for all calcined samples. This value is lower than the Nernst
equation thermodynamic values, which are possible by 2 reasons, reduction in hydrogen
pressure at the anode and electrolyte interface by the anode materials. Crossover of gases
flowing through the composite electrolyte because of change in temperature. These could
leave residual pores and leakages through the connected pore in the cathode/SDC
electrolyte layer.
172
Figure 7: The polarization curve of CSFIC calcined at (a) 1000 °C (b) 900 °C (c) 800 °C measured
at 300, 400 and 500 °C.
The linear fall reduced from 300 – 500 °C, which was instigated by these reasons. Increase
in ohmic and concentration losses from the internal resistance of the cell, which are
produced by the effective distance between the cell components and its ionic conductivity.
As the measuring temperature increased from 300 - 500 °C the ionic conductivity
increased, this influenced the reduction of adsorbed molecular oxygen to O2 ions and
improves the diffusion of these ions to the electrode/electrolyte interface. The increase in
temperature increased the diffusion of the ions to and fro the electrodes, the discharge of
the ions to form hydrogen atoms and oxygen atoms on the surface of the electrode and the
formation of water molecules. The increase in the overall rate of the diffusion process
reduces polarisation losses/resistance; hence, the losses were smaller at 500 °C.
500C
400C
300C
100
200
300
400
500
Po
we
r D
en
sit
y (
mW
cm
-2)
100 200 300 400 500 600 700 8000.2
0.4
0.6
0.8
1.0
1.2V
olt
ag
e(V
)
Current Density (mAcm-2)
100 200 300 400 500 600 700 800 9000.2
0.4
0.6
0.8
1.0
1.2
500C
400C
Vo
lta
ge
(V
)
Current Density (mAcm-2)
300C
100
200
300
400
500
Po
we
r D
en
sit
y (
mW
cm
-2)
100 200 300 400 500 600 700 800 9000.2
0.4
0.6
0.8
1.0
1.2
500C
400C
Vo
lta
ge
(V
)
Current Density (mAcm-2)
300C
100
200
300
400
500
Po
we
r D
en
sit
y (
mW
cm
-2)
(a) (b)
(c)

173
3.7.2 Area Specific Resistance
Figure 8 shows the normalised area specific resistance (ASR) of the cell. This is calculated
from the gradient of the linear fall, at the centre of the polarisation curve, where the ohmic
resistance is dominant. This is reported as a plot of cell potential against current density.
Figure 8:The Area Specific Resistance of CSFIC at (a) 1000 °C (b) 900 °C and (c) 800 °C.
The ASR values when measured at 500 °C showed varying changes of 0.324 Ω cm2 for the
samples calcined at 800°C, 0.403 Ω cm2 for 900°C and 0.349 Ω cm
2 for 1000 °C. This is a
function of the cell design, material choice and manufacturing technique. The ASR reduced
with increasing measuring temperature and reduced slightly with decreasing calcination
temperature. Subsequently increase in temperature changes the material properties and
leads to an increased oxygen loss from the lattice and increasing the total overall diffusion
processes thereby reducing polarisation resistance.
The power density displayed maximum values of 291.72 mW/cm2 at 300 °C, 344.72
mW/cm2
at 400 °C and 471.59 mW/cm2 at 500 °C. The maximum power densities were
displayed by the samples calcined at 900 °C and the power density increased with

174
increasing measuring temperature. This resulted from increase in ionic conductivity at
higher temperature and higher ionic conductivity increases the voltage. The product of the
voltage and its current density increases the power density.
4.0 Conclusions
The performance of the cathode composite material CSFIC was investigated by X-ray
diffraction, IR spectroscopy, Fourier transform infrared spectroscopy, thermogravimetric
analysis and the electrochemical properties. The XRD diffractogram exhibited FWHM
value of 0.127 nm, 0.174 nm and 0.299 nm and mean crystallite sizes of 64.78 nm, 47.10
nm, and 27.32 nm for 1000 °C, 900 °C and 800 °C respectively. This implies that the
crystallite size and particle sizes increased with increasing calcination temperature as
shown on the micrograph. The thermogravimetric analysis confirmed that the material is
stable when heated to 1000 °C. The samples decreased in weight as the calcination
temperature increased. The sample calcined at 900 °C produced the highest power density
of 471.59 mW/cm2
and a current density of 801.9 mA/cm2 at 500 °C powered for 15 hours,
and an area specific resistance of 0.349 Ω cm2. The properties exhibited revealed that the
material is a promising cathode material for low temperature solid oxide fuel cell.
Acknowledgements
The authors thank the University of KwaZulu-Natal, for a conducive environment, ESKOM
- TESP and NRF THUTUKA for their financial support.
References
1. Fukunaga, H., Koyama, M., Takahashi, N., Wen, C. and Yamada, K., 2000.
Reaction model of dense Sm0.5Sr0.5CoO3 as SOFC cathode. Solid State Ionics,
132(3), pp.279-285.
2. Suzuki, T., Awano, M., Jasinski, P., Petrovsky, V. and Anderson, H.U., 2006.
Composite (La, Sr) MnO3–YSZ cathode for SOFC. Solid State Ionics, 177(19),
pp.2071-2074.

175
3. Jiang, S.P. and Wang, W., 2005. Novel structured mixed ionic and electronic
conducting cathodes of solid oxide fuel cells. Solid State Ionics, 176(15), pp.1351-
1357.
4. Xia, C., Rauch, W., Chen, F. and Liu, M., 2002. Sm0.5Sr0.5CoO3 cathodes for low-
temperature SOFCs. Solid State Ionics, 149(1), pp.11-19.
5. Will, J., Mitterdorfer, A., Kleinlogel, C., Perednis, D. and Gauckler, L.J., 2000.
Fabrication of thin electrolytes for second-generation solid oxide fuel cells. Solid
State Ionics, 131(1), pp.79-96.
6. Mogensen, M., Sammes, N.M. and Tompsett, G.A., 2000. Physical, chemical and
electrochemical properties of pure and doped ceria. Solid State Ionics, 129(1),
pp.63-94.
7. Xia, C. and Liu, M., 2001. A simple and cost‐effective approach to fabrication of
dense ceramic membranes on porous substrates. Journal of the American Ceramic
Society, 84(8), pp.1903-1905.
8. Xia, C., Lang, Y. and Meng, G., 2004. Recent advances to the development of
low‐temperature solid oxide fuel cells. Fuel Cells, 4(1‐2), pp.41-47.
9. Xia, C. and Liu, M., 2001. Low-temperature SOFCs based on Gd0.1Ce0.9O1.95
fabricated by dry pressing. Solid State Ionics, 144(3), pp.249-255.
10. Steele, B.C.H., 2000. Appraisal of Ce1−yGdyO2−y/2 electrolytes for IT-SOFC
operation at 500 °C. Solid state ionics, 129(1), pp.95-110.
11. Maguire, E., Gharbage, B., Marques, F. M. B. and Labrincha, J. A., 2000. Cathode
materials for intermediate temperature SOFCs. Solid State Ionics, 127(3), pp.329-
335.
12. Dusastre, V. and Kilner, J. A., 1999. Optimisation of composite cathodes for
intermediate temperature SOFC applications. Solid State Ionics, 126(1), pp.163-
174.
13. Zhang, J. D., Ji, Y., Gao, H. B., He, T. M., Liu, J., 2005. Composite cathode
La0.6Sr0.4Co0.2Fe0.8O3-Sm0.1Ce0.9O1.95-Ag for intermediate temperature solid oxide
fuel cells. Journal of Alloys and Compounds, 395(1-2), pp.322-325.

176
14. Shao, Z. and Haile, S. M., 2004. A high-performance cathode for the next
generation of solid-oxide fuel cells. Nature, 431(7005), pp.170-173.
15. Sharma, M. and Jeevanandam, P., 2011. Synthesis of magnesium oxide particles
with stacks of plate’s morphology. Journal of Alloys and Compounds, 509(30),
pp.7881-7885.
16. Lou, Z., Peng, J., Dai, N., Qiao, J., Yan, Y., Wang, Z., Wang, J. and Sun, K., 2012.
High performance La3Ni2O7 cathode prepared by a facile sol–gel method for
intermediate temperature solid oxide fuel cells. Electrochemistry Communications,
22, pp.97-100.
17. M. S. Mastuli, N. S. Ansaria, M. A. Nawawia, A. Maria, Effects of Cationic
Surfactant in sol-gel synthesis of nano-sized magnesium oxide". APCBEE Procedia,
3, 93 – 98 (2012).
18. Lou, Z., Qiao, J., Yan, Y., Peng, J., Wang, Z., Jiang, T. and Sun, K., 2012.
Synthesis and characterization of aluminum-doped perovskites as cathode materials
for intermediate temperature solid oxide fuel cells. International Journal of
Hydrogen Energy, 37(15), pp.11345-11350.
19. C. B. Njoku, P. G. Ndungu, Effect of non-ionic, anionic and cationic surfactants on
the sol gel synthesis of IrO/Ce0.8Sm0.2O2 nanocomposite for solid oxide fuel cell
application, Journal of Fuel Cell Science and Technology, 11 (2014) 101 - 109.
20. Okkay, H., Bayramoglu, M. and Öksüzömer, M. F., 2013. Ce0.8Sm0.2O1.9 synthesis
for solid oxide fuel cell electrolyte by ultrasound assisted co-precipitation method.
Ultrasonics Sonochemistry, 20(3), pp.978-983.
21. Tsunekawa, S., Ishikawa, K., Li, Z. Q., Kawazoe, Y. and Kasuya, A., 2000. Origin
of anomalous lattice expansion in oxide nanoparticles. Physical Review Letters,
85(16), p.3440.
22. Fu, Q., Saltsburg, H. and Flytzani-Stephanopoulos, M., 2003. Active nonmetallic
Au and Pt species on ceria-based water-gas shift catalysts. Science, 301(5635),
pp.935-938.

177
23. Wu, Z., Li, M., Howe, J., Meyer III, H. M. and Overbury, S. H., 2010. Probing
defect sites on CeO2 nanocrystals with well-defined surface planes by Raman
spectroscopy and O2 Adsorption†. Langmuir, 26(21), pp.16595-16606.
24. Liu, X., Zhou, K., Wang, L., Wang, B. and Li, Y., 2009. Oxygen vacancy clusters
promoting reducibility and activity of ceria nanorods. Journal of the American
Chemical Society, 131(9), pp.3140-3141.
25. Shen, C. and Shaw, L.L., 2010. FTIR analysis of the hydrolysis rate in the sol–gel
formation of gadolinia-doped ceria with acetylacetonate precursors. Journal of Sol-
gel Science and Technology, 53(3), pp.571-577.
26. Xu, B., Bhawe, Y. and Davis, M. E., 2013. Spinel Metal Oxide-Alkali Carbonate-
Based, Low-Temperature Thermochemical Cycles for Water Splitting and CO2
Reduction. Chemistry of Materials, 25(9), pp.1564-1571.
27. Liu, X., Zhou, K., Wang, L., Wang, B. and Li, Y., 2009. Oxygen vacancy clusters
promoting reducibility and activity of ceria nanorods. Journal of the American
Chemical Society, 131(9), pp.3140-3141.
28. R. D. Waldron, Infrared spectra of ferrites, Phys. Rev., 1955, 99, 1727-1735.
29. M. A. Legodi, Raman Spectroscopy Applied to Iron Oxide Pigments from Waste
Materials and Earthenware Archaeological Objects, University of Pretoria etd –
Legodi, M A (2008).
30. Shebanova, O. N. and Lazor, P., 2003. Raman spectroscopic study of magnetite
(Fe2O4): a new assignment for the vibrational spectrum. Journal of Solid State
Chemistry, 174(2), pp.424-430.
31. Witke, K., Götze, J., Robler, R., Dietrich, D. and Marx, G., 2004. Raman and
cathode luminescence spectroscopic investigations on Permian fossil wood from
Chemnitz, a contribution to the study of the permineralisation process.
Spectrochimica Acta Part A: Molecular and Biomolecular Spectroscopy, 60(12),
pp.2903-2912.
32. Hanesch, M., 2009. Raman spectroscopy of iron oxides and (oxy) hydroxides at low
laser power and possible applications in environmental magnetic studies.
Geophysical Journal International, 177(3), pp.941-948.

178
33. Chaubey, N., Wani, B. N., Bharadwaj, S. R. and Chattopadhyaya, M. C., 2013.
Physicochemical properties of rare earth doped ceria Ce0.9Ln0.1O1.95 (Ln = Nd, Sm,
Gd) as an electrolyte material for IT-SOFC/SOEC. Solid State Sciences, 20, pp.135-
141.
34. Kuntaiah, K., Sudarsanam, P., Reddy, B. M. and Vinu, A., 2013. Nanocrystalline
Ce1−xSmxO2−δ (x = 0.4) solid solutions: structural characterization versus CO
oxidation. RSC Advances, 3(21), pp.7953-7962.
35. Li, L., Chen, F., Lu, J. Q. and Luo, M. F., 2011. Study of Defect Sites in Ce1–
xMxO2−δ (x = 0.2) Solid Solutions Using Raman Spectroscopy. The Journal of
Physical Chemistry A, 115(27), pp.7972-7977.
36. Korotcov, A. V., Huang, Y. S., Tiong, K. K. and Tsai, D. S., 2007. Raman
scattering characterization of well‐aligned RuO2 and IrO2 nanocrystals. Journal of
Raman Spectroscopy, 38(6), pp.737-749.
37. Lin, J., Li, L., Huang, Y., Zhang, W., Wang, X., Wang, A. and Zhang, T., 2011. In
situ calorimetric study: structural effects on adsorption and catalytic performances
for CO oxidation over Ir-in-CeO2 and Ir-on-CeO2 catalysts. The Journal of Physical
Chemistry C, 115(33), pp.16509-16517.
38. Esch, F., Fabris, S., Zhou, L., Montini, T., Africh, C., Fornasiero, P., Comelli, G.
and Rosei, R., 2005. Electron localization determines defect formation on ceria
substrates. Science, 309(5735), pp.752-755.
39. Shao, Z., Xiong, G., Tong, J., Dong, H. and Yang, W., 2001. Ba effect in doped Sr
(Co0.8Fe0.2)O3-δ on the phase structure and oxygen permeation properties of the
dense ceramic membranes. Separation and Purification Technology, 25(1), pp.419-
429.
40. Shuyan, L., Zhe, L., Xiqiang, H., Bo W., Wenhui, S., 2007. Electrical and thermal
properties of (Ba0.5Sr0.5)1−xSmxCo0.8Fe0.2O3−δ perovskite oxides, Solid State Ionics
178.pp. 417–422.

179
CHAPTER 8
Effects of surfactant on the performance of samarium doped ceria
(Ce0.8Sm0.2O2) perovskites as electrolyte for low temperature SOFC
application
Summary
This chapter has been formatted in paper format to incorporate further comments and
corrections by the examiners
Abstract
In our current work, we have adapted sol-gel technique that takes advantage of the
structural directing properties, and templating characteristics of Pluronic F-127 surfactant
to produce porous samarium doped ceria (SDC) nanoparticles. The electrolyte material was
calcined at 800 °C, the crystalline nanostructures and microstructures were characterized by
X-ray diffraction spectroscopy and high resolution transmission electron microscopy.
Textural characteristics and morphology of the particles were characterized by nitrogen
sorption at 77.5 K and scanning electron microscopy. The electrochemical properties were
characterised by using Kittec Squadro SOFC testing equipment with air and hydrogen as
gases used. Our results show that the nature of the surfactant influenced the particle
morphology, pore diameter, pore size, crystallite size, surface area and the electrochemical
properties.
Key words: Solid oxide fuel cell, Cerium, Samarium, Surfactant, Air, Sol-gel technique

180
1.0 Introduction
Sol-gel technique is a unique and adaptable technique frequently used to produce ceramic
oxide materials and perovskite materials with controlled structure [1, 2]. These materials
are produced by two methods, the hydrolysis of the metal alkoxide precursor and its
condensation [3] and aggregation of aqueous colloidal dispersions, containing discrete
particles which lead to formation of materials with tailored microstructure [4, 5]. The
addition of surfactants in synthesizing metal oxides at ambient temperatures leads to
production of composite materials that are homogeneously distributed throughout the
resulting matrix and controls. The interfacial tension between the non-polar and polar
phases and thus control the droplet sizes [6]. This causes changes in the physical
characteristics such as density, pore size, nanostructure of the oxides produced and
restrictionsin aggregation of metallic nanoparticles into matrices by sol–gel processing [7].
The materials can also be tailored by controlling the sol–gel reaction kinetics and the
relative rates of hydrolysis and condensation [8 - 12].
Ce0.8Sm0.2O2 (SDC) has been considered as a suitable electrolyte that can operate
effectively at temperatures below 700 °C. At these temperatures they possess high ionic
conductivity in air, have superb redox properties and contain high density of surface
oxygen vacancies, resulting from the population of mixed valence states [13 - 16]. They
also possess better chemical compatibility with high performance cathode materials [17 -
19]. Operating at low temperatures the electrolyte is susceptible to reduction on the anode
side and grain boundary resistance is a significant impediment to ionic conductivity [20].
Hence surfactant can be used to improve its performance at these temperatures.
The surfactant used in this experiment is Pluronic F-127, which has been proven to provide
better stabilization of the micelle walls, reduction in the inter-droplet exchange, resulting in
the production of smaller particles, smaller crystals and the avoidance of the aggregation of
the metallic nanoparticles into matrices [6]. Pluronic F-127 was added in different masses
of (2 to 5 g) to SDC electrolyte to confirm its effect on the electrolyte material. This
surfactant-assisted technique may provide an electrolyte material with appropriate pore
181
diameter, high surface areas and a better access to the active sites [21 – 23]. The support
has a fundamental role in determining the nature, number of active sites and the activity of
the catalyst.
2.0 Experimental Methods
2.1 Starting materials
The surfactant Pluronic F-127, ceria acetylacetonate hydrate (98 % purity) and samarium
acetylacetonate hydrate (97 % purity) were purchased from sigma aldrich chemicals USA.
The chemical reagents were used as acquired from their commercial sources without further
purification.
2.2 Preparation of Ce0.8Sm0.2O2 with surfactant
The synthesis was carried out by adding 0.7200 g of cerium acac and 0.3250 g of samarium
acac to 50ml of ethanol and 15ml of deionized water as the solvent. The mixture was stirred
in anultrasonic bath (UMC 20 Ultrasonic cleaner, 50 kHz and 220 W) for 30 mins. The
mass of 2 to 5 g of Pluronic F-127 was added to each of the mixture. The mixtures were
stirred using a magnetic stirrer on a hot plate for 30 mins at a temperature of 80 C, to form
a sol. The hydrolysis, condensation and solvent evaporation was very rapid and therefore
the collapse of the gel network was also rapid as a result of the surfactant. The sol was left
to dry in an oven for 24hrs and then calcined using a muffle furnace (Kittec Squadro 1350)
at 800 C for 4 hrs.
2.3 Preparation of Ce0.8Sm0.2O2 without surfactant
0.7200 g of cerium acac and 0.3250 g of samarium acac was added to 50 ml of ethanol and
15 ml of deionized water as solvents. The mixture was sonicated for 30 mins using an
ultrasonic bath (UMC 20 Ultrasonic cleaner, 50 kHz and 220 W). The mixture was stirred
using a magnetic stirrer on a hot plate for 2 hrs at 80C, to form a sol. The hydrolysis and
condensation occurred slowly and the solvent evaporation was sluggish. The gel formed
was allowed to dry at atmospheric temperature for 4 hrs at 150 C and then calcined using a

182
muffle furnace (Kittec squadro SQ11) at 800 C for 4 hrs. A summary of the process is
stated in table 1.
Table 1: Summary of the synthesis processes of Ce0.8Sm0.2O2 and Pluronic F-127.
Surfactant
Name
Sample ID Mass of Sample
(g)
No Surfactant SDC 1 No surfactant
Pluronic F127 SDC 2 2g
Pluronic F127 SDC 3 3g
Pluronic F127 SDC 4 4g
Pluronic F127 SDC 5 5g
2.4 Characterization
X-ray diffractometer (XRD) (Phillips PW 3710, 30 kV voltage and 35 mA current, Cu-Kα
radiation 1.5406 Åwavelength) was used to analyze the crystallite structure, crystal size,
lattice spacing and the phase present in the powder. The XRD diffractogram were recorded
in the interval of 20 at a scan speed of 2 / min. The mean crystallite size ‘D’
was calculated using the Scherrer equation:
D
(1)
where λ is the X-ray wavelength (1.5406 Å), β is the full width at half maximum of the
diffraction line and is the diffraction angle.
Fourier transform infrared spectroscopy (Perkin Elmer 1200 ATR- FTIR) was used to
perform the infrared spectra analysis. Raman spectroscopy was analysed with DeltaNu
advantage 532™ spectrometer (100 mW Nd:YAG laser with an excitation wavelength of
532 nm). The JOEL 2100 HRTEM (200 kV accelerating voltage, beam current of 110 µA
and a current density of 2.4 pA/cm2) was used to analyse the lattice fringes, low
magnification and diffraction patterns in the material. The morphology and grain size of
samarium doped ceria powder was investigated with ZEISS FEGSEM Ultra Plus scanning

183
electron microscopy and the samples were coated with gold before the examination.
Nitrogen adsorption and desorption (BET) was examined in a Micromeritics Tristar II 3020
V1.03 to find the surface area and porosity. For nitrogen desorption and absorption the
samples were degassed using the vacuum degasser (Micromeritics VacPrep 061 sample
Degas system) for 1 hr at 90 C thenincreased to 200 C to run overnight. The samples
were then put in the BET instrument using Nitrogen at 77 K, to carry out the process.
2.5 Single cell fabrication
The cells were prepared by moulding the materials using a 20 Ton press and a 1.3 cm die
kit. The press was made from strong steel and the die kit was made from stainless steel. For
the SSFC material, 0.1435 g of the sample was placed into the die kit mould and 15 Tons of
pressure was then applied using the 20 Ton press. 0.1545 g of NiO-SDC was used to make
the anode and 0.2100 g of SDC- surfactant was used to prepare the electrolyte using the
same method. The discs had a total active area of 1.327 cm2. The single cell discs was made
up of three layers with the electrolyte in between the anode and the cathode, then heat
treated to 500 °C for 2 hrs at a steady heating rate of 5 °C/min, The electrolyte was
estimated to be 100 µm thick, the cathode was 100 µm thick and the anode was 100 µm
thick.
2.6 Electrochemical characterisation
The symmetrical cells were tested at 400 to 500 °C in 20 % H2O/H2 mixture and in air (O2).
Platinum mesh was placed on both electrodes which are used as a current and voltage
collector. The gases (H2O/H2 and O2) were passed through a pipe into the cell and it was
controlled using flow metres. H2 gas was passed through a gas bubbler to humidify the gas.
For each cycle of the polarisation curve, the voltage was kept constant and current was
measured. The current measurement was collected with a Nuvant™ Powerstat 05
potentiostat and galvanostat, attached to the SOFC device.
184
The ionic conductivity was calculated using these equations [24, 25]:
(2)
where, l is the electrolyte thickness, S is the electrode area of the electrolyte surface and R
is resistance in ohms (cell resistance).
The activation energy and the DC electrical conductivity can be calculated using the
Arrhenius relationship [25]:
(3)
where, Ea is the activation energy of conduction, T is the absolute temperature, σo
is the pre-
exponential factor and k is the Boltzmann constant.
3.0 Results and discussion
3.1 Powder XRD analysis
The XRD results of samarium doped ceria (SDC) can be seen in Figure 1. This confirms
the structural pattern for SDC. The addition of surfactants in the sol-gel process caused
changes to the structural pattern by increasing its intensity. The diffractogram shows only
one main peak and other smaller peaks that decreased in peak intensity from left to right as
the angle 2 increased, with very sharp peaks.
The structure system was cubic corresponding to a FCC lattice and the diffracted peaks
were located at 2θ values of 28.88°, 33.43°, 47.75°, 56.56°, 59.29°, 69.54°, 76.76°, 79.12°
and 88.32° that were indexed as (111), (200), (220), (311), (222), (400), (331), (420),
(JCPDS file NO. 00-034-0394). The average crystallite sizes were 3.63 nm, 5.46 nm, 13.55
nm, 15.95 nm and 17.50 nm for SDC1 to SDC5 respectively which was calculated from
Scherrer equation using the most intense peak as shown in Table 2. This confirms that the
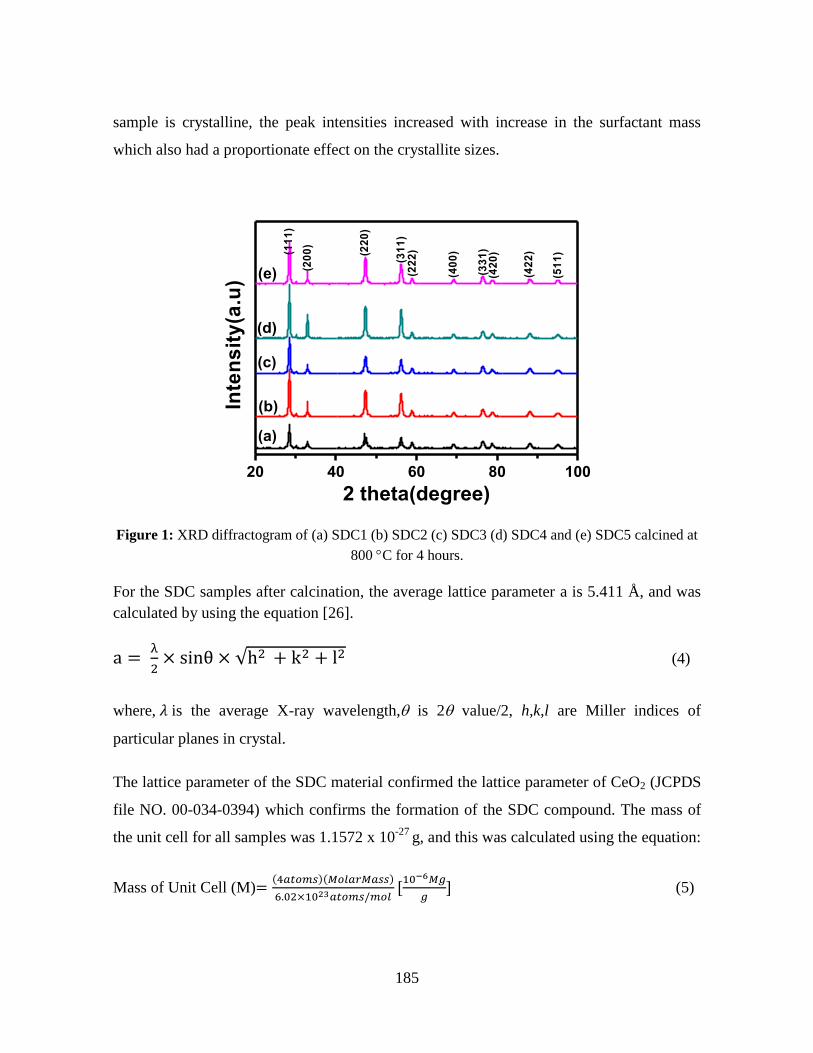
185
sample is crystalline, the peak intensities increased with increase in the surfactant mass
which also had a proportionate effect on the crystallite sizes.
Figure 1: XRD diffractogram of (a) SDC1 (b) SDC2 (c) SDC3 (d) SDC4 and (e) SDC5 calcined at
800 C for 4 hours.
For the SDC samples after calcination, the average lattice parameter a is 5.411 Å, and was
calculated by using the equation [26].
(4)
where, is the average X-ray wavelength, is 2 value/2, h,k,l are Miller indices of
particular planes in crystal.
The lattice parameter of the SDC material confirmed the lattice parameter of CeO2 (JCPDS
file NO. 00-034-0394) which confirms the formation of the SDC compound. The mass of
the unit cell for all samples was 1.1572 x 10⁻²⁷
g, and this was calculated using the equation:
Mass of Unit Cell (M)
(5)
20 40 60 80 100
Inte
ns
ity
(a.u
)
2 theta(degree)
(a)
(b)
(c)
(d)
(e)(1
11
)
(20
0)
(22
0)
(31
1)
(22
2)
(40
0)
(33
1)
(42
0)
(42
2)
(51
1)
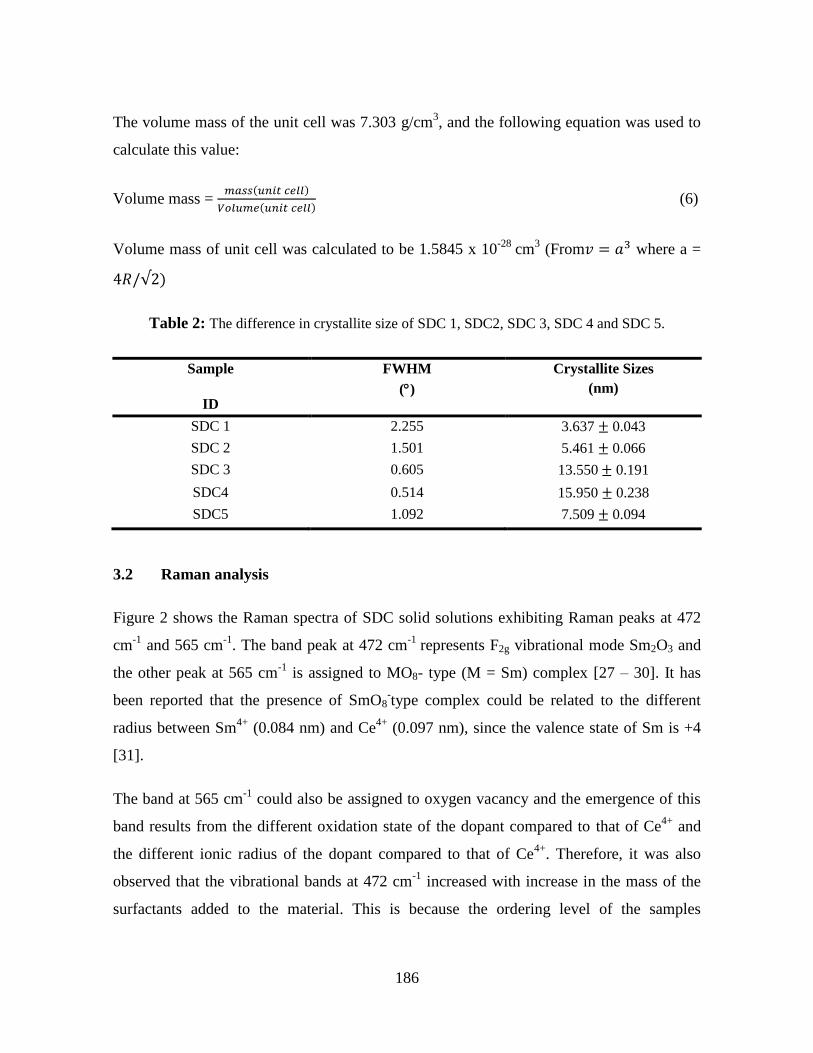
186
The volume mass of the unit cell was 7.303 g/cm3, and the following equation was used to
calculate this value:
Volume mass =
(6)
Volume mass of unit cell was calculated to be 1.5845 x 10⁻²⁸
cm3 (From where a =
Table 2: The difference in crystallite size of SDC 1, SDC2, SDC 3, SDC 4 and SDC 5.
Sample
ID
FWHM
()
Crystallite Sizes
(nm)
SDC 1 2.255 3.637 0.043
SDC 2 1.501 5.461 0.066
SDC 3 0.605 13.550 0.191
SDC4 0.514 15.950 0.238
SDC5 1.092 7.509 0.094
3.2 Raman analysis
Figure 2 shows the Raman spectra of SDC solid solutions exhibiting Raman peaks at 472
cm-1
and 565 cm-1
. The band peak at 472 cm-1
represents F2g vibrational mode Sm2O3 and
the other peak at 565 cm-1
is assigned to MO8- type (M = Sm) complex [27 – 30]. It has
been reported that the presence of SmO8-type complex could be related to the different
radius between Sm4+
(0.084 nm) and Ce4+
(0.097 nm), since the valence state of Sm is +4
[31].
The band at 565 cm-1
could also be assigned to oxygen vacancy and the emergence of this
band results from the different oxidation state of the dopant compared to that of Ce4+
and
the different ionic radius of the dopant compared to that of Ce4+
. Therefore, it was also
observed that the vibrational bands at 472 cm-1
increased with increase in the mass of the
surfactants added to the material. This is because the ordering level of the samples

187
increases with increasing surfactant and the lattice becomes more perfect, leading to the
declining concentration of the defect sites.
Figure 2: Raman spectra of (a) SDC 1 (b) SDC 2 (c) SDC 3 (d) SDC 4 and (e) SDC 5 calcined at
800 C for 4 hours.
3.3 HRTEM analysis
Figure 3 shows the lattice fringes and low magnification of SDC mixed with surfactants.
The microstructure shows that it is crystalline with the evidence of large visible particles.
The representative images showed the microstructure for all samples, which reveal slight
differences such as specific irregular shaped particles and varying crystalline shapes. We
note that there are differences in the powdered crystals as observed in the XRD data in
terms of the crystal sizes.
The lattice distance between the fringes for SDC 1 was 0.183 nm indexed to (220), SDC 2
is 0.157 nm indexed to (222), SDDC 3 is 0.202 nm indexed to (220), SDC 4 is 0.207 nm
indexed to (211) and SDC 5 is 0.190 nm indexed to (220). These lattice parameters are
linked to the XRD as SmO2 structure and CeO2 (fluorite) structures. The presence of CeO2

188
fluorite structure on the HRTEM as shown in the XRD reveals a concentration of O2
vacancies on the surface. The presence of oxygen (O2) vacancies influences oxygen ion
diffusion paths through the electrolyte. The selected area electron diffraction patterns
differed slightly in terms of the lattice and arrangements of the particles, showing slight
scattering and disorder of the lattice, thus displaying a decrease in crystallinity as the
surfactants added to the electrolyte decreased.
Figure 3: Low magnification and lattice fringe of the High Resolution TEM for (a.) SDC1
(b).SDC 2 (c).SDC3 (d).SDC 4 and (e).SDC 5 Calcined at 800 °C for 4 hours.
3.4 SEM analysis
Figure 4 show images of SDC prepared using Pluronic F-127 as surfactant, the figure
reveal that particles prepared with Pluronic F-127 exposed a low conglomeration but a wide
size distribution. The SEM image for all the materials synthesized, showed an accumulation
of metal acacs bonded together to form agglomerates. These particles are held together by
the strong and weak bonds that exist between the metal acacs. The particles were separated
(a) (b) (c)
(d) (e)
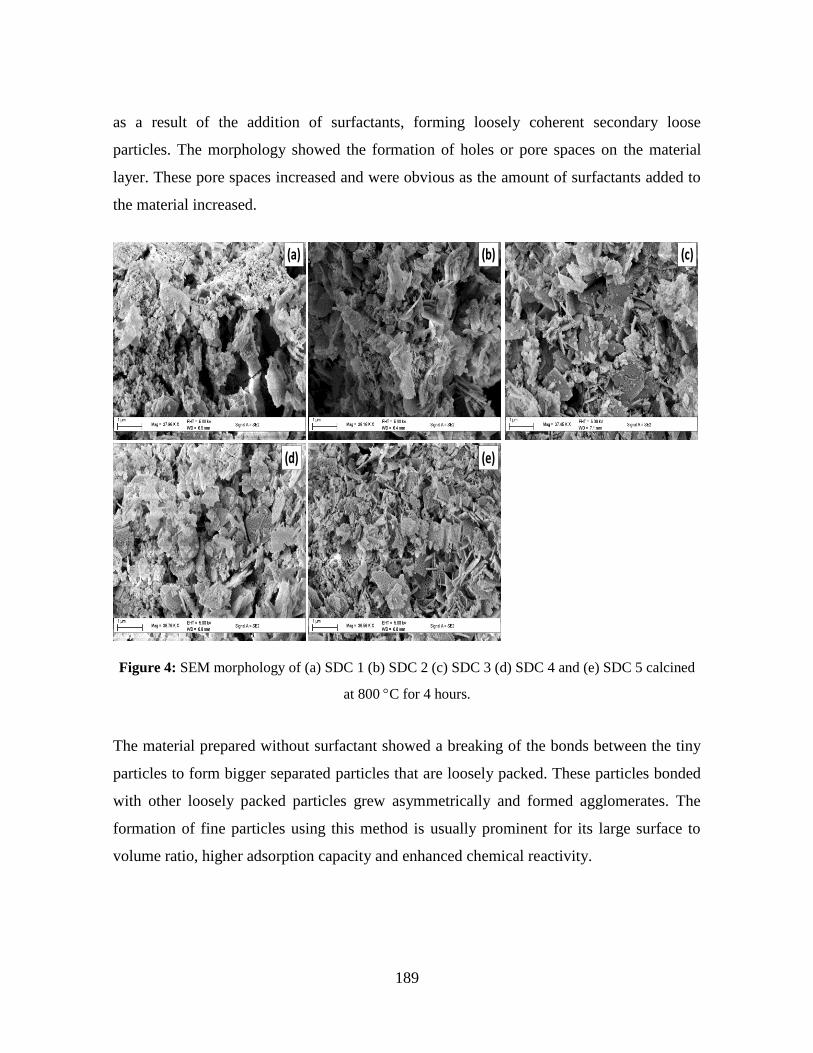
189
as a result of the addition of surfactants, forming loosely coherent secondary loose
particles. The morphology showed the formation of holes or pore spaces on the material
layer. These pore spaces increased and were obvious as the amount of surfactants added to
the material increased.
Figure 4: SEM morphology of (a) SDC 1 (b) SDC 2 (c) SDC 3 (d) SDC 4 and (e) SDC 5 calcined
at 800 C for 4 hours.
The material prepared without surfactant showed a breaking of the bonds between the tiny
particles to form bigger separated particles that are loosely packed. These particles bonded
with other loosely packed particles grew asymmetrically and formed agglomerates. The
formation of fine particles using this method is usually prominent for its large surface to
volume ratio, higher adsorption capacity and enhanced chemical reactivity.
(a) (b) (c)
(d) (e)
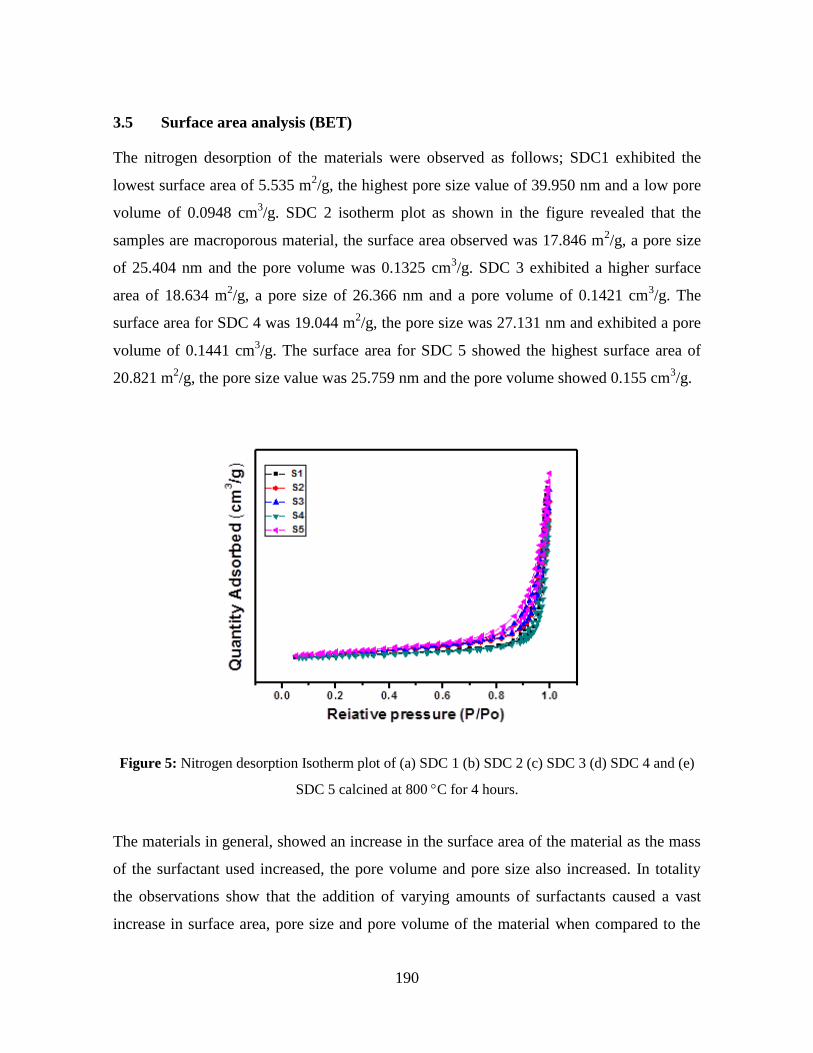
190
3.5 Surface area analysis (BET)
The nitrogen desorption of the materials were observed as follows; SDC1 exhibited the
lowest surface area of 5.535 m2/g, the highest pore size value of 39.950 nm and a low pore
volume of 0.0948 cm3/g. SDC 2 isotherm plot as shown in the figure revealed that the
samples are macroporous material, the surface area observed was 17.846 m2/g, a pore size
of 25.404 nm and the pore volume was 0.1325 cm3/g. SDC 3 exhibited a higher surface
area of 18.634 m2/g, a pore size of 26.366 nm and a pore volume of 0.1421 cm
3/g. The
surface area for SDC 4 was 19.044 m2/g, the pore size was 27.131 nm and exhibited a pore
volume of 0.1441 cm3/g. The surface area for SDC 5 showed the highest surface area of
20.821 m2/g, the pore size value was 25.759 nm and the pore volume showed 0.155 cm
3/g.
Figure 5: Nitrogen desorption Isotherm plot of (a) SDC 1 (b) SDC 2 (c) SDC 3 (d) SDC 4 and (e)
SDC 5 calcined at 800 C for 4 hours.
The materials in general, showed an increase in the surface area of the material as the mass
of the surfactant used increased, the pore volume and pore size also increased. In totality
the observations show that the addition of varying amounts of surfactants caused a vast
increase in surface area, pore size and pore volume of the material when compared to the
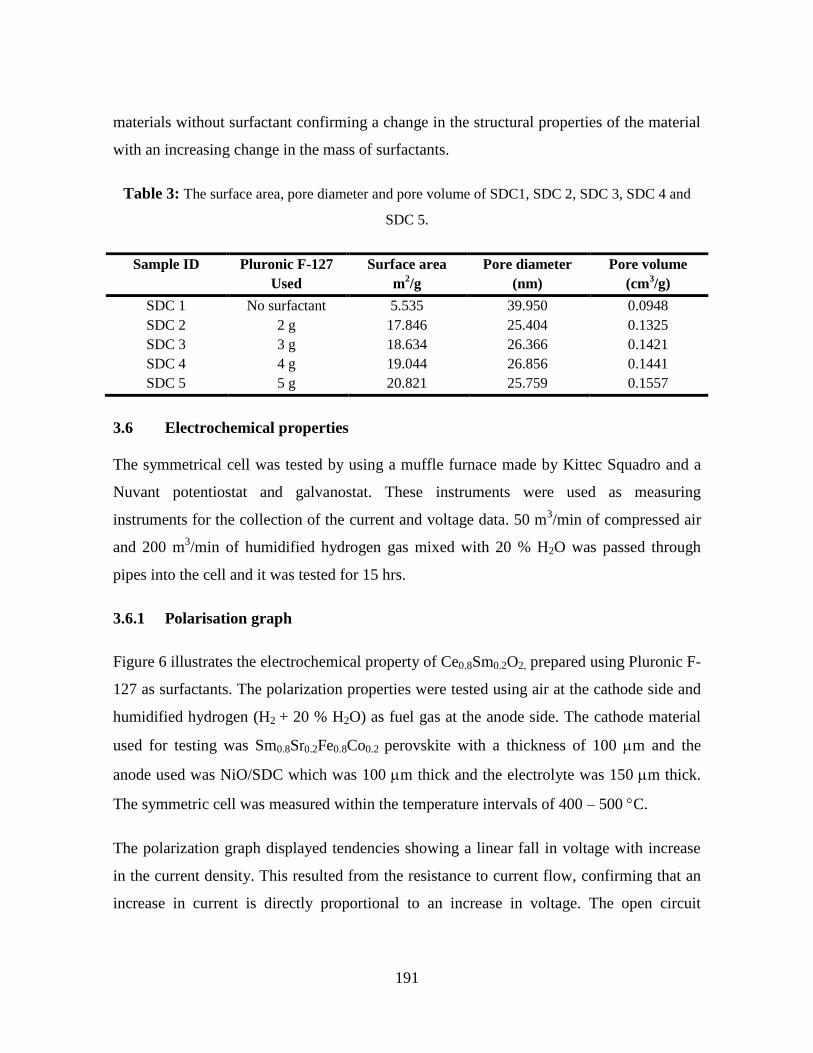
191
materials without surfactant confirming a change in the structural properties of the material
with an increasing change in the mass of surfactants.
Table 3: The surface area, pore diameter and pore volume of SDC1, SDC 2, SDC 3, SDC 4 and
SDC 5.
Sample ID Pluronic F-127
Used
Surface area
m2/g
Pore diameter
(nm)
Pore volume
(cm3/g)
SDC 1 No surfactant 5.535 39.950 0.0948
SDC 2 2 g 17.846 25.404 0.1325
SDC 3 3 g 18.634 26.366 0.1421
SDC 4 4 g 19.044 26.856 0.1441
SDC 5 5 g 20.821 25.759 0.1557
3.6 Electrochemical properties
The symmetrical cell was tested by using a muffle furnace made by Kittec Squadro and a
Nuvant potentiostat and galvanostat. These instruments were used as measuring
instruments for the collection of the current and voltage data. 50 m3/min of compressed air
and 200 m3/min of humidified hydrogen gas mixed with 20 % H2O was passed through
pipes into the cell and it was tested for 15 hrs.
3.6.1 Polarisation graph
Figure 6 illustrates the electrochemical property of Ce0.8Sm0.2O2, prepared using Pluronic F-
127 as surfactants. The polarization properties were tested using air at the cathode side and
humidified hydrogen (H2 + 20 % H2O) as fuel gas at the anode side. The cathode material
used for testing was Sm0.8Sr0.2Fe0.8Co0.2 perovskite with a thickness of 100 m and the
anode used was NiO/SDC which was 100 m thick and the electrolyte was 150 m thick.
The symmetric cell was measured within the temperature intervals of 400 – 500 C.
The polarization graph displayed tendencies showing a linear fall in voltage with increase
in the current density. This resulted from the resistance to current flow, confirming that an
increase in current is directly proportional to an increase in voltage. The open circuit
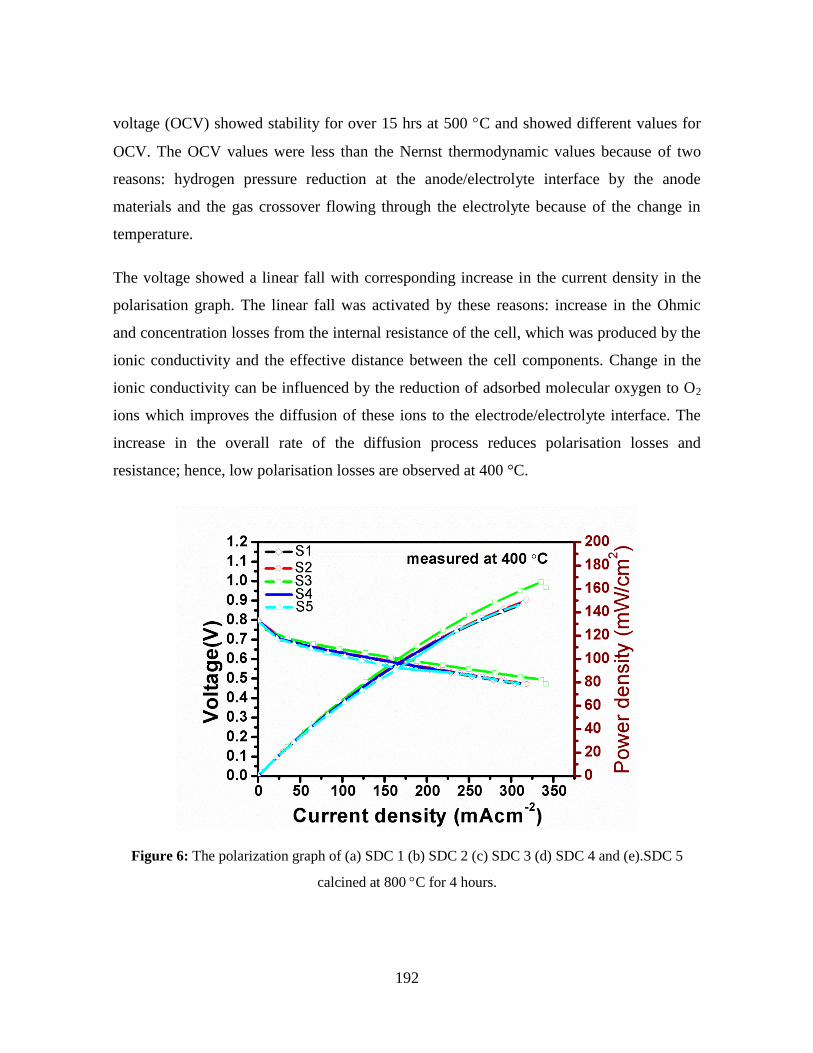
192
voltage (OCV) showed stability for over 15 hrs at 500 C and showed different values for
OCV. The OCV values were less than the Nernst thermodynamic values because of two
reasons: hydrogen pressure reduction at the anode/electrolyte interface by the anode
materials and the gas crossover flowing through the electrolyte because of the change in
temperature.
The voltage showed a linear fall with corresponding increase in the current density in the
polarisation graph. The linear fall was activated by these reasons: increase in the Ohmic
and concentration losses from the internal resistance of the cell, which was produced by the
ionic conductivity and the effective distance between the cell components. Change in the
ionic conductivity can be influenced by the reduction of adsorbed molecular oxygen to O2
ions which improves the diffusion of these ions to the electrode/electrolyte interface. The
increase in the overall rate of the diffusion process reduces polarisation losses and
resistance; hence, low polarisation losses are observed at 400 °C.
Figure 6: The polarization graph of (a) SDC 1 (b) SDC 2 (c) SDC 3 (d) SDC 4 and (e).SDC 5
calcined at 800 C for 4 hours.

193
The maximum power density for the SDC-surfactant samples calcined at 800 °C with
different wt % are shown in Figure 7. The power densities were measured at 400 °C and
500 °C and SDC 3 presented the maximum power density of 140.61 mW/cm2 at 500 °C and
161.24 mW/cm2
at 400 °C. Therefore, at each test temperature, the SDC 3 sample showed
the largest power density; however the electrolyte presented a better performance at lower
temperature. These results could have some implication for application, depicting that the
electrolytes made, can perform better at 400 C than 500 C and it exhibits a moderate
power output from a non-ideal single cell. Improvements can be achieved by using thin
electrolyte and suitable cathode and anode materials, using tape casting or dip coating
methodologies to control and optimize adhesion between the layers.
Figure 7: The Power density graph of (a) SDC 1 (b).SDC 2 (c).SDC 3 (d).SDC 4 and (e).SDC 5
calcined at 800 C for 4 hours.
3.6.2 Area Specific Resistance
The area specific resistance (ASR) can be calculated from the gradient, at the centre of the
linear fall representing the voltage to current graph of the IV curve where ohmic resistance
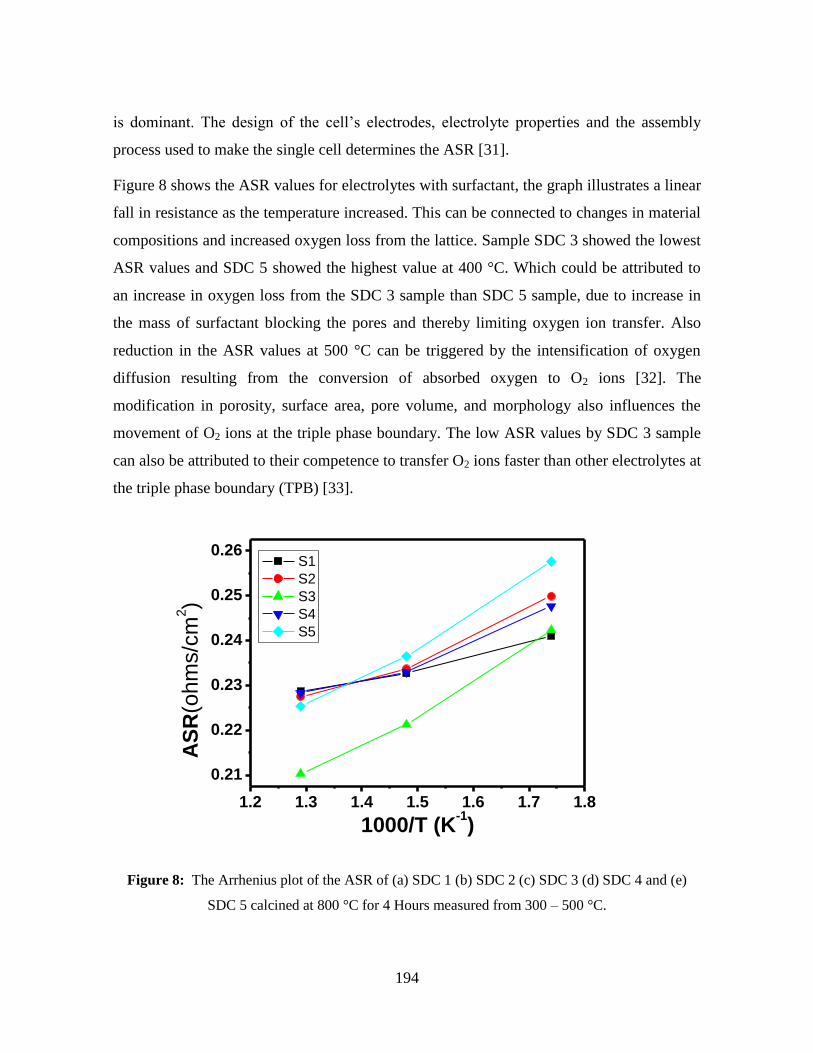
194
is dominant. The design of the cell’s electrodes, electrolyte properties and the assembly
process used to make the single cell determines the ASR [31].
Figure 8 shows the ASR values for electrolytes with surfactant, the graph illustrates a linear
fall in resistance as the temperature increased. This can be connected to changes in material
compositions and increased oxygen loss from the lattice. Sample SDC 3 showed the lowest
ASR values and SDC 5 showed the highest value at 400 °C. Which could be attributed to
an increase in oxygen loss from the SDC 3 sample than SDC 5 sample, due to increase in
the mass of surfactant blocking the pores and thereby limiting oxygen ion transfer. Also
reduction in the ASR values at 500 °C can be triggered by the intensification of oxygen
diffusion resulting from the conversion of absorbed oxygen to O2 ions [32]. The
modification in porosity, surface area, pore volume, and morphology also influences the
movement of O2 ions at the triple phase boundary. The low ASR values by SDC 3 sample
can also be attributed to their competence to transfer O2 ions faster than other electrolytes at
the triple phase boundary (TPB) [33].
Figure 8: The Arrhenius plot of the ASR of (a) SDC 1 (b) SDC 2 (c) SDC 3 (d) SDC 4 and (e)
SDC 5 calcined at 800 °C for 4 Hours measured from 300 – 500 °C.
1.2 1.3 1.4 1.5 1.6 1.7 1.8
0.21
0.22
0.23
0.24
0.25
0.26
AS
R(o
hm
s/c
m2)
1000/T (K-1)
S1
S2
S3
S4
S5

195
4.0 Conclusions
Pluronic F-127 surfactant was mixed with SDC to improve its ability to perform better than
conventional SDC in this experiment. The crystal structure was investigated by X-ray
diffraction and the structural properties were investigated by Raman spectroscopy. The
morphology, microstructure and textural characteristics were investigated by SEM,
HRTEM and BET respectively. The electrochemical properties was investigated using a
potentiostat and galvanostat. The XRD revealed an increase in the crystallite sizes of the
materials with surfactant when compared to the material without surfactant. Nitrogen
desorption analysis showed that the surface area and porosity of the material increased with
increasing mass of surfactant when compared to the ordinary SDC. The Raman spectra
displayed a high structural stability and high oxygen vacancy concentration. SDC combined
with 3 g of surfactant produced the highest power density of 161.24 mW/cm2
and a current
density of 325.90 mA/cm2 at 400 °C powered for 15 hrs. When compared to contemporary
SDC without surfactant, it produced a power density of 144.289 mW/cm2
at 400 C. This
describes that the electrolyte material works best with the addition of surfactant and also
works best at lower temperatures. The properties reveal that the electrolyte material mixed
with surfactant can be used as a promising electrolyte for low temperature solid oxide fuel
cell.
Acknowledgements
The authors thank the University of KwaZulu-Natal, for granting access to research
facilities for my research, ESKOM-TESP and NRF THUTUKA for their financial support.
References
[1] M. Sharma, J. Peng, Synthesis of magnesium oxide particles with stacks of plate’s
morphology, J.Alloys Compd. 509 (2011) 7881 - 7885.

196
[2] M. S. Mastuli., N. S. Ansaria, M. A. Nawawia, A. Maria, Effects of cationic
surfactant in sol-gel synthesis of nano-sized magnesium oxide. APCBEE Procedia,
3 (2012) 93 – 98.
[3] L. Zhongliang, J. N. Dai, J. Qiao, Y. Yan, Z. Wang, J. Wang, K. Sun, High
performance La3Ni2O7 cathode prepared by a facile sol–gel method for intermediate
temperature solid oxide fuel cells, Electro. Comm. 22 (2012)97-100.
[4] N. I. Ermokhina, V. A.Nevinsky, P. A. Manorik, V. G. Ilyin, N. N. Shcherbatyuk,
D. O. Klymchyuk, A. M. Puziy, Synthesis of large pore mesoporousnano crystalline
TiO2 microspheres, Materials Letters, 75 (2012) 68 – 70.
[5] K. T. Parada , G. V. A. A. Mantilla , M. A. Valenzuela, E. Hernández, Synthesis
and characterization of Ni/Ce–SiO2 and Co/Ce–TiO2 catalysts for methane
decomposition, Fuel 110 (2013) 70 – 75.
[6] S. K. Das, A. K. Sinha, A. Bhaumik, Self-assembled mesoporous zirconia and
sulfated zirconia nanoparticles synthesized by triblock copolymer as template, J.
Phys. Chem. 113 (2009) 8918 – 8923.
[7] J. Milewski, A. Miller, Influences of the type and thickness of electrolyte on solid
oxide fuel cell hybrid system performance, Journal of Fuel Cell Science and
Technology 3(4) (2006) 396 – 402.
[8] S. B. Adler, Factors governing oxygen reduction in solid oxide fuel cell cathodes,
Chem. Rev. 104 (2004) 4791 – 4843.
[9] A. V. Vikar, J. Chen, C. W. Tanner, J. W. Kim, The role of electrode microstructure
on activation and concentration polarizations in solid oxide fuel cells, Solid State
Ionics 131 (2000)189 –198.
[10] E. P. Murray, M. J. Sever, S. A. Barnett, Electrochemical performance of (La,Sr)
(Co,Fe)O3– (Ce,Gd)O3 composite cathodes, Solid State Ionics 148 (2002) 27 – 34.
[11] W. Guo, J. Liu, C. Jin, H. Gao, Y. Zhang, Electrochemical evaluation of La0.6Sr0.4
Co0.8Fe0.2O3–δ–La0.9Sr0.1Ga0.8Mg0.2O3–δ composite cathodes for La0.9Sr0.1Ga0.8Mg0.2
O3–δ electrolyte SOFCs, J. Alloys Compd. 473 (2008) 43 – 47.

197
[12] F. Qiang, K. N. Sun, N. Zhang, X. D. Zhu, X. D. Lee, D. R. Zhou, Characterization
of electrical properties of GDC doped A-Site deficient LSCF based composite
cathode using impedance spectroscopy, J. Power Sources, 168 (2007) 338 – 345.
[13] R. W. Tarnuzzer, J. Colon, S. Patil, S. Seal, Vacancy engineered ceria
nanostructures for protection from radiation-induced cellular damage, Nano letters,
5 (2005) 2573-2577.
[14] T. Pirmohamed, J. M. Dowding, S. Singh, B. Wasserman, E. Heckert, A. S.
Karakoti, J. E. S. King, W. T. Self, Nanoceria exhibit redox state-dependent catalase
mimetic activity, Chemical communications, 46 (2010) 2736-2738.
[15] E. G. Heckert, A. S. Karakoti, S. Seal, W. T. Self, The role of cerium redox state in
the SOD mimetic activity of nanoceria, Biomaterials, 29 (2008) 2705-2709.
[16] D. A. Andersson, S. I. Simak, B. Johansson, I. A. Abrikosov, N. V. Skorodumova,
Modeling of CeO2, Ce2O3 and CeO2− x in the LDA+ U formalism, Physical Review
B, 75 (2007) 035109.
[17] W. G. Wang, M. Mogensen, High-performance lanthanum ferrite based cathode for
SOFC, Solid State Ionics, 176 (2005) 457-462.
[18] X. Xu, C. Xia, G. Xiao, D. Peng, Fabrication and performance of functionally
graded cathodes for IT-SOFCs based on doped ceria electrolytes, Solid State Ionics,
176 (2005) 1513-1520.
[19] Z. Bi, M. Cheng, Y. Dong, H. Wu, Y. She, B. Yi, Electrochemical evaluation of
La0.6Sr0.4CoO3–La0.45Ce0.55O2 composite cathodes for anode-supported La0.45Ce0.55
O2–La0.9Sr0.1Ga0.8Mg0.2O2.85 bilayer electrolyte solid oxide fuel cells, Solid State
Ionics, 176 (2005) 655-661.
[20] J. M. Ralph, J. A. Kilner, B. C. H. Steele, Improving Gd-doped ceria electrolytes for
low temperature solid oxide fuel cells," New Materials for batteries and fuel cells.
Proc. Symp. San Francisco, 14 (1999) 309-3257.
[21] P. Blennow, J. Heljm, T. Klemens, S. Ramousse, A. Kromp, A. Leonide, A. Weber,
Manufacturing and characterization of metal-supported solid oxide fuel cells,
Journal of Power Sources, 196 (2011) 7117– 7125.

198
[22] C. Shen, L. L. Shaw, FTIR analysis of the hydrolysis rate in the sol–gel formation
of gadolinia-doped ceria with acetylacetonate precursors, J. Sol-gel Sci Technol., 53
(2010) 571 – 577.
[23] M. C. Brasil, E. V. Benvenutti, J. R. Gregorio, A. E. Gerbase, Iron acetylacetonate
complex anchored on silica xerogel polymer. React. Funct. Polym., 63 (2005) 135 –
141.
[24] C. B. Njoku, P. G. Ndungu, Effect of non-ionic, anionic and cationic surfactants on
the sol gel synthesis of IrO/Ce0.8Sm0.2O2 nanocomposite for solid oxide fuel cell
application, Journal of fuel cell science and technology, 11 (2014) 101 - 109.
[25] H. Okkay, M. Bayramoglu, M. F Öksüzömer, Ce0.8Sm0.2O1.9 synthesis for solid
oxide fuel cell electrolyte by ultrasound assisted co-precipitation method,
Ultrasonics Sonochemistry, 20 (2013) 978 – 983.
[26] N. Chaubey, B. N. Wani, S. R. Bharadwaj, M. C. Chattopadhyaya, Physicochemical
properties of rare earth doped ceria Ce0.9Ln0.1O1.95 (Ln = Nd, Sm, Gd) as an
electrolyte material for IT SOFC/SOEC, Solid State Sciences, 20 (2013) 135 - 141.
[27] K. Kuntaiah, P. Sudarsanam, B. M. Reddy, A. Vinu, Nanocrystalline Ce1−xSmxO2−δ
(x = 0.4) solid solutions: structural characterization versus CO oxidation, RSC
Advances, 3 (2013) 7953 - 7962.
[28] L. Li, F. Chen, J. Q. Lu, M. F. Luo, Study of defect sites in Ce1-xMxO2-δ (x = 0.2)
solid solutions using Raman spectroscopy, Journal of Physical Chemistry A, 115
(2011) 7972 - 7977.
[29] A. M. Torres-Huerta, J. R. Vargas-García, M. A. Domínguez-Crespo, Preparation
and characterization of IrO2 –YSZ nanocomposite electrodes by MOCVD, Solid
State Ionics, 178 (2007) 1608 - 1616.
[30] E. Barsoukov, J. R. Macdonald, Impedance spectroscopy, theory, experiment and
applications 2nd Edition (2005) John Wiley & Sons,Inc., Hoboken, New Jersey.
[31] C. B. Njoku, P. G. Ndungu, Synthesis and characterization of novel Ce0.8Sm0.2
Fe0.9Ir0.03Co0.07O3−δ perovskite material and possible application as a cathode for
low–intermediate temperature SOFCs, Materials Research Bulletin, 68 (2015) 100-
108.

199
[32] Z. Wenxia, Z. Lü, S. Li, B. Wei, J. Miao, X. Huang, K. Chen, N. Ai, W. Su, Study
on Ba0.5Sr0.5Co0.8Fe0.2O3−δ–Sm0.5Sr0.5CoO3−δ composite cathode materials for IT-
SOFCs, Journal of Alloys and Compounds, 465 (2008) 274-279.
[33] F. Esch, S. Fabris, L. Zhou, T. Montini, C. Africh, P. Fornasiero, R. Rosei, Electron
localization determines defect formation on ceria substrates, Science, 309 (2005)
752-755.
200
CHAPTER 9
Comparative study of the properties of Ce1-XSmXO2 (x = 0.1 - 0.4),
Ce0.8Sm0.2O2/Na2CO3, Ce0.8Sm0.2O2/ LiCO3 and Ce0.8Sm0.2O2 /
Na2CO3/LiCO3 electrolytes for application in low temperature SOFC
Summary
This chapter has been formatted in paper format to incorporate further comments and
corrections by the examiners
Abstract
The study utilized sol-gel technique to prepare the electrolytes Ce1-xSmxO2 compo-
sitions (x = 0.1 - 0.4), Ce0.8Sm0.2O2/Na2CO3, Ce0.8Sm0.2O2/LiCO3 and Ce0.8Sm0.2O2/
Na2CO3/LiCO3 composite electrolyte materials, which were calcined at 800 °C. The
powders were characterized using X-ray diffraction, Raman spectroscopy, high
resolution transmission electron microscopy and scanning electron microscopy. The
electrochemical properties were investigated using an open flange test set-up made by
Fiaxell Company, Nuvant™ Powerstat-05 potentiostat and galvanostat used to measure
the current density and voltage. Particle sizes and crystallite sizes varied with
electrolyte compositions and the microstructure became more compact with the
addition of the sodium carbonate and lithium carbonate composites to the electrolyte.
Ce0.8Sm0.2O2 / Na2CO3/LiCO3 electrolyte composites generated the highest current
density and power density, hence can be said to perform better at low temperature
conditions.
Key words: Solid Oxide Fuel Cell, Cerium, Samarium, Electrolytes, Current density.

201
1.0 Introduction
Solid oxide fuel cell is an innovative technological device for the generation of electricity,
because of its high efficiency, low emission of pollutants and fuel flexibility. SOFCs that
operate at high temperatures usually at 1000 °C use yttria stabilized zirconia (YSZ) as
electrolytes [1]. In reducing the operating temperatures of SOFCs, doped ceria have been
extensively studied as electrolytes and samarium doped ceria is considered to be one of the
most promising electrolytes for SOFCs operating below 650 C [2 - 6]. Doped ceria is a
promising electrolyte since it works best at low temperatures, because of its high ionic
conductivity at low temperatures and high electronic conduction at low oxygen partial
pressure resulting from the partial reduction of Ce4+
to Ce3+
[7 - 9].
Doped ceria nanoparticles possess excellent redox properties and contain a high density of
surface oxygen vacancies, resulting from the population of mixed valence states [10 - 13].
They also possess better chemical compatibility with high performance cathode materials
[14 - 16]. The ionic transport through doped ceria electrolyte depends on several factors.
The vacancy contraction profiles through the electrolyte affects the leak current and the
electrode polarizations, which closes the circle by affecting the vacancy concentration
profile. This disadvantage is solved by improving its mixed ionic and electronic properties
by varying the doping level, temperature and oxygen activation [17 - 19].
Furthermore, reports show that composite electrolytes work even more effectively at
reduced temperatures. These composite electrolytes generally contain two phases, which
are a combination of doped ceria solid solution and salt or oxide phase, usually insulating
phase, such as a mixture of Li2CO3 or Na2CO3 or solid phase like Na2CO3 and some oxides
below the molten point. Addition of carbonates to SDC performs several crucial functions.
It enhances significantly the ionic conductivity of the electrolyte, improves the thermal
stability of the nanostructure and increases the cell’s OCV significantly compared to typical
SDC single cells. In addition, the softening of amorphous Na2CO3 could improve
densification of solid electrolyte layer to prevent any gas leakage [20]. The sol-gel
technique was adapted to synthesize the electrolytes with different doping concentrations
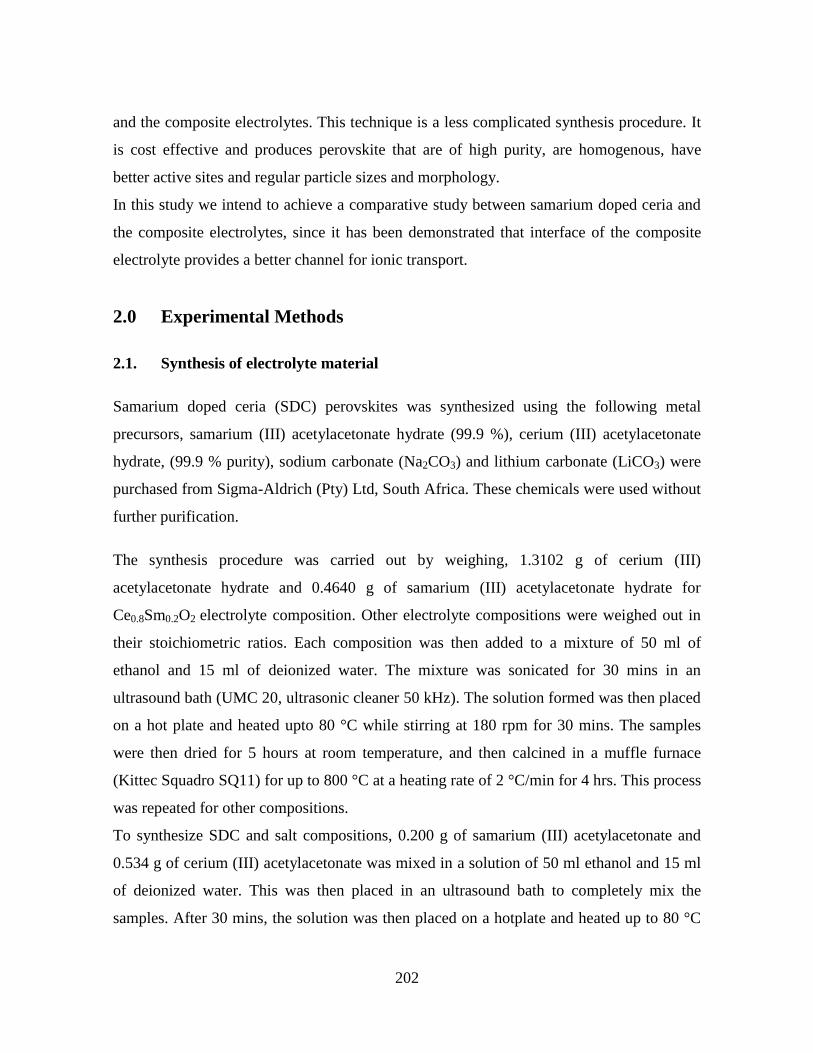
202
and the composite electrolytes. This technique is a less complicated synthesis procedure. It
is cost effective and produces perovskite that are of high purity, are homogenous, have
better active sites and regular particle sizes and morphology.
In this study we intend to achieve a comparative study between samarium doped ceria and
the composite electrolytes, since it has been demonstrated that interface of the composite
electrolyte provides a better channel for ionic transport.
2.0 Experimental Methods
2.1. Synthesis of electrolyte material
Samarium doped ceria (SDC) perovskites was synthesized using the following metal
precursors, samarium (III) acetylacetonate hydrate (99.9 %), cerium (III) acetylacetonate
hydrate, (99.9 % purity), sodium carbonate (Na2CO3) and lithium carbonate (LiCO3) were
purchased from Sigma-Aldrich (Pty) Ltd, South Africa. These chemicals were used without
further purification.
The synthesis procedure was carried out by weighing, 1.3102 g of cerium (III)
acetylacetonate hydrate and 0.4640 g of samarium (III) acetylacetonate hydrate for
Ce0.8Sm0.2O2 electrolyte composition. Other electrolyte compositions were weighed out in
their stoichiometric ratios. Each composition was then added to a mixture of 50 ml of
ethanol and 15 ml of deionized water. The mixture was sonicated for 30 mins in an
ultrasound bath (UMC 20, ultrasonic cleaner 50 kHz). The solution formed was then placed
on a hot plate and heated upto 80 °C while stirring at 180 rpm for 30 mins. The samples
were then dried for 5 hours at room temperature, and then calcined in a muffle furnace
(Kittec Squadro SQ11) for up to 800 °C at a heating rate of 2 °C/min for 4 hrs. This process
was repeated for other compositions.
To synthesize SDC and salt compositions, 0.200 g of samarium (III) acetylacetonate and
0.534 g of cerium (III) acetylacetonate was mixed in a solution of 50 ml ethanol and 15 ml
of deionized water. This was then placed in an ultrasound bath to completely mix the
samples. After 30 mins, the solution was then placed on a hotplate and heated up to 80 °C

203
while stirring for 20 mins. The samples were allowed to dry for 5 hours at room
temperature then calcined for 4 hours at 800 °C at 2 °C/min ramping rate in a muffle
furnace. Samarium doped ceria (SDC) material formed was hand mixed separately with
sodium carbonate (Na2CO3) and lithium carbonate (LiCO3) in a mass ratio of 60:40 % to
form SDC/Na2CO3 and SDC/LiCO3 electrolyte respectively as shown in Table 1. SDC
material was also hand mixed with the same mass ratios of Na2CO3 and LiCO3 (60:20:20
%) to form SDC/Na2CO3/LiCO3 electrolyte shown in Table 1.
Table1: Summary of the Electrolyte compositions of Ce1-xSmxO2 (x = 0.1 - 0.4), composite
electrolyte and Sample ID.
Electrolyte Compositions Sample ID
Ce0.7Sm0.3O2 E 1
Ce0.9Sm0.1O2 E 2
Ce0.8Sm0.2O2/LiCO3 E 3
Ce0.8Sm0.2O2 E 4
Ce0.6Sm0.4O2 E 5
Ce0.8Sm0.2O2/Na2CO3 E6
Ce0.8Sm0.2O2/ LiCO3/ Na2CO3 E7
2.2. Characterization
The crystal structure of the electrolyte nanocomposite was characterized using powder X-
ray diffraction (XRD). The XRD patterns were obtained using Brucker D8 Advance
diffractometer with a Cu Kα radiation source operating at 40 kV and a wavelength of
1.5406 Å. The XRD diffractogram was recorded in the interval of 20 at a
scan speed of 2 C/min. The mean crystallite sizes ‘D’ was calculated using the Scherrer
equation:
D
(1)
where λ is the X-ray wavelength (1.5406 Å), β is the full width at half maximum of the
diffraction line and is the diffraction angle.
204
The microstructure of the material was characterized by high resolution transmission
electron microscopy (HR-TEM). The HR-TEM analysis was done by pouring small
amounts of the samples into ethanol to mix, using an ultrasound bath. It was then drop-
dried onto a carbon coated copper TEM grid, and then examined on a JOEL 2100 HRTEM
(200 kV accelerating voltage, beam current of 110 µA and current density of 2.4 pA/cm2).
The structural properties were characterised using Raman spectroscopy. The Raman
analysis was done on a DeltaNu advantage 532™ Raman Spectrometer (100 mWNd: YAG
laser with an excitation wavelength of 532 nm). The morphology was characterized using
scanning electron microscopy (SEM). The electrolyte powders were pressed onto carbon
tape pasted on an aluminium stubs and gold coated for SEM observations on a ZEISS
FEGSEM Ultra Plus. Nitrogen adsorption and desorption (BET) was examined in a
Micromeritics Tristar II 3020 V1.03 to find the surface area and porosity. For nitrogen
desorption and absorption, the samples were degassed using the vacuum degasser
(Micromeritics VacPrep 061 sample Degas system) for 1 hr at 90 C, it was then increased
to 200 C and allowed to run overnight. The samples were then put in the BET instrument
using Nitrogen at 77 K, to carry out the process.
2.3. Single Cell fabrication
The button cells were prepared by moulding the materials into a disc using a 20 Ton press
and a 1.3 cm die kit. For each cell 0.2300 g electrolyte material of 0.2000 g Sm0.8Sr0.2
Fe0.8Co0.2 (SSFC) cathode material and 0.3500 g of NiO/SDC anode material was pressed
together in the press to form a 3 layered single button cell, for each electrolyte sample. The
cell discs were then heat treated to 350 °C for 2 hrs at a steady heating rate of 5 °C/min
sandwiched in a ceramic blanket. The button cell has a total active area of 1.327 cm2 and
the cell was 350 µm thick.
2.4. Electrochemical Performance test
To test the electrochemical properties, the button cell was positioned between the nickel
foam mesh on the anode side. Platinum mesh on the cathode side, this was then placed in

205
the open flange test set-up from Fiaxell SOFC Technologies™. This set-up was designed
for the cell sizes, and the meshes were used as contact components, with the cell, to act as a
combined current, voltage collector and gas distributor. The test-bed was placed in a muffle
furnace (Kittec Squadro SQ11) and linked to appropriate gas tight fittings for the delivery
of the gases to the cell. The current and the voltage from the cells were measured with a
Nuvant™ Powerstat 05 potentiostat and galvanostat. Polarization curves were recorded
between 400 to 500 °C with a fuel gas consisting of humidified hydrogen (4 – 20 % water)
on the anode side and air on the cathode side.
3.0 Results and discussions
3.1 Powder XRD analysis
Figure 1 shows the XRD results of the crystalline structure for the electrolytes
nanoparticles. The diffractogram shows a main peak and smaller peaks that decreased in
intensity from left to right as the angle 2 values increased, with very sharp peaks. The
structure system was cubic corresponding to FCC lattice and the diffracted peaks were
located at 2 values of 28.88°, 33.43°, 47.75°, 56.56°, 59.29°, 69.54°, 76.76°, 79.12°,
88.04° and 94.98° which were indexed as (111), (200), (220), (311), (222), (400), (331),
(420), (422) and (511) (JCPDS file NO. 00-034-0394). The peak intensities varied for the
electrolytes, resulting in average crystallite sizes of 45.90 nm, 38.87 nm, 15.60 nm, 15.94
nm, 13.42 nm, 18.10 nm and 15.94 nm for E1 to E7 respectively which was calculated from
Scherrer equation using the most intense peak.
This showed that the different compositions had an effect on the sizes of the crystals. The
single phase electrolyte exhibited bigger crystallite sizes with the conventional doped ceria
compositions E4 and E5 showing smaller crystallite sizes. The composite electrolyte E3, E6
and E7 also exhibited smaller crystallite sizes. This is because, when molten phase of salts
is added to conventional SDC it reduces the texture and coarseness of the material by
introducing the smoother and smaller crystalline nature of the salt. The smaller crystallite
size of the sample improves the ability of the material to densify and prevent any gas
leakage.

206
Figure 1: XRD pattern of (a) E1 (b) E2 (c) E3 (d) E4 (e) E5 (f) E6 and (g) E7 calcined at
800 °C for 4 hrs.
3.2 Raman analysis
Figure 2 shows the Raman spectra for SDC investigated, one major peak was seen at 470 -
474 cm-1
which represents the F2g symmetry mode of CeO2 fluorite phase. Peak shifts were
observed for the different spectra resulting from different compositions of metals in the
perovskites leading to changes in metal to oxygen bonding. The full width at half maximum
(FWHM) for the different Raman spectra were observed and these are represented as 92
cm-1
, 40 cm-1
, 36 cm-1
, 36 cm-1
, 58 cm-1
, 37 cm-1
and 36 cm-1
for the E1 - E7 SDC
compositions, respectively. Shifts in FWHM values were seen, which are attributed to
defects in nanomaterials and defects being created by inclusion of salts to the SDC
materials [21].
The relative peak intensity ID/IF2g ratio displayed differences which are dependent on
compositions of the materials. Single SDC perovskites showed high intensity ratio than the
mixture of the SDC and salts.
20 40 60 80 100
Inte
ns
ity
(a
.u)
2theta(degree)
(a)
(b)
(c)
(d)
(e)
(f)
(g)
(11
1)
(20
0)
(22
0)
(31
1)
(22
2)
(40
0)
(33
1)
(42
0)
(42
2)
(51
1)

207
Figure 2: Raman spectra of (a) E1 (b) E2 (c) E3 (d) E4 (e) E5 (f) E6 and (g) E7 calcined at
800 °C for 4 hrs.
This implies that adding of salts lowers the intensity ratio of the spectra.The changes can
alsobe attributed to stress and change of defect sites in CeO2 [22]. Researchers have found
that the presence of surface defects such as large size oxygen vacancy clusters promote the
transformation from Ce4+
to Ce3+
of CeO2 based material [23, 24]. The presence of Ce3+
in
the fluorite ceria structure produces oxygen vacancies to sustain electrostatic stability
according to equation (2) [25]. This creates a pathway for an improved ionic conductivity
of oxygen in SDC/salt electrolyte.
(2)
where represents an empty position, anion vacant site originating from the removal of
O2-
from the surface.

208
3.3 HRTEM observations
Figure 3 reveals the microstructure of the electrolytes made from different compositions
and SDC/salt compositions. The nanocrystals revealed irregular shapes that varied in sizes
with the change in composition of the samples. The lattice distance between the fringes for
electrolyte composites E1 is 0.25 nm indexed to (200), E2 is 0.207 nm indexed to (220), E3
is 0.175 nm indexed to (311), E4 is 0.207 nm indexed to (211), E5 is 0.201 nm indexed to
(122), E6 is 0.190 nm indexed to (220) and E7 is 0.175 nm indexed to (311) which
predominantly exposes the (200) planes of CeO2 fluorite structure and (122) planes of
FeSmO2 structure for samarium oxide in the composites and the (311) planes of SDC
structure for the electrolyte samples [26].
The variability in lattice distance can be due to the addition of salts to SDC which changes
the surface morphology by a reconstruction in SDC structure. It could also be attributed to
the varying compositions of the SDC material and the structural compatibility between the
different materials. The low magnification image exposes dark spots predicting the
presence of defects sites as shown in the Raman spectra. The selected diffraction pattern
differed slightly in terms of the lattice and the arrangements of the particles. The lattice
parameters can be linked to the XRD diffractogram exposing the active planes in the
pattern.
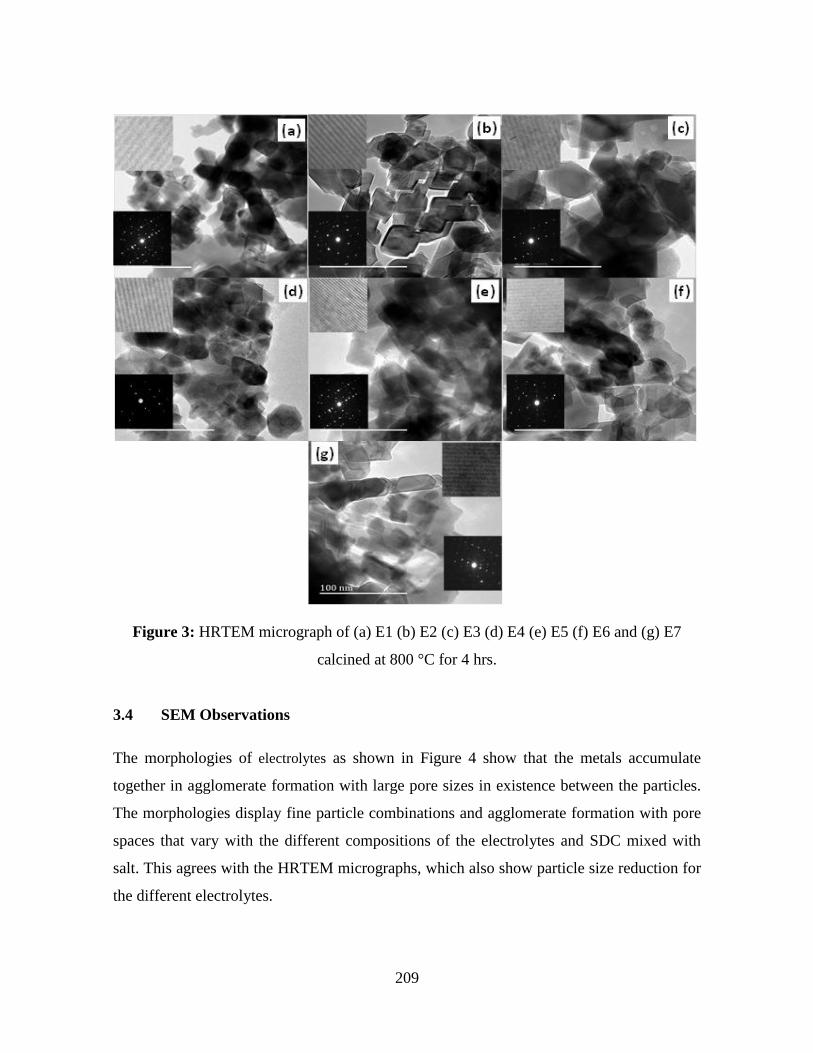
209
Figure 3: HRTEM micrograph of (a) E1 (b) E2 (c) E3 (d) E4 (e) E5 (f) E6 and (g) E7
calcined at 800 °C for 4 hrs.
3.4 SEM Observations
The morphologies of electrolytes as shown in Figure 4 show that the metals accumulate
together in agglomerate formation with large pore sizes in existence between the particles.
The morphologies display fine particle combinations and agglomerate formation with pore
spaces that vary with the different compositions of the electrolytes and SDC mixed with
salt. This agrees with the HRTEM micrographs, which also show particle size reduction for
the different electrolytes.

210
Figure 4: SEM morphology of (a) E1 (b) E2 (c) E3 (d) E4 (e) E5 (f) E6 and (g) E7 calcined
at 800 °C for 4 hrs.
3.5 Nitrogen desorption /absorption Analysis
Figure 5 shows the isotherm plot of the different electrolyte compositions. Nitrogen
desorption analysis examines the textural properties of materials which are shown in Table
2. The isotherm plot revealed the materials to be type III isotherm, revealing macroporous
materials, which are observed from the diameter of the spherical pores and distance
(a)
(g)
(f) (e) (d)
(b) (c)

211
between opposite walls in case of slit pores. These sizes reveal that the pores were large
enough for vehicular transport of ions and electrons.
Figure 5: Nitrogen desorption Isotherm plot of (a) E1 (b) E2 (c) E3 (d) E4 (e) E5 (f) E6
and (g) E7 calcined at 800 °C for 4 hrs.
Table 2: Surface Area, Pore diameter and Pore Volume of Electrolytes E1, E2, E3, E4, E5, E6 and
E7.
Sample ID Surface area
m2/g
Pore diameter
(nm)
Pore volume
(cm3/g)
E 1 12.641 39.306 0.1437
E 2 13.426 40.011 0.1466
E 3 9.537 43.430 0.102
E 4 15.407 35.560 0.1325
E 5 9.936 32.829 0.0985
E 6 8.939 37.906 0.0786
E 7 9.032 37.012 0.0774

212
Figure 6 shows the particle size distribution of the electrolyte materials which reveals them
as macroporous materials. The nature of the size distribution also reveals an efficient
transport of oxygen and hydrogen to and from the active sites.
Furthermore, the materials in general, showed an increase in the surface area, the pore
volume and pore size of the single electrolyte material compared with the electrolyte
materials mixed with salt. In totality the observations show that the addition of salts to
electrolyte caused a vast reduction in the surface area, pore size and pore volume of the
materials. This confirms changes inthe textural properties of materials with varying
electrolyte compositions and SDC material combined with salts. The reduction in surface
area and particle size distribution portrayed by the SDC/salt electrolyte poses an advantage
in oxygen ion transport, because smaller pore sizes limits leakages and blockages at the
active sites.
Figure 6: Nitrogen desorption pore size distribution of (a) E1 (b) E2 (c) E3 (d) E4 (e) E5 (f) E6 and
(g) E7 calcined at 800 °C for 4 hrs.

213
3.6.0 Electrochemical properties
The assymmetrical cell was measured by placing the cell between two platinum meshes of
15 mm each, mounted on an open flange set-up. This was then placed on a muffle furnace
and connected to a potentiostat and galvanostat. 50 m3/min of air and 200 m
3/min of
hydrogen gas mixed with 20 % H2O was supplied to both sides of the electrolyte cells.
Measurements were conducted at 400 - 500 °C and tested for 15 hrs using a 3-probe setup.
3.6.1 Polarisation Curve
Figure 7 shows the polarisation curve of the different electrolytes made with cerium and
samarium oxides. The polarization properties were tested using air at the cathode side and
humidified hydrogen (H2 + 20 % H2O) as fuel gas at the anode side. The cathode material
used for testing was Sm0.8Sr0.2Fe0.8Co0.2 (SSFC) perovskite with a thickness of 100 m, the
anode (NiO/SDC) was 150 m thick and the electrolyte was 100 m thick.
Figure 7: The Polarisation graph of (a) E1 (b) E2 (c) E3 (d) E4 (e) E5 (f) E6 and (g) E7 calcined at
800 °C for 4 hrs.

214
The polarization graph exhibit tendencies showing a linear fall in voltage with an increase
in current density. This result in resistance to current flow depiction, an increase in current
is directly proportional to an increase in voltage. The maximum current density differed for
the different electrolytes which produced values of 300.48 mA/cm2, 293.80 mA/cm
2,
165.90 mA/cm2, 304.46 mA/cm
2, 300.28 mA/cm
2, and 313.73 mA/cm
2 and 374.39 mA/cm
2
displayed for electrolytes E1 – E7 respectively. The electrolytes displayed different open
circuit voltages (OCVs) of 0.62 V, 0.45 V, 0.76 V, 0.70 V, 0.54 V, 0.74 V and 0.94 V for
E1, E2, E3, E4, E5, E6 and E7 respectively and showed stability for over 15 hrs at 500 C.
The Open circuit voltage (OCV) values were less than the Nernst thermodynamic values
because of the following reason namely, the hydrogen pressure reduction at the
anode/electrolyte interface by the anode materials and the gas crossover flowing through
the electrolyte because of the change in temperature.
The SDC/salt composites E7, E6 and E3 exhibited higher OCV values than the single SDC
E1, E5 and E2 which showed low OCV values. We observed that the single electrolyte E4
(Ce0.8Sm0.2) showed an equivalent high OCV which may account for the reason it is the
most popular SDC electrolyte used. The increase in OCV for SDC/salt composites may be
as a result of the reduction of gas leakages from the cell, because of its compatibility and
densification.
The linear fall in the polarisation graph was activated by these reasons: increase in the
ohmic and concentration losses from the internal resistance of the cell. This was produced
by the ionic conductivity and the effective distance between the cell components. Increase
in the ionic conductivity influences the reduction of adsorbed molecular oxygen to O2 ions
and improves the diffusion of these ions to the electrode/electrolyte interface [27]. The
increase in ionic conductivity of the electrolytes increases the diffusion of the ions to and
from the electrodes. The increase in the overall rate of the diffusion process reduces
polarisation losses and resistance; hence, the difference in the current density at 500 °C.
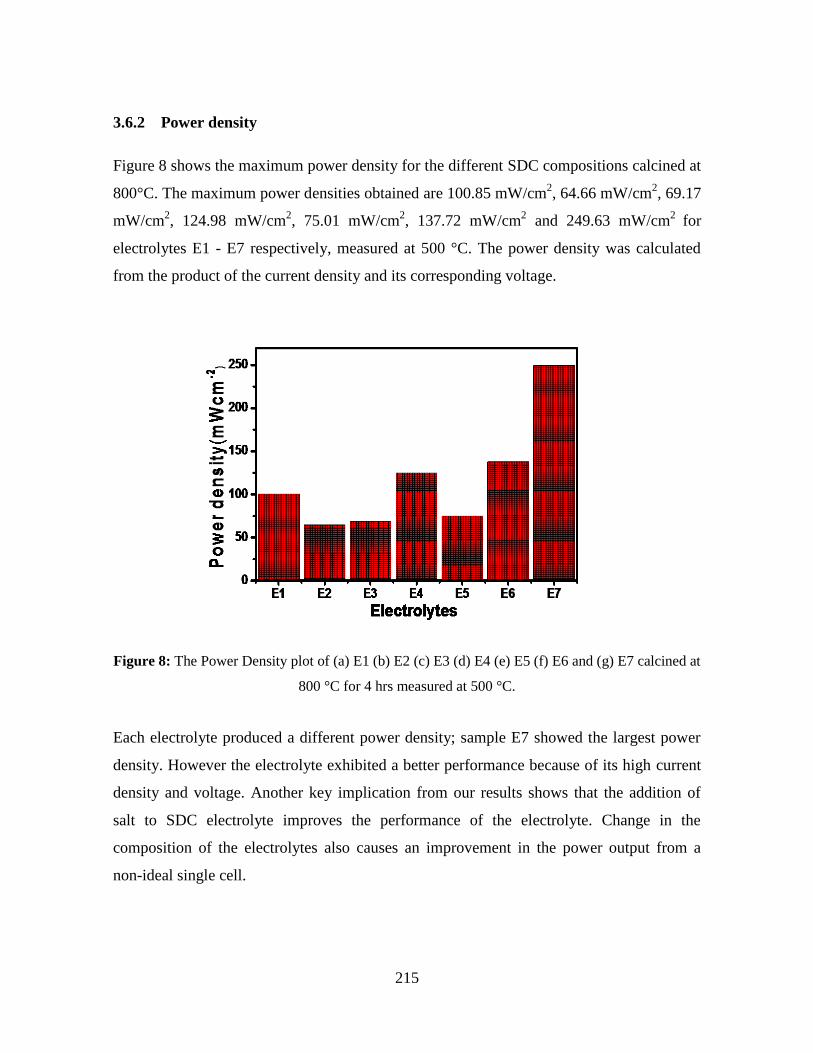
215
3.6.2 Power density
Figure 8 shows the maximum power density for the different SDC compositions calcined at
800°C. The maximum power densities obtained are 100.85 mW/cm2, 64.66 mW/cm
2, 69.17
mW/cm2, 124.98 mW/cm
2, 75.01 mW/cm
2, 137.72 mW/cm
2 and 249.63 mW/cm
2 for
electrolytes E1 - E7 respectively, measured at 500 °C. The power density was calculated
from the product of the current density and its corresponding voltage.
Figure 8: The Power Density plot of (a) E1 (b) E2 (c) E3 (d) E4 (e) E5 (f) E6 and (g) E7 calcined at
800 °C for 4 hrs measured at 500 °C.
Each electrolyte produced a different power density; sample E7 showed the largest power
density. However the electrolyte exhibited a better performance because of its high current
density and voltage. Another key implication from our results shows that the addition of
salt to SDC electrolyte improves the performance of the electrolyte. Change in the
composition of the electrolytes also causes an improvement in the power output from a
non-ideal single cell.

216
3.6.3 Area specific resistance
Figure 9 shows the normalized area specific resistance (ASR) of the single cell calculated
from the slope of the substantial linear portion (in the centre) of the I-V curve, where the
ohmic resistance is dominant. The ASR is directly related to the design of the cell’s anode,
electrolyte and cathode properties and the assembly process used to make the single cell
[28].
Figure 9: The Arrhenius plot of the ASR of (a) E1 (b) E2 (c) E3 (d) E4 (e) E5 (f) E6 and
(g) E7 calcined at 800 °C for 4 hrs measured from 300 – 500 °C.
It is interesting to note that the different compositions of the electrolyte used, have little
effect at 300 °C then there was a sharp drop from 300 to 400 °C and then slightly stable at
500 °C except for E1 and E3. This can be attributed to the compositions of the electrolytes
which may suggest at 300 °C, SDC may not be a suitable electrolyte. However, the
disparity in the ASR of the different electrolytes can be connected to changes in the
material compositions and increased oxygen loss from the lattice. As mixed ionic
conductors, oxygen reduction occurs at the triple phase boundary of the electrolytes which
results from the increase in ionic conductivity of the various electrolytes. Reduction in the

217
ASR at 500 °C can be caused by increase in oxygen diffusion which results from the
transformation of absorbed oxygen to O2 ions [29]. The change in porosity, surface area,
pore volume, the variation in the compositions of the electrolytes and the overall
morphology also affects the movement of the O2 ions at the triple phase boundary. The
SDC/salt composite displayed low ASR values which can be attributed to their abilities to
transport O2 ions faster than the other electrolytes at the TPB [30].
4.0 Conclusions
SDC electrolyte was combined with salts (Na2CO3, LiCO3) in this experiment and the
crystal structure was investigated by X-ray diffraction. The textural properties were
investigated by nitrogen adsorption/desorption analysis. The microstructure and
morphology were tested by SEM analysis and HRTEM analysis respectively. The
electrochemical properties were investigated using a NuvantTM
potentiostat and galvanostat.
The XRD diffractogram exhibited mean crystallite sizes of 45.90 nm, 38.87 nm, 15.60 nm,
15.94 nm, 13.42 nm, 18.10 nm and 15.58 nm for E1 – E7 respectively. This implies that the
crystallite sizes varied with the different compositions made and SDC/salt electrolyte
generated small crystals because of the nature of the salt. The SDC material alone
generated a higher surface area than SDC combined with salts, depicting that the addition
of salts increases the compatibility of the electrolyte. The microstructure of the SDC
revealed smaller particles that are separated but the microstructure of SDC/salt composites
revealed agglomerated large particles. The electrolyte composite E7 which is a combination
of two salts and SDC, generated the highest power density of 249.63 mW/cm2
and a current
density of 325.90 mA/cm2 at 500 °C powered for 15 hrs. When compared with the
contemporary SDC without surfactant that produced a power density of at 500 C showing
that SDC/salt composites work best than the SDC material alone at lower temperatures. The
properties exhibited revealed that the material is a promising electrolyte for low
temperature solid oxide fuel cell.

218
Acknowledgements
The authors thank the University of KwaZulu-Natal, ESKOM-TESP and NRF
THUTUKA for their financial support.
References
1. Hibino, T., Hashimoto, A., Yano, M., Suzuki, M., Yoshida, S. I., & Sano, M.
(2002). High performance anodes for SOFCs operating in methane-air mixture at
reduced temperatures. Journal of the Electrochemical Society, 149(2), A133-A136.
2. Singhal, S. C. (2000). Advances in solid oxide fuel cell technology. Solid state
ionics, 135(1), 305-313.
3. Steele, B. C. H. (2000). Appraisal of Ce1−yGdyO2−y/2 electrolytes for IT-SOFC
operation at 500 C. Solid state ionics, 129 (1), 95-110.
4. Mogensen, M., Sammes, N. M., & Tompsett, G. A. (2000). Physical, chemical and
electrochemical properties of pure and doped ceria. Solid State Ionics, 129(1), 63-
94.
5. Sahibzada, M., Steele, B. C., Hellgardt, K., Barth, D., Effendi, A., Mantzavinos, D.,
& Metcalfe, I. S. (2000). Intermediate temperature solid oxide fuel cells operated
with methanol fuels. Chemical Engineering Science, 55(16), 3077-3083.
6. Xia, C., & Liu, M. (2002). Microstructures, conductivities, and electrochemical
properties of Ce0.9Gd0.1O2 and GDC–Ni anodes for low-temperature SOFCs. Solid
State Ionics, 152, 423-430.
7. Huang, J., Yang, L., Gao, R., Mao, Z., & Wang, C. (2006). A high-performance
ceramic fuel cell with samarium doped ceria–carbonate composite electrolyte at low
temperatures. Electrochemistry communications, 8(5), 785-789.
8. Wang, X., Li, X., Zhang, L., Yoon, Y., Weber, P. K., Wang, H., Guo, J., & Dai, H.
(2009). N-doping of graphene through electrothermal reactions with ammonia.
Science, 324(5928), 768-771.
9. Matsui, T., Inaba, M., Mineshige, A., & Ogumi, Z. (2005). Electrochemical
properties of ceria-based oxides for use in intermediate-temperature SOFCs. Solid
State Ionics, 176(7), 647-654.

219
10. Tarnuzzer, R. W., Colon, J., Patil, S., & Seal, S. (2005). Vacancy engineered ceria
nanostructures for protection from radiation-induced cellular damage. Nano letters,
5(12), 2573-2577.
11. Pirmohamed, T., Dowding, J. M., Singh, S., Wasserman, B., Heckert, E., Karakoti,
A. S., King, J. E.S., & Self, W. T. (2010). Nanoceria exhibit redox state-dependent
catalase mimetic activity. Chemical communications, 46(16), 2736-2738.
12. Heckert, E. G., Karakoti, A. S., Seal, S., & Self, W. T. (2008). The role of cerium
redox state in the SOD mimetic activity of nanoceria. Biomaterials, 29(18), 2705-
2709.
13. Andersson, D. A., Simak, S. I., Johansson, B., Abrikosov, I. A., & Skorodumova, N.
V. (2007). Modeling of CeO2, Ce2O3, and CeO2−x in the LDA+ U formalism.
Physical Review B, 75(3), 035109.
14. Wang, W. G., & Mogensen, M. (2005). High-performance lanthanum-ferrite-based
cathode for SOFC. Solid State Ionics, 176(5), 457-462.
15. Xu, X., Xia, C., Xiao, G., & Peng, D. (2005). Fabrication and performance of
functionally graded cathodes for IT-SOFCs based on doped ceria electrolytes. Solid
State Ionics, 176(17), 1513-1520.
16. Bi, Z., Cheng, M., Dong, Y., Wu, H., She, Y., & Yi, B. (2005). Electrochemical
evaluation of La0.6Sr0.4CoO3–La0.45Ce0.55O2 composite cathodes for anode-supported
La0.45Ce0.55O2–La 0.9Sr0.1Ga0.8Mg0.2O2.85 bilayer electrolyte solid oxide fuel cells.
Solid State Ionics, 176(7), 655-661.
17. Wang, X., Ma, Y., Li, S., Zhu, B., & Muhammed, M. (2012). SDC/Na2CO3
nanocomposite: new freeze drying based synthesis and application as electrolyte in
low-temperature solid oxide fuel cells. International journal of hydrogen energy,
37(24), 19380-19387.
18. Hibino, T., Hashimoto, A., Asano, K., Yano, M., Suzuki, M., & Sano, M. (2002).
An intermediate-temperature solid oxide fuel cell providing higher performance
with hydrocarbons than with hydrogen. Electrochemical and solid-state letters,
5(11), A242-A244.
19. Zha, S., Moore, A., Abernathy, H., & Liu, M. (2004). GDC-based low-temperature
SOFCs powered by hydrocarbon fuels. Journal of the Electrochemical Society,
151(8), A1128-A1133.
20. Li, L., Chen, F., Lu, J. Q., & Luo, M. F. (2011). Study of Defect Sites in Ce1–x Mx

220
O2− δ (x= 0.2) Solid Solutions Using Raman Spectroscopy. The Journal of Physical
Chemistry A, 115(27), 7972-7977.
21. Lin, J., Li, L., Huang, Y., Zhang, W., Wang, X., Wang, A., & Zhang, T. (2011). In
situ calorimetric study: structural effects on adsorption and catalytic performances
for CO oxidation over Ir-in-CeO2 and Ir-on-CeO2 catalysts. The Journal of Physical
Chemistry C, 115(33), 16509-16517.
22. Liu, X., Zhou, K., Wang, L., Wang, B., & Li, Y. (2009). Oxygen vacancy clusters
promoting reducibility and activity of ceria nanorods. Journal of the American
Chemical Society, 131(9), 3140-3141.
23. Tsunekawa, S., Ishikawa, K., Li, Z. Q., Kawazoe, Y., & Kasuya, A. (2000). Origin
of anomalous lattice expansion in oxide nanoparticles. Physical Review Letters,
85(16), 3440.
24. Martínez-Arias, A., Gamarra, D., Fernández-García, M., Wang, X. Q., Hanson, J.
C., & Rodriguez, J. A. (2006). Comparative study on redox properties of nanosized
CeO2 and CuO/CeO2 under CO/O2. Journal of Catalysis, 240(1), 1-7.
25. Abdulsattar, M. A. (2011). Ab initio large unit cell calculations of the electronic
structure of diamond nanocrystals. Solid State Sciences, 13(5), 843-849.
26. Leone, P., Lanzini, A., Santarelli, M., Calì, M., Sagnelli, F., Boulanger, A., &
Zitella, P. (2010). Methane-free biogas for direct feeding of solid oxide fuel cells.
Journal of Power Sources, 195(1), 239-248.
27. Yang, S. Q., Chen, T., Wang, Y., Peng, Z., & Wang, W. G. (2013). Electrochemical
analysis of an anode-supported SOFC. Int. J. Electrochem. Sci, 8(2), 2330-2344.
28. Njoku, C. B., & Ndungu, P. G. (2015). Synthesis and characterization of novel Ce0.8
Sm0.2Fe0.9Ir0.03Co0.07O3−δ perovskite material and possible application as a cathode
for low–intermediate temperature SOFCs. Materials Research Bulletin, 68, 100-
108.
29. Zhu, W., Lü, Z., Li, S., Wei, B., Miao, J., Huang, X., Ai, N., & Su, W. (2008).
Study on Ba0.5Sr0.5Co0.8Fe0.2O3−δ–Sm0.5Sr0.5CoO3−δ composite cathode materials for
IT-SOFCs. Journal of Alloys and Compounds, 465(1), 274-279.
30. Esch, F., Fabris, S., Zhou, L., Montini, T., Africh, C., Fornasiero, P., & Rosei, R.
(2005). Electron localization determines defect formation on ceria substrates.
Science, 309(5735), 752-755.
221
CHAPTER 10
Conclusions and Future work
1.0 Conclusions
In conclusion, sol-gel technique was applied to make nanocomposite materials that have been
successfully applied to design and develop cathodes, anodes and electrolytes with enhanced
properties for low-temperature SOFC in this thesis.
Moreover, the templating characteristics of non-ionic, cationic and anionic surfactants were
utilized to produce porous IrO/SDC nanocomposite as electrodes. The addition ofsurfactants
to the material caused a reduction in the crystallite sizes, resulting from an increase in the
XRD peak intensities and a high full width at half maximum value. The surface area
increased in the materials where F127, CTAB, PEG surfactants were added and reduced with
SDS and P123 compared with the sample without surfactant. The morphology and
microstructure of the materialal so changed from surfactant to surfactant with varying
porosity, spherical particle shapes and particle sizes, but the material with SDS revealed a
rectangular particle shape, resulting from a complete coalescing of the substituent materials.
Overall, the nature of the surfactant influenced the particle morphology, pore diameter,
crystallite size, surface area and the electrochemical properties of the electrode material.
A cathode material produced was Ce0.8Sm0.2IryCo1-yO3-δ perovskite, the material was then
characterised using powder XRD patterns which revealed only samarium doped ceria and
iridium oxide phases but no cobalt oxide phase. The Raman data revealed the formation of
complex oxides with perovskite, pyrochlore and defective fluorite phases. The morphology
and microstructure showed an agglomerate formation with irregular particles varying in sizes
with increasing calcination temperature. There were some small differences between the
different compositions as shown by the electrochemical properties with the sample y = 0.03
composition calcined at 800 °C having the highest power density of 287.6 mW/cm2 at 500
°C, and the sample with y = 0.04 calcined at 1000 °C having a maximum power density of
222.7 mW/cm2 at 500 °C.
Furthermore, Iron oxide was added to Ce0.8Sm0.2IryCo1-yO3-δ perovskite to form this
Ce0.8Sm0.2Fe0.9Ir0.03Co0.07O3-δ (CSFIC) perovskite. Results revealed via Raman spectroscopy

222
showed that the different calcination temperatures affected the characteristic vibration modes
of samarium doped ceria and iridium oxide in the material and magnetite vibrational modes
were also observed at higher temperatures. FTIR spectra revealed that carbon impurities were
present at 800 °C calcination temperature. An increase in calcination temperature caused a
shift with the mid-range FTIR peaks indicating changes in the metal – oxygen – metal bonds.
XRD analysis confirmed the presence of Ce3+
and oxygen vacancies within the samples and
the TGA analysis further confirmed that the concentration of oxygen vacancies differed with
calcination temperatures. The presence of oxygen vacancies improved the performance of the
cathode material, which exhibited an increased performance with a maximum power density
of 400.15 mW/cm2 at 500 °C.
Samarium oxide was then substituted in the A site of the cathode material with strontium
oxide and cobalt oxide was removed to investigate its performance. The XRD showed the
formation of an oxygen vacancy disordered perovskite oxide with a cubic lattice symmetry.
The FTIR, TGA and Raman displayed a high structural stability, high thermal expansion and
high oxygen vacancy concentration. The cathode material showed a superior electrocatalytic
activity and relatively low electrical conductivity when compared with the cobalt based
mixed conducting cathode which may be attributed to the Sr substitution and showed
favourable long term stability. The single perovskite formed was Ce0.8Sr0.2Fe0.9Ir0.1O3-δ
(CSFI) which produced a maximum power density of 483.07 mW/cm2 and an area specific
resistance (ASR) of 0.342 Ω cm2.
The experiment was further conducted with the addition of cobalt oxide because of its active
catalytic activity for the electrolytic evolution of oxygen, thus investigating its effect on the
performance of Ce0.8Sr0.2Fe0.9Ir0.04Co0.06 (CSFIC) cathode. The Raman and XRD showed the
formation of oxygen vacancy with modulated crystallite sizes. It also displayed high
structural stability, high thermal expansion as shown by the TGA, high oxygen vacancy
concentration which was observed by the defects in the Raman. The cathode material showed
a relatively high electrocatalytic activity and demonstrated long term stability under testing
conditions but its performance was lower than the cobalt free cathode. It generated a
maximum power density of 471.59 mW/cm2 when measured at 500 °C and a relatively low
ASR.
Finally, SDC was synthesized by sol gel technique with the addition of varying masses of (2
g – 5 g) of Pluronic F-127 surfactant, to improve its performance by modulating its particle
223
sizes and porosity. The morphology and microstructure of the materials, changed with
increasing mass of the surfactant with varying porosity, change in the particle sizes and
spherical and irregular particle shapes shown in the micrographs. The XRD revealed an
increase in the crystallite sizes of the materials with surfactant when compared to the material
without surfactant. Nitrogen desorption analysis showed that the surface area and the pore
sizes of the material increased with increasing mass of surfactant when compared to the
ordinary SDC. The electrolyte exhibited long term stability with a power density of 161.24
mW/cm2 at 500 °C for SDC with 3 g of surfactant when compared with a power density of
140.61 mW/cm2 generated by SDC electrolyte without surfactant. Thus concluding that
controlling the particle sizes and porosity can increase the performance of SDC electrolyte.
SDC was then used as the core material in the synthesis of SDC/Na2CO3 and SDC/LiCO3
nanocomposite for its application as electrolytes in LTSOFC. The ionic conductivity of the
electrolyte was significantly enhanced and the thermal stability of the nanostructure was also
improved. Introduction of carbonate supressed the electronic conductivity of SDC effectively,
which was evidenced from the open-circuit voltage (OCV) of the cells based on the SDC-
carbonate electrolyte. The OCV values were significantly higher than the typical SDC single
cell compositions. The addition of the softening properties of the salts improved the
densification of the solid electrolyte layer thus preventinggas leakage, which was also
evidenced by the increase in OCV. The SDC-salt electrolyte produced a better
electrochemical performance with a power density of 249.63 mW/cm2
when compared to the
power density of 124.98 mW/cm2 produced by SDC single cell. This conclusion shows that
the performance SDC can be improved by the addition of salts (Na2CO3) and a combination
of (Na2CO3/LiCO3) for LTSOFCs.
2.0 Future work
Further investigation needs to be done on three parts of this work regarding the improvement
of electrolyte and electrode materials for LTSOFC application. Further investigative studies
would be done on electrochemical properties like electrochemical impedance spectroscopy
(EIS) and resistivity measurements. Detailed investigative study needs to be done for CuO-
SDC material as anode, such as explicit EIS measurement for interfacial polarisation of its
performance mechanism. Further studies can be carried out on the combination of the
individual cathode materials made in this study with existing cathode materials. The materials

224
should then be examined for its morphology, structural properties, textural properties and
electrochemical performance using thorough EIS measurements for impedance and
interfacial polarisations. Intergranular resistance might be obtained using impedance
measurements (grain resistance). Investigation of the problems associated with electrode
poisoning during long term stability testing of low temperature SOFC.
Furthermore, improving the performance of nanocomposite electrolyte (SDC-salt), more
attention should be paid on the nano effects of the nanocomposites. The focus should be on
the particle size and morphology of host particle SDC and how it affects the properties of the
nanocomposite. Thin film technique might also be employed to make the electrolyte pellets
which will reduce resistance and improve the power density output. Modelling simulations of
the interfacial conduction mechanism could be established based on current experimental
work and theoretical calculations can also be employed.