Embed Size (px)
Citation preview
Deep Mining 2017: Eighth International Conference on Deep and High Stress Mining – J Wesseloo (ed.) © 2017 Australian Centre for Geomechanics, Perth, ISBN 978-0-9924810-6-3
Deep Mining 2017, Perth, Australia 587
Photogrammetry in underground mining ground control — Lucky Friday mine case study
DJ Benton National Institute for Occupational Safety and Health, USA
JB Seymour National Institute for Occupational Safety and Health, USA
MS Boltz National Institute for Occupational Safety and Health, USA
MJ Raffaldi National Institute for Occupational Safety and Health, USA
SA Finley National Institute for Occupational Safety and Health, USA
Abstract Deformation and support conditions in underground mines are typically monitored through visual inspection and geotechnical instrumentation. However, the subjectivity of visual observation techniques can result in ambiguous or incomplete analyses with little quantifiable data. Monitoring displacements with conventional instrumentation can be expensive and time-consuming, and the information collected is typically limited to just a few locations. Moreover, conventional methods usually provide vector rather than tensor descriptions of geometry changes, the latter of which offer greater insight into rock movements and potential ground fall hazards. To address these issues, researchers from the National Institute for Occupational Safety and Health’s Spokane Mining Research Division have developed and evaluated photogrammetric systems for ground control monitoring applications in underground mines. In cooperation with the Hecla Mining Company, photogrammetric surveys were conducted over a three-year period at the Lucky Friday mine in northern Idaho, United States of America, as underhand cut-and-fill mining methods were used to mine Ag-Pb-Zn ore in rockburst-prone ground conditions at depths approaching 2,100 metres. A photogrammetric system was developed for underground use at the mine that is not only mobile, rugged, and relatively inexpensive, but also capable of producing measurements comparable to conventional displacement-measuring instrumentation. This paper describes the components of the photogrammetric system, discusses the use of point cloud analyses from photogrammetric surveys to monitor bulk deformation in underground entries, and explains the advantages of full tensor descriptions of three-dimensional (3D) ground movement, particularly in regard to the interpretation of potential movement along fault intercepts. The practical use of photogrammetry to augment measurements from conventional instruments, such as crackmeters, is presented, as well as the use of photogrammetric data in conjunction with 3D visualisation software to synthesise and integrate complex information from diverse sources including geology, mining configuration, seismicity, and geotechnical instrumentation.
Keywords: photogrammetry, ground monitoring, instrumentation, remote sensing
1 Introduction
1.1 Purpose — ground fall prevention The National Institute for Occupational Safety and Health (NIOSH) is committed to the improvement of worker health and safety. Ground control for underground metal mines has historically been a major technical area of emphasis for NIOSH researchers in Spokane, Washington, United States of America (USA). For the years 1999–2009, 10.4% of worker fatalities at USA metal mines were caused by falls of ground (Coleman et al. 2010). As noted in a 2006–2010 study, this number dramatically increased to 50%, when only underground metal mines were considered (Signer 2011). Another 2006–2010 study of underground metal mines with difficult ground conditions, signified by at least one unplanned fall of ground during the period,
https://papers.acg.uwa.edu.au/p/1704_39_Benton/
Photogrammetry in underground mining ground control — Lucky Friday mine case study DJ Benton et al.
588 Deep Mining 2017, Perth, Australia
found that 63.6% of fatalities were caused by ground falls (Seymour et al. 2013). Methods by which falls of ground can be mitigated, or at least reliably anticipated, are therefore a key mining safety concern.
In order to address ground control issues for the deep underground metal mines in northern Idaho, a research project entitled ‘Ground Control Safety for Deep Vein Mines’ was initiated in collaboration with the Hecla Mining Company at the Lucky Friday mine near Mullan, Idaho (Seymour et al. 2016). The purpose of this research is to develop improved methods for monitoring, assessing, and mitigating the impacts of mining--induced seismic events. This complex issue is being systematically addressed through several research activities, including seismic monitoring, geotechnical instrumentation, three-dimensional (3D) visualisation, material property testing, ground support testing, and numeric modelling. As part of this effort, Spokane Mining Research Division (SMRD) researchers are also investigating the use of photogrammetric monitoring methods for ground control applications. A photogrammetry system that is inexpensive and easy to learn was developed and used underground at the Lucky Friday mine with minimal disruption to the mining cycle. This paper discusses the use of this photogrammetry technology, the components of the system, and some of the results of photogrammetric surveys conducted at selected locations in the mine over, roughly, a three-year period.
1.2 Background — photogrammetry Photogrammetry has been successfully implemented for geometric and spatial analyses in many industries, including surveillance, law enforcement, transportation, manufacturing, materials testing, and medicine (Barazzetti et al. 2012; Boesemann 2003; Jose et al. 2015; Kalpoe et al. 2011; Koschitzki et al. 2011; Partsinevelos et al. 2014; Schwartz 2011; Urban et al. 2015). Data collection can take as little as a few minutes, can be performed at safe distances from hazardous conditions, and can generate a permanent geometric record for analysis of sites undergoing or requiring immediate change. When applied to underground mining, photogrammetry can provide a powerful means of easily and quickly capturing both the surface conditions and geometry of underground workings. Such applications include detection and characterisation of changing and potentially hazardous ground conditions, an important capability for protecting miners from falls of ground.
Advances in photogrammetry and laser scanning technology have made their use feasible in remote, poorly lit underground areas (Viggiani & Hall 2008). Photogrammetry, however, has two significant advantages over laser scanning for detailed geometric analyses of mining environments (Paar & Kontrus 2006). First, data can be collected with relatively inexpensive devices that require minimal operator training and produce only minor interference with operations. A site visit might take only twenty minutes. Second, the photographs themselves contain additional information that is useful for analysis, such as paint markings and evidence of corrosion, water intrusion, and damage to ground support. While some laser scanning devices also produce digital images, those images are in addition to the survey itself. Photogrammetry produces point clouds directly from the digital images.
Photogrammetric methods have already been used for analysis of a variety of underground openings (Birch 2008; Ferrero et al. 2009; Lato et al. 2013; Li et al. 2014). Basic geometry, rock joint spacing and orientation, and damage indicators such as areal crack intensity and average depth of failure, have been shown to be valuable for determining rock mass integrity and support requirements (Preston et al. 2015). However, methods of acquiring these data for analysis of rockburst-prone ground need to be expanded and developed further. To this end, the remainder of this paper discusses the evolution of SMRD-developed photogrammetric systems during their use at Hecla’s Lucky Friday mine.
2 Systems
2.1 Overview — components and development The photogrammetry system used at the Lucky Friday mine was initially developed to monitor rib and back deformation in one of the ramps that provides access to the Gold Hunter deposit. The photogrammetric surveys were later expanded to measure ground movement at locations where crackmeters were installed
Overbreak and rockfall
Deep Mining 2017, Perth, Australia 589
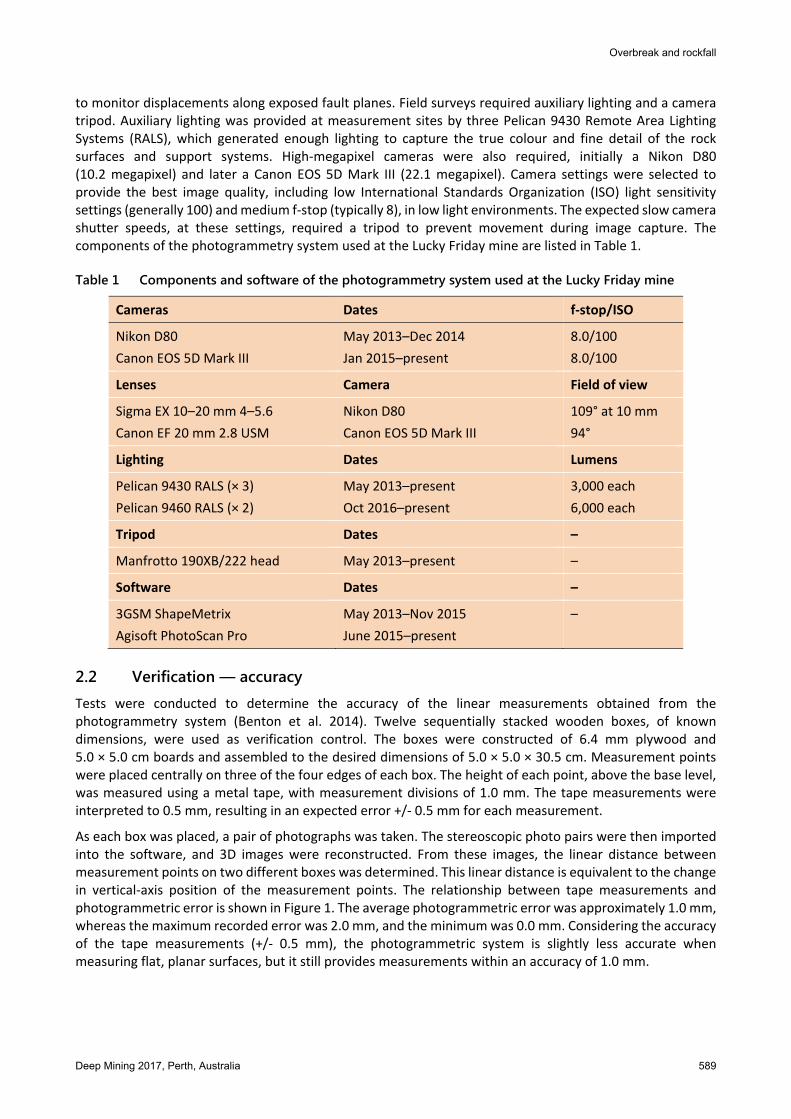
to monitor displacements along exposed fault planes. Field surveys required auxiliary lighting and a camera tripod. Auxiliary lighting was provided at measurement sites by three Pelican 9430 Remote Area Lighting Systems (RALS), which generated enough lighting to capture the true colour and fine detail of the rock surfaces and support systems. High-megapixel cameras were also required, initially a Nikon D80 (10.2 megapixel) and later a Canon EOS 5D Mark III (22.1 megapixel). Camera settings were selected to provide the best image quality, including low International Standards Organization (ISO) light sensitivity settings (generally 100) and medium f-stop (typically 8), in low light environments. The expected slow camera shutter speeds, at these settings, required a tripod to prevent movement during image capture. The components of the photogrammetry system used at the Lucky Friday mine are listed in Table 1.
Table 1 Components and software of the photogrammetry system used at the Lucky Friday mine
Cameras Dates f-stop/ISO
Nikon D80 Canon EOS 5D Mark III
May 2013–Dec 2014 Jan 2015–present
8.0/100 8.0/100
Lenses Camera Field of view
Sigma EX 10–20 mm 4–5.6 Canon EF 20 mm 2.8 USM
Nikon D80 Canon EOS 5D Mark III
109° at 10 mm 94°
Lighting Dates Lumens
Pelican 9430 RALS (× 3) Pelican 9460 RALS (× 2)
May 2013–present Oct 2016–present
3,000 each 6,000 each
Tripod Dates –
Manfrotto 190XB/222 head May 2013–present –
Software Dates –
3GSM ShapeMetrix Agisoft PhotoScan Pro
May 2013–Nov 2015 June 2015–present
–
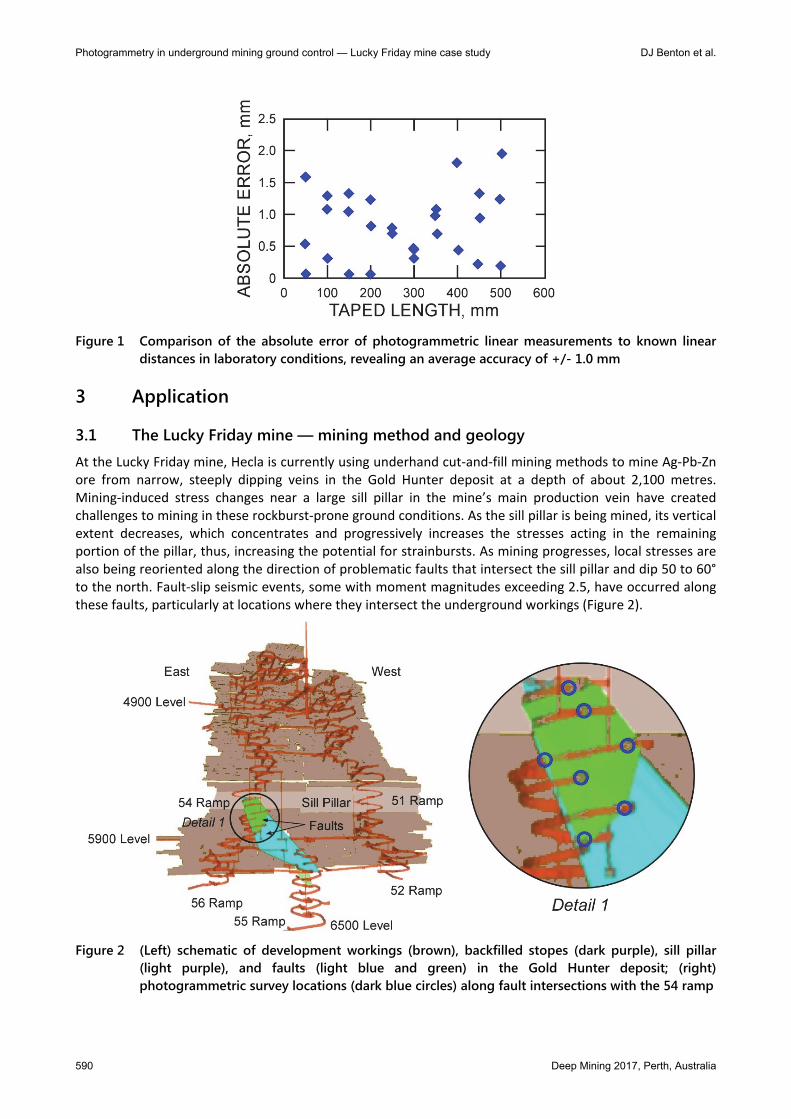
2.2 Verification — accuracy Tests were conducted to determine the accuracy of the linear measurements obtained from the photogrammetry system (Benton et al. 2014). Twelve sequentially stacked wooden boxes, of known dimensions, were used as verification control. The boxes were constructed of 6.4 mm plywood and 5.0 × 5.0 cm boards and assembled to the desired dimensions of 5.0 × 5.0 × 30.5 cm. Measurement points were placed centrally on three of the four edges of each box. The height of each point, above the base level, was measured using a metal tape, with measurement divisions of 1.0 mm. The tape measurements were interpreted to 0.5 mm, resulting in an expected error +/- 0.5 mm for each measurement.
As each box was placed, a pair of photographs was taken. The stereoscopic photo pairs were then imported into the software, and 3D images were reconstructed. From these images, the linear distance between measurement points on two different boxes was determined. This linear distance is equivalent to the change in vertical-axis position of the measurement points. The relationship between tape measurements and photogrammetric error is shown in Figure 1. The average photogrammetric error was approximately 1.0 mm, whereas the maximum recorded error was 2.0 mm, and the minimum was 0.0 mm. Considering the accuracy of the tape measurements (+/- 0.5 mm), the photogrammetric system is slightly less accurate when measuring flat, planar surfaces, but it still provides measurements within an accuracy of 1.0 mm.
Photogrammetry in underground mining ground control — Lucky Friday mine case study DJ Benton et al.
590 Deep Mining 2017, Perth, Australia
Figure 1 Comparison of the absolute error of photogrammetric linear measurements to known linear
distances in laboratory conditions, revealing an average accuracy of +/- 1.0 mm
3 Application
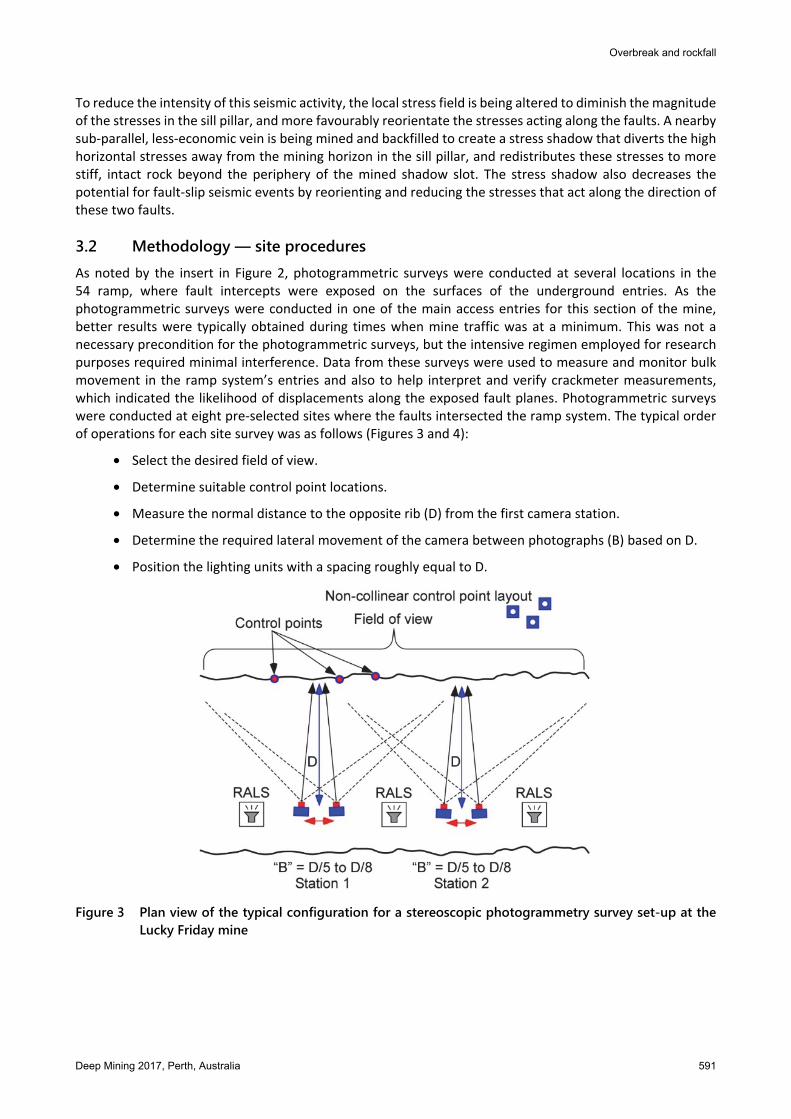
3.1 The Lucky Friday mine — mining method and geology At the Lucky Friday mine, Hecla is currently using underhand cut-and-fill mining methods to mine Ag-Pb-Zn ore from narrow, steeply dipping veins in the Gold Hunter deposit at a depth of about 2,100 metres. Mining-induced stress changes near a large sill pillar in the mine’s main production vein have created challenges to mining in these rockburst-prone ground conditions. As the sill pillar is being mined, its vertical extent decreases, which concentrates and progressively increases the stresses acting in the remaining portion of the pillar, thus, increasing the potential for strainbursts. As mining progresses, local stresses are also being reoriented along the direction of problematic faults that intersect the sill pillar and dip 50 to 60° to the north. Fault-slip seismic events, some with moment magnitudes exceeding 2.5, have occurred along these faults, particularly at locations where they intersect the underground workings (Figure 2).
Figure 2 (Left) schematic of development workings (brown), backfilled stopes (dark purple), sill pillar
(light purple), and faults (light blue and green) in the Gold Hunter deposit; (right) photogrammetric survey locations (dark blue circles) along fault intersections with the 54 ramp
Overbreak and rockfall
Deep Mining 2017, Perth, Australia 591
To reduce the intensity of this seismic activity, the local stress field is being altered to diminish the magnitude of the stresses in the sill pillar, and more favourably reorientate the stresses acting along the faults. A nearby sub-parallel, less-economic vein is being mined and backfilled to create a stress shadow that diverts the high horizontal stresses away from the mining horizon in the sill pillar, and redistributes these stresses to more stiff, intact rock beyond the periphery of the mined shadow slot. The stress shadow also decreases the potential for fault-slip seismic events by reorienting and reducing the stresses that act along the direction of these two faults.
3.2 Methodology — site procedures As noted by the insert in Figure 2, photogrammetric surveys were conducted at several locations in the 54 ramp, where fault intercepts were exposed on the surfaces of the underground entries. As the photogrammetric surveys were conducted in one of the main access entries for this section of the mine, better results were typically obtained during times when mine traffic was at a minimum. This was not a necessary precondition for the photogrammetric surveys, but the intensive regimen employed for research purposes required minimal interference. Data from these surveys were used to measure and monitor bulk movement in the ramp system’s entries and also to help interpret and verify crackmeter measurements, which indicated the likelihood of displacements along the exposed fault planes. Photogrammetric surveys were conducted at eight pre-selected sites where the faults intersected the ramp system. The typical order of operations for each site survey was as follows (Figures 3 and 4):
• Select the desired field of view.
• Determine suitable control point locations.
• Measure the normal distance to the opposite rib (D) from the first camera station.
• Determine the required lateral movement of the camera between photographs (B) based on D.
• Position the lighting units with a spacing roughly equal to D.
Figure 3 Plan view of the typical configuration for a stereoscopic photogrammetry survey set-up at the
Lucky Friday mine
Photogrammetry in underground mining ground control — Lucky Friday mine case study DJ Benton et al.
592 Deep Mining 2017, Perth, Australia
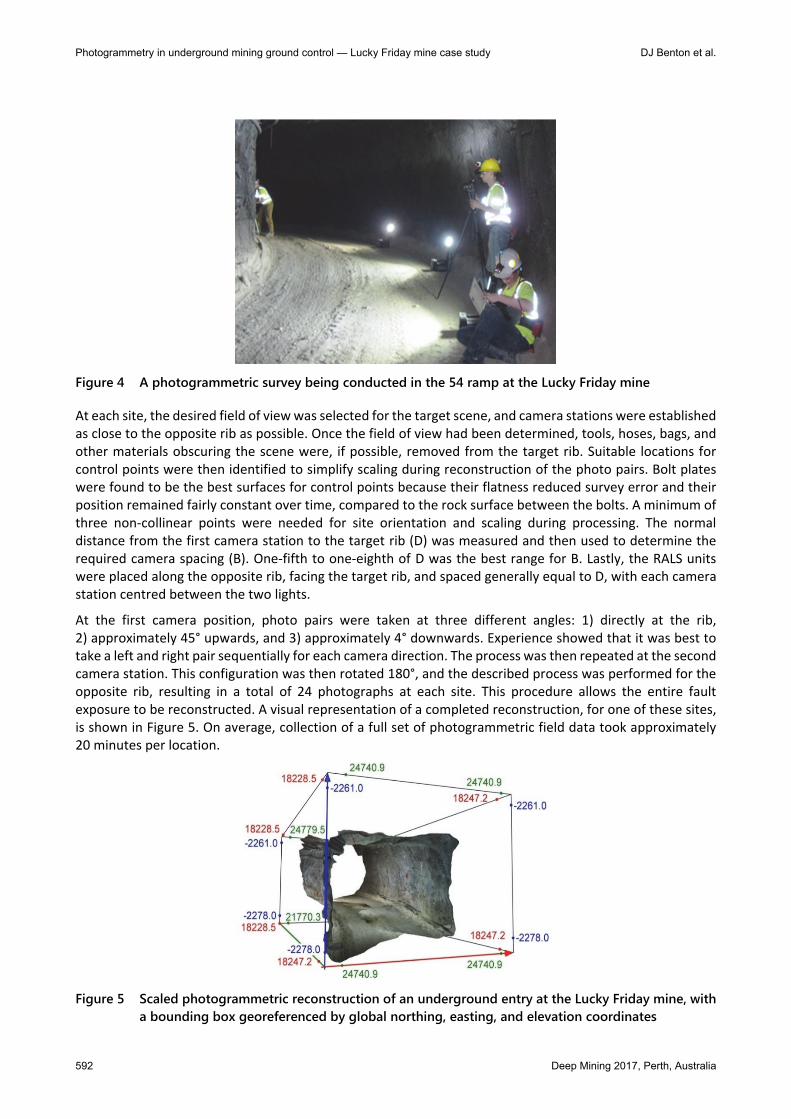
Figure 4 A photogrammetric survey being conducted in the 54 ramp at the Lucky Friday mine
At each site, the desired field of view was selected for the target scene, and camera stations were established as close to the opposite rib as possible. Once the field of view had been determined, tools, hoses, bags, and other materials obscuring the scene were, if possible, removed from the target rib. Suitable locations for control points were then identified to simplify scaling during reconstruction of the photo pairs. Bolt plates were found to be the best surfaces for control points because their flatness reduced survey error and their position remained fairly constant over time, compared to the rock surface between the bolts. A minimum of three non-collinear points were needed for site orientation and scaling during processing. The normal distance from the first camera station to the target rib (D) was measured and then used to determine the required camera spacing (B). One-fifth to one-eighth of D was the best range for B. Lastly, the RALS units were placed along the opposite rib, facing the target rib, and spaced generally equal to D, with each camera station centred between the two lights.
At the first camera position, photo pairs were taken at three different angles: 1) directly at the rib, 2) approximately 45° upwards, and 3) approximately 4° downwards. Experience showed that it was best to take a left and right pair sequentially for each camera direction. The process was then repeated at the second camera station. This configuration was then rotated 180°, and the described process was performed for the opposite rib, resulting in a total of 24 photographs at each site. This procedure allows the entire fault exposure to be reconstructed. A visual representation of a completed reconstruction, for one of these sites, is shown in Figure 5. On average, collection of a full set of photogrammetric field data took approximately 20 minutes per location.
Figure 5 Scaled photogrammetric reconstruction of an underground entry at the Lucky Friday mine, with
a bounding box georeferenced by global northing, easting, and elevation coordinates
Overbreak and rockfall
Deep Mining 2017, Perth, Australia 593
4 Results
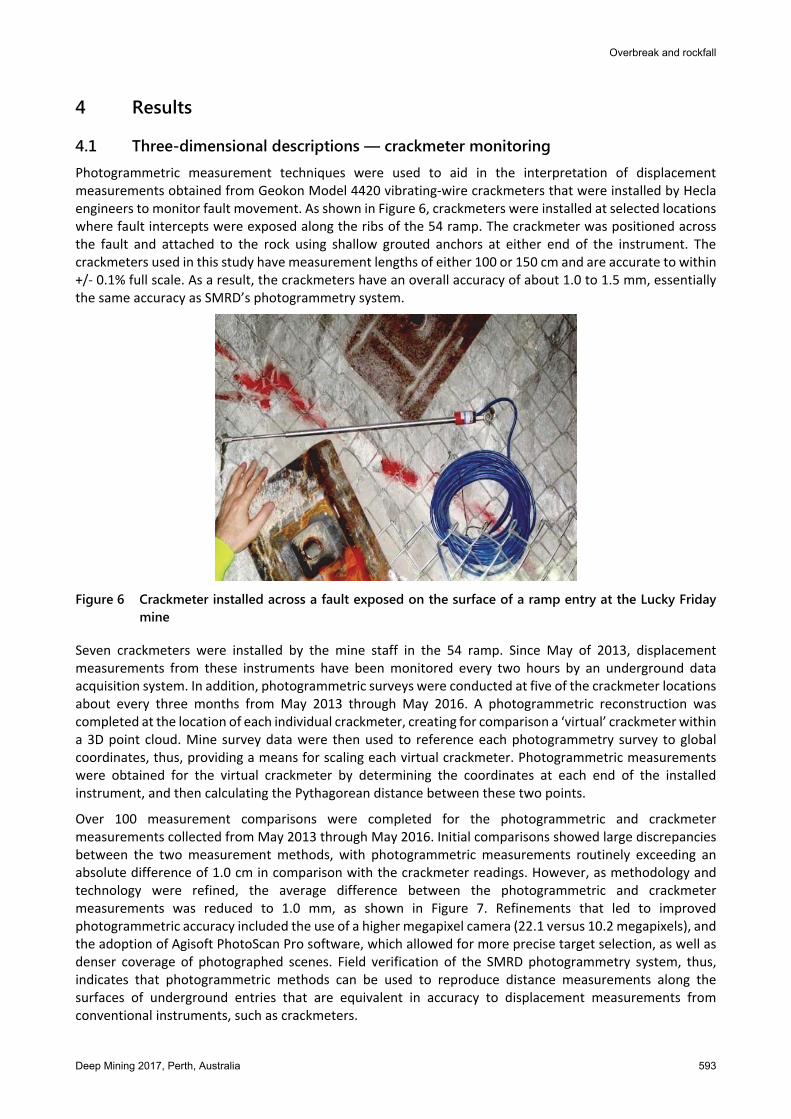
4.1 Three-dimensional descriptions — crackmeter monitoring Photogrammetric measurement techniques were used to aid in the interpretation of displacement measurements obtained from Geokon Model 4420 vibrating-wire crackmeters that were installed by Hecla engineers to monitor fault movement. As shown in Figure 6, crackmeters were installed at selected locations where fault intercepts were exposed along the ribs of the 54 ramp. The crackmeter was positioned across the fault and attached to the rock using shallow grouted anchors at either end of the instrument. The crackmeters used in this study have measurement lengths of either 100 or 150 cm and are accurate to within +/- 0.1% full scale. As a result, the crackmeters have an overall accuracy of about 1.0 to 1.5 mm, essentially the same accuracy as SMRD’s photogrammetry system.
Figure 6 Crackmeter installed across a fault exposed on the surface of a ramp entry at the Lucky Friday
mine
Seven crackmeters were installed by the mine staff in the 54 ramp. Since May of 2013, displacement measurements from these instruments have been monitored every two hours by an underground data acquisition system. In addition, photogrammetric surveys were conducted at five of the crackmeter locations about every three months from May 2013 through May 2016. A photogrammetric reconstruction was completed at the location of each individual crackmeter, creating for comparison a ‘virtual’ crackmeter within a 3D point cloud. Mine survey data were then used to reference each photogrammetry survey to global coordinates, thus, providing a means for scaling each virtual crackmeter. Photogrammetric measurements were obtained for the virtual crackmeter by determining the coordinates at each end of the installed instrument, and then calculating the Pythagorean distance between these two points.
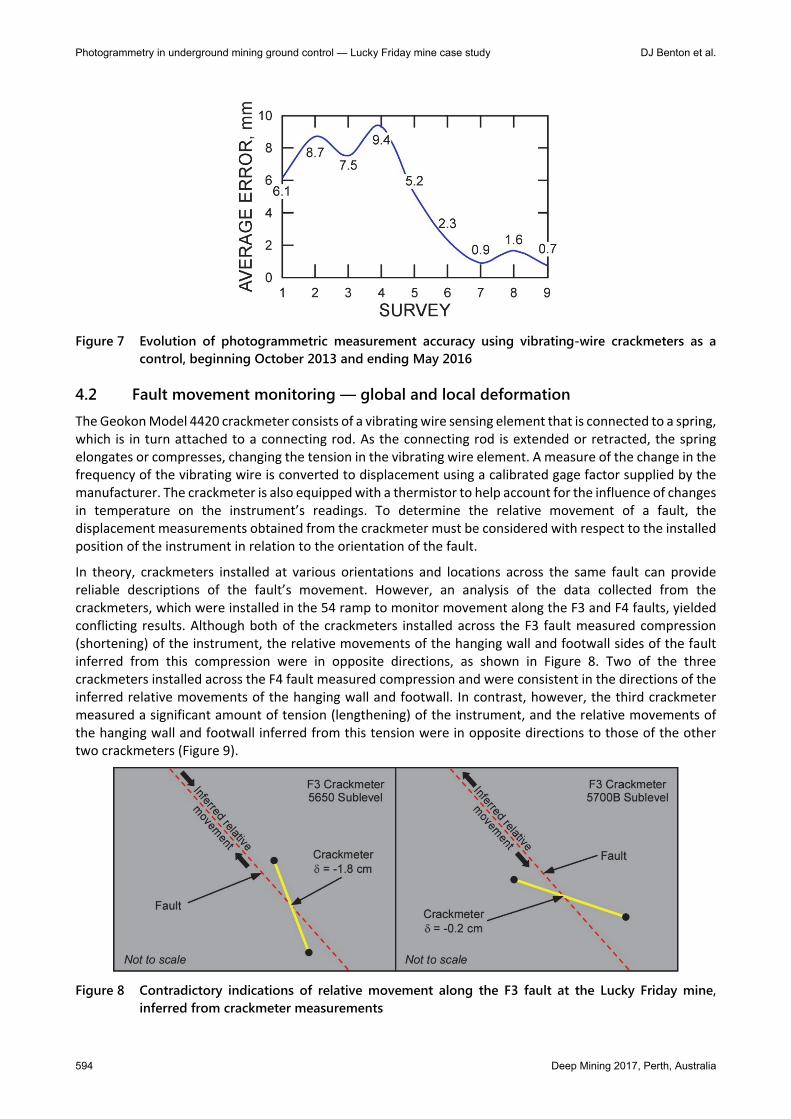
Over 100 measurement comparisons were completed for the photogrammetric and crackmeter measurements collected from May 2013 through May 2016. Initial comparisons showed large discrepancies between the two measurement methods, with photogrammetric measurements routinely exceeding an absolute difference of 1.0 cm in comparison with the crackmeter readings. However, as methodology and technology were refined, the average difference between the photogrammetric and crackmeter measurements was reduced to 1.0 mm, as shown in Figure 7. Refinements that led to improved photogrammetric accuracy included the use of a higher megapixel camera (22.1 versus 10.2 megapixels), and the adoption of Agisoft PhotoScan Pro software, which allowed for more precise target selection, as well as denser coverage of photographed scenes. Field verification of the SMRD photogrammetry system, thus, indicates that photogrammetric methods can be used to reproduce distance measurements along the surfaces of underground entries that are equivalent in accuracy to displacement measurements from conventional instruments, such as crackmeters.
Photogrammetry in underground mining ground control — Lucky Friday mine case study DJ Benton et al.
594 Deep Mining 2017, Perth, Australia
Figure 7 Evolution of photogrammetric measurement accuracy using vibrating-wire crackmeters as a
control, beginning October 2013 and ending May 2016
4.2 Fault movement monitoring — global and local deformation The Geokon Model 4420 crackmeter consists of a vibrating wire sensing element that is connected to a spring, which is in turn attached to a connecting rod. As the connecting rod is extended or retracted, the spring elongates or compresses, changing the tension in the vibrating wire element. A measure of the change in the frequency of the vibrating wire is converted to displacement using a calibrated gage factor supplied by the manufacturer. The crackmeter is also equipped with a thermistor to help account for the influence of changes in temperature on the instrument’s readings. To determine the relative movement of a fault, the displacement measurements obtained from the crackmeter must be considered with respect to the installed position of the instrument in relation to the orientation of the fault.
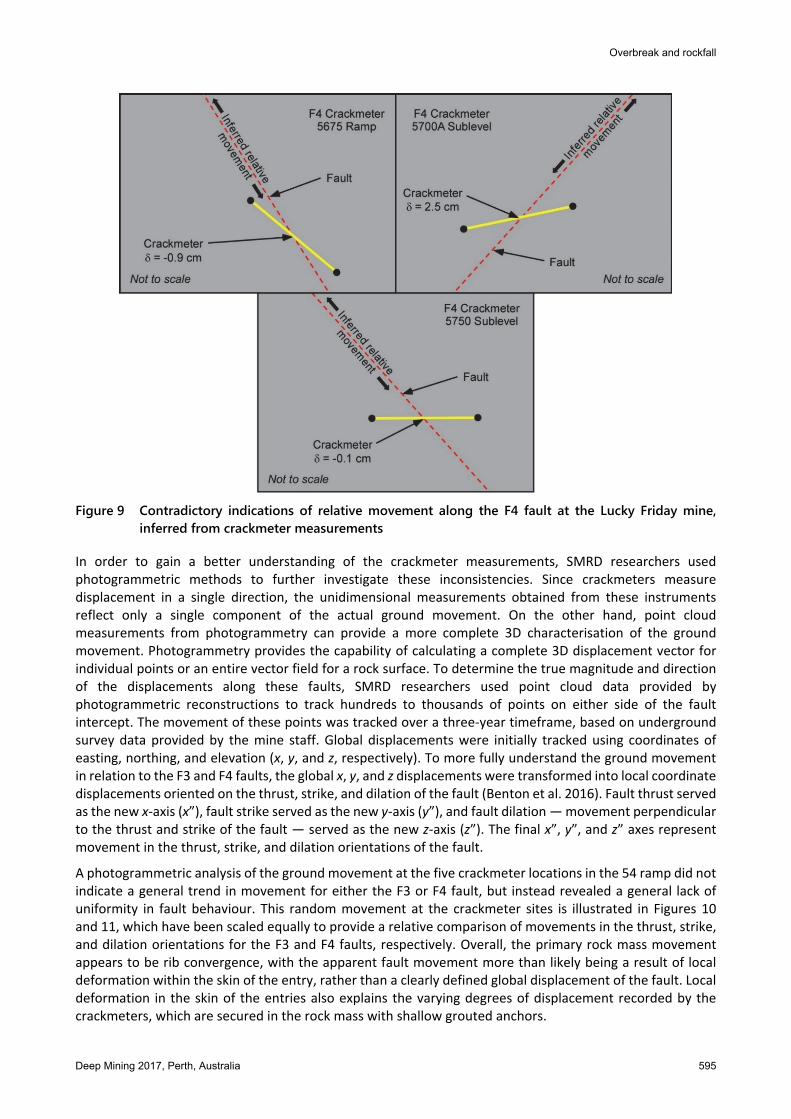
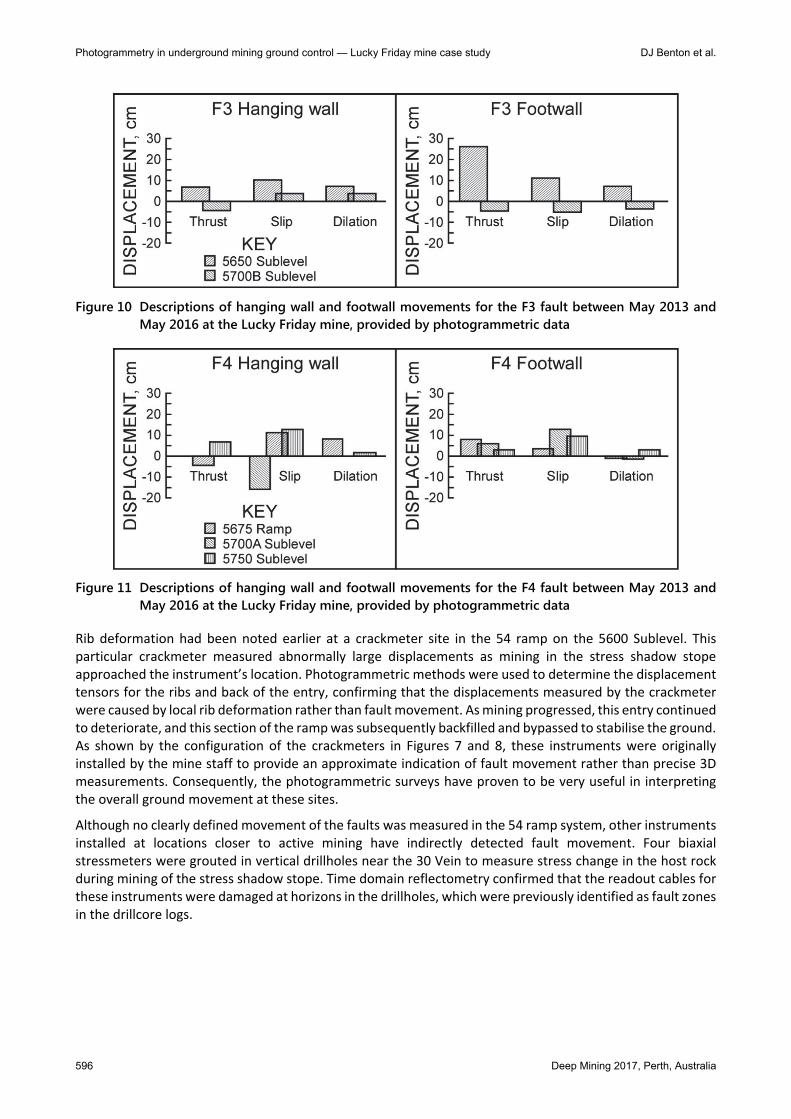
In theory, crackmeters installed at various orientations and locations across the same fault can provide reliable descriptions of the fault’s movement. However, an analysis of the data collected from the crackmeters, which were installed in the 54 ramp to monitor movement along the F3 and F4 faults, yielded conflicting results. Although both of the crackmeters installed across the F3 fault measured compression (shortening) of the instrument, the relative movements of the hanging wall and footwall sides of the fault inferred from this compression were in opposite directions, as shown in Figure 8. Two of the three crackmeters installed across the F4 fault measured compression and were consistent in the directions of the inferred relative movements of the hanging wall and footwall. In contrast, however, the third crackmeter measured a significant amount of tension (lengthening) of the instrument, and the relative movements of the hanging wall and footwall inferred from this tension were in opposite directions to those of the other two crackmeters (Figure 9).
Figure 8 Contradictory indications of relative movement along the F3 fault at the Lucky Friday mine,
inferred from crackmeter measurements
Overbreak and rockfall
Deep Mining 2017, Perth, Australia 595
Figure 9 Contradictory indications of relative movement along the F4 fault at the Lucky Friday mine,
inferred from crackmeter measurements
In order to gain a better understanding of the crackmeter measurements, SMRD researchers used photogrammetric methods to further investigate these inconsistencies. Since crackmeters measure displacement in a single direction, the unidimensional measurements obtained from these instruments reflect only a single component of the actual ground movement. On the other hand, point cloud measurements from photogrammetry can provide a more complete 3D characterisation of the ground movement. Photogrammetry provides the capability of calculating a complete 3D displacement vector for individual points or an entire vector field for a rock surface. To determine the true magnitude and direction of the displacements along these faults, SMRD researchers used point cloud data provided by photogrammetric reconstructions to track hundreds to thousands of points on either side of the fault intercept. The movement of these points was tracked over a three-year timeframe, based on underground survey data provided by the mine staff. Global displacements were initially tracked using coordinates of easting, northing, and elevation (x, y, and z, respectively). To more fully understand the ground movement in relation to the F3 and F4 faults, the global x, y, and z displacements were transformed into local coordinate displacements oriented on the thrust, strike, and dilation of the fault (Benton et al. 2016). Fault thrust served as the new x-axis (x”), fault strike served as the new y-axis (y”), and fault dilation — movement perpendicular to the thrust and strike of the fault — served as the new z-axis (z”). The final x”, y”, and z” axes represent movement in the thrust, strike, and dilation orientations of the fault.
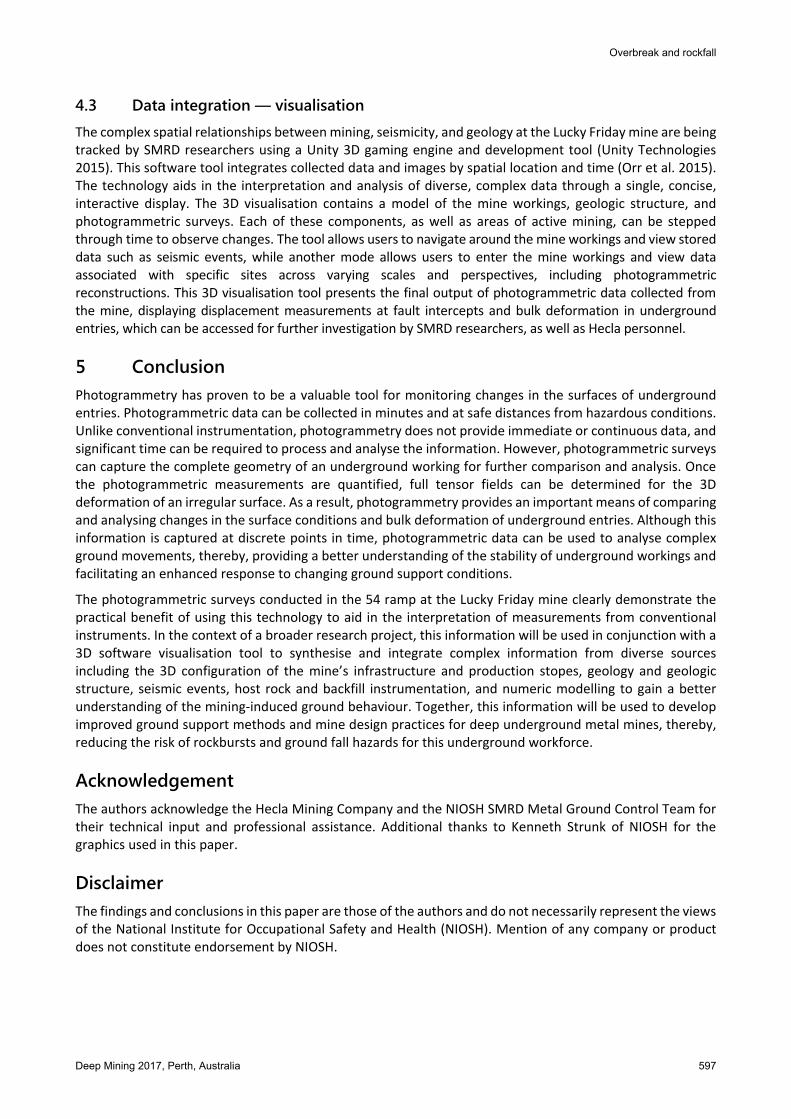
A photogrammetric analysis of the ground movement at the five crackmeter locations in the 54 ramp did not indicate a general trend in movement for either the F3 or F4 fault, but instead revealed a general lack of uniformity in fault behaviour. This random movement at the crackmeter sites is illustrated in Figures 10 and 11, which have been scaled equally to provide a relative comparison of movements in the thrust, strike, and dilation orientations for the F3 and F4 faults, respectively. Overall, the primary rock mass movement appears to be rib convergence, with the apparent fault movement more than likely being a result of local deformation within the skin of the entry, rather than a clearly defined global displacement of the fault. Local deformation in the skin of the entries also explains the varying degrees of displacement recorded by the crackmeters, which are secured in the rock mass with shallow grouted anchors.
Photogrammetry in underground mining ground control — Lucky Friday mine case study DJ Benton et al.
596 Deep Mining 2017, Perth, Australia
Figure 10 Descriptions of hanging wall and footwall movements for the F3 fault between May 2013 and
May 2016 at the Lucky Friday mine, provided by photogrammetric data
Figure 11 Descriptions of hanging wall and footwall movements for the F4 fault between May 2013 and
May 2016 at the Lucky Friday mine, provided by photogrammetric data
Rib deformation had been noted earlier at a crackmeter site in the 54 ramp on the 5600 Sublevel. This particular crackmeter measured abnormally large displacements as mining in the stress shadow stope approached the instrument’s location. Photogrammetric methods were used to determine the displacement tensors for the ribs and back of the entry, confirming that the displacements measured by the crackmeter were caused by local rib deformation rather than fault movement. As mining progressed, this entry continued to deteriorate, and this section of the ramp was subsequently backfilled and bypassed to stabilise the ground. As shown by the configuration of the crackmeters in Figures 7 and 8, these instruments were originally installed by the mine staff to provide an approximate indication of fault movement rather than precise 3D measurements. Consequently, the photogrammetric surveys have proven to be very useful in interpreting the overall ground movement at these sites.
Although no clearly defined movement of the faults was measured in the 54 ramp system, other instruments installed at locations closer to active mining have indirectly detected fault movement. Four biaxial stressmeters were grouted in vertical drillholes near the 30 Vein to measure stress change in the host rock during mining of the stress shadow stope. Time domain reflectometry confirmed that the readout cables for these instruments were damaged at horizons in the drillholes, which were previously identified as fault zones in the drillcore logs.
Overbreak and rockfall
Deep Mining 2017, Perth, Australia 597
4.3 Data integration — visualisation The complex spatial relationships between mining, seismicity, and geology at the Lucky Friday mine are being tracked by SMRD researchers using a Unity 3D gaming engine and development tool (Unity Technologies 2015). This software tool integrates collected data and images by spatial location and time (Orr et al. 2015). The technology aids in the interpretation and analysis of diverse, complex data through a single, concise, interactive display. The 3D visualisation contains a model of the mine workings, geologic structure, and photogrammetric surveys. Each of these components, as well as areas of active mining, can be stepped through time to observe changes. The tool allows users to navigate around the mine workings and view stored data such as seismic events, while another mode allows users to enter the mine workings and view data associated with specific sites across varying scales and perspectives, including photogrammetric reconstructions. This 3D visualisation tool presents the final output of photogrammetric data collected from the mine, displaying displacement measurements at fault intercepts and bulk deformation in underground entries, which can be accessed for further investigation by SMRD researchers, as well as Hecla personnel.
5 Conclusion Photogrammetry has proven to be a valuable tool for monitoring changes in the surfaces of underground entries. Photogrammetric data can be collected in minutes and at safe distances from hazardous conditions. Unlike conventional instrumentation, photogrammetry does not provide immediate or continuous data, and significant time can be required to process and analyse the information. However, photogrammetric surveys can capture the complete geometry of an underground working for further comparison and analysis. Once the photogrammetric measurements are quantified, full tensor fields can be determined for the 3D deformation of an irregular surface. As a result, photogrammetry provides an important means of comparing and analysing changes in the surface conditions and bulk deformation of underground entries. Although this information is captured at discrete points in time, photogrammetric data can be used to analyse complex ground movements, thereby, providing a better understanding of the stability of underground workings and facilitating an enhanced response to changing ground support conditions.
The photogrammetric surveys conducted in the 54 ramp at the Lucky Friday mine clearly demonstrate the practical benefit of using this technology to aid in the interpretation of measurements from conventional instruments. In the context of a broader research project, this information will be used in conjunction with a 3D software visualisation tool to synthesise and integrate complex information from diverse sources including the 3D configuration of the mine’s infrastructure and production stopes, geology and geologic structure, seismic events, host rock and backfill instrumentation, and numeric modelling to gain a better understanding of the mining-induced ground behaviour. Together, this information will be used to develop improved ground support methods and mine design practices for deep underground metal mines, thereby, reducing the risk of rockbursts and ground fall hazards for this underground workforce.
Acknowledgement The authors acknowledge the Hecla Mining Company and the NIOSH SMRD Metal Ground Control Team for their technical input and professional assistance. Additional thanks to Kenneth Strunk of NIOSH for the graphics used in this paper.
Disclaimer The findings and conclusions in this paper are those of the authors and do not necessarily represent the views of the National Institute for Occupational Safety and Health (NIOSH). Mention of any company or product does not constitute endorsement by NIOSH.
Photogrammetry in underground mining ground control — Lucky Friday mine case study DJ Benton et al.
598 Deep Mining 2017, Perth, Australia
References Agisoft 2016, Agisoft PhotoScan User Manual: Professional Edition, Version 1.2, Agisoft LLC, St. Petersburg, Russia, viewed 16 January
2016, http://www.agisoft.com/pdf/photoscan-pro_1_2_en.pdf Barazzetti, L, Sala, R, Scaioni, M, Cattaneo, C, Gibelli, D, Giussani, A, Poppa, P, Roncoroni, F & Vandone, A 2012, ‘3D scanning and
imaging for quick documentation of crime and accident scenes’, in EM Carapezza (ed.), Proceedings of SPIE: Sensors, and Command, Control, Communications, and Intelligence (C3I) Technologies for Homeland Security and Homeland Defense XI, vol. 8359.
Benton, DJ, Iverson, SR, Martin, LA, Johnson, JC & Raffaldi, MJ 2016, ‘Volumetric measurement of rock movement using photogrammetry’, International Journal of Mining Science and Technology, vol. 26, pp. 123–130.
Benton, D, Iverson, S, Johnson, J & Martin L 2014, ‘Photogrammetric monitoring of rock mass behavior in deep vein mining’, Proceedings of the Thirty-Third International Conference on Ground Control in Mining, pp. 221–227.
Birch, JS 2008, ‘Using 3DM analyst mine mapping suite for underground mapping’, Laser and Photogrammetric Methods for Rock Tunnel Characterization, American Rock Mechanics Association, Alexandria.
Boesemann, W 2003, ‘Photogrammetry in the line: recent developments in industrial photogrammetry’, Proceedings of SPIE Volume 5144: Optical Measurement Systems for Industrial Inspection III, International Society for Optics and Photonics, pp. 758–765.
Coleman, P, Martini, L & Brune, J 2010, Safety and Health in U.S. Mines, 1999- 2009, National Institute for Occupational Health and Safety internal report.
Ferrero, AM, Forlani, G, Roncella, R & Voyat, HI 2009, ‘Advanced geostructural survey methods applied to rock mass characterization’, Rock Mechanics and Rock Engineering, vol. 42, no. 5, pp. 631–665.
Jose, A, Haak, D, Jonas, S, Brandenburg, V & Deserno, TM 2015, ‘Human wound photogrammetry with low-cost hardware based on automatic calibration of geometry and color’, in LM Hadjiiski & GD Tourassi (eds), Proceedings of SPIE Volume 9414: Medical Imaging 2015: Computer-Aided Diagnosis.
Kalpoe, D, Khoshelham, K & Gorte, B 2011, ‘Vibration measurement of a model wind turbine using high speed photogrammetry’, in F Remondino & MR Shortis (eds), Proceedings of SPIE Volume 8085: Videometrics, Range Imaging, and Applications XI, International Society for Optics and Photonics.
Koschitzki, R, Schacht, G, Schneider, D, Marx, S & Maas, H-G 2011, ‘Integration of photogrammetry and acoustic emission analysis for assessing concrete structures during loading tests’, in F Remondino & MR Shortis (eds), Proceedings of SPIE Volume 8085: Videometrics, Range Imaging, and Applications XI, International Society for Optics and Photonics.
Lato, M, Kemeny, J, Harrap, RM & Bevan, G 2013, ‘Rock bench: Establishing a common repository and standards for assessing rockmass characteristics using LiDAR and photogrammetry’, Computers and Geosciences, vol. 50, pp. 106–114.
Li, H, Zhang, RC, Yang, B & Wu, MF 2014, ‘Principle and geometric precision of photographic geological logging of tunnels’, Journal of Applied Remote Sensing, vol. 8, 083617.
Orr, TJ, MacDonald, BD, Iverson, SR & Hammond, WR 2015, ‘Development of a generic mine visualization tool using unity’, Proceedings of the Thirty-Seventh International Symposium on the Application of Computers and Operations Research in the Mineral Industry, Society for Mining, Metallurgy & Exploration, Englewood.
Paar, G & Kontrus, H 2006, ‘Three-dimensional tunnel reconstruction using photogrammetry and laser scanning’, Proceedings of the Third Nordost, Anwendungsbezogener Workshop zur Erfassung, Modellierung, Verarbeitung und Auswertung von 3D-Daten.
Partsinevelos, P, Mertikas, S, Agioutantis, Z, Tsioukas, V, Tripolitsiotis, A & Zervos, P 2014, ‘Rockfall detection along road networks using close range photogrammetry’, in DG Hadjimitsis, K Themistocleous, S Michaelides & G Papadavid (eds), Proceedings of SPIE: Second International Conference on Remote Sensing and Geoinformation of the Environment (RSCy2014), vol. 9229.
Preston, R, Roberts, D, McIntire, H & Stead, D 2015, ‘Use of photogrammetry to estimate mine pillar damage and strength’, Proceedings of the 2015 International Symposium on Rock Mechanics, International Society for Rock Mechanics, Lisboa.
Seymour, J, Martin, L, Clark, C, Tesarik, D & Stepan, M 2013, ‘An analysis of recent MSHA accident data for underground metal mines using backfill’, SME 2013 Annual Conference and Expo, Preprint 13-061.
Seymour, J, Benton, D, Raffaldi, M, Johnson, J, Martin, L, Boltz, MS & Richardson, J 2016, ‘Improving ground control safety in deep vein mines’, Proceedings of the Third International Symposium on Mine Safety Science and Engineering, vol. 1, no. 87, pp. 71–77.
Schwartz, JM 2011, ‘Precise positioning surveillance in 3-D using night-vision stereoscopic photogrammetry’, in JJ Güell, KL Bernier, JT Thomas & DD Desjardins (eds), Proceedings of SPIE Volume 8042: Display Technologies and Applications for Defense, Security, and Avionics V; and Enhanced and Synthetic Vision 2011, International Society for Optics and Photonics.
Signer, S 2011, Assessment of Ground Control for Underground Metal Mines. Ground Control Branch Strategic Planning Document, National Institute for Occupational Health and Safety internal report.
Unity Technologies 2015, Unity Manual, Unity Technologies, San Francisco, http://docs.unity3d.com/Manual/index.html Urban, R, Braun, J & Stroner, M 2015, ‘Precise deformation measurement of prestressed concrete beam during a strain test using the
combination of intersection photogrammetry and micro-network measurement’, in F Remondino & MR Shortis (eds), Proceedings of SPIE Volume 9528: Videometrics, Range Imaging, and Applications XIII, International Society for Optics and Photonics.
Viggiani, G & Hall, SA 2008, ‘Full-field measurements, a new tool for laboratory experimental geomechanics’, Proceedings of the Fourth International Symposium on Deformation Characteristics of Geomaterials, pp. 3–26.