Embed Size (px)
Citation preview

New York City Transit TRB Paper #10-0487 1
NYC SubwayTrain
Subway Productivity, Performance, and Profitability:Tale of Five CitiesHong Kong, Singapore, Kuala Lumpur, Taipei,New York City
Alla ReddyAlex Lu, Ted Wang
System Data & ResearchOperations Planning
New York City Transit Authority
Presented at the 89th Annual Meeting of the Transportation Research Board
Washington D.C. (2010)
T R A N S I T
Photo: Trevor Logan, Jr.
Notice: Opinions expressed in this presentation are those of the authors and do not necessarily reflect the official policy or position of MTA New York City Transit, TCRP, or any other organization.
New York City Transit TRB Paper #10-0487 2
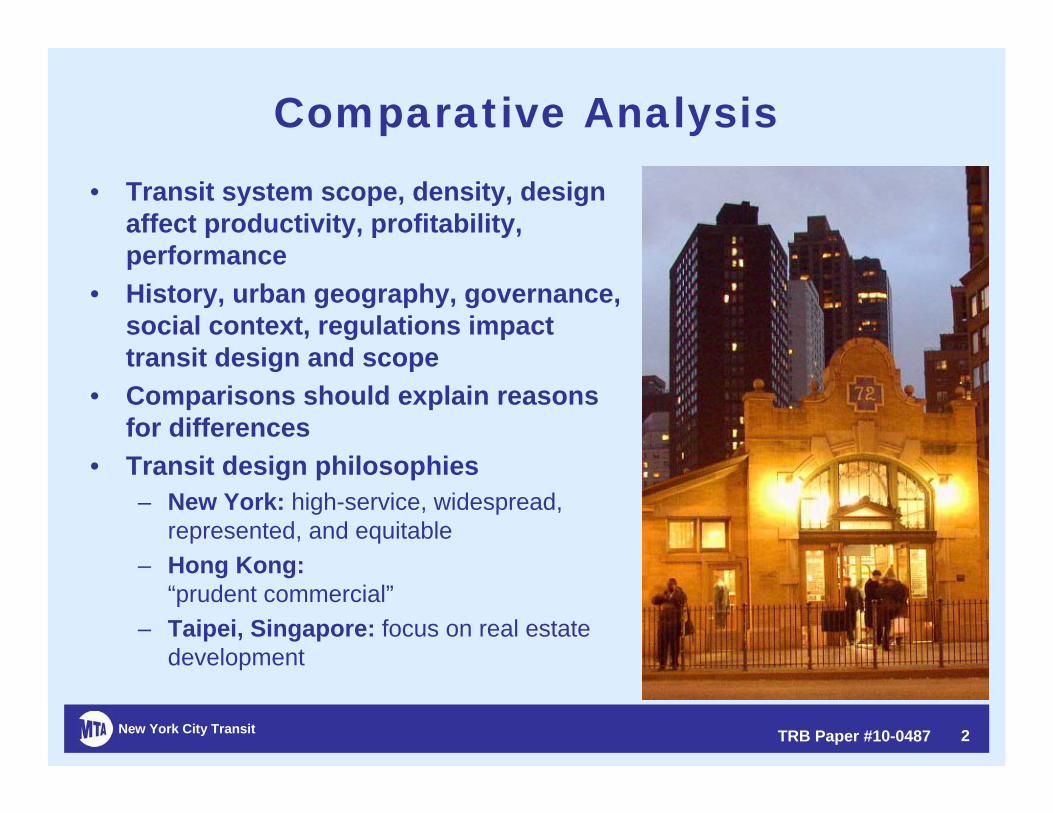
• Transit system scope, density, design affect productivity, profitability, performance
• History, urban geography, governance, social context, regulations impact transit design and scope
• Comparisons should explain reasons for differences
• Transit design philosophies– New York: high-service, widespread,
represented, and equitable– Hong Kong:
“prudent commercial”– Taipei, Singapore: focus on real estate
development
Comparative Analysis

New York City Transit TRB Paper #10-0487 3
Productivity: Density and Utilization
• Hong Kong is densest, even after absorbing commuter rail; New York is a huge system, but not dense
• Hong Kong generates 8 times more non-fare revenue than NY from 80% fewer stations!
0 100 200 300 400 500Miles of line (by system)
20
0
40
60
80
100
120
Annu
al av
erag
e loa
d, mi
llion p
asse
nger
-mile
s per
route
mile
(Tra
ffic de
nsity
)
Hon
g K
ong
(199
7)
Hon
g K
ong
(200
7)
Hon
g K
ong
(200
8)
Sing
apor
e
Taip
ei
New
Yor
k
30 51 104 56 48 233
Area of rectangles proportional to passenger-miles carried by each system
(see Pushkarev, Zupan, and Cumella, 1980)
$161m$36m$59m$1.2 bn$1.3 bn$248mSubway Non-Fare Revenue
788141827Passengers per Route Mile
4686951805244Stations
New YorkTaipeiSingaporeHong Kong (2008)
Hong Kong (2007)
Hong Kong (1997)
City
New York City Transit TRB Paper #10-0487 4
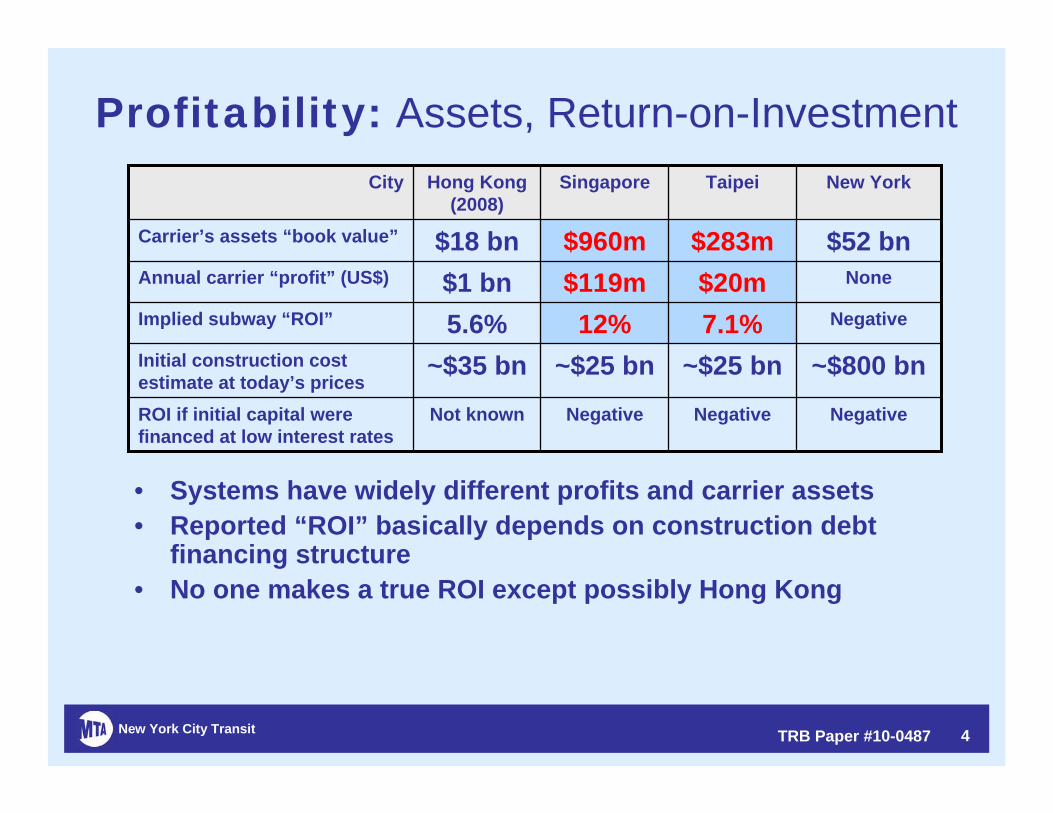
Profitability: Assets, Return-on-Investment
• Systems have widely different profits and carrier assets• Reported “ROI” basically depends on construction debt
financing structure• No one makes a true ROI except possibly Hong Kong
NegativeNegativeNegativeNot knownROI if initial capital were financed at low interest rates
~$800 bn~$25 bn~$25 bn~$35 bnInitial construction cost estimate at today’s prices
Negative7.1%12%5.6%Implied subway “ROI”
None$20m$119m$1 bnAnnual carrier “profit” (US$)
$52 bn$283m$960m$18 bnCarrier’s assets “book value”
New YorkTaipeiSingaporeHong Kong (2008)
City
New York City Transit TRB Paper #10-0487 5
Performance: Design & Management
• Asian subway systems have excellent operational performance compared to New York– By design:
• Long, wide, spacious articulated cars• Stations on straight and level track, platform screen doors,
electronic ‘next train’ displays• Loads generally within design capacity
– Thorough effective incident response:• Wider troubleshooting and maintenance responsibilities for train
operators, station agents, and other field staff• Strategic incident response teams, including press management
– Delay root cause analysis: weekly meetings– Strong regulatory regime: franchise revocation threat– International benchmarking: line-level competition
New York City Transit TRB Paper #10-0487 6
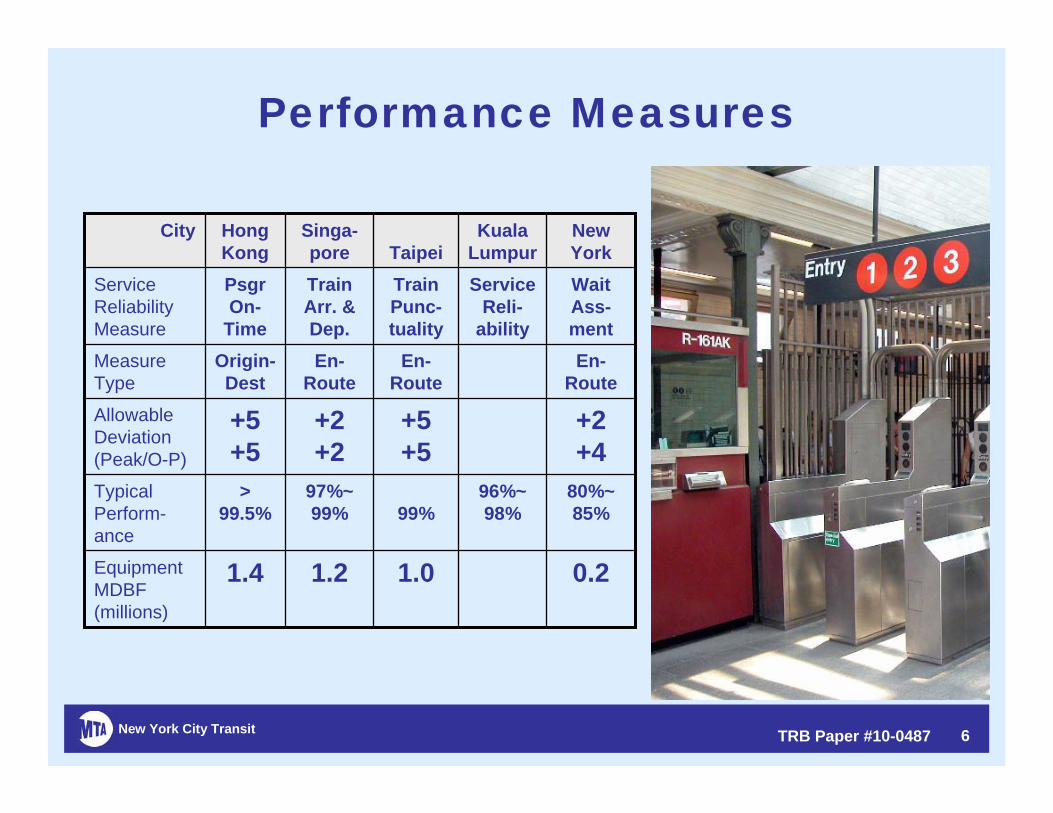
Performance Measures
0.21.01.21.4Equipment MDBF (millions)
80%~85%
96%~98%99%
97%~99%
> 99.5%
Typical Perform-ance
+2+4
+5+5
+2+2
+5+5
Allowable Deviation(Peak/O-P)
En-Route
En-Route
En-Route
Origin-Dest
Measure Type
Wait Ass-ment
Service Reli-
ability
Train Punc-tuality
Train Arr. & Dep.
PsgrOn-
Time
Service Reliability Measure
New York
Kuala LumpurTaipei
Singa-pore
Hong Kong
City
New York City Transit TRB Paper #10-0487 7
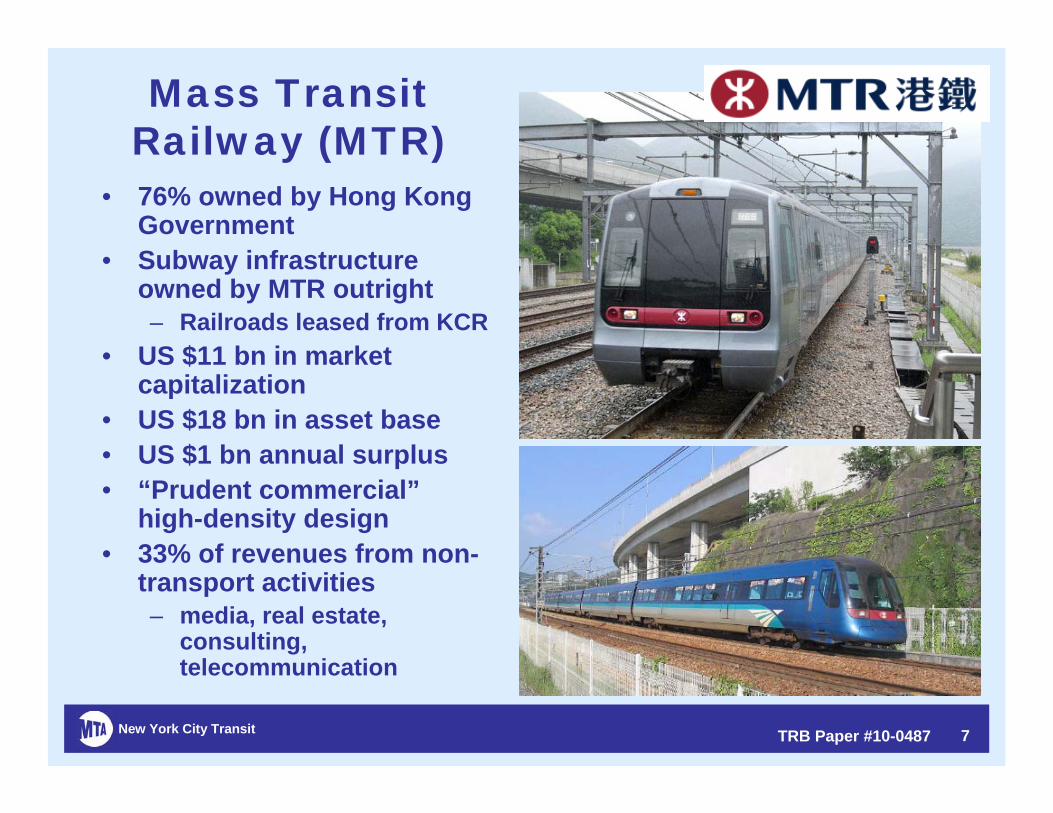
Mass Transit Railway (MTR)
• 76% owned by Hong Kong Government
• Subway infrastructure owned by MTR outright– Railroads leased from KCR
• US $11 bn in market capitalization
• US $18 bn in asset base• US $1 bn annual surplus• “Prudent commercial”
high-density design• 33% of revenues from non-
transport activities– media, real estate,
consulting, telecommunication
New York City Transit TRB Paper #10-0487 8
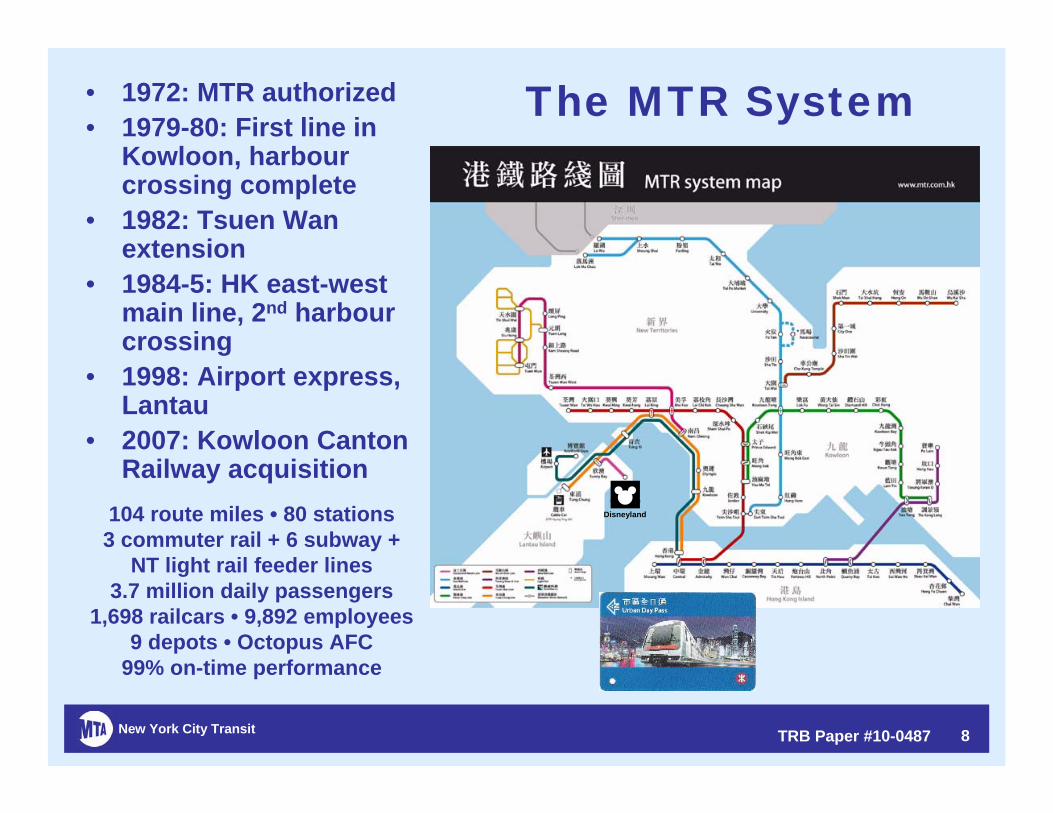
The MTR System• 1972: MTR authorized• 1979-80: First line in
Kowloon, harbourcrossing complete
• 1982: Tsuen Wan extension
• 1984-5: HK east-west main line, 2nd harbourcrossing
• 1998: Airport express, Lantau
• 2007: Kowloon Canton Railway acquisition
104 route miles • 80 stations3 commuter rail + 6 subway +
NT light rail feeder lines3.7 million daily passengers
1,698 railcars • 9,892 employees9 depots • Octopus AFC
99% on-time performance
Disneyland

New York City Transit TRB Paper #10-0487 9
Mind the Gap
Do not holdthe Doors
Half heightplatform
screen doors
Full heightplatform
screen doors
MTR’s KowloonCanton Railway

New York City Transit TRB Paper #10-0487 10
Singapore Mass Rapid Transit (SMRT)
• Multimodal operator• Regulated duopoly• 55% owned by Government
of Singapore– 20% private investors– 25% institutional investors
• US $1.4 bn in market capitalization
• US $960 m in asset base• US $119 m annual “surplus”
– 8%~12% “return on investment”
• 20% of revenues from non-transport activities– Engineering, advertising,
real estate, taxi
New York City Transit TRB Paper #10-0487 11
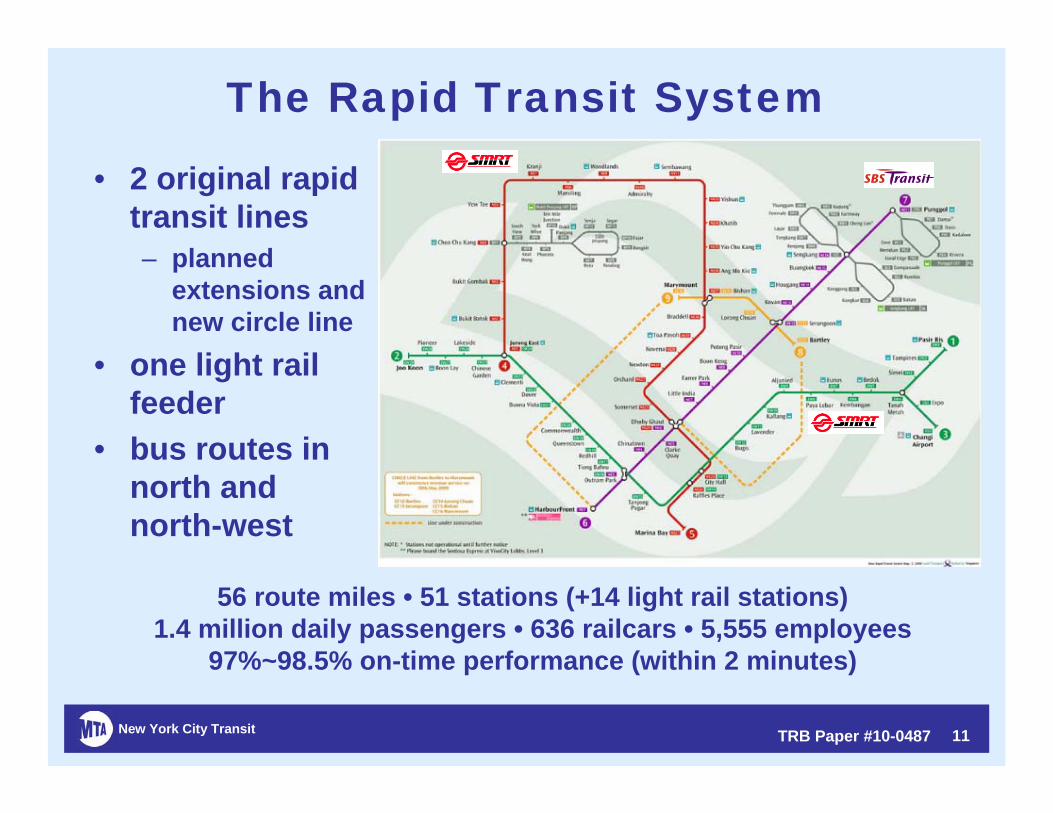
The Rapid Transit System
• 2 original rapid transit lines– planned
extensions and new circle line
• one light rail feeder
• bus routes in north and north-west
56 route miles • 51 stations (+14 light rail stations)1.4 million daily passengers • 636 railcars • 5,555 employees
97%~98.5% on-time performance (within 2 minutes)
New York City Transit TRB Paper #10-0487 12
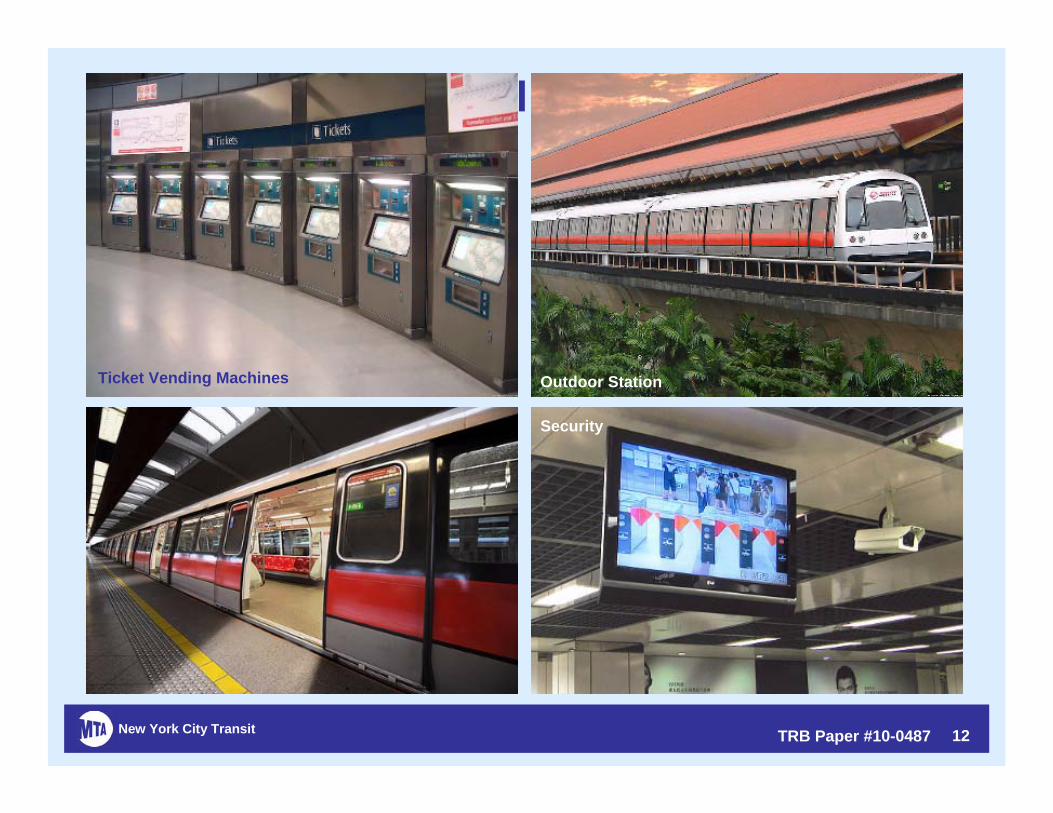
Station Cleanliness
Ticket Vending Machines Outdoor Station
Security
New York City Transit TRB Paper #10-0487 13
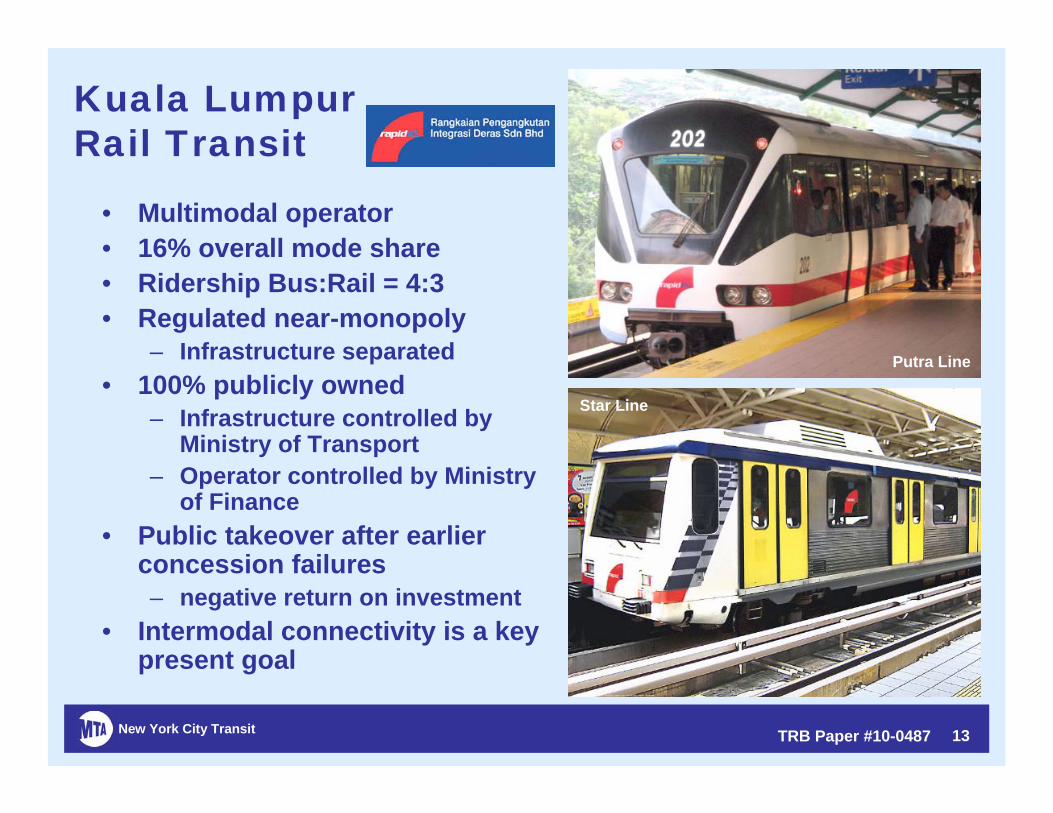
Kuala Lumpur Rail Transit
• Multimodal operator• 16% overall mode share• Ridership Bus:Rail = 4:3• Regulated near-monopoly
– Infrastructure separated• 100% publicly owned
– Infrastructure controlled by Ministry of Transport
– Operator controlled by Ministry of Finance
• Public takeover after earlier concession failures– negative return on investment
• Intermodal connectivity is a key present goal
Putra Line
Star Line
New York City Transit TRB Paper #10-0487 14
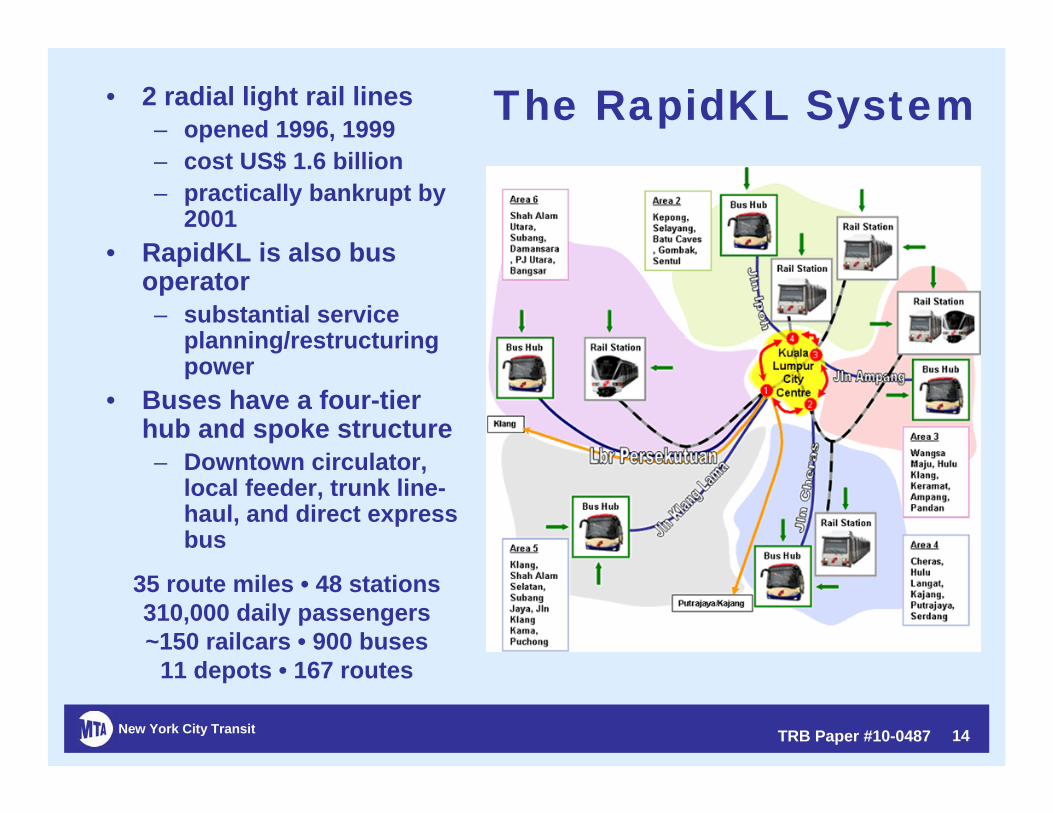
The RapidKL System• 2 radial light rail lines– opened 1996, 1999– cost US$ 1.6 billion– practically bankrupt by
2001• RapidKL is also bus
operator– substantial service
planning/restructuring power
• Buses have a four-tier hub and spoke structure– Downtown circulator,
local feeder, trunk line-haul, and direct express bus
RapidKLBus Zone Map
35 route miles • 48 stations310,000 daily passengers~150 railcars • 900 buses
11 depots • 167 routes
New York City Transit TRB Paper #10-0487 15
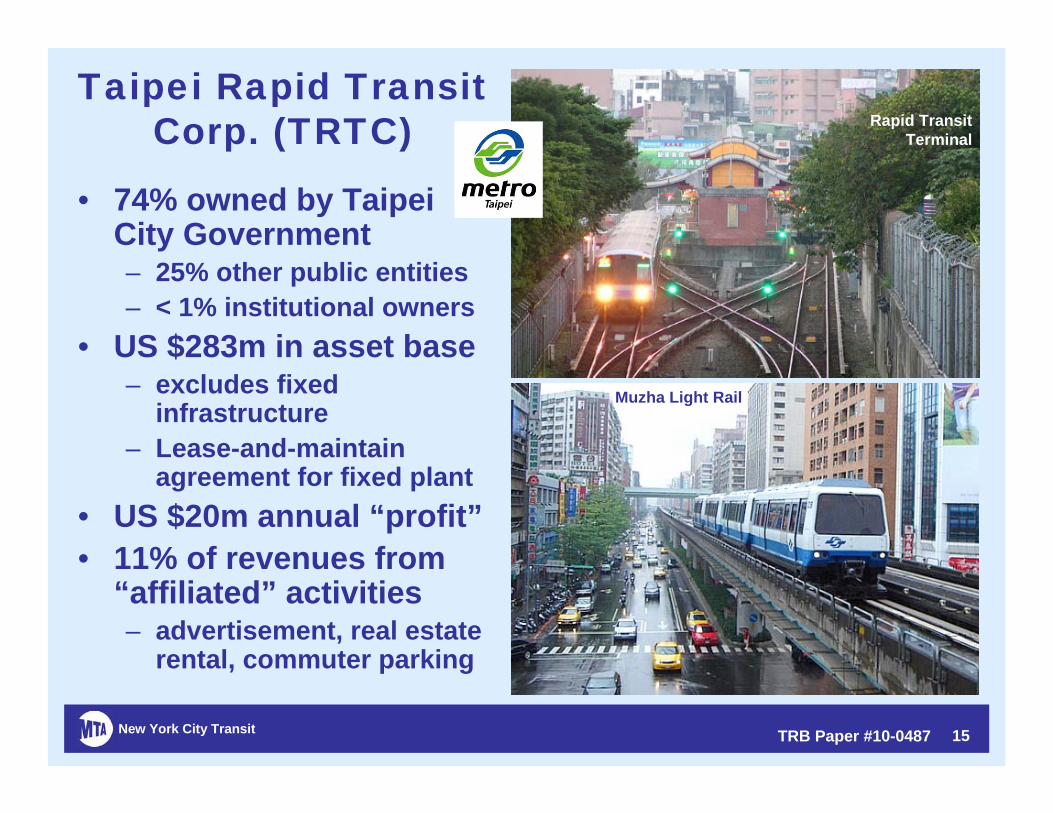
Taipei Rapid Transit Corp. (TRTC)
• 74% owned by Taipei City Government– 25% other public entities– < 1% institutional owners
• US $283m in asset base– excludes fixed
infrastructure– Lease-and-maintain
agreement for fixed plant• US $20m annual “profit”• 11% of revenues from
“affiliated” activities– advertisement, real estate
rental, commuter parking
Rapid TransitTerminal
Muzha Light Rail
New York City Transit TRB Paper #10-0487 16
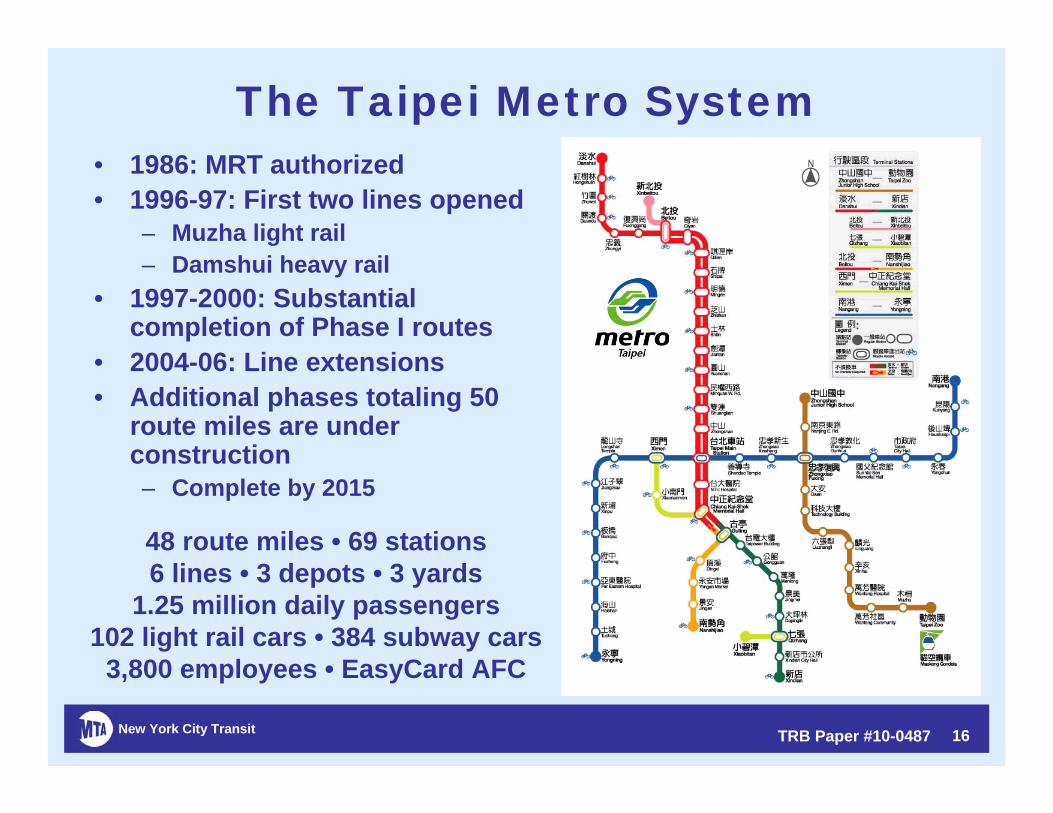
The Taipei Metro System• 1986: MRT authorized• 1996-97: First two lines opened
– Muzha light rail– Damshui heavy rail
• 1997-2000: Substantial completion of Phase I routes
• 2004-06: Line extensions• Additional phases totaling 50
route miles are under construction– Complete by 2015
48 route miles • 69 stations6 lines • 3 depots • 3 yards
1.25 million daily passengers102 light rail cars • 384 subway cars
3,800 employees • EasyCard AFC

New York City Transit TRB Paper #10-0487 17
TRTC Profit Sharing Bonus System
• Performance Measurement for:– Total Quality Management– Reliability Improvement– International Benchmarking– Performance Bonus
• Year End Bonus– 1 to 16 weeks’ pay awarded
at year end– Applies to all staff
(management and labor)– Dependent on:
• Composite performance index
• Company profits
IncreasingRidership

New York City Transit TRB Paper #10-0487 18
Observations
• Infrastructure debt cannot be fully covered by the subway concession through the farebox– even in successful, high density, “private” Asian systems– recapturing (real estate) development benefits is essential
• Coverage, density, span of service has huge impacts on productivity and thus capital and operating costs– service scope and historic design not under agency control
• Land grant model may produce transit oriented development more easily
• Many factors affect service reliability– Density, governance framework, regulation, cultural, weather,
and historic design are beyond transit agency control• “Profitability” is relative and depends on assets
New York City Transit TRB Paper #10-0487 19
Acknowledgements
• Transportation Research Board of the National Academies
• Transit Cooperative Research Program (TCRP)
• Kathryn Harrington-Hughes
• Hong Kong Mass Transit Railway (MTR) Corp.
• Singapore Mass Rapid Transit• Rangkaian Pengangkutan Integrasi
Deras Sdn Bhd (RapidKL)• Taipei Rapid Transit Corp. (TRTC)