Embed Size (px)
Citation preview

8/8/2019 Phil's Basic Chart Analysis Method
http://slidepdf.com/reader/full/phils-basic-chart-analysis-method 1/12
Before you read any further, I’m going to give you 5 reasons to close this ebook right now.
You should NOT read this if:
1. You do not know the basics of how Forex trading works. If you don't know what the terms“leverage” and “margin call” mean then you are in the wrong place. I'd suggest you head over to the Babypips.com “School of Pipsology” and then come back to this ebook.
2. You are looking for a forex guru. I teach what has worked for me, but I am no guru and I cannotguarantee your success.
3. You are looking for a totally mechanical system that will take all the work off your hands andmake you rich in six months. I don’t have such a system. I can show you how to get rich slowly by using your brain, but not how to get rich quick with no effort!
4. You are looking to read this once and be an expert Forex trader. You will have to read this andthen practice, practice, practice for many months on real charts.
5. You are looking to be spoon-fed information. Everything you need to get started is in thisdocument, but it’s your responsibility to take it to the next level. Read the Babypips forums, ask me and the other experienced traders questions, and practice!
Good, you're still here. One more thing and then we can get down to business.
PDF ebooks have a way of spreading around the Internet like wildfire, and that's fine with me! Ioriginally released this on the Babypips forums, but as long as you're not charging for it feel free todistribute this in any manner you wish, as long you don't change the contents in any way.
If anyone has any questions about my method the best way to get in touch with me is through theforums at Babypips.com, where I can be found under the username Phil838. You can also contact me
through email at [email protected]. I'm always happy to answer questions and help new traders!
Now let's get to it...

8/8/2019 Phil's Basic Chart Analysis Method
http://slidepdf.com/reader/full/phils-basic-chart-analysis-method 2/12
Phil's Basic Chart Analysis Trading Method
Chapter 1: Money Management
You'll notice the first chapter of this ebook has nothing at all to do with my trading method, and there'sa reason for that. Your trading method only accounts for about 20% of your success as a Forex trader.It's often been said that a bad trader with good money management (MM) will beat out a great trader with lousy MM. This is absolutely true!!
So what exactly is a MM plan? Think of a MM plan as an insurance policy on your Forex account.Why do you have insurance on your car, or on your life, or on your house?? In case a disaster
happens!! It's the same with trading, you need protection from the ultimate Forex disaster... the losingstreak!
Most new traders risk way too much of their money per trade because they do not understand how probability works. Just because you're trading a system that has an 80% win rate does not mean thatyou will “win 4 trades and lose 1” over and over in a repeating pattern. Losing streaks of 4, 5, andeven 6 trades will happen. It's not a matter of if it will happen, but a matter of when it will happen.
If you don't believe me, just start flipping a coin. I bet you can't get to 20 flips without hitting a streak of at least 4 heads or tails in a row. Your MM plan is an insurance policy against losing streaks likethat. It keeps those streaks from wiping out your account!
So where do we get a MM plan? That's easy, I'm going to give you one right now.
Rule #1: Risk no more than 2% of your account balance per trade.Rule #2: See Rule #1.
How does it work in practice? Here's an example...
Say we have opened a trading account with $1000 dollars. We always want to risk 2% of our accounton each trade, so we multiply our account balance by 2% ($1000 * .02) and get $20.
So if a trade fails we want to only lose $20. We know how much we want to risk, now it's time figureout what lot size give us that amount of risk. The formula for that is easy...
After we've planned our trade and know what our stoploss is going to be (we'll learn how to do thatlater) we simply divide our risk by our stoploss. So if we want to risk $20 and our trade has a stoplossof 50 pips, then we divide $20 by 50 pips and get 0.4 dollars per pip. We know 1 micro lot equals 10cents per pip, so to trade 40 cents per pip we need to trade 4 micro lots.
Now I know there's some Forex/math guru out there reading this saying, “Hold on, that's wrong!! That

8/8/2019 Phil's Basic Chart Analysis Method
http://slidepdf.com/reader/full/phils-basic-chart-analysis-method 3/12
formula depends on the pair your trading! If you're trading GBP/JPY then your result is in pounds, notdollars!!”
That person is technically right, but there's no need to do the extra math to get “down to the penny”results. If you always use 2% of your account in the formula then, even with the margin of error, you'llalways be trading a safe percentage of your account, even if it's not exactly 2%.
Now on to the trading method!
Chapter 2: The Basics
Rules of the method: None... This is chart analysis, and every situation is different, sothere are no “enter when x crosses y” type rules here. You have to use your brain... thereis no blind rule following here!
Indicators used: None. All you need is the ability to draw lines on your chart.
Timeframe: Any timeframe will work, but higher ones work best. I don't trade onanything less than a 4 hour chart.
Pairs: This method works on any pair, although I personally like GBP/JPY!

8/8/2019 Phil's Basic Chart Analysis Method
http://slidepdf.com/reader/full/phils-basic-chart-analysis-method 4/12
Chapter 3: Candlesticks
I know candlestick formations and patterns can be confusing, but don't worry. You don't need to
memorize dozens of candle patterns with weird Japanese names in order to trade! All we need are two basic candle concepts... Long Wicked Candles and Inside Candles.
Long Wicked Candles (LWC) are just what they sound like, candles with long wicks. I've circled someLWC's on the chart below. Notice that almost every time price changes direction we see a LWC.
I know what you're thinking... “But Phil,” you say, “there are long wicked candles all over that chart,and they aren't just in the places where price is reversing!” You're right, but remember we aren't basingtrades off these LWC's by themselves. They are simply a tool to help us identify price reversals. Weneed to use them along with all the other tools we're going to learn later in the method.
8/8/2019 Phil's Basic Chart Analysis Method
http://slidepdf.com/reader/full/phils-basic-chart-analysis-method 5/12
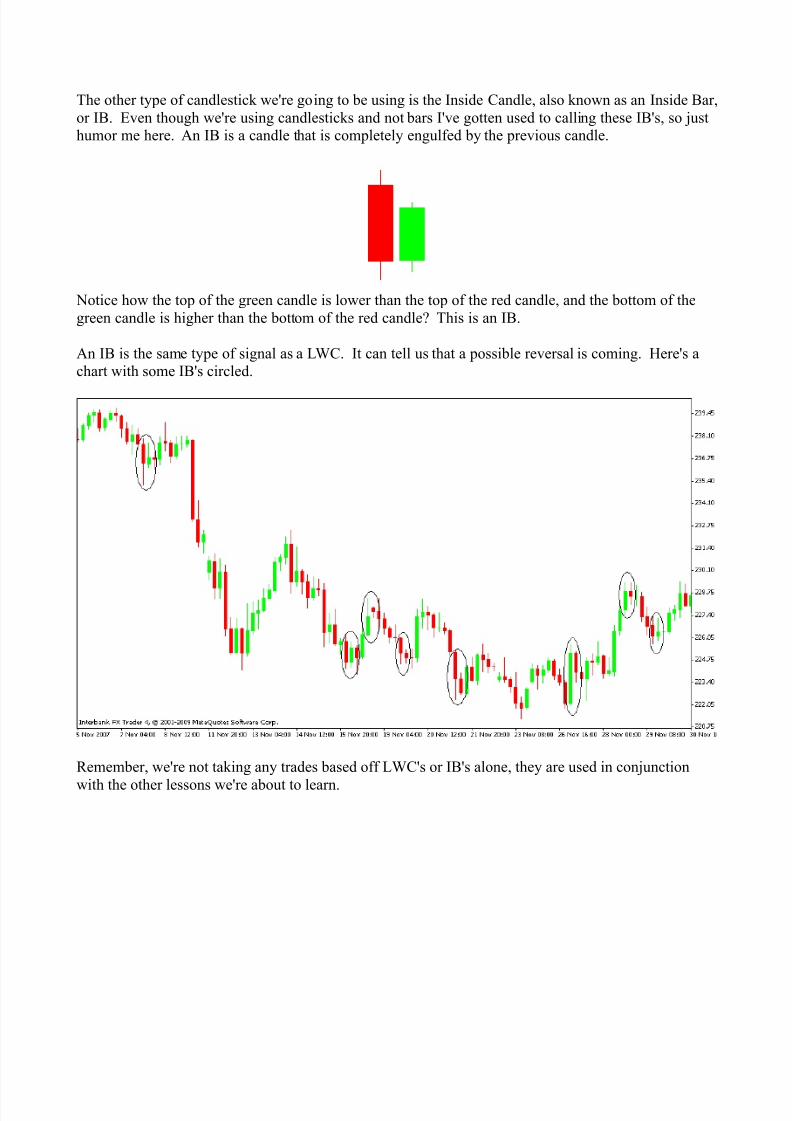
The other type of candlestick we're going to be using is the Inside Candle, also known as an Inside Bar,or IB. Even though we're using candlesticks and not bars I've gotten used to calling these IB's, so justhumor me here. An IB is a candle that is completely engulfed by the previous candle.
Notice how the top of the green candle is lower than the top of the red candle, and the bottom of thegreen candle is higher than the bottom of the red candle? This is an IB.
An IB is the same type of signal as a LWC. It can tell us that a possible reversal is coming. Here's achart with some IB's circled.
Remember, we're not taking any trades based off LWC's or IB's alone, they are used in conjunction
with the other lessons we're about to learn.

8/8/2019 Phil's Basic Chart Analysis Method
http://slidepdf.com/reader/full/phils-basic-chart-analysis-method 6/12
Chapter 4: Support and Resistance Zones
Understanding support and resistance is essential if you want to successfully interpret Forex charts, but
what exactly is support and resistance (abbreviated S+R)?
What causes S+R is an economic question that's beyond the scope of this lesson, but understanding thereason for it really isn't important to us anyway. All we need to know is this...
RESISTANCE levels exists above the current price, and act as a barrier to the price increasing abovethe level. Imagine you were inside your house and tried to jump up through the roof... You wouldencounter resistance from your ceiling, and it would be very hard to break through that resistance.
SUPPORT levels exist below the current price, and act as a barrier to the price falling below the level.When you fall back down from your previous jump you will encounter support from the floor whenyou hit it. You would have to do a lot of stomping to break through the support of your floor!
So why is it important that you know where the current support and resistance levels are? The reasonis simple... Support and resistance levels are places where price direction can possibly reverse on
you. So if you know ahead of time where they are, then you can take profit on your trades before the price reverses against you, and you can enter into new trades!
So how do we find these S+R levels. It's actually pretty easy, it just takes practice to get good at it.
Look at this chart... The gray bar marks a very strong area of support. A total of 15 candles have their bottoms on or in this gray box. I call an area such as this an S+R zone.

8/8/2019 Phil's Basic Chart Analysis Method
http://slidepdf.com/reader/full/phils-basic-chart-analysis-method 7/12
Here's the same chart, with an area of resistance added. A total of 9 candles have their tops on or in thisgray box.
We can see in the above picture that the price is heading back up, so if we were in a trade where do youthink a good exit point might be? That's right, the upper S+R zone!
You may have noticed that I'm using what I call S+R zones, and not single S+R lines like a lot of other traders. Lines tend to be too rigid for me, because prices rarely bounce directly off a certain line. Azone is a much more realistic representation of S+R levels.
So how do we use these S+R zones to trade? You can trade directly off S+R bounces, but I like to addone more tool to the toolbox... The trendline!

8/8/2019 Phil's Basic Chart Analysis Method
http://slidepdf.com/reader/full/phils-basic-chart-analysis-method 8/12
Chapter 5: Predicting Trends
Anyone who's been trading for any time at all has heard the phrase “The trend is your friend,” but what
exactly is a trend, and more importantly, how to we predict them and use them to our advantage?
A trend is nothing more than a series of higher highs and higher lows (or lower highs/lows for adownward trend). The following picture is a GBP/JPY daily chart. I've marked the trend with two purple trendlines, and I've circled the significant high/low points of the trend. Notice how the high points I've circled in blue keep getting lower and lower, and how the low points circled in red also keepgetting lower?
When this pattern of lower highs and lower lows stops it means the trend is coming to an end, and thata new trend will be beginning. Here are the three things to look for that signal the death of a trend.
1: A break in the trend's trendline. A trendline is just a line connecting the significant high/low points
of a trend.2: A high that's above the previous major high point.3: A low that's above the previous major low point.
This example is for a downward trend, an upward trend would need to use the opposite of steps 2 and3.
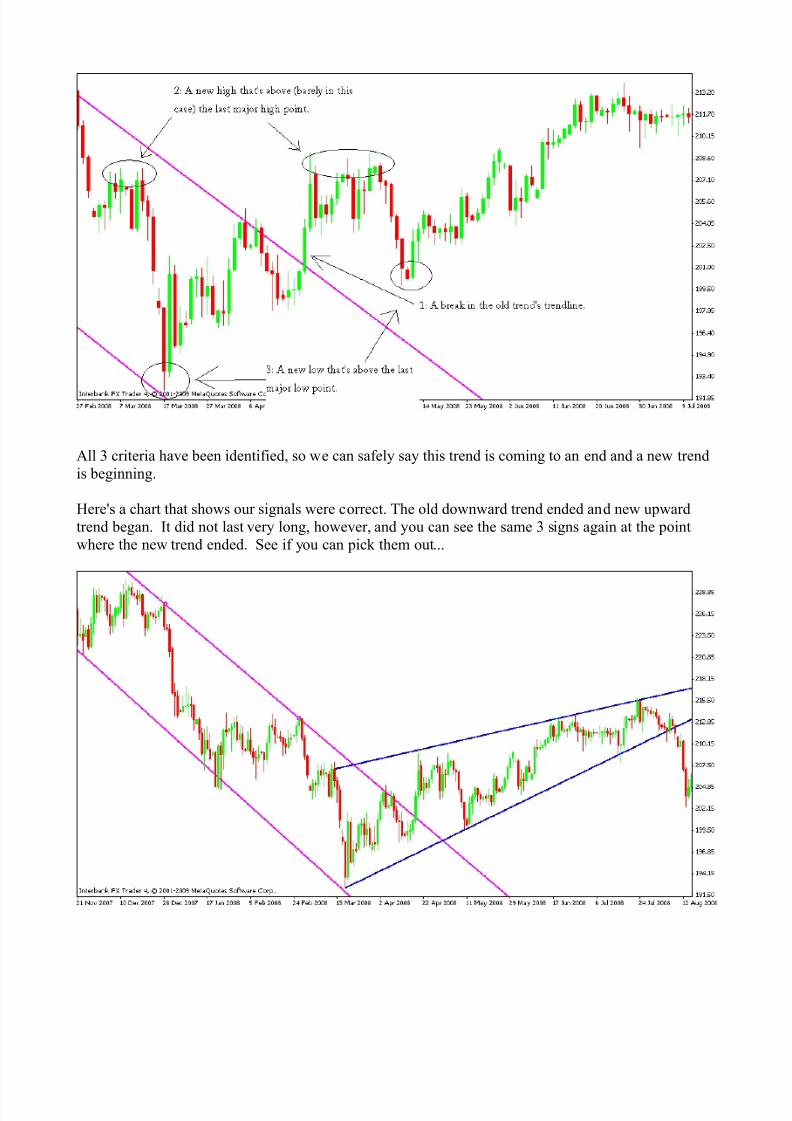
On the next page is a chart that zooms in on the end of this trend and shows these 3 things.
8/8/2019 Phil's Basic Chart Analysis Method
http://slidepdf.com/reader/full/phils-basic-chart-analysis-method 9/12
All 3 criteria have been identified, so we can safely say this trend is coming to an end and a new trendis beginning.
Here's a chart that shows our signals were correct. The old downward trend ended and new upwardtrend began. It did not last very long, however, and you can see the same 3 signs again at the pointwhere the new trend ended. See if you can pick them out...

8/8/2019 Phil's Basic Chart Analysis Method
http://slidepdf.com/reader/full/phils-basic-chart-analysis-method 10/12
Chapter 6: Finding Entries, Stoplosses and Profit Targets.
Let's practice putting everything we've learned together to find potential trades. Here is a EUR/JPY 4Hchart with trendlines and S+R zones already drawn. Can you see the trade opportunity?
As you can see, the last candle on the chart is a Long Wicked Candle, and it has bounced directly off both an S+R zone and off a trendline. This makes it an excellent trade opportunity! But when do weenter, and what do we use for our stoploss and profit target? In the picture on the next page I've addedtwo lines to our chart. An orange line for our entry point, and a red line for our stoploss.

8/8/2019 Phil's Basic Chart Analysis Method
http://slidepdf.com/reader/full/phils-basic-chart-analysis-method 11/12
The Entry:
Before we enter we need to confirm that this is a valid price reversal. Even though all the signs of areversal are there, we need to be safe and wait for the actual reversal to start. To confirm the price isreversing we want to wait until the current candle moves a few pips above the red LWC that signaledthe reversal. This is represented by the orange 132.45 line in the above picture. After the price brokeabove that orange line I would have entered the trade. Remember, we're not waiting for the candle toclose, just move above the line. If we wait for a close we'll miss out on too much profit!
The StopLoss:
We want our stop to be somewhere safe, in a place is is very unlikely to get hit. In this case I would place my stop at the red 131.40 line, which is on the other side of both the S+R zone and the trendline.You'll also notice that if price did reach this level then we would have a lower low than the previous131.46 low. This would mean our upwards trend was failing, and that the price is probably not going togo back up anyway, so it's a great place for a stoploss.
The TakeProfit:
For a TP level I would be watching two different areas, the upper S+R zone, and the area around theupper trendline. If the price started to reversal around the S+R zone, I would take my profit and be outof the trade, but if it moved through the zone, I would exit around the upper trendline.
You could also exit half your position at the S+R zone and the other half at the trendline, if you prefer.Either way is acceptable.

8/8/2019 Phil's Basic Chart Analysis Method
http://slidepdf.com/reader/full/phils-basic-chart-analysis-method 12/12
Let's look at the chart after the trade is completed...
As you can see, the candle after our entry flew straight through the S+R zone, and on the candle after that price touched our trendline, signaling our exit from the trade. If you got out on the trendline touchyou would have gotten 230 pips with a 105 pip risk. That's a reward:risk ratio of 2.19, and was anexcellent trade. Even if you waited and got out after the bounce you still would have gotten +180 pips.
That's the conclusion of my basic chart analysis method, but here is one more picture to help you seehow to spot trades. In the following picture the orange line is the entry, the red line the stoploss, andthe dark green is the profit target.


![Vincent & Phil's Book Circle Project [final presentation]](https://img.pdfslide.us/doc/110x75/58efe1fa1a28ab562f8b4681/vincent-phils-book-circle-project-final-presentation.jpg)