Embed Size (px)
Citation preview

Measuring Personality Traits and Predicting Loan Default with Experiments and Surveys¥
Dean Karlan
Yale University
Sendhil Mullainathan Harvard University
Omar Robles Bureau of Labor Statistics
January 2011
Abstract: We use two natural field experiments and surveys to identify character elements, and test whether these traits can be used to predict the likelihood of loan default. In the first experiment we identify subjects with high psychosomatic moral costs by observing their reactions when a bank error is made in their favor. In the second experiment we identify subjects that were less naïve about their own ability to meet future commitments. We found that both individuals with higher moral costs and individuals who were the least naïve displayed lower default rates than other groups. We also explore the relationship between qualitative survey-based social capital measures and loan default. We find that survey-based social capital measures are not predictive of loan default for these individual loans, contrary to the results from a prior study -with group loans. Lastly, we examine whether more general personality index measures predict default, and we find that they do not. Overall, the lessons present evidence of moral hazard in microentrepreneurial credit markets to the extent that they reflect choice by the borrower about whether to repay. They also show the potential for adverse selection insofar as these personality measures are typically unobservable to the lender. JEL Classification: O16, N95 Keywords: Default, Naïve Beliefs, Personality Index, Social Capital
¥ We thank Carissa Feria, Matthew Grant, Tomoko Harigaya, Nicole Mauriello, Sang Seok Lee and Hannah Trachtman for excellent research assistance. This article has benefited from the comments of Nava Ashraf, Lucas Coffman, Justin Ho, Asim Khwaja, Kirk Moore and participants at the Harvard Economic Development workshop. Any and all errors are the authors’ own. All views expressed in this paper are those of the authors and do not necessarily reflect the views or policies of the U.S. Bureau of Labor Statistics.

1
I. IntroductionIntuition suggests that certain personality types are predisposed to loan default. Accurately
identifying these personality types could have profound implications for consumer banking policy, and
also important lessons for our understanding of why credit markets may fail. Specifically, we discuss two
types of moral hazard, a more deliberate or conscious decision to shirk or not repay (e.g., strategic default)
versus a less deliberate series of acts of financial or time mismanagement which lead to the inability to
repay. Our experiments are designed to measure each separately, and in the case of individual
mismanagement, especially to assess whether the individual is self-aware of his mistakes. This second
aspect of self-awareness is important in terms of its theoretical implications, in that it determines whether
the information on type is hidden from both the lender and the borrower or just the lender.
We used two experiments and one survey to create personality measures of subjects. In the first
experiment we tried to identify subjects with higher moral standards. During the experiment, subjects were
intentionally given too much cash during a transaction at the bank; subjects were encouraged to believe
this was a result of a clerical error by the bank’s cashier (hereafter referred to as bank error). We focused
on subjects who returned and reported the bank error after first exiting the bank with additional cash, as
once the individual has left the bank the perceived likelihood of being penalized for taking the extra cash
should fall. Thus, for this group of individuals, the high psychosomatic moral cost can be understood as
the driving force behind the decision to return. Using the above experiment to measure moral standards, or
psychosomatic cost of moral defection, we find that those who voluntarily return to the bank to
acknowledge the error are less likely to default, and if they do, they default on a smaller amount.
In our second experiment we tried to identify subjects that were not able to complete a future task
(complete a text-back1 message survey exactly 7 days later), and those who were naïve about the
likelihood that they will complete the task. In this experiment individuals were randomly assigned to one
1 Text-back refers to the act of communication via Short Message Service (SMS) on mobile telephones.

2
of two groups: those asked to respond in exactly 7 days (the control group), and those given the choice to
respond in exactly 7 days or complete the survey immediately at the bank for significantly less
compensation. Those who choose the text-back option but failed to actually text back can be classified as
naïvely over-optimistic subjects. Those who choose to complete the survey immediately can be classified
as being rationally aware, or pessimistic, about their ability to meet future commitments. We then attempt
to link these personality traits to the probability of loan default. We expect that the naïvely over-optimistic
subjects will be more likely to believe they can make a higher stream of loan payments than their
circumstances permit, and thus more likely to default on loans. We expect that rationally aware subjects
will be less likely to default on loans. We find that the subjects who chose to text-back were not more
likely to actually text-back than the control group, which suggests the presence of subjects with naïvely
optimistic beliefs. In addition, consistent with our theory, we find that rationally aware subjects—those
who did not choose the text-back option—were less likely to default relative to the other groups.
Finally, we used a survey to explore the relationship between psychological measures and
behavior in both our experiments and loan default. We first attempted to use measures of social capital to
predict default in individual loans (as compared to previous work mapping measures of social capital to
predict default on group loans (Karlan, 2005)). We found that social capital is less predictive in individual
loans, which makes sense, since the burden of default falls on the bank and not individuals within the
participant’s social network. We also incorporated recent work in psychology to examine the relationship
between personality index measures and behavior in real-world settings. Several studies have been able to
predict school-related or job-related behavior using these personality measures.2 Yet few studies have
analyzed the link between personality measures and undesirable behavior. Salgado (2002) examined the
relationship between personality measures and counterproductive behavior such as absenteeism, accidents,
deviant behaviors, and turnover. The results of that meta-analysis showed that conscientiousness
2 Zimmerman (2008) found that neuroticism best predicted (negatively) employees' intentions to quit, whereas the traits of conscientiousness and agreeableness best predicted (negatively) actual turnover decisions. He found that employees who were low on neuroticism were more likely to quit for reasons other than dissatisfaction with their jobs or not being able to perform their jobs well. The direct effects on turnover suggest that individuals who were low on agreeableness or high on openness were more likely to engage in unplanned quitting. See Barrick and Mount (1991) for more.

3
consistently predicted deviant behaviors. Although we find no evidence that personality measures are good
predictors of loan default, we discovered other interesting links between the personality measures and the
classes of subjects we identified in our experiments.
II. SettingThe experiments took place from 2005 to 2006 in various locations across the island of Luzon in
the Philippines.3 A regional bank, the Rural Bank of Mabitac, provided us with the financial transaction
data through one year after the experiment for all of the subjects involved in our experiment.4 Experiments
and surveys were conducted by the bank immediately after subjects had received approval for a new
individual loan. This bank was an ideal setting for our experiment due to its high default rate of 71%
(default defined as not completing full payment on or before the maturity date of loan). Since we do not
have financial transaction data for the period after the maturity dates of loans, we are unable to report the
overall final default rate (i.e., never completed payment).
All participants were recipients of short-term individual loans which were commonly renewed 2-5
times a year. Summary information on the characteristics of the participants is available in Table 1. Over
77% of the participants were female of which 82.2% were married and 74.5% had secondary or post-
secondary education. The average income for the sample was within the ninth decile of the population
according to the 2006 Philippine Census (i.e., are on the wealthy side but not the wealthiest). Given that
there is a relatively large middle class in the Philippines, and that these data come from different sources,
theyare likely to be biased high (applicants have an incentive to overstate income on loan applications in
order to get larger loans). The vast majority of subjects were entrepreneurs, and the most common form of
business was “corner stores.”
3 See Figure 1 for a map of the eight branch locations on the island of Luzon in the Philippines. 4 The bank was established in the early 1970s and regulated by the government. It typically offers 90-day term loans and voluntary savings. Only individual loans with a start and maturity date within one-year period were included in the analysis.

4
III. Experiments and Results
A. BankErrorThe first experiment was focused on the influence of a borrower’s moral standards or high
psychosomatic costs of immoral behavior on strategic default; these character traits were assessed at a
bank branch when the subject was compensated for completing an initial survey. The subject had just met
with the loan officer to initiate or renew a loan, and was asked to fill out an initial survey on individual and
household characteristics. The subject was also told that this survey was voluntary, participation would not
influence the loan decision, and all answers would be confidential and not shared with the bank. A loan
officer informed the subject that he would receive compensation of P30.00 (US$0.60) in exchange for
participating in the survey. The officer then conducted the survey and gave the subject a claim stub that
stated “Thank You. Claim your P30.00 from the cashier.” 5 Both the verbal instruction by the loan officer
as well as the written instruction on the claim stub informed the subject that the bank had pledged P30.00.
The subject was instructed to hand the stub to the bank cashier in exchange for the promised P30.00. In
each case the cashier handed the subject P50.00 (two P20.00 bills and one P10.00 bill or coin) and
instructed the subject to sign the claim stub upon receipt of the money.6 If a subject alerted the cashier to
the error and returned the excess compensation of P20.00 the cashier was instructed to say “Oh! Thank
you” and make no acknowledgement of the intentional bank error. If a subject did not alert the cashier to
the excess cash then the subject was allowed to leave without interruption.
We classify the subject’s behavior into three possible reactions. The subject either: (1)
acknowledged and immediately returned the excess cash; (2) exited the bank without acknowledging or
returning the excess cash; or (3) exited the bank but returned later in the day to acknowledge and return the
excess cash.7
We argue that the first two of the three aforementioned actions reveal little information about a
subject’s moral standards or psychosomatic moral costs. First, there is no certainty that subjects who left 5 All communication in verbal or written form was in Tagalog, the official language of the Philippines. 6 The two bills should be easily differentiable by the different images and colors. 7 There were no reports of subjects who attempted to return the money the day after initially leaving the branch.

5
the bank were aware of the excess cash when doing so. Second, the subject’s chosen action may also
reflect the expected consequences of taking the cash or revealing the bank error. The subject’s choice will
depend on the perceived likelihood and severity of being penalized, the benefit from obtaining the excess
cash, as well as the potential for guilt or some other psychosomatic cost. Since we cannot distinguish
between these motivations, the act of immediately revealing the bank error uncovers little information
about the subject’s psychosomatic costs. We might expect that the majority of subjects that chose to return
the excess cash were motivated by the cost-benefit analysis (the risk of being penalized exceeds the benefit
of taking the excess cash) given that the amount of excess cash was insignificant relative to the size of
each subject’s loan (0.001% on average), and therefore also insignificant relative to the value of a
continued relationship with the bank.
The third reaction (returning excess cash after exiting the bank), however, does reveal information
about the subjects’ moral standards or psychosomatic costs. We can organize this group of subjects into
two classes: those who exited the bank knowing about the excess cash, and those who exited the bank not
knowing about the excess cash. The former case implies that the subject initially intended to take the
excess cash but changed his mind after exiting the bank. The latter case implies that the subject realized he
had the excess cash after exiting the bank, and subsequently decided to return it. We contend that for either
class of subjects, the perceived risk of being penalized for taking the excess cash is lower ex post. This
raises the overall expected value of the choice to take (or keep) the excess cash. Since the subjects in this
group have a higher expected value for keeping the cash, but return it anyway, we can infer that on average
they have higher psychosomatic costs from taking the excess cash, relative to subjects who reveal the bank
error immediately (and also, of course, relative to subjects who take the cash).
We note that failure to notice the excess cash quickly may also be indicative of simply being
unorganized. If this were the case, that such individuals were somewhat (only “somewhat” because they do
have to notice the error a few minutes later) unorganized, then this would counteract the hypothesis, as
such a characteristic is potentially positively correlated with default or missed loan payments.
We put forward the following hypothesis:

6
Hypothesis #1 (Bank Error): Returning to the bank to give back the excess cash is negatively
correlated with loan default.
Our findings in Table 3 suggest that, as predicted, the aforementioned subjects were significantly
less likely to default within one year of the experiment than the other groups. We used probit regression
analysis to determine the subjects’ likelihood of default and tobit regression analysis to analyze the
fraction of the principal defaulted (given censoring at zero). Separate analysis was done on default in the
first loan cycle (Panel A) and over the course of the first year (Panel B). There is no indication in Panel A
that any of the three groups of subjects were more or less likely to default on the first loan cycle after the
experiment, but Panel B shows that the longer term effect on repayment over one year is strong and
significant statistically: subjects who returned the excess cash ex post were 15.1% less likely to default
within the first year of the loan. The lack of predictive power for immediate default potentially indicates
that trustworthiness and morality do not lead to more default immediately after disbursal than later, or if
anything, morality is more influential on default in later loan cycles. This could be an indication of
strategic behavior from the beginning, to wait until loan sizes are larger before defaulting, or could simply
be a function of more time needed to improve efficiency of estimates of default. Economically, the effect
is large: the amount of the default as a percentage of the principal was 15.0% lower for those marked as
trustworthy. Thus we contend that on average, subjects who return the cash after exiting the bank have
higher psychosomatic costs, which in turn makes them less likely to default. The true effect of high
psychosomatic costs may be understated, as customers who returned to the bank may have been less
aware, counteracting some of the reduction in default rate caused by higher psychosomatic costs.
B. TimedResponseSurvey
The second experiment was focused on unintentional default; we examined the link between both
a subject’s ability to meet future commitments and one’s own perception of its ability to meet future
commitments, with the likelihood of default. The subjects were asked to participate in a shorter second
survey upon completion of the first survey but prior to receiving the excess cash in the bank error

7
experiment. The survey contained two short questions on client satisfaction with multiple choice
responses: the first question required a one digit response (1-5) and the second question required a single
letter response (A-E). The subjects were randomly assigned to one of two groups: Group A was given the
survey and instructed to text-back the responses exactly one week in the future using his or her cell phone.8
Subjects were informed that P50.00 (US$1.00) would be deposited in the person’s savings account at the
bank if the text was received on the specified date,9 otherwise no payment was made to the subject.10
Group B was given an identical survey but had a choice regarding timing and payment: the person could
either complete the survey immediately at the bank for P30.00, or they could text-back the response
exactly one week in the future for P50.00.
The experiment yields five pools of people, outlined in the table below: (1) those in Group A (i.e.,
who had no choice about when to respond) and were successful; (2) those in Group A who were
unsuccessful; (3) those in Group B (i.e., who had a choice on when to respond) who chose to complete the
survey immediately; (4) those in Group B who chose to text-back in a week and were successful; and (5)
those in Group B who chose to text-back in a week and were unsuccessful. The table below presents a
discussion of how these five experiment outcomes identify various personality types, and ensuing
predictions regarding correlation with default.
8 All subjects were required to have access to a cell phone to participate in this experiment. 9 The bank required all loan recipients to have a savings account. 10 The instructions specifying the expected date for the response, the phone number and the amount to be deposited were all clearly specified on each copy of the survey that was provided to subjects.
8
Treatment Group
Choice Experiment
Success # Personality Inference
Predicted Loan Behavior
A: No Choice
n/a
Successful 1
Good at implementing future plans (assumes cost of responding is lower than opportunity cost of time, which
may be correlated with ability to repay)
Low default rate
Unsuccessful 2
Bad at implementing future plans (assumes cost of responding is lower than opportunity cost of time, which
may be correlated with ability to repay)
High default rate
B: Choice
Choose Immediate
N/A 3
Either (a) very high discount rate, or (b) bad at (or pessimistic about)
implementing future plans and self-aware
(a) Ambiguous11 and (b) Low default
rate
Choose Text-Back
Successful 4 Good at implementing future plans
and self-aware Low default rate
Unsuccessful 5 Bad at implementing future plans and
not self-aware High default rate
The choice made by subjects in Group B--to immediately complete the survey or to text-back the
response to the survey-- depends on both the discount rate and the self-perceived likelihood of completing
the task.12 Subjects with a sufficiently high discount rate may find it optimal to forego 40% of the payout
to avoid waiting a week for payment, and complete the survey immediately. Subjects who believe they
have a low likelihood of success may also find it optimal to complete the survey immediately, while
subjects who believe they have a high likelihood of success will choose to text-back the response.
If subjects’ perceptions are correctly realized then we should see a higher rate of text-back success
in Group B relative to Group A due to self-selection; this means that we would expect to see a higher
success rate in Group B for those who opt to text-back in a week than in Group A who are randomly
assigned to have to text back in a week (i.e. all of Group A).
The results of our analyses are presented in Table 4.
11 It is ambiguous whether or not individuals with high discount rates should be more or less likely to default. On the one hand they likely place a high value on access to credit while on the other hand their higher value on short-term consumption may increase their inability to meet future obligations. 12 We are not concerned about the potential for a liquidity constraint since the payout is an insignificant proportion (0.001%) of the loan that is received the same day.

9
Hypothesis #2 (Bad Implementers Default): Within Group A (i.e., those with no choice as to
whether to do the survey now or later), those who failed to text-back (Group 2) are more likely to default
than those who succeed (Group 1). Within Group B, (i.e., those with a choice as to whether to do the
survey now or later), those who failed to text-back (Group 5) are more likely to default than those who
succeed (Group 4).
There is weak evidence that the subjects who successfully texted-back were less likely to default
than those who did not. The difference is not statistically significant at 90% but the individuals who failed
to text-back (Group 2) did have a greater likelihood of default than those who successfully texted back,
particularly in the first-cycle. Within Group B, the evidence is similar; among those who texted back the
first-cycle default rate is 18%, compared to 28% among those who were unsuccessful. The differential
reverses after one year (although neither near the level of statistical significance nor of the magnitude
found from the first experiment). The fraction defaulted is consistently higher through the first year for
those who failed to text-back.
Hypothesis #3 (Self-Aware Test): Group 3 is less likely to default than Group A (no choice
treatment group). Group 3 contains individuals bad at implementing future plans but self-aware, so they
may only seek out loans they expect to repay. Note this hypothesis has an important confound, in that
Group 3 also contains those with high discount rates (i.e., unwilling to wait a week for higher future
payment), and thus this is not a clean test of this hypothesis.
We find evidence for Hypothesis #3. Group 3, comprised of self-aware bad implementers, are 9
percentage points less likely to default. The one year results, however, are nearly half the size and not
significant statistically.
Hypothesis #4: (Sorting of the Self-Aware): Group A is more likely to fail to text-back than
pooled Groups 4 & 5 (text-back pool of Group B), because the choice to opt out of the future plan likely
removes self-aware bad implementers from this Group B pool.

10
There is some evidence to support Hypothesis #4 based on the average success rates. While
79.5% of subjects in Group B failed to text-back after having made the choice to text-back, 82.8% of
subjects in Group A failed to text-back.
Hypothesis #5 (Bad Implementers Effect Strongest with Sorting): Since bad but self-aware
implementers select out of the text-back pool (and are in Group 3), the differential between Group 5 and
Group 4 default will be more than the differential between Group 2 and Group 1 default.
The results of our analysis show that the default differential for the first cycle is 3 percentage
points higher for Group B than Group A. When considering the data from the first year, this differential is
4 percentage points and is slightly stronger statistically.
IV. Surveys
A. SocialCapital
For the third part of the study, we administered a survey with the social capital questions from the
General Social Survey (GSS) on trust, fairness and helpfulness to predict default.13 One definition of
individual-level social capital is the social skills and networks that enable an individual to overcome
imperfect information problems and form contracts with others.14 Trust and trustworthiness are two
critical ingredients of individual social capital. Previous literature has examined the link between the GSS
questions and the Trust game15 as well as the GSS questions and real-life outcomes or decisions. Glaeser
et al. (2002) found that more positive answers to the GSS questions predicted trustworthy behavior in a
trust game but not trusting behavior. Since the difficulty of observing or enforcing credit market contracts
can be mitigated by increased social connections, there should exist a positive relationship between loan
compliance and measures of social capital. Karlan (2005) used the GSS to predict real financial decisions
13 See Sobel (2002) for more information on the social capital literature. See Krishna and Shrader (2000), and Grootaert and van Bastelaer (2001) for discussions on measuring social capital. 14 See Fukuyama (1995), and Ostrom (1990) for work on social capital frameworks. 15 The trust game extends the dictator game one step by having the reward that the dictator can (unilaterally) split between himself and a partner partially decided by an initial gift from that partner.

11
on a micro-level, and found evidence that more positive answers to the GSS questions predicted higher
repayment on group loans and higher savings levels (for savings then held as collateral for the group
loans).
The results of our probit regression analysis in Table 5 indicate that social capital does not predict
default on individual loans, unlike the result for group loans from Karlan (2005). This may be because
social capital makes people less likely to default when the burden falls on people within their network, as
is the case with group lending. However, in the case of individual loans, the burden falls on the bank,
which is likely to be outside of a subject’s social network.
B. PersonalityIndex
In the final part of the study, we examined the relationship between personality index measures
and behavior in financial settings using the Big Five personality index model. The Big Five personality
index model is a hierarchical model developed from statistically aggregate clusters of descriptors of
personality.16 The model summarizes personality into the following five factors:
1. Openness A dimension of personality that distinguishes imaginative, creative people from down-to-earth, conventional people.
Describes the breadth, depth and complexity of an individual’s mental and experiential life (Caspi et al., 1994).
2. Conscientiousness Concerns the way in which one controls, regulates, and directs one’s impulses. Primarily describes tasks and goal directed
behavior and socially prescribed impulse control. 3. Extraversion Is marked by pronounced engagement with the external world. 4. Agreeableness Reflects individual differences in concern with cooperation and social harmony. 5. Emotional Stability Refers to the tendency to experience negative emotions
(anxiety, sadness, irritability and nervous tension).
16 The most recent account of the Big-Five personality dimensions were developed by Goldberg (1981) but first identified by Norman (1963). This model has become widely used in the psychology field (for reviews, see John & Srivastava (1999) and McCrae & Costa (1999)) but not unanimously (see Block (1995)).

12
Recent research has looked at the Big-Five’s predictive power in personality disorders and job
performance. Barrick and Mount (1991, 1998) found that conscientiousness showed consistent relations
with all performance criteria for all occupational groups. Extraversion was a valid predictor for
occupations involving social interaction (e.g. management and sales). Furthermore, extraversion and
openness to experiences were valid predictors of training proficiency criteria. However little systematic
research on personality measures has been directed at whether the Big Five are predictive of
counterproductive behaviors. Salgado (2002) found (i) that conscientiousness predicted deviant behaviors
(e.g. theft, drug and alcohol use) and turnover and (ii) that extroversion, openness, agreeableness, and
emotional stability predicted turnover.
We examined the Big Five’s ability to predict default and behavior in our experiments using the
Ten-Item Personality Index (TIPI), a brief measure of the Big-Five factor model developed by Gosling et
al. (2003). The TIPI uses a seven point scale from 1 (strongly disagree) to 7 (strongly agree) for each of ten
descriptive items. Pairs of items compose each of the five factors of personality similar to the bipolar
markers in Goldberger (1992). Gosling et al. (2003) provide evidence that the instruments reach adequate
levels in terms of: (a) convergence with widely used Big-Five measures in self, observer, and peer reports,
(b) test–retest reliability, (c) patterns of predicted external correlates, and (d) convergence between self and
observer ratings.17
The results examining the predictive power of the five factor personality index model on default
and behavior in our experiments are presented in Table 6. We found no evidence that personality measures
were strong predictors of default in the first cycle or first year after the survey using probit regression
analysis.
We can speculate that there is little to no deliberate default in our sample according to Salgado’s
results, or that there is deliberate default and our results contradict that of Salgado (2002). We used a
multinomial probit regression to examine the predictive power on the bank error outcomes normalized on
17 Although long instruments tend to have better metric properties than short instruments, the time and costs associated with short instruments are much lower.

13
the choice to return the excess cash prior to exiting the bank. We found evidence that Agreeableness and
Openness were weakly negatively correlated with never returning the excess cash (relative to returning it
at the moment of the disbursement). This is perhaps because individuals who rated themselves as being
highly agreeable or open were concerned with cooperation and maintaining social harmony.
In the case of the text-back experiment we found that Emotional Stability (i.e. calmness vs.
anxiety, irritability) was positively correlated with the choice to text-back. Alternatively this result
suggests that individuals who rated themselves as being relatively anxious were more likely to choose to
complete the survey at the bank rather than text back a response. This is consistent with our premise that
some of the Group B individuals who chose to complete the survey at the bank may have done so because
of a very high discount rate. Openness was correlated with actual success in the choice to text-back. This
may be due to the association between Openness and crystallized intelligence which is the ability to use
skills, knowledge and experience (Geary 2005).18 Crystallized intelligence relies on the ability to access
memory. As a result it is possible that lack of success in the text-back experiment may be due to an
inability to remember how or when to text-back the survey results, particularly since it is an uncommon
act.
Overall, however, the correlations between personality measures and repayment were weak and
did not conform to a precise theory. This could be due either to a default driven by non-choice
circumstances (shocks in one’s life, that are not correlated with personality) or tomeasures which not
successfully identify personality traits in this context or implementation.
V. Conclusion
We used field experiments and surveys to identify character elements that may predict the
likelihood of default in individual loans. In the first experiment we identified the class of subjects with
18 Crystalized intelligence is distinct from fluid intelligence which is the ability to reason independent of knowledge. It is worth noting that Openness is only weakly correlated with general intelligence.
14
high psychosomatic costs from taking excess cash when a bank error was made in their favor. We find this
measure is positively correlated with default on loans over one year. In the second experiment we
identified the class of subjects that were less naïve about their own ability to meet future commitments. We
then used that information to predict the likelihood of default in the first loan cycle. We also explored the
relationship between psychological measures and behavior in both our experiments and in the case of
default on individual loans, and found little correlation for both measures of social capital and personality
measures. From a policy perspective, given the growth of cell phone ownership and introduction of mobile
banking, these experiments do suggest that credit scoring approaches could benefit from further
exploration and identification of type-revealing surveys and screening devices.

15
References
Barrick, M. R., & Mount M. K. (1991). The Big Five Personality Dimensions and Job Performance: A
Meta-Analysis. Personnel Psychology, 44, 1-26. Block, J. (1995). A contrarian view of the five-factor approach to personality description. Psychological
Bulletin, 117, 187–215. Caspi, A., John, O., Moffitt, T., Robins, R., Stouthamer-Loeber, M., (1994). The “Little Five”: Exploring
the Nomological Network of the Five-Factor Model of Personality in Adolescent Boys. Child Development, 65, 160-178.
Costa, P. T., Jr., &McCrae, R. R. (1992). Revised NEO Personality Inventory (NEO-PI-R) and NEO Five-
Factor Inventory (NEO-FFI) professional manual. Odessa, FL: Psychological Assessment Resources.
Geary, D.C. (2005). The origin of mind: Evolution of brain, cognition, and general intelligence. Washington, DC: American Psychological Association. Glaeser, Edward L., Laibson, David I., Scheinkman, Jose A. and Soutter, Christine L. (2000). Measuring
Trust. Quartery Journal of Economics, 115, pp. 811-46.
Goldberg, L. R. (1981). Language and individual differences: The search for universals in personality lexicons. In Wheeler (Ed.), Review of Personality and social psychology, Vol. 1, 141-165. Beverly Hills, CA: Sage. Gosling, S.D., Rentfrow, P.J. and Swann Jr, W.B. (2003). A very brief measure of the Big-Five personality domains. Journal of Research in Personality: 37, 504-528. John, O. P., & Srivastava, S. (1999). The Big Five trait taxonomy: History, measurement, and theoretical
perspectives. In L. A. Pervin, & O. P. John (Eds.), Handbook of personality: Theory and research (pp. 102–138). New York: Guilford Press.
Karlan, D. (2005). Using Experimental Economics to Measure Social Capital and Predict Financial Decisions. American Economic Review: 95(5), 1688-1699. Mischel, W. (1968). Psychological Assessment. New York: Wiley. Salgado, J. (2002). The Big Five Personality Dimensions and Counterproductive Behavior. International
Journal of Selection and Assessment, 10: 117-125. Zimmerman, R.D. (2008). Understanding the impact of personality traits on individuals’ turnover
decisions: A meta-analytic path. Personnel Psychology, 61(2), 309-348.

16
Table 1: Summary Statistics (Means and Standard Deviations)
Demographic Information
Observations 725
Age 40.80
(9.45)
Female 77.4%
Education (Last Level Completed)
Elementary 22.0%
High School 45.3%
College 29.2%
Other 3.5%
Marital Status
Single 9.5%
Married 82.2%
Widowed or Separated 8.3%
Household Members (including head) 5.08
(1.93)
Children 2.25
(1.33)
Financial Information
First‐Time Borrower 37.2%
Average Previous Loan Cycles 3.87
(3.29)
Average Loan Size (in thousands)1 1,868
(1,665)
First Cycle Default Rate 0.26
(0.44)
Annual Default Rate 0.71
(0.45)
Household Weekly Income2
P5,000 or less 40.1%
P5,000‐10,000 25.6%
P10,000‐15,000 11.1%
P15,000 and up 23.1%
Household Income Source
Buy and Sell 8.4%
Sari‐Sari Store 3 44.2%
Other4 47.4%
Unexpected Reduction in Income5 50.3%
Held Voluntary Savings Account at Bank 52.4%
1 The exchange rate between $US and Pisos is P42 to the dollar during period of experiment.
2
Source: National Statistics Office, Republic of the Philippines
3 Sari‐Sari stores are neighborhood shops for various kinds of household items.
4 Other includes all other categories. Each has a share of less than 3.0%
5 An unexpected reduction in income over the six months previous to the survey date.
Average annual household income in ninth decile is P292,000 according to 2006 Census. This corresponds to an average
weekly income of approximately P5,615.
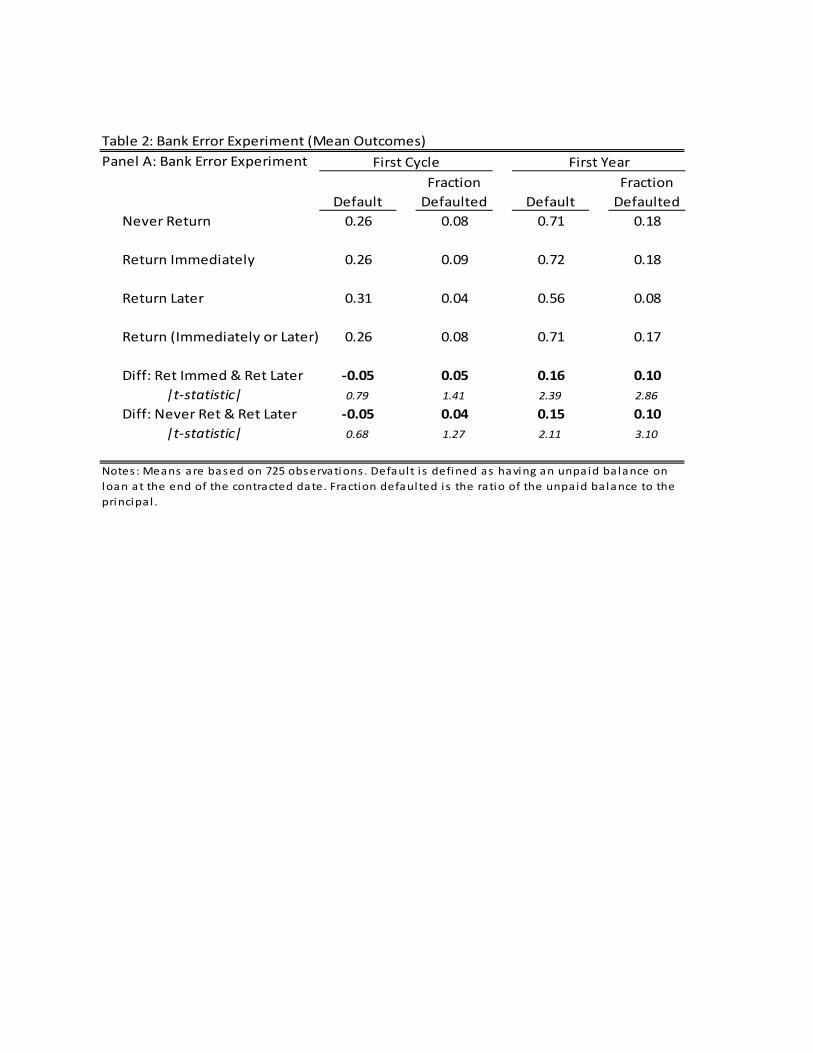
Table 2: Bank Error Experiment (Mean Outcomes)
Panel A: Bank Error Experiment
Default
Fraction
Defaulted Default
Fraction
Defaulted
Never Return 0.26 0.08 0.71 0.18
Return Immediately 0.26 0.09 0.72 0.18
Return Later 0.31 0.04 0.56 0.08
Return (Immediately or Later) 0.26 0.08 0.71 0.17
Diff: Ret Immed & Ret Later ‐0.05 0.05 0.16 0.10
|t‐statistic| 0.79 1.41 2.39 2.86
Diff: Never Ret & Ret Later ‐0.05 0.04 0.15 0.10
|t‐statistic| 0.68 1.27 2.11 3.10
Notes : Means are based on 725 observations . Defaul t i s defined as having an unpaid balance on
loan at the end of the contracted date. Fraction defaulted i s the ratio of the unpaid balance to the
principa l .
First Cycle First Year

18
Table 3: Bank Error Experiment Econometric Results
Panel A: First Loan Cycle
(1) (2) (3) (4) (5) (6) (7)
Return 0.000 0.002 0.011
(0.035) (0.035) (0.057)
Return Later 0.049 0.054 ‐0.016 ‐0.001
(0.075) (0.076) (0.117) (0.116)
Return Immediately ‐0.005 ‐0.004 0.009 0.013
(0.035) (0.036) (0.059) (0.058)
Controls No Yes No Yes Yes No Yes
Observations 725 725 725 725 725 725 725
Panel B: First Year
(1) (2) (3) (4) (5) (6) (7)
Return ‐0.004 ‐0.002 ‐0.004
(0.036) (0.036) (0.050)
Return Later ‐0.156* ‐0.151* ‐0.162** ‐0.150**
(0.080) (0.081) (0.052) (0.052)
Return Immediately 0.012 0.013 ‐0.001 0.002
(0.037) (0.037) (0.025) (0.024)
Controls No Yes No Yes Yes No Yes
Observations 725 725 725 725 725 725 725
+ significant at 10%; * significant at 5%; ** significant at 1%
Probit: Default Tobit: Fraction Defaulted
Probit: Default Tobit: Fraction Defaulted
Notes : Robust standard errors reported in parentheses . Defaul t i s defined as having an unpaid balance on loan
at the end of the contracted date. Fraction defaul ted i s the ratio of the unpaid balance to the principa l . The
controls include ln(age), number of previous loan cycles , and indicators of high school completion and a
bus iness income shock within the l as t s ix months prior to the experiment.
Hypothesis # 1 (Bank Error): Returning to the bank to give back the excess cash is negatively correlated with
default. Results of Panel B analysis find support for this hypothesis; Clients who returned to the bank were 15.1%
less l ikely to default (column 4) and the amount of the default, as percentage of principal, was 15% lower on
average (column 7).

19
Table 4: Text‐Back Experiment Outcomes (Means and Standard Errors)
Mean (Standard Error) Mean (Standard Error)
Default
Fraction
Defaulted Default
Fraction
Defaulted
0.28 0.09 0.73 0.17
(0.02) (0.01) (0.02) (0.01)
(1) Group 1: No choice, Successful 0.22 0.07 0.70 0.15
(0.05) (0.03) (0.06) (0.02)
(2) 0.30 0.10 0.74 0.18
(0.03) (0.02) (0.02) (0.01)
Treatment Group B
(3) 0.20 0.05 0.69 0.17
(0.04) (0.01) (0.04) (0.02)
0.26 0.10 0.69 0.18
(0.03) (0.02) (0.03) (0.02)
(4) 0.18 0.07 0.75 0.16
(0.06) (0.02) (0.07) (0.03)
(5) 0.28 0.09 0.67 0.19
(0.03) (0.01) (0.04) (0.02)
Hypothesis # 2 (Bad Implementers)
‐0.07 ‐0.04 ‐0.03 ‐0.03and 1.18 0.83 0.58 1.16
‐0.10 ‐0.03 0.08 ‐0.021.33 0.77 0.99 0.58
‐0.09+
‐0.04+
‐0.04 ‐0.011.88 1.88 0.94 0.35
Hypothesis #4 (Sorting of Self‐Aware):
Group B: 79.5% Group A: 82.8%
Hypothesis #5 (Bad Impl Effect Strongest with Sorting):
0.03 0.01 0.04 0.011.19 0.95 1.51 0.37
Hypotheses presented us ing di fference of mean and |t‐statistic| . + s igni ficant at 10%; * s igni ficant at
5%; ** s igni fi cant at 1%.
|(4) ≠ (5)| > |(1) ≠ (2)|
Group 3: Choose Now
Choose Text‐Back, All
Group 4: Choose Text‐
Back, Successful
Group 5: Choose Text‐
Back, Unsuccessful
(3) ≠ Pool of (1) and (2)
Success rates of Group B ≠ Group A
Hypothesis #3 (Self‐Aware Test) :
(4) ≠ (5)
Notes : Means are based on 725 observations . Default i s defined as having an unpaid balance on
loan at the end of the contracted date. Fraction defaul ted i s the ratio of the unpaid balance to the
(1) ≠ (2)
First Cycle First Year
Treatment Group A
No Choice, All
Group 2: No choice,
Unsuccessful

20
Table 5: General Social Survey and Default
(1) (2) (3) (4)
GSS Index ‐0.021 0.023
(0.016) (0.017)
GSS #1: People can be trusted ‐0.025 ‐0.011
(0.024) (0.030)
GSS #2: People try to be fair 0.016 0.046+
(0.021) (0.030)
GSS #3: People are helpful ‐0.013 0.002
(0.024) (0.031)
Controls Yes Yes Yes Yes
Observations 712 712 712 712
+ s igni fi cant at 10%; * s igni ficant at 5%; ** s igni fi cant at 1%
Probit
Notes : Robust standard errors reported in parentheses . The three Genera l Socia l Survey
questions are: #1 "General ly speaking, would you say that most people can be trusted or
that you can't be too careful in deal ing with people?"; #2 "Do you think most people would
try to take advantage of you i f they got a chance, or would they try to be fa i r?" ; #3 "Would
you say that most of the time people try to be helpful , or that they are mostly jus t looking
out for themselves?" Subjects may ei ther agree, disagree or give a neutra l response. The
responses were standardized with mean zero and variance 1. The GSS index was
ca lculated as the sum of the three responses (+1) Agree, (‐1) Disagree and (0) Neither and
standardized with mean zero and variance 1. The controls include ln(age), number of
previous loan cycles , and indicators of high school completion and bus iness income shock
within the las t s ix months prior to the experiment.
Default
First YearFirst Cycle
Default

21
Table 6: Ten Item Personality Index (TIPI)
First Cycle First Year
Default Default Later Never Choice Success
(1) (2) (3) (4) (5) (6)
Extroversion ‐0.002 0.012 0.004 0.008 0.014 ‐0.002
(0.017) (0.018) (0.097) (0.075) (0.027) (0.018)
Agreeableness ‐0.008 ‐0.016 ‐0.025 ‐0.135+ ‐0.005 0.012
(0.020) (0.020) (0.127) (0.082) (0.033) (0.024)
Conscientiousness ‐0.027 0.018 ‐0.096 0.014 ‐0.032 ‐0.01
(0.020) (0.020) (0.117) (0.084) (0.033) (0.024)
Emotional Stability 0.011 0.021 ‐0.052 0.041 0.060* 0.017
(0.020) (0.020) (0.121) (0.081) (0.030) (0.022)
Openness 0.019 0.033+ 0.026 ‐0.152* 0.024 0.037+
(0.018) (0.018) (0.111) (0.075) (0.027) (0.021)
Controls Yes Yes Yes Yes Yes Yes
Observations 657 657 657 657 308 308
+ significant at 10%; * significant at 5%; ** significant at 1%Notes: Robust standard errors reported in parentheses . Columns (3) and (4) are the resul ts of a multinomia l
probi t on the individual 's action in the bank error experiment with a baseoutcome of returning the excess cash
immediately after the experiment. Columns (5) examines the l ikel ihood of choos ing the text‐back option when
prompted with a choice to complete the survey immediately or text‐back a response. Column (6) only examines
the l ikel ihood of successful ly texting back given that the individual made the choice to text‐back. The TIPI
measure of personal i ty index conta ins two polar questions for each personal i ty category. The corresponding
questions are averaged together to get a measure of each category of the personal i ty index. Each item was
standardized with mean zero and variance 1. The controls include ln(age), number of previous loan cycles , and
indicators of high school completion and bus iness income shock within the las t s ix months prior to the
experiment.
Probit Mprobit Probit
Bank Error Group B

22
Appendix
Figure 1: Map of field experiment areas in Luzon island, Philippines
Notes: There were eight branches used in the experiment: Cabugao, Calamba, Los Banos, Tanay, Santa Maria, Siniloan, Paete and Infanta. The locations of Cabuyao and Siniloan are approximated on this map. Source: maps.google.com.
Santa MariaSiniloan