Embed Size (px)
Citation preview

INTERNATIONAL JOURNAL OF OPTIMIZATION IN CIVIL ENGINEERING
Int. J. Optim. Civil Eng., 2012; 3(2):327-343
PERFORMANCE-BASED DESIGN OPTIMIZATION OF STEEL
MOMENT FRAMES
S. Gholizadeh1,*, †
, R. Kamyab2 and H. Dadashi
1
1Department of Civil Engineering, Urmia University, Urmia, Iran
2The Iranian Academic Center for Education, Culture and Research, Kerman, Iran
ABSTRACT
This study deals with performance-based design optimization (PBDO) of steel moment
frames employing four different metaheuristics consisting of genetic algorithm (GA), ant
colony optimization (ACO), harmony search (HS), and particle swarm optimization (PSO).
In order to evaluate the seismic capacity of the structures, nonlinear pushover analysis is
conducted (PBDO). This method is an iterative process needed to meet code requirements.
In the PBDO procedure, the metaheuristics minimize the structural weight subjected to
performance constraints on inter-story drift ratios at various performance levels. Two
numerical examples are presented demonstrating the superiority of the PSO to the GA, ACO
and HS metaheuristic algorithms.
Received: 15 February 2013; Accepted: 5 May 2013
KEY WORDS: structural optimization; metaheuristic; performance-based design; nonlinear
pushover analysis; steel structure;
1. INTRODUCTION
In the seismic design process of a structural system the number of parameters which affect
the structural performance and consequently the design is usually large. In this case,
recognizing that the current design is the best solution or still there is room for finding cost-
efficient solutions satisfying design code requirements is a difficult task. In the face of
increase in price of materials, finding cost-efficient structural designs, with improved
performance, is one of the major concerns in the field of structural engineering. In order to
*Corresponding author: S. Gholizadeh, Department of Civil Engineering, Urmia University, Urmia, Iran
†E-mail address: [email protected]
Dow
nloa
ded
from
ijoc
e.iu
st.a
c.ir
at 1
3:36
IRD
T o
n T
hurs
day
June
21s
t 201
8

S. Gholizadeh, R. Kamyab and H. Dadashi
328
achieve this purpose, structural optimization methodologies have been developed during the
last decades. The performance-based design (PBD) of steel structures in the framework of
structural optimization is a topic of growing interest [1-6]. In the PBD approach, nonlinear
analysis procedures are efficiently employed to evaluate the nonlinear seismic responses of
structures. Pushover analysis is a simplified, static nonlinear procedure in which a
predefined pattern of earthquake loads is applied incrementally to framework structures
until a plastic collapse mechanism is reached. This analysis method generally adopts a
lumped-plasticity approach that tracks the spread of inelasticity through the formation of
nonlinear plastic hinges at the frame element’s ends during the incremental loading process
[7].
In PBD design codes, such as FEMA-356 [8], performance ratings are divided into three
levels: Immediate Occupancy (IO), Life Safety (LS) and Collapse Prevention (CP) [8]. The
IO level implies very light damage with minor local yielding and negligible residual drifts.
In the Life Safety (LS) level, the structure tolerates sever damage, but it remains safe for the
occupants to evacuate the building. The CP level is associated with extensive inelastic
distortion of structural members and an increase in load or deflection results in collapse of
the structure. The PBD methods tend to consider the nonlinear seismic response of
structures. These methods directly address inelastic deformations to identify the levels of
damage during severe seismic events. A nonlinear analysis tool is required to evaluate
earthquake demands at the various performance levels. Pushover analysis is widely adopted
as the effective tool for such nonlinear analysis because of its simplicity compared with
dynamic nonlinear procedures. The purpose of the nonlinear static pushover analysis is to
assess structural performance in terms of strength and deformation capacity globally as well
as at the element level. The outcome of pushover analysis is the inelastic capacity curve of
the structure.
In order to replace the traditional PBD process with an automatic advanced procedure for
seismic design of structures, optimization algorithms can be effectively used. In this case,
pushover analysis can be incorporated in a structural optimization strategy to evaluate the
structural performance at the various performance levels. In the last years, many researches
have been done in the field of performance-based design optimization (PBDO) of structures.
However, metaheuristics have been employed in a few numbers of these researches. In this
work, the well-known genetic algorithm (GA) [9], ant colony optimization (ACO) [10],
harmony search (HS) [11] and particle swarm optimization (PSO) [12] metaheuristics are
employed to achieve PBDO of steel moment-resisting frames.
Two six and twelve story planar steel frame structures are optimized for various
performance levels using GA, ACO, HS and PSO metaheuristics and the results are
compared. The results indicate that PSO converges to better solutions compared with the
other algorithms.
2. PERFORMANCE-BASED DESIGN OPTIMIZATION PROCESS
In PBD frameworks, a performance objective is defined as a given level of performance for
a specific hazard level. To define a performance objective, at first the level of structural
Dow
nloa
ded
from
ijoc
e.iu
st.a
c.ir
at 1
3:36
IRD
T o
n T
hurs
day
June
21s
t 201
8

PERFORMANCE-BASED DESIGN OPTIMIZATION OF STEEL MOMENT...
329
performance should be selected and then the corresponding seismic hazard level should be
determined. In the present work, immediate occupancy (IO), life safety (LS) and collapse
prevention (CP) performance levels are considered according to FEMA-356. Each objective
corresponds to a given probability of being exceed during 50 years. A usual assumption [2]
is that the IO, LS and CP performance levels correspond respectively to a 20%, 10% and 2%
probability of exceedance in 50 year period. In this study, the mentioned hazard levels are
considered.
In this work, the nonlinear static pushover analysis is utilized to quantify seismic induced
nonlinear response of structures. Among various methods of static pushover analyses, the
displacement coefficient method [8] procedure is adopted to evaluate the seismic demands
on building frameworks under equivalent static earthquake loading. In this method the
structure is pushed with a specific distribution of the lateral loads until the target
displacement is reached. The target displacement can be obtained from the FEMA-356 as
follows:
gT
SCCCC eat 2
2
32104
(1)
where C0 relates the spectral displacement to the likely building roof displacement; C1
relates the expected maximum inelastic displacements to the displacements calculated for
linear elastic response; C2 represents the effect of the hysteresis shape on the maximum
displacement response and C3 accounts for P-D effects. Te is the effective fundamental
period of the building in the direction under consideration; Sa is the response spectrum
acceleration corresponding to the Te.
In this work, the OPENSEES [13] platform is utilized to conduct the pushover analyses.
In a sizing structural optimization problem, the aim is usually to minimize the weight of
the structure under some behavioural constraints. For a steel frame structure consisting of ne
members that are collected in ng design groups, if the variables associated with each design
group are selected from a given profile list of steel sections, a discrete optimization problem
can be formulated as follows:
Minimize:
ng
i
nm
j
jii LAXw1 1
)( (2)
Subject to: 0)( Xgk, nck ,,2,1 (3)
T
21 }...{ ngi x...xxxX (4)
where xi is an integer value expressing the sequence numbers of steel sections assigned to
ith group; w represents the weight of the frame, ρi and Ai are weight of unit volume and
cross-sectional area of the ith group section, respectively; nm is the number of elements
collected in the ith group; Lj is the length of the jth element in the ith group; gk(X) is the kth
behavioral constraint. In the present study, design variables are selected from W-shaped
sections found in the AISC design manual [14].
Dow
nloa
ded
from
ijoc
e.iu
st.a
c.ir
at 1
3:36
IRD
T o
n T
hurs
day
June
21s
t 201
8
S. Gholizadeh, R. Kamyab and H. Dadashi
330
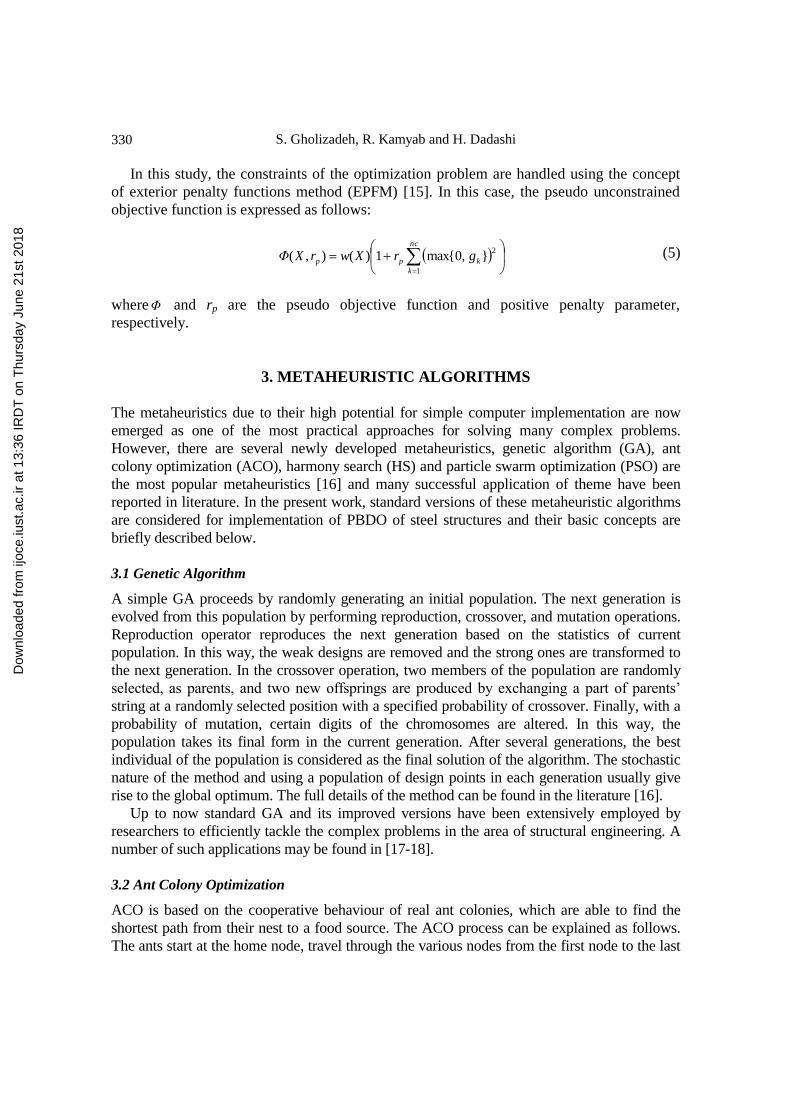
In this study, the constraints of the optimization problem are handled using the concept
of exterior penalty functions method (EPFM) [15]. In this case, the pseudo unconstrained
objective function is expressed as follows:
nc
k
kpp grXwrXΦ1
2}max{0,1)(),( (5)
whereΦ and rp are the pseudo objective function and positive penalty parameter,
respectively.
3. METAHEURISTIC ALGORITHMS
The metaheuristics due to their high potential for simple computer implementation are now
emerged as one of the most practical approaches for solving many complex problems.
However, there are several newly developed metaheuristics, genetic algorithm (GA), ant
colony optimization (ACO), harmony search (HS) and particle swarm optimization (PSO) are
the most popular metaheuristics [16] and many successful application of theme have been
reported in literature. In the present work, standard versions of these metaheuristic algorithms
are considered for implementation of PBDO of steel structures and their basic concepts are
briefly described below.
3.1 Genetic Algorithm
A simple GA proceeds by randomly generating an initial population. The next generation is
evolved from this population by performing reproduction, crossover, and mutation operations.
Reproduction operator reproduces the next generation based on the statistics of current
population. In this way, the weak designs are removed and the strong ones are transformed to
the next generation. In the crossover operation, two members of the population are randomly
selected, as parents, and two new offsprings are produced by exchanging a part of parents’
string at a randomly selected position with a specified probability of crossover. Finally, with a
probability of mutation, certain digits of the chromosomes are altered. In this way, the
population takes its final form in the current generation. After several generations, the best
individual of the population is considered as the final solution of the algorithm. The stochastic
nature of the method and using a population of design points in each generation usually give
rise to the global optimum. The full details of the method can be found in the literature [16].
Up to now standard GA and its improved versions have been extensively employed by
researchers to efficiently tackle the complex problems in the area of structural engineering. A
number of such applications may be found in [17-18].
3.2 Ant Colony Optimization
ACO is based on the cooperative behaviour of real ant colonies, which are able to find the
shortest path from their nest to a food source. The ACO process can be explained as follows.
The ants start at the home node, travel through the various nodes from the first node to the last
Dow
nloa
ded
from
ijoc
e.iu
st.a
c.ir
at 1
3:36
IRD
T o
n T
hurs
day
June
21s
t 201
8

PERFORMANCE-BASED DESIGN OPTIMIZATION OF STEEL MOMENT...
331
node, and end at the destination node in each iteration. Each ant can select only one node in
each layer in accordance with the state transition rule [19]. An ant k, when located at node i,
uses the pheromone trail τij to compute the probability of choosing j as the next node:
)(
)(
)(
0 k
i
k
i
Nj
α
ij
α
ij
k
ij
Njif
Njifτ
τ
Pki
(6)
where α denotes the degree of importance of the pheromones and )(kiN indicates the set of
neighbourhood nodes of ant k when located at node i.
The neighbourhood of node i contain all the nodes directly connected to node i except the
predecessor node. This will prevent the ant from returning to the same node visited
immediately before node i. An ant travels from node to node until it reaches the destination
node. Before returning to the home node, the kth ant deposits an amount of pheromone on arcs
it has visited. After all the ants return to the nest, the pheromone information is updated in
order to increase the pheromone value associated with good or promising paths. The updating
is achieved as follows:
)(1 kijijij ττρτ (7)
k
kij
L
Qτ )( (8)
where ρ(0, 1] is the pheromone decay factor; )(kijτ is the amount of pheromone deposited on
arc ij by the best ant k. also, Q is a constant and Lk is the length of the path traveled by the kth
ant.
When more paths are available from the nest to a food source, a colony of ants will be able
to exploit the pheromone trails left by the individual ants to discover the shortest path from the
nest to the food source and back [19]. In fact, ACO simulates the optimization of ant foraging
behaviour.
During the last years some applications of ACO in the field of structural engineering have
been reported in [20-22].
3.3 Harmony Search Algorithm
The harmony search (HS) algorithm is based on the musical performance process that achieves
when a musician searches for a better state of harmony. In the process of musical production a
musician selects and brings together number of different notes from the whole notes and then
plays these with a musical instrument to find out whether it gives a pleasing harmony. The
musician then tunes some of these notes to achieve a better harmony [16].
For implementation of HS, at first a harmony memory (HM), the harmony considering rate
(HMCR), the pitch adjusting rate (PAR) and the maximum number of searches should be
specified. To improvise new HM, a new harmony vector is generated. Thus the new value of
Dow
nloa
ded
from
ijoc
e.iu
st.a
c.ir
at 1
3:36
IRD
T o
n T
hurs
day
June
21s
t 201
8

S. Gholizadeh, R. Kamyab and H. Dadashi
332
the ith design variable can be chosen from the possible range of ith column of the HM with the
probability of HMCR or from the entire possible range of values with the probability of 1-
HMCR as follows:
ii
HMS
iii
j
i
iΔx
x,...,x,xxx
T21
new }{
)HMCR1( of yprobabilit thewith
HMCR of yprobabilit thewith
(9)
where iΔ is the set of the potential range of values for ith design variable.
Pitch adjusting is performed only after a value has been chosen from the HM as follows:
? ofadjusment pitch newix
No
Yes
)PAR1( of yprobabilit thewith
RAP of yprobabilit thewith
(10)
If the pitch-adjustment decision for newix is "Yes", then a neighbouring value with the
probability of PAR%×HMCR is taken for it as follows:
new
new 1)1,(
i
inew
ix
bwuxx
HMCR)(1PAR ofy probabilit with the
HMCRPAR ofy probabilit with the
(11)
where u(-1,+1) is a uniform distribution between -1 and +1; also bw is an arbitrary distance
bandwidth for the continuous design variables.
If newix is better than the worst vector in the HM, the new harmony is substituted by the
existing worst harmony.
Computational merits of HS for tackling complex structural optimization problems have
been demonstrated in many researches such as those of reported in [23-25].
3.4 Particle Swarm Optimization
The particle swarm optimization (PSO) is based on the social behavior of animals such as
fish schooling, insect swarming and bird flocking. The PSO has been proposed to simulate
the graceful motion of bird swarms as a part of a socio-cognitive study.
The PSO involves a number of particles, which are randomly initialized in the search
space. These particles are referred to as swarm. Each particle of the swarm represents a
potential solution of the optimization problem. The particles fly through the search space
and their positions are updated based on the best positions of individual particles and the
best of the swarm in each iteration. The objective function is evaluated for each particle at
each grid point and the fitness values of particles are obtained to determine the best position
in the search space. In iteration k, the swarm is updated using the following equations:
)()( 2211
1 k
i
k
g
k
i
k
i
k
i
kk
i XPrcXPrcVωV (12)
Dow
nloa
ded
from
ijoc
e.iu
st.a
c.ir
at 1
3:36
IRD
T o
n T
hurs
day
June
21s
t 201
8

PERFORMANCE-BASED DESIGN OPTIMIZATION OF STEEL MOMENT...
333
11 ki
ki
ki VXX (13)
whereiX and iV represent the current position and the velocity of the ith particle,
respectively;iP is the best previous position of the ith particle (pbest) and
gP is the best
global position among all the particles in the swarm (gbest); 1r and
2r are two uniform
random sequences generated from interval [0, 1]; c1 and c2 are the cognitive and social
scaling parameters, respectively. The inertia weight used to discount the previous velocity of
particle preserved is expressed byω .
Due to the importance of ω in achieving efficient search behavior the updating criterion
can be taken as follows:
k.k
ωωωω
max
minmaxmax
(14)
where maxω and
inmω are the maximum and minimum values of ω , respectively. Also, maxk ,
and k are the numbers of maximum iterations and present iteration, respectively.
Standard PSO is more efficient, requiring fewer number of function evaluations
compared with other robust design optimization methods [26].
In the field of structural engineering many successful application of PSO have been
reported in literature. A number of such applications can be found in [27-30].
4. ANALYSIS AND DESIGN OF STEEL FRAMES
In this study, two types of constraints are checked during the optimization process. The first
type includes the checks of each structural element for gravity loads. In this case, the
following load combination is considered:
LDG Q.Q.Q 61211 Type (15)
where QD and QL are dead and live loads, respectively.
Each structural element should satisfy the following constraints for the non-seismic load
combinations according to the LRFD-AISC [14] code.
01-)(2
0.2;for nyb
uy
nxb
ux
nc
u
nc
u
M
M
M
M
P
P
P
P
(16)
01-)(9
8 0.2;for
nyb
uy
nxb
ux
nc
u
nc
u
M
M
M
M
P
P
P
P
(17)
where Pu is the required strength (tension or compression); Pn is the nominal axial strength
Dow
nloa
ded
from
ijoc
e.iu
st.a
c.ir
at 1
3:36
IRD
T o
n T
hurs
day
June
21s
t 201
8
S. Gholizadeh, R. Kamyab and H. Dadashi
334
(tension or compression); c is the resistance factor; Mux and Muy are the required flexural
strengths in the x and y directions; respectively; Mnx and Mny are the nominal flexural
strengths in the x and y directions; and b is the flexural resistance reduction factor
( 90.b ).
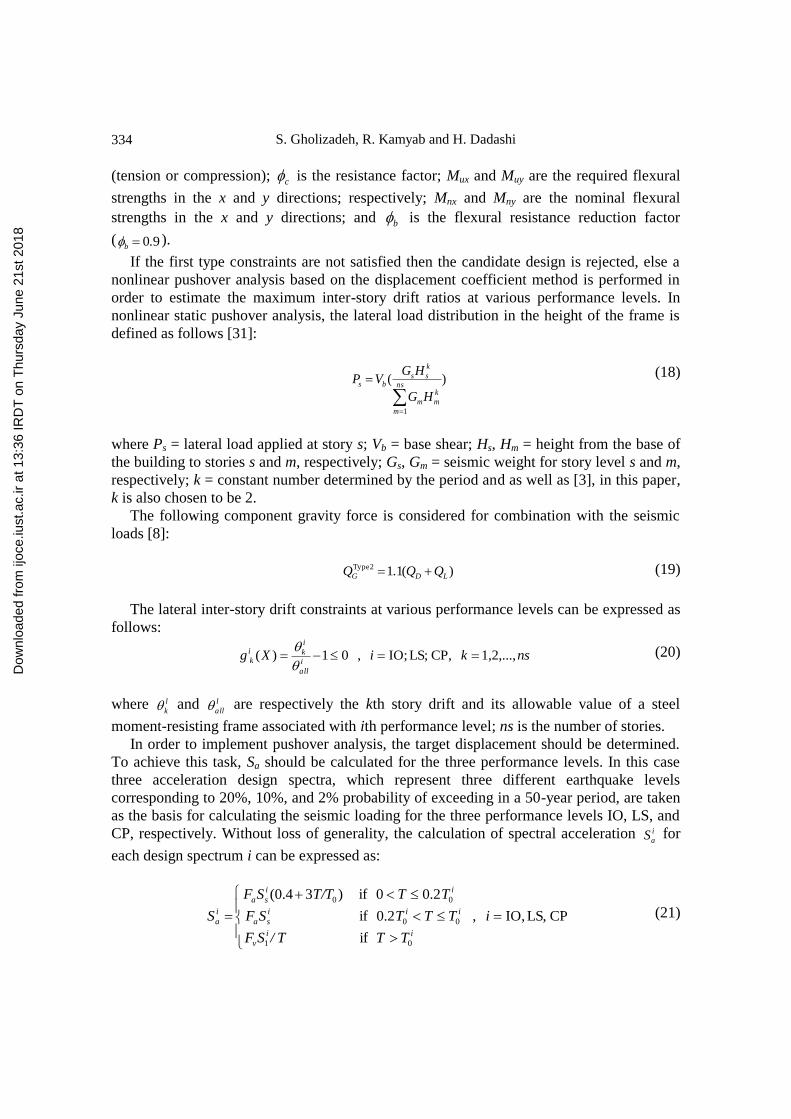
If the first type constraints are not satisfied then the candidate design is rejected, else a
nonlinear pushover analysis based on the displacement coefficient method is performed in
order to estimate the maximum inter-story drift ratios at various performance levels. In
nonlinear static pushover analysis, the lateral load distribution in the height of the frame is
defined as follows [31]:
)(
1
ns
m
k
mm
k
ssbs
HG
HGVP
(18)
where Ps = lateral load applied at story s; Vb = base shear; Hs, Hm = height from the base of
the building to stories s and m, respectively; Gs, Gm = seismic weight for story level s and m,
respectively; k = constant number determined by the period and as well as [3], in this paper,
k is also chosen to be 2.
The following component gravity force is considered for combination with the seismic
loads [8]:
)(112 Type
LDG QQ.Q (19)
The lateral inter-story drift constraints at various performance levels can be expressed as
follows:
nskiXgi
all
i
ki
k 1,2,..., CP, LS; IO; , 01)(
(20)
where l
k and l
all are respectively the kth story drift and its allowable value of a steel
moment-resisting frame associated with ith performance level; ns is the number of stories.
In order to implement pushover analysis, the target displacement should be determined.
To achieve this task, Sa should be calculated for the three performance levels. In this case
three acceleration design spectra, which represent three different earthquake levels
corresponding to 20%, 10%, and 2% probability of exceeding in a 50-year period, are taken
as the basis for calculating the seismic loading for the three performance levels IO, LS, and
CP, respectively. Without loss of generality, the calculation of spectral acceleration i
aS for
each design spectrum i can be expressed as:
CP LS, IO, ,
if
0.2 if
0.20 if
)3(0.4
0
00
0
1
0
i
TT
TTT
TT
T/SF
SF
T/TSF
Si
ii
i
i
v
i
sa
i
sa
i
a (21)
Dow
nloa
ded
from
ijoc
e.iu
st.a
c.ir
at 1
3:36
IRD
T o
n T
hurs
day
June
21s
t 201
8

PERFORMANCE-BASED DESIGN OPTIMIZATION OF STEEL MOMENT...
335
i
sa
i
vi
SF
SFT 1
0 (22)
where T is the elastic fundamental period of the structure, which is computed here from
structural modal analysis; i
sS and iS1 are the short-period and the first second-period
response acceleration parameters, respectively. Fa and Fv are the site coefficient determined
respectively from FEMA-273 [31], based on the site class and the values of the response
acceleration parameters i
sS and iS1, according to Table 1 [3].
Table 1. Performance level site parameters for site class of D
Performance Level Hazard Level Ss (g) S1 (g) Fa Fv
IO 20% / 50-years 0.658 0.198 1.27 2.00
LS 10% / 50-years 0.794 0.237 1.18 1.92
CP 2% / 50-years 1.150 0.346 1.04 1.70
5. NUMERICAL RESULTS
Two planar steel frames are optimized in this section. The frames are assumed to have rigid
connections and fixed supports. The sections of all members are assumed to be selected
from the 267 W-shaped sections from the AISC database. The value of the modulus of
elasticity is 210 GPa and of the yield stress is 235 MPa. The constitutive law is bilinear with
pure strain hardening slope equal to 3% of the elastic modulus. The dead load of QD = 2500
kg/m and live load of QL = 1000 kg/m are applied to the all beams.
For all the presented examples, the parameters of the metaheuristics are taken as follows:
In the GA, crossover rate=0.9, mutation rate=0.001. In the ACO, α=1.0, ρ=0.2, Q=1.0. In the
HS, HMCR=0.9, PAR=0.25. And in the PSO, c1=1.0, c2=3.0, ωmin=0.4, ωmax=0.9.
In this paper, all of the required computer programs are coded in MATLAB [32]. Also for
computer implementation a personal Pentium IV 3.0 GHz has been used.
The allowable values of inter-story drifts at the IO, LS and CP performance levels are
taken as 0.7%, 2.5% and 5.0%, respectively.
Finally, in the numerical examples of this study, plastic hinge distributions in the
optimum designs are presented at the IO, LS and CP performance levels. To achieve this,
the yield rotation of beams and columns are calculated as follows according to FEMA-356:
Beams: b
bye
yEI
lZF
6 (23)
Columns: )-(16 yec
cy
yP
P
EI
lZF (24)
Dow
nloa
ded
from
ijoc
e.iu
st.a
c.ir
at 1
3:36
IRD
T o
n T
hurs
day
June
21s
t 201
8
S. Gholizadeh, R. Kamyab and H. Dadashi
336
where E is modulus of elasticity; Z is plastic section modulus; Fye is expected yield stress;
Ib is beam moment of inertia; Ic is column moment of inertia; lb is beam length; lc is column
length; P is axial force in the member at the target displacement and Pye is expected axial
yield force of the member..
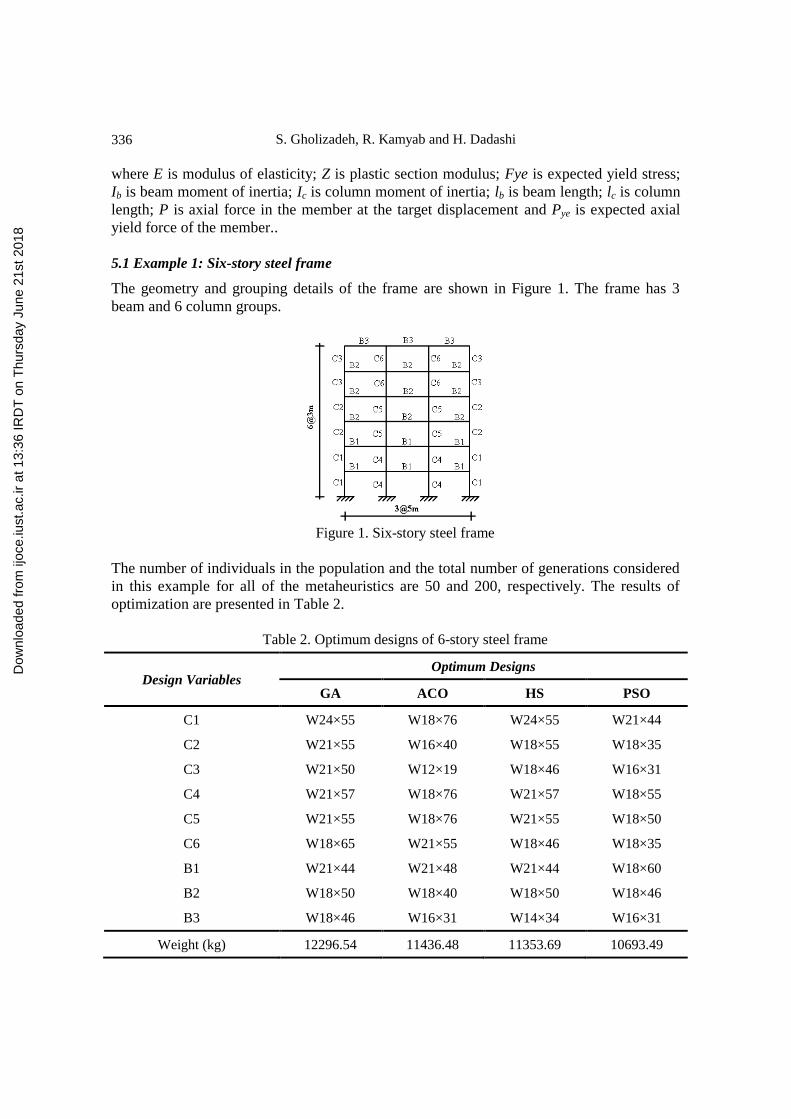
5.1 Example 1: Six-story steel frame
The geometry and grouping details of the frame are shown in Figure 1. The frame has 3
beam and 6 column groups.
Figure 1. Six-story steel frame
The number of individuals in the population and the total number of generations considered
in this example for all of the metaheuristics are 50 and 200, respectively. The results of
optimization are presented in Table 2.
Table 2. Optimum designs of 6-story steel frame
Design Variables Optimum Designs
GA ACO HS PSO
C1 W24×55 W18×76 W24×55 W21×44
C2 W21×55 W16×40 W18×55 W18×35
C3 W21×50 W12×19 W18×46 W16×31
C4 W21×57 W18×76 W21×57 W18×55
C5 W21×55 W18×76 W21×55 W18×50
C6 W18×65 W21×55 W18×46 W18×35
B1 W21×44 W21×48 W21×44 W18×60
B2 W18×50 W18×40 W18×50 W18×46
B3 W18×46 W16×31 W14×34 W16×31
Weight (kg) 12296.54 11436.48 11353.69 10693.49
Dow
nloa
ded
from
ijoc
e.iu
st.a
c.ir
at 1
3:36
IRD
T o
n T
hurs
day
June
21s
t 201
8

PERFORMANCE-BASED DESIGN OPTIMIZATION OF STEEL MOMENT...
337
The results indicate that, among the employed metaheuristic algorithms, the PSO
converges to the best solution. The structure found by HS is better than those of the ACO
and GA while the optimal weight of the solution found by ACO is better in comparison with
that of the GA. The convergence histories of GA, ACO, HS and PSO based optimization
processes are given in Figure 2. It can be easily observed that PSO possesses better
convergence behavior in comparison with other metaheuristics.
10000
11000
12000
13000
14000
15000
16000
17000
18000
19000
20000
0 20 40 60 80 100 120 140 160 180 200
Iteration
We
igh
t (k
g)
GA
ACO
HS
PSO
Figure 2. Convergence histories of GA, ACO, HS and PSO in PBDO of six-story frame
The drift profiles of the solution found by PSO, as the best solution, are shown at the IO,
LS and CP performance levels in Figure 3. In this figure the vertical dashed lines denote the
drift limit. The results show that the constraints associate with IO level dominates the
designs.
0.4961
0.4698
0.6296
0.6988
0.6346
0.6632
0
1
2
3
4
5
6
0 0.1 0.2 0.3 0.4 0.5 0.6 0.7 0.8
Inter-storey drift (%)
Sto
rey
1.2078
1.1736
1.3189
1.1898
0.8397
1.0082
0
1
2
3
4
5
6
0 0.5 1 1.5 2 2.5 3
Inter-storey drift (%)
1.5831
1.2467
1.7577
1.8733
1.5938
1.5834
0
1
2
3
4
5
6
0 1 2 3 4 5
Inter-storey drift (%) (a) (b) (c)
Figure 3. Story drifts profile of six-story frame at (a) IO, (b) LS and (c) CP levels
Plastic hinge distributions of the solution found by PSO under the pushover loading at
the IO, LS and CP performance levels are shown in Figure 4.
Dow
nloa
ded
from
ijoc
e.iu
st.a
c.ir
at 1
3:36
IRD
T o
n T
hurs
day
June
21s
t 201
8

S. Gholizadeh, R. Kamyab and H. Dadashi
338
(a) (b) (c)
Figure 4. Plastic hinge distribution for six-story frame at (a) IO, (b) LS and (c) CP levels
No plastic hinge rotation is found to exceed the specified threshold of plastic rotation.
5.2 Example 2: Twelve-story steel frame
Figure 5 represents the geometry and grouping details of the frame. The frame has 6 beam
and 18 column groups.
Figure 5. Twelve-story steel frame
In this example 75 particles are considered and the total number of generations is 300.
The results of structural optimization are presented in Table 3.
Dow
nloa
ded
from
ijoc
e.iu
st.a
c.ir
at 1
3:36
IRD
T o
n T
hurs
day
June
21s
t 201
8

PERFORMANCE-BASED DESIGN OPTIMIZATION OF STEEL MOMENT...
339
Table 3. Optimum designs of twelve-story steel frame
Design Variables Optimum Designs
GA ACO HS PSO
C1 W24×68 W24×76 W24×76 W24×62
C2 W24×68 W24×76 W24×68 W21×50
C3 W24×68 W24×68 W16×89 W18×55
C4 W16×89 W16×89 W16×89 W21×44
C5 W16×50 W16×45 W16×45 W18×35
C6 W16×45 W14×26 W14×38 W16×26
C7 W24×94 W21×111 W21×111 W24×76
C8 W21×111 W21×101 W21×111 W24×68
C9 W21×68 W18×86 W16×89 W24×55
C10 W21×50 W21×50 W21×50 W21×55
C11 W18×50 W18×35 W18×35 W18×55
C12 W16×50 W14×38 W14×38 W16×26
C13 W24×94 W24×94 W24×94 W24×76
C14 W21×55 W21×55 W21×55 W24×68
C15 W21×55 W18×55 W18×55 W21×62
C16 W21×50 W18×46 W18×46 W21×55
C17 W18×46 W12×45 W12×45 W18×40
C18 W16×50 W10×30 W10×30 W14×26
B1 W21×55 W24×68 W21×48 W21×48
B2 W18×60 W21×55 W21×48 W21×48
B3 W21×50 W21×50 W21×44 W21×48
B4 W18×50 W21×48 W21×44 W18×40
B5 W16×50 W18×46 W18×46 W18×40
B6 W16×45 W14×38 W14×38 W14×26
Weight (kg) 36186.87 35491.61 33951.84 28747.07
The numerical results given in Table 3 demonstrate that, among the employed
metaheuristic algorithms, PSO has the best computational performance. HS is better than
the ACO and GA while the optimal design found by ACO is better than that of the GA. The
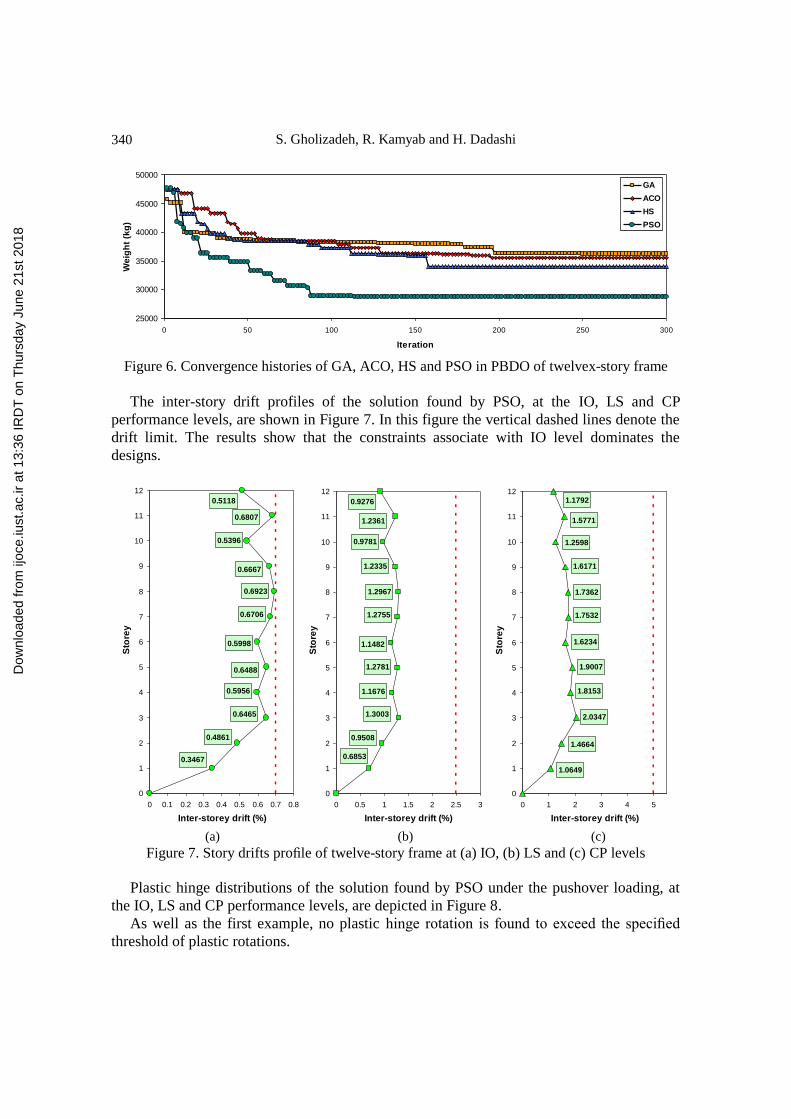
convergence histories of GA, ACO, HS and PSO are given in Figure 6. It is obvious that the
best convergence behavior associates with PSO.
Dow
nloa
ded
from
ijoc
e.iu
st.a
c.ir
at 1
3:36
IRD
T o
n T
hurs
day
June
21s
t 201
8
S. Gholizadeh, R. Kamyab and H. Dadashi
340
25000
30000
35000
40000
45000
50000
0 50 100 150 200 250 300
Iteration
We
igh
t (k
g)
GA
ACO
HS
PSO
Figure 6. Convergence histories of GA, ACO, HS and PSO in PBDO of twelvex-story frame
The inter-story drift profiles of the solution found by PSO, at the IO, LS and CP
performance levels, are shown in Figure 7. In this figure the vertical dashed lines denote the
drift limit. The results show that the constraints associate with IO level dominates the
designs.
0.6706
0.6923
0.6667
0.5396
0.6807
0.5118
0.6488
0.5956
0.6465
0.4861
0.5998
0.3467
0
1
2
3
4
5
6
7
8
9
10
11
12
0 0.1 0.2 0.3 0.4 0.5 0.6 0.7 0.8
Inter-storey drift (%)
Sto
rey
0.6853
1.1482
0.9508
1.3003
1.1676
1.2781
0.9276
1.2361
0.9781
1.2335
1.2967
1.2755
0
1
2
3
4
5
6
7
8
9
10
11
12
0 0.5 1 1.5 2 2.5 3
Inter-storey drift (%)
Sto
rey
1.0649
1.6234
1.4664
2.0347
1.8153
1.9007
1.1792
1.5771
1.2598
1.6171
1.7362
1.7532
0
1
2
3
4
5
6
7
8
9
10
11
12
0 1 2 3 4 5
Inter-storey drift (%)
Sto
rey
(a) (b) (c)
Figure 7. Story drifts profile of twelve-story frame at (a) IO, (b) LS and (c) CP levels
Plastic hinge distributions of the solution found by PSO under the pushover loading, at
the IO, LS and CP performance levels, are depicted in Figure 8.
As well as the first example, no plastic hinge rotation is found to exceed the specified
threshold of plastic rotations.
Dow
nloa
ded
from
ijoc
e.iu
st.a
c.ir
at 1
3:36
IRD
T o
n T
hurs
day
June
21s
t 201
8

PERFORMANCE-BASED DESIGN OPTIMIZATION OF STEEL MOMENT...
341
Figure 8. Plastic hinge distribution for 12-story frame at (a) IO, (b) LS and (c) CP levels
6. CONCLUSIONS
The present paper deals with PBDO of steel frames using metaheuristic optimization
algorithms. Two types of design constraints are checked during the optimization process. In
the first type, each structural element is checked to satisfy the AISD-LRFD constraints for
the non-seismic load combinations. While the second type includes the check of inter-story
drifts at IO, LS and CP performance levels according to the FEMA-356 provided
constraints. Two numerical examples including a three-bay, six-story and a four-bay,
twelve-story steel frames are presented. The optimization task is achieved using GA, ACO,
HS and PSO metaheuristics and the results are compared. The numerical results
demonstrate that in the first example, PSO finds a solution which is 5.81%, 6.49% and
13.04% lighter than those of the HS, ACO and GA, respectively. The results imply that the
solution found by HS is better than those of the ACO and GA and the ACO possesses better
performance in comparison with GA. In the second example, the optimal weight of PSO is
15.33%, 19.01% and 20.56% lighter than those of the HS, ACO and GA, respectively. It is
observed again that the solution of HS is better than those of the ACO and GA. Also, ACO
possesses better performance compared with GA. It can be concluded that the PSO provides
results which are significantly better than those of the other metaheuristics. Also it is evident
that in the large scale problems the improvement in optimal weight is considerable.
Therefore, PSO can be effectively employed to design cost-efficient steel structures with
desirable seismic performance.
Dow
nloa
ded
from
ijoc
e.iu
st.a
c.ir
at 1
3:36
IRD
T o
n T
hurs
day
June
21s
t 201
8
S. Gholizadeh, R. Kamyab and H. Dadashi
342
REFERENCES
1. Kaveh A, Laknejadi K, Alinejad B. Performance-based multi-objective optimization of
large steel structures, Acta Mech, 2012; 232: 355–69.
2. Fragiadakis M, Lagaros ND. An overview to structural seismic design optimisation
frameworks, Comput Struct, 2011; 89: 1155–65.
3. Kaveh A, Farahmand Azar B, Hadidi A, Rezazadeh Sorochi F, Talatahari S.
Performance-based seismic design of steel frames using ant colony optimization, J
Constr Steel Res, 2010; 66: 566–74.
4. Salajegheh E, Mohammadi A, Ghaderi Sohi S. Optimum performance based design of
concentric steel braced frames, the 14th
World Conference on Earthquake Engineering,
Beijing, China, 2008.
5. Pan P, Ohsaki M, Kinoshita T. Constraint approach to performance-based design of
steel moment-resisting Frames, Eng Struct, 2007; 29: 186–94.
6. Fragiadakis M, Lagaros ND, Papadrakakis M. Performance-based multiobjective
optimum design of steel structures considering life-cycle cost, Struct Multidiscip
Optim, 2006; 32: 1–11.
7. Zou XK, Chan CM. Optimal seismic performance-based design of reinforced concrete
buildings using nonlinear pushover analysis, Eng Struct, 2005; 27: 1289–302.
8. FEMA-356, Prestandard and commentary for the seismic rehabilitation of buildings.
Federal Emergency Management Agency, Washington, DC, 2000.
9. Holland JH. Adaptation in Natural and Artificial Systems, Ann Arbor: University of
Michigan Press, 1975.
10. Eberhart RC, Kennedy J. A New Optimizer using particle swarm theory, Proceedings
of the Sixth International Symposium on Micro Machine and Human Science, Nagoya:
IEEE Press, 39–43, 1995.
11. Dorigo M. Optimization, Learning and Natural Algorithms, PhD Thesis, Dipartimento
di Elettronica, Politecnico di Milano, IT, 1992.
12. Geem ZW, Kim JH, Loganathan GV, A new heuristic optimization algorithm:
Harmony Search, Simulations, 2001; 76: 60–8.
13. McKenna F, Fenves GL. The OpenSees Command Language Manual (1.2. edn). PEER,
2001.
14. Manual of steel construction. Load and resistance factor design, Chicago, IL: American
Institute of Steel Construction; 2001.
15. Vanderplaats GN. Numerical Optimization Techniques for Engineering Design: With
Application, McGraw-Hill, NewYork, 1984.
16. Salajegheh E, Gholizadeh S. Structural seismic optimisation using meta-heuristics and
neural networks: a review, Comput Tech Rev, 2012; 5: 109–37.
17. Farhat F, Nakamura S, Takahashi K. Application of genetic algorithm to optimization of
buckling restrained braces for seismic upgrading of existing structures, Comput Struct,
2009; 87: 110–19.
18. Gholizadeh S, Salajegheh E. Optimal design of structures for earthquake loading by self
organizing radial basis function neural networks, Adv Struct Eng, 2010; 13: 339–56.
19. Dorigo M, Caro DG, Gambardella LM. Ant algorithms for discrete optimization,
Dow
nloa
ded
from
ijoc
e.iu
st.a
c.ir
at 1
3:36
IRD
T o
n T
hurs
day
June
21s
t 201
8

PERFORMANCE-BASED DESIGN OPTIMIZATION OF STEEL MOMENT...
343
Artificial Life, 1999; 5: 137–72.
20. Luh GC, Lin CY. Structural topology optimization using ant colony optimization
algorithm, Appl Soft Comput, 2009; 9: 1343–53.
21. Kaveh A, Talatahari S. An improved ant colony optimization for the design of planar steel
frames, Eng Struct, 2010; 32: 864–73.
22. Gholizadeh S, Fattahi F. Serial integration of particle swarm and ant colony algorithms
for structural optimization, Asian J Civil Eng, 2012; 13: 127–46.
23. Kaveh A, Ahangaran M. Discrete cost optimization of composite floor system using
social harmony search model, Appl Soft Comput, 2012; 12: 372–81.
24. Gholizadeh S, Barzegar A. Shape optimization of structures for frequency constraints by
sequential harmony search algorithm, Eng Optim, 2012 (in press).
25. Degertekin SO. Improved harmony search algorithms for sizing optimization of truss
structures, Comput & Struct, 2012; 92-93: 229–41.
26. Hassan R, Cohanim B, de Weck O, Venter G. A comparison of particle swarm
optimization and the genetic algorithm, In: 1st AIAA Multidisciplinary Design
Optimization Specialist Conference. No. AIAA-2005-1897, Austin, 2005.
27. Li LJ, Huang ZB, Liu F. A heuristic particle swarm optimization method for truss
structures with discrete variables, Comput Struct, 2009; 87: 435–43.
28. Gholizadeh S, Salajegheh E. Optimal design of structures for time history loading by
swarm iIntelligence and an advanced metamodel, Comput Meth Appl Mech Eng, 2009;
198: 2936–49.
29. Gomes HM. Truss optimization with dynamic constraints using a particle swarm
algorithm, Expert Syst Appl, 2011; 38: 957–68.
30. Gholizadeh S, Fattahi F. Design optimization of tall steel buildings by a modified particle
swarm algorithm, Struct Design Tall Spec Buil, 2012 (in press).
31. FEMA-273, NEHRP guideline for the seismic rehabilitation of buildings. Federal
Emergency Management Agency, Washington, DC, 1997.
32. The Language of Technical Computing, MATLAB. Math Works Inc, 2009.
Dow
nloa
ded
from
ijoc
e.iu
st.a
c.ir
at 1
3:36
IRD
T o
n T
hurs
day
June
21s
t 201
8