Embed Size (px)
Citation preview

PERAMALAN DATA TIME SERIES
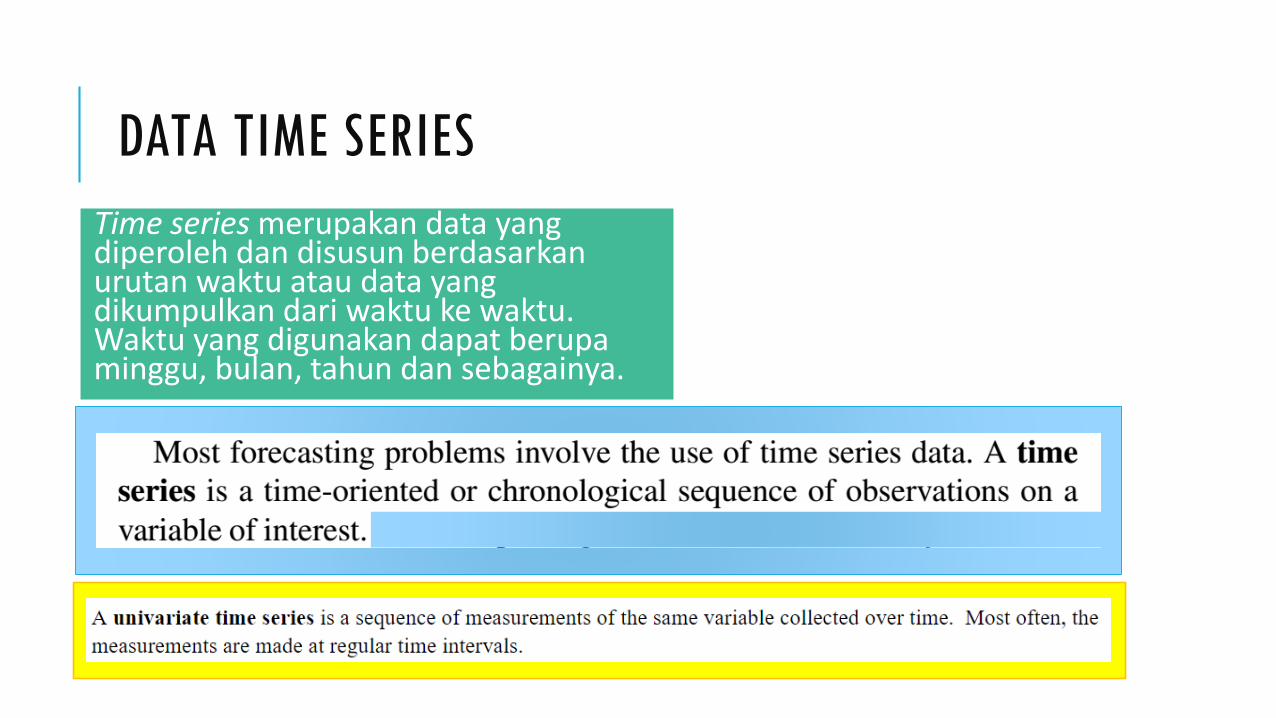
DATA TIME SERIES
Time series merupakan data yang diperoleh dan disusun berdasarkanurutan waktu atau data yang dikumpulkan dari waktu ke waktu. Waktu yang digunakan dapat berupa minggu, bulan, tahun dan sebagainya.
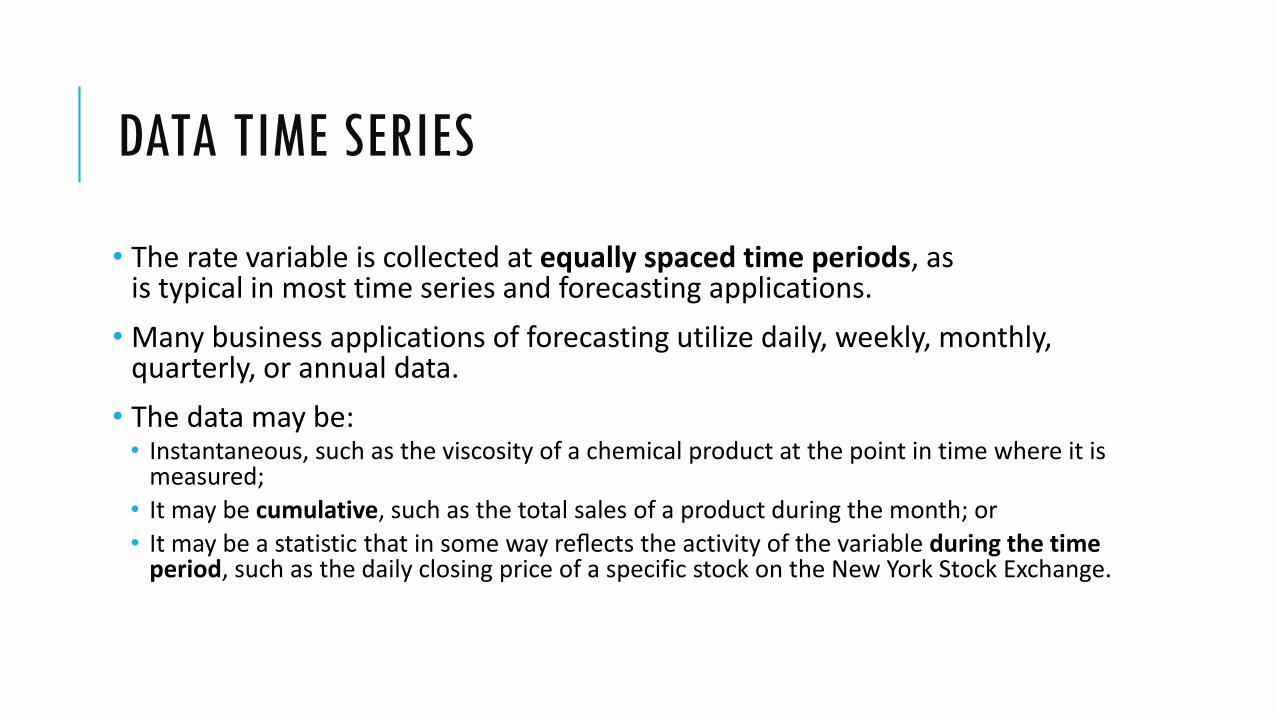
DATA TIME SERIES
• The rate variable is collected at equally spaced time periods, asis typical in most time series and forecasting applications.
• Many business applications of forecasting utilize daily, weekly, monthly, quarterly, or annual data.
• The data may be:• Instantaneous, such as the viscosity of a chemical product at the point in time where it is
measured;
• It may be cumulative, such as the total sales of a product during the month; or
• It may be a statistic that in some way reflects the activity of the variable during the time period, such as the daily closing price of a specific stock on the New York Stock Exchange.

CONTOH 1
Harga saham AAPL: 5 tahun, direkam dalam data per minggu
http://finance.yahoo.com/quote/AAPL?ltr=1
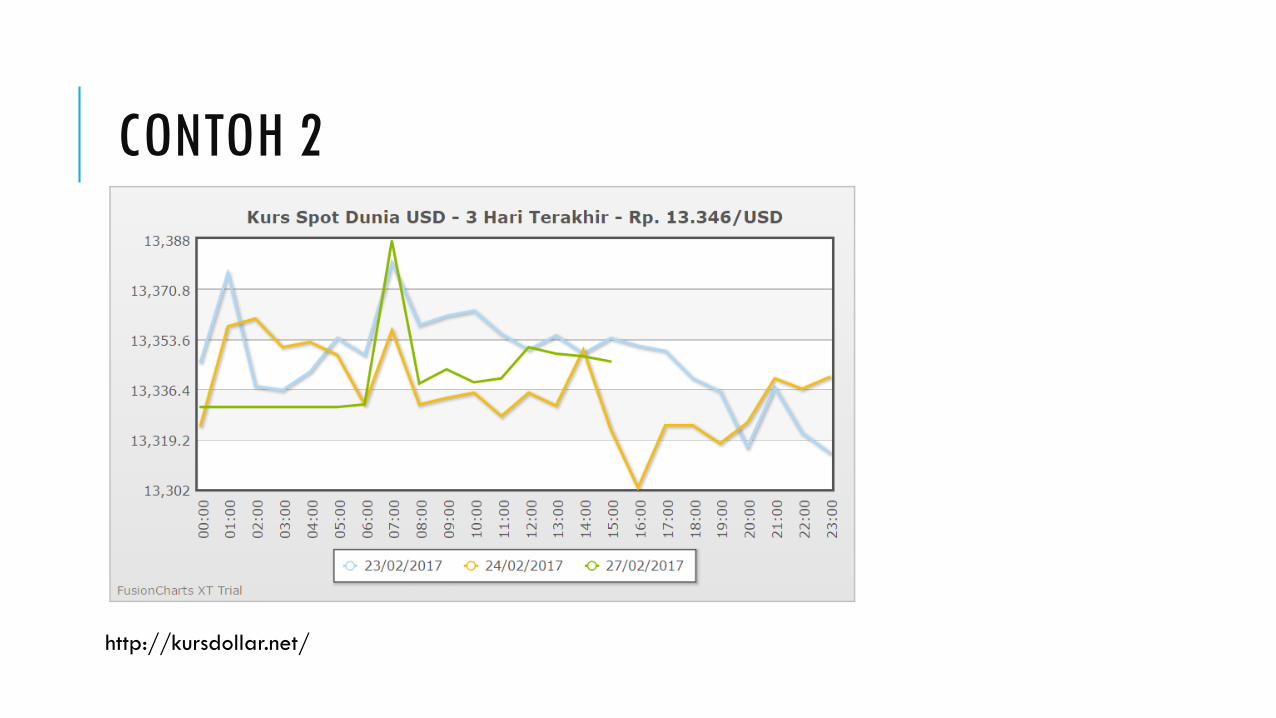
CONTOH 2
http://kursdollar.net/
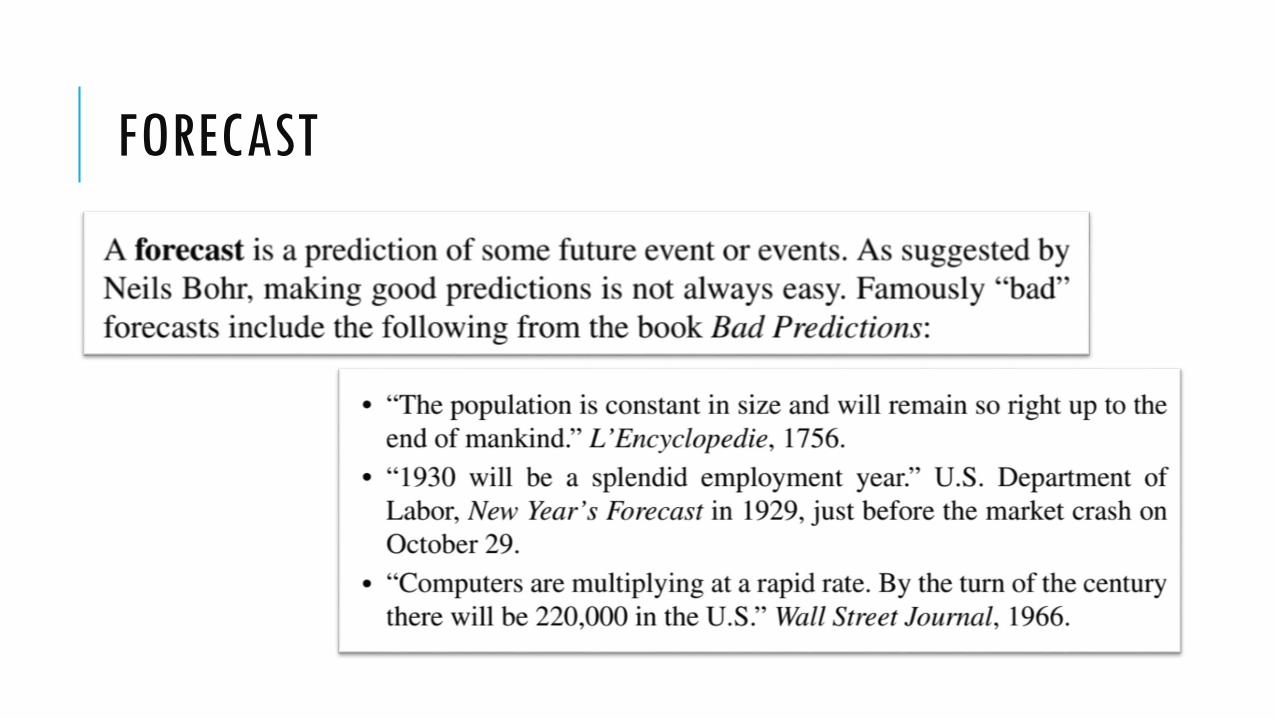
FORECAST

KEGIATAN PERAMALAN (FORECASTING)
Merupakan bagian integral dari pengambilan keputusan.
Mengurangi ketergantungan pada hal-hal yang belumpasti (intuitif).
Ada saling ketergantungan antar divisi. Contoh , kesalahan proyeksi penjualan akan mempengaruhi
ramalan anggaran, pengeluaran operasi, arus kas, persediaan, dst.
Dua hal utama dalam proses peramalan yang akurat dan bermanfaat: Pengumpulan data yang relevan.
Pemilihan teknik peramalan yang tepat.
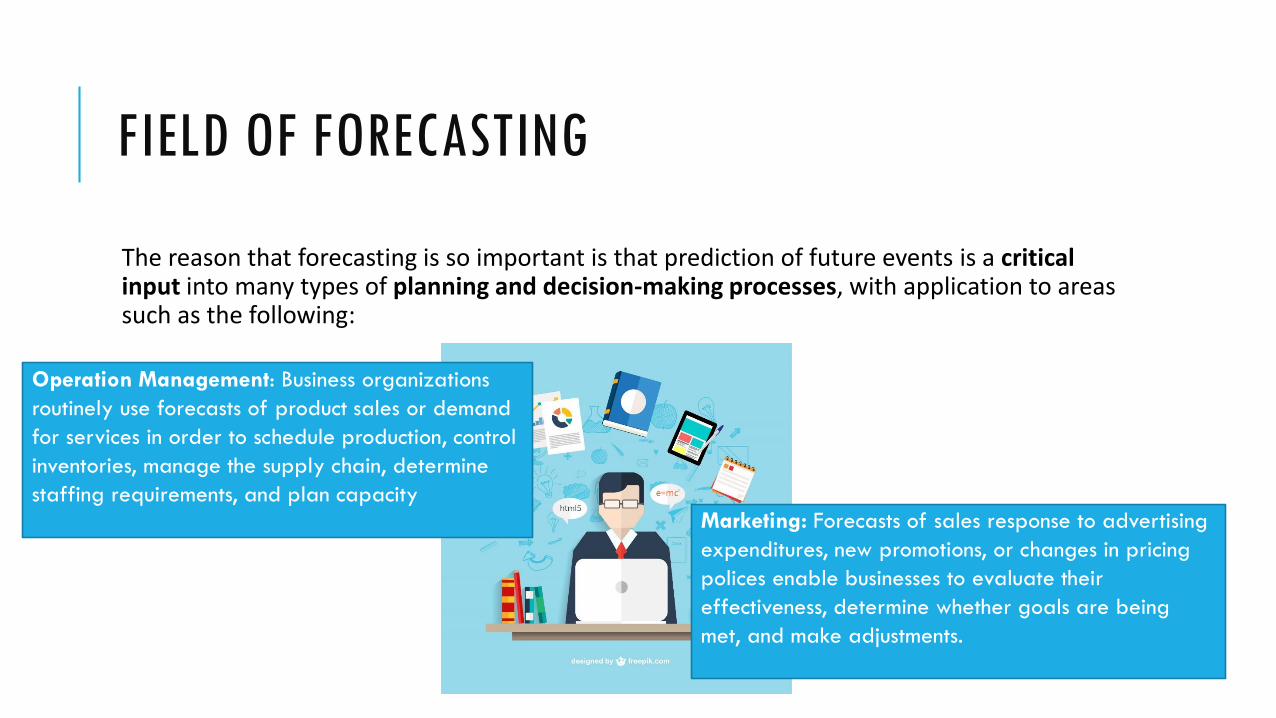
FIELD OF FORECASTING
The reason that forecasting is so important is that prediction of future events is a critical input into many types of planning and decision-making processes, with application to areas such as the following:
Operation Management: Business organizations
routinely use forecasts of product sales or demand
for services in order to schedule production, control
inventories, manage the supply chain, determine
staffing requirements, and plan capacity
Marketing: Forecasts of sales response to advertising
expenditures, new promotions, or changes in pricing
polices enable businesses to evaluate their
effectiveness, determine whether goals are being
met, and make adjustments.
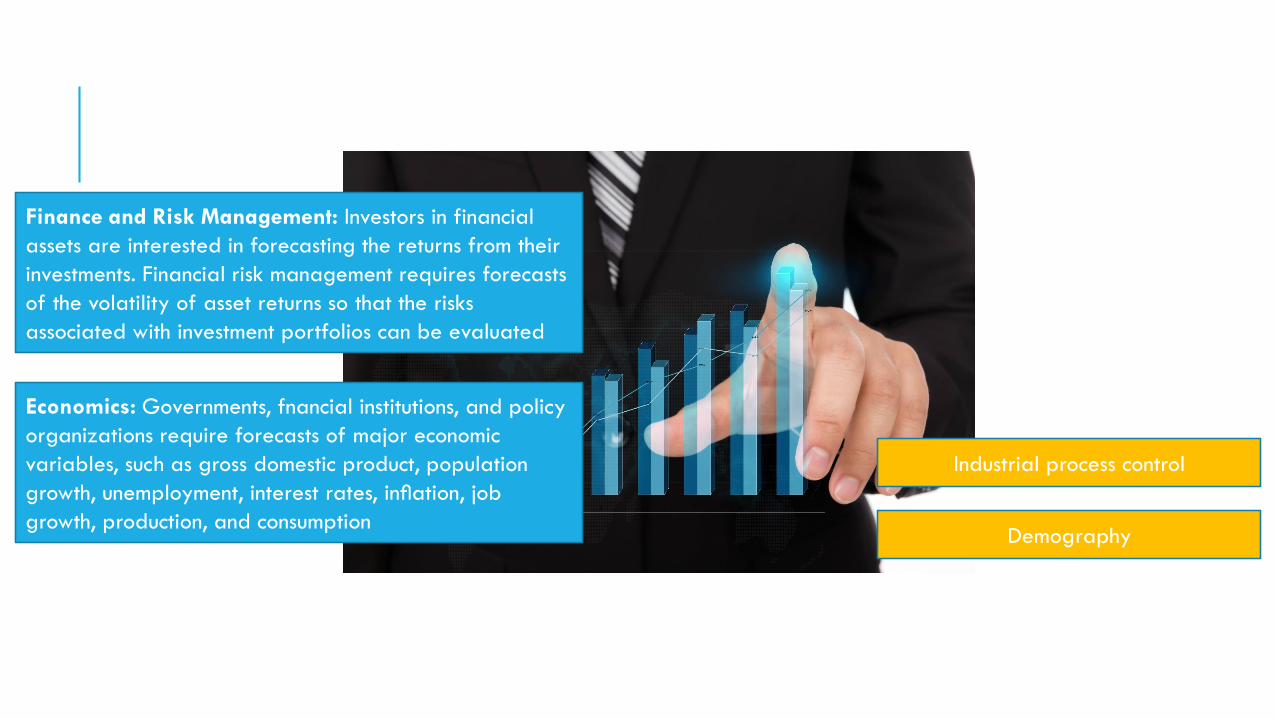
Finance and Risk Management: Investors in financial
assets are interested in forecasting the returns from their
investments. Financial risk management requires forecasts
of the volatility of asset returns so that the risks
associated with investment portfolios can be evaluated
Economics: Governments, fnancial institutions, and policy
organizations require forecasts of major economic
variables, such as gross domestic product, population
growth, unemployment, interest rates, inflation, job
growth, production, and consumption
Industrial process control
Demography

METODE PERAMALAN
Terdapat dua pendekatan peramalan : Kualitatif
Kuantitatif.
METODE PERAMALAN KUALITATIF
Metode ini digunakan ketika data historis langka atau bahkan tidak tersedia sama sekali;
Metode ini (biasanya) menggunakan opini dari para ahli untuk memprediksi kejadian secara subyektif;
Contoh: penjualan dari produk baru, lingkungan dan teknologi di masa mendatang.
Keuntungan: berguna ketika tidak ada data historis;
Kelemahan: subyektif

GLAD YOU DIDN’T SAY IT

METODE PERAMALAN KUANTITATIF
Metode ini digunakan ketika tersedia data historis;
Metode ini mengkonstruksi model peramalan dari data yang tersedia atauteori peramalan;
Keuntungan: Obyektif
Metode kuantitatif dibagi menjadi 2 jenis: time series dan causal
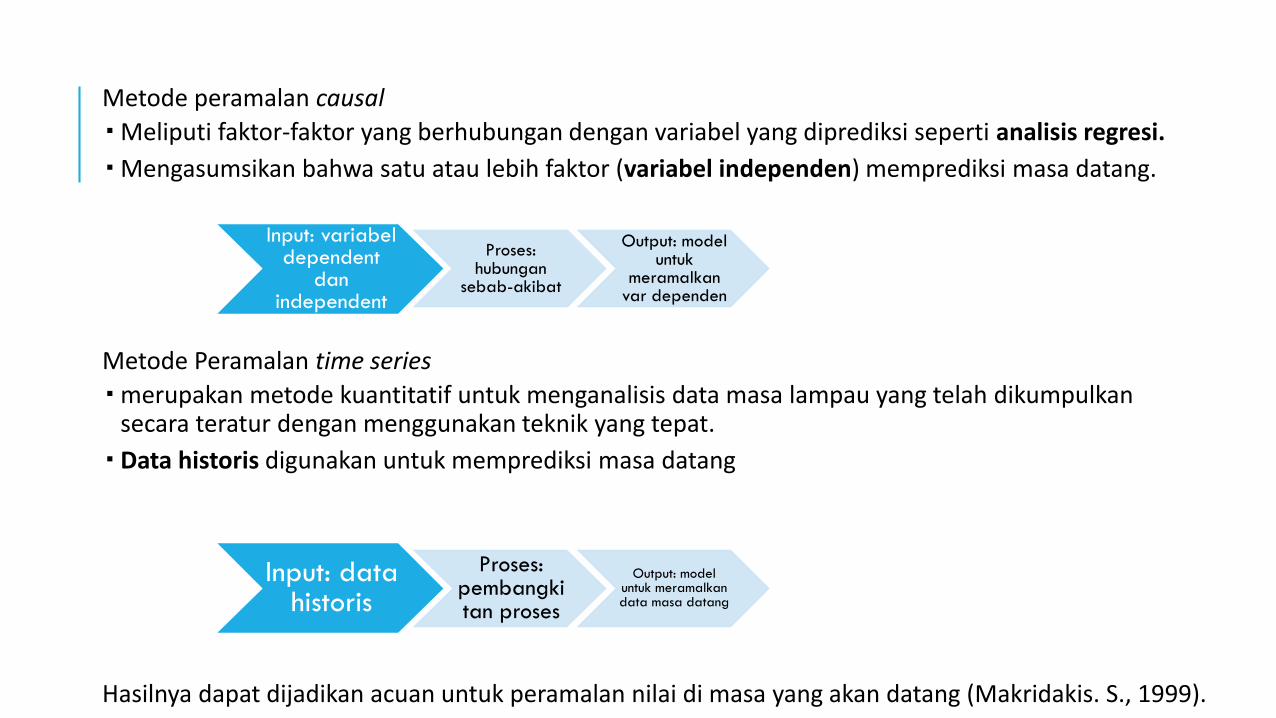
Metode peramalan causal
Meliputi faktor-faktor yang berhubungan dengan variabel yang diprediksi seperti analisis regresi.
Mengasumsikan bahwa satu atau lebih faktor (variabel independen) memprediksi masa datang.
Metode Peramalan time series
merupakan metode kuantitatif untuk menganalisis data masa lampau yang telah dikumpulkan secara teratur dengan menggunakan teknik yang tepat.
Data historis digunakan untuk memprediksi masa datang
Hasilnya dapat dijadikan acuan untuk peramalan nilai di masa yang akan datang (Makridakis. S., 1999).
Input: variabeldependent
danindependent
Proses: hubungan
sebab-akibat
Output: model untuk
meramalkanvar dependen
Input: data historis
Proses: pembangkitan proses
Output: model untuk meramalkandata masa datang
SYARAT-SYARAT PERAMALAN KUANTITATIF
1. Tersedia info pada waktu lalu
2. Info tersebut dapat dikuantitatifkan
3. Diasumsikan pola pada waktu-waktu lalu akan berlanjut di masa yang akandatang (assumption of constancy)

TIPE-TIPE METODE KUANTITATIF
1. Naif/intuitif
2. Formal• Berdasarkan prinsip-prinsip statistik
t
tt
tty
yyyy 1
1
Data mendatang = data sekarang + proporsi
peningkatan
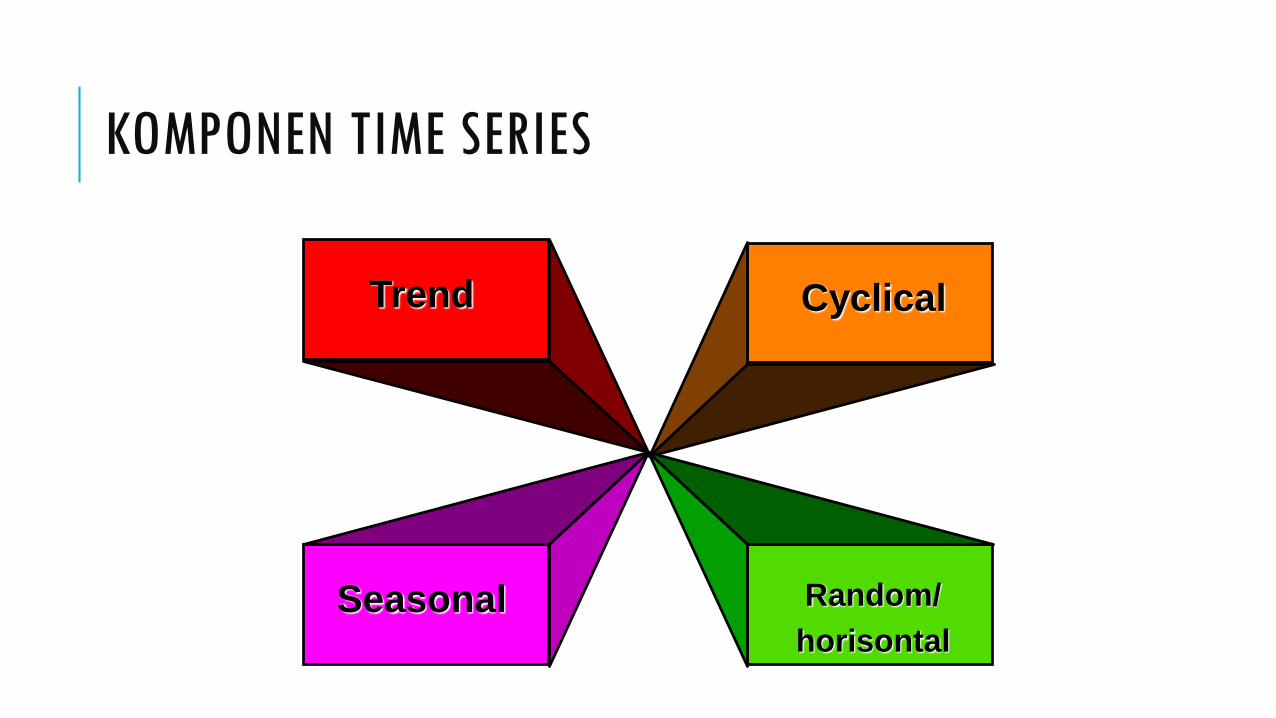
KOMPONEN TIME SERIES
Trend
Seasonal
Cyclical
Random/
horisontal
KOMPONEN/POLA DATA
Terdapat empat pola data yang lazim dalam peramalan:
1. Pola horisontal
2. Pola musiman
3. Pola siklis
4. Pola tren
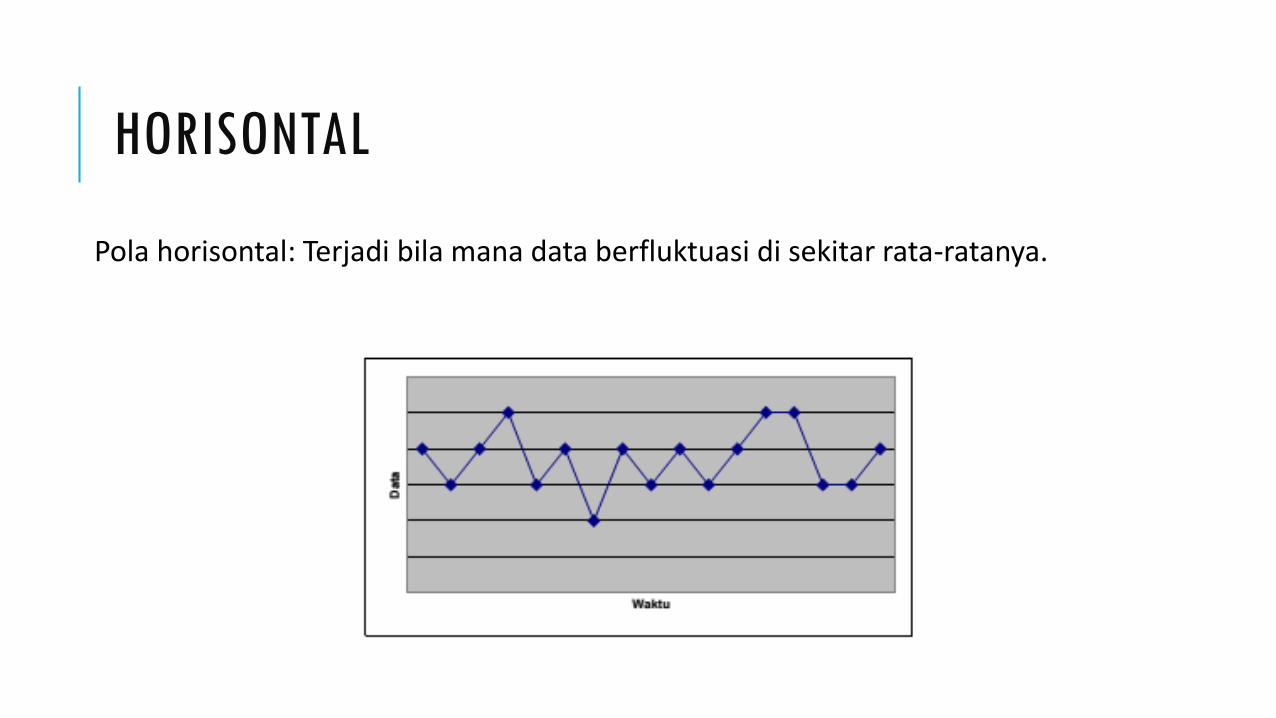
HORISONTAL
Pola horisontal: Terjadi bila mana data berfluktuasi di sekitar rata-ratanya.

MUSIMAN
Pola musiman: Terjadi bila mana nilai data dipengaruhi oleh faktor musiman(misalnya kuartal tahun tertentu, bulanan atau mingguan).
Menunjukkan puncak-puncak (peaks) dan lembah-lembah (valleys) yang berulangdalam interval yang konsisten.
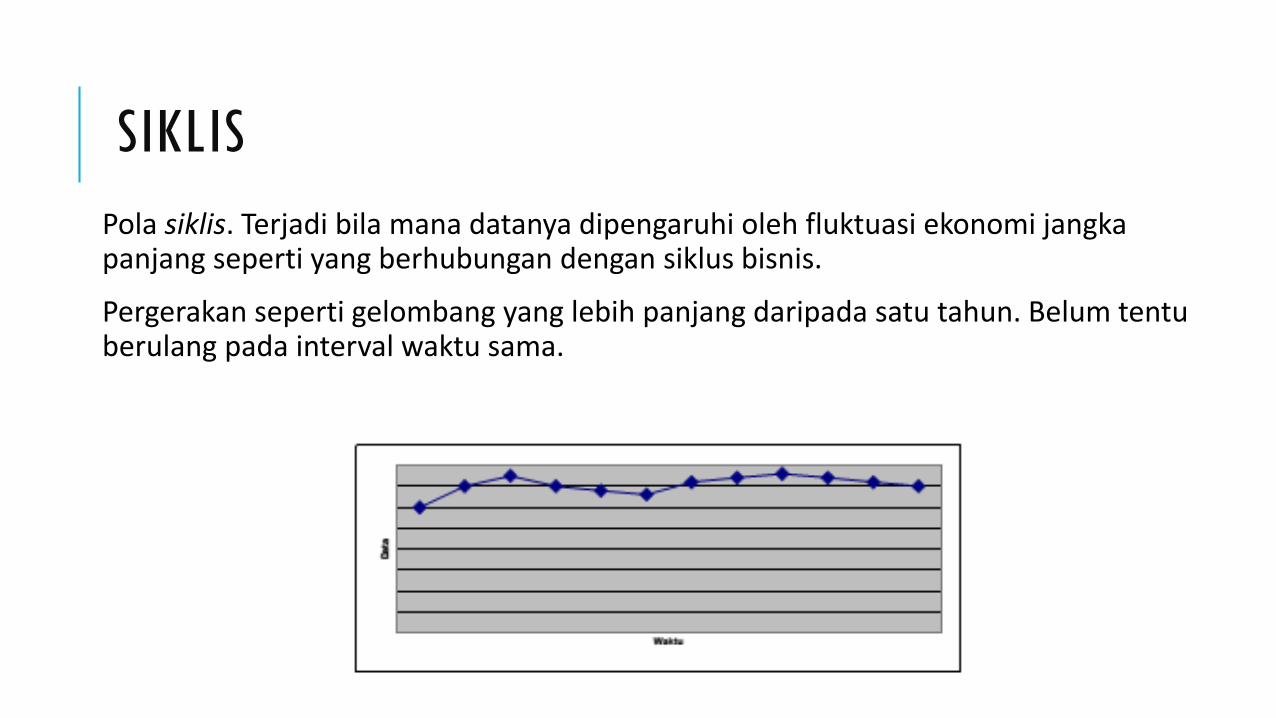
SIKLIS
Pola siklis. Terjadi bila mana datanya dipengaruhi oleh fluktuasi ekonomi jangkapanjang seperti yang berhubungan dengan siklus bisnis.
Pergerakan seperti gelombang yang lebih panjang daripada satu tahun. Belum tentuberulang pada interval waktu sama.
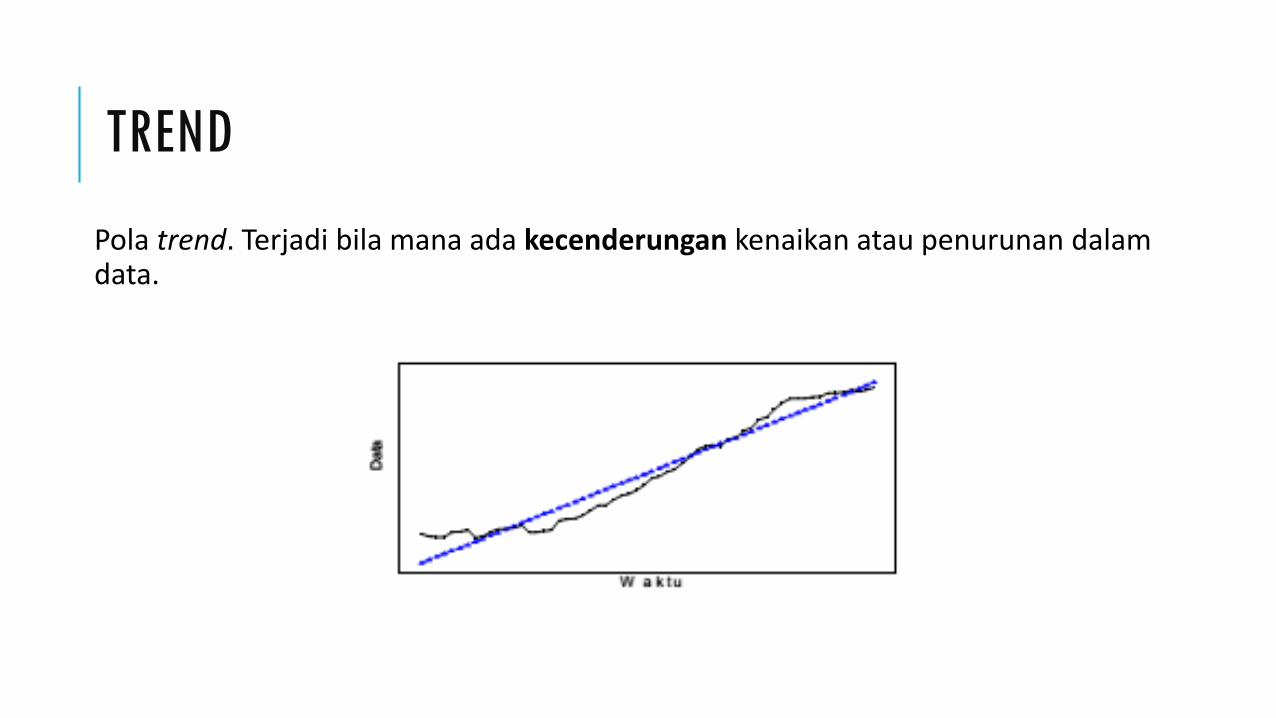
TREND
Pola trend. Terjadi bila mana ada kecenderungan kenaikan atau penurunan dalamdata.
SIMPLE AVERAGE
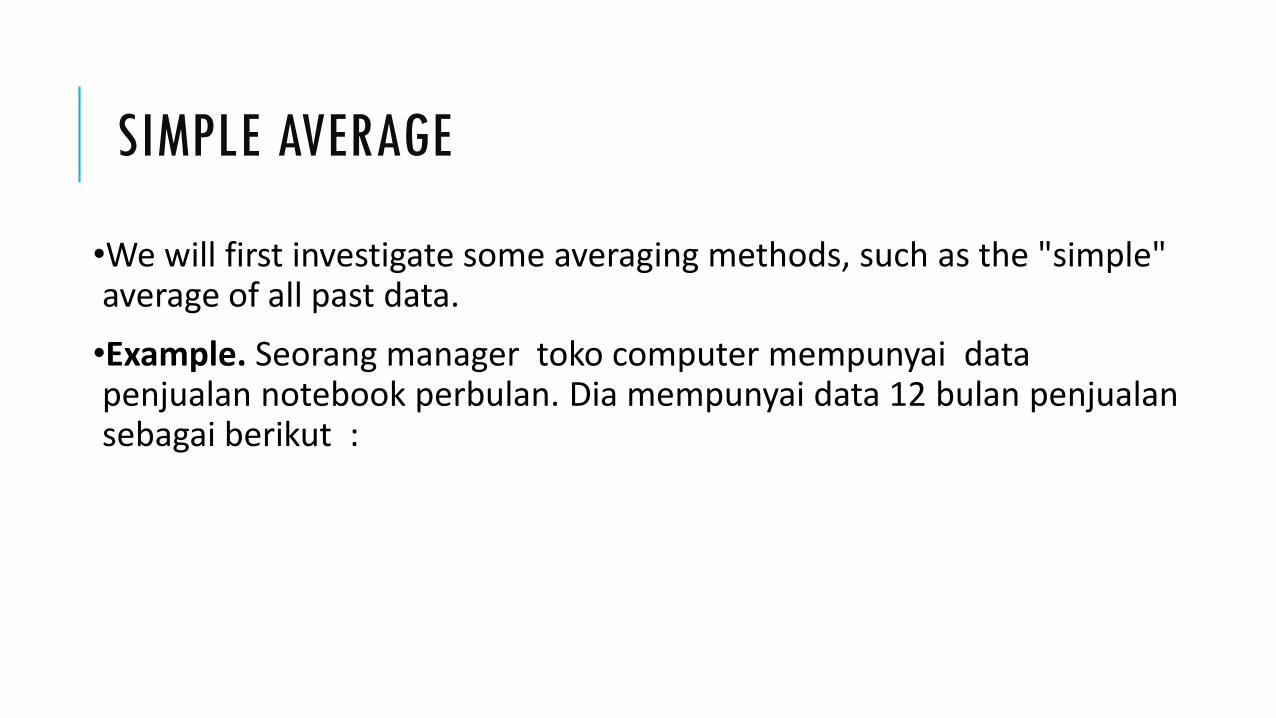
•We will first investigate some averaging methods, such as the "simple" average of all past data.
•Example. Seorang manager toko computer mempunyai data penjualan notebook perbulan. Dia mempunyai data 12 bulan penjualansebagai berikut :

DATABulan Amount Bulan Amount
1 9 7 11
2 8 8 7
3 9 9 13
4 12 10 9
5 9 11 11
6 12 12 10
The computed mean or average of the data = 10.
The manager decides to use this as the estimate for
next demand. Is this a good or bad estimate?
MSE
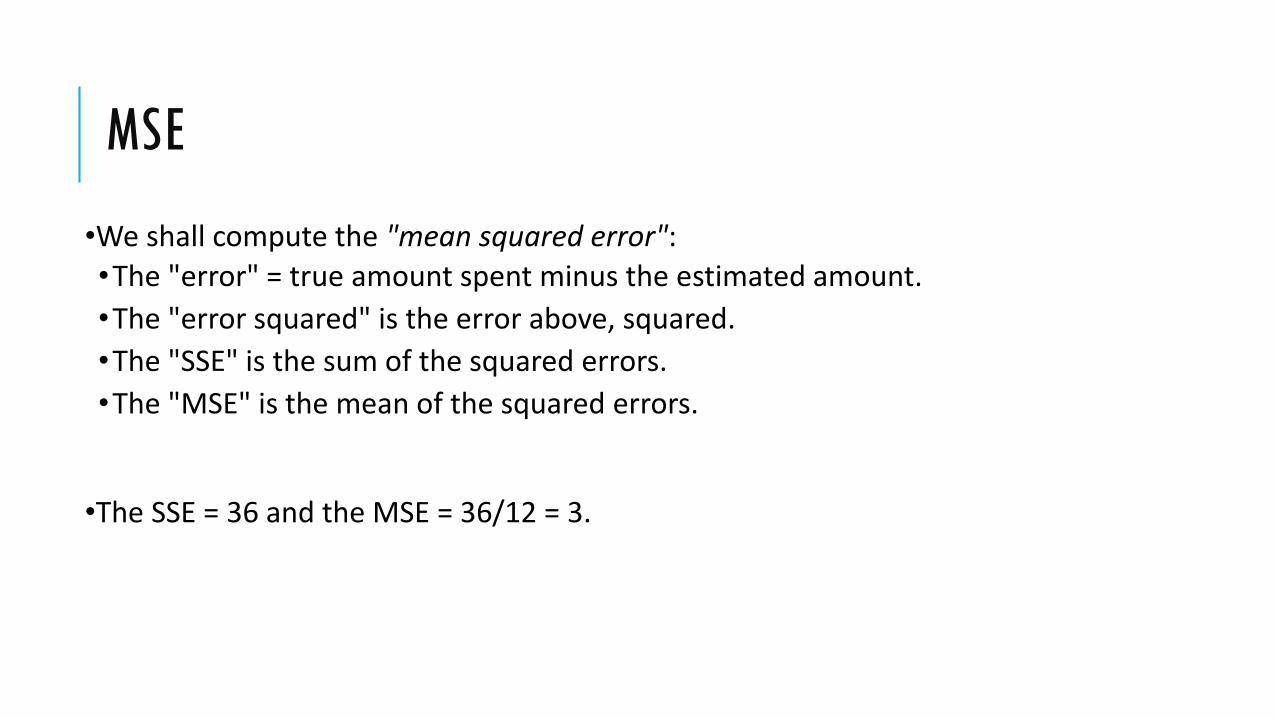
•We shall compute the "mean squared error": •The "error" = true amount spent minus the estimated amount.
•The "error squared" is the error above, squared.
•The "SSE" is the sum of the squared errors.
•The "MSE" is the mean of the squared errors.
•The SSE = 36 and the MSE = 36/12 = 3.
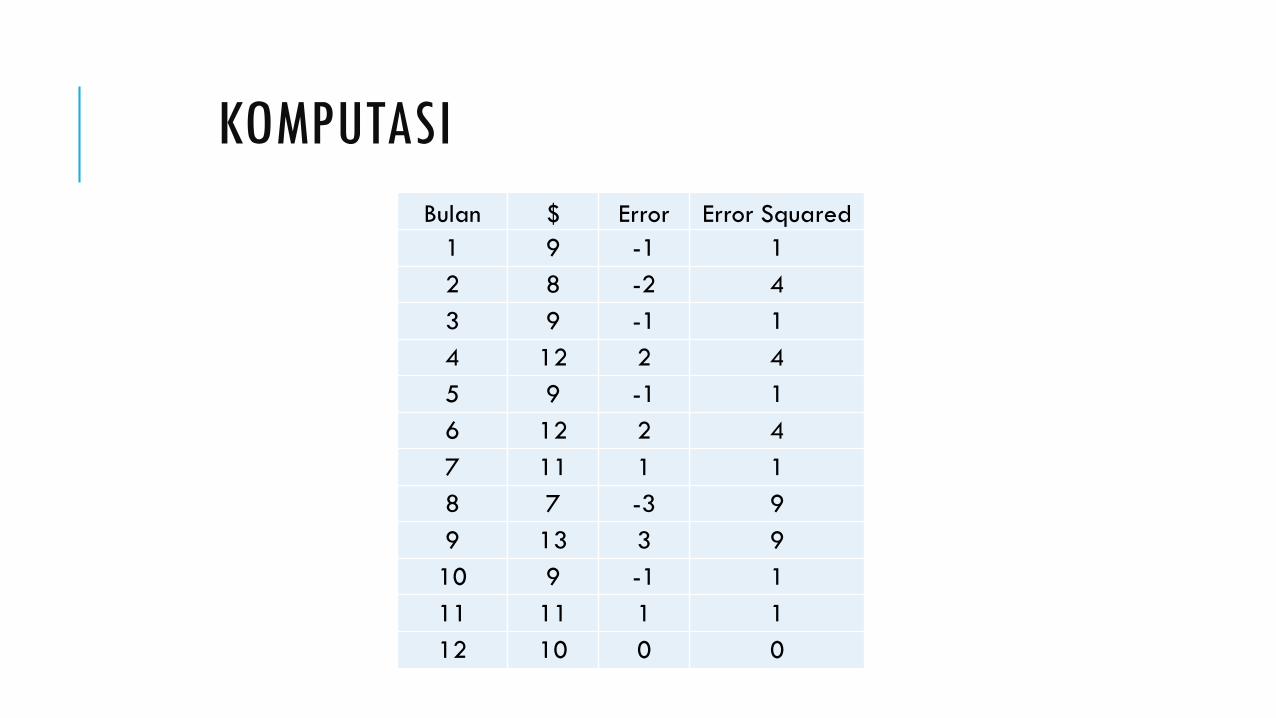
KOMPUTASI
Bulan $ Error Error Squared
1 9 -1 1
2 8 -2 4
3 9 -1 1
4 12 2 4
5 9 -1 1
6 12 2 4
7 11 1 1
8 7 -3 9
9 13 3 9
10 9 -1 1
11 11 1 1
12 10 0 0

MSE TERBAIK
So how good was the estimator for the next demand ? Let us compare the estimate (10) with the following estimates: 7, 9, and 12.
Performing the same calculations we arrive at:
Estimator 7 9 10 12
SSE 144 48 36 84
MSE 12 4 3 7

BUKTI ANALISIS
Dapat dibuktikan secara matematis bahwa estimator yang meminimalkan MSE pada himpunan data random adalah mean.
2
1
Minimum MSE 0n
i
i
dY a
da
DATA WITH TREND
Selanjutnya kita lihat data timeseries yang mengandung trend.
Next we will examine the mean to see how well it predicts net income over time for data having a trend. The next table gives the income before taxes of a PC manufacturer between 1985 and 1994.
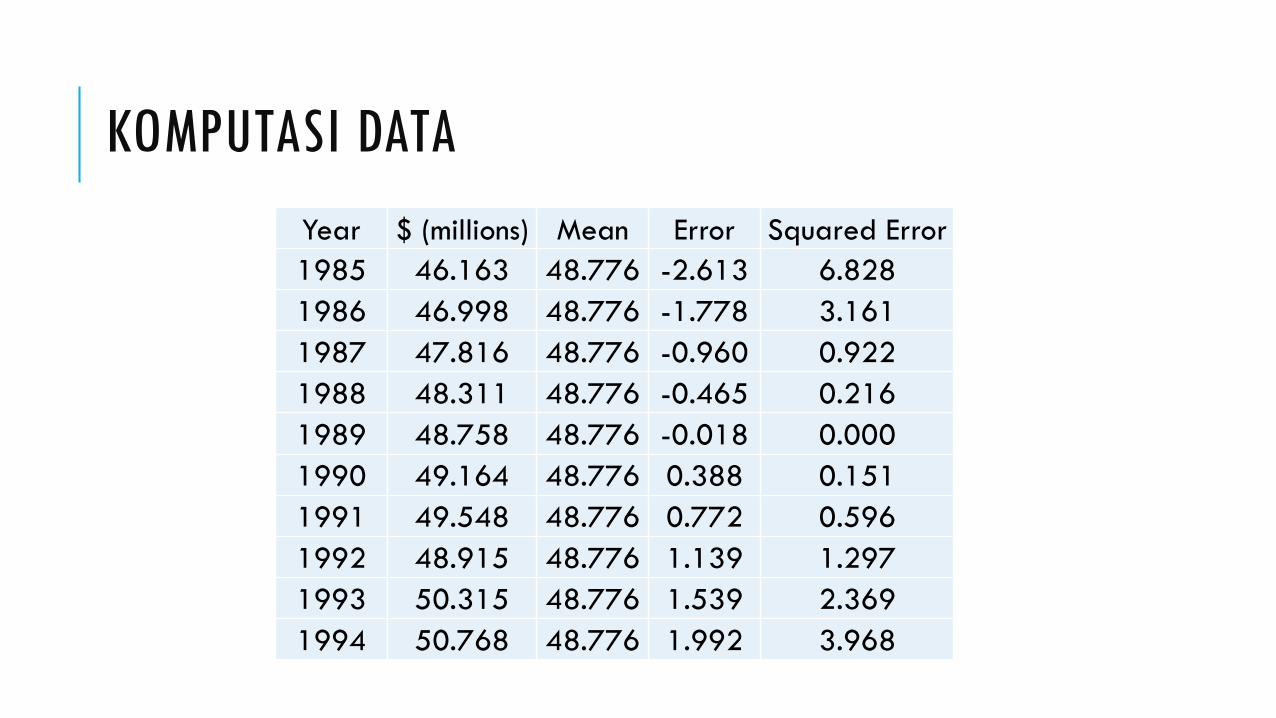
KOMPUTASI DATA
Year $ (millions) Mean Error Squared Error
1985 46.163 48.776 -2.613 6.828
1986 46.998 48.776 -1.778 3.161
1987 47.816 48.776 -0.960 0.922
1988 48.311 48.776 -0.465 0.216
1989 48.758 48.776 -0.018 0.000
1990 49.164 48.776 0.388 0.151
1991 49.548 48.776 0.772 0.596
1992 48.915 48.776 1.139 1.297
1993 50.315 48.776 1.539 2.369
1994 50.768 48.776 1.992 3.968

BUKTI EMPIRIS
The question arises: can we use the mean to forecast income if we suspect a trend ? A look at the graph below shows clearly that we should not do this.
Kasus di atas dapat diselesaikan antara lain dengan menggunakanregresi trend atau metode perataan yang lain seperti MA ganda, Metode Eksponensial Smoothing Linear Holt atau Brown.
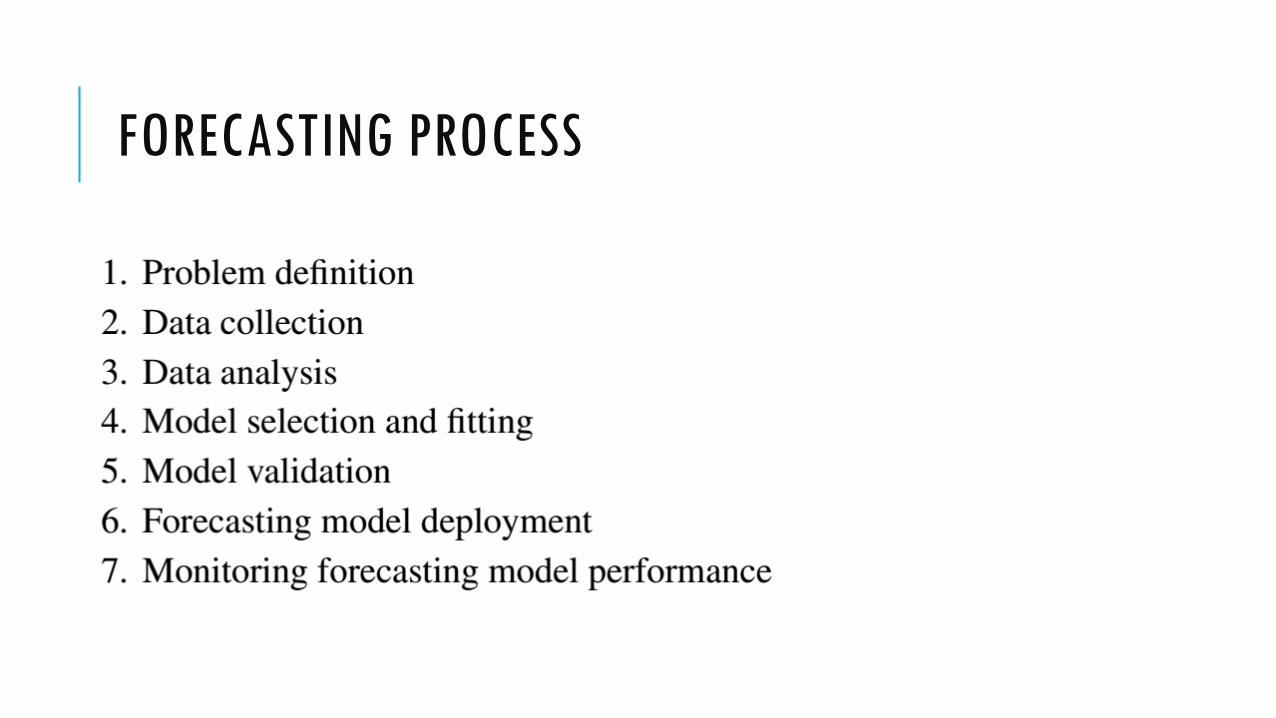
FORECASTING PROCESS
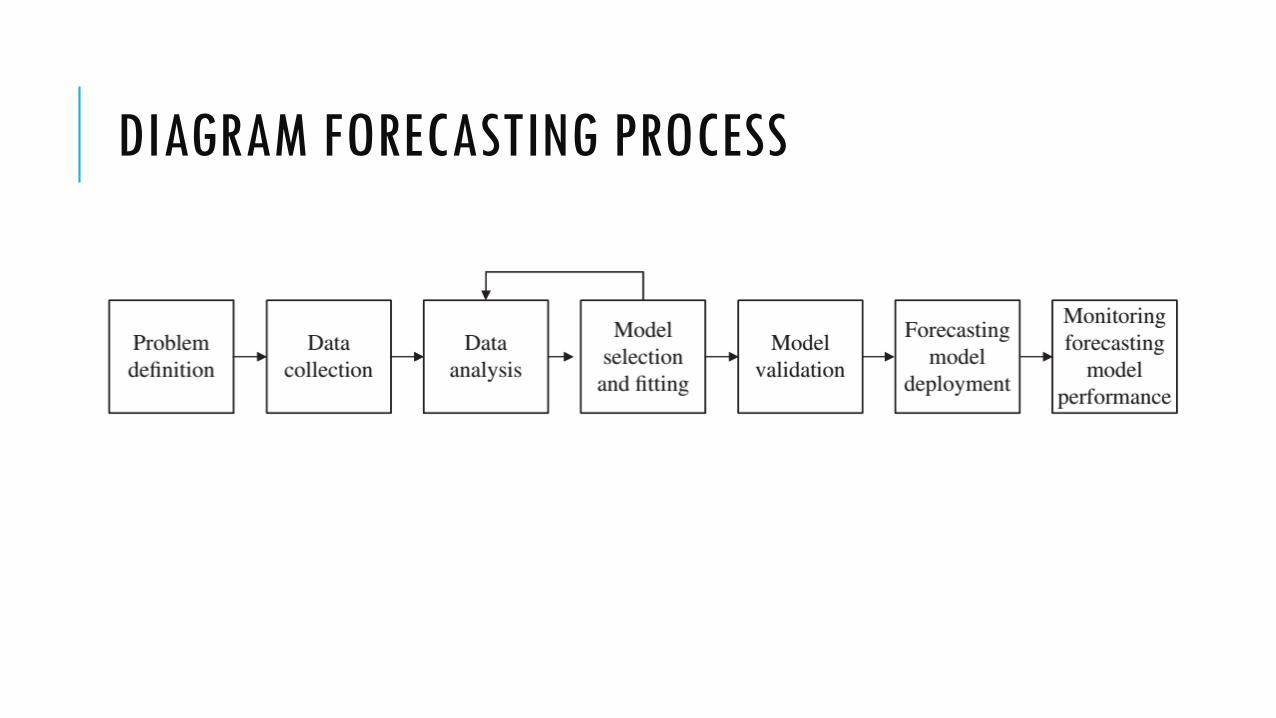
DIAGRAM FORECASTING PROCESS
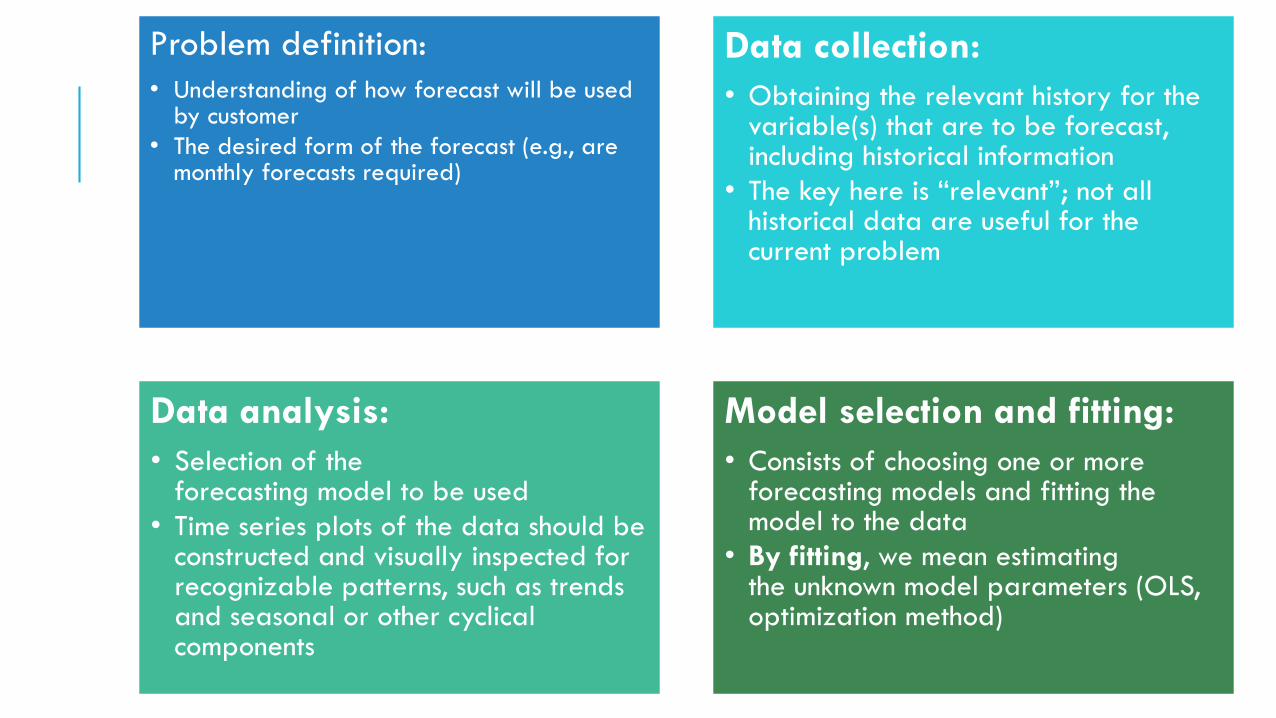
Problem definition:
• Understanding of how forecast will be used by customer
• The desired form of the forecast (e.g., are monthly forecasts required)
Data collection:
• Obtaining the relevant history for the variable(s) that are to be forecast, including historical information
• The key here is “relevant”; not all historical data are useful for the current problem
Data analysis:
• Selection of theforecasting model to be used
• Time series plots of the data should be constructed and visually inspected for recognizable patterns, such as trendsand seasonal or other cyclical components
Model selection and fitting:
• Consists of choosing one or more forecasting models and fitting the model to the data
• By fitting, we mean estimatingthe unknown model parameters (OLS, optimization method)
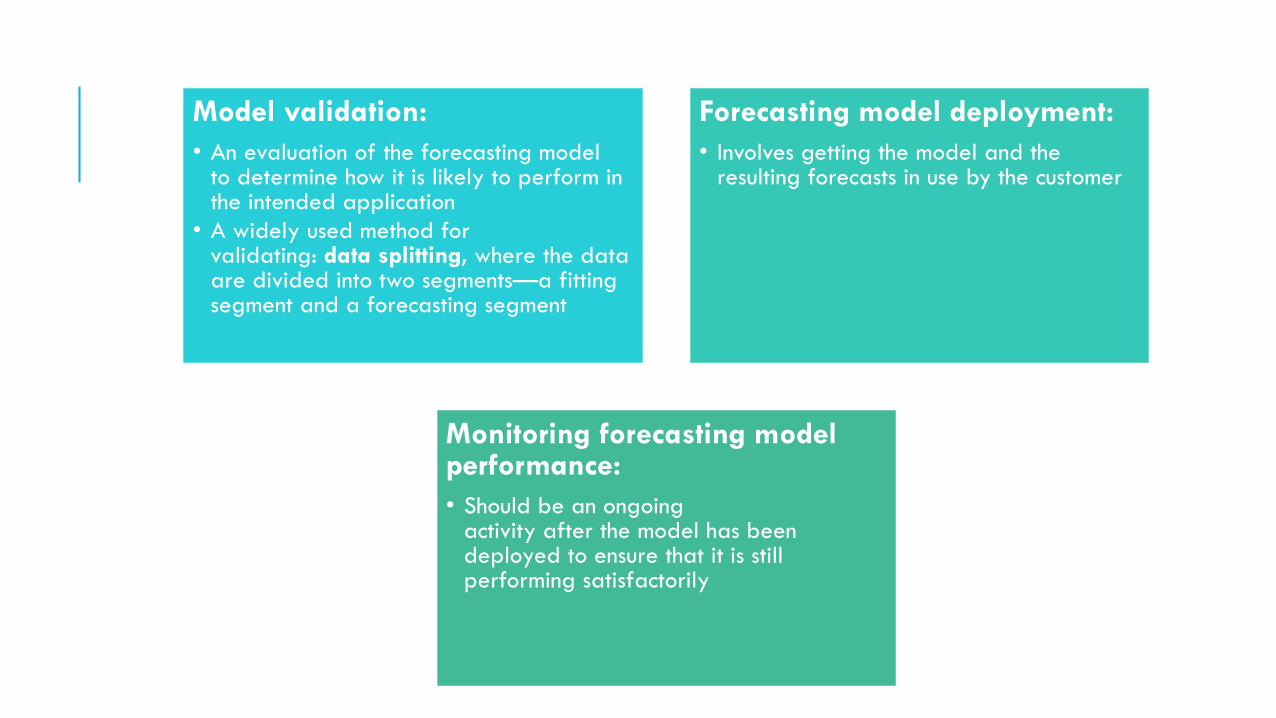
Model validation:
• An evaluation of the forecasting modelto determine how it is likely to perform in the intended application
• A widely used method forvalidating: data splitting, where the data are divided into two segments—a fitting segment and a forecasting segment
Forecasting model deployment:
• Involves getting the model and the resulting forecasts in use by the customer
Monitoring forecasting model performance:
• Should be an ongoingactivity after the model has been deployed to ensure that it is still performing satisfactorily
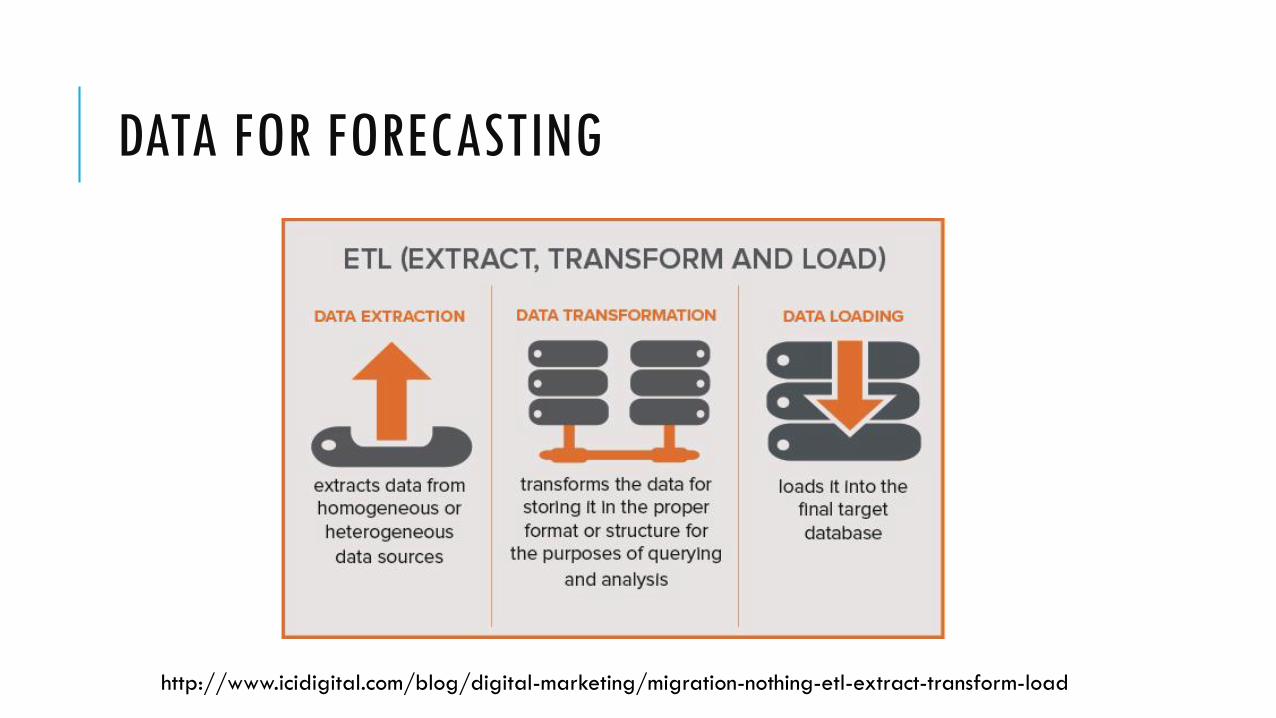
DATA FOR FORECASTING
http://www.icidigital.com/blog/digital-marketing/migration-nothing-etl-extract-transform-load
EXTRACT
Data extraction refers to obtaining data from internal sources and from external sources
Such as third party vendors or government entities and financial service organizations
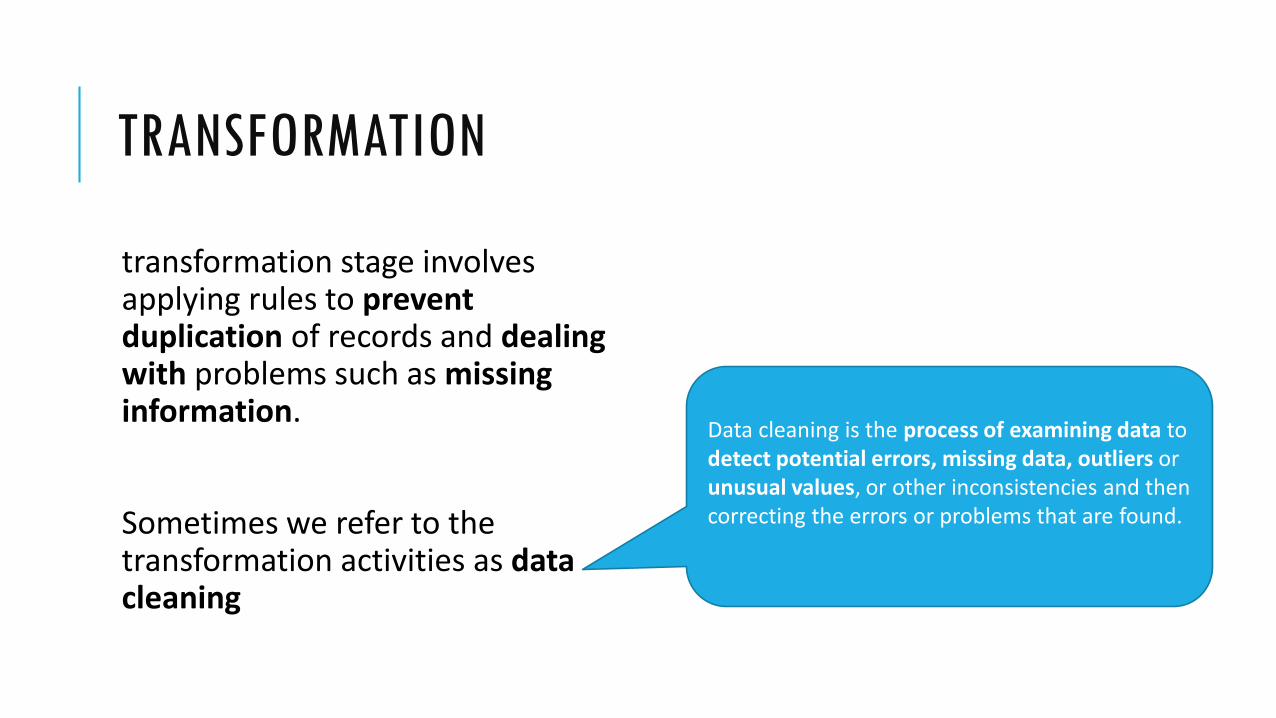
TRANSFORMATION
transformation stage involves applying rules to prevent duplication of records and dealing with problems such as missinginformation.
Sometimes we refer to the transformation activities as datacleaning
Data cleaning is the process of examining data to detect potential errors, missing data, outliers or unusual values, or other inconsistencies and thencorrecting the errors or problems that are found.
LOAD
Finally, the data are loaded into the data warehouse where
they are available for modeling and analysis.
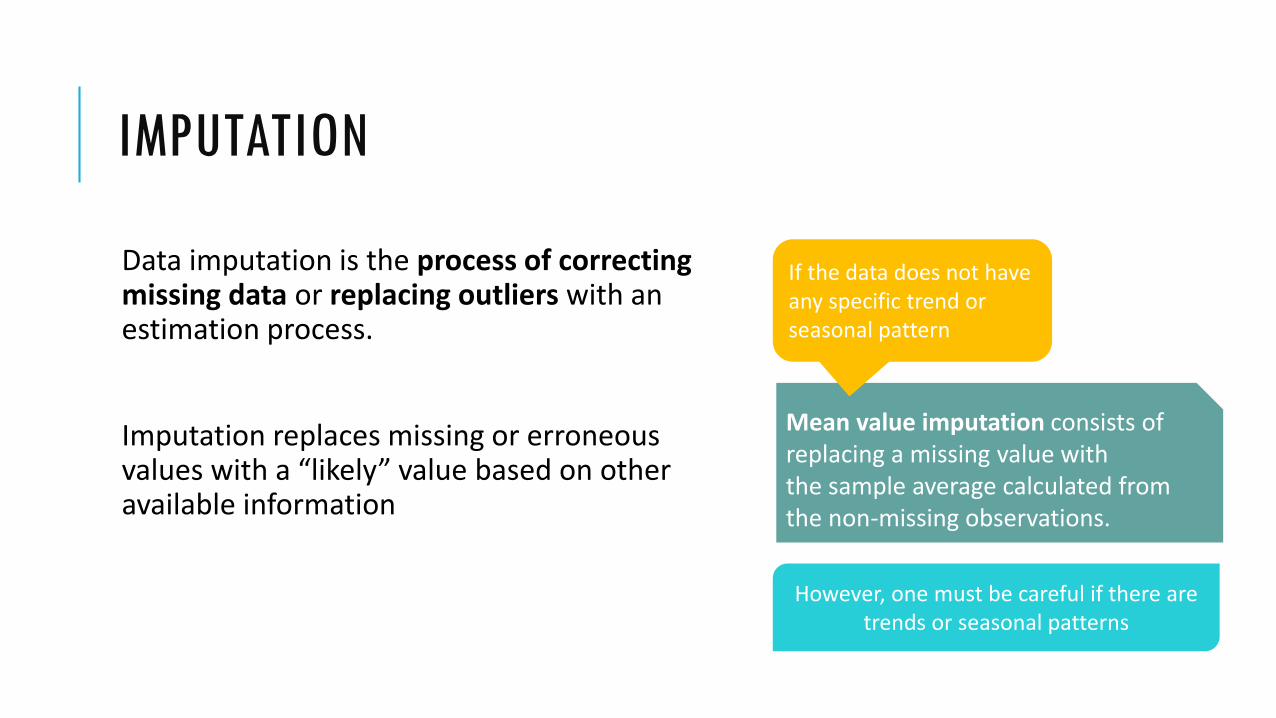
IMPUTATION
Data imputation is the process of correcting missing data or replacing outliers with an estimation process.
Imputation replaces missing or erroneous values with a “likely” value based on other available information
Mean value imputation consists of replacing a missing value withthe sample average calculated from the non-missing observations.
If the data does not have any specific trend or seasonal pattern
However, one must be careful if there are trends or seasonal patterns
IMPUTATION
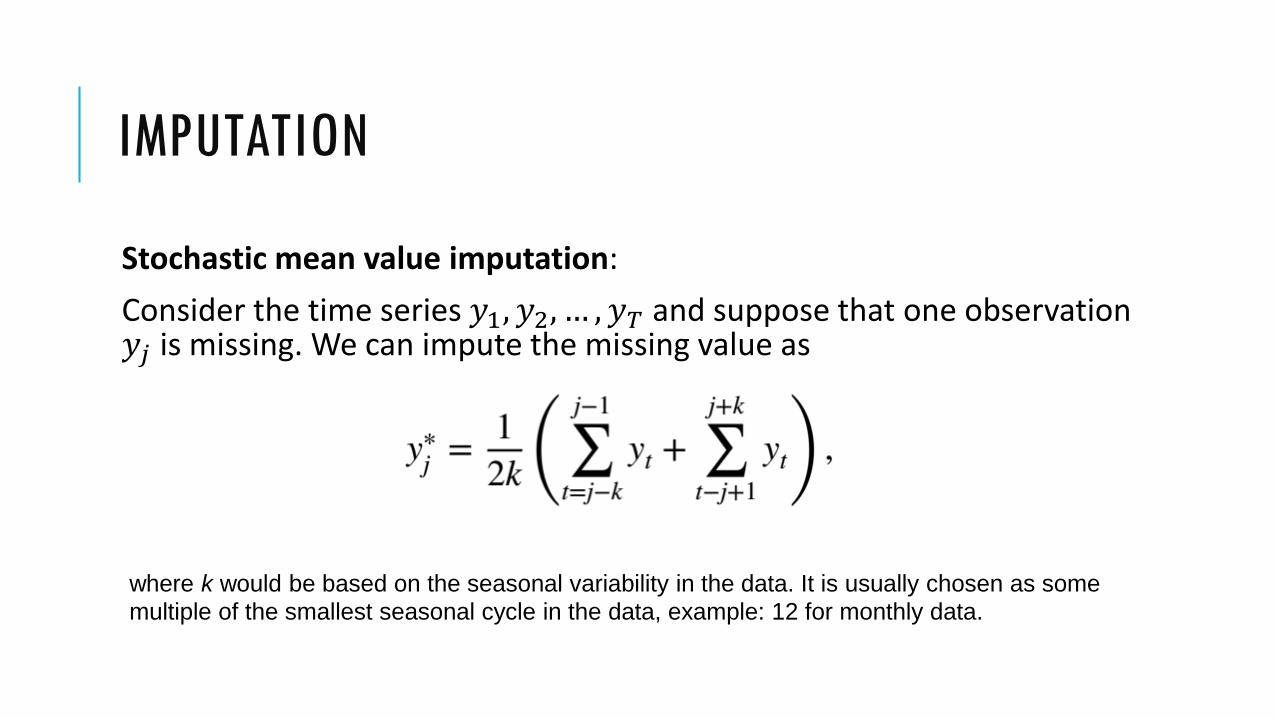
Stochastic mean value imputation:
Consider the time series 𝑦1, 𝑦2, … , 𝑦𝑇 and suppose that one observation 𝑦𝑗 is missing. We can impute the missing value as
where k would be based on the seasonal variability in the data. It is usually chosen as some
multiple of the smallest seasonal cycle in the data, example: 12 for monthly data.
IMPUTATION
Regression imputation
Is a variation of mean value imputation where the imputed value is computed from a model used to predict the missing value. The prediction model does not have to be a linear regression model.
REFERENCE
https://onlinecourses.science.psu.edu/stat510/node/47