Embed Size (px)
Citation preview

1/18
IntroductionData
ResultsConclusions
Peculiar velocities of SN Ia in clusters of galaxies:the impact on distance measurements
P.-F. Leget, M. V. Pruzhinskaya, Ph. Gris, A. Ciulli, E. Gangler,L.-P. Says + SNfactory collaboration
postdoctoral researcher at the Laboratoire de Physique Corpusculaire, LSST group,Clermont-Ferrand
April 25, 2017
P.-F. Leget et al. SN Ia in clusters of galaxies: the impact on distance measurements
2/18
IntroductionData
ResultsConclusions
Introduction
DataNearby Supernova Factory dataHost clusters data
ResultsHubble diagram fittingLuminosity dispersion of SN Ia inside the galaxy clusters
Conclusions
P.-F. Leget et al. SN Ia in clusters of galaxies: the impact on distance measurements
3/18
IntroductionData
ResultsConclusions
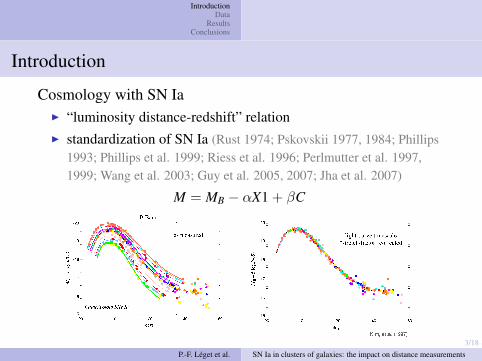
Introduction
Cosmology with SN IaI “luminosity distance-redshift” relationI standardization of SN Ia (Rust 1974; Pskovskii 1977, 1984; Phillips
1993; Phillips et al. 1999; Riess et al. 1996; Perlmutter et al. 1997,1999; Wang et al. 2003; Guy et al. 2005, 2007; Jha et al. 2007)
M = MB − αX1 + βC
P.-F. Leget et al. SN Ia in clusters of galaxies: the impact on distance measurements

4/18
IntroductionData
ResultsConclusions
Introduction
Cosmology with SN IaI Is the uncertainty on the redshift negligible?
(1 + zobs) = (1 + zc)(1 + zd)
I For low and intermediate redshifts (z < 0.2):I to remove all SNe with z < 0.015 from the Hubble diagram
(Astier et al. 2006; Wood-Vasey et al. 2007)I high intrinsic velocity dispersion (300 km/s, Amanullah
et al. 2010)I velocity maps of the nearby Universe (150 km/s, Hudson et al.,
2004; Conley et al., 2011; Betoule et al., 2014)
P.-F. Leget et al. SN Ia in clusters of galaxies: the impact on distance measurements
5/18
IntroductionData
ResultsConclusions
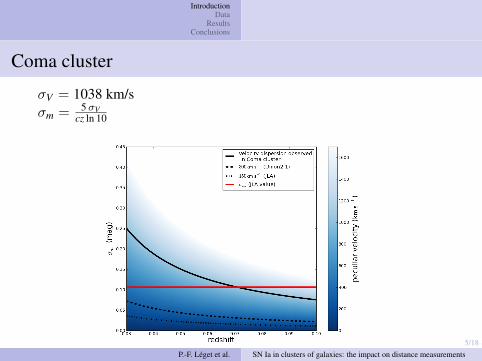
Coma cluster
σV = 1038 km/sσm = 5σV
cz ln 10
P.-F. Leget et al. SN Ia in clusters of galaxies: the impact on distance measurements

6/18
IntroductionData
ResultsConclusions
SN Ia in clusters
P.-F. Leget et al. SN Ia in clusters of galaxies: the impact on distance measurements
Doppler shift
Doppler shift
Doppler shift
Blakeslee et al. 1999;Radburn-Smith et al. 2004(Virgo, Fornax)
How to estimate better theimpact of peculiar velocities onthe distance measurements?
I to match the host galaxies of SNe Ia with known clusters of galaxiesI to use the host cluster redshift instead of the host galaxy redshift
7/18
IntroductionData
ResultsConclusions
Nearby Supernova Factory dataHost clusters data
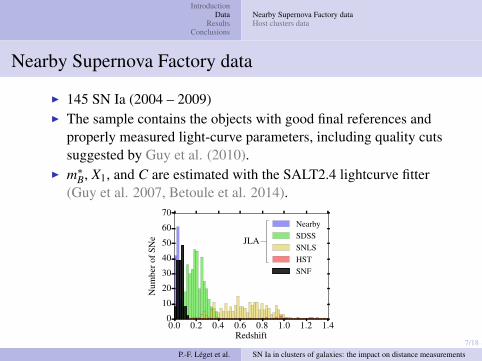
Nearby Supernova Factory data
I 145 SN Ia (2004 – 2009)I The sample contains the objects with good final references and
properly measured light-curve parameters, including quality cutssuggested by Guy et al. (2010).
I m∗B, X1, and C are estimated with the SALT2.4 lightcurve fitter
(Guy et al. 2007, Betoule et al. 2014).
0.0 0.2 0.4 0.6 0.8 1.0 1.2 1.4Redshift
0
10
20
30
40
50
60
70
Num
bero
fSN
e JLA
NearbySDSSSNLSHSTSNF
P.-F. Leget et al. SN Ia in clusters of galaxies: the impact on distance measurements

8/18
IntroductionData
ResultsConclusions
Nearby Supernova Factory dataHost clusters data
Galaxy clusters
Methods for identifying the clusters:I over-density regions on the imagesI red sequence methodI diffused X-ray emissionI Sunyaev-Zel’dovich effect
SIMBAD databaseI only clusters of galaxies
(exclude groups of galaxies)I d < 1 MpcI ∆z < 0.01
P.-F. Leget et al. SN Ia in clusters of galaxies: the impact on distance measurements
A2589
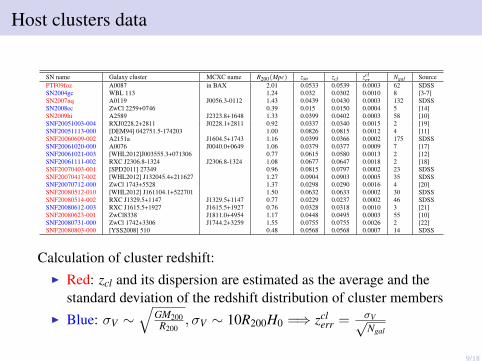
Host clusters data
SN name Galaxy cluster MCXC name R200(Mpc) zsn zcl zcler Ngal Source
PTF09foz A0087 in BAX 2.01 0.0533 0.0539 0.0003 62 SDSSSN2004gc WBL 113 1.24 0.032 0.0302 0.0010 8 [3-7]SN2007nq A0119 J0056.3-0112 1.43 0.0439 0.0430 0.0003 132 SDSSSN2008ec ZwCl 2259+0746 0.39 0.015 0.0150 0.0004 5 [14]SN2009hi A2589 J2323.8+1648 1.33 0.0399 0.0402 0.0003 58 [10]SNF20051003-004 RXJ0228.2+2811 J0228.1+2811 0.92 0.0337 0.0340 0.0015 2 [19]SNF20051113-000 [DEM94] 042751.5-174203 1.00 0.0826 0.0815 0.0012 4 [11]SNF20060609-002 A2151a J1604.5+1743 1.16 0.0399 0.0366 0.0002 175 SDSSSNF20061020-000 A0076 J0040.0+0649 1.06 0.0379 0.0377 0.0009 7 [17]SNF20061021-003 [WHL2012]J003555.3+071306 0.77 0.0615 0.0580 0.0013 2 [12]SNF20061111-002 RXC J2306.8-1324 J2306.8-1324 1.08 0.0677 0.0647 0.0018 2 [18]SNF20070403-001 [SPD2011] 27349 0.96 0.0815 0.0797 0.0002 23 SDSSSNF20070417-002 [WHL2012] J132045.4+211627 1.27 0.0904 0.0903 0.0005 35 SDSSSNF20070712-000 ZwCl 1743+5528 1.37 0.0298 0.0290 0.0016 4 [20]SNF20080512-010 [WHL2012] J161104.1+522701 1.50 0.0632 0.0633 0.0002 30 SDSSSNF20080514-002 RXC J1329.5+1147 J1329.5+1147 0.77 0.0229 0.0237 0.0002 46 SDSSSNF20080612-003 RXC J1615.5+1927 J1615.5+1927 0.76 0.0328 0.0318 0.0010 3 [21]SNF20080623-001 ZwCl8338 J1811.0+4954 1.17 0.0448 0.0495 0.0003 55 [10]SNF20080731-000 ZwCl 1742+3306 J1744.2+3259 1.55 0.0755 0.0755 0.0026 2 [22]SNF20080803-000 [YSS2008] 510 0.48 0.0568 0.0568 0.0007 14 SDSS
Calculation of cluster redshift:I Red: zcl and its dispersion are estimated as the average and the
standard deviation of the redshift distribution of cluster membersI Blue: σV ∼
√GM200R200
, σV ∼ 10R200H0 =⇒ zclerr = σV√
Ngal
9/18

10/18
IntroductionData
ResultsConclusions
Hubble diagram fittingLuminosity dispersion of SN Ia inside the galaxy clusters
Hubble diagramwRMS = 0.150m (without correction); wRMS = 0.149m (with correction)The significance of improvement is 1.7-σ
P.-F. Leget et al. SN Ia in clusters of galaxies: the impact on distance measurements
0.02 0.04 0.06 0.08 0.10
zc
0.4
0.3
0.2
0.1
0.0
0.1
0.2
0.3
0.4
∆µ
all SN Ia
SN Ia inside a galaxy cluster, before correction
SN Ia inside a galaxy cluster, after correction
wRMS=0.149 mag
wRMS=0.121 mag
wRMS=0.103 mag } 2.4-σ
11/18
IntroductionData
ResultsConclusions
Hubble diagram fittingLuminosity dispersion of SN Ia inside the galaxy clusters
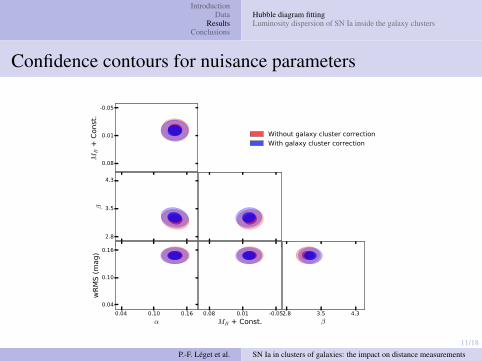
Confidence contours for nuisance parameters
P.-F. Leget et al. SN Ia in clusters of galaxies: the impact on distance measurements
-0.05
0.01
0.08
MB +
Const
.
0.04 0.10 0.16
2.8
3.5
4.3
β
-0.050.010.08
0.04 0.10 0.16
α
0.04
0.10
0.16
wR
MS (
mag)
-0.050.010.08
MB + Const.2.8 3.5 4.3
β
Without galaxy cluster correctionWith galaxy cluster correction

12/18
IntroductionData
ResultsConclusions
Hubble diagram fittingLuminosity dispersion of SN Ia inside the galaxy clusters
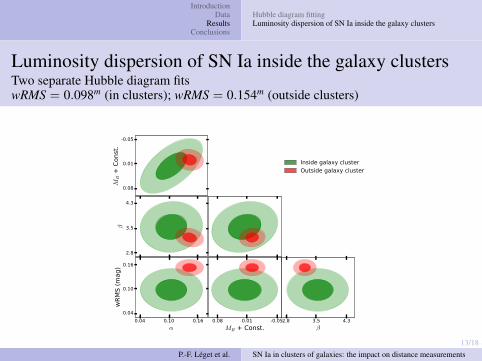
Luminosity dispersion of SN Ia inside the galaxy clusters
The wRMS (0.121m) for SNe inside the clusters even beforecorrection is smaller than wRMS for the SNe outside the clusters
(wRMS=0.153m)⇓
Are SNe Ia inside the galaxy clusters more standard?
P.-F. Leget et al. SN Ia in clusters of galaxies: the impact on distance measurements
13/18
IntroductionData
ResultsConclusions
Hubble diagram fittingLuminosity dispersion of SN Ia inside the galaxy clusters
Luminosity dispersion of SN Ia inside the galaxy clustersTwo separate Hubble diagram fitswRMS = 0.098m (in clusters); wRMS = 0.154m (outside clusters)
-0.05
0.01
0.08
MB +
Const
.
0.04 0.10 0.16
2.8
3.5
4.3
β
-0.050.010.08
0.04 0.10 0.16
α
0.04
0.10
0.16
wR
MS (
mag)
-0.050.010.08
MB + Const.2.8 3.5 4.3
β
Inside galaxy clusterOutside galaxy cluster
P.-F. Leget et al. SN Ia in clusters of galaxies: the impact on distance measurements

14/18
IntroductionData
ResultsConclusions
Hubble diagram fittingLuminosity dispersion of SN Ia inside the galaxy clusters
Stretch and color distribution
P.-F. Leget et al. SN Ia in clusters of galaxies: the impact on distance measurements
3 2 1 0 1 2 3 4
SALT2 X1
outside cluster
inside cluster
0.2 0.1 0.0 0.1 0.2 0.3 0.4 0.5 0.6
SALT2 C
outside cluster
inside cluster

15/18
IntroductionData
ResultsConclusions
Hubble diagram fittingLuminosity dispersion of SN Ia inside the galaxy clusters
The environment of SN Ia
The influence of the environmental effects on the SN Ia intrinsicluminosity was proved in many works:
I host galaxy morphology and stellar population age (Hamuy et al.1995,1996,2000; Riess et al. 1999; Sullivan 2003; Hicken et al. 2009;Hill et al. 2016; Henne et al. 2017)
I galocentric distance (Sullivan et al. 2003; Hill et al. 2016)I star-formation rate (Sullivan et al. 2006; Neill et al. 2009; Lampeitl
et al. 2010; Sullivan et al. 2010; Smith et al. 2012; Johansson 2013)I local star-formation rate (1-3 kpc; Rigault et al. 2013; Roman et al.
(in prep.))I stellar mass of host galaxy (Kelly et al. 2010; Sullivan et al. 2010;
Johansson 2013)I host metallicity (Gallagher et al. 2005,2008; Howell et al. 2009)
P.-F. Leget et al. SN Ia in clusters of galaxies: the impact on distance measurements

16/18
IntroductionData
ResultsConclusions
Hubble diagram fittingLuminosity dispersion of SN Ia inside the galaxy clusters
The properties of host galaxies of SNe Ia in clusters
P.-F. Leget et al. SN Ia in clusters of galaxies: the impact on distance measurements
SN name Host name Hosttype
log(sSFR) log(Mstellar )
SNF20070403-001 2MASXJ10054419+1819037 Sbc -10.07 11.01SN2007nq UGC 595 E -12.57 12.12SNF20080914-001 2MASXJ04572695-0004153 Sbc - -SN2006X M 100 Sc - -SNF20080514-002 UGC 8472 S0 -9.722 11.12SN2009hi NGC 7647 E -12.30 11.51SNF20061020-000 2MASXJ00410521+0647439 Sab -10.08 10.26SNF20051003-004 NSFJ022743.32+281037.6 - -10.33 9.005SNF20060609-002 MCG+03-41-072 Sbc -9.586 10.19SN2008ec NGC 7469 Sa -10.04 10.84SNF20080731-000 - - -12.22 10.14SN2004gc 2MASXJ05214980+0640372 E-S0 -11.79 10.31SNF20061111-002 - - -9.300 9.016SNF20080803-000 2MASXJ17000690+2307533 Sab -9.934 11.26SNF20080623-001 WINGSJ181139.70+501057.1 - -10.05 8.857PTF09foz 2MASXJ00421192-0952551 S0 -11.34 10.49SNF20070417-002 2MASXJ13205225+2119452 E -11.03 10.85SNF20080512-010 UGC 10261 E-S0 -12.26 11.51SNF20051113-000 - - -8.839 7.506SNF20061021-003 2MASXJ00361351+0710004 S -8.890 11.17SNF20080612-003 2MASXJ16152860+1913344 E -9.348 10.17SNF20070712-000 2MASXJ17461117+5516000 E -10.61 10.05

Conclusions
17/18
I We studied how the peculiar velocities of SNe Ia in galaxy clustersaffect the distance measurements by matching 145 SNFACTORY
supernovae with known clusters of galaxies.I The applied technique allowed to decrease the spread on the Hubble
diagram. The wRMS is improved from 0.150m to 0.149m with 1.7-σsignificance.
I For the SN Ia in clusters wRMS is improved from 0.121m to 0.103m
with 2.4-σ significance.I SNe Ia in clusters have smaller dispersion on the Hubble diagram
than ones outside the clusters, i.e. represent more standard subclassof supernovae (1.8-σ significance). The separate fit of twosubsamples shows the difference in α, β, and MB parameters.
I The described effect influences the distance measurements in thenearby Universe (z < 0.1) and has to be taken into account in futurecosmological surveys.
18/18
IntroductionData
ResultsConclusions
Merci pour votre attention !
P.-F. Leget et al. SN Ia in clusters of galaxies: the impact on distance measurements