Embed Size (px)
Citation preview
Addition to the Lecture on Galactic Evolution
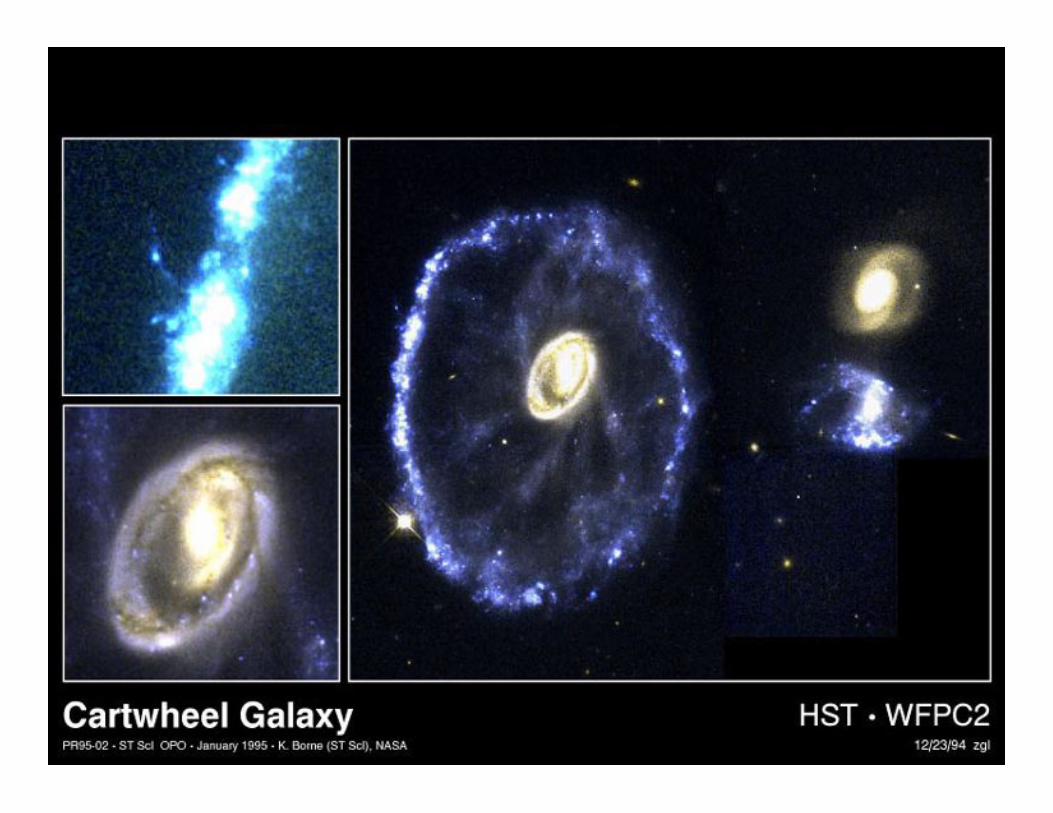
Rapid Encounters • In case the encounter of two galaxies is quite fast, there will be not
much dynamical friction due to lack of the density enhancement • The potential energy of the galaxies remain unchanged • The internal kinetic energy increases in the collision • When regaining equilibrium after the collision, the gained energy is
dissipated by • Increasing the gravitational potential leading to a slight
expansion of the galaxies • After regaining equilibrium a ring may have formed
• Tidal forces removing mass from the galaxies (tidal stripping)
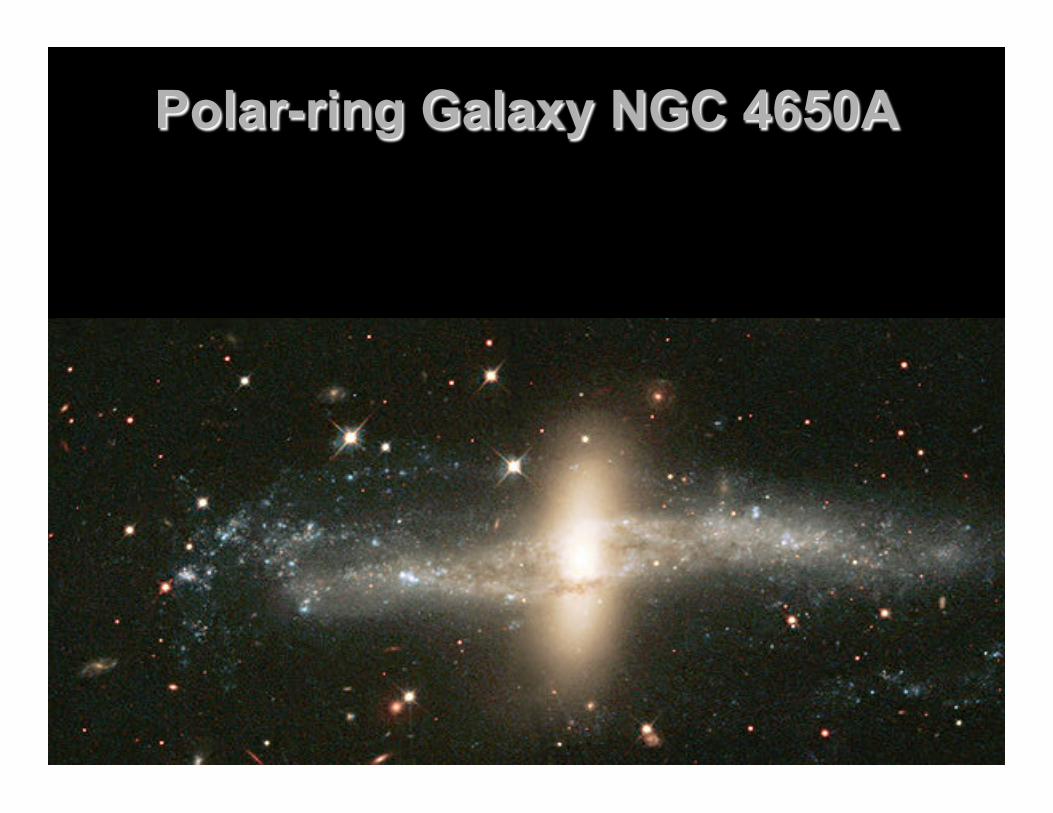
Polar-ring Galaxy NGC 4650A
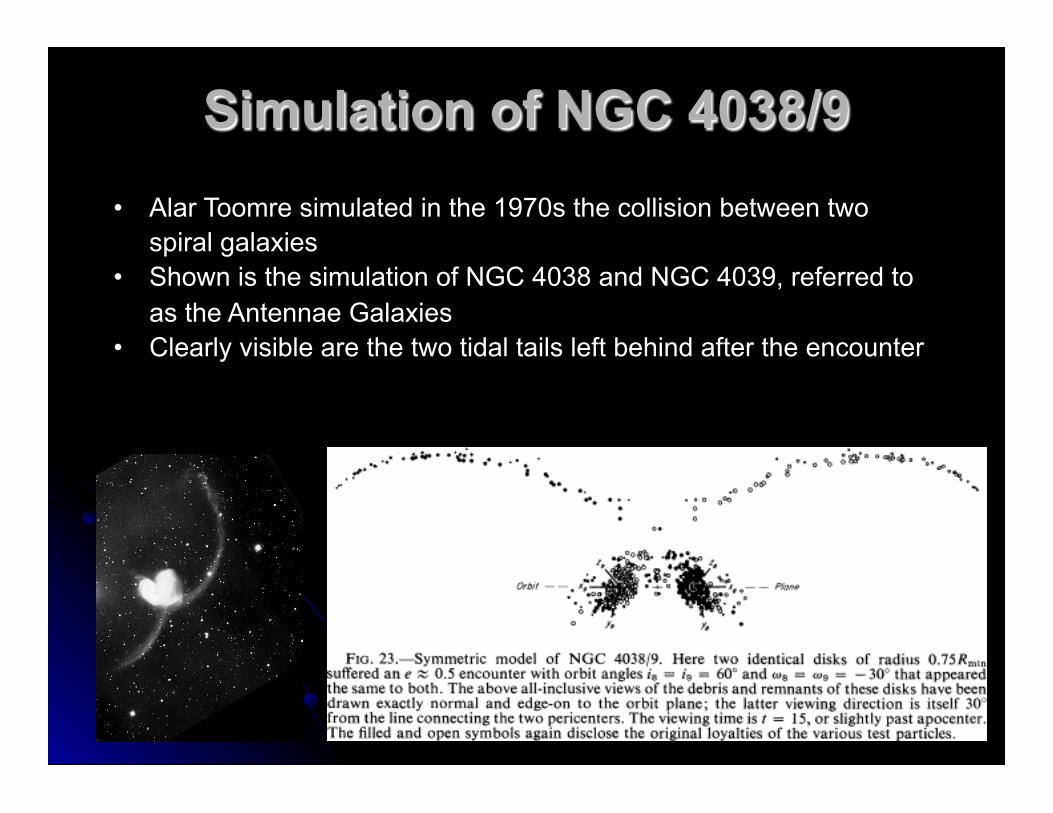
Simulation of NGC 4038/9 • Alar Toomre simulated in the 1970s the collision between two
spiral galaxies • Shown is the simulation of NGC 4038 and NGC 4039, referred to
as the Antennae Galaxies • Clearly visible are the two tidal tails left behind after the encounter
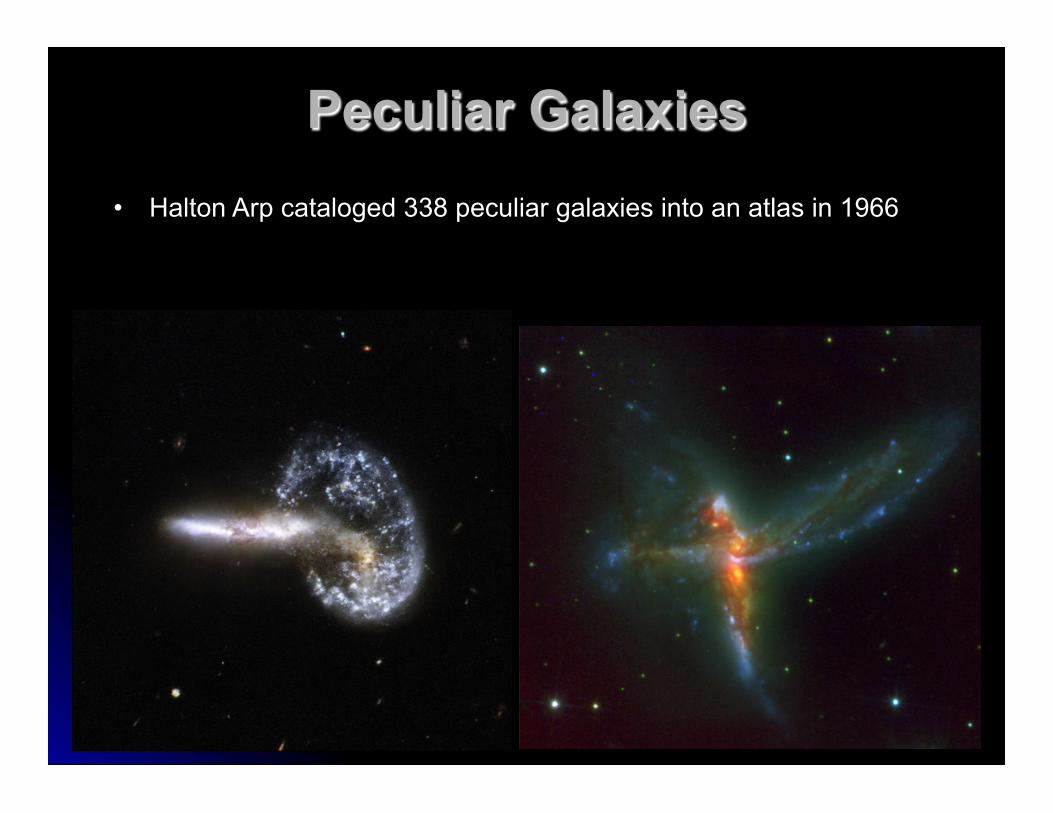
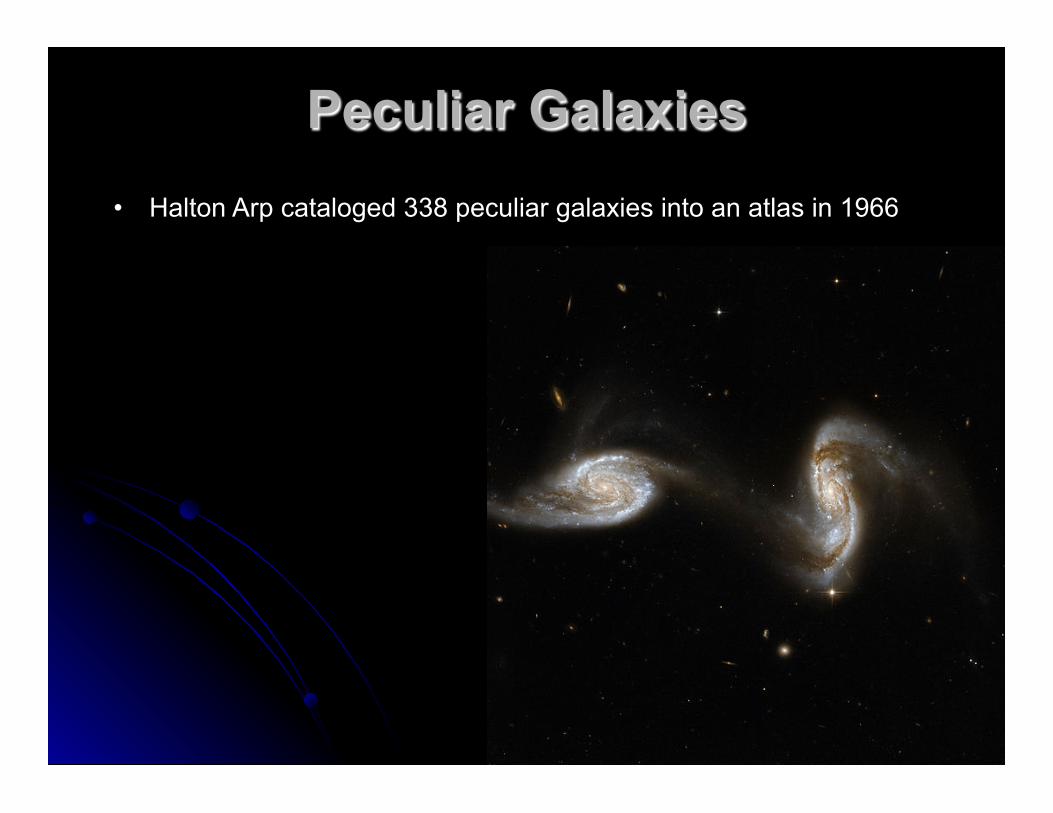
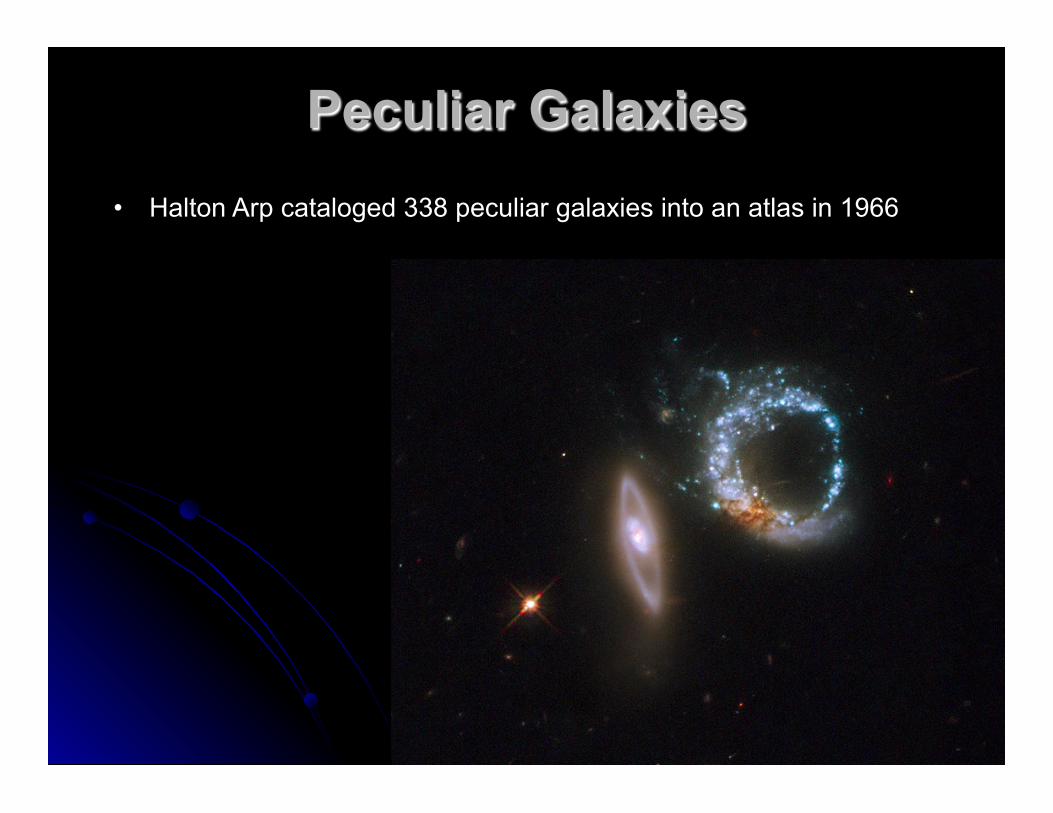
Peculiar Galaxies • Halton Arp cataloged 338 peculiar galaxies into an atlas in 1966
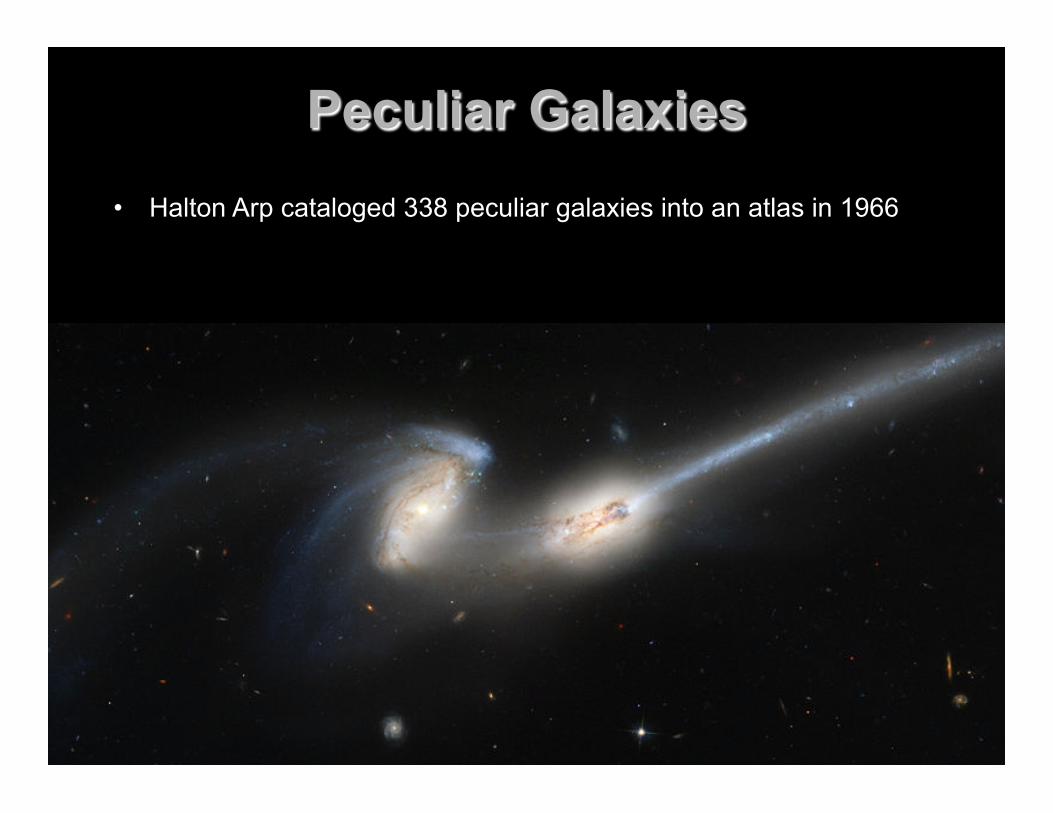
Peculiar Galaxies • Halton Arp cataloged 338 peculiar galaxies into an atlas in 1966
Peculiar Galaxies • Halton Arp cataloged 338 peculiar galaxies into an atlas in 1966
Peculiar Galaxies • Halton Arp cataloged 338 peculiar galaxies into an atlas in 1966
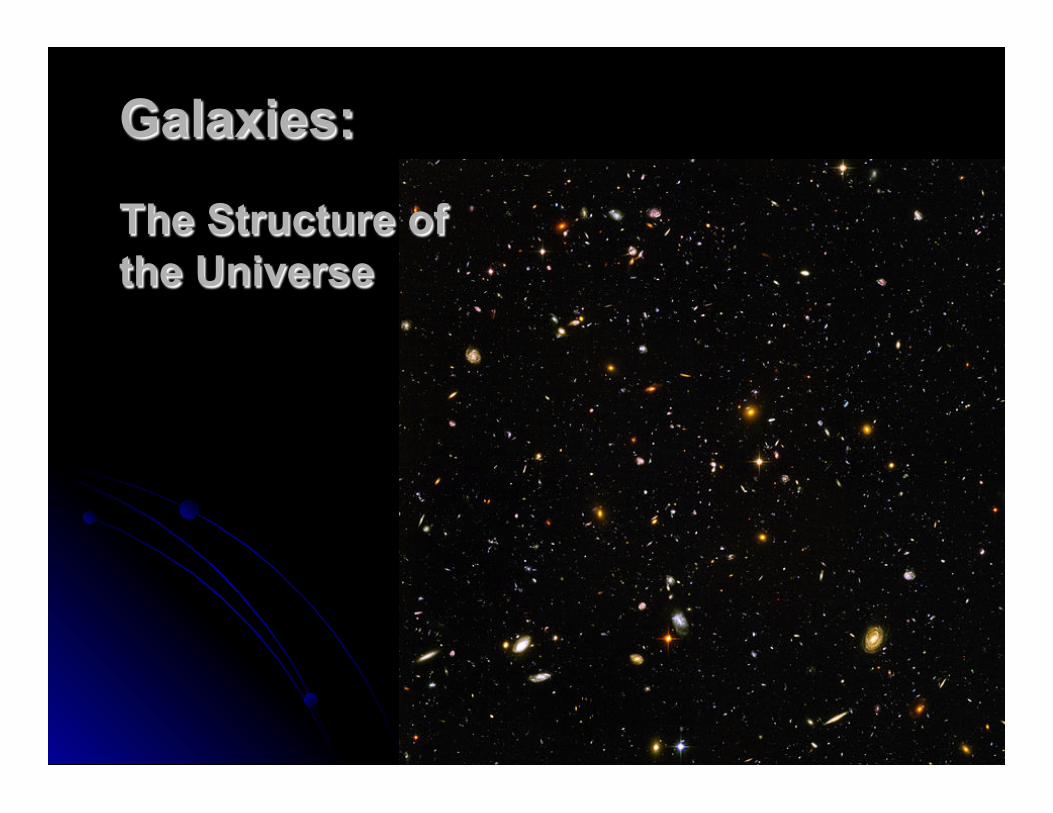
Galaxies: The Structure of the Universe
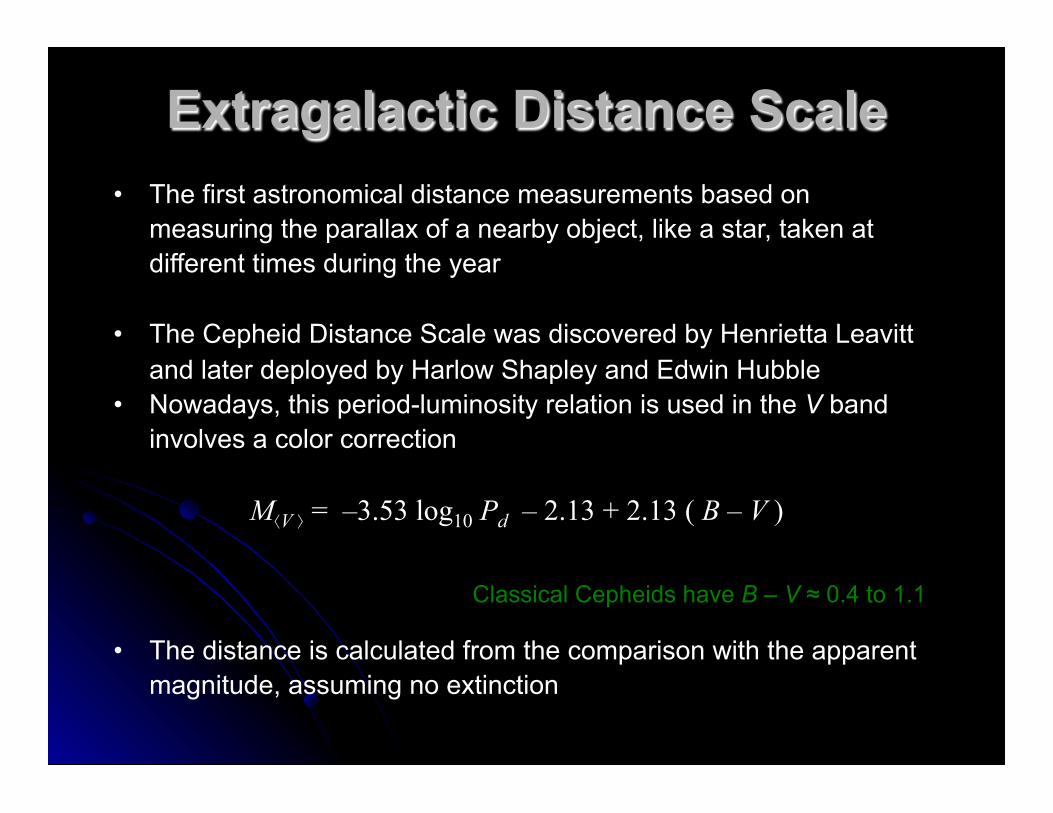
Extragalactic Distance Scale • The first astronomical distance measurements based on
measuring the parallax of a nearby object, like a star, taken at different times during the year
• The Cepheid Distance Scale was discovered by Henrietta Leavitt and later deployed by Harlow Shapley and Edwin Hubble
• Nowadays, this period-luminosity relation is used in the V band involves a color correction
• The distance is calculated from the comparison with the apparent magnitude, assuming no extinction
M⟨V ⟩ = –3.53 log10 Pd – 2.13 + 2.13 ( B – V )
Classical Cepheids have B – V ≈ 0.4 to 1.1
Extragalactic Distance Scale • In 1928, Edwin Hubble detected Cepheids in the Andromeda
galaxy and estimated the distance to be 285 kpc, compared to the modern value of 770 kpc
• This established the Andromeda galaxy as the first object outside our Milky Way galaxy
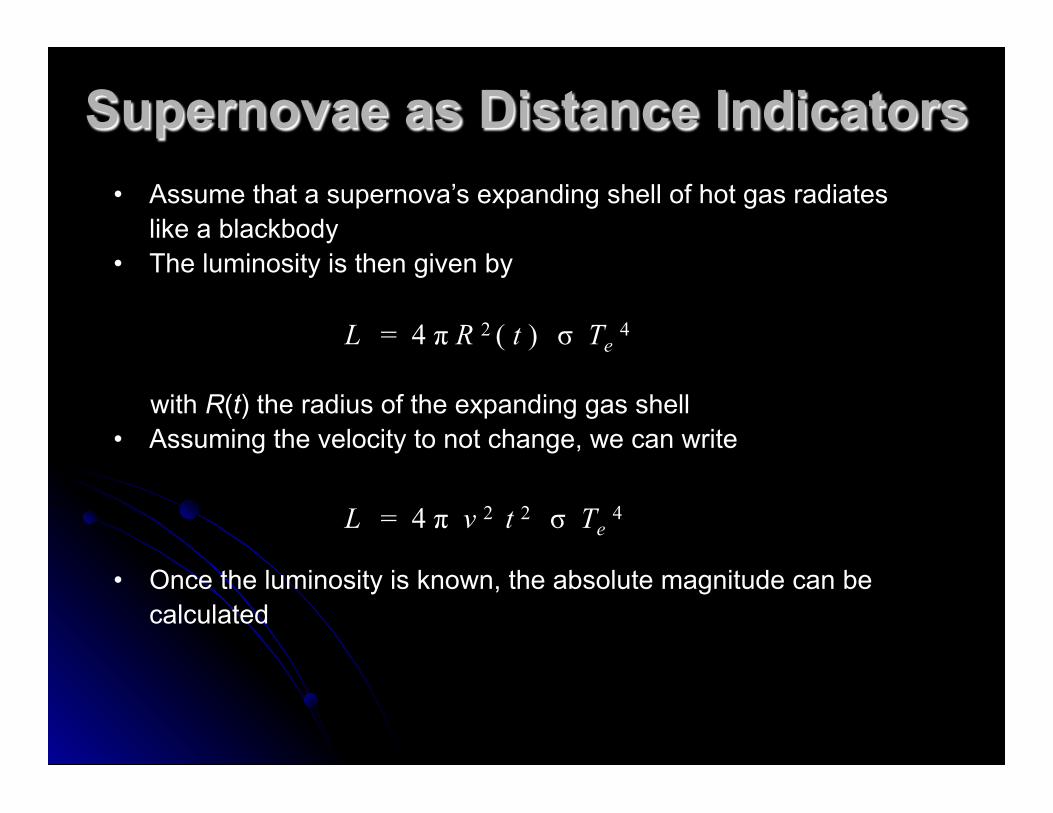
Supernovae as Distance Indicators • Assume that a supernova’s expanding shell of hot gas radiates
like a blackbody • The luminosity is then given by
with R(t) the radius of the expanding gas shell • Assuming the velocity to not change, we can write
• Once the luminosity is known, the absolute magnitude can be calculated
L = 4 π R 2 ( t ) σ Te 4
L = 4 π v 2 t 2 σ Te 4
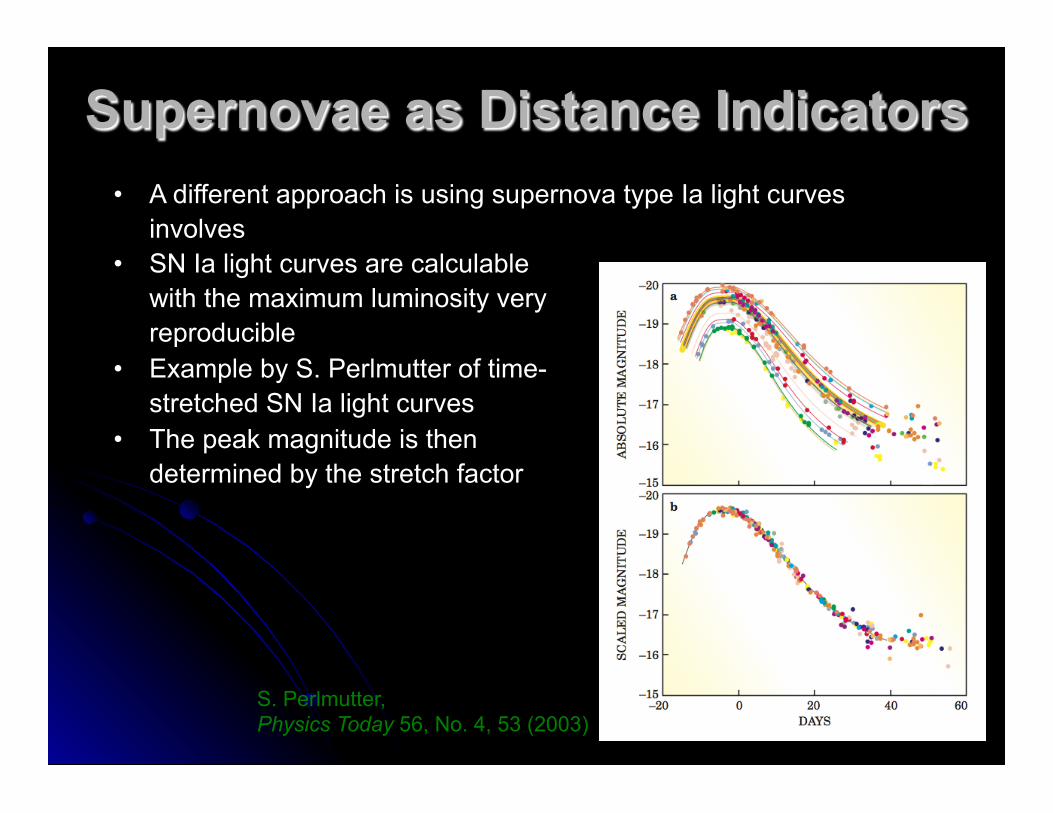
Supernovae as Distance Indicators • A different approach is using supernova type Ia light curves
involves • SN Ia light curves are calculable
with the maximum luminosity very reproducible
• Example by S. Perlmutter of time-stretched SN Ia light curves
• The peak magnitude is then determined by the stretch factor
S. Perlmutter, Physics Today 56, No. 4, 53 (2003)
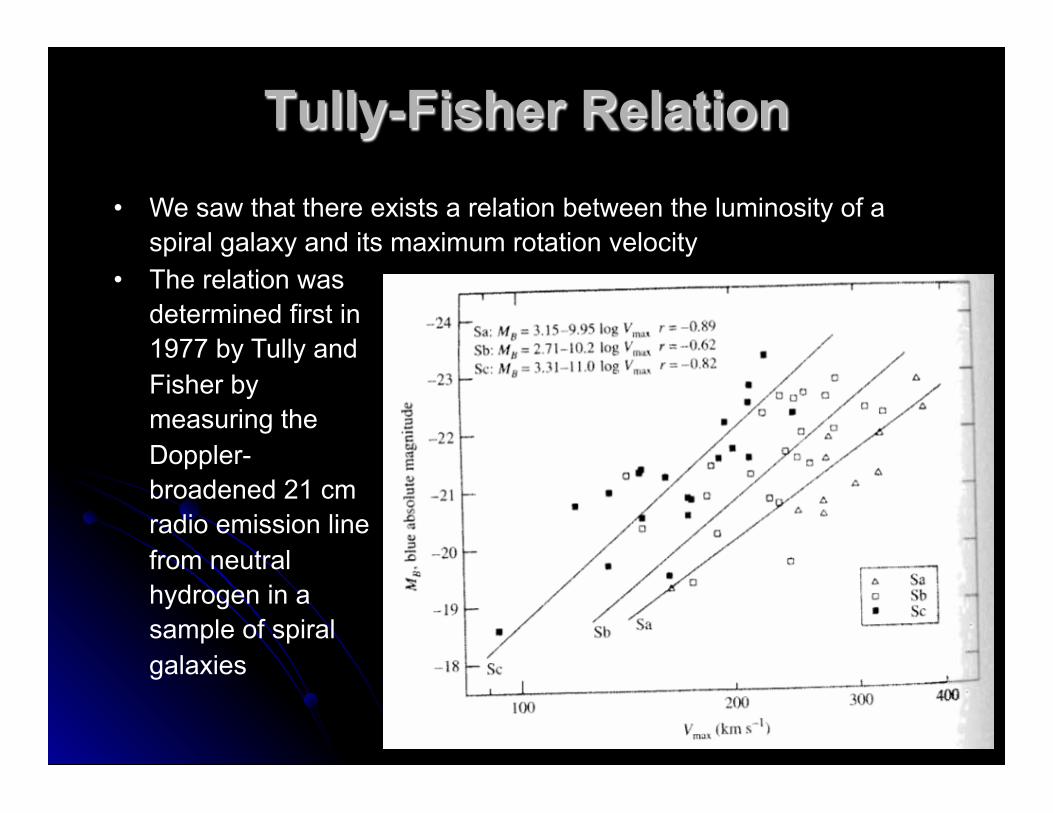
Tully-Fisher Relation • We saw that there exists a relation between the luminosity of a
spiral galaxy and its maximum rotation velocity • The relation was
determined first in 1977 by Tully and Fisher by measuring the Doppler-broadened 21 cm radio emission line from neutral hydrogen in a sample of spiral galaxies
Globular Cluster Luminosity Function
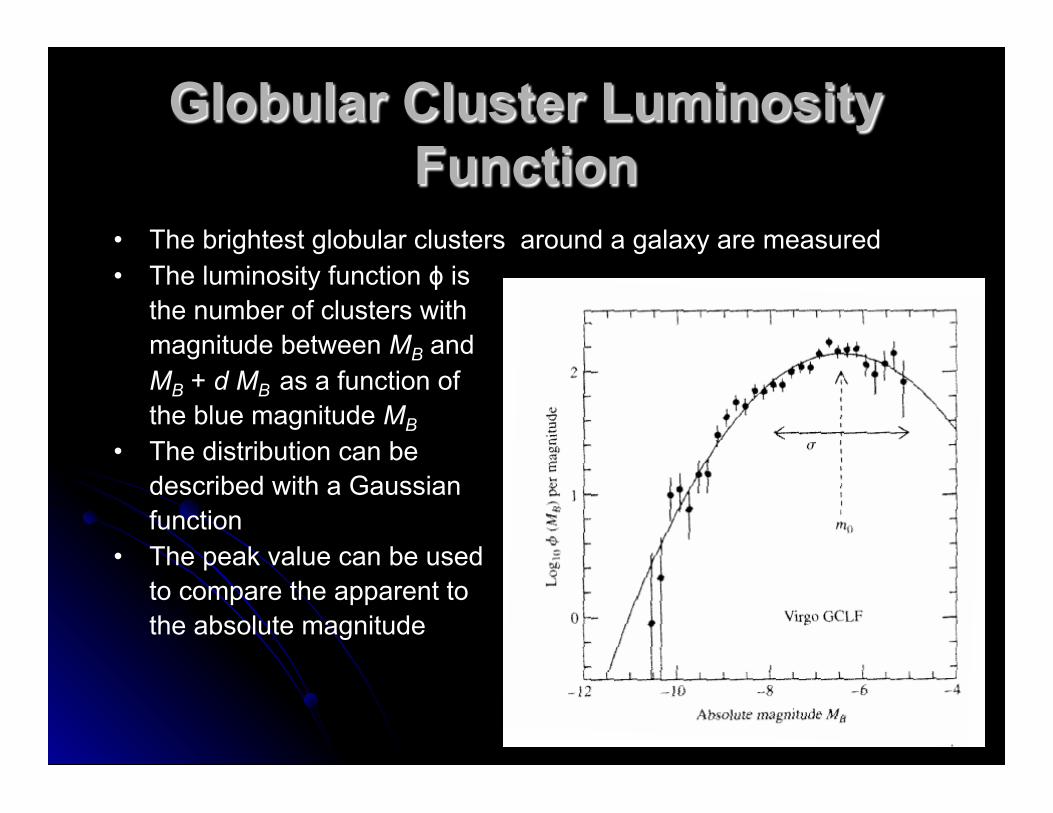
• The brightest globular clusters around a galaxy are measured • The luminosity function ϕ is
the number of clusters with magnitude between MB and MB + d MB as a function of the blue magnitude MB
• The distribution can be described with a Gaussian function
• The peak value can be used to compare the apparent to the absolute magnitude
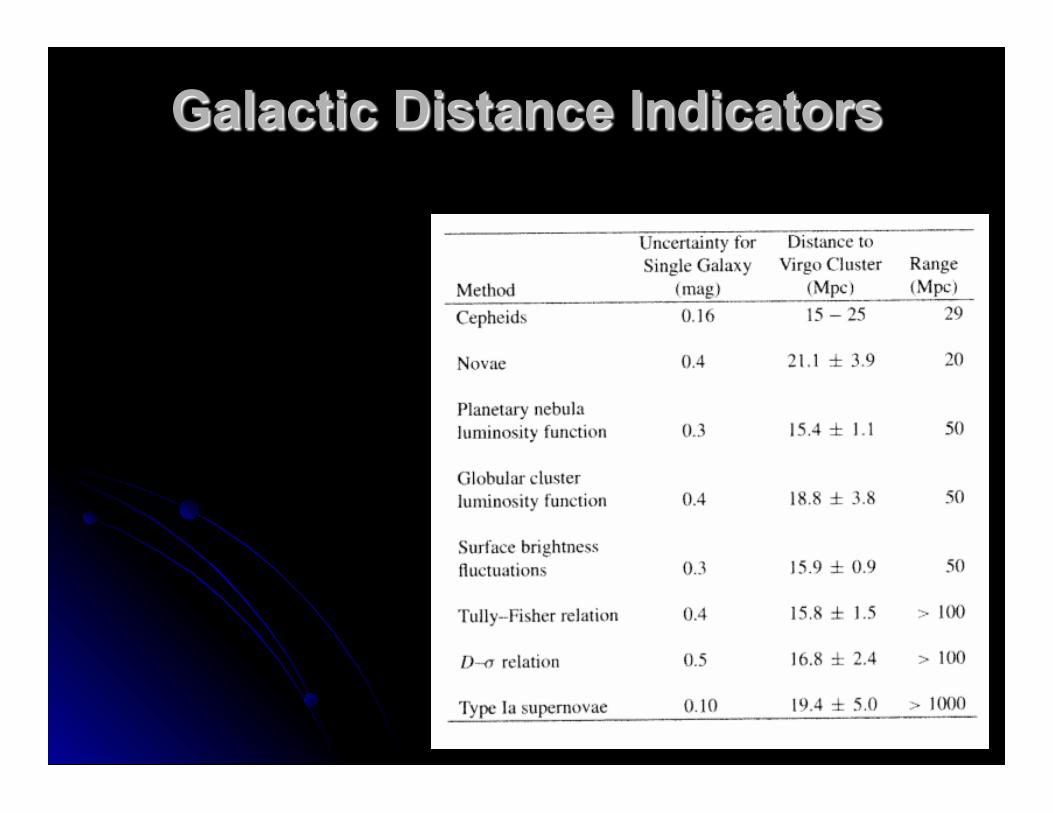
Galactic Distance Indicators
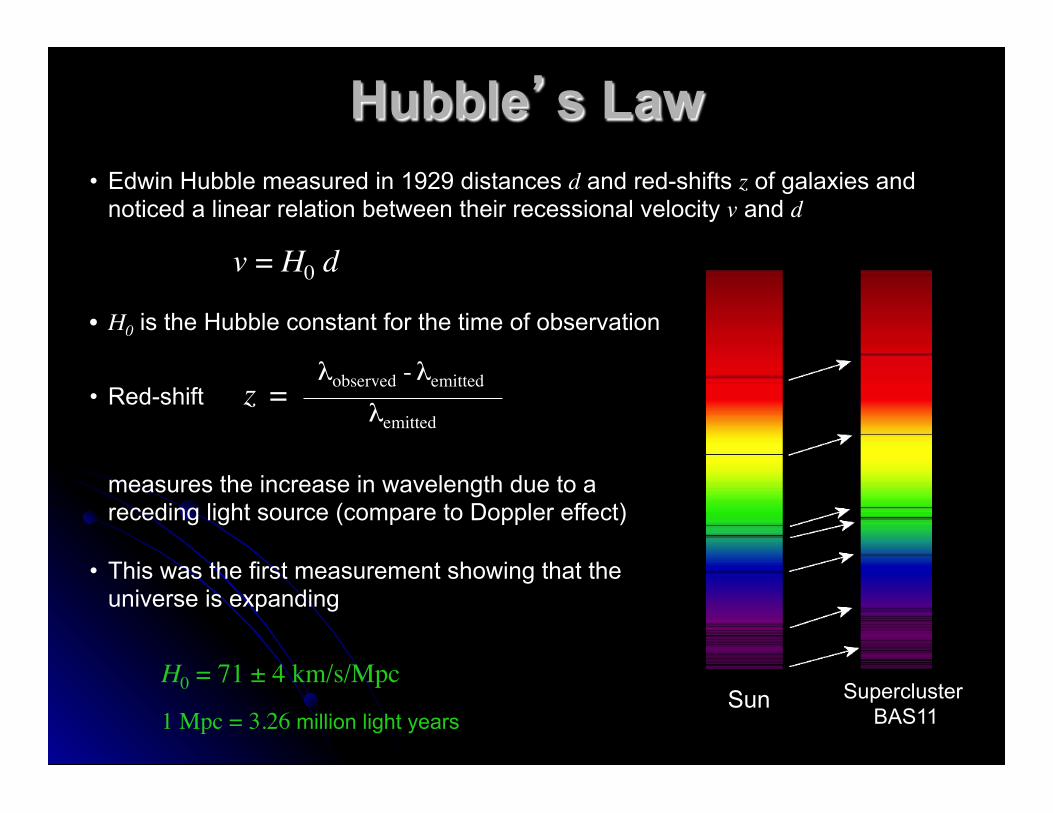
Hubble’s Law • Edwin Hubble measured in 1929 distances d and red-shifts z of galaxies and
noticed a linear relation between their recessional velocity v and d
v = H0 d
• H0 is the Hubble constant for the time of observation
• Red-shift z =
measures the increase in wavelength due to a receding light source (compare to Doppler effect)
• This was the first measurement showing that the
universe is expanding
Supercluster BAS11
Sun
λobserved - λemitted
λemitted
H0 = 71 ± 4 km/s/Mpc 1 Mpc = 3.26 million light years
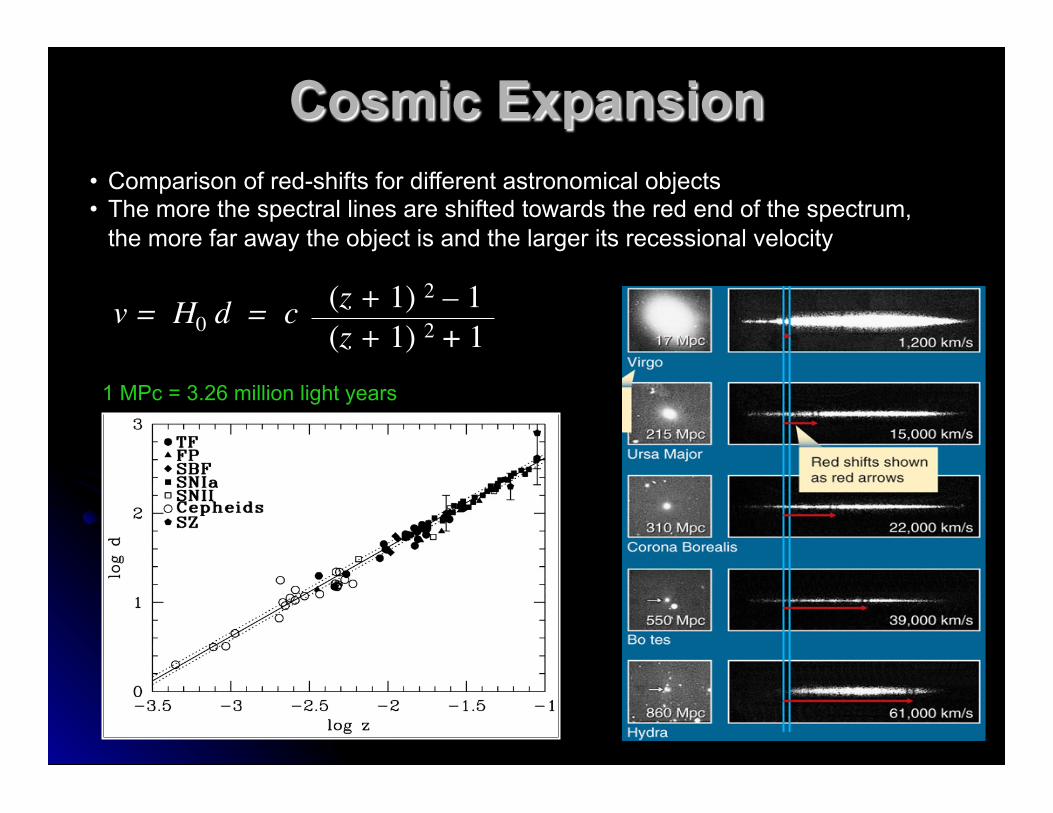
• Comparison of red-shifts for different astronomical objects • The more the spectral lines are shifted towards the red end of the spectrum,
the more far away the object is and the larger its recessional velocity
(z + 1) 2 – 1
Cosmic Expansion
v = H0 d = c
1 MPc = 3.26 million light years
(z + 1) 2 + 1