Embed Size (px)
Citation preview
Physics 315 Spring 2011Physics 315 Spring 2011
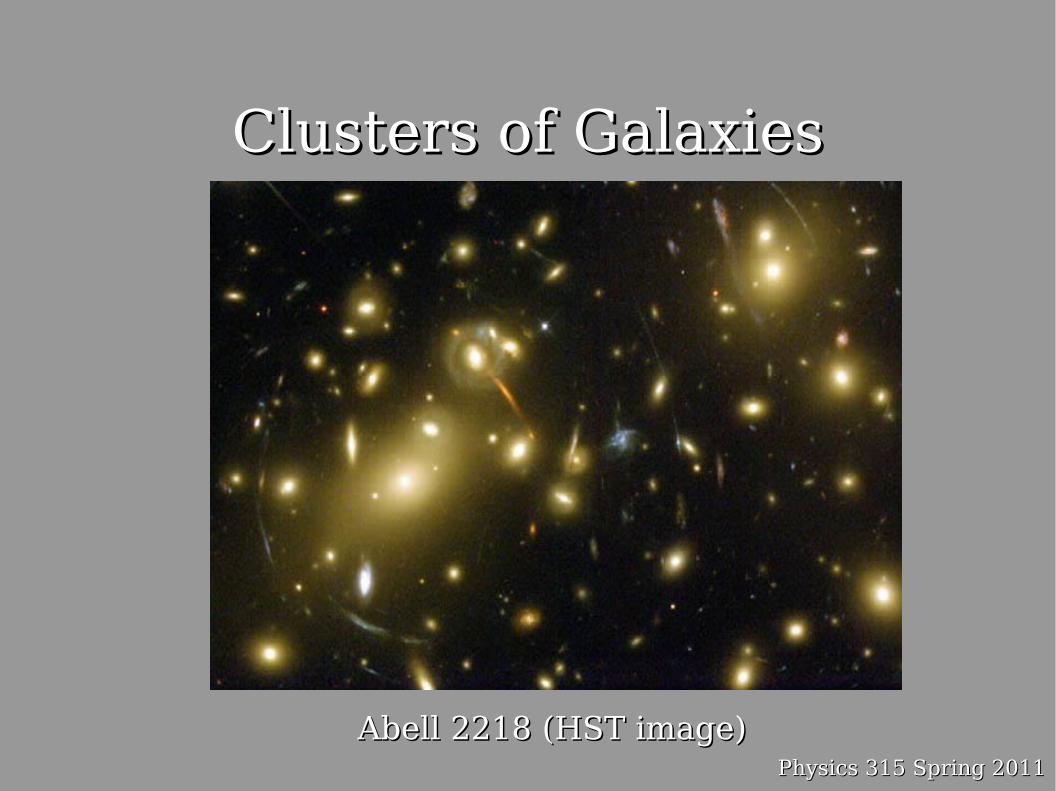
Clusters of GalaxiesClusters of Galaxies
Abell 2218 (HST image)Abell 2218 (HST image)
Physics 315 Spring 2011Physics 315 Spring 2011
Galaxies are not uniformly distributed Galaxies are not uniformly distributed on the “small” scale. on the “small” scale.
~90% of all galaxies are in clusters or ~90% of all galaxies are in clusters or groups of galaxies.groups of galaxies.
These structures form sheets and These structures form sheets and flaments on the skyflaments on the sky
Groups contain 3 – 50 galaxiesGroups contain 3 – 50 galaxies
Masses are 10Masses are 101212 – 10 – 101313 M Msunsun
Clusters can have more than 1000 Clusters can have more than 1000 galaxiesgalaxies
Masses up to 10Masses up to 101515 M Msunsun
Physics 315 Spring 2011Physics 315 Spring 2011
Clusters and groups have very similar Clusters and groups have very similar sizes. sizes.
Clusters span 1-3 MpcClusters span 1-3 Mpc
Groups span 0.25-1 MpcGroups span 0.25-1 Mpc
In general Clusters a much denser In general Clusters a much denser environmentsenvironments
Compact groups can be as dense as Compact groups can be as dense as clustersclusters
Physics 315 Spring 2011Physics 315 Spring 2011
Physics 315 Spring 2011Physics 315 Spring 2011
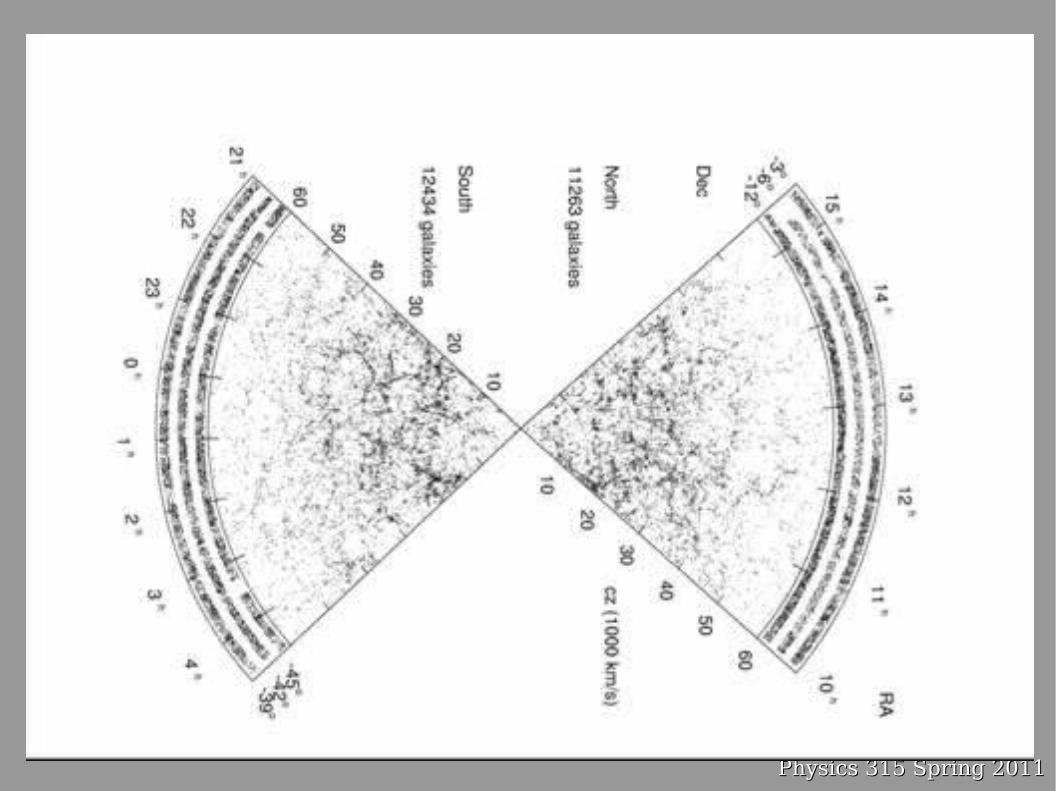
These large scale structures cause These large scale structures cause peculiar velocities, deviations from the peculiar velocities, deviations from the Hubble fow, due to their gravitational Hubble fow, due to their gravitational attraction. attraction. We can use large galaxy redshift surveys We can use large galaxy redshift surveys to trace the mass distribution of the to trace the mass distribution of the universe and measure universe and measure mm
The amount of clustering we observe also The amount of clustering we observe also provides strong constraints on the amount provides strong constraints on the amount and type of dark matter in the universe and type of dark matter in the universe and the energy density.and the energy density.
Physics 315 Spring 2011Physics 315 Spring 2011
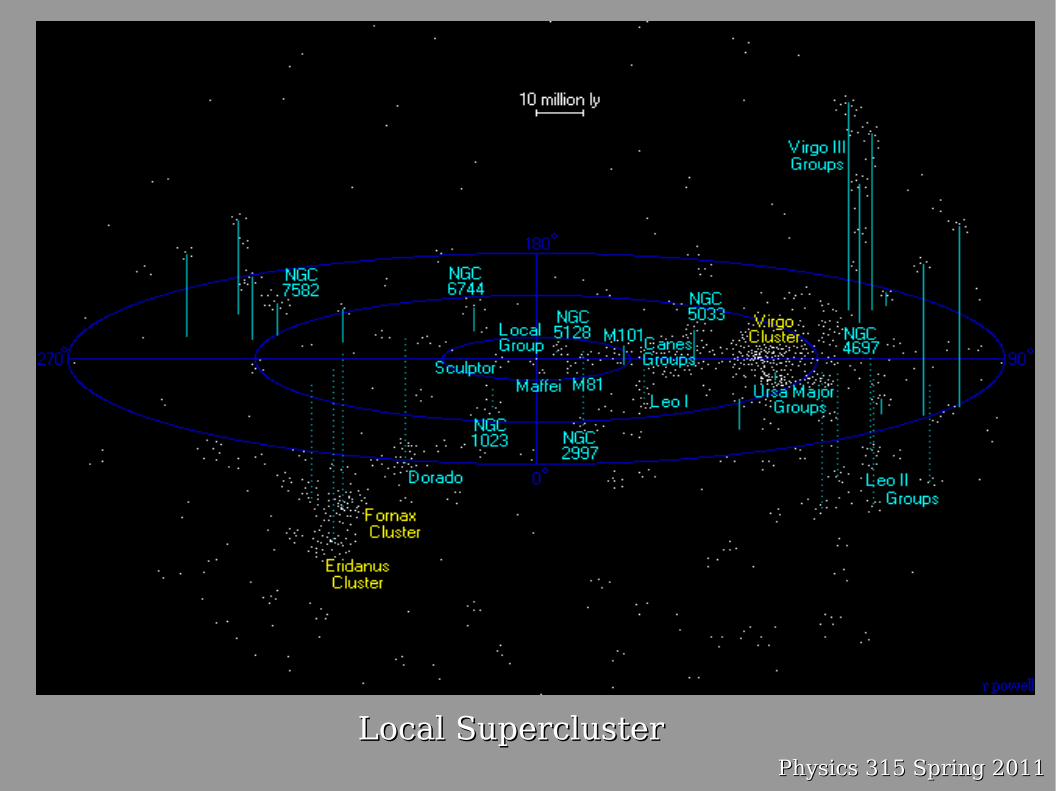
Local SuperclusterLocal Supercluster
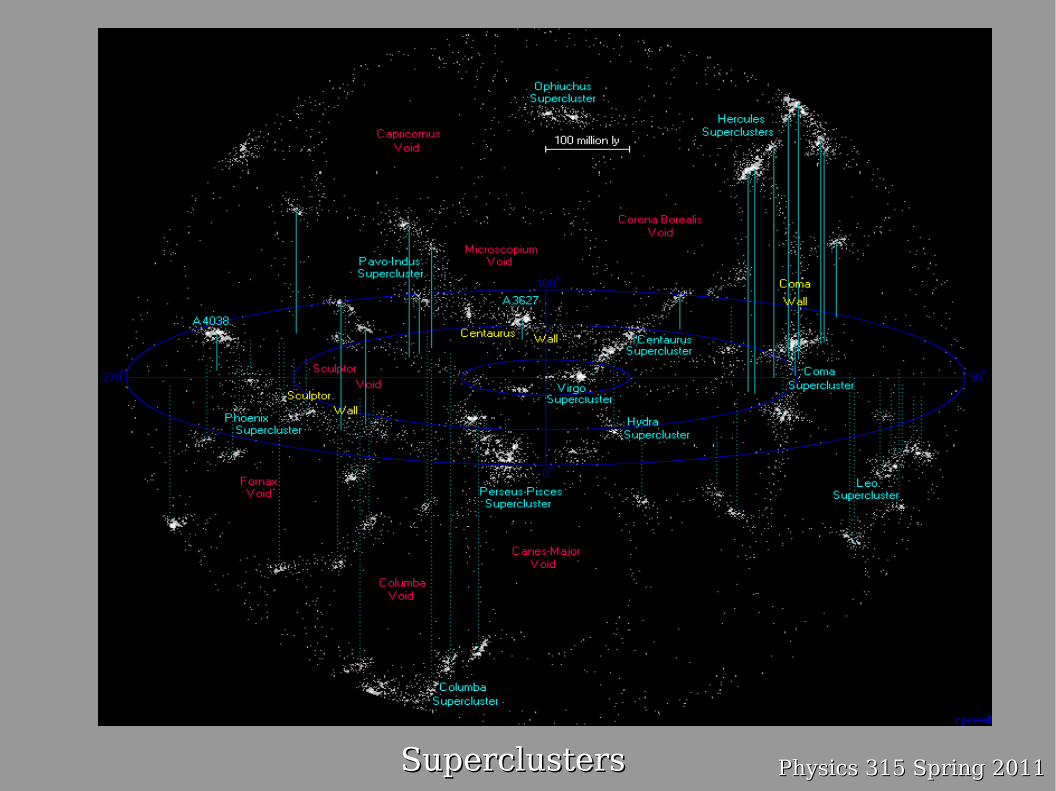
Physics 315 Spring 2011Physics 315 Spring 2011SuperclustersSuperclusters
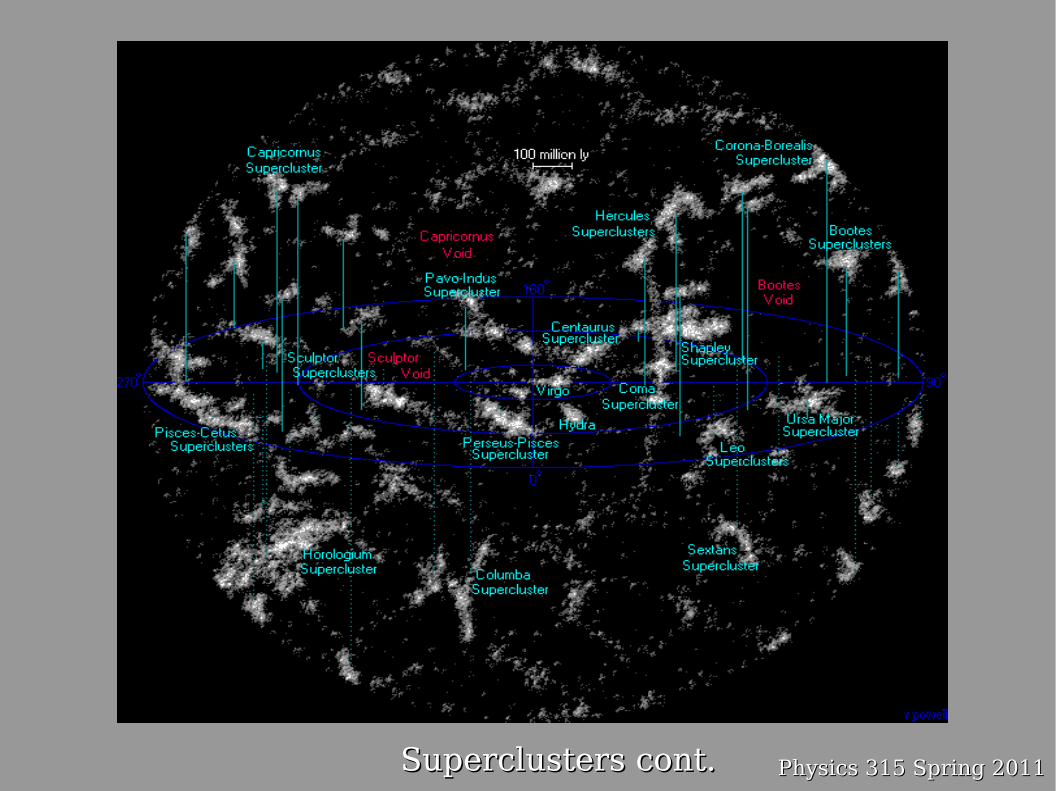
Physics 315 Spring 2011Physics 315 Spring 2011Superclusters cont.Superclusters cont.
Physics 315 Spring 2011Physics 315 Spring 2011
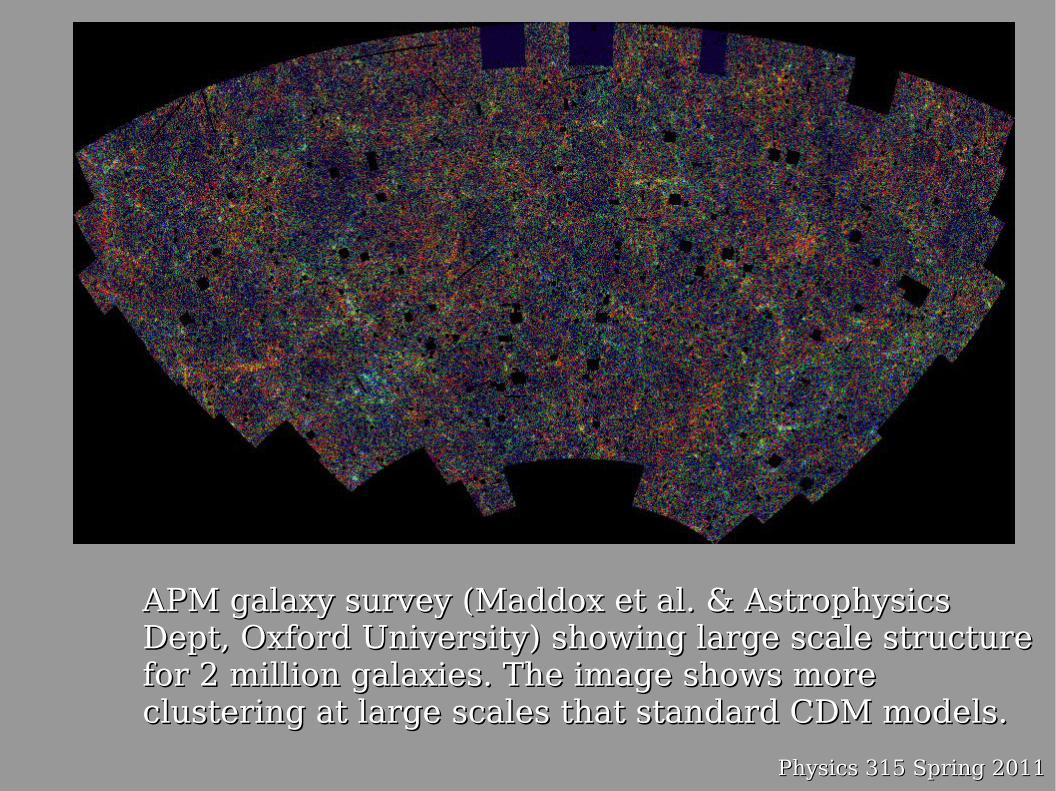
APM galaxy survey (Maddox et al. & Astrophysics APM galaxy survey (Maddox et al. & Astrophysics Dept, Oxford University) showing large scale structureDept, Oxford University) showing large scale structurefor 2 million galaxies. The image shows more for 2 million galaxies. The image shows more clustering at large scales that standard CDM models.clustering at large scales that standard CDM models.
Physics 315 Spring 2011Physics 315 Spring 2011
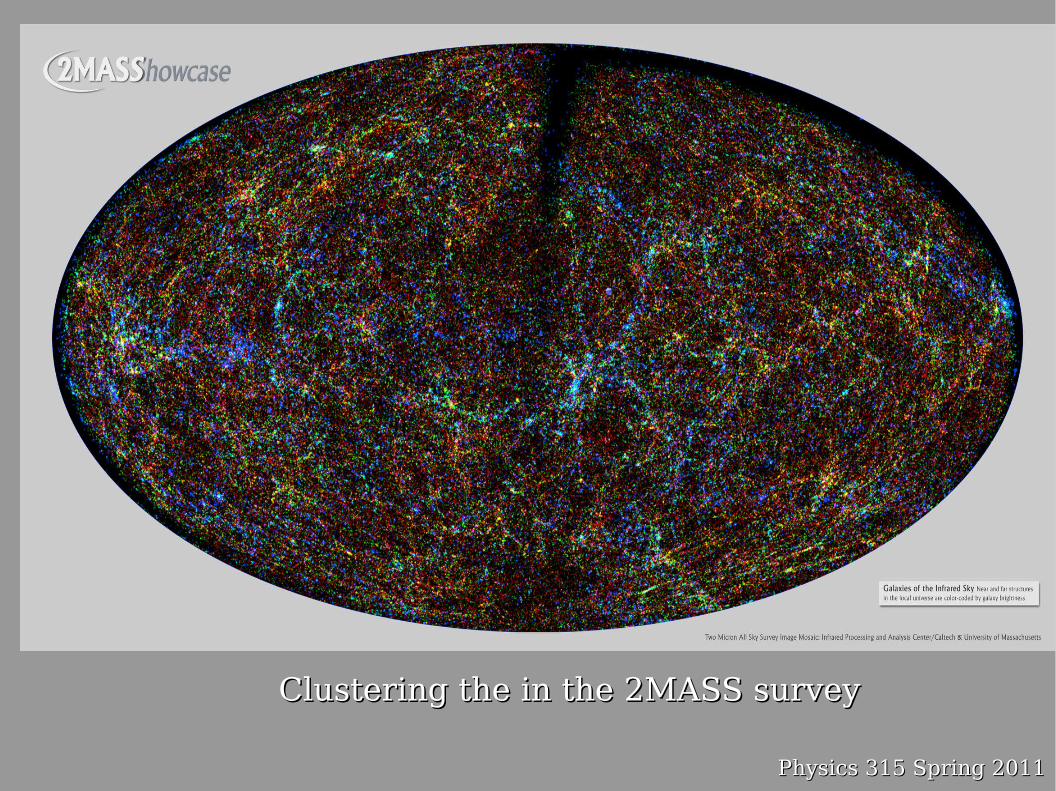
Clustering the in the 2MASS surveyClustering the in the 2MASS survey
Physics 315 Spring 2011Physics 315 Spring 2011
Redshift SurveysRedshift SurveysIn the 1980’s large scale redshift surveys, allowed us to In the 1980’s large scale redshift surveys, allowed us to measure clustering in 3 dimensions, instead of just twomeasure clustering in 3 dimensions, instead of just two
The frst large scale redshift survey was the CfA2 The frst large scale redshift survey was the CfA2 (Center for Astrophysics) survey led by Margaret Geller (Center for Astrophysics) survey led by Margaret Geller & John Huchra started in 1984 to 1995.& John Huchra started in 1984 to 1995.
There was a CfA1 survey 1977-1982, 2500 galaxies with There was a CfA1 survey 1977-1982, 2500 galaxies with b<14.5 (Huchra, Davis, Latham, & Tonry) b<14.5 (Huchra, Davis, Latham, & Tonry)
CfA2 observed 20,000 galaxies brighter than B=15.5 CfA2 observed 20,000 galaxies brighter than B=15.5 with a 1.5 m telescope. with a 1.5 m telescope.
This was done one redshift at a time, a massive This was done one redshift at a time, a massive undertaking!undertaking!
Later the Las Campanas Redshift Survey was done in Later the Las Campanas Redshift Survey was done in the south (with multiobject spectroscopy), ~25000 the south (with multiobject spectroscopy), ~25000 galaxies covering 700 square degrees of the sky to galaxies covering 700 square degrees of the sky to r=17.5. Finished in the mid-1990’s.r=17.5. Finished in the mid-1990’s.
Physics 315 Spring 2011Physics 315 Spring 2011
Redshift Surveys cont.Redshift Surveys cont.The CfA2 redshift survey revealed surprising The CfA2 redshift survey revealed surprising amounts of large scale structure (LSS) in the amounts of large scale structure (LSS) in the universeuniverse
There are flaments, walls, and voidsThere are flaments, walls, and voidsVoids are “3500-5000 km/s” in diameter or >50hVoids are “3500-5000 km/s” in diameter or >50h -1-1 Mpc acrossMpc across
The “Great Wall” stretches for 100hThe “Great Wall” stretches for 100h-1-1 Mpc or ¼ of Mpc or ¼ of the way across the sky! the way across the sky!
The universe is like a sponge or perhaps a pile of The universe is like a sponge or perhaps a pile of soap bubbles!soap bubbles!
Note that walls appear thinner in redshift Note that walls appear thinner in redshift space than they really are.space than they really are.
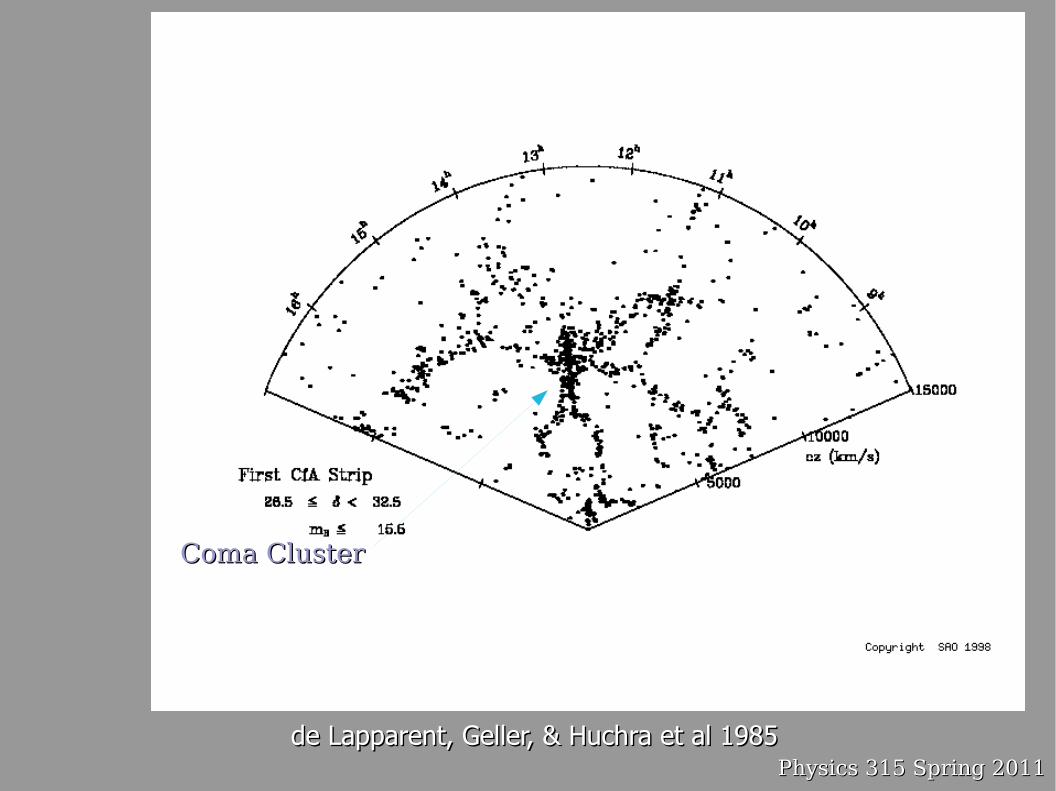
Clusters (like Coma) appear elongated – this Clusters (like Coma) appear elongated – this is the “Finger of God” efect. is the “Finger of God” efect.
Physics 315 Spring 2011Physics 315 Spring 2011
Coma ClusterComa Cluster
de Lapparent, Geller, & Huchra et al 1985de Lapparent, Geller, & Huchra et al 1985
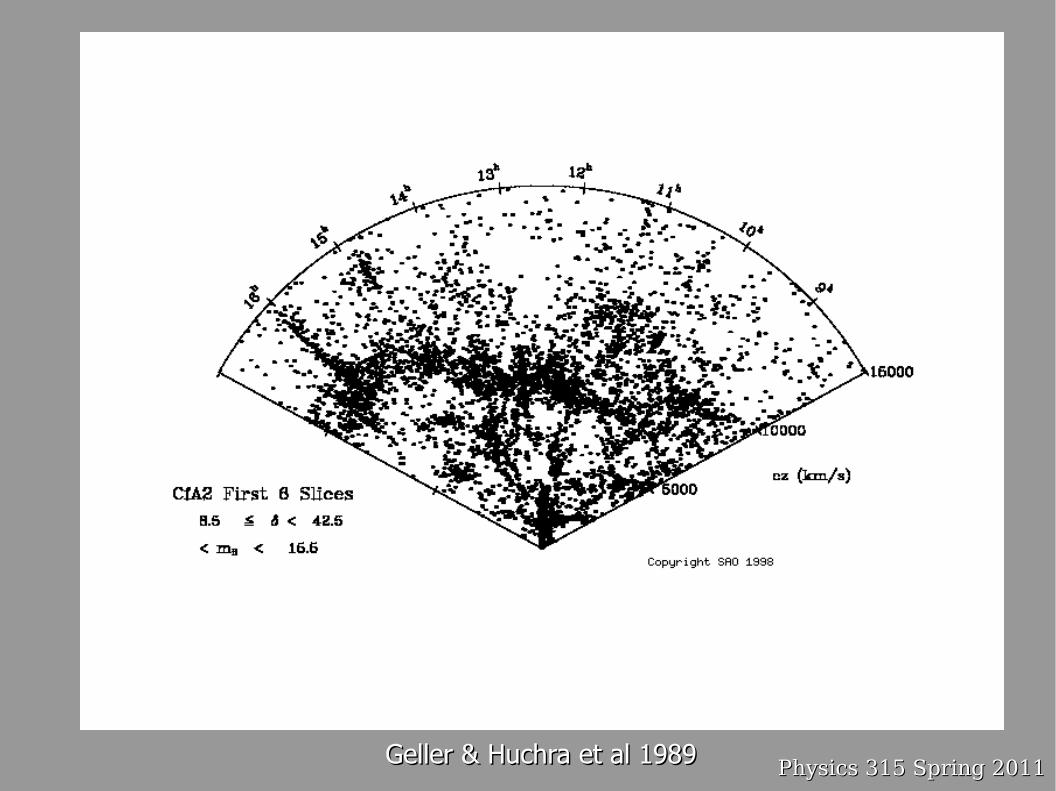
Physics 315 Spring 2011Physics 315 Spring 2011Geller & Huchra et al 1989Geller & Huchra et al 1989
Physics 315 Spring 2011Physics 315 Spring 2011
Redshift Surveys cont.Redshift Surveys cont.Recently there have been two large redshift surveys Recently there have been two large redshift surveys undertakenundertaken
The 2dF (2 degree Field) redshift survey done with the The 2dF (2 degree Field) redshift survey done with the Anglo-Australian telescope Anglo-Australian telescope
~220,000 galaxies covering 5% of the sky reaching to ~220,000 galaxies covering 5% of the sky reaching to z~0.3 with B<19.5z~0.3 with B<19.5
Their spectrograph can measure 400 redshifts at a timeTheir spectrograph can measure 400 redshifts at a time
The Sloan Digital Sky Survey (SDSS) which uses a The Sloan Digital Sky Survey (SDSS) which uses a dedicated 2.5m telescope at Apache Point Observatory dedicated 2.5m telescope at Apache Point Observatory in New Mexicoin New Mexico
Does multicolor imaging to r=22.5 and spectra of galaxies Does multicolor imaging to r=22.5 and spectra of galaxies down to r<17.5 reaching to z~0.4, ~500 redshifts at a down to r<17.5 reaching to z~0.4, ~500 redshifts at a timetimeTo date (~930,000 redshifts DR7), total goal is 1 millionTo date (~930,000 redshifts DR7), total goal is 1 million
Also measuring redshifts of quasar candidates out to Also measuring redshifts of quasar candidates out to much higher redshifts (Schneider et al.)much higher redshifts (Schneider et al.)
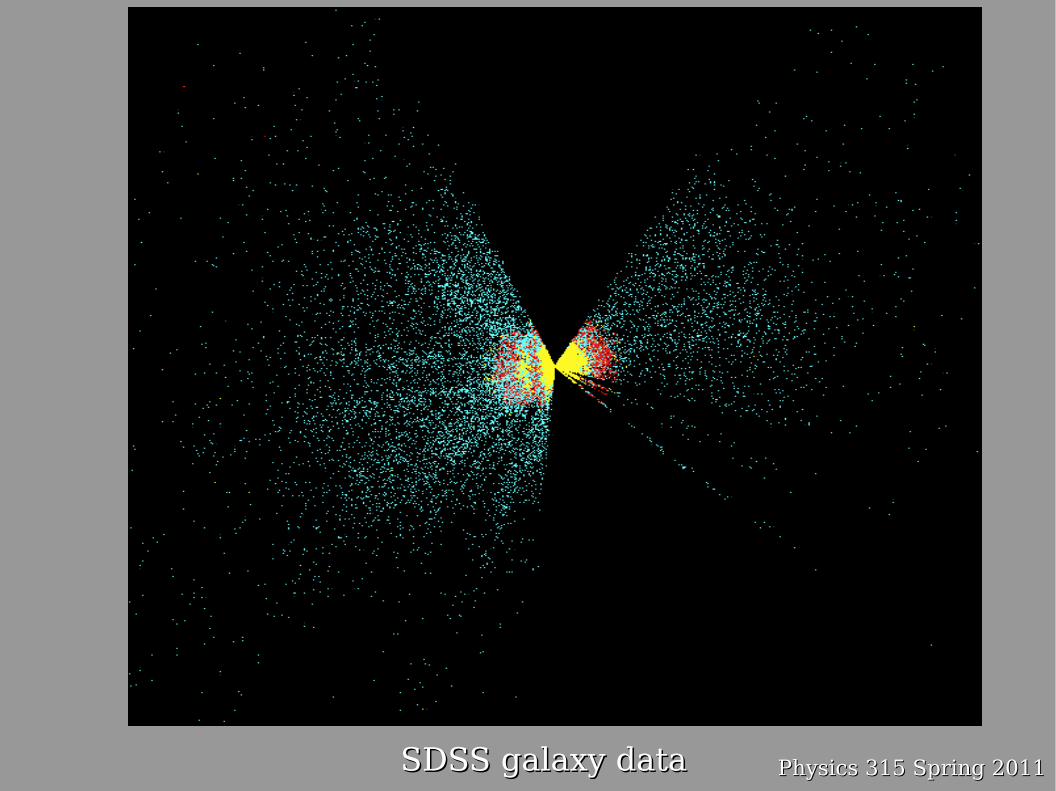
Physics 315 Spring 2011Physics 315 Spring 2011SDSS galaxy dataSDSS galaxy data
Physics 315 Spring 2011Physics 315 Spring 2011
Deeper SurveysDeeper SurveysProbing structure at higher redshifts is Probing structure at higher redshifts is generally done with deep “pencil beam” generally done with deep “pencil beam” surveys in small patches of the sky. surveys in small patches of the sky.
Original pencil beam surveys done by David Original pencil beam surveys done by David Koo, Richard Kron, & collaborators in early Koo, Richard Kron, & collaborators in early 1990’s showed walls showing up at large 1990’s showed walls showing up at large redshiftsredshifts
Originally thought to be periodic, but but this Originally thought to be periodic, but but this turned out not to be trueturned out not to be true
The voids & walls we see locally seems to continue The voids & walls we see locally seems to continue out to z~1out to z~1
Even deeper surveys done with Keck of the Even deeper surveys done with Keck of the Hubble Deep Field and several other deep Hubble Deep Field and several other deep surveys show the same thingsurveys show the same thing
Physics 315 Spring 2011Physics 315 Spring 2011
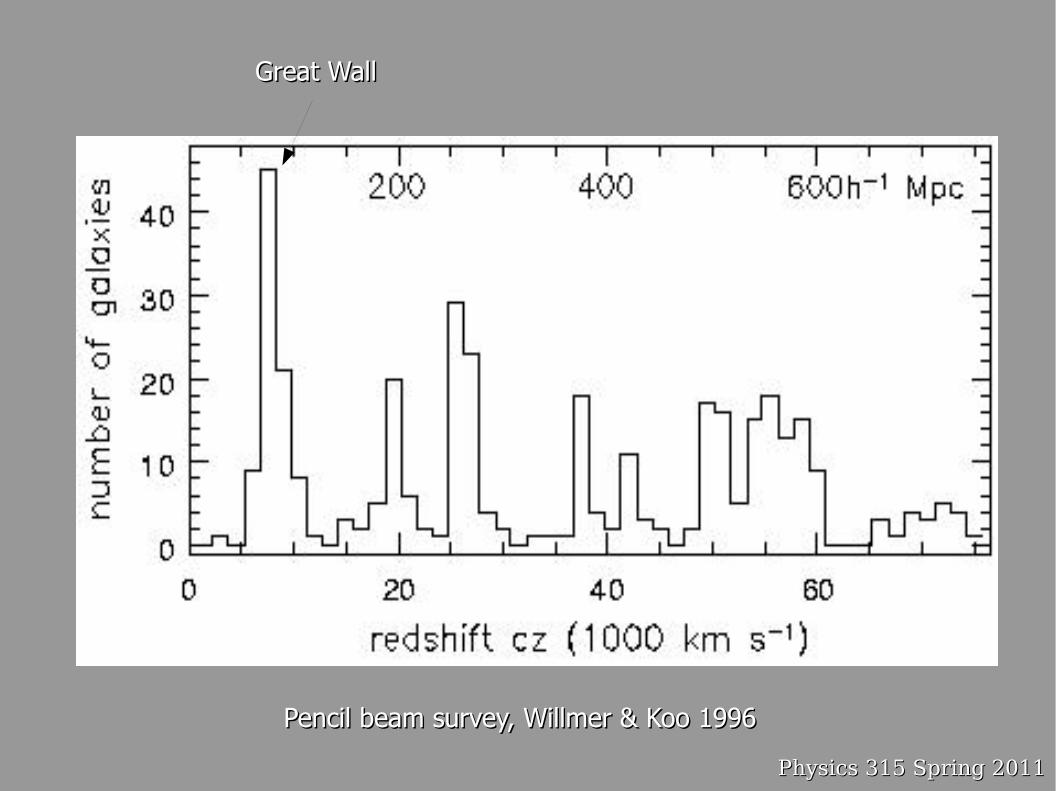
Pencil beam survey, Willmer & Koo 1996Pencil beam survey, Willmer & Koo 1996
Great WallGreat Wall
Physics 315 Spring 2011Physics 315 Spring 2011
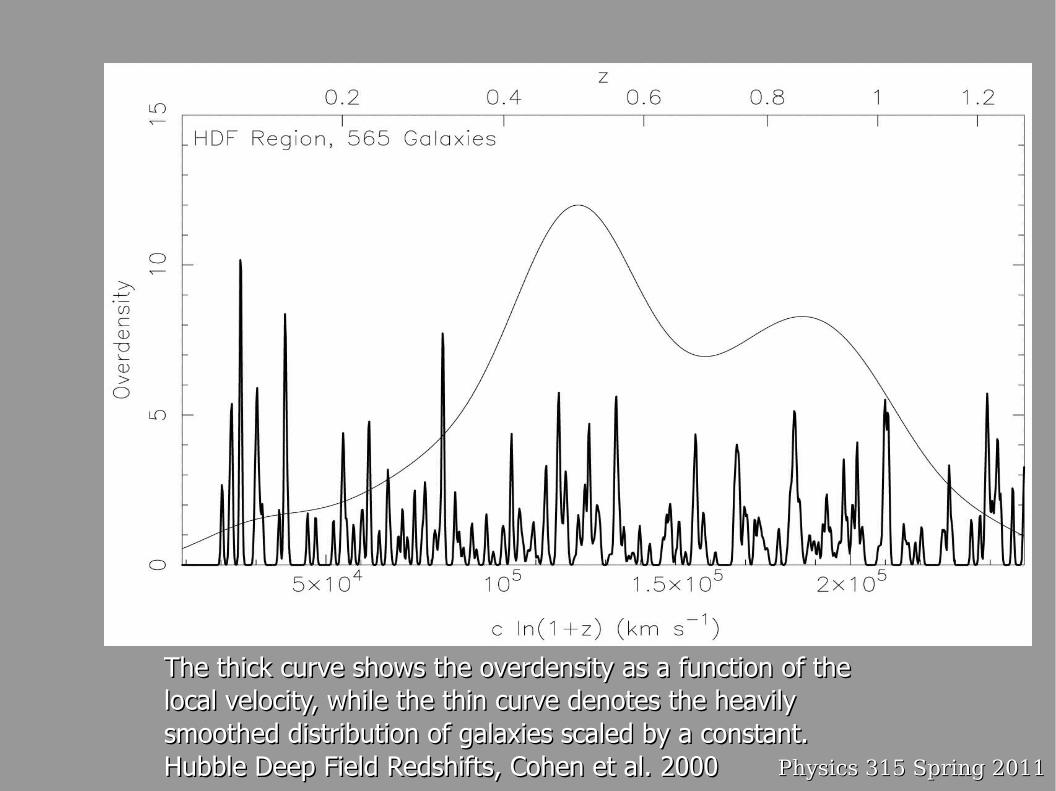
The thick curve shows the overdensity as a function of the The thick curve shows the overdensity as a function of the local velocity, while the thin curve denotes the heavily local velocity, while the thin curve denotes the heavily smoothed distribution of galaxies scaled by a constant.smoothed distribution of galaxies scaled by a constant.Hubble Deep Field Redshifts, Cohen et al. 2000Hubble Deep Field Redshifts, Cohen et al. 2000
Physics 315 Spring 2011Physics 315 Spring 2011
How to measure the amount How to measure the amount of clustering?of clustering?
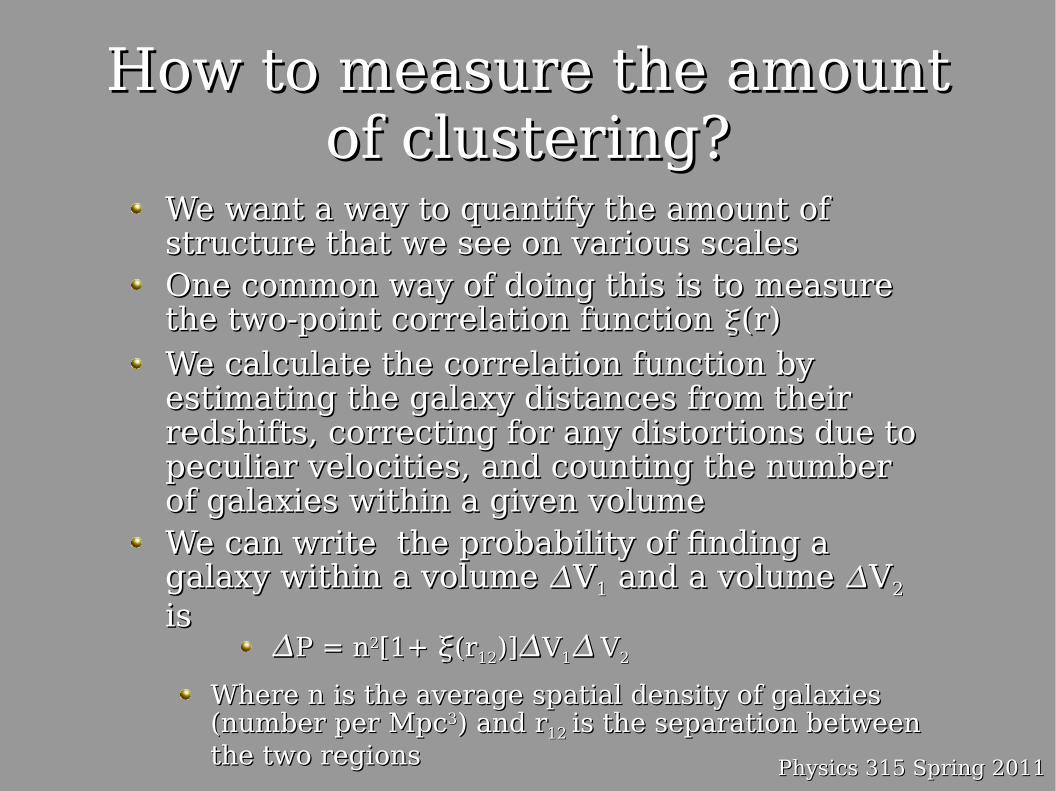
We want a way to quantify the amount of We want a way to quantify the amount of structure that we see on various scalesstructure that we see on various scalesOne common way of doing this is to measure One common way of doing this is to measure the two-point correlation function the two-point correlation function (r) (r) We calculate the correlation function by We calculate the correlation function by estimating the galaxy distances from their estimating the galaxy distances from their redshifts, correcting for any distortions due to redshifts, correcting for any distortions due to peculiar velocities, and counting the number peculiar velocities, and counting the number of galaxies within a given volumeof galaxies within a given volumeWe can write the probability of fnding a We can write the probability of fnding a galaxy within a volume galaxy within a volume VV11 and a volume and a volume VV22 is is
P = nP = n22[1+ [1+ (r(r1212)])]VV11 VV22
Where n is the average spatial density of galaxies Where n is the average spatial density of galaxies (number per Mpc(number per Mpc33) and r) and r12 12 is the separation between is the separation between the two regionsthe two regions
Physics 315 Spring 2011Physics 315 Spring 2011
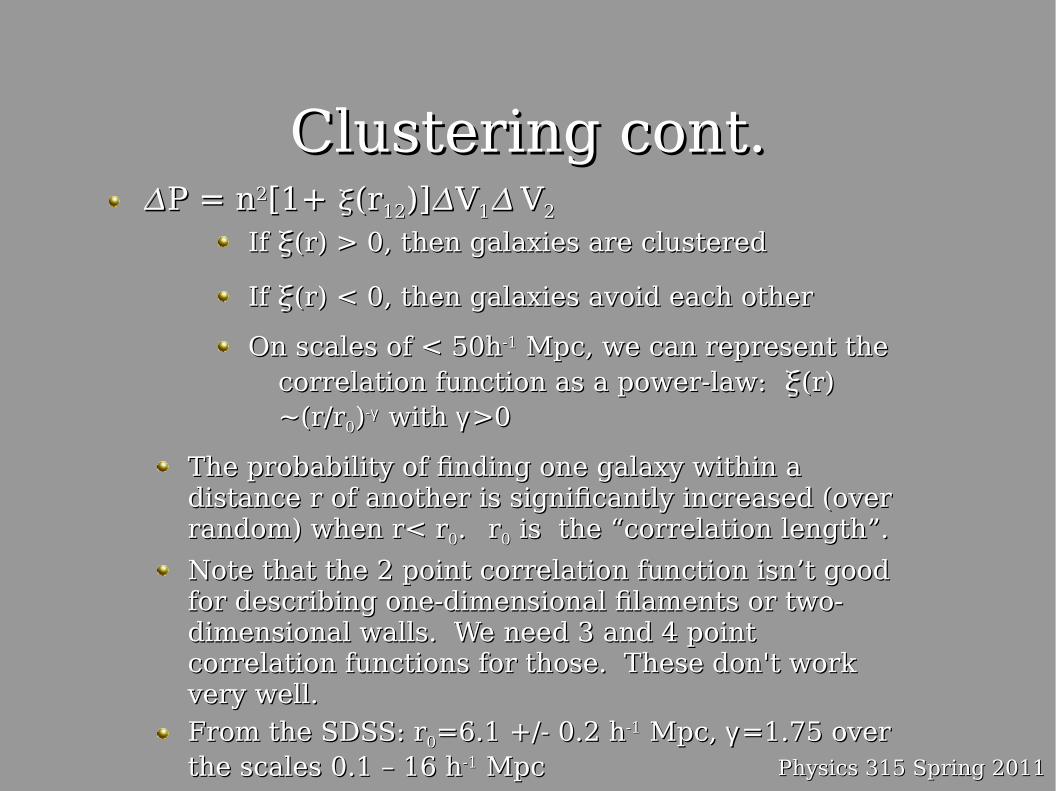
Clustering cont.Clustering cont.P = nP = n22[1+ [1+ (r(r1212)])]VV11 VV22
If If (r) > 0, then galaxies are clustered (r) > 0, then galaxies are clustered
If If (r) < 0, then galaxies avoid each other(r) < 0, then galaxies avoid each other
On scales of < 50hOn scales of < 50h-1-1 Mpc, we can represent the Mpc, we can represent the correlation function as a power-law: correlation function as a power-law: (r) (r) ~(r/r~(r/r00))--γγ with with γγ >0>0
The probability of fnding one galaxy within a The probability of fnding one galaxy within a distance r of another is signifcantly increased (over distance r of another is signifcantly increased (over random) when r< rrandom) when r< r00. . rr00 is the “correlation length”. is the “correlation length”.
Note that the 2 point correlation function isn’t good Note that the 2 point correlation function isn’t good for describing one-dimensional flaments or two-for describing one-dimensional flaments or two-dimensional walls. We need 3 and 4 point dimensional walls. We need 3 and 4 point correlation functions for those. These don't work correlation functions for those. These don't work very well.very well.
From the SDSS: rFrom the SDSS: r00=6.1 +/- 0.2 h=6.1 +/- 0.2 h-1-1 Mpc, Mpc, γγ =1.75 over =1.75 over the scales 0.1 – 16 hthe scales 0.1 – 16 h-1-1 Mpc Mpc
Physics 315 Spring 2011Physics 315 Spring 2011
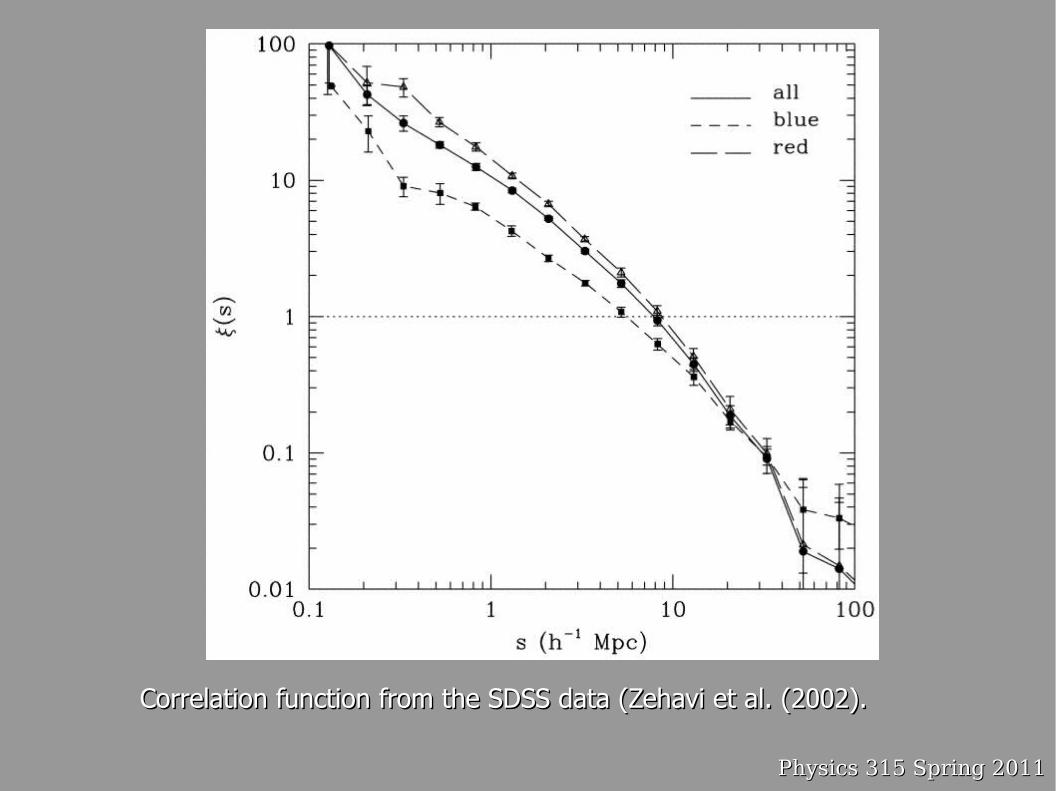
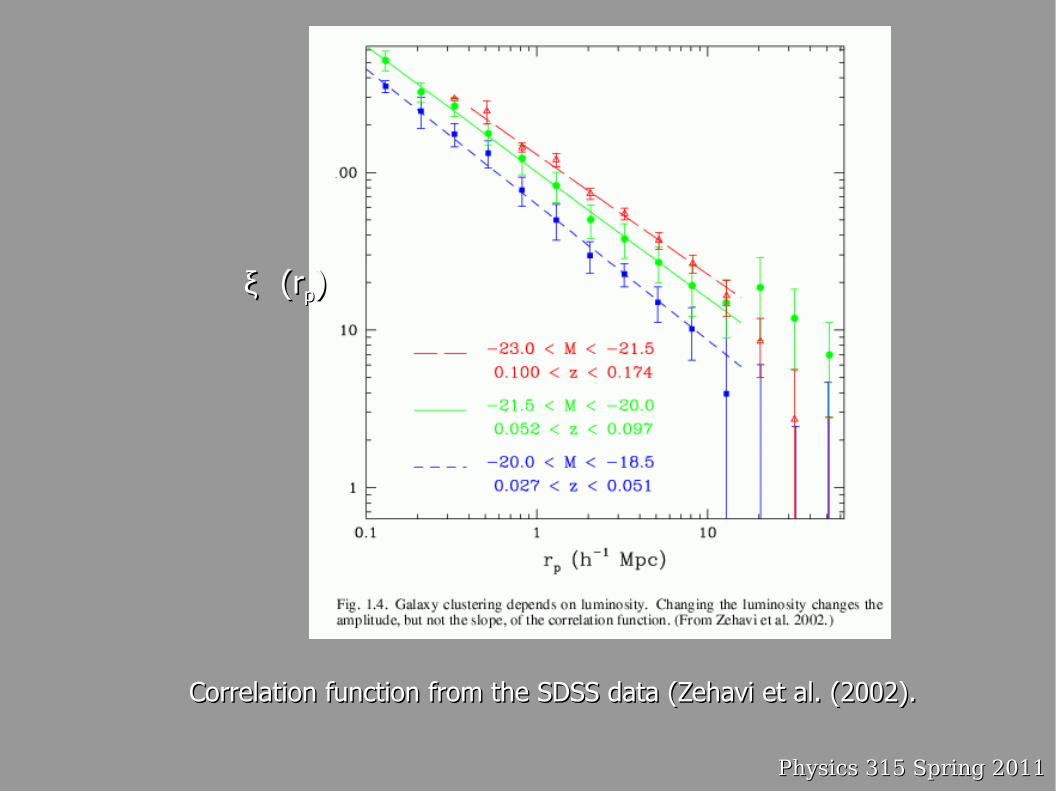
Clustering cont.Clustering cont.Clustering is a function of galaxy luminosity:Clustering is a function of galaxy luminosity:
Fainter galaxies are less strongly clustered than Fainter galaxies are less strongly clustered than brighter onesbrighter ones
And on galaxy color:And on galaxy color:Bluer galaxies are less strongly clustered than Bluer galaxies are less strongly clustered than redder onesredder ones
This is presumably telling us something This is presumably telling us something fundamental about galaxy formation, fundamental about galaxy formation, luminous redder galaxies (ellipticals?) like to luminous redder galaxies (ellipticals?) like to form in areas of higher mass density form in areas of higher mass density
Physics 315 Spring 2011Physics 315 Spring 2011
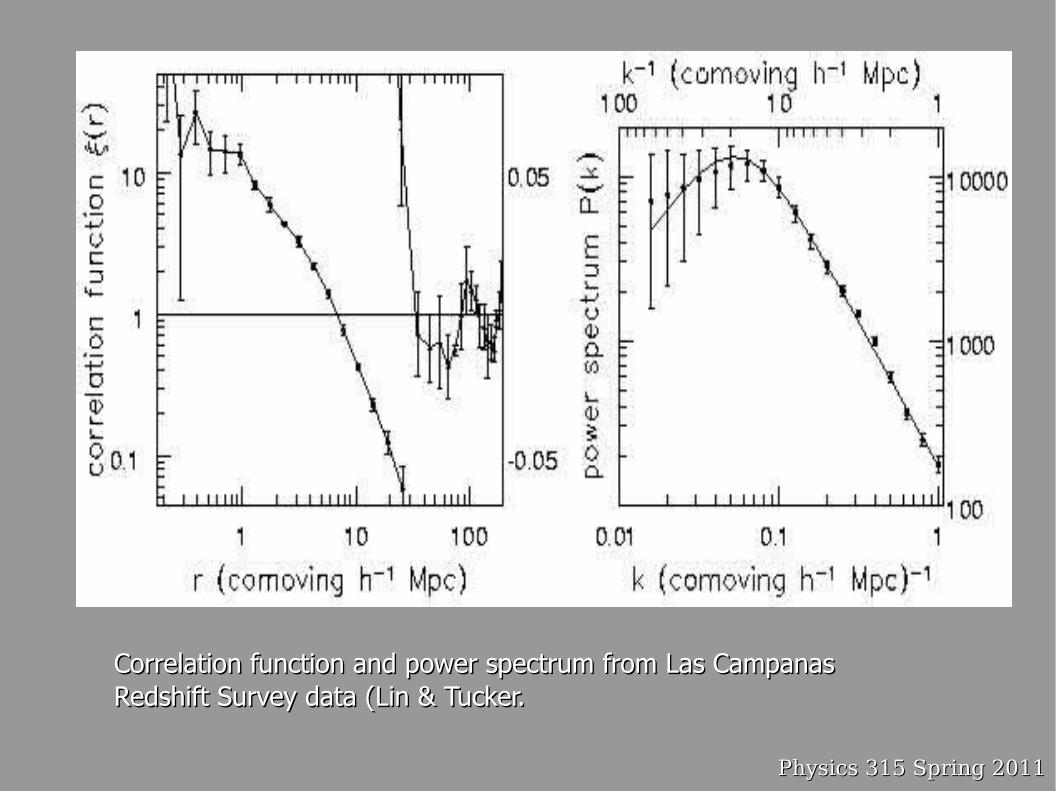
Correlation function and power spectrum from Las Campanas Correlation function and power spectrum from Las Campanas Redshift Survey data (Lin & Tucker.Redshift Survey data (Lin & Tucker.
Physics 315 Spring 2011Physics 315 Spring 2011
Correlation function from the SDSS data (Zehavi et al. (2002).Correlation function from the SDSS data (Zehavi et al. (2002).
Physics 315 Spring 2011Physics 315 Spring 2011
Correlation function from the SDSS data (Zehavi et al. (2002).Correlation function from the SDSS data (Zehavi et al. (2002).
ξξ (r(rpp))
Physics 315 Spring 2011Physics 315 Spring 2011
Clustering cont.Clustering cont.The Fourier transform of The Fourier transform of (r) is the power spectrum (r) is the power spectrum
P(k), P(k) = 4P(k), P(k) = 4∫∫ (r) [sin(kr)/kr] r(r) [sin(kr)/kr] r22drdr
k is the wavenumber, small values of k correspond to k is the wavenumber, small values of k correspond to large physical scales large physical scales
P(k) has the dimensions of volume. It will be at P(k) has the dimensions of volume. It will be at maximum close the radius r where maximum close the radius r where (r ) drops to zero.(r ) drops to zero.
Roughly speaking the power spectrum is a power-law Roughly speaking the power spectrum is a power-law at large k (small physical scales) and turns over at at large k (small physical scales) and turns over at small k (large physical scales)small k (large physical scales)
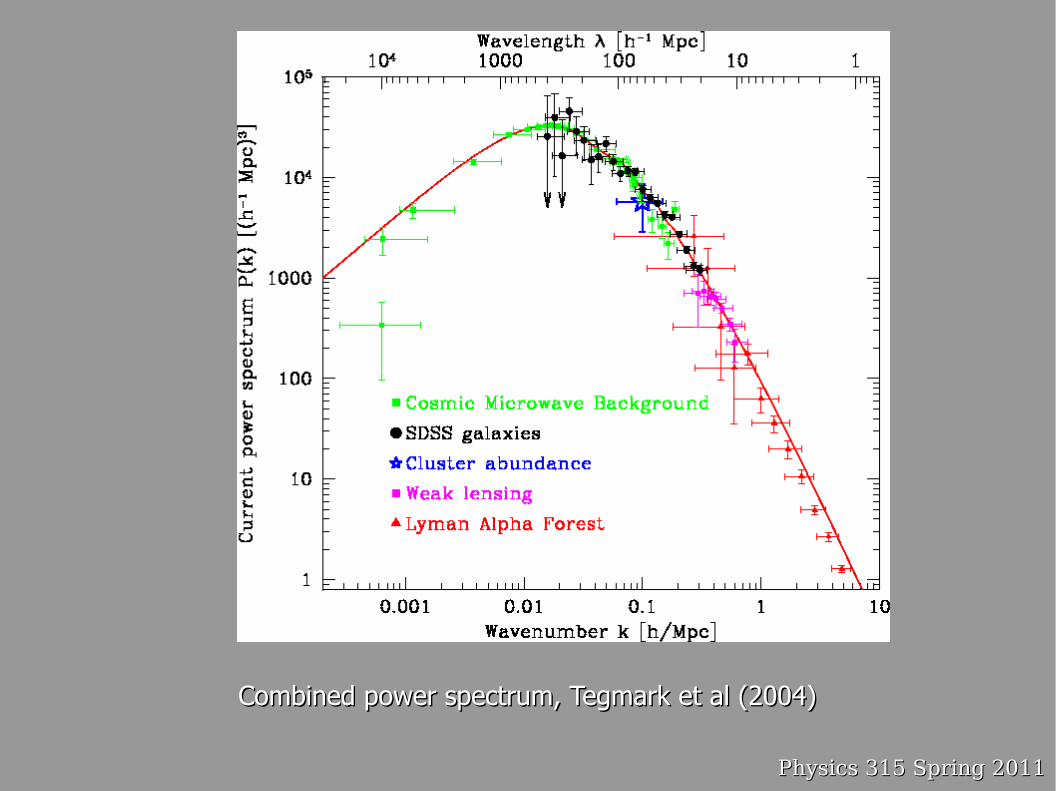
We can combine information from diferent We can combine information from diferent measurements (redshift surveys, CMB, Lymeasurements (redshift surveys, CMB, Ly forest, forest, weak lensing) to trace P(k) over a large range of weak lensing) to trace P(k) over a large range of physical scalesphysical scales
The power spectrum provides strong constraints on the The power spectrum provides strong constraints on the amount and type of dark matter and dark energy in the amount and type of dark matter and dark energy in the universe universe

Physics 315 Spring 2011Physics 315 Spring 2011
Correlation function and power spectrum from Las Campanas Correlation function and power spectrum from Las Campanas Redshift Survey data (Lin & Tucker.Redshift Survey data (Lin & Tucker.
Physics 315 Spring 2011Physics 315 Spring 2011
Clustering cont.Clustering cont.We would also like to know how well the We would also like to know how well the galaxies trace the mass distribution, or how galaxies trace the mass distribution, or how biased are the galaxies relative to the dark biased are the galaxies relative to the dark mattermatter
We generally assume that the two densities We generally assume that the two densities are linearly related such that:are linearly related such that:
Let Let xx= (= (x x - - avgavg))//avgavg be the density fuctuation be the density fuctuation
of a given populationof a given population
Linear biasing for galaxies implies Linear biasing for galaxies implies galaxiesgalaxies=b=bdmdm
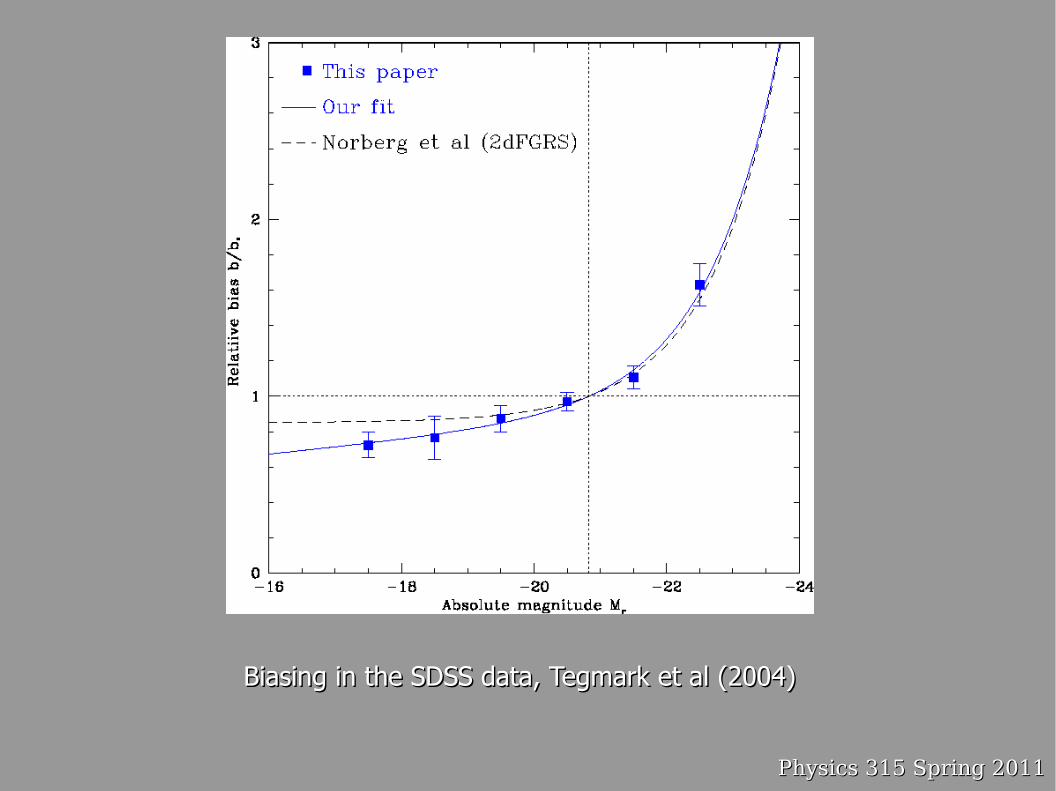
Biasing may be a function of scale and of galaxy Biasing may be a function of scale and of galaxy luminosityluminosity
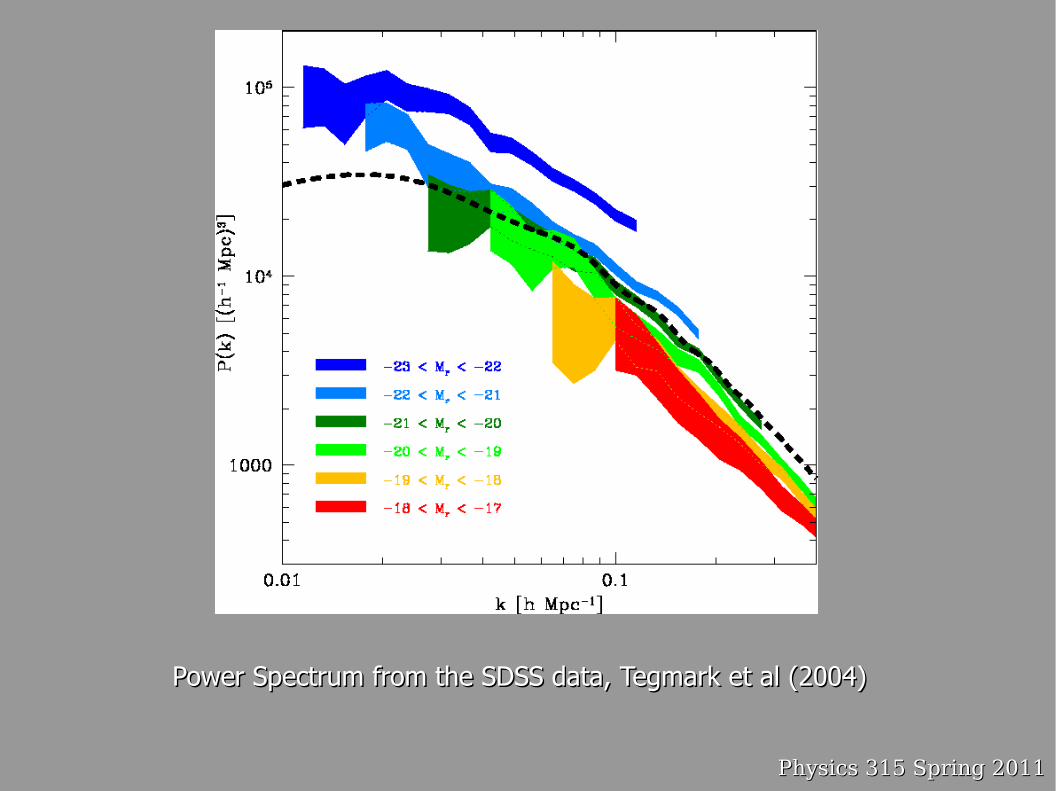
We can measure relative biasing by measuring We can measure relative biasing by measuring the power spectrum of diferent populationsthe power spectrum of diferent populations
Physics 315 Spring 2011Physics 315 Spring 2011
Power Spectrum from the SDSS data, Tegmark et al (2004)Power Spectrum from the SDSS data, Tegmark et al (2004)
Physics 315 Spring 2011Physics 315 Spring 2011
Biasing in the SDSS data, Tegmark et al (2004)Biasing in the SDSS data, Tegmark et al (2004)
Physics 315 Spring 2011Physics 315 Spring 2011
Combined power spectrum, Tegmark et al (2004)Combined power spectrum, Tegmark et al (2004)
Physics 315 Spring 2011Physics 315 Spring 2011
Peculiar velocities & Bulk FlowsPeculiar velocities & Bulk FlowsLarge scale structure causes peculiar velocities (deviations Large scale structure causes peculiar velocities (deviations from the Hubble Flow)from the Hubble Flow)We can measure these if we have accurate distances to the We can measure these if we have accurate distances to the galaxies by:galaxies by:
VVrr = H = H00d + Vd + Vpecpec – so if we measure distance and radial – so if we measure distance and radial velocity (and assume the Hubble Constant) we can velocity (and assume the Hubble Constant) we can measure the peculiar velocity of a galaxymeasure the peculiar velocity of a galaxy
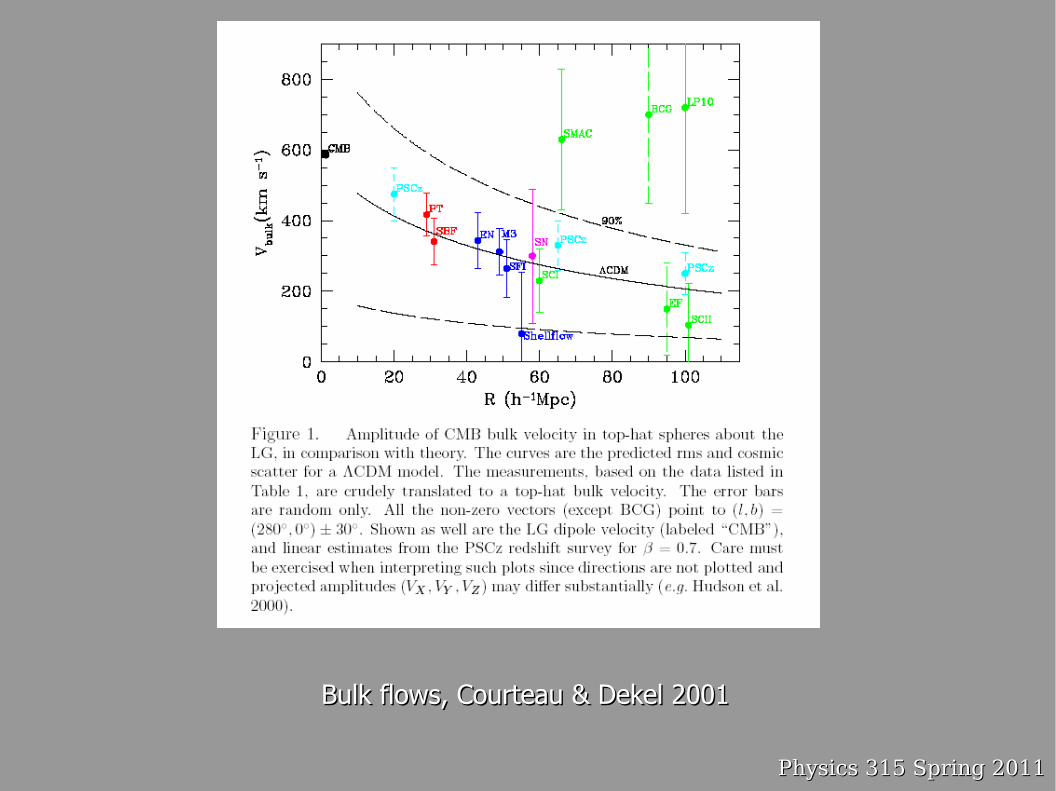
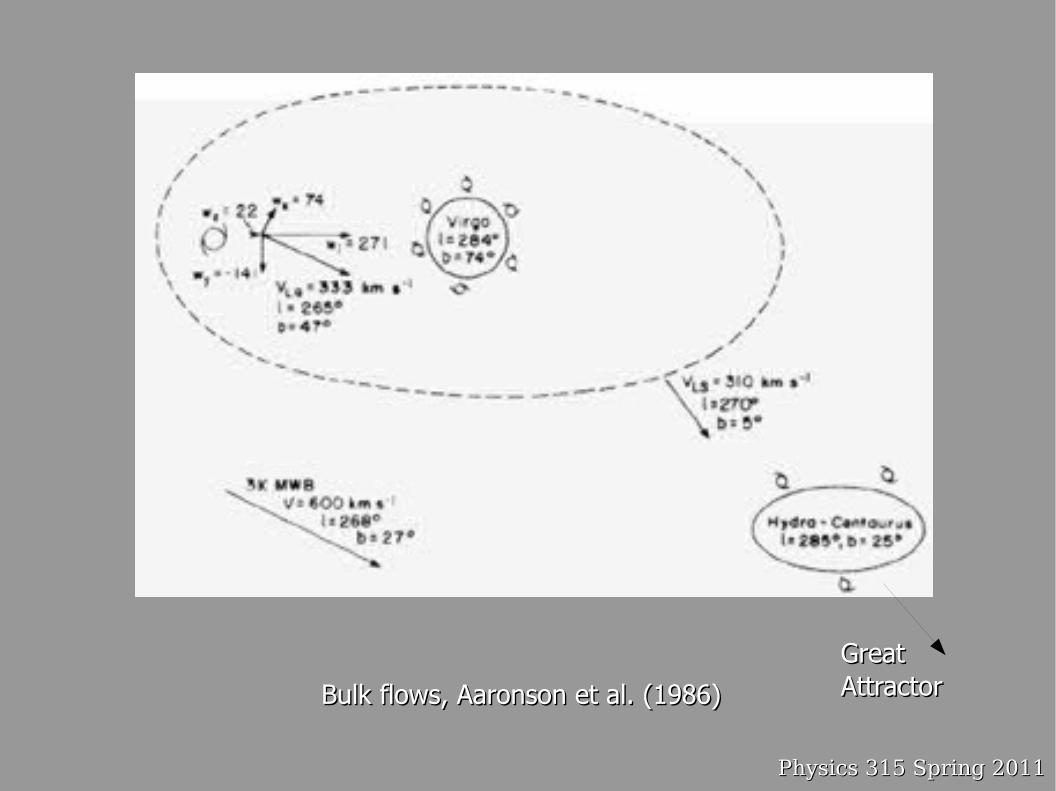
We are falling into the Virgo cluster at ~270 km/s, this is We are falling into the Virgo cluster at ~270 km/s, this is called the “Virgocentric infall”called the “Virgocentric infall”We also measure a dipole anisotropy in the cosmic microwave We also measure a dipole anisotropy in the cosmic microwave background which implies that the local group is moving at background which implies that the local group is moving at ~620 km/s towards b=27, l=268.~620 km/s towards b=27, l=268.This is due to a combination of our infall towards Virgo and This is due to a combination of our infall towards Virgo and the entire Local Supercluster moving towards the general the entire Local Supercluster moving towards the general direction of the Hydro-Centaurus Supercluster (the Great direction of the Hydro-Centaurus Supercluster (the Great Attractor)Attractor)
Flows of superclusters are known as “bulk fows”Flows of superclusters are known as “bulk fows”Measurements of the velocity feld of galaxies can help Measurements of the velocity feld of galaxies can help put constraints on the underlying mass feld put constraints on the underlying mass feld
Physics 315 Spring 2011Physics 315 Spring 2011
Surface Brightness Surface Brightness fuctuationsfuctuations
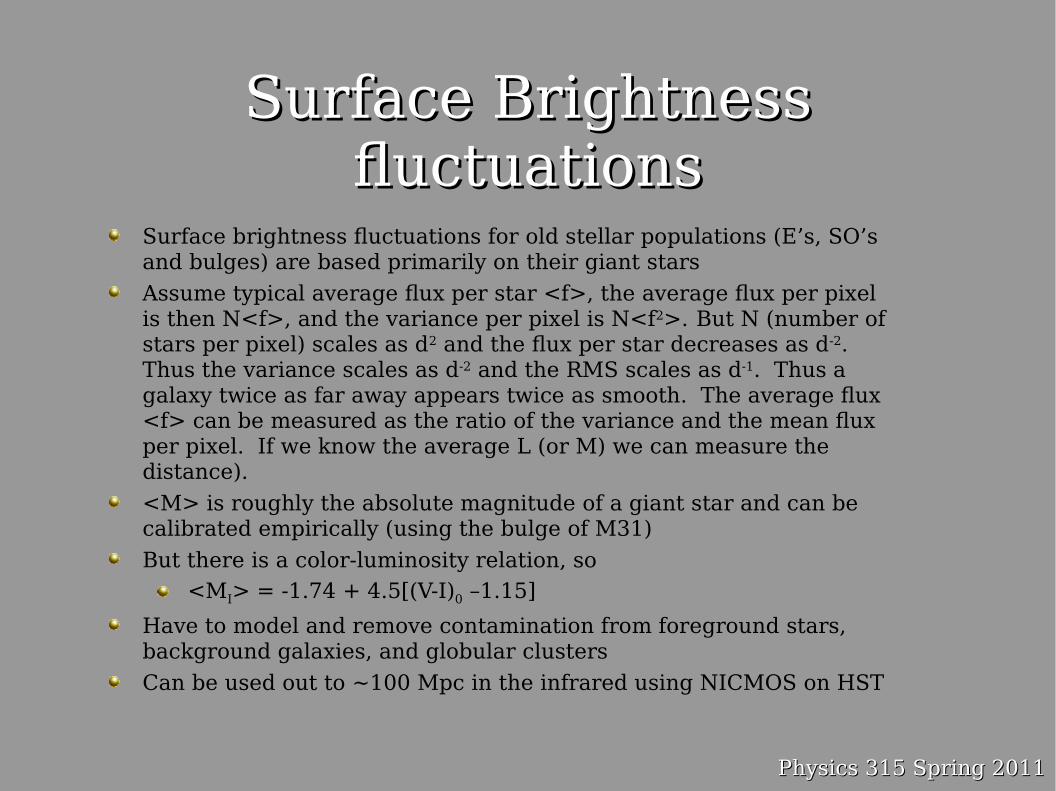
Surface brightness fuctuations for old stellar populations (E’s, SO’s and bulges) are based primarily on their giant stars
Assume typical average fux per star <f>, the average fux per pixel is then N<f>, and the variance per pixel is N<f2>. But N (number of stars per pixel) scales as d2 and the fux per star decreases as d-2. Thus the variance scales as d-2 and the RMS scales as d-1. Thus a galaxy twice as far away appears twice as smooth. The average fux <f> can be measured as the ratio of the variance and the mean fux per pixel. If we know the average L (or M) we can measure the distance).
<M> is roughly the absolute magnitude of a giant star and can be calibrated empirically (using the bulge of M31)
But there is a color-luminosity relation, so<MI> = -1.74 + 4.5[(V-I)0 –1.15]
Have to model and remove contamination from foreground stars, background galaxies, and globular clusters
Can be used out to ~100 Mpc in the infrared using NICMOS on HST
Physics 315 Spring 2011Physics 315 Spring 2011
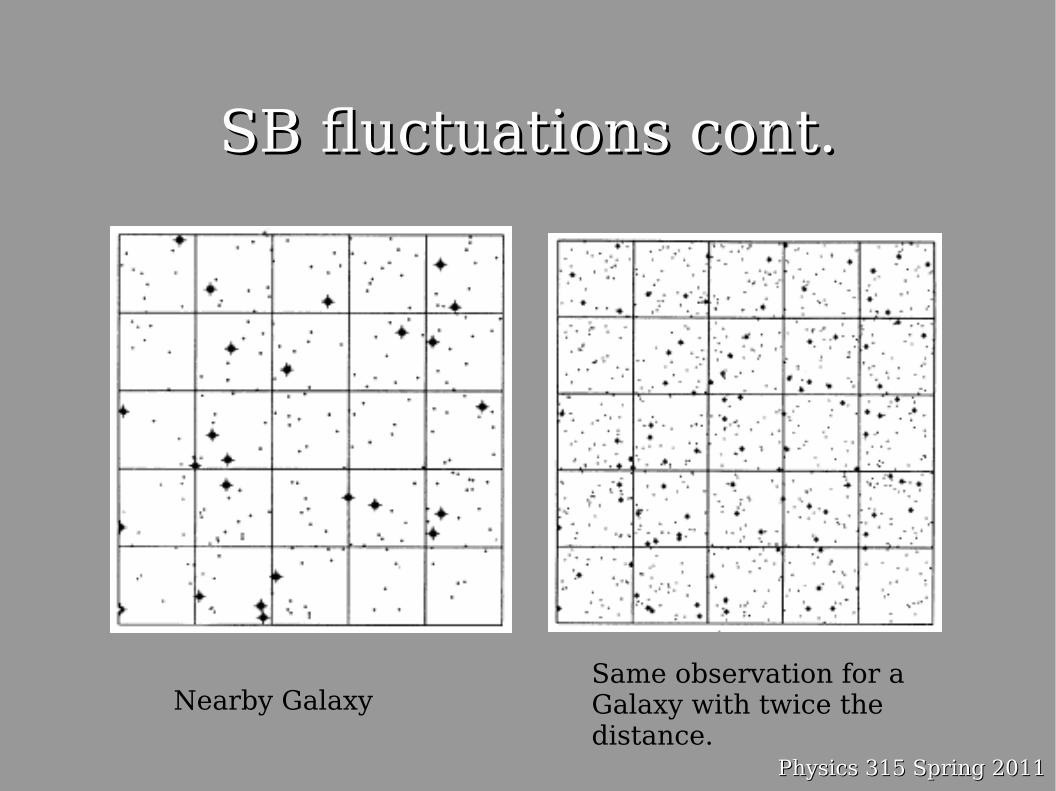
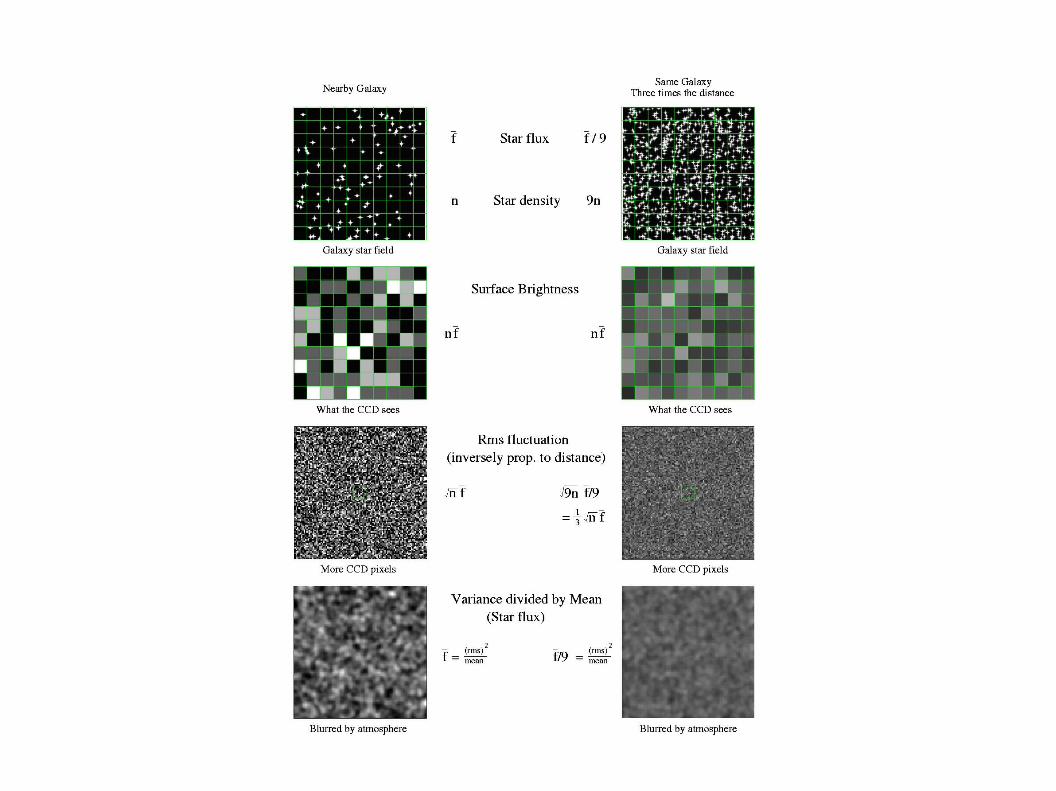
SB fuctuations cont.SB fuctuations cont.
Nearby GalaxySame observation for a Galaxy with twice the distance.
Physics 315 Spring 2011Physics 315 Spring 2011
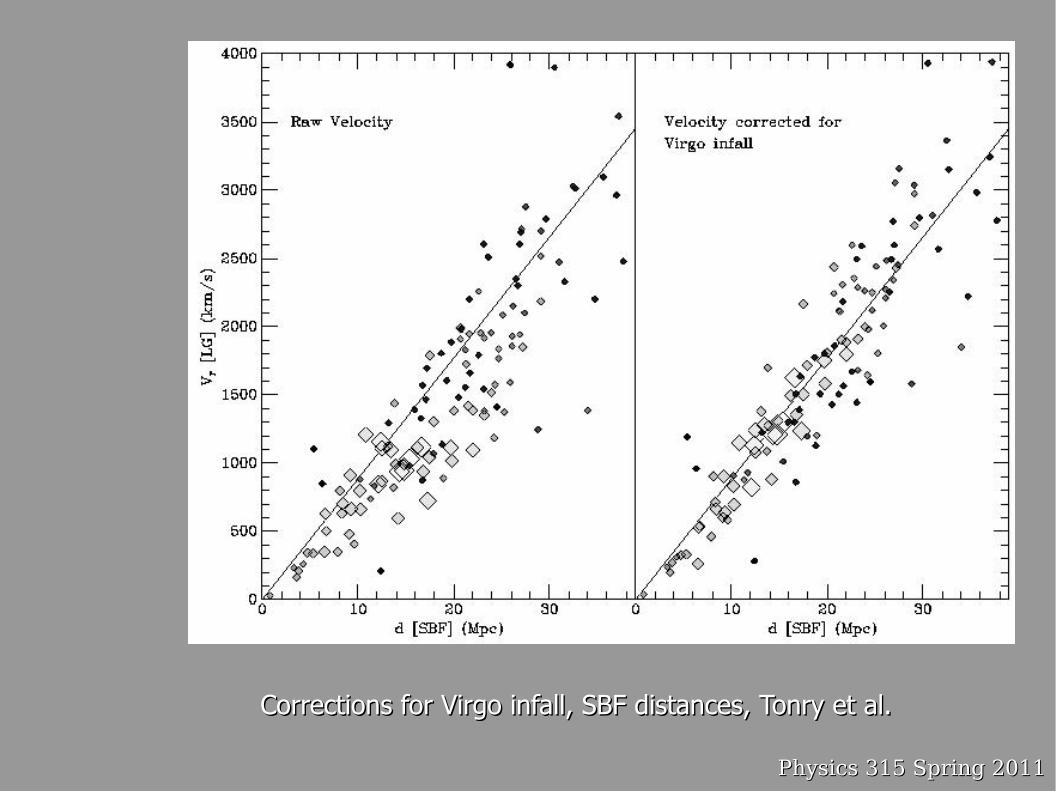
Corrections for Virgo infall, SBF distances, Tonry et al.Corrections for Virgo infall, SBF distances, Tonry et al.
Physics 315 Spring 2011Physics 315 Spring 2011
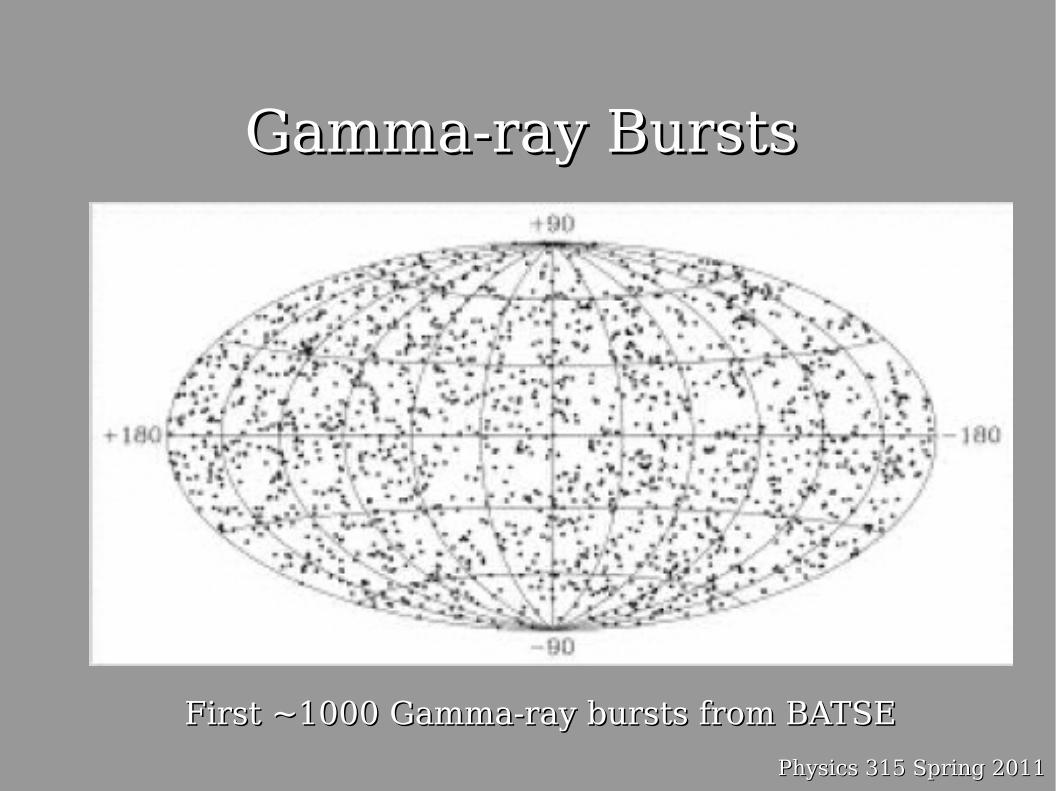
Gamma-ray BurstsGamma-ray Bursts
First ~1000 Gamma-ray bursts from BATSEFirst ~1000 Gamma-ray bursts from BATSE
Physics 315 Spring 2011Physics 315 Spring 2011
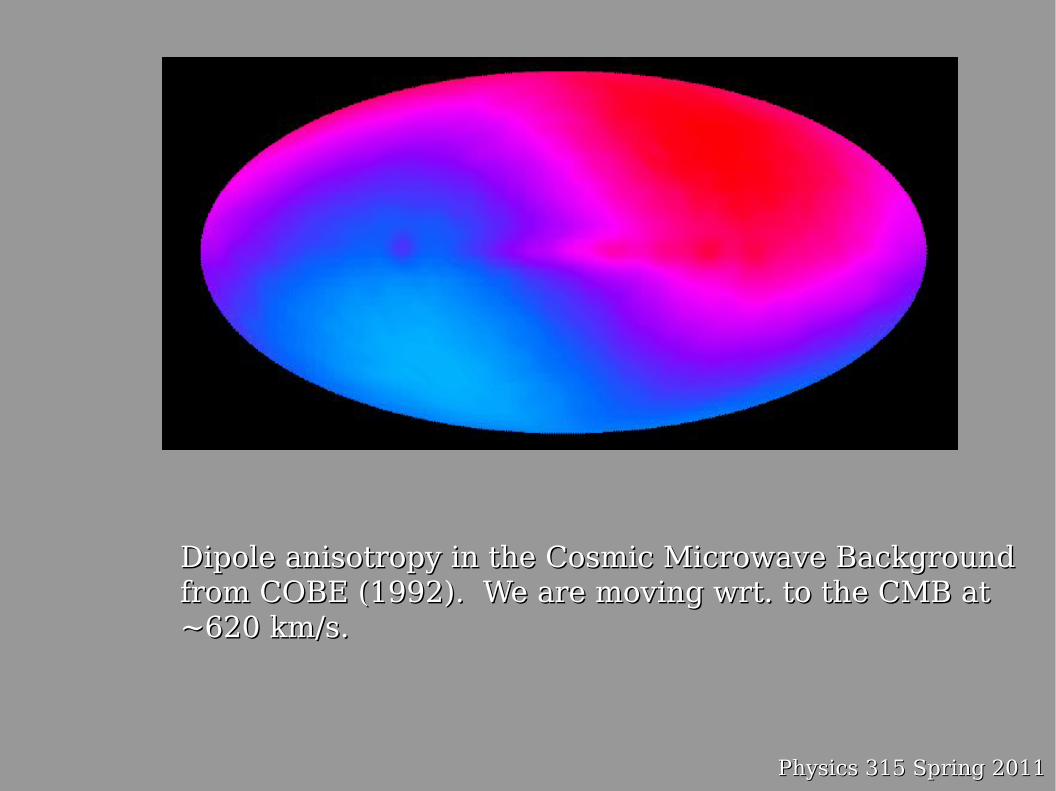
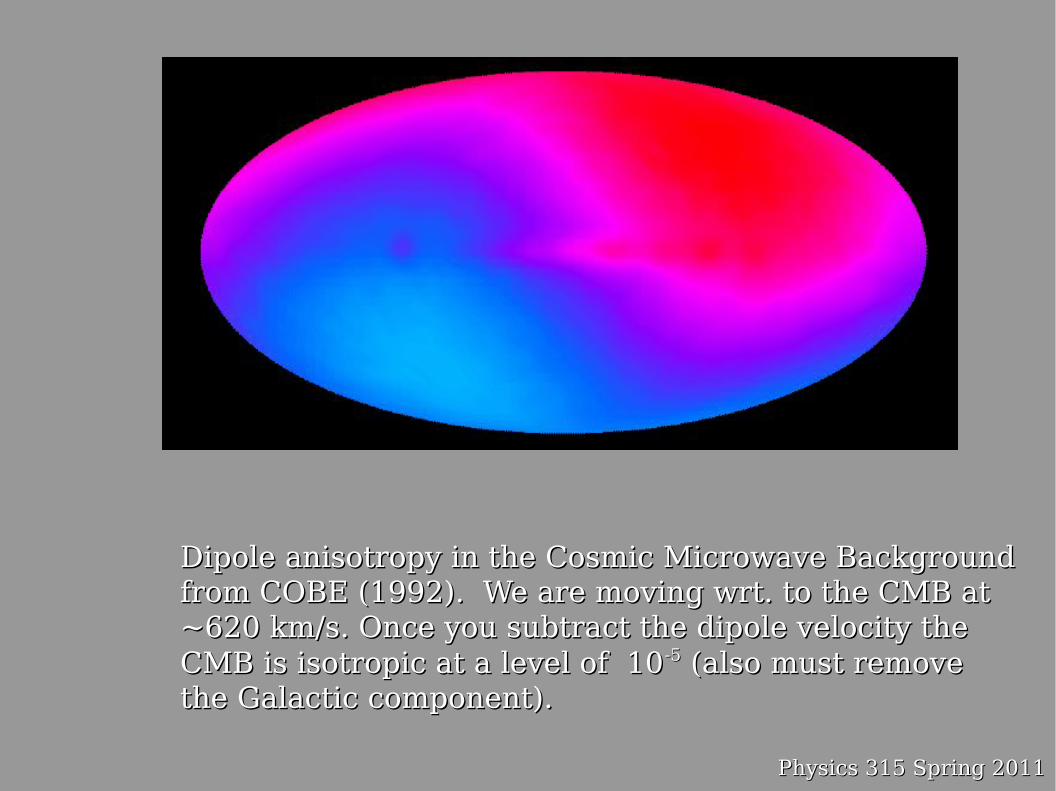
Dipole anisotropy in the Cosmic Microwave BackgroundDipole anisotropy in the Cosmic Microwave Backgroundfrom COBE (1992). We are moving wrt. to the CMB atfrom COBE (1992). We are moving wrt. to the CMB at~620 km/s.~620 km/s.
Physics 315 Spring 2011Physics 315 Spring 2011
Bulk flows, Courteau & Dekel 2001Bulk flows, Courteau & Dekel 2001
Physics 315 Spring 2011Physics 315 Spring 2011
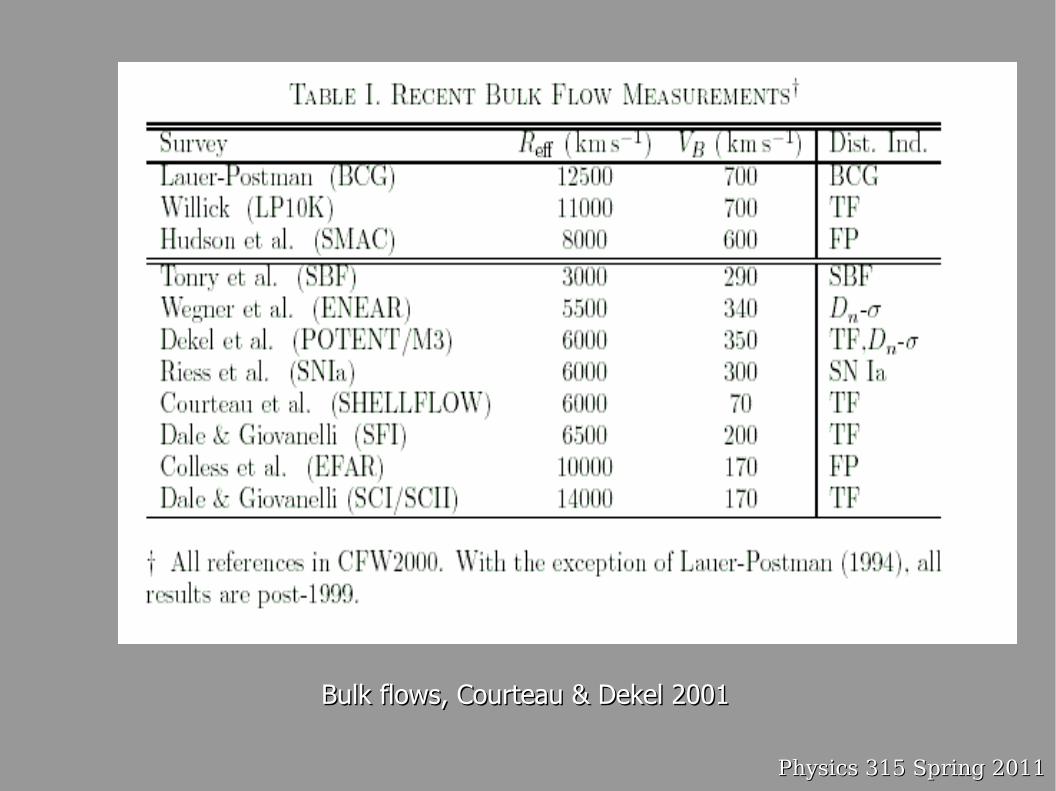
Bulk flows, Courteau & Dekel 2001Bulk flows, Courteau & Dekel 2001
Physics 315 Spring 2011Physics 315 Spring 2011
Bulk flows, Aaronson et al. (1986)Bulk flows, Aaronson et al. (1986)GreatGreatAttractorAttractor
Physics 315 Spring 2011Physics 315 Spring 2011
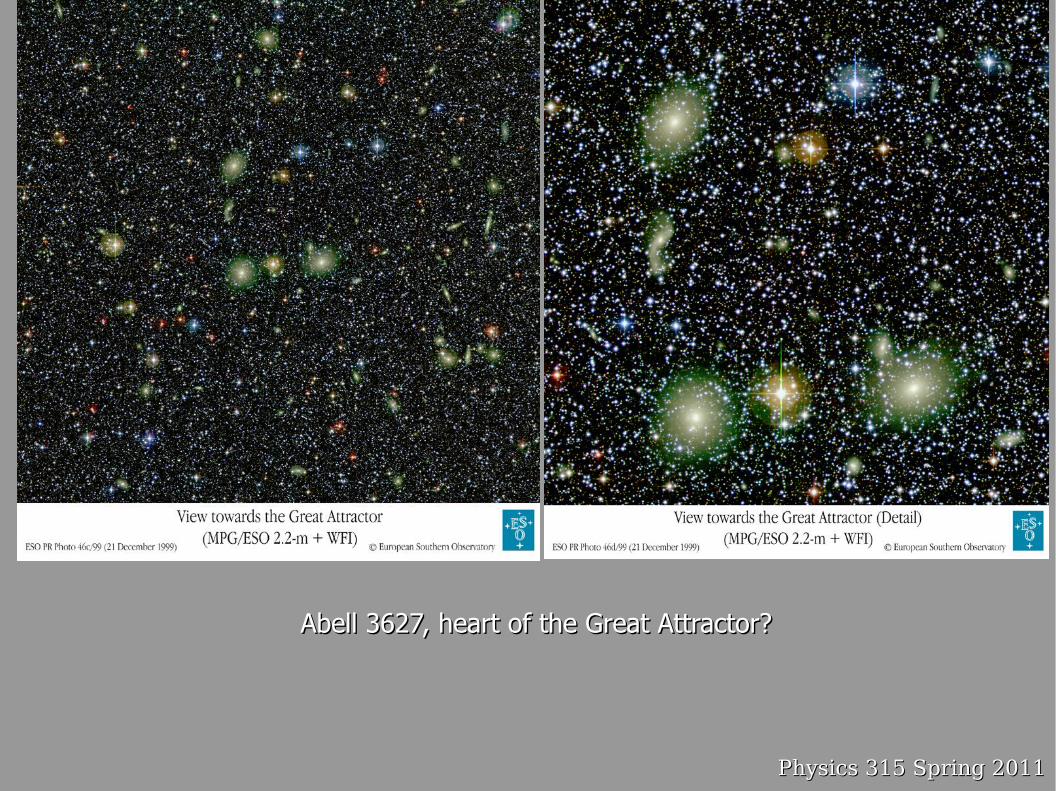
Abell 3627, heart of the Great Attractor?Abell 3627, heart of the Great Attractor?
Physics 315 Spring 2011Physics 315 Spring 2011
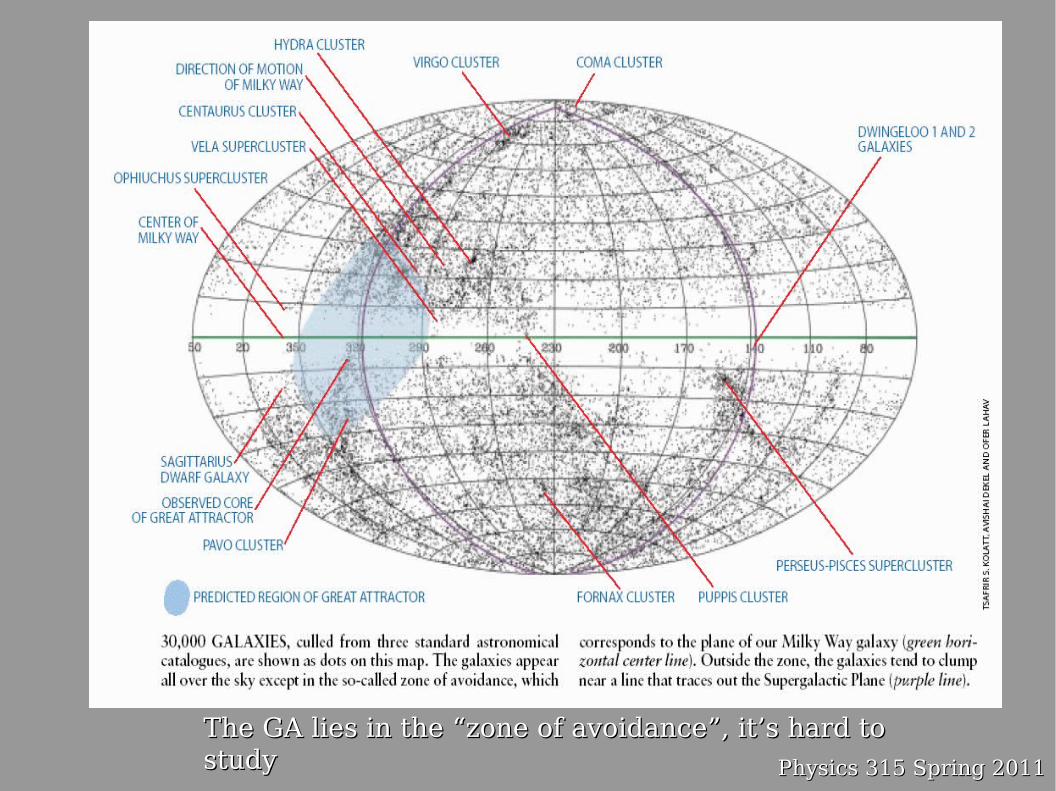
The GA lies in the “zone of avoidance”, it’s hard to The GA lies in the “zone of avoidance”, it’s hard to studystudy
Physics 315 Spring 2011Physics 315 Spring 2011
Hot Big Bang ModelHot Big Bang Model
Universe is isotropic and homogeneousUniverse is isotropic and homogeneous
This is only true when you average over This is only true when you average over sufciently large volumessufciently large volumes
This is also know as the Cosmological This is also know as the Cosmological Principle Principle
Physics 315 Spring 2011Physics 315 Spring 2011
Dipole anisotropy in the Cosmic Microwave BackgroundDipole anisotropy in the Cosmic Microwave Backgroundfrom COBE (1992). We are moving wrt. to the CMB atfrom COBE (1992). We are moving wrt. to the CMB at~620 km/s. Once you subtract the dipole velocity the ~620 km/s. Once you subtract the dipole velocity the CMB is isotropic at a level of 10CMB is isotropic at a level of 10 -5-5 (also must remove (also must removethe Galactic component).the Galactic component).
Physics 315 Spring 2011Physics 315 Spring 2011
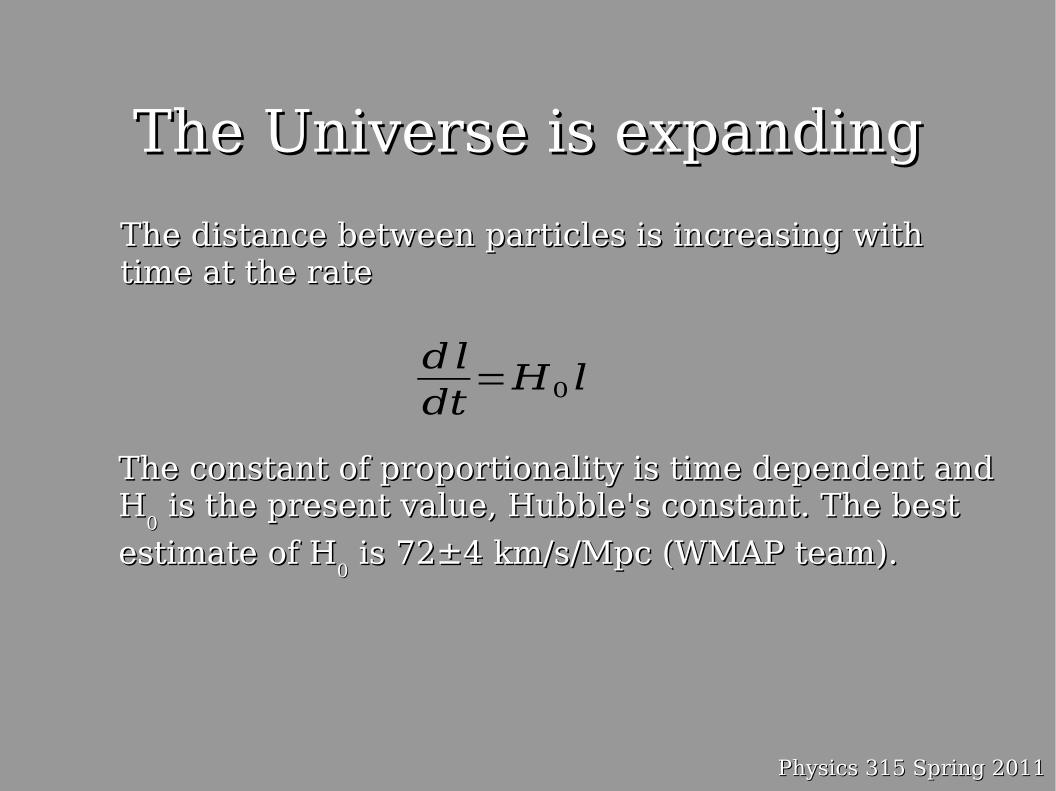
The Universe is expandingThe Universe is expanding
The distance between particles is increasing with The distance between particles is increasing with time at the rate time at the rate
dldt
=H0 l
The constant of proportionality is time dependent andThe constant of proportionality is time dependent andHH
00 is the present value, Hubble's constant. The best is the present value, Hubble's constant. The best
estimate of Hestimate of H00 is 72 is 72±±4 km/s/Mpc (WMAP team).4 km/s/Mpc (WMAP team).
Physics 315 Spring 2011Physics 315 Spring 2011
We can defne a Hubble length:We can defne a Hubble length:
c/Hc/H00 ~ 4000 Mpc ~ 4000 Mpc
This is the point where the recession velocity is equal This is the point where the recession velocity is equal to the speed of light. Clearly to do this correctly we to the speed of light. Clearly to do this correctly we need a fully relativistic treatment.need a fully relativistic treatment.
We can also defne a Hubble timeWe can also defne a Hubble time
1/H1/H00 ~ 10 ~ 101010 years years
this gives the age of the universe (to an order of this gives the age of the universe (to an order of magnitude).magnitude).
Physics 315 Spring 2011Physics 315 Spring 2011
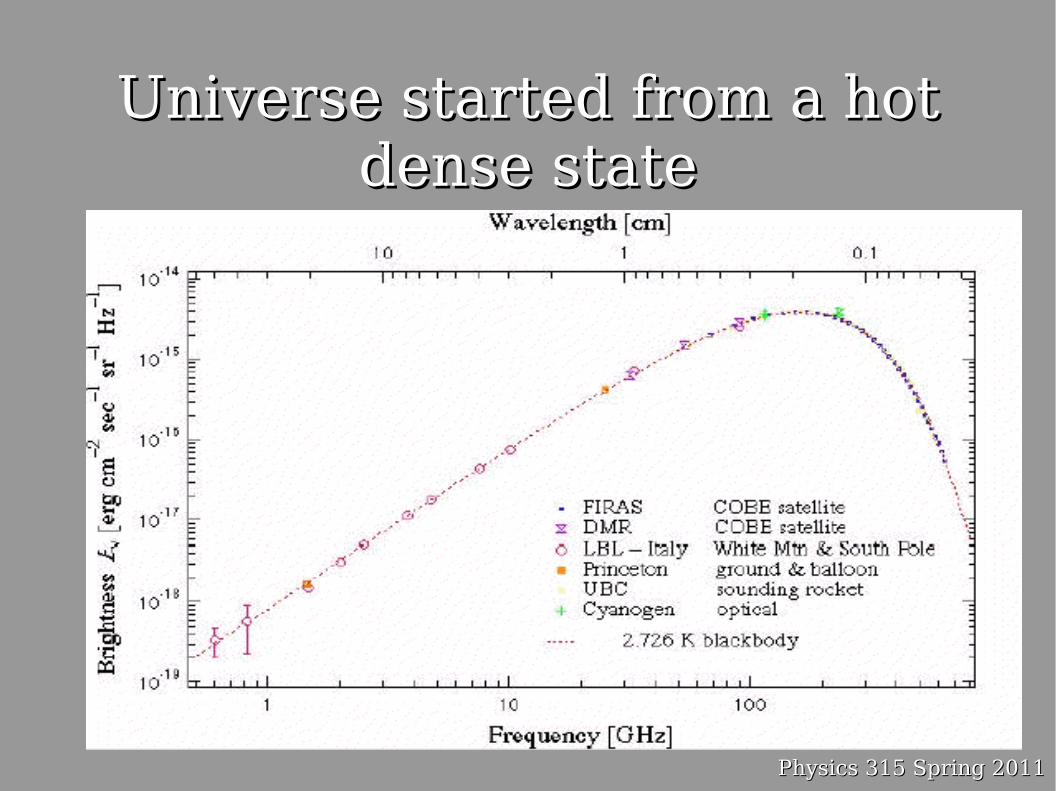
Universe started from a hot Universe started from a hot dense statedense state
Physics 315 Spring 2011Physics 315 Spring 2011
The Robertson-Walker MetricThe Robertson-Walker Metric
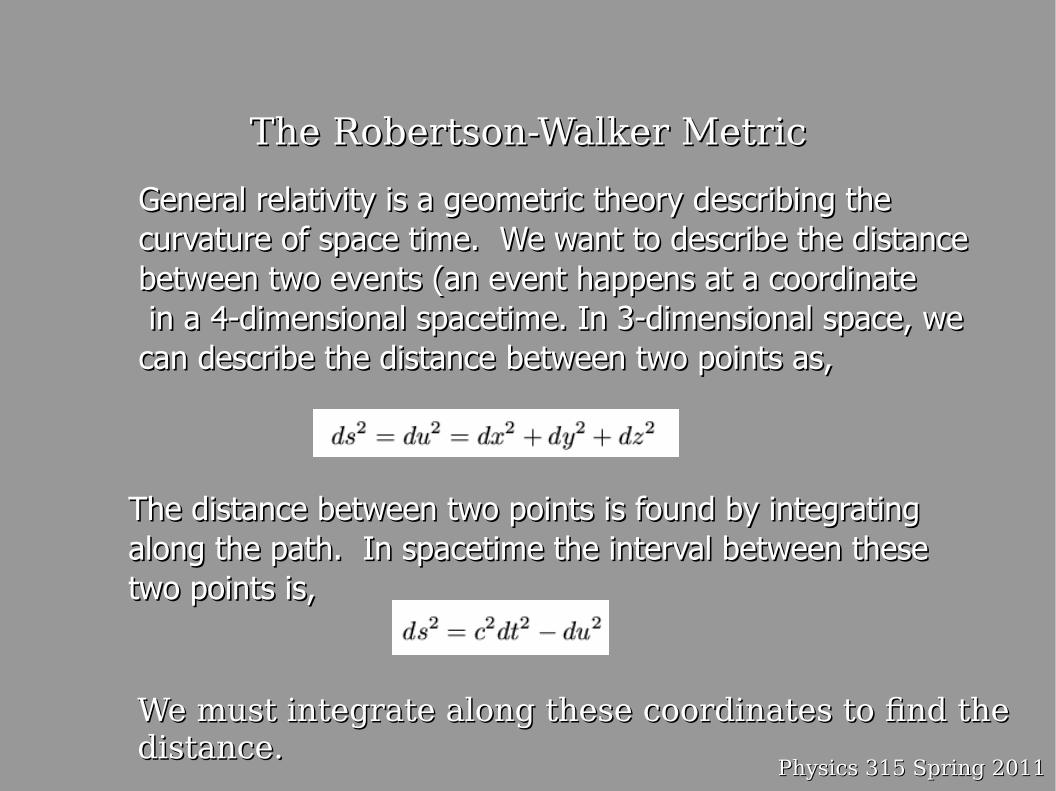
General relativity is a geometric theory describing theGeneral relativity is a geometric theory describing thecurvature of space time. We want to describe the distancecurvature of space time. We want to describe the distancebetween two events (an event happens at a coordinatebetween two events (an event happens at a coordinate in a 4-dimensional spacetime. In 3-dimensional space, we in a 4-dimensional spacetime. In 3-dimensional space, we can describe the distance can describe the distance between two points as,between two points as,
The distance between two points is found by integratingThe distance between two points is found by integratingalong the path. In spacetime the interval between thesealong the path. In spacetime the interval between thesetwo points is,two points is,
We must integrate along these coordinates to fnd theWe must integrate along these coordinates to fnd thedistance.distance.
Physics 315 Spring 2011Physics 315 Spring 2011
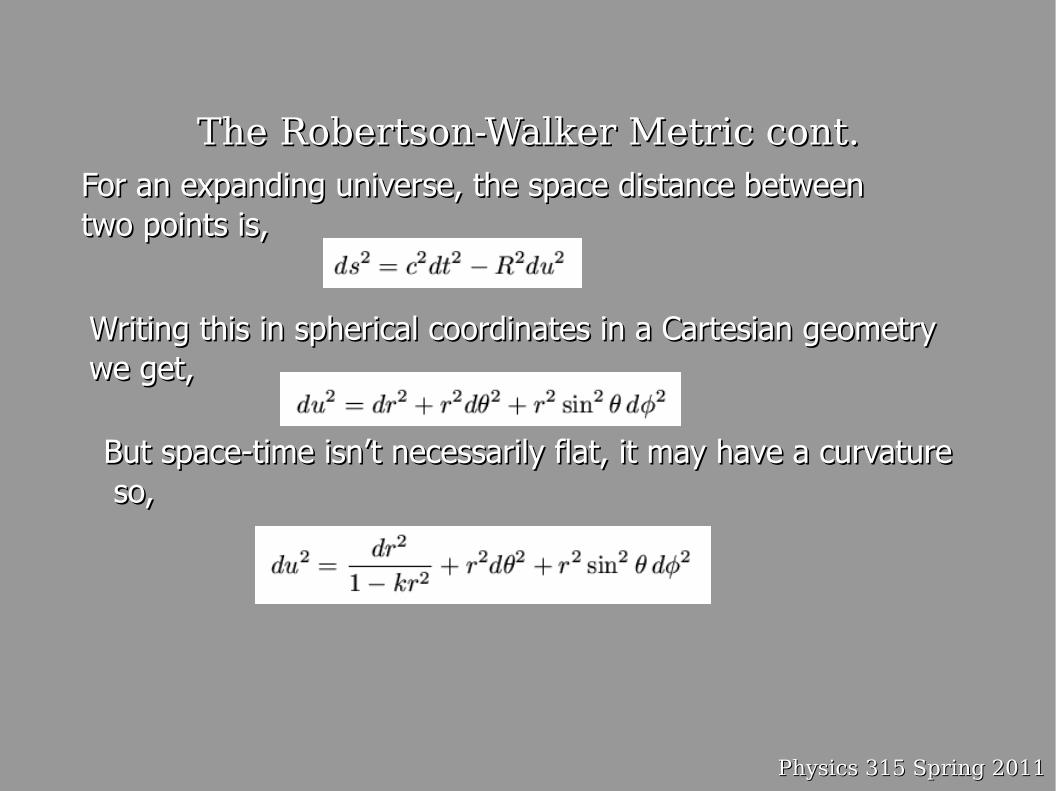
The Robertson-Walker Metric cont.The Robertson-Walker Metric cont.For an expanding universe, the space distance between For an expanding universe, the space distance between two points is,two points is,
Writing this in spherical coordinates in a Cartesian geometryWriting this in spherical coordinates in a Cartesian geometrywe get,we get,
But space-time isn’t necessarily flat, it may have a curvatureBut space-time isn’t necessarily flat, it may have a curvature so,so,
Physics 315 Spring 2011Physics 315 Spring 2011
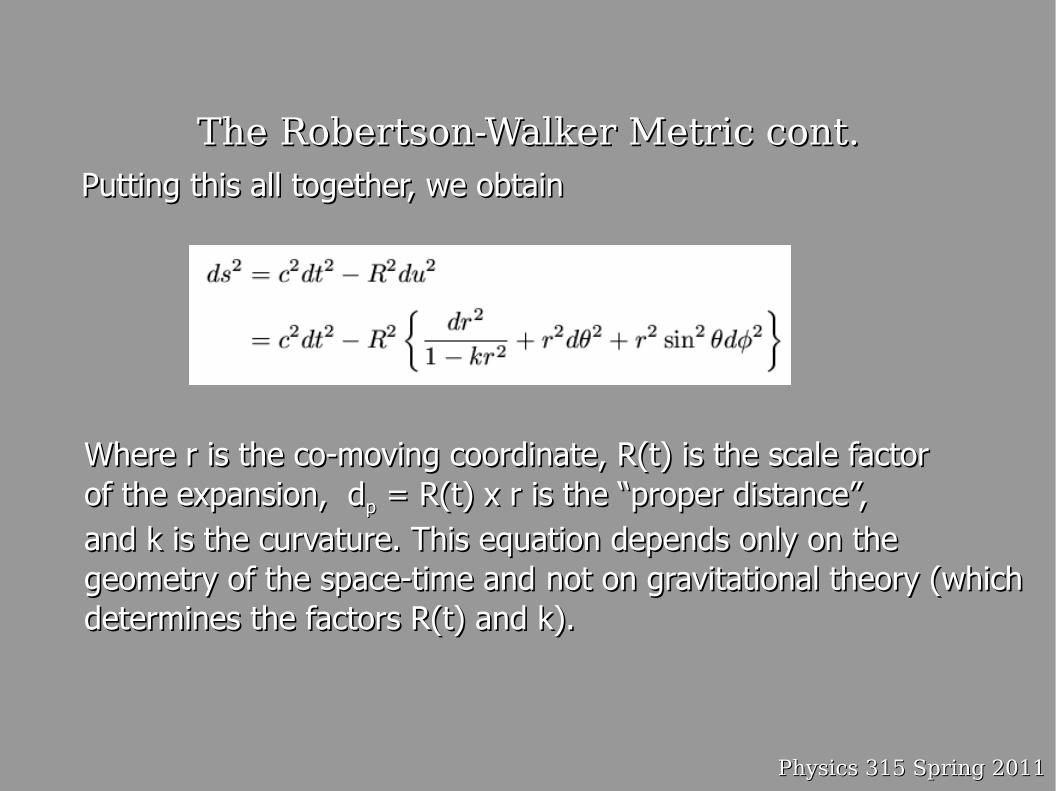
The Robertson-Walker Metric cont.The Robertson-Walker Metric cont.Putting this all together, we obtainPutting this all together, we obtain
Where r is the co-moving coordinate, R(t) is the scale factorWhere r is the co-moving coordinate, R(t) is the scale factorof the expansion, dof the expansion, dpp = R(t) x r is the “proper distance”, = R(t) x r is the “proper distance”, and k is the curvature. This equation depends only on theand k is the curvature. This equation depends only on thegeometry of the space-time and geometry of the space-time and not on gravitational theory (whichnot on gravitational theory (whichdetermines the factors R(t) and k).determines the factors R(t) and k).
Physics 315 Spring 2011Physics 315 Spring 2011
Distance MeasuresDistance Measures
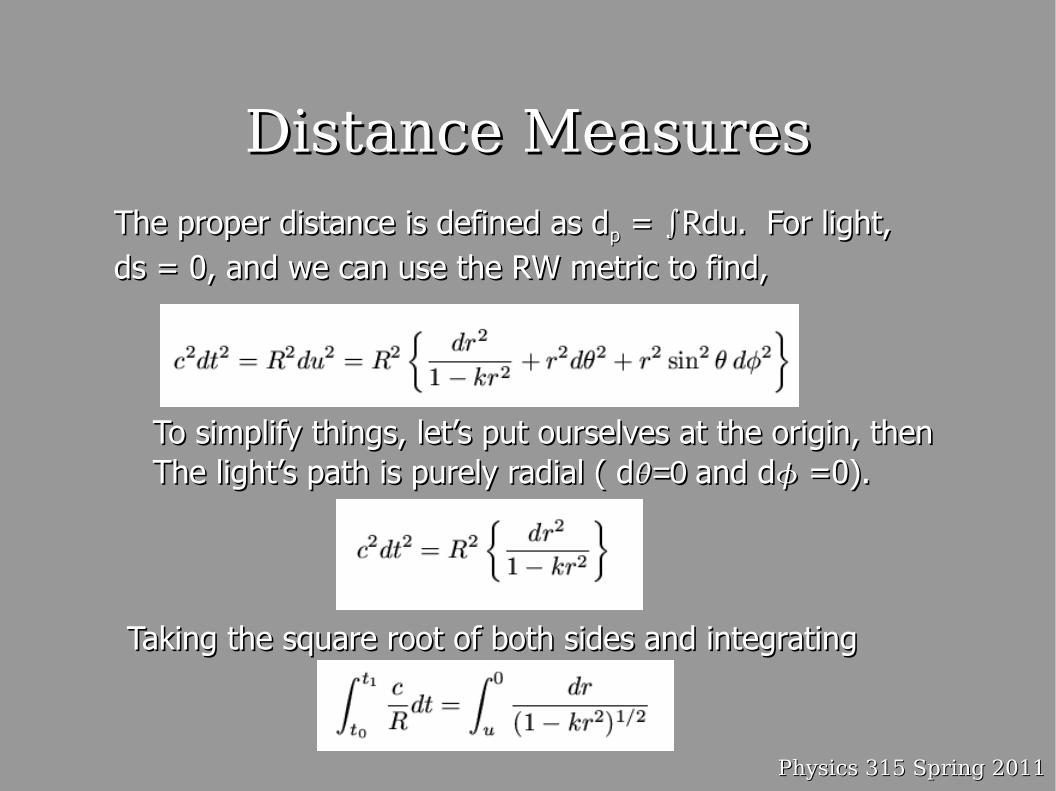
Taking the square root of both sides and integratingTaking the square root of both sides and integrating
To simplify things, let’s put ourselves at the origin, thenTo simplify things, let’s put ourselves at the origin, thenThe light’s path is purely radial ( dThe light’s path is purely radial ( d=0=0 and d and d =0). =0).
The proper distance is defined as dThe proper distance is defined as dpp = = ∫∫Rdu. For light,Rdu. For light,ds = 0, and we can use the RW metric to find,ds = 0, and we can use the RW metric to find,
Physics 315 Spring 2011Physics 315 Spring 2011
Distance Measures cont.Distance Measures cont.
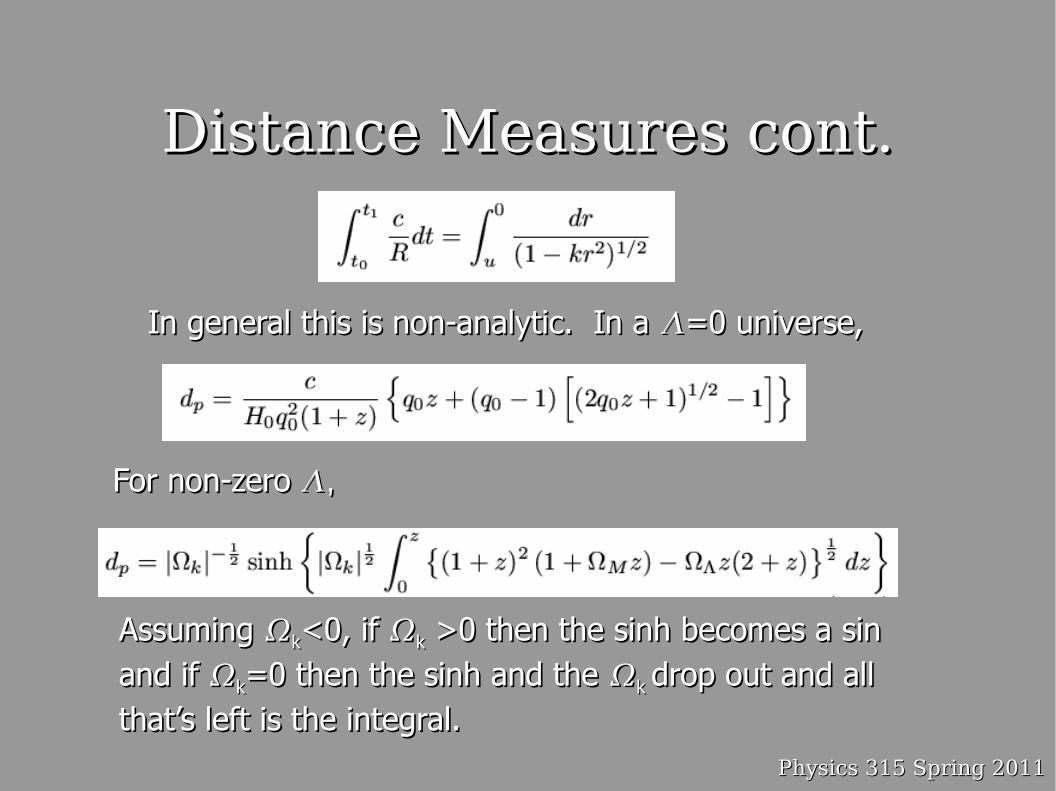
Assuming Assuming kk<0, if <0, if kk >0 then the sinh becomes a sin >0 then the sinh becomes a sinand if and if kk=0 then the sinh and the =0 then the sinh and the k k drop out and alldrop out and allthat’s left is the integral. that’s left is the integral.
For non-zero For non-zero ,,
In general this is non-analytic. In a In general this is non-analytic. In a =0 universe,=0 universe,
Physics 315 Spring 2011Physics 315 Spring 2011
Distance Measures cont.Distance Measures cont.
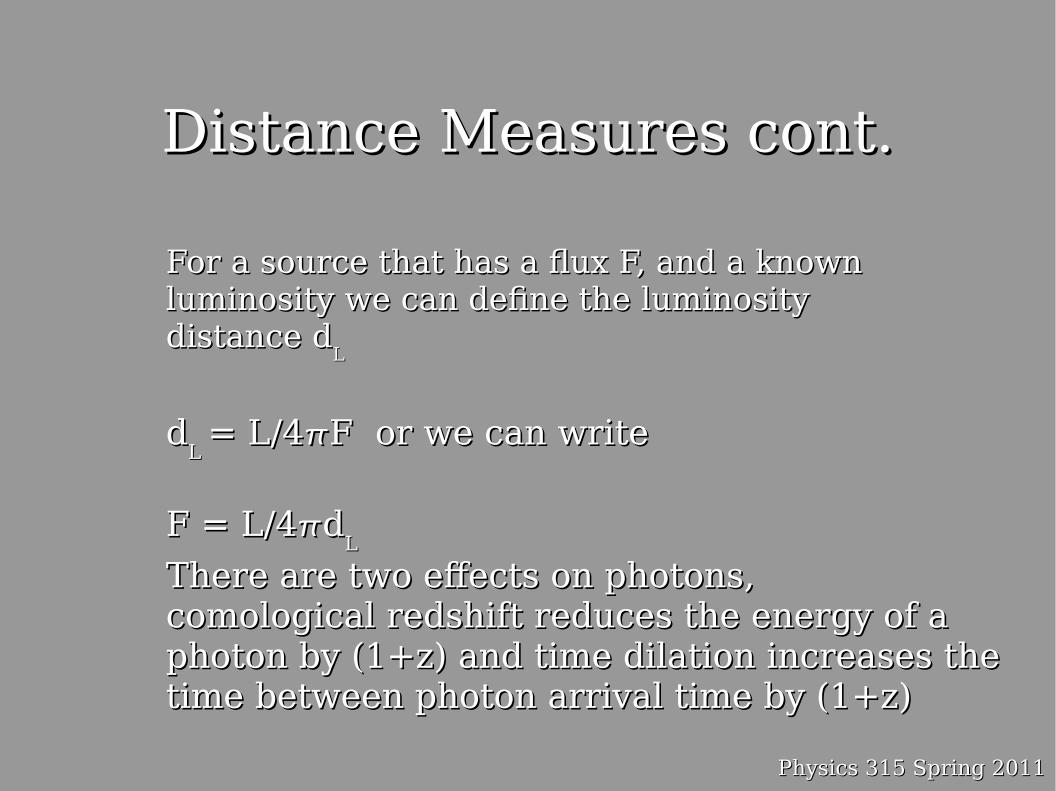
For a source that has a fux F, and a known For a source that has a fux F, and a known luminosity we can defne the luminosity luminosity we can defne the luminosity distance ddistance d
LL
ddL L = L/4= L/4F or we can writeF or we can write
F = L/4F = L/4ddLL
There are two efects on photons,There are two efects on photons,comological redshift reduces the energy of a comological redshift reduces the energy of a photon by (1+z) and time dilation increases thephoton by (1+z) and time dilation increases thetime between photon arrival time by (1+z)time between photon arrival time by (1+z)


![arXiv:1208.3522v1 [astro-ph.CO] 17 Aug 2012richard/ASTRO620/Cappellari_ATLAS_models.pdf1 Sub-department of Astrophysics, Department of Physics, University of Oxford, Denys Wilkinson](https://img.pdfslide.us/doc/110x75/5ec4a4721d09796673191374/arxiv12083522v1-astro-phco-17-aug-2012-richardastro620cappellariatlas-1.jpg)