Embed Size (px)
Citation preview
Lutz Bellmann, Herbert Düll, Jürgen Kühl, Manfred Lahner, Udo Lehmann
Patterns of Enterprise Flexibility:
IAB Establishment Panel Results,Western Germany, 1993-95*
0 Abstract
1 Introduction: Defining Flexibility
2 The IAB-Establishment Panel: Complementary Data
3 Job Turnover and Labour Turnover: Numerical Flexibilityof Human Resources
4 Time: Another Dimension of Flexibility of Human Resourcesand Establishments
5 Trends in Wage Differentials and Wage Gaps
6 Technical and Organisational Renewal, Investment andInnovation: further means of achieving flexibility
7 Modern Technology, Organisational Changes and EmploymentFlexibility
8 Functional Flexibility and Training
9 New Establishments, Hive-off and Integration of Units
10 Prospects
11 References
* Lutz Bellmann, Herbert Düll, Jürgen Kühl, Manfred Lahner, Udo Lehmann: Patterns of Enterprise
Flexibility in Germany. Results of the IAB Establishment Panel 1993-1995. Country Report for theOECD-Project : ‘Technological and Organisational Change and Labour Demand - the Flexible Enter-prise: Human Resource Implications" on behalf of the Federal Ministry of Education, Science, Rese-arch and Technology, Nuremberg 1996, Institute for Employment Research.
IAB Labour Market Research Topics 24 (1997) 2
0. Abstract
The debate on flexibility has recently shifted focus from individual employees, forms ofemployment and remuneration to converge on the entire range of options open to corpo-rations, in particular technological upgrading, research, innovation in tandem with in-vestment, longer operating times, organisational changes, in-house basic training andadvanced training. So flexibility at the level of the individual establishment and its effectson the economy and employment system are now centre-stage. The purpose of the IABEstablishment Panel was to undertake empirical employment research in the form of in-terviews, followed up annually in the same establishments and new units, with a view tobuilding up a new range of data on individual companies. This process has yielded repre-sentative results on the process of introducing flexibility in business activities, with morethan 4,000 usable statements for all 1.6 million establishments of every size class andsector. Compared with case studies in flexible companies, sectoral studies on the use anddistribution of key technologies or new forms of organisation, and analyses of develop-ments of new corporate forms or services that are said to be exemplary, our results en-able statements to be made for individual units and the economy as a whole for all estab-lishments in western Germany. Our analysis concentrates on data obtained at the man-agement level of establishments, for taken together, they make up the competitive fabricof Germany and determine the flexibility of the production and employment system.
1. Introduction: Defining Flexibility
The German model of employment is characterised by consensual industrial relations,high union membership and even higher union involvement in wages, apprenticeshiptraining and adult education issues, and social security provision for all. Numericallyflexible manpower planning has never been an important factor in German labour marketpolicy with any impact on employment at will, atypical forms of work, inefficiently highwage differentials and the working poor, or even full-time, year-round contracts at legalminimum wages. The goal of labour market flexibility is not to maximise job and labourturnover.
Flexibility at the level of the enterprise is not primarily intended to lower labour costs.Enterprise flexibility mainly involves functional elements such as R&D, technological andorganisational change, innovation and investment, an increasing variety of operating orbusiness hours (in addition to reduced and flexibly implemented working hours), and in-house training of young and adult workers. It focuses on human resource management(Standing, 1995) and on improving profitability with a view to eliminating the reasonsfor poor enterprise performance and lack of competitiveness.
Behind the demand for more flexibility, (reflected in more movement of employees be-tween enterprises, deregulation of labour law and collective bargaining, new forms ofworking time and even greater wage differentiation, for example), is also the assumptionthat Europe, in contrast to the United States, has a number of institutions, regulations,official practices and policies that may prevent companies from operating efficiently orbeing competitive on world markets. An evaluation of these factors on an enterprise level
IAB Labour Market Research Topics 24 (1997) 3
may indicate whether such assumptions are correct and whether the range of availableoptions is being utilised.
The OECD Jobs Study (OECD, 1994) diagnoses the cause of continuing high levels ofunemployment as being the member states’ inability to adapt quickly and creatively to aworld of rapid structural change with new goods, markets, technologies, services andcommunication routes. The study recognises the central role played by enterprises in thisprocess, but it does not explore the ways they are responding to the challenge in the ar-eas of R&D, innovation, nor their efforts at external and internal organisational restruc-turing and introducing new working time patterns and independent operating times. Thestudy makes no mention at all of implications for corporate personnel management, in-house basic and advanced training and the role of corporate planning.
Brodsky (1994) has outlined the changes in the OECD strategy for the promotion of la-bour market flexibility over the last thirty years (e.g. OECD 1986), and he objects that ithas not reduced unemployment; moreover, he believes it has encouraged sub-standardemployment and undermined minimum social standards. Brewster, Hegewisch andMayne (1994) argue that aspects of labour market flexibility have generally been ap-praised indirectly, and not from the standpoint of the enterprise, i.e. by looking at inflowsand outflows of personnel (numerical flexibility) and atypical, often insecure employmentarrangements: part-time, fixed-term employment contracts, employment for only part ofa year and labour law regulations. More recent studies on more flexible working timesand remuneration and on decoupling working time from operating times tend to focus onthe macro-economic effects on employment, rather than look at what is happening ac-tively at enterprise level.
The distinction between a core and a peripheral workforce, as defined by either thesegmentation theories of the seventies or by Atkinson (1985), does take us back to thelevel of the enterprise, but it is rather vague; there is little empirical evidence and the dis-tinction is imprecise at a strategic level because it cannot be shown that enterprises formand utilise core and peripheral workforces as part of their personnel strategy.
Nevertheless, a combination of the two arguments does lead to the conclusion that la-bour market flexibility outside the enterprise is closely related to internal flexibility. Toomuch or too frequent external flexibility can have negative effects on the workforce’sproductivity, and on the enterprise’s commitment to an efficient workforce, restructuringand necessary internal job changes. Often, enterprises do not provide in-house basic andadvanced training for personnel who are temporary or on fixed-term contracts, seasonal,employed for only a few hours a week, part-time, peripheral etc., part of the reason beingbecause it does not really pay off. So functional flexibility within the enterprise and forthe workforce as a whole comes to be of decisive importance in coping strategically withexternal adjustment constraints (Semlinger, Frick, 1995). Productivity gains have to beplanned; work must be organised to meet market, customer and production needs; col-lectively agreed and individually requested working times must be balanced with thelonger operating times that are necessary; and internal staff qualifications and participa-tion must be enhanced.
In the past, efforts have been focused on achieving greater and better flexibility of em-ployment, labour law regulations, working time arrangements and remuneration with
IAB Labour Market Research Topics 24 (1997) 4
greater differentiation in order to reduce labour costs. 146 British case studies, mostly ofbig companies (Institute of Management, 1995), have shown that greater manpowerflexibility has usually been introduced mainly for cost reasons. More than three quartersof all reorganisations to date have involved job losses at every level of the firm. 60% ofthe British firms surveyed anticipate further staff reductions. They all expect flexibleforms of work organisation to predominate one day, but they see a danger here: a poten-tial decline in company loyalty and cohesion if the workforce becomes an arbitrarygrouping, with the core workforce losing its morale. It was felt that the way tostrengthen a company’s competitiveness is by developing flexible activities (e.g. newproducts, markets, production techniques, forms of organisation, patterns of workingtime and qualification processes), although they must be strategic: the workforce andtheir representatives must be involved. This will require adequate job security with ongo-ing personnel training opportunities.
The European Commission (1995) has pointed out how external and internal flexibilityare related and how both are important for economic growth, competitiveness and em-ployment. The ILO (1995) also views enterprises as being flexible protagonists whenthey are forced to adjust to new markets, technologies, forms of organisation and em-ployment, and to modernise in order to remain productive (and therefore competitive),yet offer decent jobs.
The OECD too emphasises enterprise flexibility and its implications for personnel policyin the process of technological and organisational change. The main focus of the OECDanalysis, and consequently of political attention and at-large discussion, are private andpublic enterprises and their organisational behaviour.
Our analysis of enterprise flexibility and its implications for personnel management andtraining is based on the following definition of flexibility, comprised of three parts:
- The ability of establishments to adjust constructively to external constraints resultingfrom labour law and collective agreements on working times and remuneration andpersonnel representation;
- The ability of establishments to adjust to new requirements by undertaking research,investment, and implementing innovation and technical and/or organisational moderni-sation. This includes the provision of in-house basic and advanced training to upgradepersonnel management strategies and qualifications. We look at new establishments,their survival rates and employment effects, as well as splitting and the merging ofexisting establishments;
- The ability of establishments to cope with short-term and medium-term personnel dif-ficulties, to pursue strategic employment policy objectives and priorities, and to im-plement production, investment and manpower plans.
The analysis is mainly of a descriptive nature, using many indicators. In some cases, italso addresses the interaction between indicators. Substantial longitudinal analyses of thethree different definitions of flexibility have been left for the future, when more than thefirst three ‘waves’ of the IAB Establishment Panel are available.
IAB Labour Market Research Topics 24 (1997) 5
The paper first looks at job and labour turnover, focusing on numerical flexibility andemployment contracts, working and operating times and remuneration. It goes on to ex-amine how technical and organisational change affect research, product innovation andinvestment and what this means for functional flexibility. This is followed by a discussionof the importance of training for corporate flexibility. Lastly, the paper describes the de-velopment of new establishments and the integration or hive-off effects.
It is important to read this paper against the backdrop of employment trends in westernGermany between 1992 and 1995: from a historic peak of 29.5 million employed in1992, there was a steady decline of about one million over the next twelve months, to28.5 million in 1995. Employment losses continued in 1996, but in 1997 there have beensome signs of stability.
2. The IAB-Establishment Panel: Complementary Data
In the past, the discussion on flexibility has always suffered from a lack of empirical evi-dence. Most studies concentrate on workers or the unemployed, working times andwages. Labour market statistics, national sources that have been made internationallycomparable and most research projects draw on employee, working hours and remu-neration data for their flexibility statistics, not on the real protagonists, the enterprises.At most, there are some individual case studies, a few sectoral studies and some surveysthat are not representative, but none of them is really internationally comparable.
The international organisations have concluded from this that new reporting systemsneed to be created on an enterprise level. The OECD bases its work on new surveys ofenterprises in some member states. The EU has commissioned EUROSTAT (1995) tocarry out the European Enterprise Panel Project and study the effects of the Europeansingle market on enterprises. The ILO has carried out surveys in enterprises in more than20 countries on ‘Flexible Enterprises and Human Resource Management’ (ILO 1995).
In the Federal Republic of Germany, the Institute for Employment Research (IAB) de-veloped such a reporting strategy in the early 1990s (Projektgruppe IAB-Betriebspanel1991, 1994, 1995). Every year interviews are conducted on a management level in about4,000 establishments employing altogether about 3 million workers. This yields a randomsample of 0.3% of all 1.6 million western German establishments, accounting for about11% of the total workforce and is representative of all sectors and establishment sizes.The fact that the process is repeated annually allows for accurate individual macro-economic longitudinal analyses. New establishments, hive offs and closures are also in-cluded.
The units surveyed are establishments (not companies), i.e. local units that producegoods or services; they must have an operating ID number allocated by the labour officeand have at least one wage or salary earner for whom statutory social insurance contri-butions are payable. The Federal Employment Institute employment statistics draw onthe same source, and together with the IAB Establishment Panel data, they are the mainsource of data for this paper. Data from the first three ‘waves’ of the EstablishmentPanel (1993/1994/1995) are used; eastern Germany has been included in 1996. The datafrom the IAB Establishment Panel random sample is generally extrapolated proportion-ately. The total reference figure is the number of establishments (units) according to em-
IAB Labour Market Research Topics 24 (1997) 6
ployment statistics data; reference date: 30 June of the previous year; the random sam-ples are weighted and extrapolated using that structure.
In regard to the results, it must always be borne in mind that smaller and medium-sizedestablishments employing up to fifty persons constitute 95% of the total 1.6 million es-tablishments but account for only 45% of the total workforce. The average establishmentemploys a workforce of only 18. The results of an analysis carried out purely on estab-lishment level will therefore always reflect the predominance of such smaller units.Looked at from the angle of employment, the effects on personnel and labour marketpolicy will emerge more strongly.
3. Job Turnover and Labour Turnover: Numerical Flexibility of HumanResources
The most comprehensive way to measure numerical flexibility is to look at the job turn-over caused by jobs being created and destroyed as a result of hirings and firings by exist-ing establishments and by the creation of new businesses and plant closures (OECD1987, Cramer/Koller 1988, Cramer/Boeri 1991). A high job reallocation ratio means thatthe employment system can react flexibly to changing structures, regulations and poli-cies.
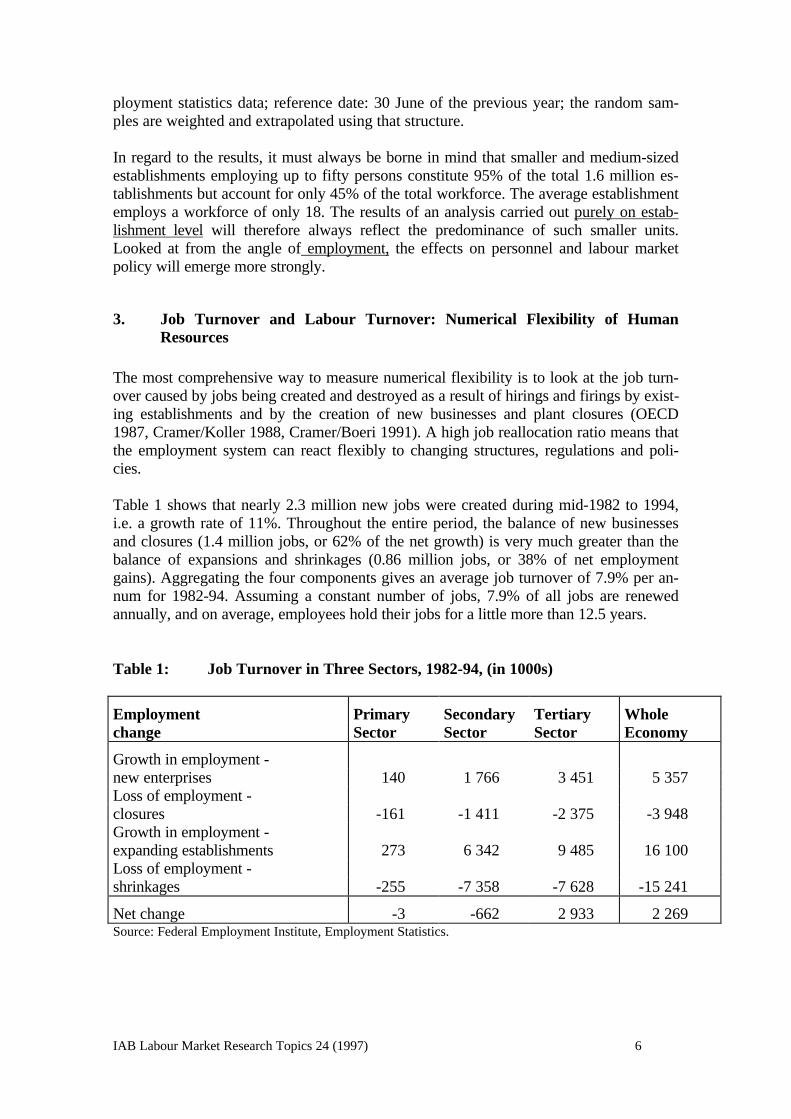
Table 1 shows that nearly 2.3 million new jobs were created during mid-1982 to 1994,i.e. a growth rate of 11%. Throughout the entire period, the balance of new businessesand closures (1.4 million jobs, or 62% of the net growth) is very much greater than thebalance of expansions and shrinkages (0.86 million jobs, or 38% of net employmentgains). Aggregating the four components gives an average job turnover of 7.9% per an-num for 1982-94. Assuming a constant number of jobs, 7.9% of all jobs are renewedannually, and on average, employees hold their jobs for a little more than 12.5 years.
Table 1: Job Turnover in Three Sectors, 1982-94, (in 1000s)
Employment Primary Secondary Tertiary Wholechange Sector Sector Sector Economy
Growth in employment -new enterprises 140 1 766 3 451 5 357Loss of employment -closures -161 -1 411 -2 375 -3 948Growth in employment -expanding establishments 273 6 342 9 485 16 100Loss of employment -shrinkages -255 -7 358 -7 628 -15 241
Net change -3 -662 2 933 2 269Source: Federal Employment Institute, Employment Statistics.
IAB Labour Market Research Topics 24 (1997) 7
Looking at each economic sector separately, clearly de-industrialisation was causedmainly by the lack of compensation for shrinking establishments in the primary sector.The number of new enterprises was small and could not compensate for job losses.
The job growth in the services sector was due partly to a clear surplus of new firms overclosures and to the fact that even more establishments were expanding rather thanshrinking. Nevertheless, more jobs were lost in this sector as a result of plant closures(-2.4 million) and declining firms (-7.6 million) than in the secondary sector.
According to the OECD (1987, 155ff), turnover in Germany in the 1980s was lower thanin some other member countries. The results presented here indicate that it has not risenfurther.
All these gross and net changes in employment reflect labour turnover, i.e. the sum ofinflows and outflows in relation to average personnel figures over the period of a year.Labour turnover is a key factor in renewing and rejuvenating the workforce, as new em-ployees bring new knowledge and require lower wage payments. Outflows create up-ward mobility for those that remain, and opportunities for internal transfers, for recallsand for saving labour costs.
According to the IAB Panel on Establishments labour turnover is considerable, at around11% per year of the total workforce, with a slightly rising trend for 1993-95. The figurefor SMEs employing up to 50 persons is 12-14%, a downward trend, which is neverthe-less still double that of larger firms where downsizing has resulted in higher labour turn-over.
The OECD calculates western Germany’s labour turnover to have been about 25% in1984 (OECD Part II, 1994, p. 64); German sources estimate it to be 28.9%(Cramer/Koller 1988, p. 369) - a relatively high figure compared with estimates in man-agers’ surveys:
- The Panel surveys all employed persons (i.e. self-employed, family workers, civil ser-vants, officials) and all industries - not only those covered by social security (+/- 80%of the workforce). Job turnover for the whole economy is lower, since more stableemployment is included and the total workforce is much bigger (about 29 million).
- Inflow and outflow figures obtained from interviews are only about 50% as high asthe movements officially registered under statutory social insurance requirements.Data on inflows and outflows during a six month period obtained during interviewsare imprecise and incomplete in respect of the groups included and what the managersinterviewed actually remember. Brief periods of employment, breaks, recalls,fixed-term contracts and extra staff - even if registered and accounted for - are some-times not considered inflows or outflows.
Some inconsistencies in data remain: if, regardless of industry or size of enterprise, atleast 11% of the workforce move every year, then there are many opportunities for re-newals and internal transfers. Instead of looking at obstacles to flexibility in rigid person
IAB Labour Market Research Topics 24 (1997) 8
nel structures, it might be better to examine the costs and erosion effects of excessivelabour turnover.
Labour and social legislation designed to prevent staff cuts is frequently used as a tool tocontain flexibility if employers do not take on personnel, delay in doing so, employ toofew people or hire them only on fixed-term contracts, or if groups of workers that enjoyspecial protection are not taken on.
According to the IAB Establishment Panel, about 36% of all outflows during 1993-95were initiated and carried out by the employer. If half of the terminations by mutual con-sent are included, e.g. older workers accepting earlier retirement, the figure is clearlyover 40%. Terminations by the employer account for about one quarter, and the expira-tion of fixed-term contracts nearly 10%, a rising trend. 3% to 4% of all outflows resultfrom transfers to other establishments of the same firm. While in energy/mining, bank-ing/insurance and in the public sector, 20% of all outflows were initiated by the em-ployer, the figure was around twice as high in private production and service industries.During the recession in 1993 and subsequent cutbacks, large establishments reduced theirworkforce considerably.
The idea of a flexible enterprise with a core and a peripheral workforce originated fromsegmentation theories and has recently become established (Atkinson 1985), despite thecritics who argue that there is no precise definition and little empirical evidence of dataor strategy, and that it might be a consequence of service sector expansions (Brewsteret al, 1994, pp. 187-189). Generally, the core workforce is employed on a permanentbasis: they work full-time and year-round, they have job security and personnel represen-tation; they are functionally flexible and participate in in-service training; at most, theymay be confronted with contract annulment, golden handshakes and social plans for earlyretirement. A peripheral workforce bears all employment risks; they work only for a fewhours a week, on fixed-term contracts or not throughout the year; their jobs are part-time, irregular and possibly even precarious; some are subcontracted (Kühl 1990, 1995).Recent additions to the peripheral workforce are the ‘quasi’ self-employed, temporaryworkers, persons teleworking at home, or on screens, on networks and for virtual firms.This ‘complementary employment’ is believed to be extensive and expanding, fuelled bythe endeavour to reduce labour costs.
If useful data is to be gathered from interviews in firms, the definition of atypical formsof employment must be pragmatic. Part-time work, which in western Germany ac-counted for about 14% of all workers covered by social security in 1995, (or even 21%,when including persons employed for a few hours a week), has now become a normalphenomenon, part of the trend away from full-time employment. According to the IABEstablishment Panel, about 3.5 million workers were employed for a few hours a week in1995. As this data was not calculated for 1993 and 1994, these workers cannot be in-cluded in the peripheral workforce for those years, although they do represent an impor-tant form of numerical flexibility.
In this paper, peripheral employment is defined as:
- fixed-term employment- extra staff, occasional workers, staff on practical courses
IAB Labour Market Research Topics 24 (1997) 9
- sub-contracted workers- independent workers on service- or works-contracts.
These four groups of workers account for 8-9% of the total workforce (including theperipherally employed); the 1993-95 trend is upward. In larger establishments, all fourperipheral forms occur simultaneously. SMEs in particular have an above-average pro-portion of these groups; in larger firms the figure is around 6%. The slight upward trendin 1993-95 indicates that personnel cuts were also carried out in the core area: establish-ments did not already have a strategic and expansive peripheral workforce.
4. Time: Another Dimension of Flexibility of Human Resources and Establishments
Just as important as the three aspects of numerical flexibility discussed above is the con-cept that greater flexibility in working and operating times, together with a steady reduc-tion in annual working times, will help employment policy by securing existing jobs oreven enabling firms to employ more people. After initial confrontations in em-ployer/union bargaining over reduced vs. more flexible working time and implementationon the establishment level, there is now consensus that collectively-agreed working timepolicies have to be managed on the establishment level. When asked about corporatepolicy aims, like improving quality, increasing productivity, organisational restructuringand personnel cuts, more than a fifth of all establishments said in mid-1995 that ‘moreflexible working and operating times’ was a priority objective. For about 4% it was themost important one.
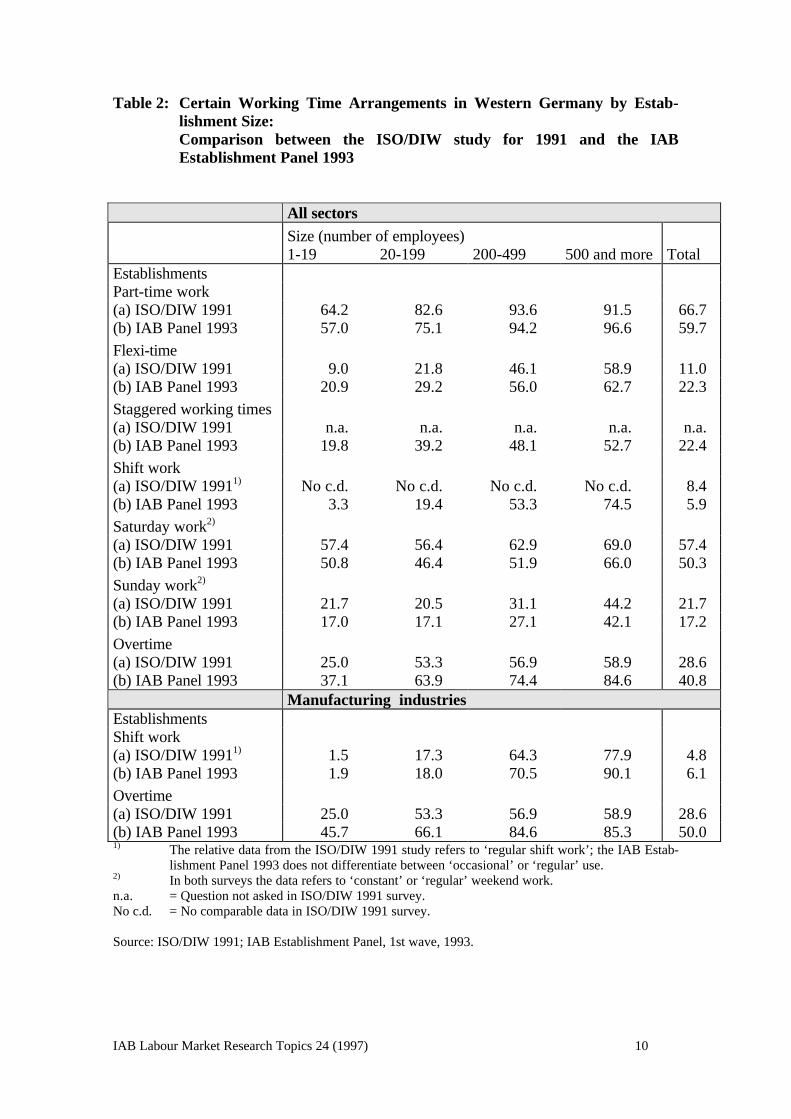
Table 2 summarises the numbers of establishments which practise a certain working timemode (or combinations) and compares the results with the 1991 ISO/DIW study (Großet al). The variation of working time patterns is very large and increases as establishmentsize increases:
IAB Labour Market Research Topics 24 (1997) 10
Table 2: Certain Working Time Arrangements in Western Germany by Estab-lishment Size:Comparison between the ISO/DIW study for 1991 and the IABEstablishment Panel 1993
All sectorsSize (number of employees)1-19 20-199 200-499 500 and more Total
EstablishmentsPart-time work(a) ISO/DIW 1991 64.2 82.6 93.6 91.5 66.7(b) IAB Panel 1993 57.0 75.1 94.2 96.6 59.7
Flexi-time(a) ISO/DIW 1991 9.0 21.8 46.1 58.9 11.0(b) IAB Panel 1993 20.9 29.2 56.0 62.7 22.3
Staggered working times(a) ISO/DIW 1991 n.a. n.a. n.a. n.a. n.a.(b) IAB Panel 1993 19.8 39.2 48.1 52.7 22.4
Shift work(a) ISO/DIW 19911) No c.d. No c.d. No c.d. No c.d. 8.4(b) IAB Panel 1993 3.3 19.4 53.3 74.5 5.9
Saturday work2)
(a) ISO/DIW 1991 57.4 56.4 62.9 69.0 57.4(b) IAB Panel 1993 50.8 46.4 51.9 66.0 50.3
Sunday work2)
(a) ISO/DIW 1991 21.7 20.5 31.1 44.2 21.7(b) IAB Panel 1993 17.0 17.1 27.1 42.1 17.2
Overtime(a) ISO/DIW 1991 25.0 53.3 56.9 58.9 28.6(b) IAB Panel 1993 37.1 63.9 74.4 84.6 40.8
Manufacturing industriesEstablishmentsShift work(a) ISO/DIW 19911) 1.5 17.3 64.3 77.9 4.8(b) IAB Panel 1993 1.9 18.0 70.5 90.1 6.1
Overtime(a) ISO/DIW 1991 25.0 53.3 56.9 58.9 28.6(b) IAB Panel 1993 45.7 66.1 84.6 85.3 50.01) The relative data from the ISO/DIW 1991 study refers to ‘regular shift work’; the IAB Estab-
lishment Panel 1993 does not differentiate between ‘occasional’ or ‘regular’ use.2) In both surveys the data refers to ‘constant’ or ‘regular’ weekend work.n.a. = Question not asked in ISO/DIW 1991 survey.No c.d. = No comparable data in ISO/DIW 1991 survey.
Source: ISO/DIW 1991; IAB Establishment Panel, 1st wave, 1993.
IAB Labour Market Research Topics 24 (1997) 11
(i) Part-time work was a feature in 60% of all establishments in 1993 and expanded toalmost three quarters of all firms in 1995. Following the 1993 recession, the ratio ofall part-timers to the total workforce increased from 15.8% to 21.9% in 1995. Thisratio includes 3.5 million employment contracts of less than 15 hours per week in1995, of which 2.5 million were women. If we restrict part-time work to jobs cov-ered by social security, in 1995 14.1% of all staff members under social securitywere part-time. In the primary sector, 4.7% were part-time, although 63.4% of cor-responding establishments had at least one part-timer. Private services had 19.9%and public services 23.2% part-time jobs covered by social security. Thus, we cansee that this phenomenon is normal - or even on the increase - in private and publicestablishments, where one fifth of all employment contracts and one seventh of alljobs covered by social security are part-time.
(ii) Flexible working hours are practised by 22.3% of all establishments - again morefrequently in larger firms - not only in administration, but in commercial and techni-cal divisions and customer-oriented services as well. Flexi-time contracts account for24% of total employment on average; most (almost 57%) are found in public sectoremployment.
(iii) Staggered working times are regarded by employers as a suitable means to extendopening or operating times, although from the employees’ perspective they offer lessindividual control over individual working hours than flexi-arrangements. Neverthe-less, the percentages of establishments with staggered working times is just as high(22.4%) as those implementing flexi-time. On average, about 13% of the workforcework staggered hours: in the tertiary sector the figure is 20%. In manufacturing in-dustries, especially in medium-sized and large firms, shift work takes the place ofstaggered working hours. There are more and more permutations of both arrange-ments appearing, and both are becoming increasingly independent.
(iv) Shift work was performed in 5.4% of all establishments in 1993, with a slightlyhigher proportion in manufacturing industries. More than half of all establishmentswith 200-499 employees perform shift work, and in larger firms, as many as threeout of four employees work shifts. The figures are even higher for manufacturing in-dustries. For methodological reasons, however, too much importance should not beplaced on the shift work figures in both studies. Employers’ decisions on shift workor job-sharing systems are decisions of principle and only slight changes are to beexpected over time. This assertion is confirmed by the fact that the numbers of em-ployees doing shift work are quite stable.
(v) Weekend work: in 1993 in 50% of the establishments, work was performed on Sat-urdays and in 17% on Sundays. Both surveys found the figures for all size classes de-creased in 1991-93, perhaps due to the end of the unification boom, to the recessionin 1993 and to subsequent low rates of capacity utilisation. Nearly a quarter of theworkforce work regularly on Saturday, and nearly 10% on Sundays as well. But thenumber of employees affected by weekend work has fallen since the late eighties.There are legal restrictions on Sunday work, so most weekend work is still per-formed on Saturdays. Nearly half the establishments performing Saturday work‘normally’ work ‘every’ Saturday, and are mainly in the service sector. In manufac
IAB Labour Market Research Topics 24 (1997) 12
turing industries, one third of all establishments surveyed included Saturday in theiroperating time which is covered by shift work.
(vi) Overtime was performed in 40.8% of all establishments and in half of the manufac-turing industries in 1993. Due to the recession and slow growth, and due to the ef-forts to reduce overtime made by works’ councils and management, the number ofestablishments using overtime decreased from 40.8% to 24.9 during 1993-95; due tothe business cycle, manufacturing industries reduced overtime from 50% to 40.1%in 1994 and 42.9% in 1995 (first half). However, this did not involve any general re-duction in paid overtime, as in the decreasing number of establishments with over-time work, paid overtime as a proportion of the total volume of labour increasedfrom 2.8% in the first half of 1993 to 4% in the first half of 1995. Most establish-ments are still using overtime as a short-term adjustment option in the course of thebusiness cycle.
There is much evidence that an increasing variety and extension of working and operat-ing time patterns indicate widespread temporal flexibility of human resources and estab-lishments. Greater flexibility in working times and cost-optimal choices of operating timeare important indicators of economic performance and competitiveness. While the dis-cussion has so far concentrated on the weekly duration of operating times (Bosch 1991;Hofmann 1995, Seifert 1995b), their adaptability, extension and variability in a down-ward trend of collective agreements of weekly hours and the strong desire of the work-force for flexible working times (Stille 1995) are even more important. Many studies(Reyher et al,1985, ISO/DIW 1991) have shown that the dissociation of working andoperating times has been on the increase in every industry.
The IAB Establishment Panel 1995 therefore investigated whether operating times gobeyond the agreed weekly working time, and if so, which patterns of working time ar-rangements were implemented.
Table 3 shows that only one third of establishments ‘decouple’, but the number clearlyincreases with the size of the firm to reach about three fifths for large firms employing aworkforce of 500 or more. Keeping in mind that SMEs employing a maximum of 19 staffaccount for 90% of all firms, overtime is the most important form of dissociation, fol-lowed by staggered working times and weekend work. Combinations of full and part-time work, flexi-time and shift work are mainly implemented in bigger firms employingmore than 200 people. If, however, the answers are weighted to reflect the workforce,shift work is the main form of dissociation (cf. European Commission, 1995, No. 25),especially in manufacturing industries.
More than half of all establishments with longer operating hours than working hoursmake use of only one form of dissociation, mainly ‘regular overtime’: nearly two fifth ofestablishments in the manufacturing industries, one third in the private service sector, andjust 12% in public services. Almost one third of all establishments implement two formsof dissociation; and 15%, three or more.
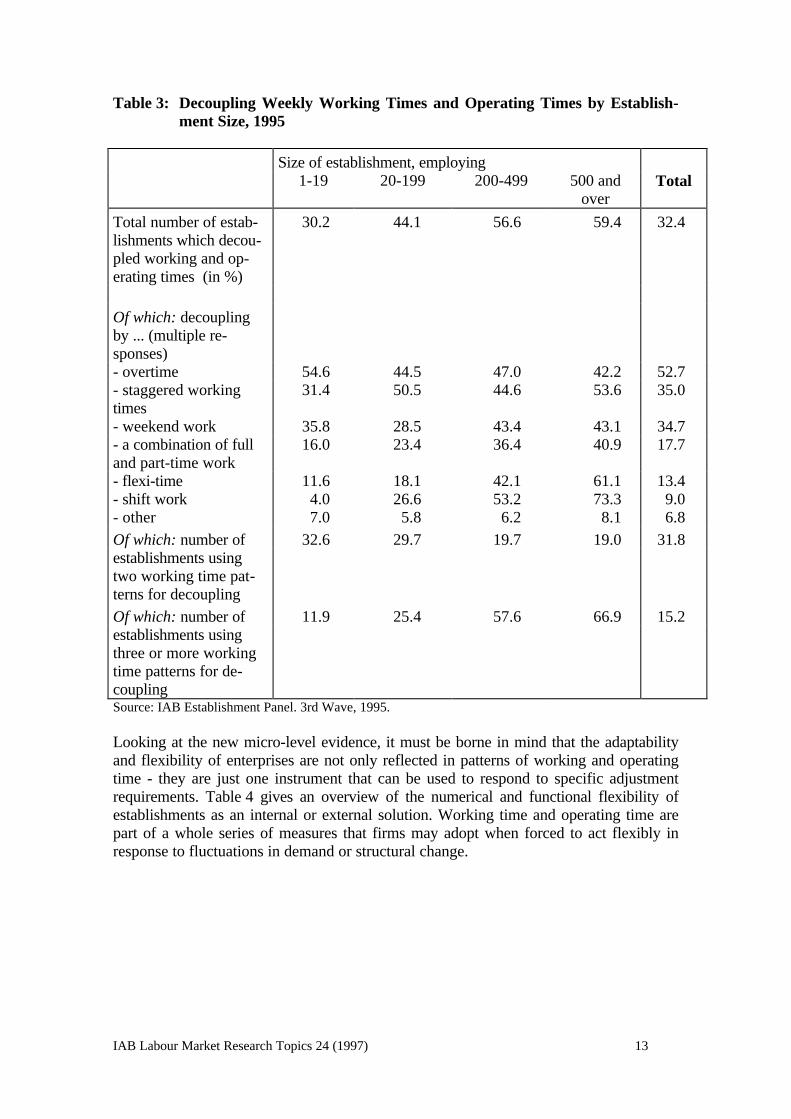
IAB Labour Market Research Topics 24 (1997) 13
Table 3: Decoupling Weekly Working Times and Operating Times by Establish-ment Size, 1995
Size of establishment, employing1-19 20-199 200-499 500 and
overTotal
Total number of estab- 30.2 44.1 56.6 59.4 32.4lishments which decou-pled working and op-erating times (in %)
Of which: decouplingby ... (multiple re-sponses)- overtime 54.6 44.5 47.0 42.2 52.7- staggered workingtimes
31.4 50.5 44.6 53.6 35.0
- weekend work 35.8 28.5 43.4 43.1 34.7- a combination of fulland part-time work
16.0 23.4 36.4 40.9 17.7
- flexi-time 11.6 18.1 42.1 61.1 13.4- shift work 4.0 26.6 53.2 73.3 9.0- other 7.0 5.8 6.2 8.1 6.8
Of which: number of 32.6 29.7 19.7 19.0 31.8establishments usingtwo working time pat-terns for decoupling
Of which: number of 11.9 25.4 57.6 66.9 15.2establishments usingthree or more workingtime patterns for de-couplingSource: IAB Establishment Panel. 3rd Wave, 1995.
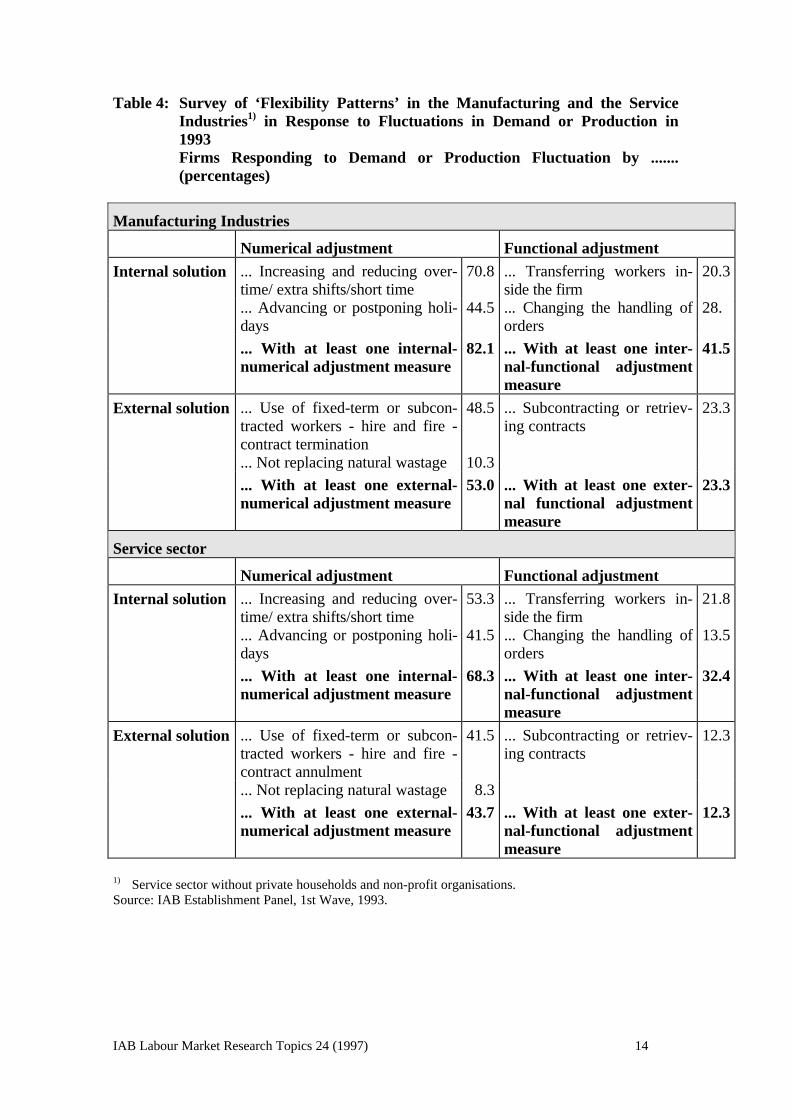
Looking at the new micro-level evidence, it must be borne in mind that the adaptabilityand flexibility of enterprises are not only reflected in patterns of working and operatingtime - they are just one instrument that can be used to respond to specific adjustmentrequirements. Table 4 gives an overview of the numerical and functional flexibility ofestablishments as an internal or external solution. Working time and operating time arepart of a whole series of measures that firms may adopt when forced to act flexibly inresponse to fluctuations in demand or structural change.
IAB Labour Market Research Topics 24 (1997) 14
Table 4: Survey of ‘Flexibility Patterns’ in the Manufacturing and the ServiceIndustries1) in Response to Fluctuations in Demand or Production in1993Firms Responding to Demand or Production Fluctuation by .......(percentages)
Manufacturing Industries
Numerical adjustment Functional adjustment
Internal solution ... Increasing and reducing over-time/ extra shifts/short time
70.8 ... Transferring workers in-side the firm
20.3
... Advancing or postponing holi-days
44.5 ... Changing the handling oforders
28.
... With at least one internal-numerical adjustment measure
82.1 ... With at least one inter-nal-functional adjustmentmeasure
41.5
External solution ... Use of fixed-term or subcon-tracted workers - hire and fire -contract termination
48.5 ... Subcontracting or retriev-ing contracts
23.3
... Not replacing natural wastage 10.3
... With at least one external-numerical adjustment measure
53.0 ... With at least one exter-nal functional adjustmentmeasure
23.3
Service sector
Numerical adjustment Functional adjustment
Internal solution ... Increasing and reducing over-time/ extra shifts/short time
53.3 ... Transferring workers in-side the firm
21.8
... Advancing or postponing holi-days
41.5 ... Changing the handling oforders
13.5
... With at least one internal-numerical adjustment measure
68.3 ... With at least one inter-nal-functional adjustmentmeasure
32.4
External solution ... Use of fixed-term or subcon-tracted workers - hire and fire -contract annulment
41.5 ... Subcontracting or retriev-ing contracts
12.3
... Not replacing natural wastage 8.3
... With at least one external-numerical adjustment measure
43.7 ... With at least one exter-nal-functional adjustmentmeasure
12.3
1) Service sector without private households and non-profit organisations.Source: IAB Establishment Panel, 1st Wave, 1993.
IAB Labour Market Research Topics 24 (1997) 15
5. Trends in Wage Differentials and Wage Gaps
Pay flexibility may be inferred from wage differential trends, the number of establish-ments bound by collective wage agreements and the wage gap between wages/salariespaid and collectively-agreed figures. Contrary to trends evident in the OECD study(1993), wage differentials actually increased over time in western Germany: high payingmanufacturing sectors declined, low paying services expanded, while in both sectorswage dispersion was on the rise; trade unions lost power in terms of membership andinvolvement; changes in the international division of labour had severe repercussion onthe structure of employment; relatively undesirable employment for some hours perweek, and the numbers of fixed-term, seasonal, part-time jobs etc. expanded; technologi-cal developments, labour supply factors and female labour all grew.
A look at the daily wages of males in full-time employment (i.e. the core workforce) in31 industries between 1979-89, out of a 1% sample from the employment statistics re-veals a rising trend in wage differentials (Bellmann/Möller 1995). This trend is increasingin capital-intensive industries like petroleum and tobacco processing, but it is also on therise in high-tech industries like aircraft, data processing and chemical industries. Adownward trend is evident in clothing industries, food, steel construction, precision in-struments/optics and timber processing. As regards education and vocational training,the figures indicate an increase in qualification-dependent wage differentials, especiallyfor highly qualified workers (there is an upper limit to income according to social secu-rity requirements).
The evidence is in line with Bound and Johnson’s thesis (1992) that technical progresshas resulted in a drop in demand for semi-skilled manpower and an increase in demandfor better trained workers, in particular highly qualified employees.
The German system of regional and sectoral bargaining (Flächentarifvertrag), patternbargaining (Pilotabschlüsse) within and between regions and industries and collectivewage agreements that are binding on members and non-members alike, (Allgemeinver-bindlichkeitserklärung) leads to more or less standardised wages in many industries, in-cluding many firms that have to be flexible and pay higher wages in order to gain or keepskilled or specialised workers.
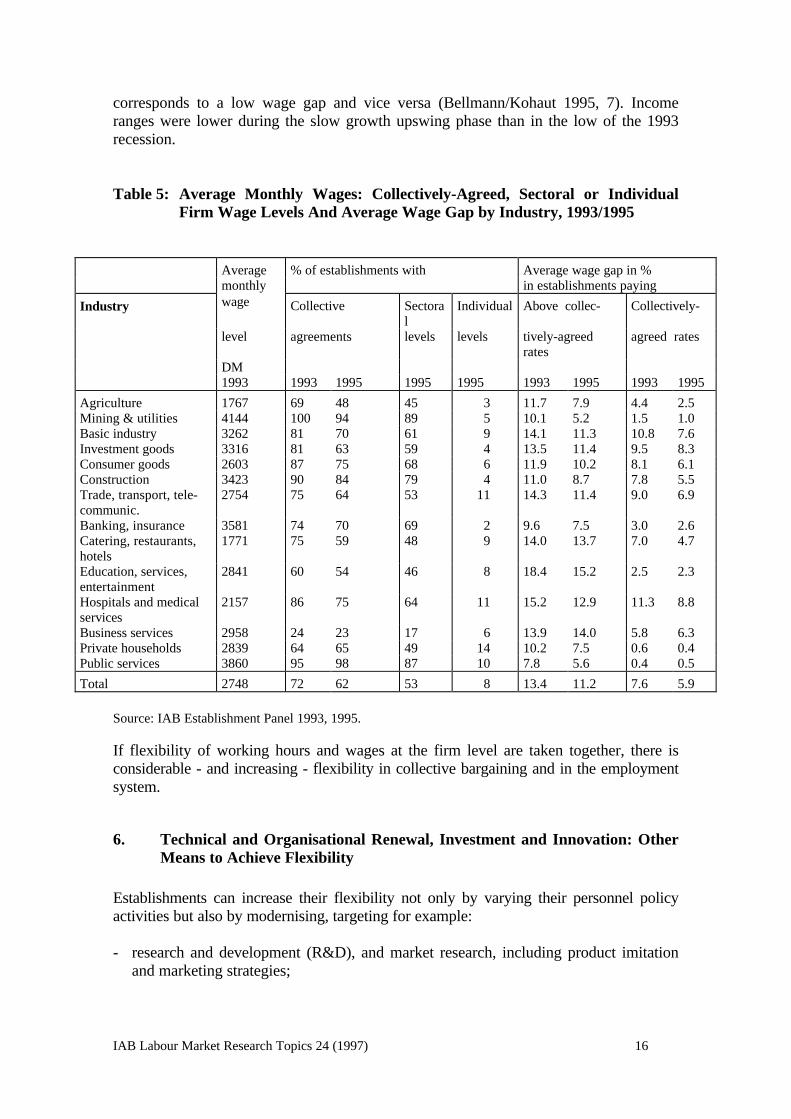
Table 5 shows that the number of establishments bound to collectively-agreed wagesdropped from 72% to 62% from 1993 to 1995. This result holds for all industries exceptpublic services and private households. Most of the collective wage levels had beenagreed on a sectoral level, while some industries used firm-specific rates, particularly thebig companies. As the numbers of establishments not bound by collective agreements andof those paying only collectively-agreed rates (of those bound by collective bargaining)have risen, the average wage gap fell between 1993 and 1995 from 13.4% to 11.2%. Thedecline is even more noticeable in regard to establishments bound by collective agree-ments - from 7.6% to 5.9%. This decline occurred in almost all industries except busi-ness services between 1993 and 1995. By mid-1993, the highest average monthly wageswere being paid by the mining industries, utilities (DM 4,144), public services(DM 3,860) and banking/insurance (DM 3,581). The lowest monthly gross wages werepaid in hospitals/medical services (DM 2,157), restaurants/hotels (DM 1,771) and in ag-riculture (DM 1,767). It can be seen that in some industries, a high average wage level
IAB Labour Market Research Topics 24 (1997) 16
corresponds to a low wage gap and vice versa (Bellmann/Kohaut 1995, 7). Incomeranges were lower during the slow growth upswing phase than in the low of the 1993recession.
Table 5: Average Monthly Wages: Collectively-Agreed, Sectoral or IndividualFirm Wage Levels And Average Wage Gap by Industry, 1993/1995
Average % of establishments with Average wage gap in %monthly in establishments paying
Industry wage Collective Sectoral
Individual Above collec- Collectively-
level agreements levels levels tively-agreedrates
agreed rates
DM1993 1993 1995 1995 1995 1993 1995 1993 1995
Agriculture 1767 69 48 45 3 11.7 7.9 4.4 2.5Mining & utilities 4144 100 94 89 5 10.1 5.2 1.5 1.0Basic industry 3262 81 70 61 9 14.1 11.3 10.8 7.6Investment goods 3316 81 63 59 4 13.5 11.4 9.5 8.3Consumer goods 2603 87 75 68 6 11.9 10.2 8.1 6.1Construction 3423 90 84 79 4 11.0 8.7 7.8 5.5Trade, transport, tele-communic.
2754 75 64 53 11 14.3 11.4 9.0 6.9
Banking, insurance 3581 74 70 69 2 9.6 7.5 3.0 2.6Catering, restaurants,hotels
1771 75 59 48 9 14.0 13.7 7.0 4.7
Education, services,entertainment
2841 60 54 46 8 18.4 15.2 2.5 2.3
Hospitals and medicalservices
2157 86 75 64 11 15.2 12.9 11.3 8.8
Business services 2958 24 23 17 6 13.9 14.0 5.8 6.3Private households 2839 64 65 49 14 10.2 7.5 0.6 0.4Public services 3860 95 98 87 10 7.8 5.6 0.4 0.5
Total 2748 72 62 53 8 13.4 11.2 7.6 5.9
Source: IAB Establishment Panel 1993, 1995.
If flexibility of working hours and wages at the firm level are taken together, there isconsiderable - and increasing - flexibility in collective bargaining and in the employmentsystem.
6. Technical and Organisational Renewal, Investment and Innovation: OtherMeans to Achieve Flexibility
Establishments can increase their flexibility not only by varying their personnel policyactivities but also by modernising, targeting for example:
- research and development (R&D), and market research, including product imitationand marketing strategies;
IAB Labour Market Research Topics 24 (1997) 17
- investment activity and priorities in stimulating production potential;
- innovations in products and production processes, including services;
- internal organisational changes like mergers, team-work, flattening hierarchies, just-in-time production, profit centres;
- in-house basic (i.e. apprenticeship) training and advanced training of staff.
Naturally, not every establishment engages in all these activities in a short space of time(e.g. a year), and so only longitudinal analyses can adequately measure the extent andfrequency of follow-up. Moreover, such activities may be undertaken individually or inconjunction with one another, depending on compatibility of content. For example, in-vestment in technology and innovation can entail organisational improvements and spe-cial staff training programs. Finally, research and training activities need not necessarilybe undertaken in the local production units: they can be centralised in the appropriateunits of the same enterprise.
R&D and market research are among the most important renewal strategies that an es-tablishment has to enhance its flexibility potential. The number of establishments engagedin such research activities is a function of the size of the company, rising to 70-90% inthe case of large enterprises. The average for the economy as a whole - 8% for all estab-lishments engaged in market and sales research and 5% in R&D - is deceptive, owing tothe preponderance of small units. Moreover, in the larger companies, (10% to 18%),research is more and more often assigned to a different unit in the holding company.
When SMEs engage in research, it is more on the sales than on the R&D side. Theycontribute 13.5% to that part of the GDP generated by research-intensive industries andare clearly very important, both for the national economy and for international invest-ment competition. In 1995, total German R&D expenditure was about DM 59.4 billion,although since the early 1990s, a decline in real terms has been evident. The share ofR&D expenditure (on fixed assets, personnel and investment) was still 1.8% of GDP in1991, but it is now only 1.6%. According to the Stifterverband für die Deutsche Wissen-schaft a total of 284,400 employees were working in R&D in 1994, nearly 12% fewerthan in 1991. While the big companies reduced the personnel in their research depart-ments by between 4% and 5% in 1993 and 1994, the research groups in the smaller andmedium-sized establishments that employ up to 500 staff remained unchanged. Unlikethe large companies that are cutting back on research at home, the smaller establishmentsactually increased their R&D expenditure in the first half of the 1990s.
A recent German Federal Ministry of Education, Science, Research and Technology re-port offers little hope of any noteworthy growth in employment in the technology sec-tors, as these are no longer the draught-horses for jobs in the manufacturing sector. Norcan we expect that rapidly expanding R&D industries will provide the solution to macro-economic growth and employment problems in the future. On the contrary: research-intensive sectors are only of indirect importance to growth and job creation, since theytie up capacities for scientific and technical problem-solving and promote the expansionof innovative corporate services.
IAB Labour Market Research Topics 24 (1997) 18
Investment Activities and Targets
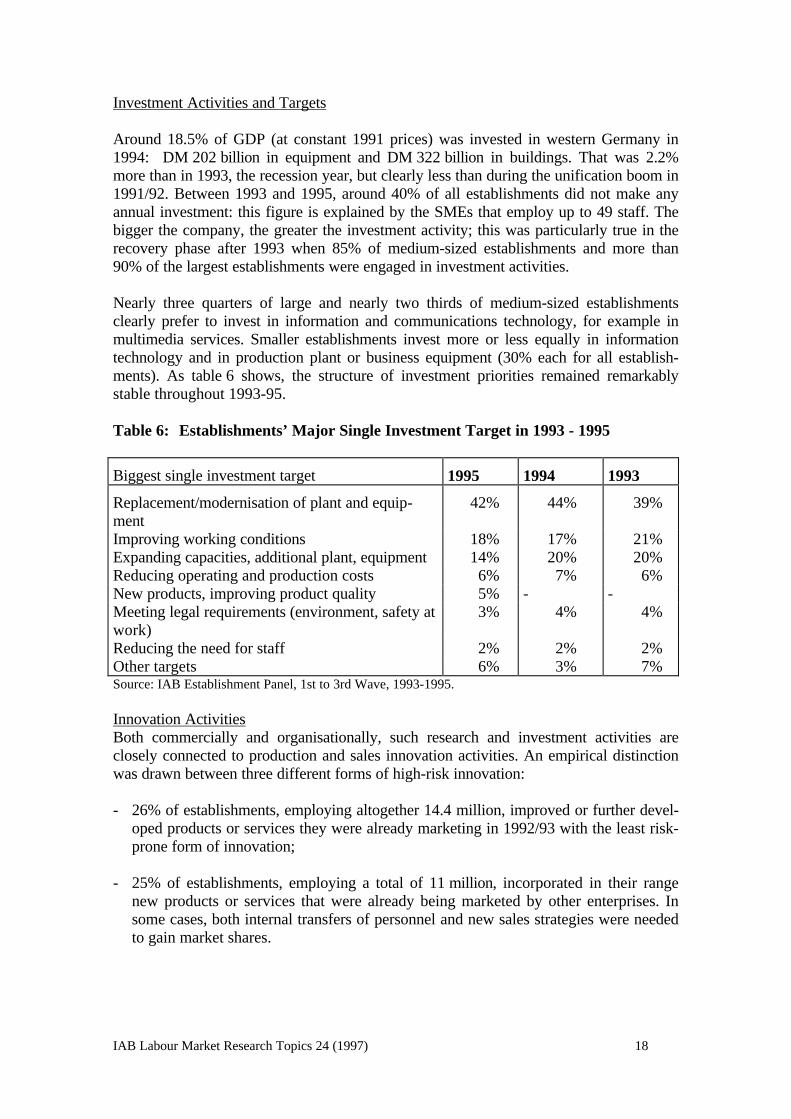
Around 18.5% of GDP (at constant 1991 prices) was invested in western Germany in1994: DM 202 billion in equipment and DM 322 billion in buildings. That was 2.2%more than in 1993, the recession year, but clearly less than during the unification boom in1991/92. Between 1993 and 1995, around 40% of all establishments did not make anyannual investment: this figure is explained by the SMEs that employ up to 49 staff. Thebigger the company, the greater the investment activity; this was particularly true in therecovery phase after 1993 when 85% of medium-sized establishments and more than90% of the largest establishments were engaged in investment activities.
Nearly three quarters of large and nearly two thirds of medium-sized establishmentsclearly prefer to invest in information and communications technology, for example inmultimedia services. Smaller establishments invest more or less equally in informationtechnology and in production plant or business equipment (30% each for all establish-ments). As table 6 shows, the structure of investment priorities remained remarkablystable throughout 1993-95.
Table 6: Establishments’ Major Single Investment Target in 1993 - 1995
Biggest single investment target 1995 1994 1993
Replacement/modernisation of plant and equip-ment
42% 44% 39%
Improving working conditions 18% 17% 21%Expanding capacities, additional plant, equipment 14% 20% 20%Reducing operating and production costs 6% 7% 6%New products, improving product quality 5% - -Meeting legal requirements (environment, safety atwork)
3% 4% 4%
Reducing the need for staff 2% 2% 2%Other targets 6% 3% 7%Source: IAB Establishment Panel, 1st to 3rd Wave, 1993-1995.
Innovation ActivitiesBoth commercially and organisationally, such research and investment activities areclosely connected to production and sales innovation activities. An empirical distinctionwas drawn between three different forms of high-risk innovation:
- 26% of establishments, employing altogether 14.4 million, improved or further devel-oped products or services they were already marketing in 1992/93 with the least risk-prone form of innovation;
- 25% of establishments, employing a total of 11 million, incorporated in their rangenew products or services that were already being marketed by other enterprises. Insome cases, both internal transfers of personnel and new sales strategies were neededto gain market shares.
IAB Labour Market Research Topics 24 (1997) 19
- Around 11% of establishments, employing altogether 5.7 million, developed entirelynew products or services and created or found a new market for them.
Where these three innovation activities occur simultaneously, particularly in larger estab-lishments, around 40% of all establishments in the economy as a whole, i.e. about600,000 employing a good 17 million, can be classified as ‘innovative’. 87,000 estab-lishments, employing 3.5 million, use all three forms of innovation simultaneously to in-crease their competitiveness.
Although about 60% establishments surveyed in western German stated that they did notengage in any of the innovation activities named, they cannot really be called ‘not inno-vative’. During the unification boom in 1991/92, considerable innovation was under-taken: products were changed and new products were created. However, during the1993 recession, financing was not always available for innovation. In many enterprisesthe normal product cycle may be such that these forms of innovation will only be neces-sary at some future date.
7. Modern Technology, Organisational Changes and Employment Flexibility
The corporate and internal flexibility an enterprise needs to compete globally today re-quires the use of modern technology; certain organisational changes may also have to bemade.
The usual spectrum of reorganisation measures consists mainly of:
- flattening hierarchies (hierarchy levels, management ranges);
- ‘segmentation’ (creation of autonomous and self-managing ‘centres’ - functional inte-gration, holding structures, independent local units, the ‘factual’ factory, productionislands, the enterprise-within-the-enterprise);
- learning organisation (shifting improvement processes out of central staff departmentsinto specialised departments - continuous improvement process);
- intensification of group work (partly autonomous groups, project groups, circle work, co-ordination bodies).
‘Lean’ strategic manpower planning needs to integrate elegant solutions to staff short-ages, bottlenecks and surpluses. It would be wrong to see lean management as primarilya tool for saving on staff by killing jobs and making cuts (slimming down personnel,thinning out the workforce, rationalisation, out-placement). The aim is to limit fluctua-tions by forming teams (in the interests of group cohesion) and in project work(minimising training on the job).
The following question was asked in the IAB Establishment Panel survey: ‘How do yourate the technology in this establishment in comparison with other establishments in yoursector?’ We asked for a response on a five-point scale, where ‘1’ was very advanced and‘5’ very old. Since those responding to the survey were expected to give very differentanswers as a function of their own expectations, the responses have been separated by
IAB Labour Market Research Topics 24 (1997) 20
industry. The results are roughly similar in the manufacturing sector and intrade/banking/insurance in particular, and in other services, where in 1995, in each caserather more than (extrapolated) 60% of establishments answered ‘1’ or ‘2’. The figurefor non-profit organisations, central, regional and local authorities and social insuranceinstitutions was a good 10 percentage points lower for 1995. An assessment of the trendbetween 1993 and 1995 reveals a decline in ‘1’ and ‘2’ responses and an increase in ‘3’s.
The pattern is similar for establishments with an upward employment trend. While in1993, 77% of these judged their technology to be ‘1’ and ‘2’ on the scale, in 1995 only69% did so. The number of establishments with an upward employment trend giving ‘3’responses increased during the same period from 21% to 27%. However, more estab-lishments with upward employment trends answered with ‘1’s and ‘2’s: clearly then, es-tablishments expecting employment opportunities to increase tend to say that their tech-nology is relatively modern.
Differences are also evident between the manufacturing sector and the services sector inregard to hirings, layoffs and churning. Churning occurs when the same establishment (inthe first half-year) both hires and fires personnel, or staff leaves of their own volition.There are more of these establishments in the manufacturing sector than in the servicesector. 35% of the establishments in the manufacturing sector said they had hired andlaid off employees or staff had given notice. 21% experienced all of these in the sameperiod. In the service sector the corresponding figures were 28% and 17%. In both sec-tors, the greatest personnel fluctuation occurred in establishments with modern technol-ogy (that is, rated as ‘1’, ‘2’ or ‘3’ on the scale).
A relatively high number of establishments whose representatives believed their plant tobe very modern stated they had only hirings and no layoffs. In the manufacturing sectormore establishments with ‘1’, ‘2’ and ‘3’ ratings reduced rather than hired personnel.
Another question that is related to the use of modern technology is whether establish-ments have made any organisational change. Nearly 80% of establishments across themanufacturing sector, private services, non-profit organisations and the public servicehad not undertaken any organisational changes in 1995. Indeed, the majority of all estab-lishments had made no more than one change.
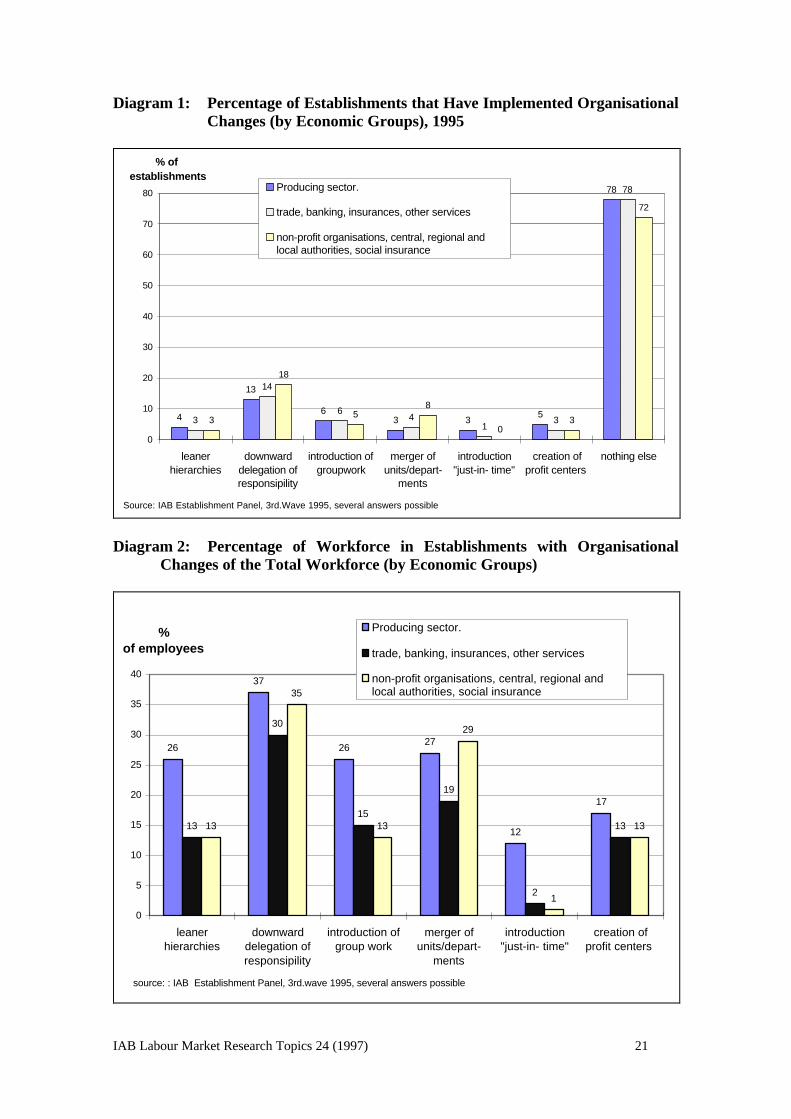
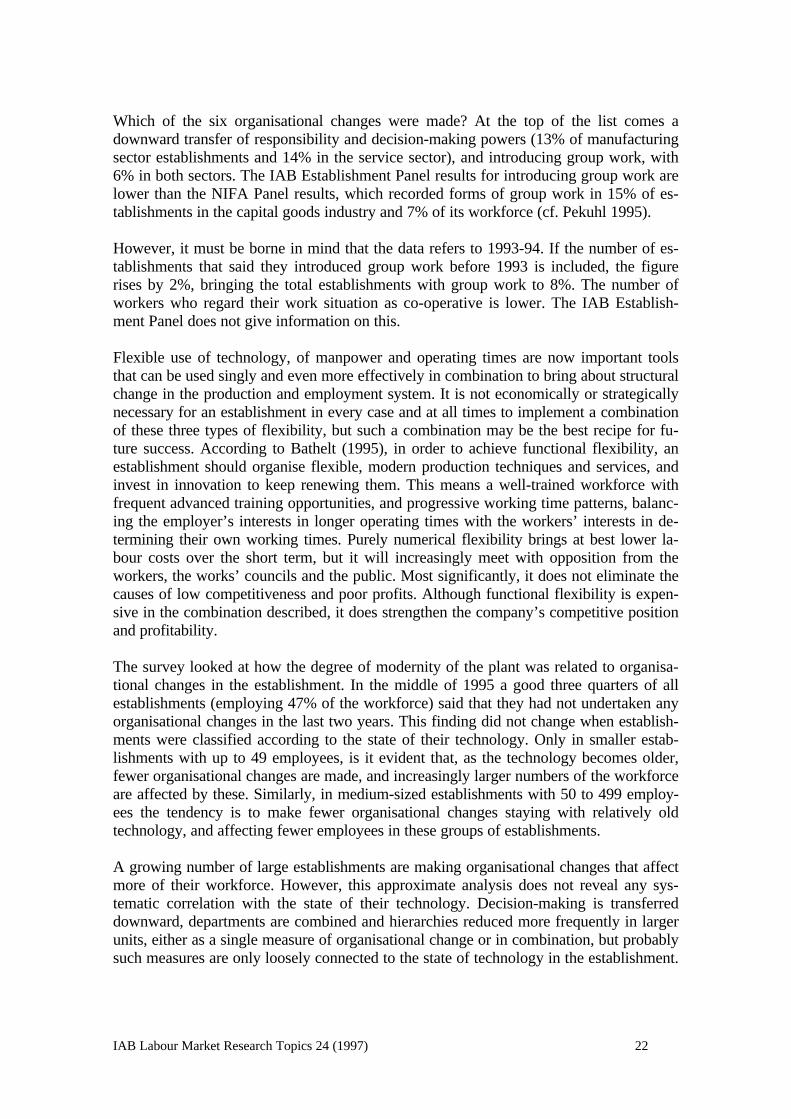
Although only one fifth of all establishments had carried out any organisational changes,it is interesting to see their employment figures, even if the survey did not ask how manywere directly affected by these changes. Diagram 1 and 2 shows that these (relativelyfew) establishments employ a considerable share of the total workforce. Only 4% of theestablishments in the manufacturing sector, for instance, said they had seen hierarchiesreduced, but 26% of the total workforce in that sector are employed in these establish-ments. The size of the firm clearly has an affect on organisational changes: SMEs(employing up to 49 employees) that had implemented such changes accounted for just5-19% of the total SME workforce.
IAB Labour Market Research Topics 24 (1997) 21
Diagram 1: Percentage of Establishments that Have Implemented OrganisationalChanges (by Economic Groups), 1995
4
13
63 3
5
78
3
14
64
13
78
3
18
58
03
72
0
10
20
30
40
50
60
70
80
leanerhierarchies
downwarddelegation ofresponsipility
introduction ofgroupwork
merger ofunits/depart-
ments
introduction"just-in- time"
creation ofprofit centers
nothing else
Producing sector.
trade, banking, insurances, other services
non-profit organisations, central, regional and local authorities, social insurance
% of establishments
Source: IAB Establishment Panel, 3rd.Wave 1995, several answers possible
Diagram 2: Percentage of Workforce in Establishments with OrganisationalChanges of the Total Workforce (by Economic Groups)
26
37
2627
12
17
13
30
15
19
2
1313
35
13
29
1
13
0
5
10
15
20
25
30
35
40
leanerhierarchies
downwarddelegation ofresponsipility
introduction ofgroup work
merger ofunits/depart-
ments
introduction"just-in- time"
creation ofprofit centers
Producing sector.
trade, banking, insurances, other services
non-profit organisations, central, regional and local authorities, social insurance
source: : IAB Establishment Panel, 3rd.wave 1995, several answers possible
% of employees
IAB Labour Market Research Topics 24 (1997) 22
Which of the six organisational changes were made? At the top of the list comes adownward transfer of responsibility and decision-making powers (13% of manufacturingsector establishments and 14% in the service sector), and introducing group work, with6% in both sectors. The IAB Establishment Panel results for introducing group work arelower than the NIFA Panel results, which recorded forms of group work in 15% of es-tablishments in the capital goods industry and 7% of its workforce (cf. Pekuhl 1995).
However, it must be borne in mind that the data refers to 1993-94. If the number of es-tablishments that said they introduced group work before 1993 is included, the figurerises by 2%, bringing the total establishments with group work to 8%. The number ofworkers who regard their work situation as co-operative is lower. The IAB Establish-ment Panel does not give information on this.
Flexible use of technology, of manpower and operating times are now important toolsthat can be used singly and even more effectively in combination to bring about structuralchange in the production and employment system. It is not economically or strategicallynecessary for an establishment in every case and at all times to implement a combinationof these three types of flexibility, but such a combination may be the best recipe for fu-ture success. According to Bathelt (1995), in order to achieve functional flexibility, anestablishment should organise flexible, modern production techniques and services, andinvest in innovation to keep renewing them. This means a well-trained workforce withfrequent advanced training opportunities, and progressive working time patterns, balanc-ing the employer’s interests in longer operating times with the workers’ interests in de-termining their own working times. Purely numerical flexibility brings at best lower la-bour costs over the short term, but it will increasingly meet with opposition from theworkers, the works’ councils and the public. Most significantly, it does not eliminate thecauses of low competitiveness and poor profits. Although functional flexibility is expen-sive in the combination described, it does strengthen the company’s competitive positionand profitability.
The survey looked at how the degree of modernity of the plant was related to organisa-tional changes in the establishment. In the middle of 1995 a good three quarters of allestablishments (employing 47% of the workforce) said that they had not undertaken anyorganisational changes in the last two years. This finding did not change when establish-ments were classified according to the state of their technology. Only in smaller estab-lishments with up to 49 employees, is it evident that, as the technology becomes older,fewer organisational changes are made, and increasingly larger numbers of the workforceare affected by these. Similarly, in medium-sized establishments with 50 to 499 employ-ees the tendency is to make fewer organisational changes staying with relatively oldtechnology, and affecting fewer employees in these groups of establishments.
A growing number of large establishments are making organisational changes that affectmore of their workforce. However, this approximate analysis does not reveal any sys-tematic correlation with the state of their technology. Decision-making is transferreddownward, departments are combined and hierarchies reduced more frequently in largerunits, either as a single measure of organisational change or in combination, but probablysuch measures are only loosely connected to the state of technology in the establishment.
IAB Labour Market Research Topics 24 (1997) 23
Looking at establishments that chose to implement more than one change at once, therewere a good 124,000 establishments in 1995, employing more than a sixth of the totalworkforce (5.1 million), that regarded their technology as very advanced compared withother establishments in their sector (i.e. ‘1’ response) but nevertheless - or perhaps forthat very reason - went ahead and made the organisational changes listed.
8. Functional Flexibility and Training
Between 1977 and 1994 there was a general upward trend in the level of skills demandedby establishments of all sizes:
1977 1994 changeUnskilled workers 41.0% 29.4% - 11.6 pointsSkilled workers 55.5% 63.9% + 8.4 pointsHighly-skilled, universitygraduates
3.5% 6.6% + 3.1 points
While numerical flexibility results in a highly qualified core group of employees and agroup of less qualified, semi-skilled workers with a high employment risk, functionalflexibility generally requires higher skill levels and fewer low-skilled workers. If we lookat establishments with a growing workforce, we find a significantly higher number ofskilled and highly-skilled employees. But it depends on the industry: some industries usetraditional, Taylor type strategies, whereas other growing industries prefer to pursuefunctional strategies, i.e. continuously upgrading the skills of their staff.
Every year, 4% to 5% of the workforce (1.4 million) start an apprenticeship and aretrained in-house or at vocational school. 10% of the workforce (3 million) undergo ad-vanced training paid by an establishment. About 80% of the workforce are in establish-ments that offer apprenticeship training (i.e. 19 million employees) or advanced training(18 million) or both (14 million). But a little less than 870.000 firms, employing 6.3 mil-lion, neither conducted apprenticeship training nor advanced training, mainly SMEs.
Even if the establishments that offer training fulfil their promises regarding apprentice-ship places, three developments rather suggest that there will be a shortage of trainee-ships over the next ten years:
- the half million small and medium-sized establishments, including 200,000 craft indus-tries, that provide around 60% of the training are having considerable managementproblems and difficulties consolidating their position. Easier access to training, e.g. forFachhochschule (specialised colleges of higher education) graduates, a training as-sociation and tax breaks could help here.
- The training cut-backs introduced by the large establishments in 1994-95, especially inindustry, can be attributed to new management strategies intended to make establish-ments more ‘lean’ and get training back onto the factory floor. There is a feeling thatin the short term, training does not pay off, given the heavy expenditure on work
IAB Labour Market Research Topics 24 (1997) 24
shops, trainers and apprentices’ remuneration, or a preference to pass the costs off onto the state.
- Service establishments have provided a further 6 million jobs over the last twentyyears, but vocational training has not followed this expansion, either in numbers orcontent. Half of all our youngsters are still training for commercial and technical oc-cupations, although this type of employment can only provide jobs for 40% of the to-tal workforce now and the numbers are falling. New training requirements in theservice sector could help here, as could supporting service establishments’ trainingefforts.
Finally, the question of a more even distribution of costs between companies that providetraining and those that do not will have to be addressed.
Inadequate initial training cannot be compensated for by more advanced training in theestablishment, and wooing suitable skilled workers from other establishments may wellprove more expensive, owing to the costs of the search and high wage demands, alongwith the cost of training on the job and of obtaining the workers’ commitment to thefirm.
Table 7: Participation in Advanced Training by Skill Class, Jan-June 1993
Qualification % of Participants in Participants in advancedworkforce advanced training measures
training as % oftotal workforce All measures Longer
thanthree days
Unskilled and semi-skilledworkers
25.0 2.6 6.3 4.1
Skilled workers 22.0 9.3 20.1 19.2White collar workers/publicservantsWith simple jobs 11.0 6.5 6.8 5.8with skilled jobs 42.0 16.2 66.8 70.9
Total 100 10 100 100Source: IAB Establishment Panel, 1st Wave, 1993.
As previously seen, a more highly-skilled workforce has a higher number of people in-volved in in-house advanced training. Probably the greatest challenge for training in allthe industrialised countries is that the demand for unskilled and semi-skilled workers isfalling, while the demand for skilled workers is rising. Establishments, however, are do-ing next to nothing to remedy the situation. Table 7 indicates that participation in trainingdepends on the employee’s initial qualification. 43% of those in training are women,which is directly proportional to their number in the workforce.
IAB Labour Market Research Topics 24 (1997) 25
9. New Establishments, Hive-off and Integration of Units
New businesses have been a big focus of interest for research and in political discussion.There are all sorts of programmes to encourage new businesses and there are currentlyproposals to extend these further (e.g. by offering tax breaks for venture capital). Theinterest in new businesses is due mainly to the mostly positive long term effects on em-ployment. Moreover, it is assumed that new businesses frequently have the requisiteknow-how for innovative products, production techniques and distribution channels etc.,and will stimulate innovation in large establishments. There is a high mortality rate offirms in their first few years of operation: a high ratio of new businesses always implies ahigh ratio of closures. Turbulent market activity of this kind also reflects fierce competi-tion, something which is desirable and means that the establishments that do survive for alonger period will have to be particularly efficient.
Between 1 July, 1982 and 30 June, 1983, about 128,000 establishments were founded, ofwhich the majority were in the service sector. On 30 June, 1983, about 359,000 peoplewere employed in these establishments, giving an average size of 2.8 workers per newestablishment. A good third of these, employing approximately 165,000 workers in 1983,were still operation on 30 June 1994, by then employing 330,000 staff. Clearly, theworkforce grew considerably on average in the establishments that survived. The averagesize of establishment doubled over the twelve-year period; the survivors were clearlybigger, even in the year they were established, than the average for the total number ofestablishments.
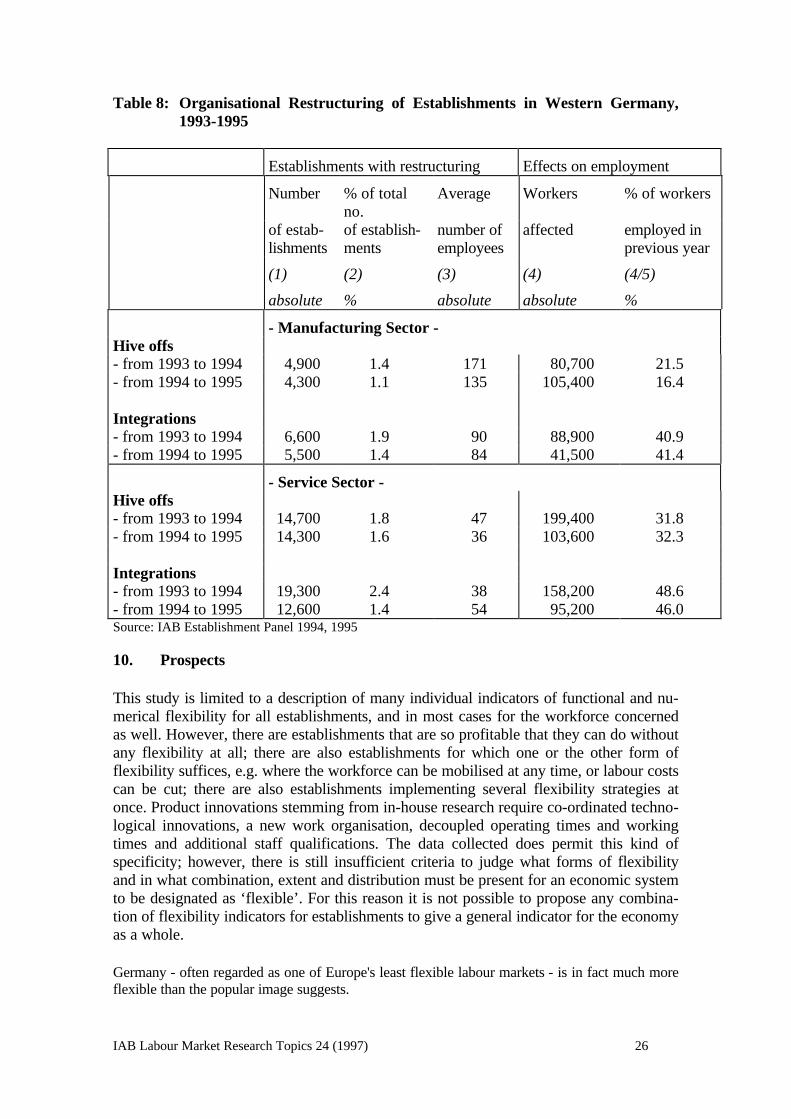
The founding of new establishments is also strongly related to the restructuring processesin existing firms, particularly during the period in question. As part of organisationalchange, companies hived off divisions, and in the employment statistics register theseappear by definition as new establishments. The significance and extent of these proc-esses has not yet been evaluated.
With the help of the IAB Establishment Panel it is possible to determine the significanceof the hive-off and the integration of formerly independent firms into divisions of existingfirms, at least for the years 1994 and 1995, and for establishments that were surveyed inthe First Wave (1993). The results are shown in Table 8, classified under industry andservices. One sees that both trends are more significant in the service industries. In theproduction sector one third more establishments were integrated than hived off (in theservice sector these were only about 10%). As there were clearly more units -hived offduring these two years than integrated, fewer workers were affected, because the aver-age number of employees in hived off enterprises is higher than that in integrated estab-lishments. This applies, although to a lesser extent, to the service sector as well.
IAB Labour Market Research Topics 24 (1997) 26
Table 8: Organisational Restructuring of Establishments in Western Germany,1993-1995
Establishments with restructuring Effects on employment
Number % of totalno.
Average Workers % of workers
of estab-lishments
of establish-ments
number ofemployees
affected employed inprevious year
(1) (2) (3) (4) (4/5)
absolute % absolute absolute %
- Manufacturing Sector -Hive offs- from 1993 to 1994 4,900 1.4 171 80,700 21.5- from 1994 to 1995 4,300 1.1 135 105,400 16.4
Integrations- from 1993 to 1994 6,600 1.9 90 88,900 40.9- from 1994 to 1995 5,500 1.4 84 41,500 41.4
- Service Sector -Hive offs- from 1993 to 1994 14,700 1.8 47 199,400 31.8- from 1994 to 1995 14,300 1.6 36 103,600 32.3
Integrations- from 1993 to 1994 19,300 2.4 38 158,200 48.6- from 1994 to 1995 12,600 1.4 54 95,200 46.0Source: IAB Establishment Panel 1994, 1995
10. Prospects
This study is limited to a description of many individual indicators of functional and nu-merical flexibility for all establishments, and in most cases for the workforce concernedas well. However, there are establishments that are so profitable that they can do withoutany flexibility at all; there are also establishments for which one or the other form offlexibility suffices, e.g. where the workforce can be mobilised at any time, or labour costscan be cut; there are also establishments implementing several flexibility strategies atonce. Product innovations stemming from in-house research require co-ordinated techno-logical innovations, a new work organisation, decoupled operating times and workingtimes and additional staff qualifications. The data collected does permit this kind ofspecificity; however, there is still insufficient criteria to judge what forms of flexibilityand in what combination, extent and distribution must be present for an economic systemto be designated as ‘flexible’. For this reason it is not possible to propose any combina-tion of flexibility indicators for establishments to give a general indicator for the economyas a whole.
Germany - often regarded as one of Europe's least flexible labour markets - is in fact much moreflexible than the popular image suggests.
IAB Labour Market Research Topics 24 (1997) 27
11. References
Atkinson, J. (1985): Flexibility, Uncertainty and Manpower Management, IMS-ReportNo. 89, London.
Bathelt, H. (1995): Der Einfluß von Flexibilisierungsprozessen auf industrielle Produk-tionsstrukturen <The effect of flexibilisation processes on industrial productionstructures>, in: Erdkunde, vol. 49/3, pp. 176-196.
Bellmann, L.; Kohaut, S. (1995): Determinants of Wages in the German Service andManufacturing Sectors: An Empirical Analysis Based on the IAB EstablishmentPanel. IAB Topics No. 15.
Bellmann, L.; Möller, J. (1995): Institutional Influences on Interindustry Wage Differen-tials. In: F. Buttler, W. Franz, R. Schettkat und D. Soskice (eds.): InstitutionalFrameworks and Labour Market Performance, London, pp. 132-167.
Bellmann, L.; Möller, J. (1995): Der Wandel der interindustriellen und qualifikatorischenLohnstruktur im Verarbeitenden Gewerbe <Teh change of inter-industrial andqualification-induced wage structure in the manufacturing industry>, ZEW-Wirtschaftsanalysen, No. 3, pp. 65-91.
Bielenski, H. (1994): New Forms of Work and Activity. Survey of Experience at Estab-lishment Level in Eight European Countries, European Foundation for the Im-provement of Living and Working Conditions, Dublin.
Bosch, G. (1991): Betriebszeiten im internationalen Vergleich <Hours of operation ininternational comparison>, in: WSI-Mitteilungen, No. 44/6, pp. 337-346.
Bound, J.; Johnson, G. (1992): Changes in the Structure of Wages in the 1980s: anEvaluation of Alternative Explanations. American Economic Review, No. 82, pp.371-392.
Brewster, Ch.; Hegewisch, A. (ed.) (1994): Policy and Practice in European Human Re-source Management. The Price Waterhouse Cranfield Survey, London, New York.
Brewster, Ch.; Hegewisch, A., Mayne, L. (1994): Flexible working practices. The con-troversy and the evidence, in: Ch. Brewster, A. Hegewisch (eds.): Policy and Prac-tice in European Human Resource Management, London, New York, pp. 168-215.
Brodsky, M.M. (1994): Labour Market Flexibility: A changing international perspective,in: Monthly Labour Review, November, pp. 53-60.
Commission of the European Communities (1993): Growth, Competitiveness, Employ-ment; White Paper, November, Brussels
IAB Labour Market Research Topics 24 (1997) 28
Cramer, U.; Koller, M. (1988): Gewinne und Verluste von Arbeitsplätzen in Betrieben- der ‘Job-Turnover’-Ansatz <Jobs gained and lost in enterprises - the ‘job-turnover’ approach>, in: MittAB, No. 3, pp. 361-377.
Cramer, U.; Boeri, T. (1991): Betriebliche Wachstumsprozesse - Eine statistische Ana-lyse mit der Beschäftigtenstatistik 1977-1987 <Growth processes in enterprises - astatistical analysis based on employment statistics 1977-1987>, in: MittAB, No. 1,pp. 70-80.
Düll, H. (1995): Potentiale der Arbeitszeit- und Betriebszeit-Flexibilisierung. Aus-gewählte Ergebnisse aus dem IAB-Betriebspanel <Potentials of more flexibleworking and operating hours. Selected results from the IAB Enterprise Panel>, in:Senatsverwaltung für Arbeit und Frauen (Ed.): Arbeitszeitpolitik 2000.Tagungsreader zum bundesweiten Fachkongreß am 4./5.,1995., 2nd revised edition,pp. 95-98, Berlin.
European Commission (1995): Performance of the European Union Labour Market. Re-sults of an ad hoc labour market survey of employers and employees, EuropeanEconomy, Reports and Studies No. 3.
EUROSTAT (1995): Techniques and uses of enterprise panels. Proceedings of the firstEUROSTAT international workshop on techniques of enterprise panels, Luxem-bourg.
Fritsch, M.; König, A.; Weißhuhn, G. (1994): Die Beschäftigtenstatistik als Be-triebspanel - Ansatz, Probleme und Analysepotentiale <Employment statistcs as anenterprise panel - approach, problems and potential for analysis>, in Hochmuth, U.;Wagner, J. (ed.): Firmenpanelstudien in Deutschland, Tübingen, Basel, pp. 65-82.
Groß, H. et al (1991): Arbeitszeiten und Betriebszeiten 1990. Ergebnisse einer aktuellenBetriebsbefragung zu Arbeitszeitformen und Betriebszeiten in der BundesrepublikDeutschland <Working and operating hours 1990. Results of a topical enterprisepoll on types of working and operating hours in the FRG>, Köln.
Hofmann C.F. (1995): EU-Arbeitsmarktumfrage: Aspekte der Arbeitsmärkte in Europaund Deutschland <EU labor market survey: aspects of the European and Germanlabor markets>, Forschungsbericht No. 250, Bundesministerium für Arbeit undSozialordnung (ed.), Bonn.
Hutchinson, S.; Brewster, C. (1994): Flexibility at Work in Europe. Strategies and prac-tices, Institute of Personnel and Development, London.
Infratest Sozialforschung (1994): Beschäftigungstrends Arbeitgeberbefragung 1993- Methodenbericht <Employment trends, employer survey 1993 - report on meth-odology>, Munich.
IAB Labour Market Research Topics 24 (1997) 29
Infratest Sozialforschung (1995a): Beschäftigungstrends Arbeitgeberbefragung 1994- Methodenbericht <Employment trends, employer survey 1994 - report on meth-odology>, Munich.
Infratest Sozialforschung (1995b): Beschäftigungstrends Arbeitgeberbefragung 1995- Methodenbericht <Employment trends, employer survey 1995 - report on meth-odology>, Munich.
International Labour Office (1995): Technical Meeting on Enterprise Restructuring andLabour Markets, Konferenzbeiträge, 31 May - 2 June, Turin.
Institute of Management (1995): Survey of Long Term Employment Strategies, October1995, London.
ISO/DIW (Groß, H. et al) (1991): Arbeitszeiten und Betriebszeiten 1990. Ergebnisseeiner aktuellen Betriebsbefragung zu Arbeitszeitformen und Betriebszeiten in derBundesrepublik Deutschland <Working and operating hours 1990. Results of atopical enterprise poll on types of working and operating hours in the FRG>, Köln.
Kohler, H.; Spitznagel, E. (1995): Teilzeitarbeit in der Gesamtwirtschaft und aus derSicht von Arbeitnehmern und Betrieben in der Bundesrepublik Deutschland <Part-time work in the national economy and from the perspective of German workersand enterprises>, in: MittAB, No. 28/3, pp. 339-364.
Kohler, H. et al (1996): Umfang, Struktur und Entwicklung der geringfügigenBeschäftigung. Eine Bestandsaufnahme <Scope, structure and development of so-cial security-free jobs. Taking stock>, IAB-Kurzbericht No. 2, 31 January, 1996.
Kühl, J. (1990): New Deal and New Forms of Employment, in: Labour and Society, No.15/2, pp. 237-254.
Kühl, J. (1995): Beschäftigungsfelder, Segmentierung und Marginalisierung im Dienst-leistungsbereich <Fields of employment, segmentation and marginalisation in theservice sector>, in: Bullinger, H.-J. (ed., 1995): Dienstleistungen der Zukunft.Märkte, Unternehmen und Infrastrukturen im Wandel, Wiesbaden, pp. 386-397.
Kühl, J. (1996): Warum schaffen zwei Millionen Betriebe nicht genügend gute Arbe-itsplätze für alle? <Why do two million enterprises not create a sufficient numberof good jobs for all?>, in: Aus Politik und Zeitgeschichte. Supplement B3-4/96 toDas Parlament (weekly newspaper), 12 January.
Kühl, J., Lahner, M., Wagner, J. (1997): Die Nachfrageseite des Arbeitsmarktes. Ergeb-nisse aus Analysen mit deutschen Firmenpanel-Daten <The demand side of the la-bor market. Results of analyses of German enterprise panels>, Beiträge aus derArbeitsmarkt- und Berufsforschung, No. 204, Nuremberg.
IAB Labour Market Research Topics 24 (1997) 30
Mavromaras, K.G.; Rudolph, H. (1995): ‘Recalls’ - Wiederbeschäftigung im alten Be-trieb <Return to be employed with the former employer again>, in: MittAB, No. 2,pp. 171-194.
Mückenberger, U.; Deakin, S. (1989): From deregulation to a European floor of rights:Labour law, flexibilisation and the European Single Market, in: Zeitschrift fürausländisches und internationales Arbeits- und Sozialrecht, No. 3, pp. 153-207.
OECD (1986): Labour Market Flexibility, Report by a high-level group of experts to theSecretary-General, Paris.
OECD (1987): Employment Outlook, Paris.
OECD (1989): Labour Market Flexibility. Trends in Enterprises, Paris.
OECD (1993): Employment Outlook, Paris.
OECD (1994): The OECD Jobs Study. Evidence and Explanations. Part I: Labour Mar-ket Trends and Underlying Forces of Change; Part II: The Adjustment of the La-bour Market, Paris.
OECD (1995): Literacy, Economy and Society, Paris.
Pekuhl, U. (1995): Gruppenarbeit - nur ein Thema für Kongresse? <Group work - nomore than a discussion point for conferences?> Technische Rundschau No.68,pp.10-13.
Projektgruppe Betriebspanel (1991): Das IAB-Betriebspanel - Ansatz und Aufbau <IABEnterprise Panel - Approach and organisation>, in: MittAB, No. 3, pp. 514-530.
Projektgruppe Betriebspanel (1994): Das IAB-Betriebspanel - Ergebnisse der erstenWelle 1993 <IAB Enterprise Panel - Results of the first wave 1993>, in: MittAB,No. 1, pp. 20-32.
Projektgruppe Betriebspanel (1995): Das IAB-Betriebspanel - Ergebnisse der zweitenWelle 1994 <IAB Enterprise Panel - Results of the second wave 1994>, in: Mit-tAB, No. 1, pp. 43-61.
Reyher, L. et al (1985): Zu den Beschäftigungspotentialen einer Entkoppelung von Ar-beits- und Betriebszeit <About the employment potential of decoupling workingand operating hours>, in: MittAB, No. 1, pp. 30-40.
Reynolds, P. et al (1994): Cross-national Comparisons of the Variation in New FirmFormation Rates, in: Regional Studies, No.4, pp. 443-456.
Semlinger, K., Frick, B. (pub.1995): Betriebliche Modernisierung in personellerErneuerung <Corporate modernisation by exchanging personnel>, Berlin.
IAB Labour Market Research Topics 24 (1997) 31
Seifert, H. (1995 a): Rückläufige Entwicklung bei Schicht-, Nacht- und Wochenendar-beit <Downward trend for shift work, night work and weekend work>, in:WSI-Mitteilungen, No.3, pp. 182-189.
Seifert, H. (1995 b): Spielräume für Betriebsnutzungszeiten <Scope for times of utilisa-tion of operations>, in: WSI-Mitteilungen No.10, pp. 641-646.
Sparrow, P.R. (1995): Towards a Dynamic and comparative model of European HumanResource Management: an extended review, in: The International Journal of Hu-man Resource Management, No.4, pp. 935-952.
Standing, G. (1995): Promoting the ‘Human Development Enterprise’: an approach toEnterprise Restructuring and Corporate Governance illustrated in Russia, ILO,Geneva, June, 1995.
Stille, F. (1995): Betriebszeiten als Standortfaktor <Operating hours as an element affect-ing the choice of an industrial location>, in: DIW-Wochenbericht, No. 48.
Teriet, B. (1993): Arbeitszeit- und Betriebszeitflexibilisierung <Making working and op-erating hours more flexible>, IAB-Werkstattbericht No. 15, 2 August, 1993.