Embed Size (px)
Citation preview
PARTIAL
STURAA TEST 7 YEAR 200,000 MILE BUS from ARBOC MOBILITY, LLC MODEL 2010 CNG HYBRID-SOM236 DECEMBER 2010 PTI-BT-R1009-P
The Thomas D. Larson Pennsylvania Transportation Institute
201 Transportation Research Building (814) 865-1891 The Pennsylvania State University University Park, PA 16802
Bus Testing and Research Center
2237 Old Route 220 N. (814) 695-3404 Duncansville, PA 16635
2
TABLE OF CONTENTS
Page
EXECUTIVE SUMMARY .......................................................................................................................... 3 ABBREVIATIONS .................................................................................................................................... 5 BUS CHECK-IN ....................................................................................................................................... 6 1. MAINTAINABILITY
1.3 REPLACEMENT AND/OR REPAIR OF SELECTED SUBSYSTEMS ......................... 25 2. RELIABILITY - DOCUMENTATION OF BREAKDOWN AND REPAIR TIMES DURING TESTING ................................................................................................................ 29 4. PERFORMANCE TESTS 4.1 PERFORMANCE - AN ACCELERATION, GRADEABILITY, AND TOP SPEED TEST ............................................................................................................... 35 4.2 PERFORMANCE – BUS BRAKING PERFORMANCE TEST……………………..…… 39 5. STRUCTURAL INTEGRITY
5.7 STRUCTURAL DURABILITY TEST ............................................................................ 68 6. FUEL ECONOMY TEST - A FUEL CONSUMPTION TEST USING AN APPROPRIATE OPERATING CYCLE ........................................................................................... 79 7. NOISE
7.1 INTERIOR NOISE AND VIBRATION TESTS ........................................................... 94 7.2 EXTERIOR NOISE TESTS ......................................................................................... 99
8. EMISSIONS
3
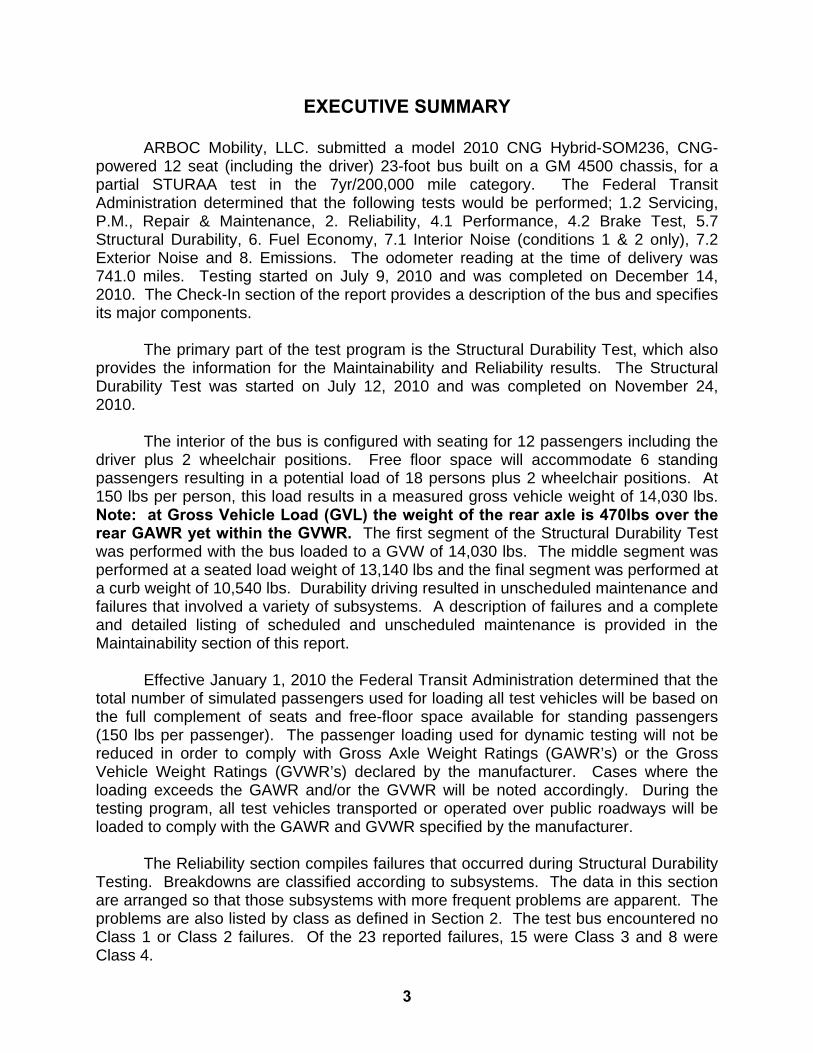
EXECUTIVE SUMMARY
ARBOC Mobility, LLC. submitted a model 2010 CNG Hybrid-SOM236, CNG-powered 12 seat (including the driver) 23-foot bus built on a GM 4500 chassis, for a partial STURAA test in the 7yr/200,000 mile category. The Federal Transit Administration determined that the following tests would be performed; 1.2 Servicing, P.M., Repair & Maintenance, 2. Reliability, 4.1 Performance, 4.2 Brake Test, 5.7 Structural Durability, 6. Fuel Economy, 7.1 Interior Noise (conditions 1 & 2 only), 7.2 Exterior Noise and 8. Emissions. The odometer reading at the time of delivery was 741.0 miles. Testing started on July 9, 2010 and was completed on December 14, 2010. The Check-In section of the report provides a description of the bus and specifies its major components.
The primary part of the test program is the Structural Durability Test, which also provides the information for the Maintainability and Reliability results. The Structural Durability Test was started on July 12, 2010 and was completed on November 24, 2010.
The interior of the bus is configured with seating for 12 passengers including the driver plus 2 wheelchair positions. Free floor space will accommodate 6 standing passengers resulting in a potential load of 18 persons plus 2 wheelchair positions. At 150 lbs per person, this load results in a measured gross vehicle weight of 14,030 lbs. Note: at Gross Vehicle Load (GVL) the weight of the rear axle is 470lbs over the rear GAWR yet within the GVWR. The first segment of the Structural Durability Test was performed with the bus loaded to a GVW of 14,030 lbs. The middle segment was performed at a seated load weight of 13,140 lbs and the final segment was performed at a curb weight of 10,540 lbs. Durability driving resulted in unscheduled maintenance and failures that involved a variety of subsystems. A description of failures and a complete and detailed listing of scheduled and unscheduled maintenance is provided in the Maintainability section of this report.
Effective January 1, 2010 the Federal Transit Administration determined that the
total number of simulated passengers used for loading all test vehicles will be based on the full complement of seats and free-floor space available for standing passengers (150 lbs per passenger). The passenger loading used for dynamic testing will not be reduced in order to comply with Gross Axle Weight Ratings (GAWR’s) or the Gross Vehicle Weight Ratings (GVWR’s) declared by the manufacturer. Cases where the loading exceeds the GAWR and/or the GVWR will be noted accordingly. During the testing program, all test vehicles transported or operated over public roadways will be loaded to comply with the GAWR and GVWR specified by the manufacturer.
The Reliability section compiles failures that occurred during Structural Durability Testing. Breakdowns are classified according to subsystems. The data in this section are arranged so that those subsystems with more frequent problems are apparent. The problems are also listed by class as defined in Section 2. The test bus encountered no Class 1 or Class 2 failures. Of the 23 reported failures, 15 were Class 3 and 8 were Class 4.
4
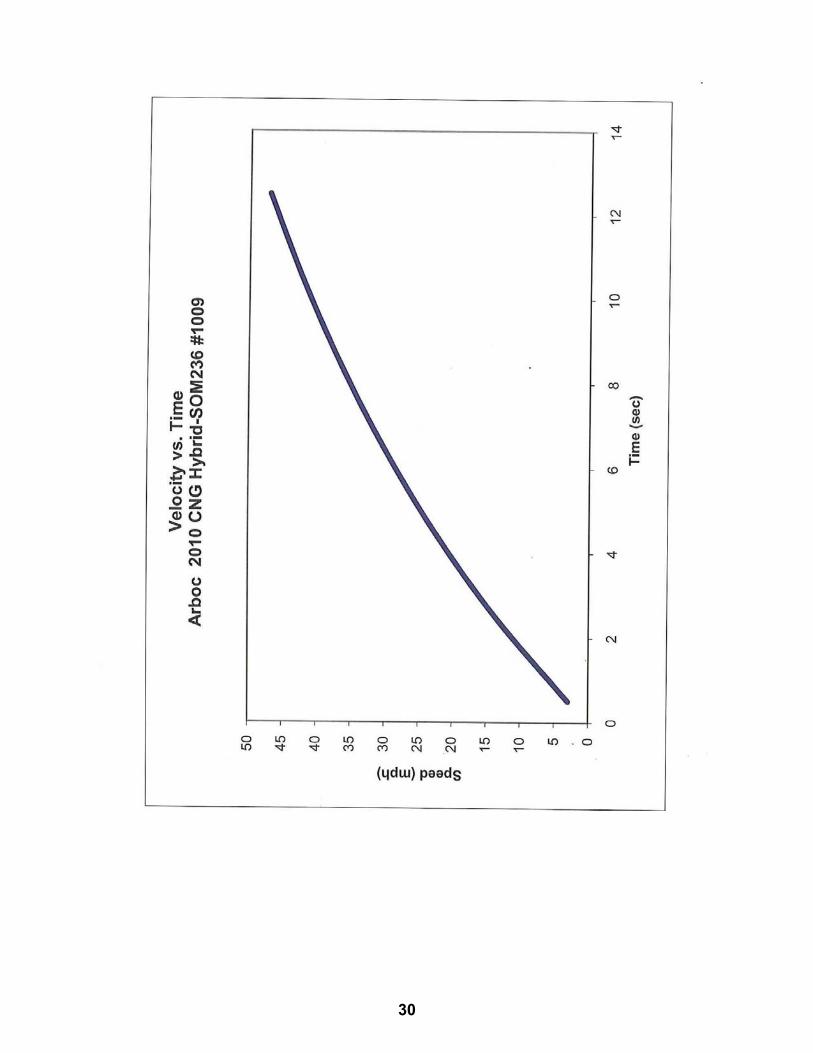
The performance of the bus is illustrated by a speed vs. time plot. Acceleration
and gradeability test data are provided in Section 4, Performance. The average time to obtain 50 mph was 13.95 seconds. The Stopping Distance phase of the Brake Test was completed with the following results; for the Uniform High Friction Test average stopping distances were 26.06’ at 20 mph, 52.74’ at 30 mph, 87.32’ at 40 mph and 109.46’ at 45 mph. The average stopping distance for the Uniform Low Friction Test was 25.09’. There was no deviation from the test lane during the performance of the Stopping Distance phase. During the Stability phase of Brake Testing the test bus experienced no deviation from the test lane but did experience pull to the left during both approaches to the Split Friction Road surface. The Parking Brake phase was completed with the test bus maintaining the parked position for the full five minute period with no slip or roll observed in both the uphill and downhill positions.
A Fuel Economy Test was run on simulated central business district, arterial, and commuter courses. The results were 0.67 M/lb, 1.07 M/lb, and 1.74 M/lb respectively; with an overall average of 0.93 M/lb.
A series of Interior and Exterior Noise Tests was performed. These data are listed in Section 7.1 and 7.2 respectively. Emissions testing was also performed. These data are available in Section 8.
5
ABBREVIATIONS
ABTC - Altoona Bus Test Center
A/C - air conditioner
ADB - advance design bus
ATA-MC - The Maintenance Council of the American Trucking Association
CBD - central business district
CW - curb weight (bus weight including maximum fuel, oil, and coolant; but
without passengers or driver)
dB(A) - decibels with reference to 0.0002 microbar as measured on the "A" scale
DIR - test director
DR - bus driver
EPA - Environmental Protection Agency
FFS - free floor space (floor area available to standees, excluding ingress/egress areas,
area under seats, area occupied by feet of seated passengers, and the vestibule area)
GVL - gross vehicle load (150 lb for every designed passenger seating
position, for the driver, and for each 1.5 sq ft of free floor space)
GVW - gross vehicle weight (curb weight plus gross vehicle load)
GVWR - gross vehicle weight rating
MECH - bus mechanic
mpg - miles per gallon
mph - miles per hour
PM - Preventive maintenance
PSBRTF - Penn State Bus Research and Testing Facility
PTI - Pennsylvania Transportation Institute
rpm - revolutions per minute
SAE - Society of Automotive Engineers
SCH - test scheduler
SEC - secretary
SLW - seated load weight (curb weight plus 150 lb for every designed passenger seating
position and for the driver)
STURAA - Surface Transportation and Uniform Relocation Assistance Act
TD - test driver
TECH - test technician
TM - track manager
TP - test personnel
6
TEST BUS CHECK-IN I. OBJECTIVE
The objective of this task is to log in the test bus, assign a bus number, complete the vehicle data form, and perform a safety check. II. TEST DESCRIPTION
The test consists of assigning a bus test number to the bus, cleaning the bus, completing the vehicle data form, obtaining any special information and tools from the manufacturer, determining a testing schedule, performing an initial safety check, and performing the manufacturer's recommended preventive maintenance. The bus manufacturer must certify that the bus meets all Federal regulations. III. DISCUSSION
The check-in procedure is used to identify in detail the major components and configuration of the bus.
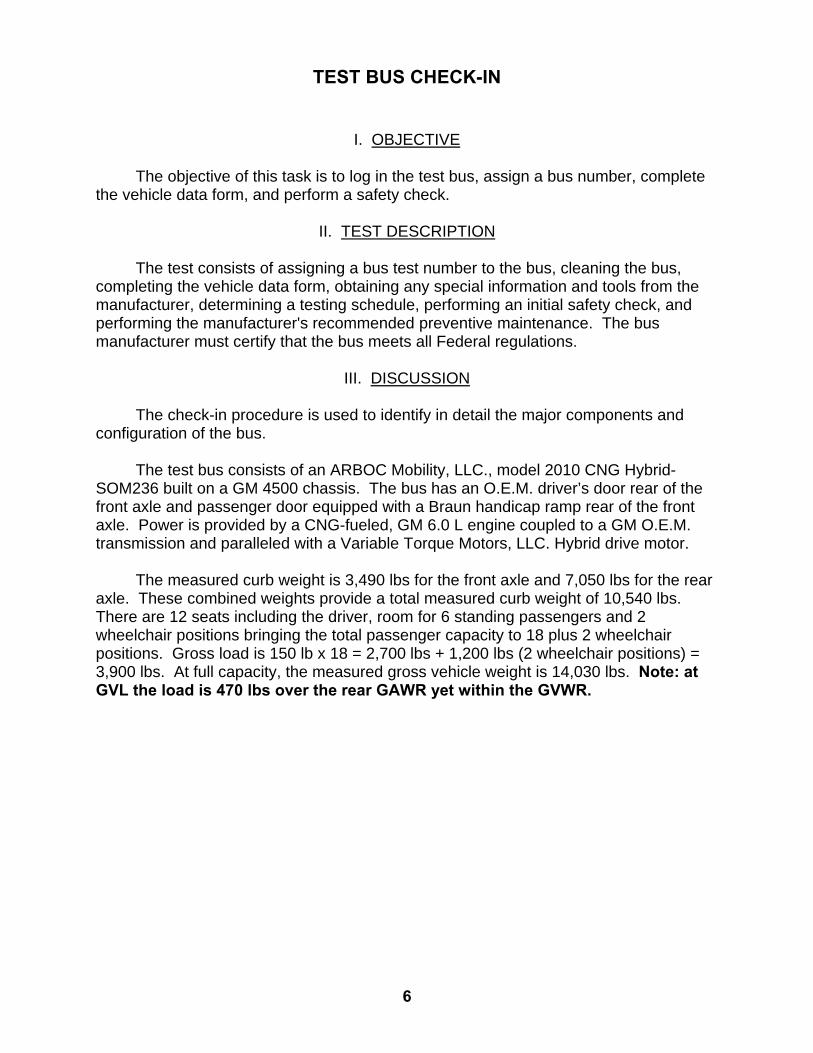
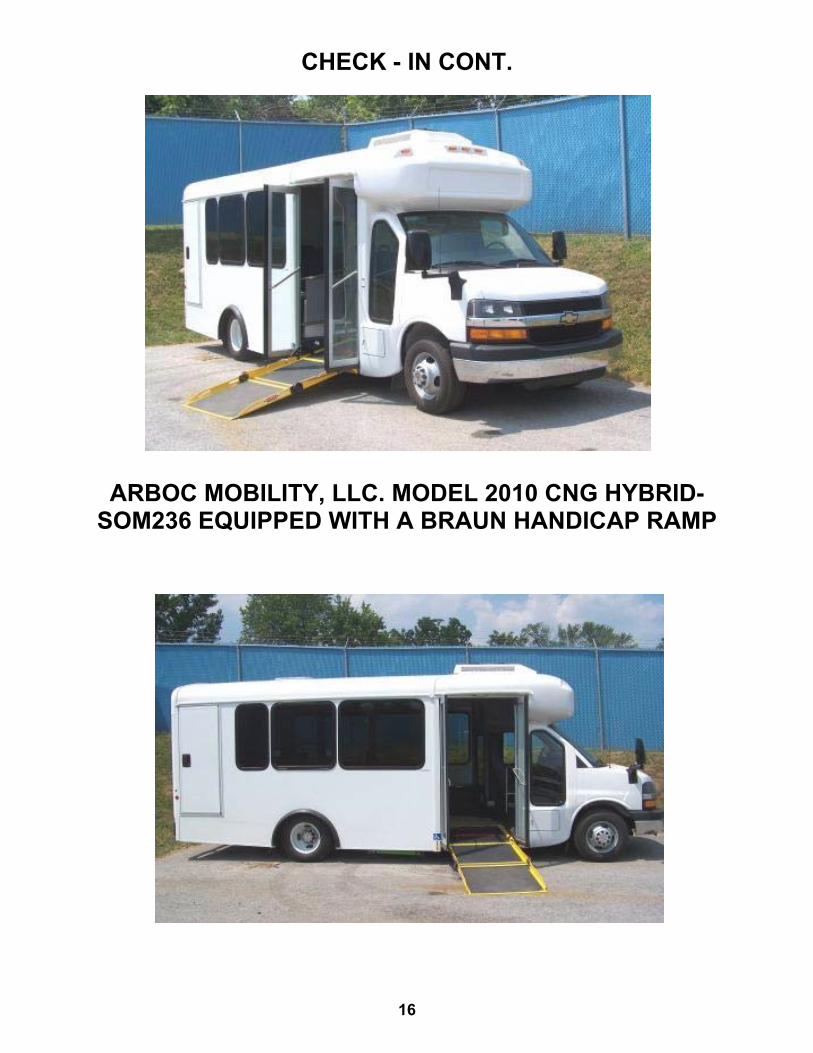
The test bus consists of an ARBOC Mobility, LLC., model 2010 CNG Hybrid-SOM236 built on a GM 4500 chassis. The bus has an O.E.M. driver’s door rear of the front axle and passenger door equipped with a Braun handicap ramp rear of the front axle. Power is provided by a CNG-fueled, GM 6.0 L engine coupled to a GM O.E.M. transmission and paralleled with a Variable Torque Motors, LLC. Hybrid drive motor.
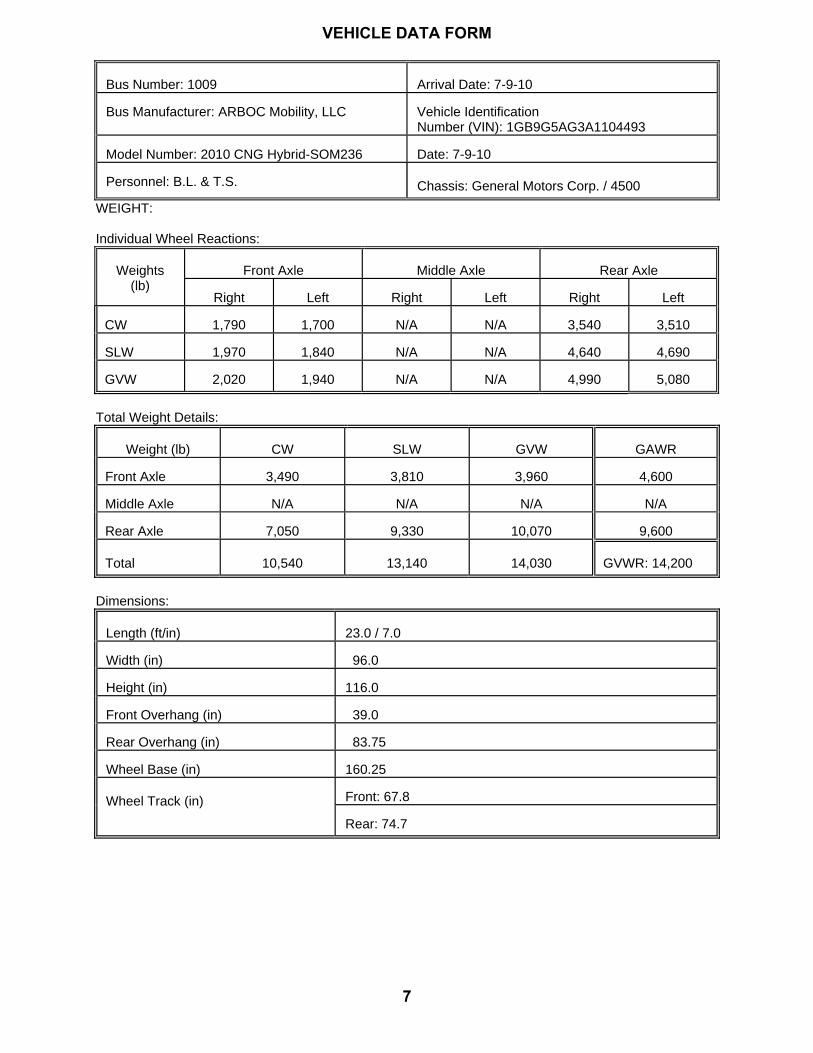
The measured curb weight is 3,490 lbs for the front axle and 7,050 lbs for the rear axle. These combined weights provide a total measured curb weight of 10,540 lbs. There are 12 seats including the driver, room for 6 standing passengers and 2 wheelchair positions bringing the total passenger capacity to 18 plus 2 wheelchair positions. Gross load is 150 lb x 18 = 2,700 lbs + 1,200 lbs (2 wheelchair positions) = 3,900 lbs. At full capacity, the measured gross vehicle weight is 14,030 lbs. Note: at GVL the load is 470 lbs over the rear GAWR yet within the GVWR.
7
VEHICLE DATA FORM
Bus Number: 1009 Arrival Date: 7-9-10 Bus Manufacturer: ARBOC Mobility, LLC Vehicle Identification
Number (VIN): 1GB9G5AG3A1104493 Model Number: 2010 CNG Hybrid-SOM236 Date: 7-9-10 Personnel: B.L. & T.S.
Chassis: General Motors Corp. / 4500
WEIGHT: Individual Wheel Reactions:
Weights
(lb)
Front Axle Middle Axle Rear Axle
Right
Left Right Left Right
Left
CW
1,790
1,700 N/A N/A
3,540 3,510
SLW
1,970
1,840 N/A N/A
4,640 4,690
GVW
2,020
1,940 N/A N/A
4,990 5,080
Total Weight Details:
Weight (lb)
CW SLW GVW
GAWR
Front Axle
3,490 3,810 3,960 4,600
Middle Axle
N/A N/A N/A N/A
Rear Axle
7,050 9,330 10,070 9,600
Total
10,540 13,140 14,030
GVWR: 14,200
Dimensions:
Length (ft/in) 23.0 / 7.0 Width (in) 96.0 Height (in) 116.0 Front Overhang (in) 39.0 Rear Overhang (in) 83.75 Wheel Base (in) 160.25 Wheel Track (in) Front: 67.8
Rear: 74.7
8
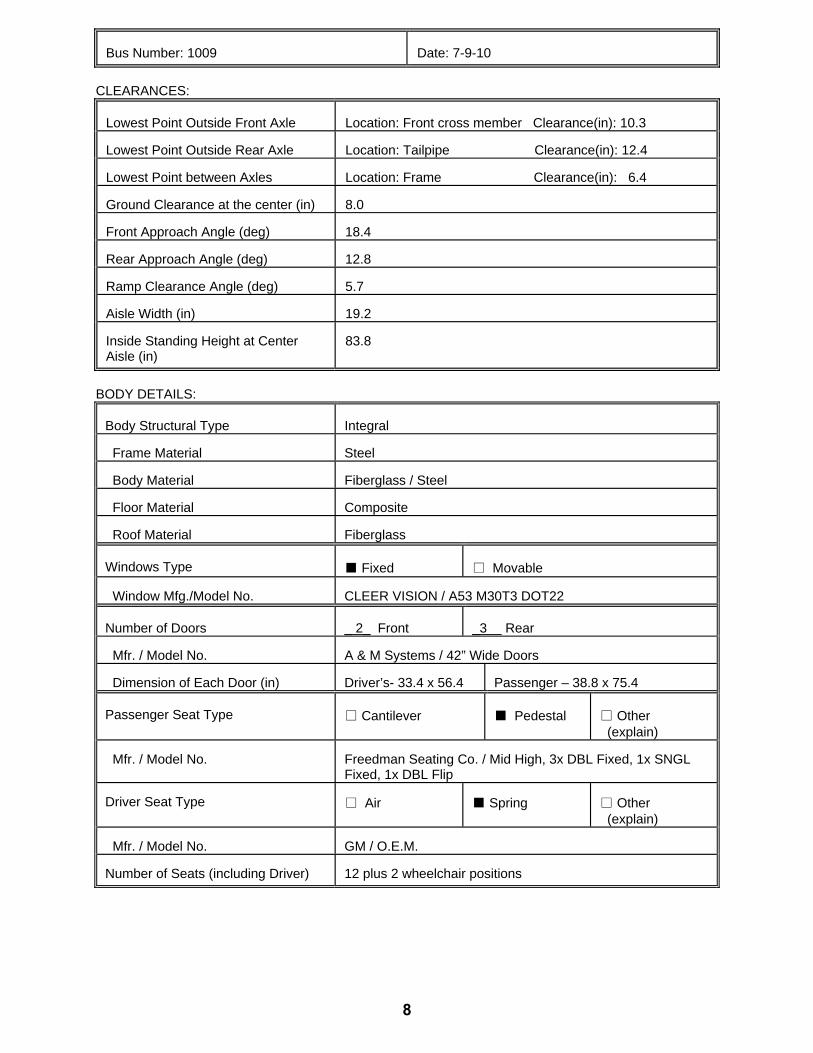
Bus Number: 1009 Date: 7-9-10
CLEARANCES:
Lowest Point Outside Front Axle Location: Front cross member Clearance(in): 10.3 Lowest Point Outside Rear Axle Location: Tailpipe Clearance(in): 12.4 Lowest Point between Axles Location: Frame Clearance(in): 6.4 Ground Clearance at the center (in) 8.0 Front Approach Angle (deg) 18.4 Rear Approach Angle (deg) 12.8 Ramp Clearance Angle (deg) 5.7 Aisle Width (in) 19.2 Inside Standing Height at Center Aisle (in)
83.8
BODY DETAILS:
Body Structural Type Integral Frame Material Steel Body Material Fiberglass / Steel Floor Material Composite Roof Material Fiberglass Windows Type ■ Fixed □ Movable Window Mfg./Model No. CLEER VISION / A53 M30T3 DOT22 Number of Doors _ 2_ Front _3 Rear Mfr. / Model No. A & M Systems / 42” Wide Doors Dimension of Each Door (in) Driver’s- 33.4 x 56.4 Passenger – 38.8 x 75.4 Passenger Seat Type □ Cantilever ■ Pedestal
□ Other (explain)
Mfr. / Model No. Freedman Seating Co. / Mid High, 3x DBL Fixed, 1x SNGL
Fixed, 1x DBL Flip Driver Seat Type □ Air ■ Spring
□ Other (explain)
Mfr. / Model No. GM / O.E.M. Number of Seats (including Driver) 12 plus 2 wheelchair positions
9
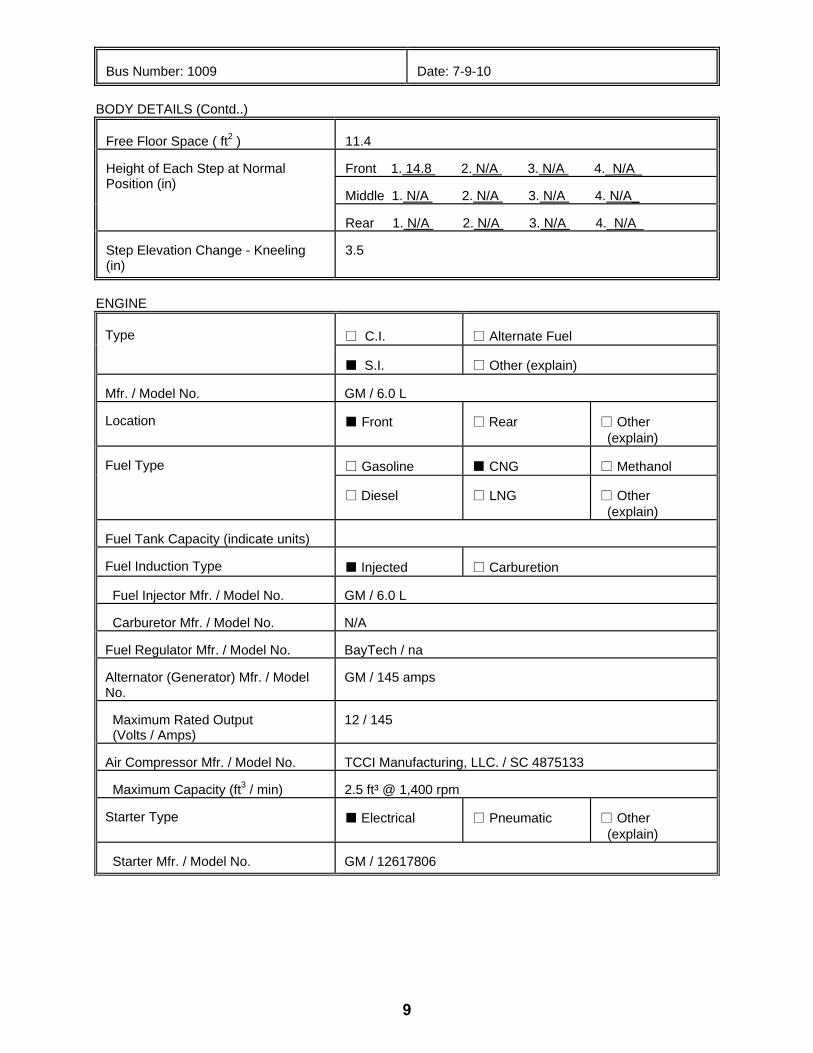
Bus Number: 1009 Date: 7-9-10
BODY DETAILS (Contd..)
Free Floor Space ( ft2 ) 11.4 Height of Each Step at Normal Position (in)
Front 1. 14.8 2. N/A 3. N/A 4._N/A_
Middle 1. N/A 2. N/A 3. N/A 4. N/A_
Rear 1. N/A 2. N/A 3. N/A 4._N/A_ Step Elevation Change - Kneeling (in)
3.5
ENGINE
Type □ C.I. □ Alternate Fuel
■ S.I. □ Other (explain) Mfr. / Model No. GM / 6.0 L Location ■ Front □ Rear
□ Other (explain)
Fuel Type □ Gasoline ■ CNG
□ Methanol
□ Diesel □ LNG □ Other (explain)
Fuel Tank Capacity (indicate units) Fuel Induction Type ■ Injected □ Carburetion Fuel Injector Mfr. / Model No. GM / 6.0 L Carburetor Mfr. / Model No. N/A Fuel Regulator Mfr. / Model No. BayTech / na Alternator (Generator) Mfr. / Model No.
GM / 145 amps
Maximum Rated Output (Volts / Amps)
12 / 145
Air Compressor Mfr. / Model No. TCCI Manufacturing, LLC. / SC 4875133 Maximum Capacity (ft3 / min) 2.5 ft³ @ 1,400 rpm Starter Type ■ Electrical □ Pneumatic
□ Other (explain)
Starter Mfr. / Model No. GM / 12617806
10
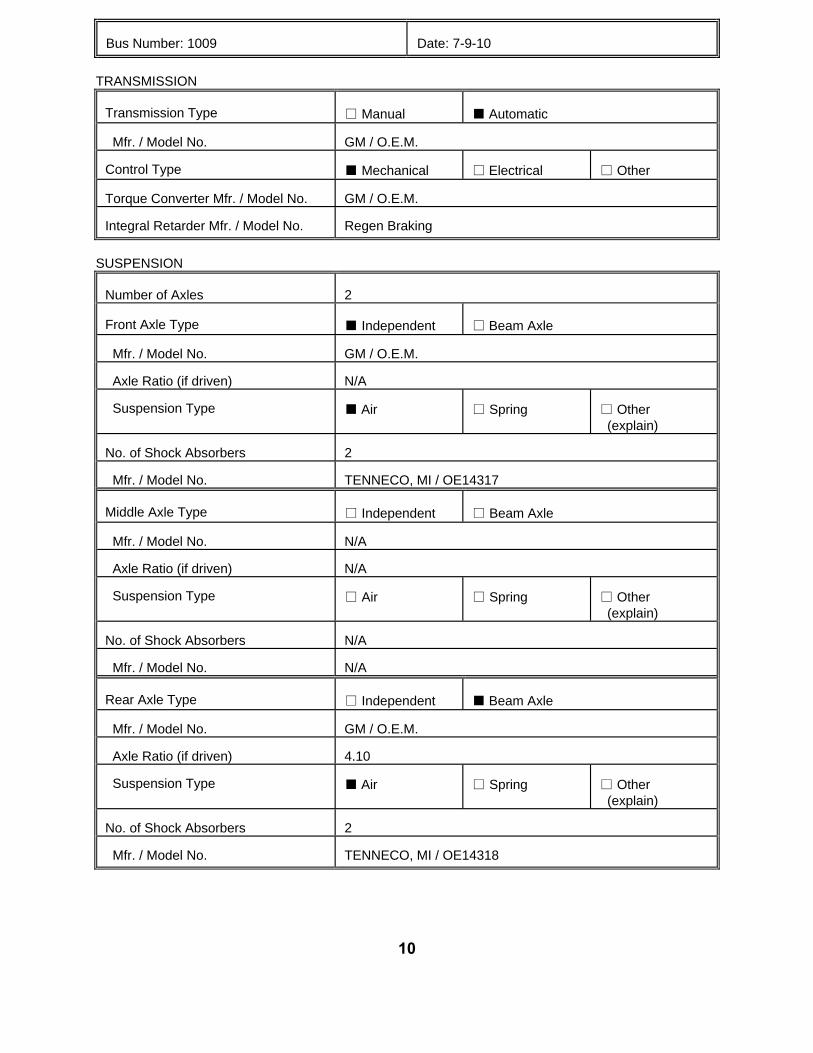
Bus Number: 1009 Date: 7-9-10
TRANSMISSION
Transmission Type □ Manual ■ Automatic Mfr. / Model No. GM / O.E.M. Control Type ■ Mechanical □ Electrical
□ Other
Torque Converter Mfr. / Model No. GM / O.E.M. Integral Retarder Mfr. / Model No. Regen Braking
SUSPENSION
Number of Axles 2 Front Axle Type ■ Independent □ Beam Axle Mfr. / Model No. GM / O.E.M. Axle Ratio (if driven) N/A Suspension Type ■ Air □ Spring
□ Other (explain)
No. of Shock Absorbers 2 Mfr. / Model No. TENNECO, MI / OE14317 Middle Axle Type □ Independent □ Beam Axle Mfr. / Model No. N/A Axle Ratio (if driven) N/A Suspension Type □ Air □ Spring
□ Other (explain)
No. of Shock Absorbers N/A Mfr. / Model No. N/A Rear Axle Type □ Independent ■ Beam Axle Mfr. / Model No. GM / O.E.M. Axle Ratio (if driven) 4.10 Suspension Type ■ Air □ Spring
□ Other (explain)
No. of Shock Absorbers 2 Mfr. / Model No. TENNECO, MI / OE14318
11
Bus Number: 1009 Date: 7-9-10
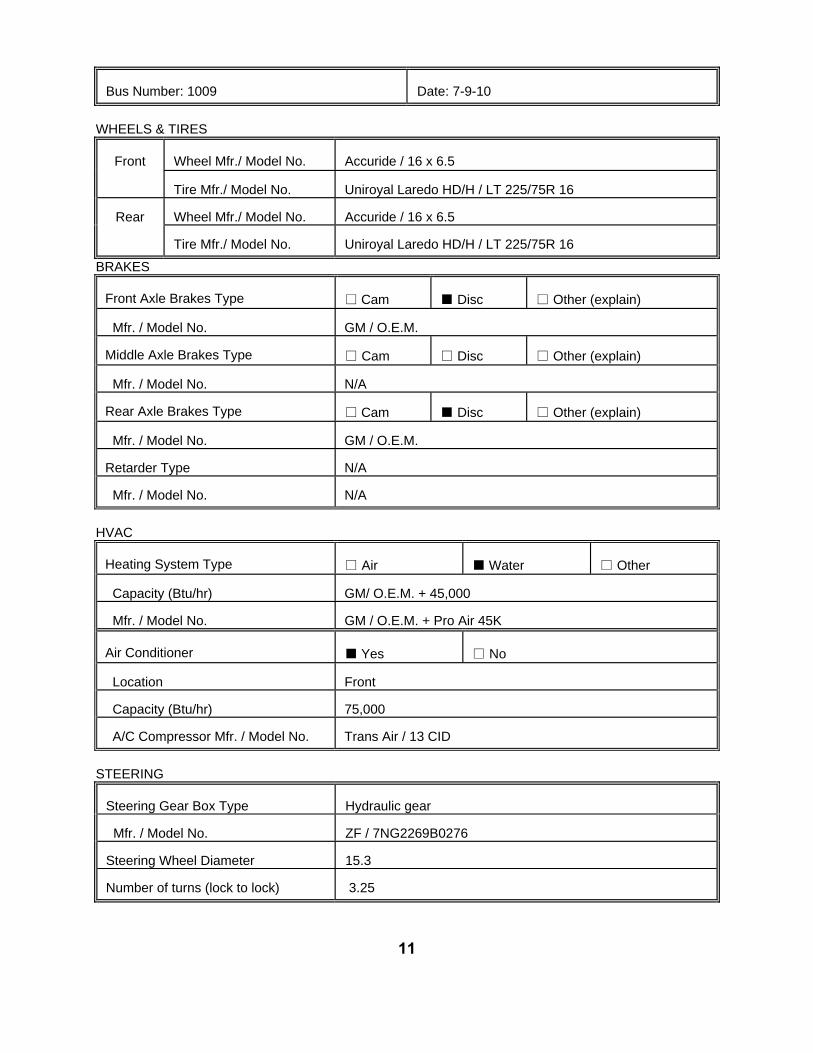
WHEELS & TIRES
Front
Wheel Mfr./ Model No. Accuride / 16 x 6.5 Tire Mfr./ Model No. Uniroyal Laredo HD/H / LT 225/75R 16
Rear
Wheel Mfr./ Model No. Accuride / 16 x 6.5 Tire Mfr./ Model No. Uniroyal Laredo HD/H / LT 225/75R 16
BRAKES Front Axle Brakes Type □ Cam ■ Disc □ Other (explain) Mfr. / Model No. GM / O.E.M. Middle Axle Brakes Type □ Cam □ Disc □ Other (explain) Mfr. / Model No. N/A Rear Axle Brakes Type □ Cam ■ Disc □ Other (explain) Mfr. / Model No. GM / O.E.M. Retarder Type N/A Mfr. / Model No. N/A
HVAC
Heating System Type □ Air ■ Water
□ Other
Capacity (Btu/hr) GM/ O.E.M. + 45,000 Mfr. / Model No. GM / O.E.M. + Pro Air 45K Air Conditioner ■ Yes □ No Location Front Capacity (Btu/hr) 75,000 A/C Compressor Mfr. / Model No. Trans Air / 13 CID
STEERING
Steering Gear Box Type Hydraulic gear Mfr. / Model No. ZF / 7NG2269B0276 Steering Wheel Diameter 15.3 Number of turns (lock to lock) 3.25
12
Bus Number: 1009 Date: 7-9-10
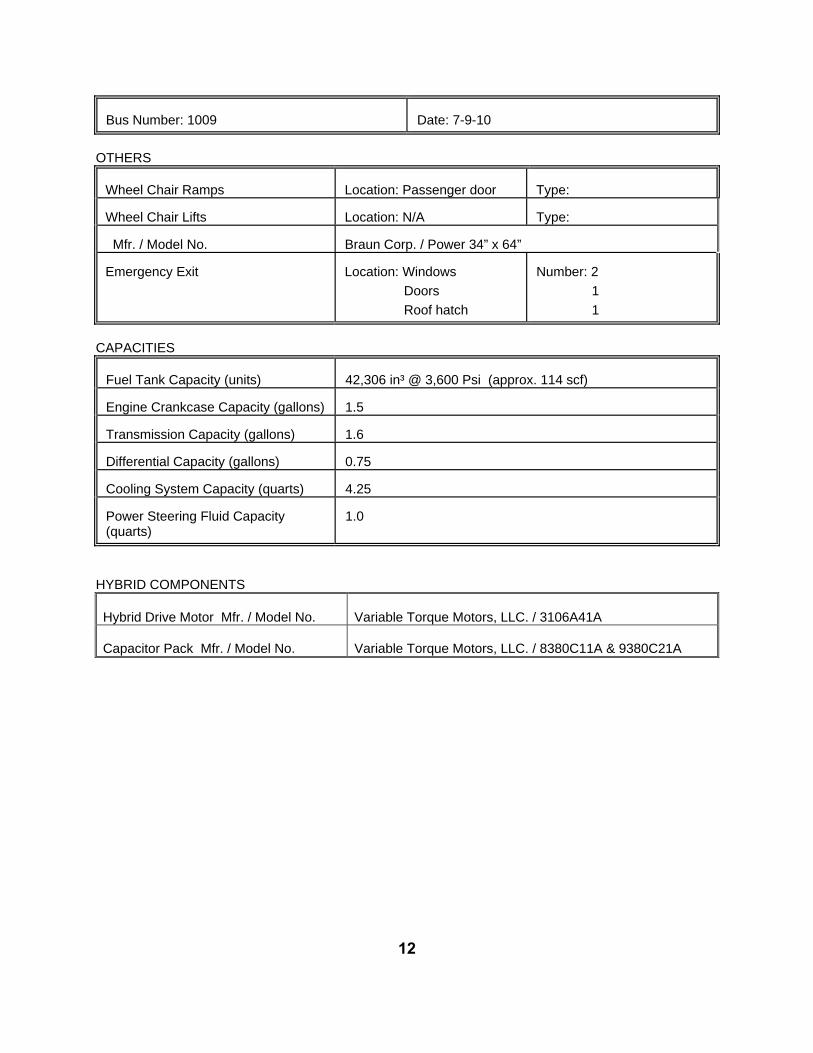
OTHERS
Wheel Chair Ramps Location: Passenger door Type: Wheel Chair Lifts Location: N/A Type: Mfr. / Model No. Braun Corp. / Power 34” x 64” Emergency Exit Location: Windows
Doors Roof hatch
Number: 2 1 1
CAPACITIES
Fuel Tank Capacity (units) 42,306 in³ @ 3,600 Psi (approx. 114 scf) Engine Crankcase Capacity (gallons) 1.5 Transmission Capacity (gallons) 1.6 Differential Capacity (gallons) 0.75 Cooling System Capacity (quarts) 4.25 Power Steering Fluid Capacity (quarts)
1.0
HYBRID COMPONENTS Hybrid Drive Motor Mfr. / Model No.
Variable Torque Motors, LLC. / 3106A41A
Capacitor Pack Mfr. / Model No.
Variable Torque Motors, LLC. / 8380C11A & 9380C21A
13
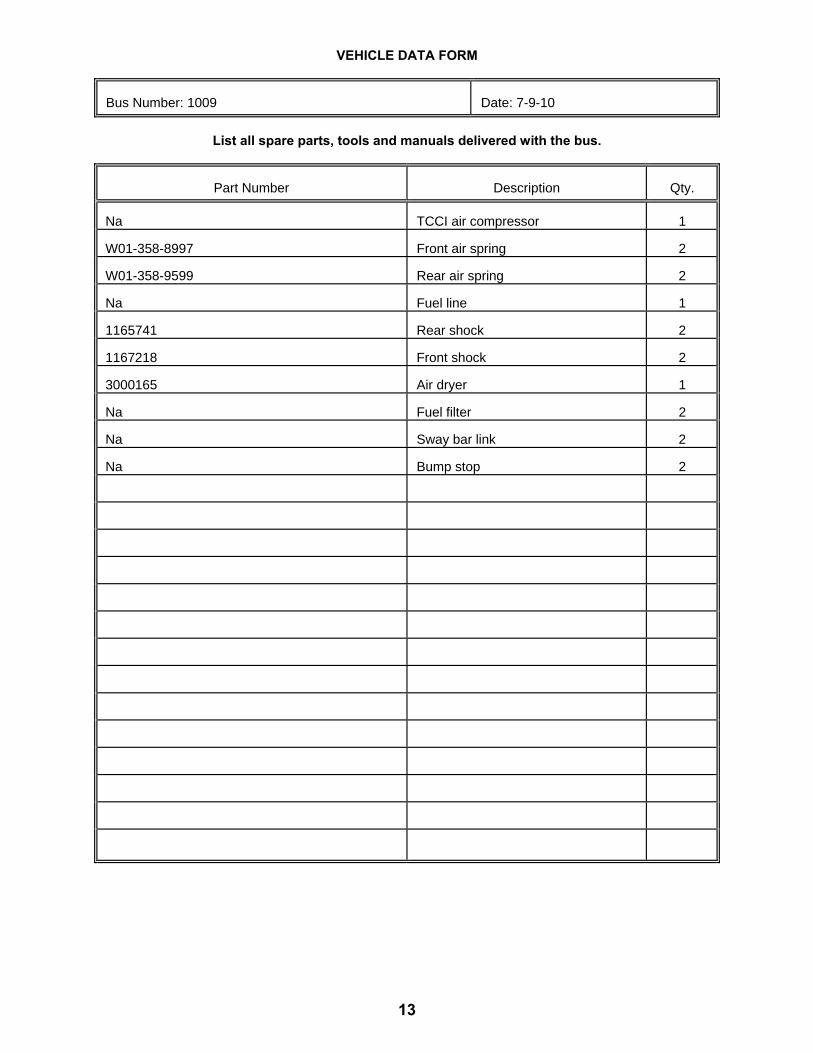
VEHICLE DATA FORM
Bus Number: 1009 Date: 7-9-10
List all spare parts, tools and manuals delivered with the bus.
Part Number Description Qty. Na TCCI air compressor 1 W01-358-8997 Front air spring 2 W01-358-9599 Rear air spring 2 Na Fuel line 1 1165741 Rear shock 2 1167218 Front shock 2 3000165 Air dryer 1 Na Fuel filter 2 Na Sway bar link 2 Na Bump stop 2
14
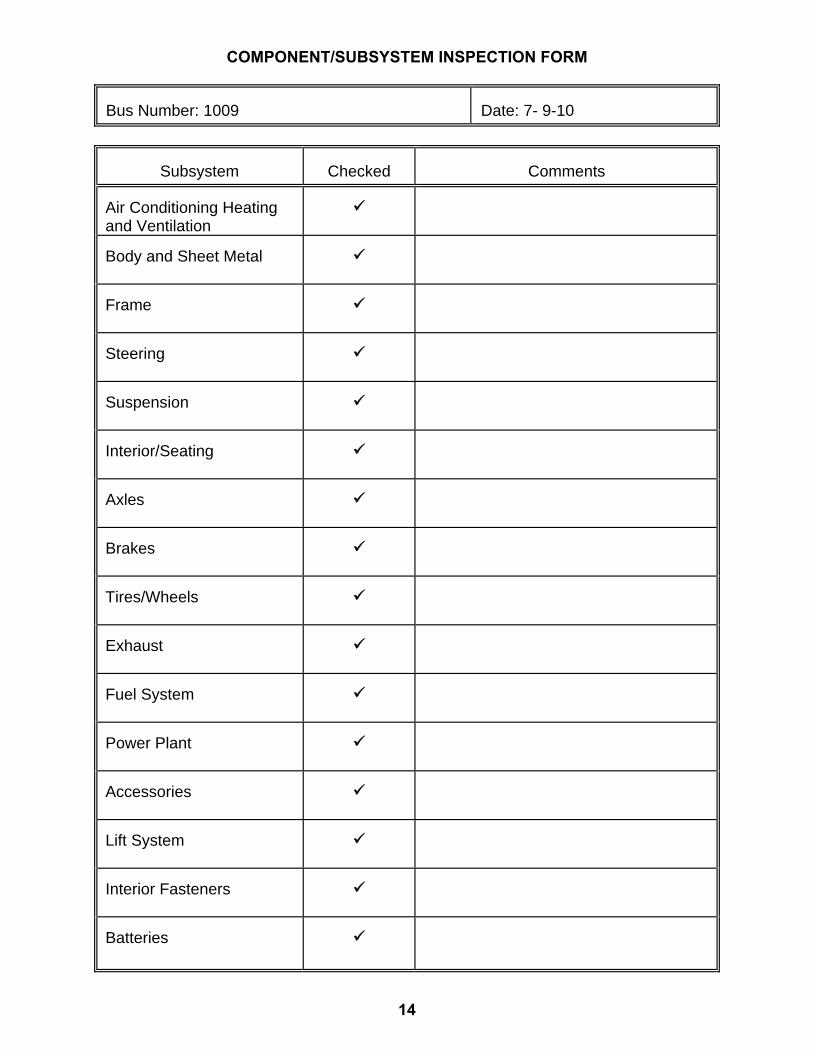
COMPONENT/SUBSYSTEM INSPECTION FORM
Bus Number: 1009 Date: 7- 9-10
Subsystem
Checked Comments
Air Conditioning Heating and Ventilation
Body and Sheet Metal
Frame
Steering
Suspension
Interior/Seating
Axles
Brakes
Tires/Wheels
Exhaust
Fuel System
Power Plant
Accessories
Lift System
Interior Fasteners
Batteries

15
CHECK - IN ARBOC MOBILITY, LLC. MODEL 2010 CNG HYBRID-SOM236
16
CHECK - IN CONT.
ARBOC MOBILITY, LLC. MODEL 2010 CNG HYBRID-SOM236 EQUIPPED WITH A BRAUN HANDICAP RAMP
17
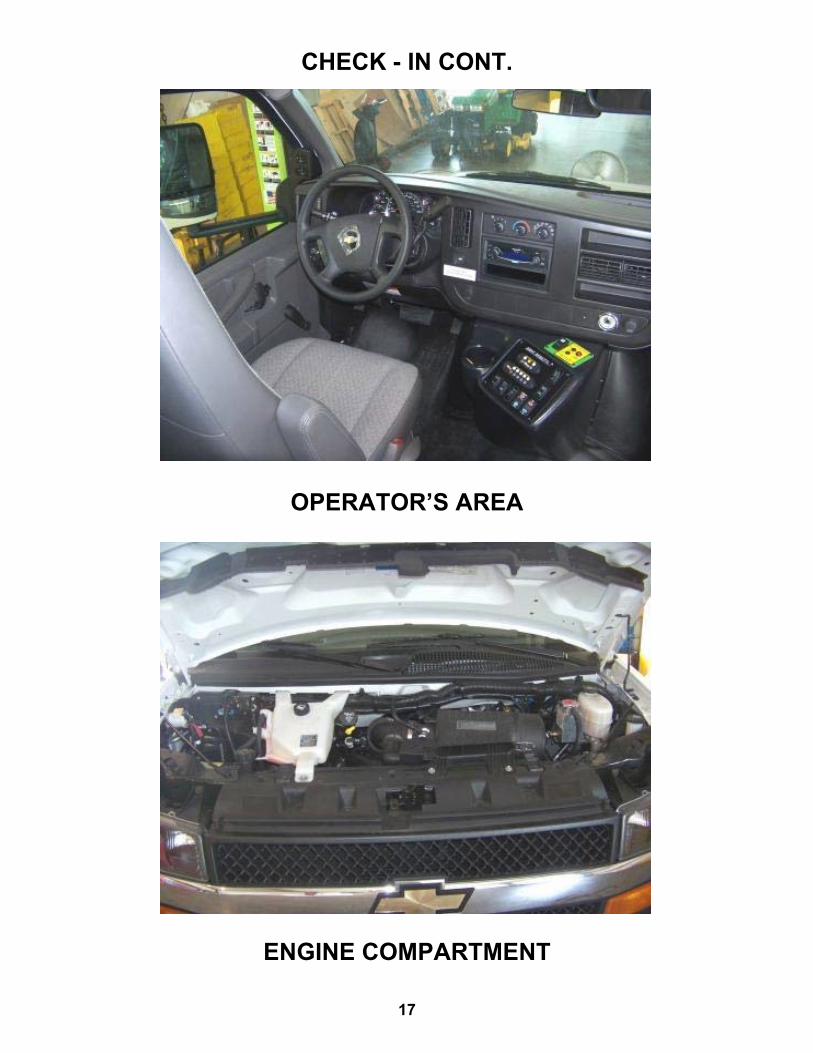
CHECK - IN CONT.
OPERATOR’S AREA
ENGINE COMPARTMENT
18
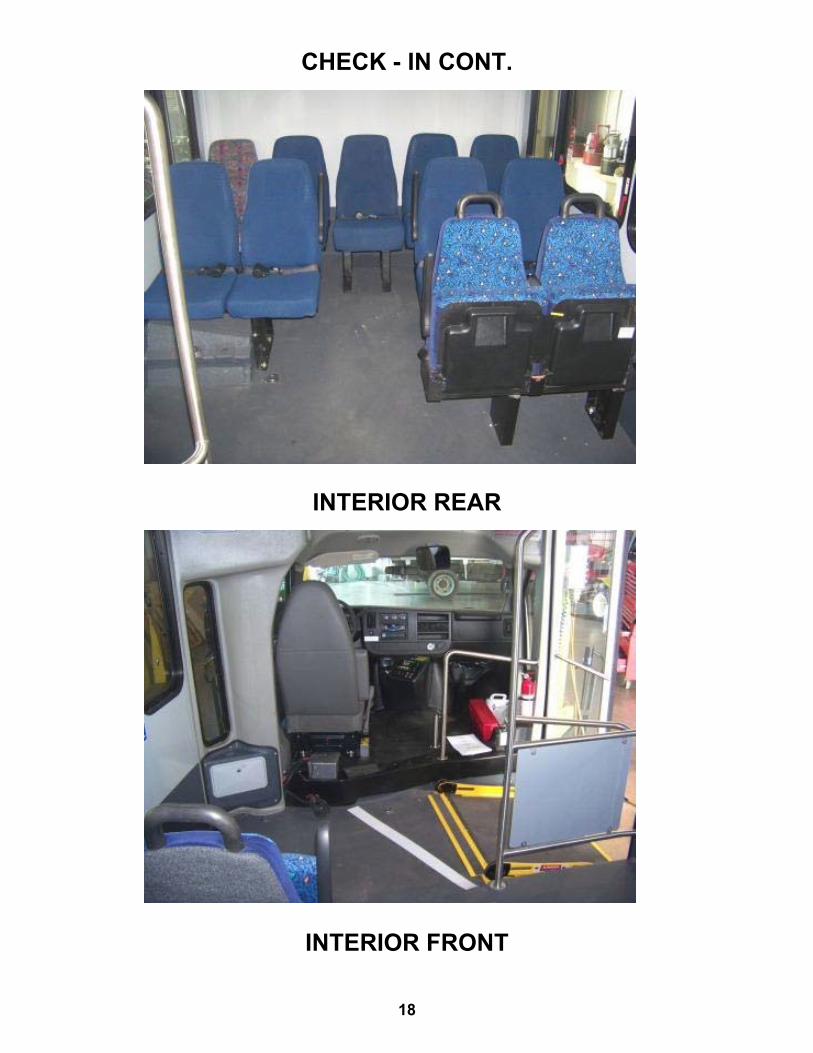
CHECK - IN CONT.
INTERIOR REAR
INTERIOR FRONT
19
1.2 SERVICING, PREVENTIVE MAINTENANCE, AND REPAIR AND MAINTENANCE DURING TESTING
1.2-I. TEST OBJECTIVE
The objective of this test is to collect maintenance data about the servicing, preventive maintenance, and repair. 1.2.-II. TEST DESCRIPTION
The test will be conducted by operating the NBM and collecting the following data on work order forms and a driver log.
1. Unscheduled Maintenance a. Bus number b. Date c. Mileage d. Description of malfunction e. Location of malfunction (e.g., in service or undergoing inspection) f. Repair action and parts used g. Man-hours required
2. Scheduled Maintenance
a. Bus number b. Date c. Mileage d. Engine running time (if available) e. Results of scheduled inspections f. Description of malfunction (if any) g. Repair action and parts used (if any) h. Man-hours required
The buses will be operated in accelerated durability service. While typical items
are given below, the specific service schedule will be that specified by the manufacturer.
A. Service 1. Fueling 2. Consumable checks 3. Interior cleaning
B. Preventive Maintenance
4. Brake adjustments 5. Lubrication 6. 3,000 mi (or equivalent) inspection
20
7. Oil and filter change inspection 8. Major inspection 9. Tune-up
C. Periodic Repairs
1. Brake reline 2. Transmission change 3. Engine change 4. Windshield wiper motor change 5. Stoplight bulb change 6. Towing operations 7. Hoisting operations
1.2-III. DISCUSSION
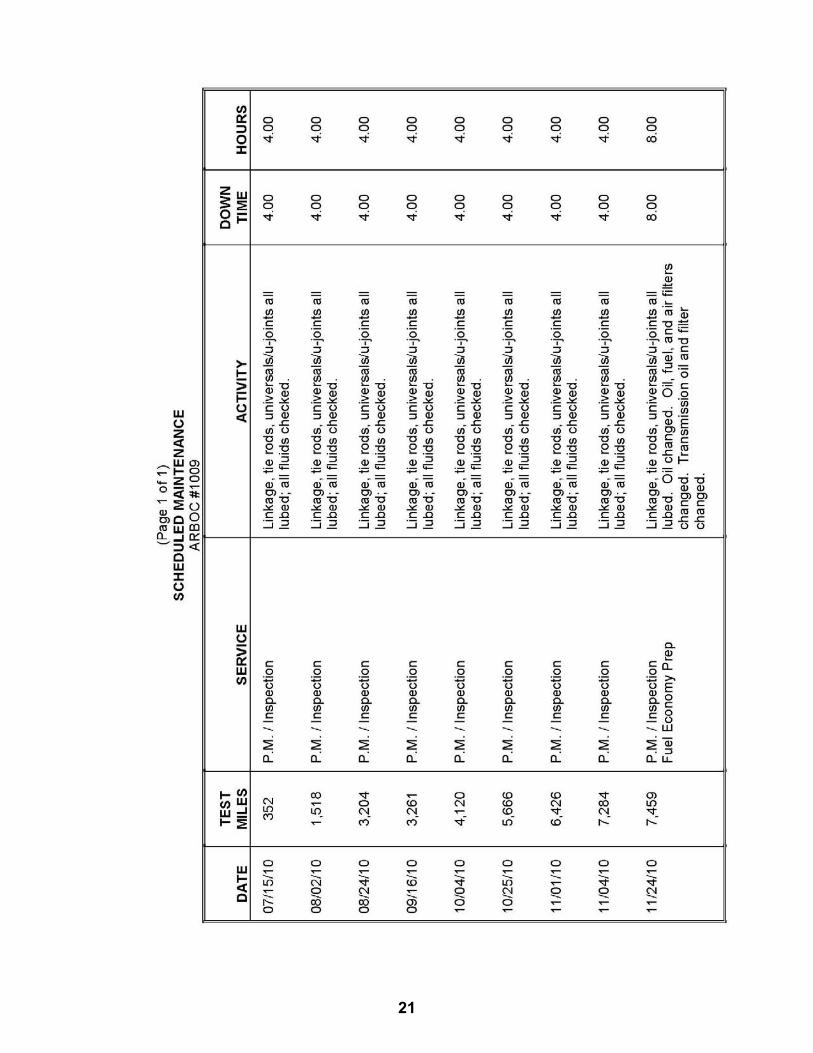
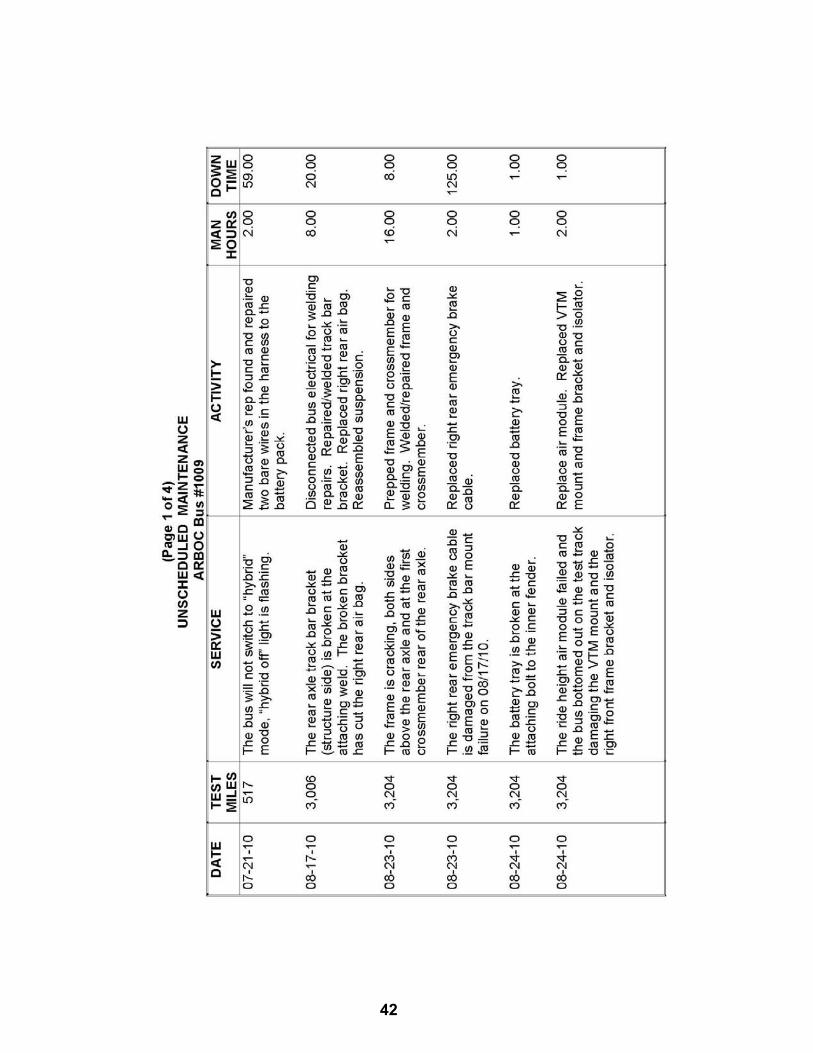
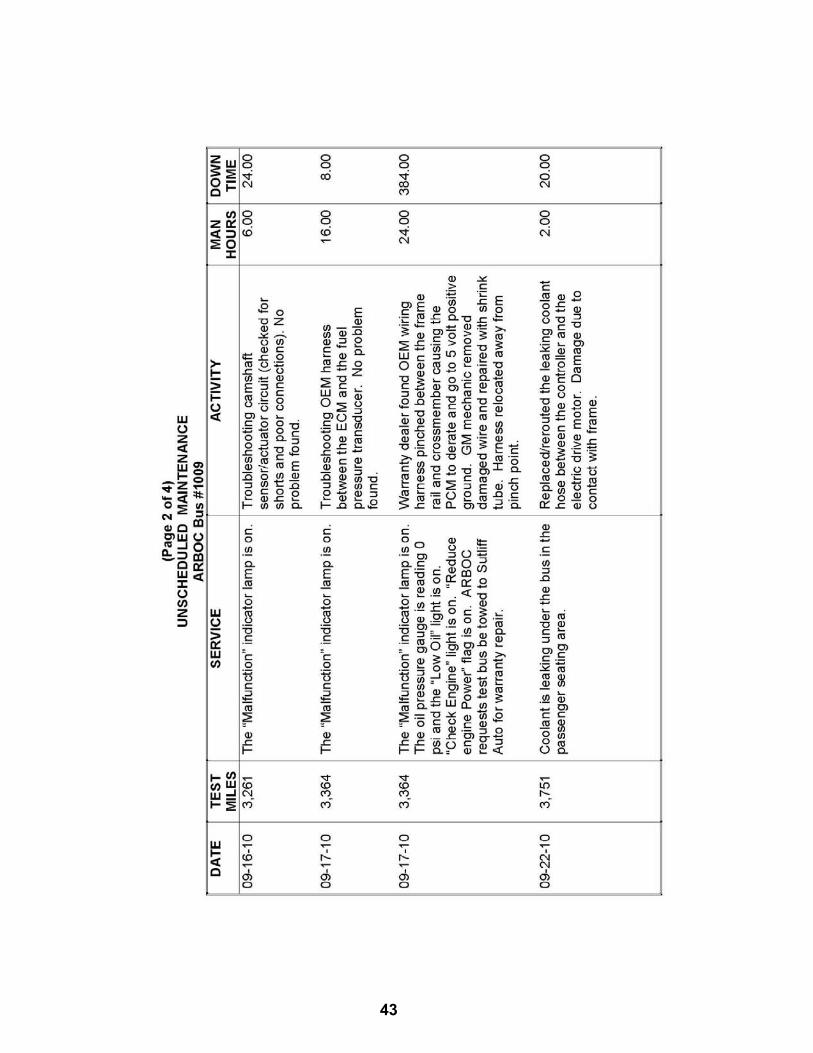
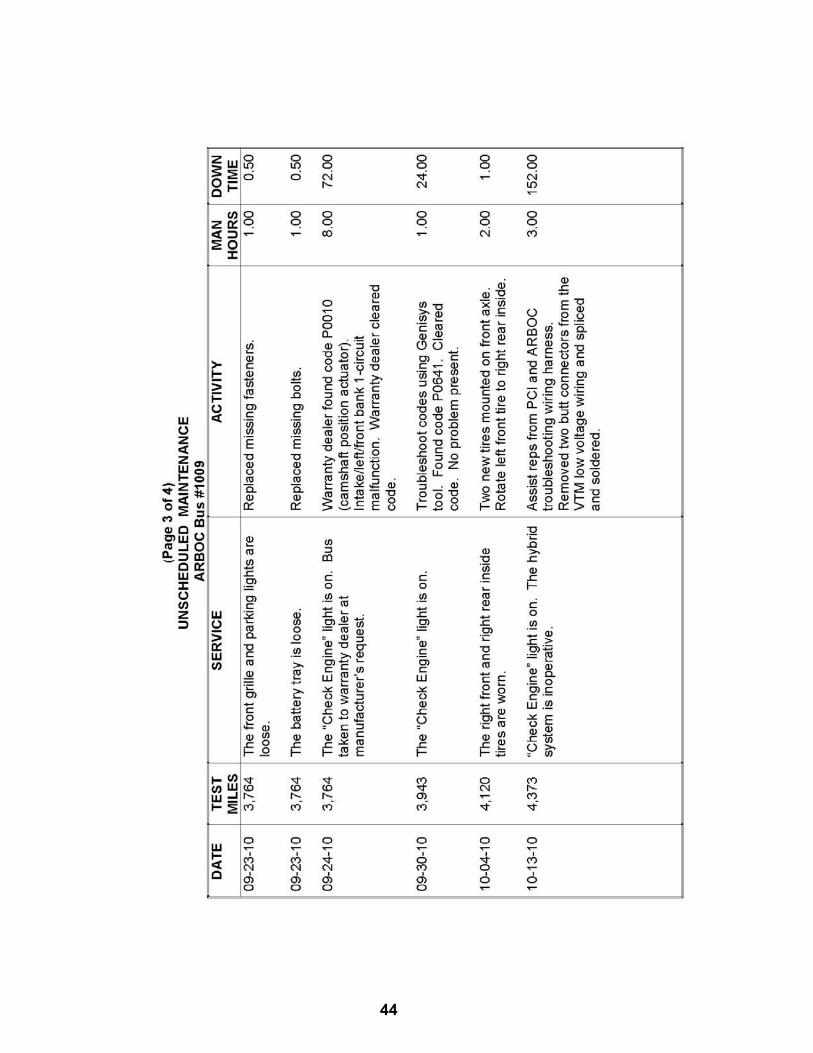
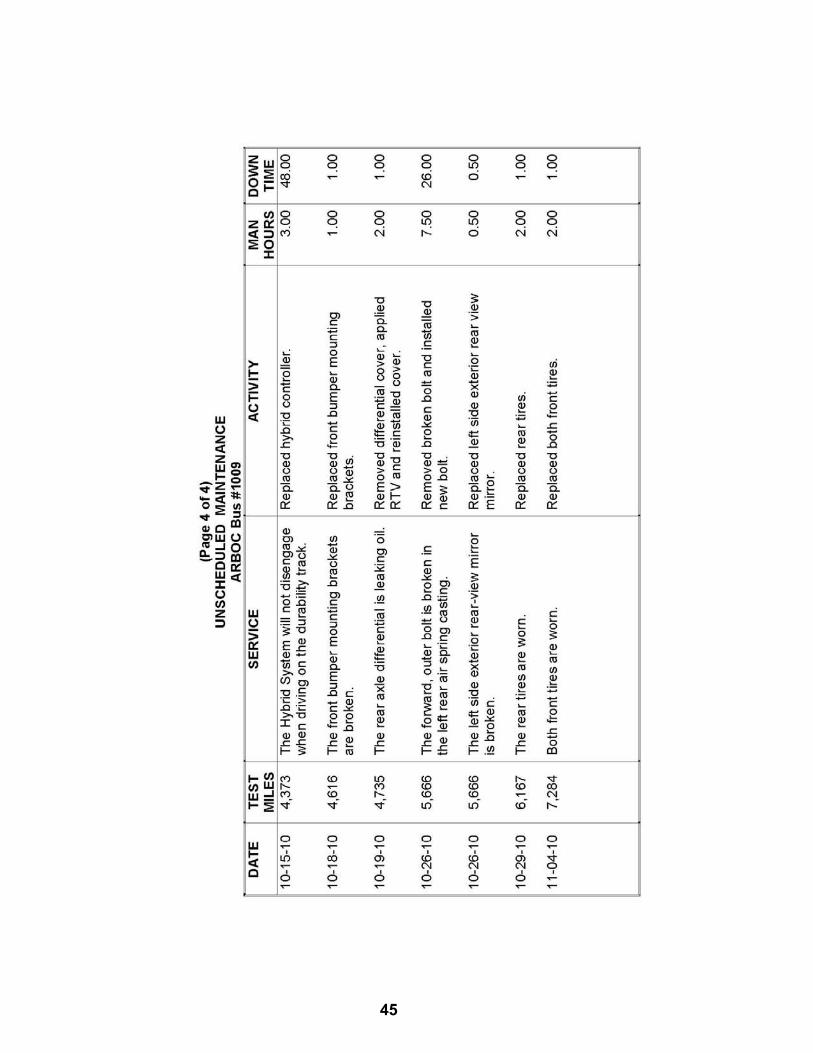
Servicing and preventive maintenance were performed at manufacturer-specified intervals. The following Scheduled Maintenance Form lists the mileage, items serviced, the service interval, and amount of time required to perform the maintenance. Table 1 is a list of the lubricating products used in servicing. Finally, the Unscheduled Maintenance List along with Unscheduled Maintenance-related photographs is included in Section 5.7, Structural Durability. This list supplies information related to failures that occurred during the durability portion of testing. The Unscheduled Maintenance List includes the date and mileage at which the malfunction occurred, a description of the malfunction and repair, and the time required to perform the repair.
21
22
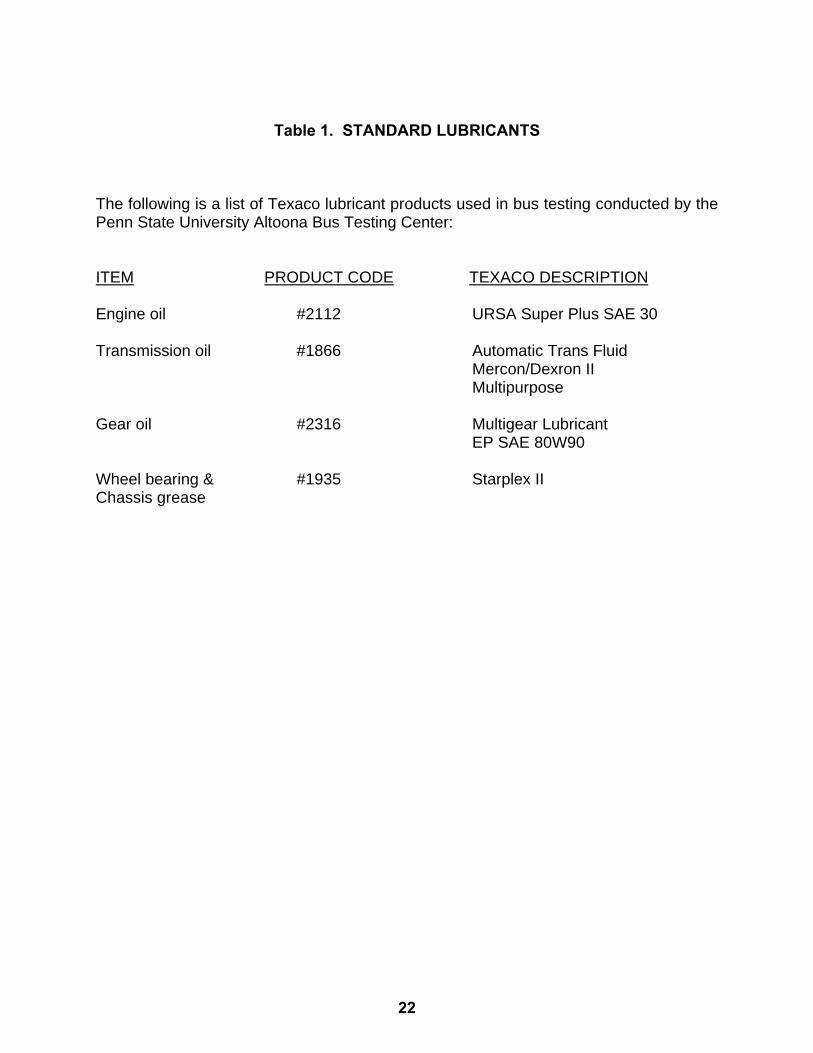
Table 1. STANDARD LUBRICANTS The following is a list of Texaco lubricant products used in bus testing conducted by the Penn State University Altoona Bus Testing Center: ITEM PRODUCT CODE TEXACO DESCRIPTION Engine oil #2112 URSA Super Plus SAE 30 Transmission oil #1866 Automatic Trans Fluid
Mercon/Dexron II Multipurpose
Gear oil #2316 Multigear Lubricant
EP SAE 80W90 Wheel bearing & #1935 Starplex II Chassis grease
23
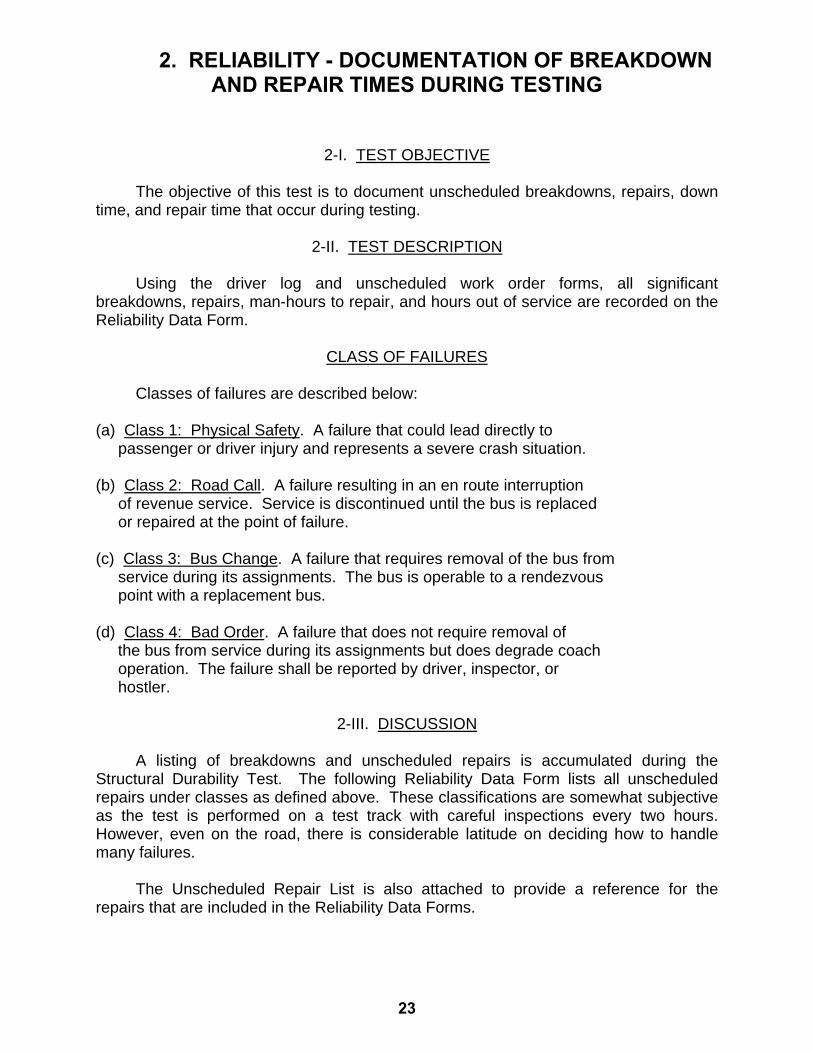
2. RELIABILITY - DOCUMENTATION OF BREAKDOWN AND REPAIR TIMES DURING TESTING 2-I. TEST OBJECTIVE
The objective of this test is to document unscheduled breakdowns, repairs, down time, and repair time that occur during testing. 2-II. TEST DESCRIPTION
Using the driver log and unscheduled work order forms, all significant breakdowns, repairs, man-hours to repair, and hours out of service are recorded on the Reliability Data Form. CLASS OF FAILURES
Classes of failures are described below: (a) Class 1: Physical Safety. A failure that could lead directly to passenger or driver injury and represents a severe crash situation. (b) Class 2: Road Call. A failure resulting in an en route interruption of revenue service. Service is discontinued until the bus is replaced or repaired at the point of failure. (c) Class 3: Bus Change. A failure that requires removal of the bus from service during its assignments. The bus is operable to a rendezvous point with a replacement bus. (d) Class 4: Bad Order. A failure that does not require removal of the bus from service during its assignments but does degrade coach operation. The failure shall be reported by driver, inspector, or hostler. 2-III. DISCUSSION
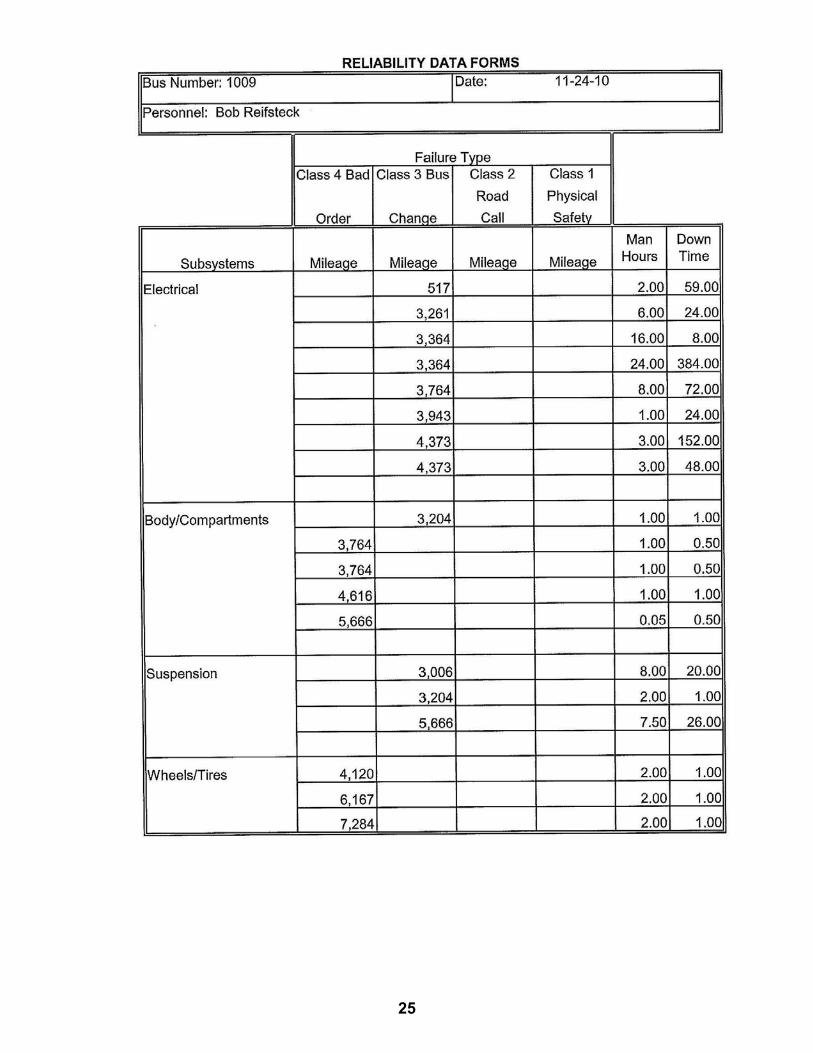
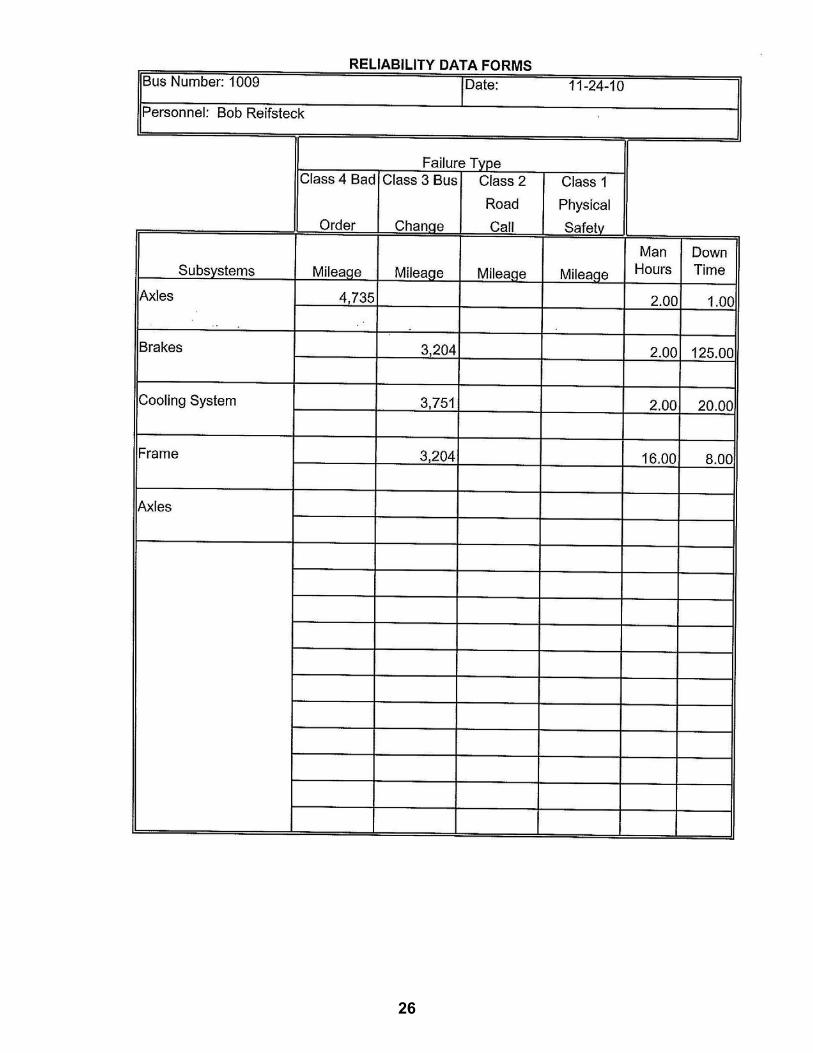
A listing of breakdowns and unscheduled repairs is accumulated during the Structural Durability Test. The following Reliability Data Form lists all unscheduled repairs under classes as defined above. These classifications are somewhat subjective as the test is performed on a test track with careful inspections every two hours. However, even on the road, there is considerable latitude on deciding how to handle many failures.
The Unscheduled Repair List is also attached to provide a reference for the repairs that are included in the Reliability Data Forms.
24
The classification of repairs according to subsystem is intended to emphasize those systems which had persistent minor or more serious problems. There were no Class 1 or 2 failures. Of the 15 Class 3 failures, eight occurred in the electrical system, three with the suspension system and one each to the body, brakes, cooling system and frame. These, and the remaining eight Class 4 failures are available for review in the Unscheduled Maintenance List, located in Section 5.7 Structural Durability.
25
26
27
4.1 PERFORMANCE - AN ACCELERATION, GRADEABILITY, AND TOP SPEED TEST 4-I. TEST OBJECTIVE
The objective of this test is to determine the acceleration, gradeability, and top speed capabilities of the bus. 4-II. TEST DESCRIPTION
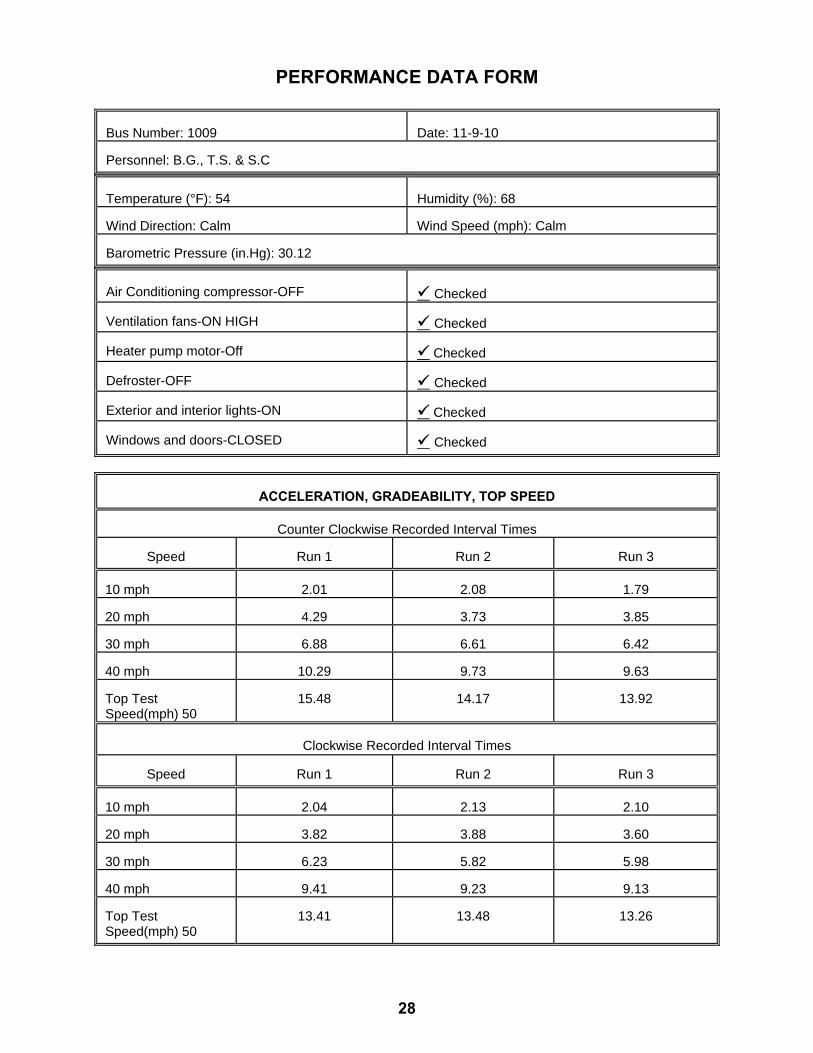
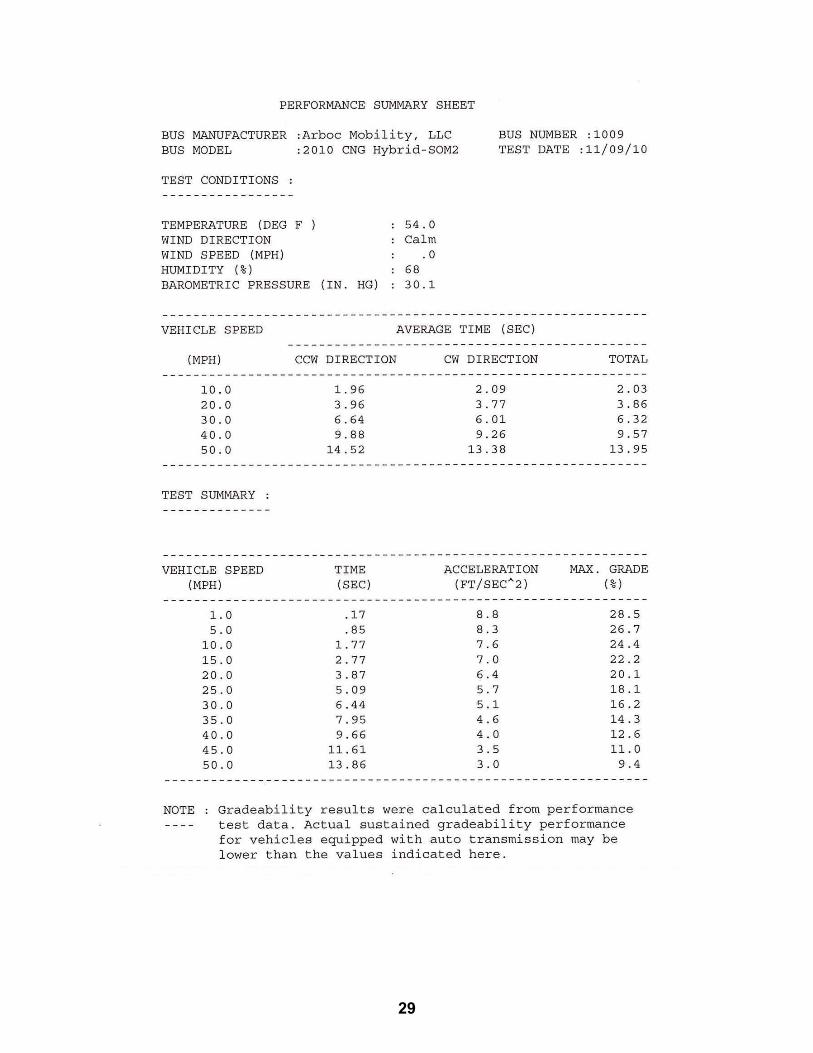
In this test, the bus will be operated at SLW on the skid pad at the PSBRTF. The bus will be accelerated at full throttle from a standstill to a maximum "geared" or "safe" speed as determined by the test driver. The vehicle speed is measured using a Correvit non-contacting speed sensor. The times to reach speed between ten mile per hour increments are measured and recorded using a stopwatch with a lap timer. The time to speed data will be recorded on the Performance Data Form and later used to generate a speed vs. time plot and gradeability calculations. 4-III. DISCUSSION
This test consists of three runs in both the clockwise and counterclockwise directions on the Test Track. Velocity versus time data is obtained for each run and results are averaged together to minimize any test variability which might be introduced by wind or other external factors. The test was performed up to a maximum speed of 50 mph. The fitted curve of velocity vs. time is attached, followed by the calculated gradeability results. The average time to obtain 50 mph was 13.95 seconds.
28
PERFORMANCE DATA FORM
Bus Number: 1009 Date: 11-9-10 Personnel: B.G., T.S. & S.C
Temperature (°F): 54 Humidity (%): 68 Wind Direction: Calm Wind Speed (mph): Calm Barometric Pressure (in.Hg): 30.12
Air Conditioning compressor-OFF Checked Ventilation fans-ON HIGH Checked Heater pump motor-Off Checked Defroster-OFF Checked Exterior and interior lights-ON Checked Windows and doors-CLOSED Checked
ACCELERATION, GRADEABILITY, TOP SPEED
Counter Clockwise Recorded Interval Times
Speed
Run 1 Run 2 Run 3 10 mph
2.01 2.08
1.79
20 mph
4.29 3.73
3.85
30 mph
6.88 6.61
6.42
40 mph
10.29 9.73
9.63
Top Test Speed(mph) 50
15.48 14.17
13.92
Clockwise Recorded Interval Times
Speed
Run 1 Run 2 Run 3
10 mph
2.04 2.13
2.10
20 mph
3.82 3.88
3.60
30 mph
6.23 5.82
5.98
40 mph
9.41 9.23
9.13
Top Test Speed(mph) 50
13.41 13.48
13.26
29
30
31
4.0 PERFORMANCE
4.2 Performance - Bus Braking
4.2 I. TEST OBJECTIVE
The objective of this test is to provide, for comparison purposes, braking performance data on transit buses produced by different manufacturers.
4.2 II. TEST DESCRIPTION
The testing will be conducted at the PTI Test Track skid pad area. Brake tests will be conducted after completion of the GVW portion of the vehicle durability test. At this point in testing the brakes have been subjected to a large number of braking snubs and will be considered well burnished. Testing will be performed when the bus is fully loaded at its GVW. All tires on each bus must be representative of the tires on the production model vehicle The brake testing procedure comprises three phases:
1. Stopping distance tests
i. Dry surface (high-friction, Skid Number within the range of 70-76) ii. Wet surface (low-friction, Skid Number within the range of 30-36)
2. Stability tests 3. Parking brake test
Stopping Distance Tests
The stopping distance phase will evaluate service brake stops. All stopping distance tests on dry surface will be performed in a straight line and at the speeds of 20, 30, 40 and 45 mph. All stopping distance tests on wet surface will be performed in straight line at speed of 20 mph. The tests will be conducted as follows:
1. Uniform High Friction Tests: Four maximum deceleration straight-line brake applications each at 20, 30, 40 and 45 mph, to a full stop on a uniform high-friction surface in a 3.66-m (12-ft) wide lane.
2. Uniform Low Friction Tests: Four maximum deceleration straight-line brake
applications from 20 mph on a uniform low friction surface in a 3.66-m (12-ft) wide lane.
When performing service brake stops for both cases, the test vehicle is accelerated
on the bus test lane to the speed specified in the test procedure and this speed is maintained into the skid pad area. Upon entry of the appropriate lane of the skid pad area, the vehicle's service brake is applied to stop the vehicle as quickly as possible. The stopping distance is measured and recorded for both cases on the test data form. Stopping
32
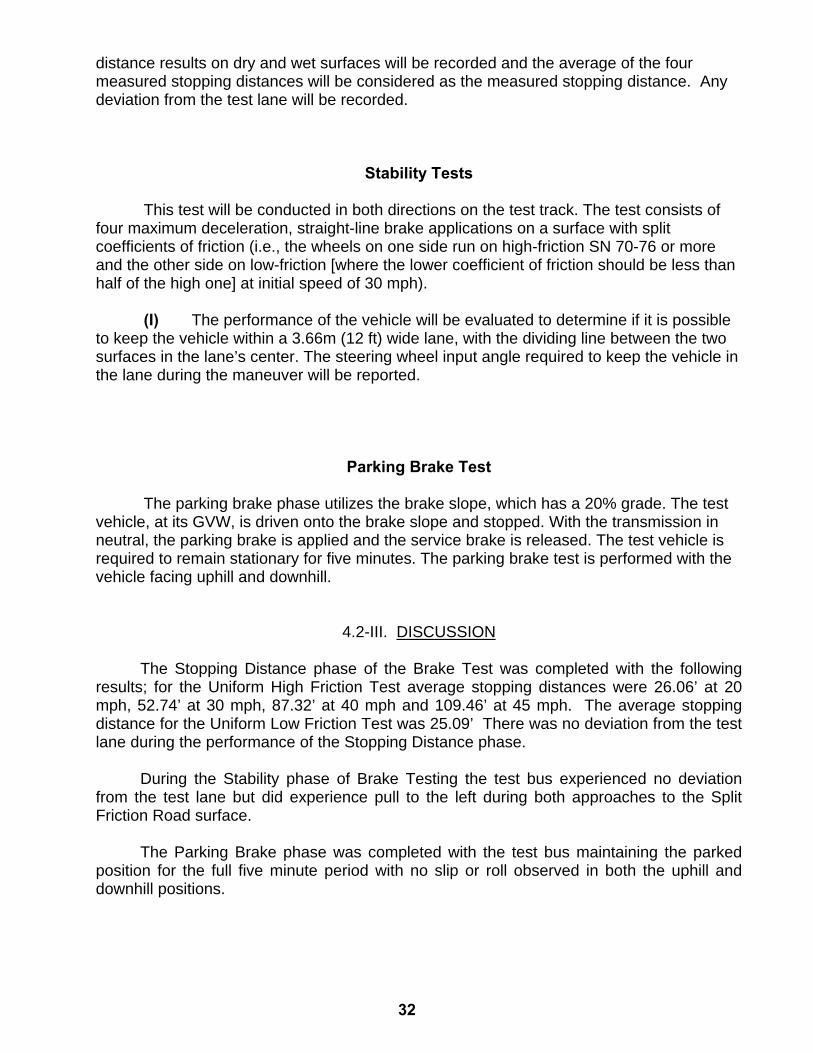
distance results on dry and wet surfaces will be recorded and the average of the four measured stopping distances will be considered as the measured stopping distance. Any deviation from the test lane will be recorded.
Stability Tests
This test will be conducted in both directions on the test track. The test consists of four maximum deceleration, straight-line brake applications on a surface with split coefficients of friction (i.e., the wheels on one side run on high-friction SN 70-76 or more and the other side on low-friction [where the lower coefficient of friction should be less than half of the high one] at initial speed of 30 mph).
(I) The performance of the vehicle will be evaluated to determine if it is possible to keep the vehicle within a 3.66m (12 ft) wide lane, with the dividing line between the two surfaces in the lane’s center. The steering wheel input angle required to keep the vehicle in the lane during the maneuver will be reported.
Parking Brake Test
The parking brake phase utilizes the brake slope, which has a 20% grade. The test vehicle, at its GVW, is driven onto the brake slope and stopped. With the transmission in neutral, the parking brake is applied and the service brake is released. The test vehicle is required to remain stationary for five minutes. The parking brake test is performed with the vehicle facing uphill and downhill.
4.2-III. DISCUSSION The Stopping Distance phase of the Brake Test was completed with the following results; for the Uniform High Friction Test average stopping distances were 26.06’ at 20 mph, 52.74’ at 30 mph, 87.32’ at 40 mph and 109.46’ at 45 mph. The average stopping distance for the Uniform Low Friction Test was 25.09’ There was no deviation from the test lane during the performance of the Stopping Distance phase. During the Stability phase of Brake Testing the test bus experienced no deviation from the test lane but did experience pull to the left during both approaches to the Split Friction Road surface. The Parking Brake phase was completed with the test bus maintaining the parked position for the full five minute period with no slip or roll observed in both the uphill and downhill positions.
33
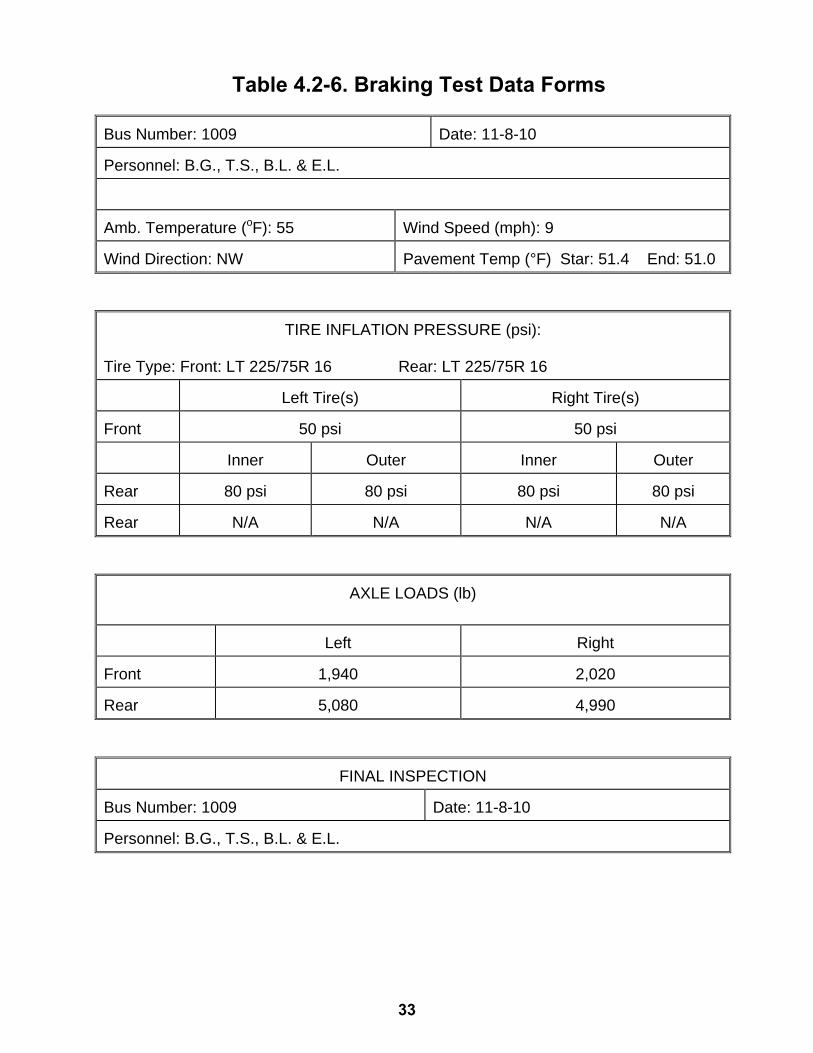
Table 4.2-6. Braking Test Data Forms
Bus Number: 1009 Date: 11-8-10 Personnel: B.G., T.S., B.L. & E.L. Amb. Temperature (oF): 55 Wind Speed (mph): 9 Wind Direction: NW Pavement Temp (°F) Star: 51.4 End: 51.0
TIRE INFLATION PRESSURE (psi):
Tire Type: Front: LT 225/75R 16 Rear: LT 225/75R 16
Left Tire(s)
Right Tire(s)
Front
50 psi
50 psi
Inner
Outer Inner
Outer
Rear
80 psi 80 psi 80 psi 80 psi
Rear
N/A N/A N/A N/A
AXLE LOADS (lb)
Left Right
Front 1,940
2,020
Rear 5,080
4,990
FINAL INSPECTION
Bus Number: 1009 Date: 11-8-10 Personnel: B.G., T.S., B.L. & E.L.
34
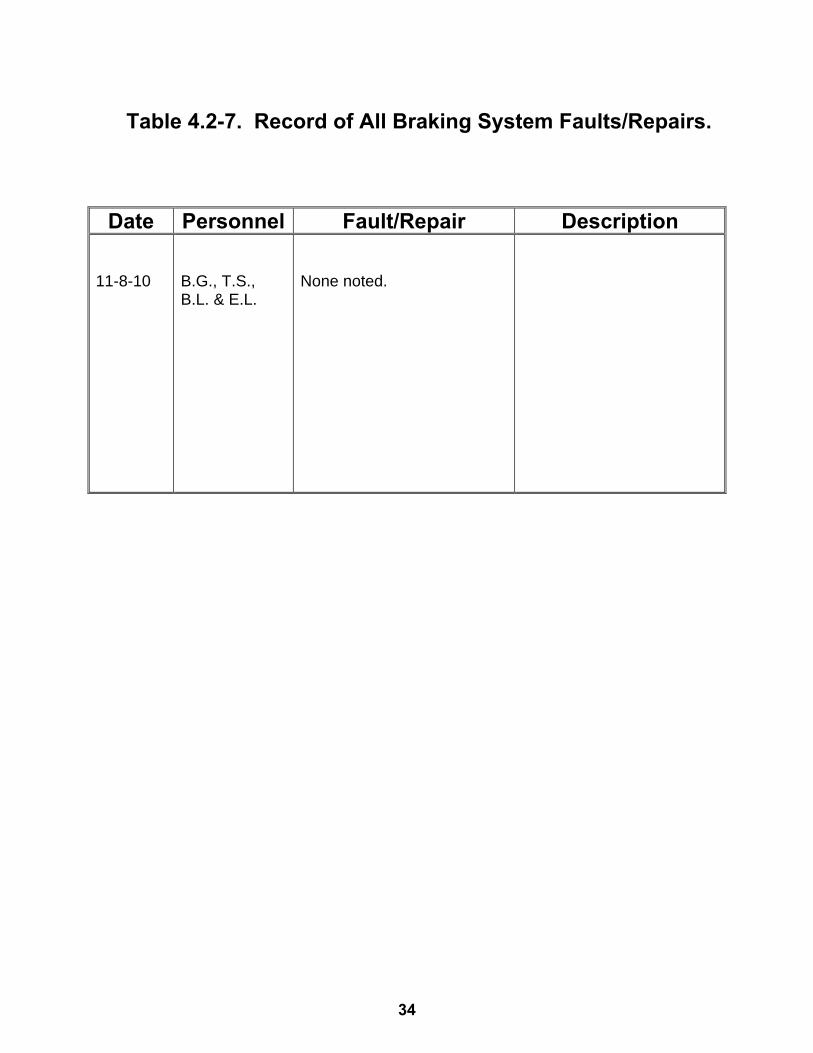
Table 4.2-7. Record of All Braking System Faults/Repairs.
Date Personnel Fault/Repair Description 11-8-10
B.G., T.S., B.L. & E.L.
None noted.
35
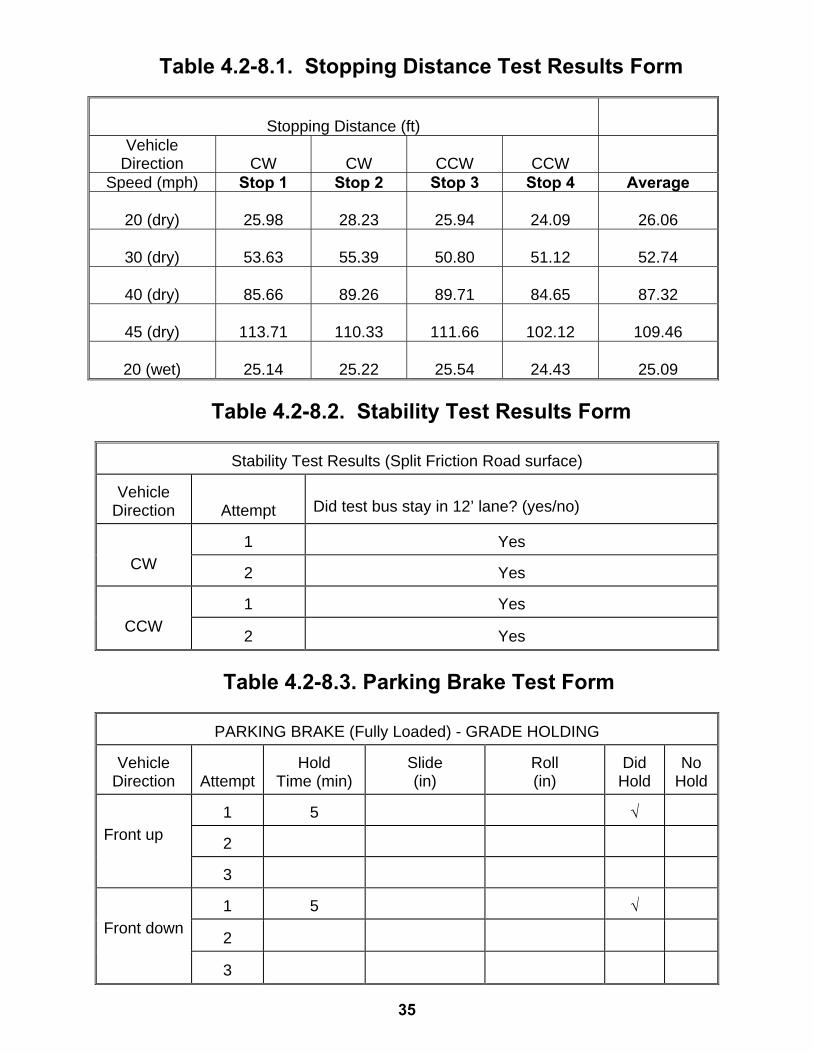
Table 4.2-8.1. Stopping Distance Test Results Form
Stopping Distance (ft)
Vehicle Direction
CW
CW
CCW
CCW
Speed (mph) Stop 1 Stop 2 Stop 3 Stop 4 Average
20 (dry)
25.98
28.23
25.94
24.09
26.06
30 (dry)
53.63
55.39
50.80
51.12
52.74
40 (dry)
85.66
89.26
89.71
84.65
87.32
45 (dry)
113.71
110.33
111.66
102.12
109.46
20 (wet)
25.14
25.22
25.54
24.43
25.09
Table 4.2-8.2. Stability Test Results Form
Stability Test Results (Split Friction Road surface)
Vehicle
Direction
Attempt Did test bus stay in 12’ lane? (yes/no)
CW
1 Yes
2 Yes
CCW
1 Yes
2 Yes
Table 4.2-8.3. Parking Brake Test Form
PARKING BRAKE (Fully Loaded) - GRADE HOLDING
Vehicle Direction
Attempt
Hold
Time (min) Slide (in)
Roll (in)
Did
Hold No
Hold Front up
1
5
√
2
3
Front down
1
5
√
2
3
36
5.7 STRUCTURAL DURABILITY TEST 5.7-I. TEST OBJECTIVE
The objective of this test is to perform an accelerated durability test that approximates up to 25 percent of the service life of the vehicle. 5.7-II. TEST DESCRIPTION
The test vehicle is driven a total of 7,500 miles; approximately 5,000 miles on the PSBRTF Durability Test Track and approximately 2,500 miscellaneous other miles. The test will be conducted with the bus operated under three different loading conditions. The first segment will consist of approximately 3,000 miles with the bus operated at GVW. The second segment will consist of approximately 1,500 miles with the bus operated at SLW. The remainder of the test, approximately 3,000 miles, will be conducted with the bus loaded to CW. If GVW exceeds the axle design weights, then the load will be adjusted to the axle design weights and the change will be recorded. All subsystems are run during these tests in their normal operating modes. All recommended manufacturers servicing is to be followed and noted on the vehicle maintainability log. Servicing items accelerated by the durability tests will be compressed by 10:1; all others will be done on a 1:1 mi/mi basis. Unscheduled breakdowns and repairs are recorded on the same log as are any unusual occurrences as noted by the driver. Once a week the test vehicle shall be washed down and thoroughly inspected for any signs of failure. 5.7-III. DISCUSSION
The Structural Durability Test was started on July 12, 2010 and was conducted until November 24, 2010. The first 3,000 miles were performed at a GVW of 14,030 lbs. and completed on August 16, 2010. Note: at GVL the load is 470 lbs over the rear GAWR yet within the GVWR. The next 1,500 mile SLW segment was performed at 13,140 lbs and completed on October 18, 2010 and the final 3,000 mile segment was performed at a CW of 10,540 lbs and completed on November 24, 2010.
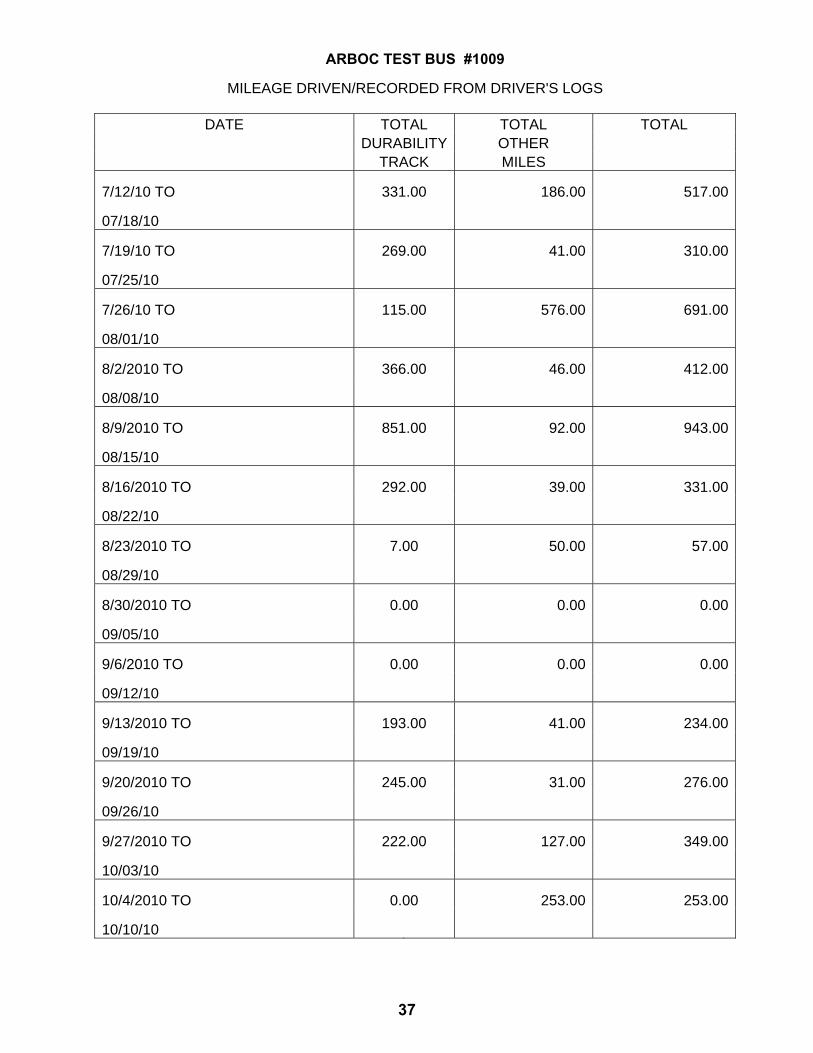
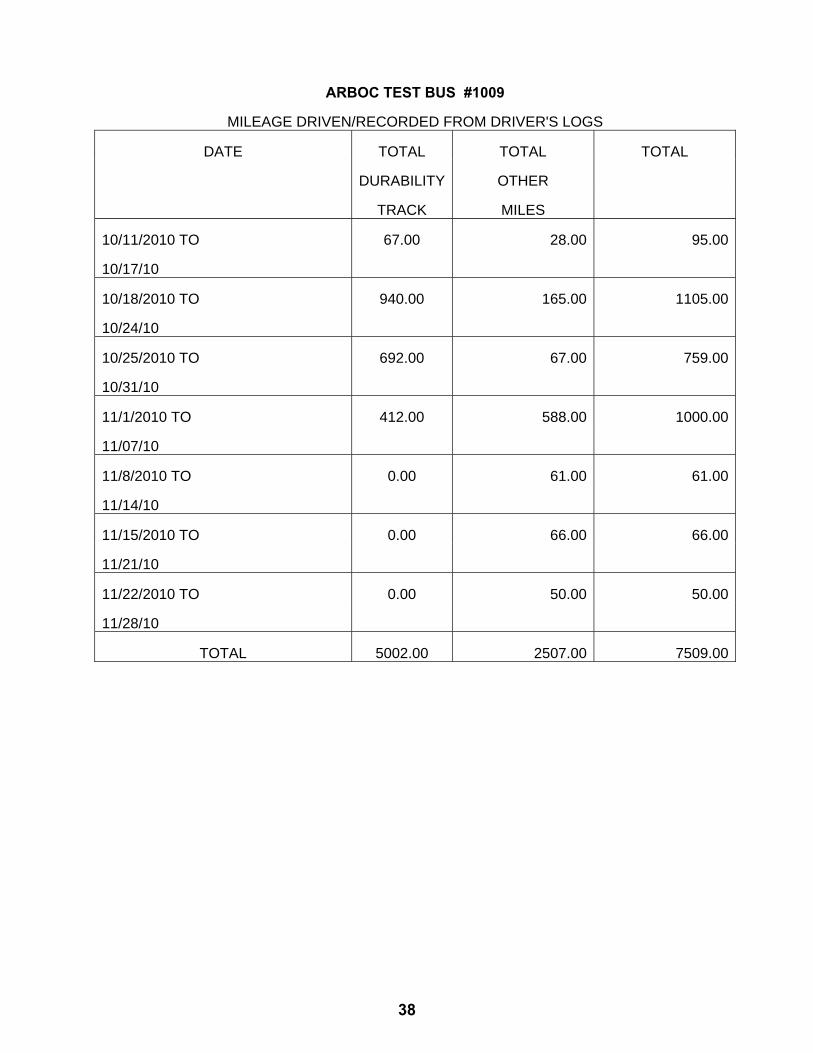
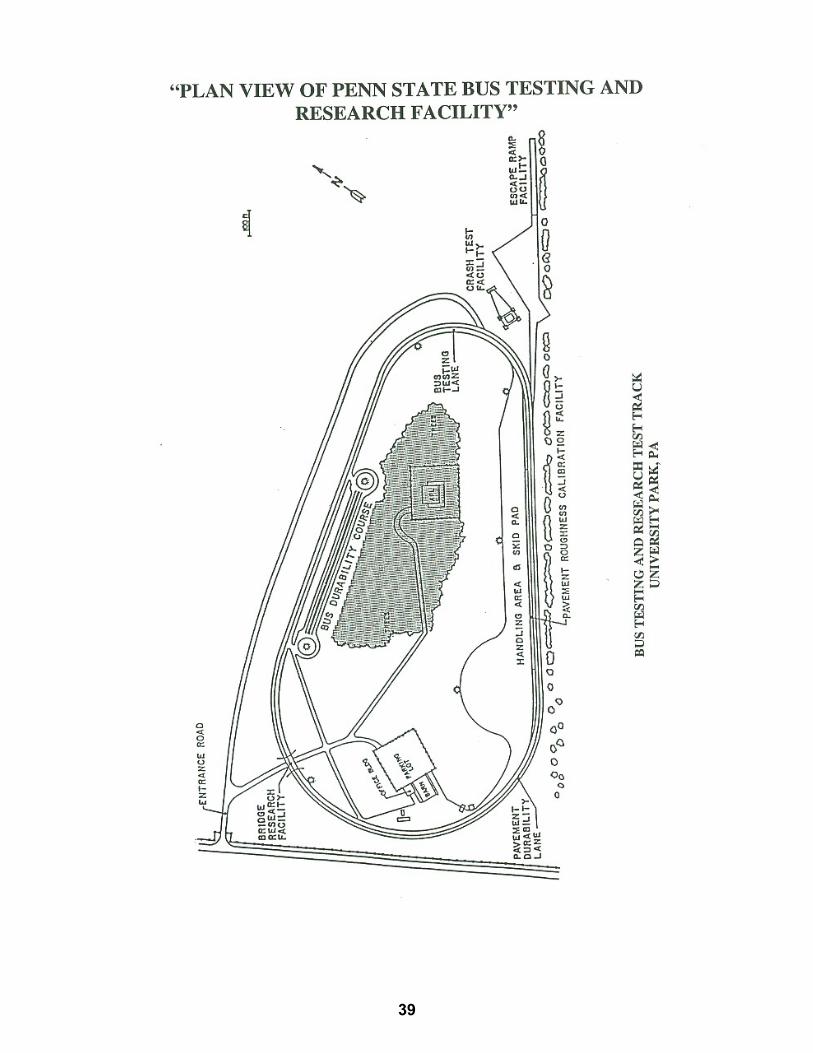
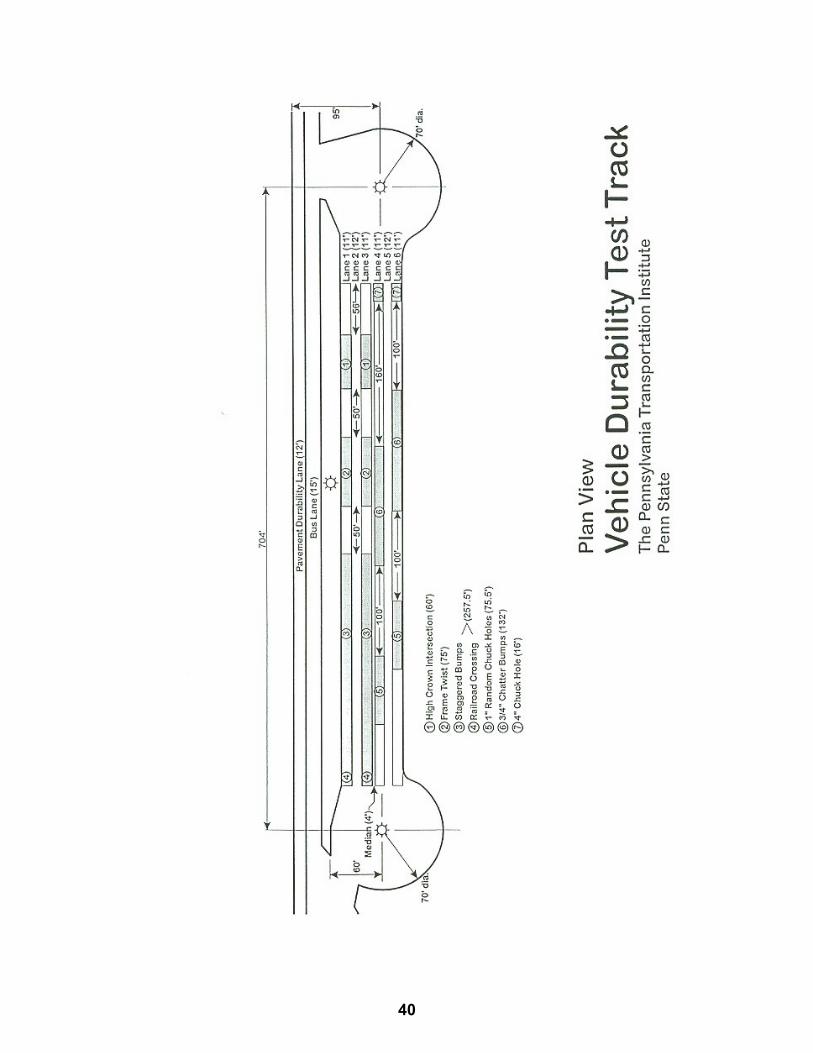
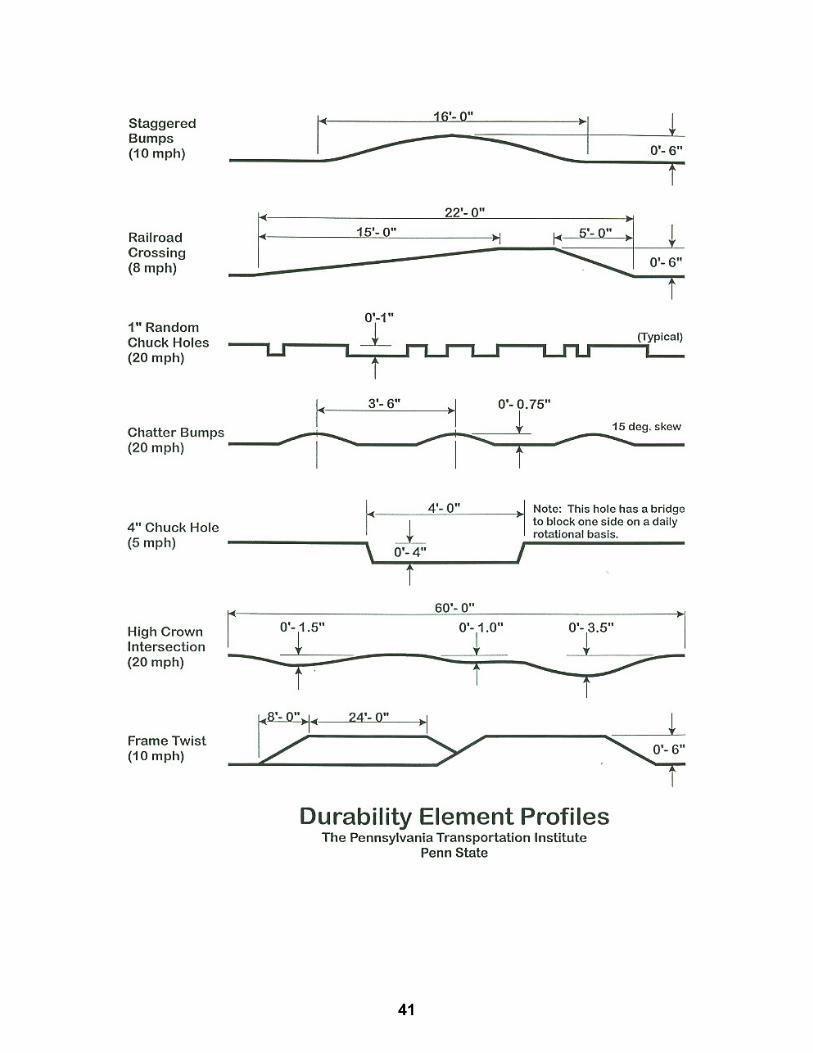
The following mileage summary presents the accumulation of miles during the
Structural Durability Test. The driving schedule is included, showing the operating duty cycle. A detailed plan view of the Test Track Facility and Durability Test Track are attached for reference. Also, a durability element profile detail shows all the measurements of the different conditions. Finally, photographs illustrating some of the failures that were encountered during the Structural Durability Test are included.
37
ARBOC TEST BUS #1009
MILEAGE DRIVEN/RECORDED FROM DRIVER'S LOGS
DATE TOTAL TOTAL TOTAL DURABILITY OTHER TRACK MILES
7/12/10 TO 331.00 186.00 517.00
07/18/10
7/19/10 TO 269.00 41.00 310.00
07/25/10
7/26/10 TO 115.00 576.00 691.00
08/01/10
8/2/2010 TO 366.00 46.00 412.00
08/08/10
8/9/2010 TO 851.00 92.00 943.00
08/15/10
8/16/2010 TO 292.00 39.00 331.00
08/22/10
8/23/2010 TO 7.00 50.00 57.00
08/29/10
8/30/2010 TO 0.00 0.00 0.00
09/05/10
9/6/2010 TO 0.00 0.00 0.00
09/12/10
9/13/2010 TO 193.00 41.00 234.00
09/19/10
9/20/2010 TO 245.00 31.00 276.00
09/26/10
9/27/2010 TO 222.00 127.00 349.00
10/03/10
10/4/2010 TO 0.00 253.00 253.00
10/10/10
38
ARBOC TEST BUS #1009
MILEAGE DRIVEN/RECORDED FROM DRIVER'S LOGS
DATE TOTAL TOTAL TOTAL
DURABILITY OTHER
TRACK MILES
10/11/2010 TO 67.00 28.00 95.00
10/17/10
10/18/2010 TO 940.00 165.00 1105.00
10/24/10
10/25/2010 TO 692.00 67.00 759.00
10/31/10
11/1/2010 TO 412.00 588.00 1000.00
11/07/10
11/8/2010 TO 0.00 61.00 61.00
11/14/10
11/15/2010 TO 0.00 66.00 66.00
11/21/10
11/22/2010 TO 0.00 50.00 50.00
11/28/10
TOTAL 5002.00 2507.00 7509.00
39
40
41
42
43
44
45
46
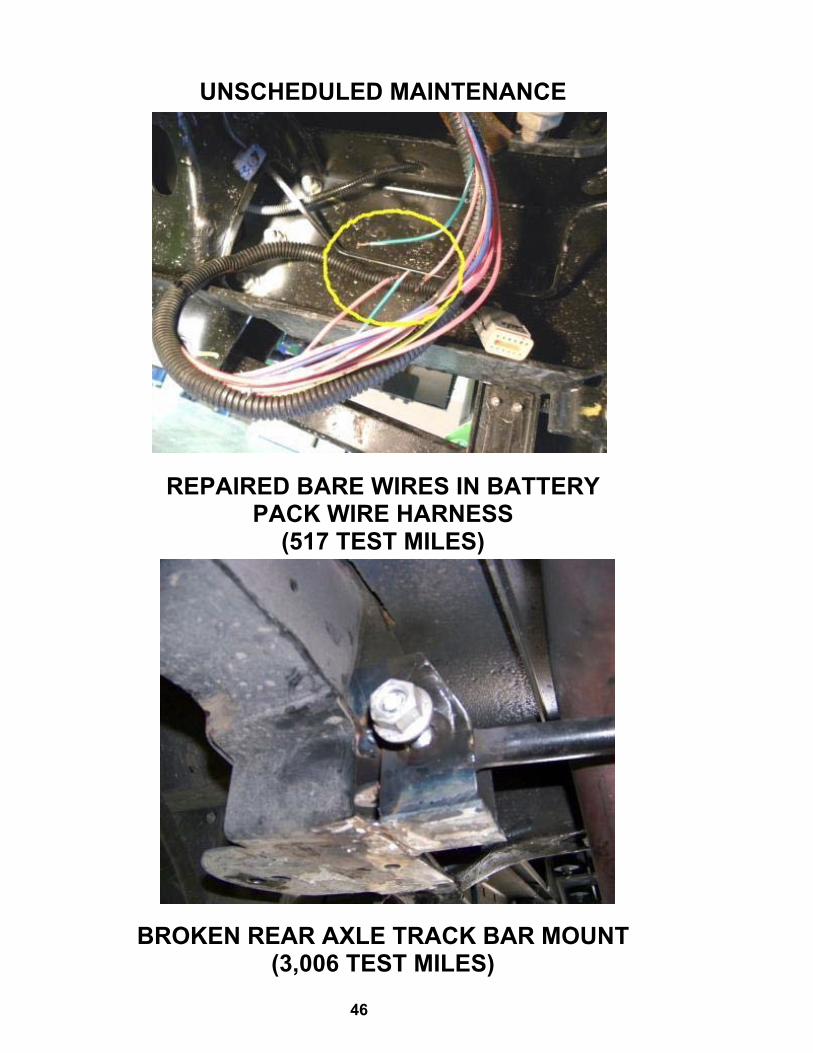
UNSCHEDULED MAINTENANCE
REPAIRED BARE WIRES IN BATTERY PACK WIRE HARNESS
(517 TEST MILES)
BROKEN REAR AXLE TRACK BAR MOUNT
(3,006 TEST MILES)
47
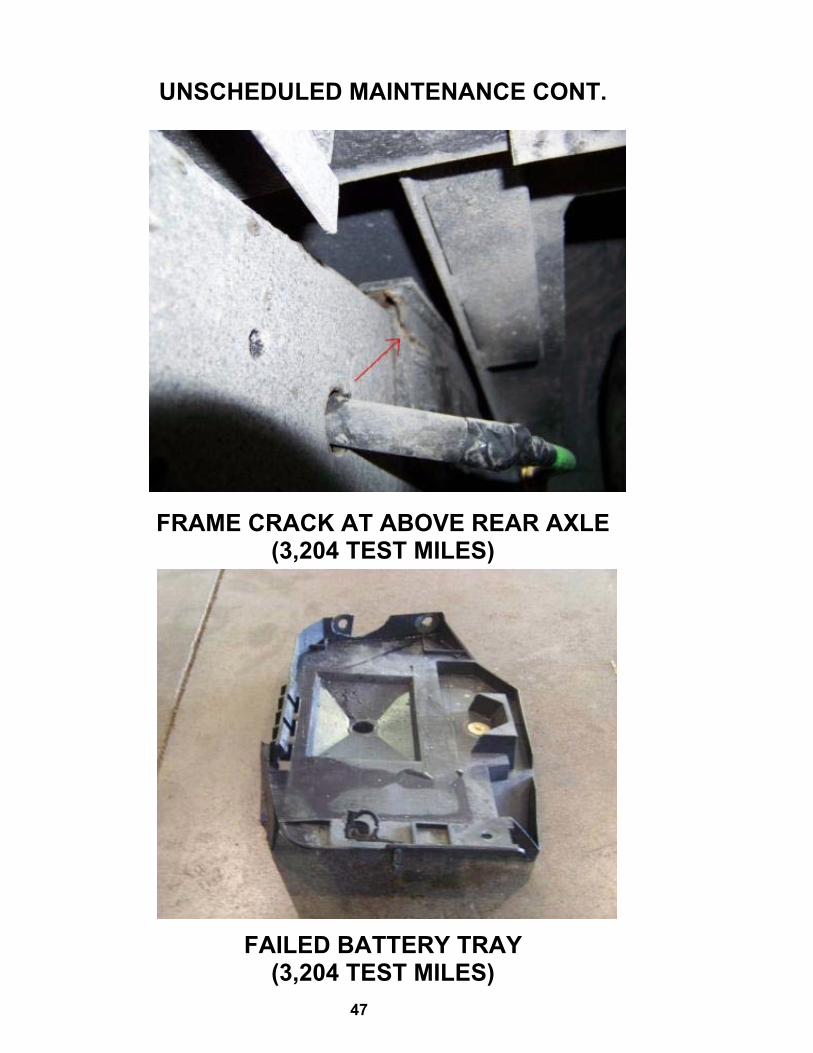
UNSCHEDULED MAINTENANCE CONT.
FRAME CRACK AT ABOVE REAR AXLE
(3,204 TEST MILES)
FAILED BATTERY TRAY (3,204 TEST MILES)
48
6. FUEL ECONOMY TEST - A FUEL CONSUMPTION TEST USING AN APPROPRIATE OPERATING CYCLE 6-I. TEST OBJECTIVE
The objective of this test is to provide accurate comparable fuel consumption data on transit buses produced by different manufacturers. This fuel economy test bears no relation to the calculations done by the Environmental Protection Agency (EPA) to determine levels for the Corporate Average Fuel Economy Program. EPA's calculations are based on tests conducted under laboratory conditions intended to simulate city and highway driving. This fuel economy test, as designated here, is a measurement of the fuel expended by a vehicle traveling a specified test loop under specified operating conditions. The results of this test will not represent actual mileage but will provide data that can be used by recipients to compare buses tested by this procedure. 6-II. TEST DESCRIPTION
This test requires operation of the bus over a course based on the Transit Coach Operating Duty Cycle (ADB Cycle) at seated load weight using a procedure based on the Fuel Economy Measurement Test (Engineering Type) For Trucks and Buses: SAE 1376 July 82. The procedure has been modified by elimination of the control vehicle and by modifications as described below. The inherent uncertainty and expense of utilizing a control vehicle over the operating life of the facility is impractical.
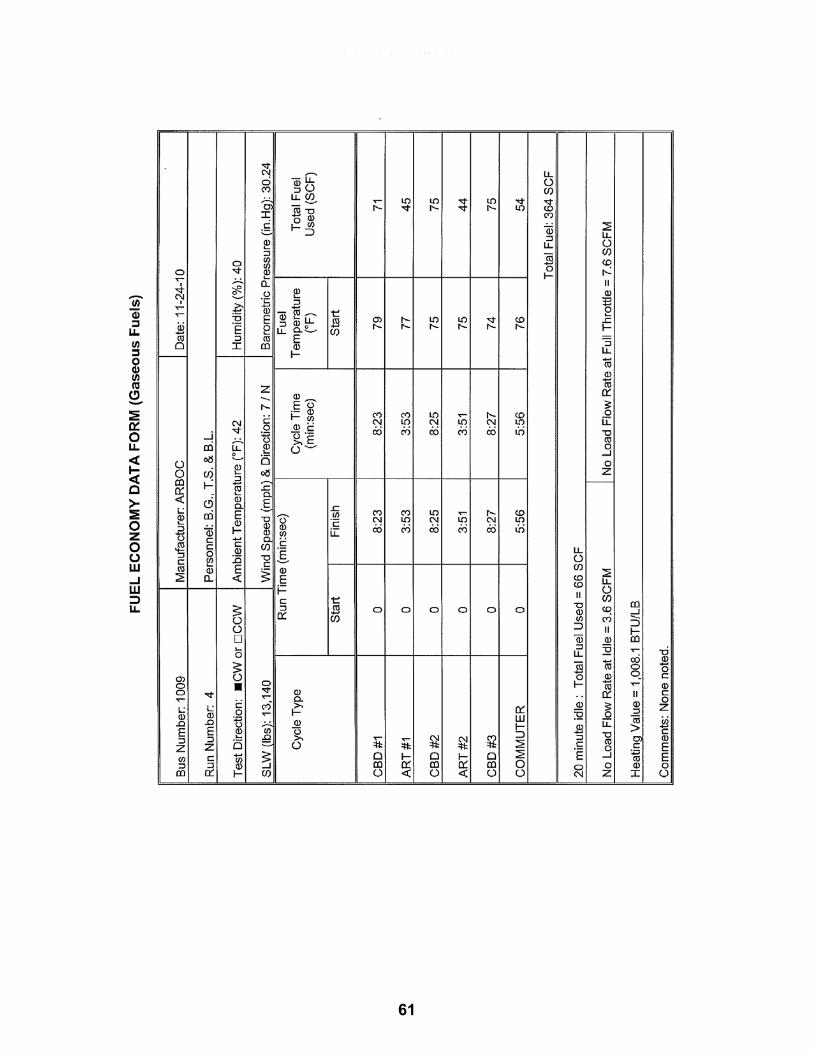
The fuel economy test will be performed as soon as possible (weather permitting) after the completion of the GVW portion of the structural durability test. It will be conducted on the bus test lane at the Penn State Test Facility. Signs are erected at carefully measured points which delineate the test course. A test run will comprise 3 CBD phases, 2 Arterial phases, and 1 Commuter phase. An electronic fuel measuring system will indicate the amount of fuel consumed during each phase of the test. The test runs will be repeated until there are at least two runs in both the clockwise and counterclockwise directions in which the fuel consumed for each run is within ± 4 percent of the average total fuel used over the 4 runs. A 20-minute idle consumption test is performed just prior to and immediately after the driven portion of the fuel economy test. The amount of fuel consumed while operating at normal/low idle is recorded on the Fuel Economy Data Form. This set of four valid runs along with idle consumption data comprise a valid test.
49
The test procedure is the ADB cycle with the following four modifications:
1. The ADB cycle is structured as a set number of miles in a fixed time in the following order: CBD, Arterial, CBD, Arterial, CBD, and Commuter. A separate idle fuel consumption measurement is performed at the beginning and end of the fuel economy test. This phase sequence permits the reporting of fuel consumption for each of these phases separately, making the data more useful to bus manufacturers and transit properties.
2. The operating profile for testing purposes shall consist of simulated transit
type service at seated load weight. The three test phases (figure 6-1) are: a central business district (CBD) phase of 2 miles with 7 stops per mile and a top speed of 20 mph; an arterial phase of 2 miles with 2 stops per mile and a top speed of 40 mph; and a commuter phase of 4 miles with 1 stop and a maximum speed of 40 mph. At each designated stop the bus will remain stationary for seven seconds. During this time, the passenger doors shall be opened and closed.
3. The individual ADB phases remain unaltered with the exception that 1 mile
has been changed to 1 lap on the Penn State Test Track. One lap is equal to 5,042 feet. This change is accommodated by adjusting the cruise distance and time.
4. The acceleration profile, for practical purposes and to achieve better
repeatability, has been changed to "full throttle acceleration to cruise speed".
Several changes were made to the Fuel Economy Measurement Test (Engineering Type) For Trucks and Buses: SAE 1376 July 82:
1. Sections 1.1, and 1.2 only apply to diesel, gasoline, methanol, and any other fuel in the liquid state (excluding cryogenic fuels).
1.1 SAE 1376 July 82 requires the use of at least a 16-gal fuel tank. Such a fuel tank when full would weigh approximately 160 lb. It is judged that a 12-gal tank weighing approximately 120 lb will be sufficient for this test and much easier for the technician and test personnel to handle.
50
1.2 SAE 1376 July 82 mentions the use of a mechanical scale or a flow meter system. This test procedure uses a load cell readout combination that provides an accuracy of 0.5 percent in weight and permits on-board weighing of the gravimetric tanks at the end of each phase. This modification permits the determination of a fuel economy value for each phase as well as the overall cycle.
2. Section 2.1 applies to compressed natural gas (CNG), liquefied natural gas (LNG), cryogenic fuels, and other fuels in the vapor state.
2.1 A laminar type flow meter will be used to determine the fuel consumption. The pressure and temperature across the flow element will be monitored by the flow computer. The flow computer will use this data to calculate the gas flow rate. The flow computer will also display the flow rate (scfm) as well as the total fuel used (scf). The total fuel used (scf) for each phase will be recorded on the Fuel Economy Data Form.
3. Use both Sections 1 and 2 for dual fuel systems. FUEL ECONOMY CALCULATION PROCEDURE A. For diesel, gasoline, methanol and fuels in the liquid state.
The reported fuel economy is based on the following: measured test quantities--distance traveled (miles) and fuel consumed (pounds); standard reference values--density of water at 60°F (8.3373 lbs/gal) and volumetric heating value of standard fuel; and test fuel specific gravity (unitless) and volumetric heating value (BTU/gal). These combine to give a fuel economy in miles per gallon (mpg) which is corrected to a standard gallon of fuel referenced to water at 60°F. This eliminates fluctuations in fuel economy due to fluctuations in fuel quality. This calculation has been programmed into a computer and the data processing is performed automatically.
The fuel economy correction consists of three steps:
1.) Divide the number of miles of the phase by the number of pounds of fuel consumed
total miles phase miles per phase per run CBD 1.9097 5.7291 ART 1.9097 3.8193 COM 3.8193 3.8193
FEomi/lb = Observed fuel economy = miles
lb of fuel
51
2.) Convert the observed fuel economy to miles per gallon [mpg] by multiplying
by the specific gravity of the test fuel Gs (referred to water) at 60°F and multiply by the density of water at 60°F
FEompg = FEcmi/lb x Gs x Gw
where Gs = Specific gravity of test fuel at 60°F (referred to water)
Gw = 8.3373 lb/gal
3.) Correct to a standard gallon of fuel by dividing by the volumetric heating value of the test fuel (H) and multiplying by the volumetric heating value of standard reference fuel (Q). Both heating values must have the same units.
FEc = FEompg x Q H where
H = Volumetric heating value of test fuel [BTU/gal] Q = Volumetric heating value of standard reference fuel
Combining steps 1-3 yields
==> FEc = miles x (Gs x Gw) x Q lbs H
4.) Covert the fuel economy from mpg to an energy equivalent of miles per
BTU. Since the number would be extremely small in magnitude, the energy equivalent will be represented as miles/BTUx106.
Eq = Energy equivalent of converting mpg to mile/BTUx106.
Eq = ((mpg)/(H))x106
B. CNG, LNG, cryogenic and other fuels in the vapor state.
The reported fuel economy is based on the following: measured test quantities--
distance traveled (miles) and fuel consumed (scf); density of test fuel, and volumetric heating value (BTU/lb) of test fuel at standard conditions (P=14.73 psia and T=60 ΕF).
52
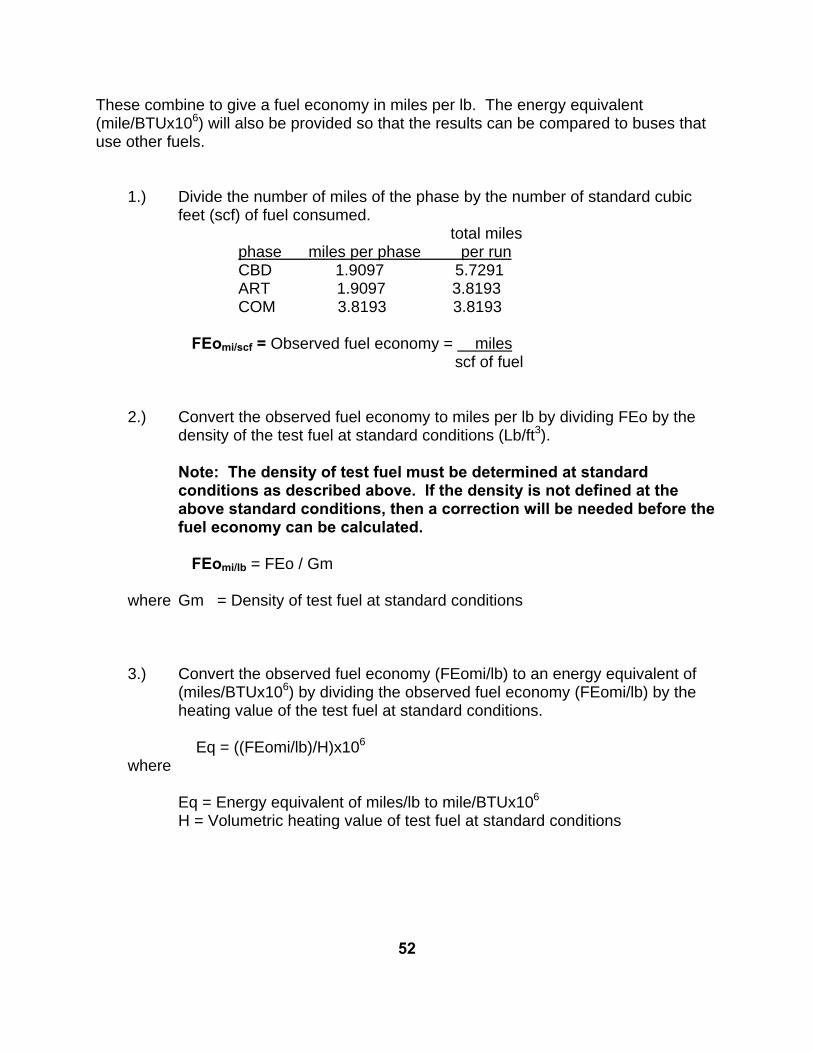
These combine to give a fuel economy in miles per lb. The energy equivalent (mile/BTUx106) will also be provided so that the results can be compared to buses that use other fuels.
1.) Divide the number of miles of the phase by the number of standard cubic feet (scf) of fuel consumed.
total miles phase miles per phase per run CBD 1.9097 5.7291 ART 1.9097 3.8193 COM 3.8193 3.8193
FEomi/scf = Observed fuel economy = miles
scf of fuel
2.) Convert the observed fuel economy to miles per lb by dividing FEo by the density of the test fuel at standard conditions (Lb/ft3).
Note: The density of test fuel must be determined at standard conditions as described above. If the density is not defined at the above standard conditions, then a correction will be needed before the fuel economy can be calculated.
FEomi/lb = FEo / Gm
where Gm = Density of test fuel at standard conditions
3.) Convert the observed fuel economy (FEomi/lb) to an energy equivalent of (miles/BTUx106) by dividing the observed fuel economy (FEomi/lb) by the heating value of the test fuel at standard conditions.
Eq = ((FEomi/lb)/H)x106
where
Eq = Energy equivalent of miles/lb to mile/BTUx106 H = Volumetric heating value of test fuel at standard conditions
53
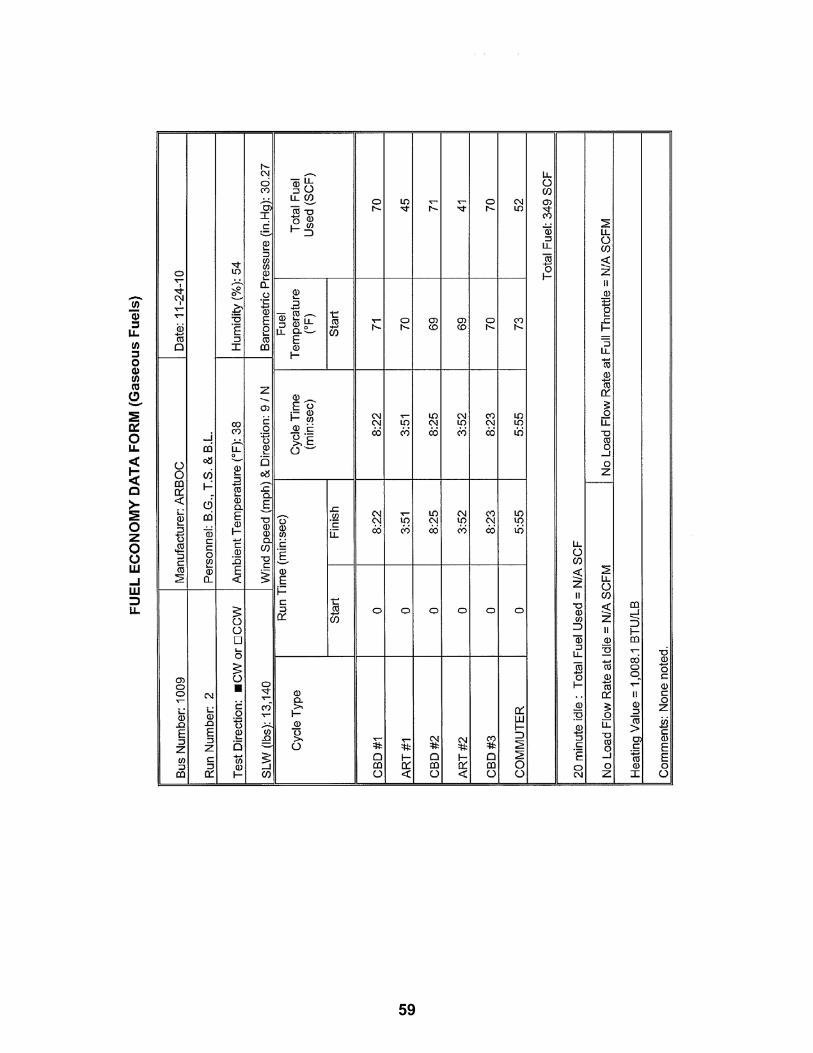
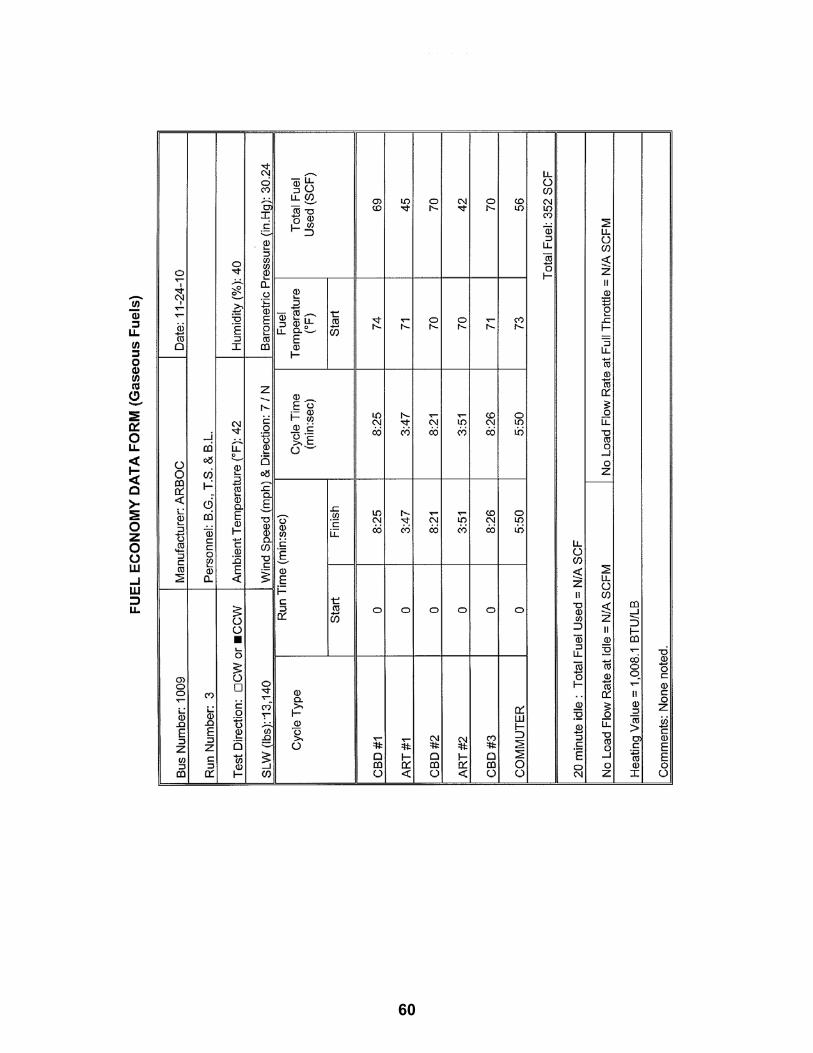
6-III. DISCUSSION
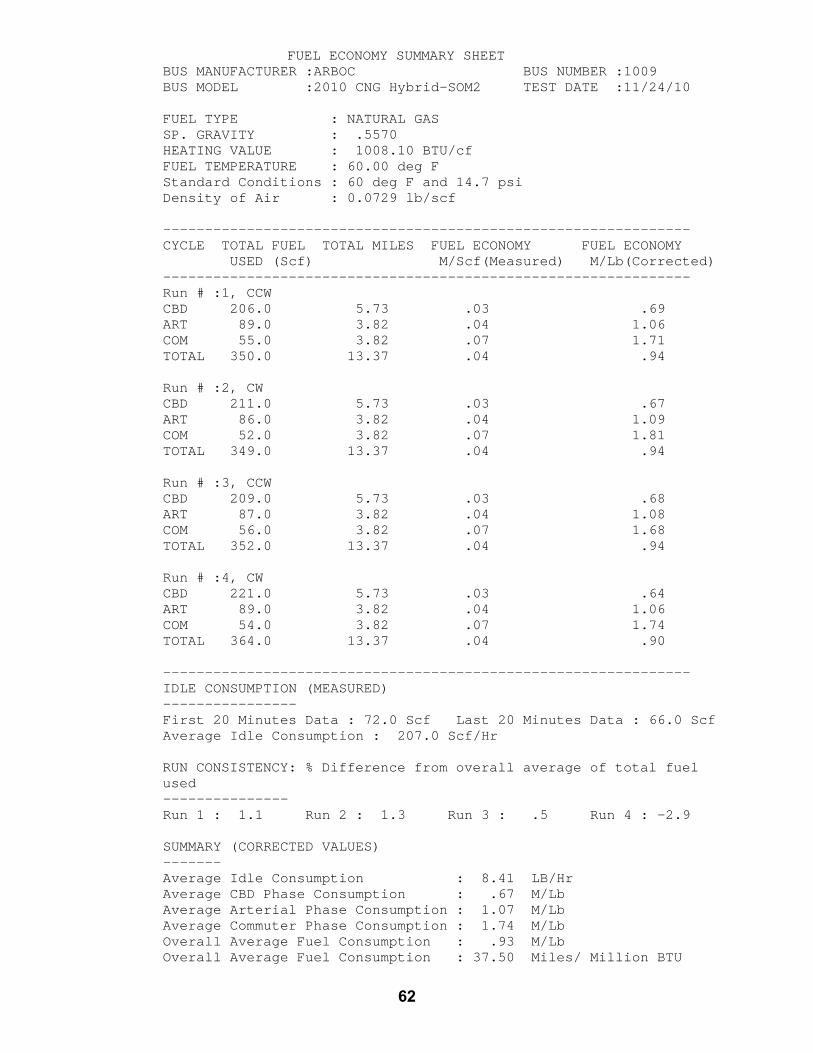
This is a comparative test of fuel economy using CNG fuel with a heating value of 1,008.1 btu/lb. The driving cycle consists of Central Business District (CBD), Arterial (ART), and Commuter (COM) phases as described in 6-II. The fuel consumption for each driving cycle and for idle is measured separately. The results are corrected to a reference fuel with a volumetric heating value of 127,700.0 btu/gal. An extensive pretest maintenance check is made including the replacement of all lubrication fluids. The details of the pretest maintenance are given in the first three Pretest Maintenance Forms. The fourth sheet shows the Pretest Inspection. The next sheet shows the correction calculation for the test fuel. The next four Fuel Economy Forms provide the data from the four test runs. Finally, the summary sheet provides the average fuel consumption. The overall average is based on total fuel and total mileage for each phase. The overall average fuel consumption values were; CBD – 0.67 M/lb, ART – 1.07 M/lb, and COM – 1.74 M/lb. Average fuel consumption at idle was 207.0 scf/hr.
54
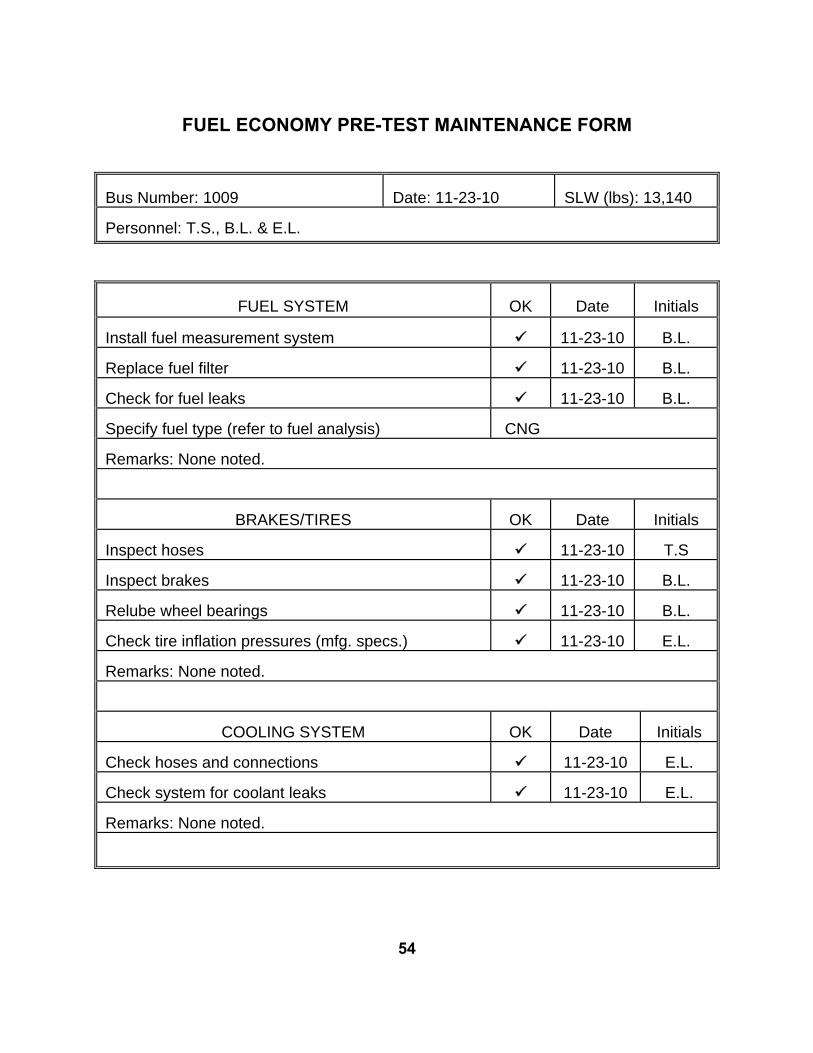
FUEL ECONOMY PRE-TEST MAINTENANCE FORM
Bus Number: 1009 Date: 11-23-10 SLW (lbs): 13,140 Personnel: T.S., B.L. & E.L.
FUEL SYSTEM OK Date
Initials
Install fuel measurement system
11-23-10 B.L.
Replace fuel filter
11-23-10 B.L.
Check for fuel leaks
11-23-10 B.L.
Specify fuel type (refer to fuel analysis) CNG Remarks: None noted.
BRAKES/TIRES OK Date
Initials Inspect hoses
11-23-10 T.S
Inspect brakes
11-23-10 B.L.
Relube wheel bearings
11-23-10 B.L.
Check tire inflation pressures (mfg. specs.)
11-23-10 E.L.
Remarks: None noted.
COOLING SYSTEM OK Date Initials
Check hoses and connections
11-23-10 E.L.
Check system for coolant leaks
11-23-10 E.L.
Remarks: None noted.
55
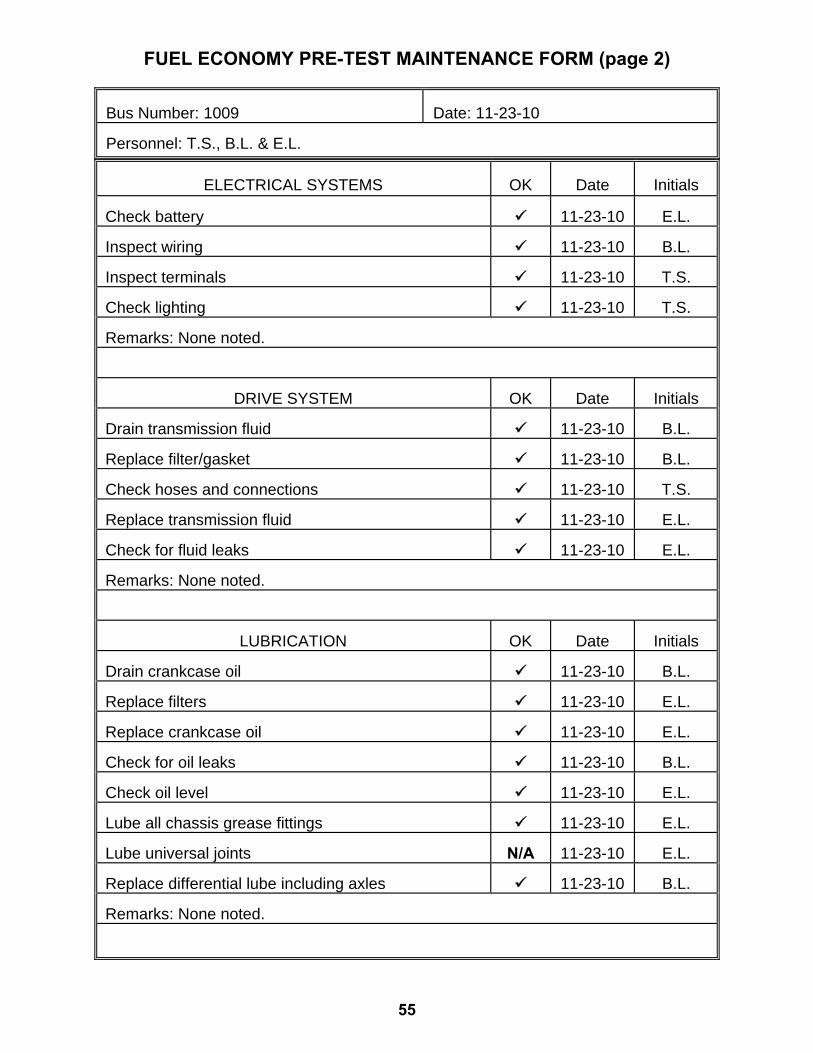
FUEL ECONOMY PRE-TEST MAINTENANCE FORM (page 2)
Bus Number: 1009 Date: 11-23-10 Personnel: T.S., B.L. & E.L.
ELECTRICAL SYSTEMS OK Date
Initials Check battery
11-23-10 E.L.
Inspect wiring
11-23-10 B.L.
Inspect terminals
11-23-10 T.S.
Check lighting
11-23-10 T.S.
Remarks: None noted.
DRIVE SYSTEM OK Date
Initials Drain transmission fluid
11-23-10 B.L.
Replace filter/gasket
11-23-10 B.L.
Check hoses and connections
11-23-10 T.S.
Replace transmission fluid
11-23-10 E.L.
Check for fluid leaks
11-23-10 E.L.
Remarks: None noted.
LUBRICATION OK Date
Initials Drain crankcase oil
11-23-10 B.L.
Replace filters
11-23-10 E.L.
Replace crankcase oil
11-23-10 E.L.
Check for oil leaks
11-23-10 B.L.
Check oil level
11-23-10 E.L.
Lube all chassis grease fittings
11-23-10 E.L.
Lube universal joints N/A
11-23-10 E.L.
Replace differential lube including axles
11-23-10 B.L.
Remarks: None noted.
56
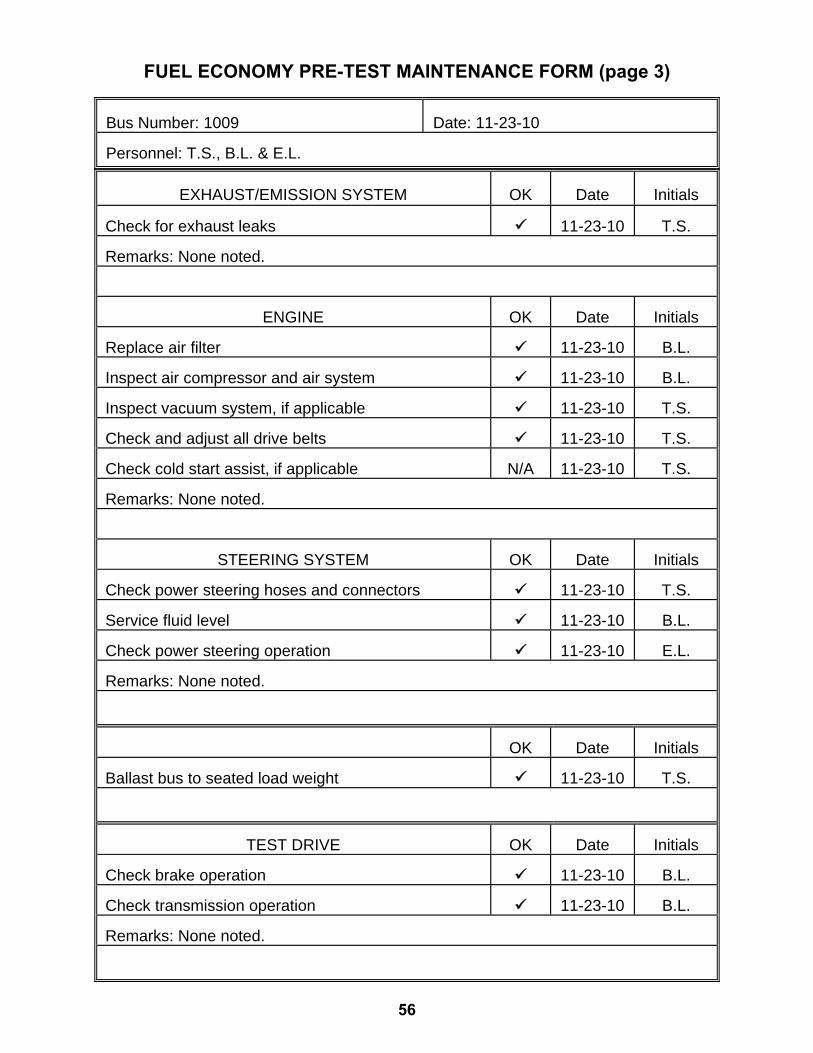
FUEL ECONOMY PRE-TEST MAINTENANCE FORM (page 3)
Bus Number: 1009 Date: 11-23-10 Personnel: T.S., B.L. & E.L.
EXHAUST/EMISSION SYSTEM OK Date
Initials Check for exhaust leaks
11-23-10 T.S.
Remarks: None noted.
ENGINE OK Date
Initials Replace air filter
11-23-10 B.L.
Inspect air compressor and air system
11-23-10 B.L.
Inspect vacuum system, if applicable
11-23-10 T.S.
Check and adjust all drive belts
11-23-10 T.S.
Check cold start assist, if applicable N/A
11-23-10 T.S.
Remarks: None noted.
STEERING SYSTEM OK Date
Initials Check power steering hoses and connectors
11-23-10 T.S.
Service fluid level
11-23-10 B.L.
Check power steering operation
11-23-10 E.L.
Remarks: None noted.
OK Date
Initials Ballast bus to seated load weight
11-23-10 T.S.
TEST DRIVE OK Date
Initials Check brake operation
11-23-10 B.L.
Check transmission operation
11-23-10 B.L.
Remarks: None noted.
57
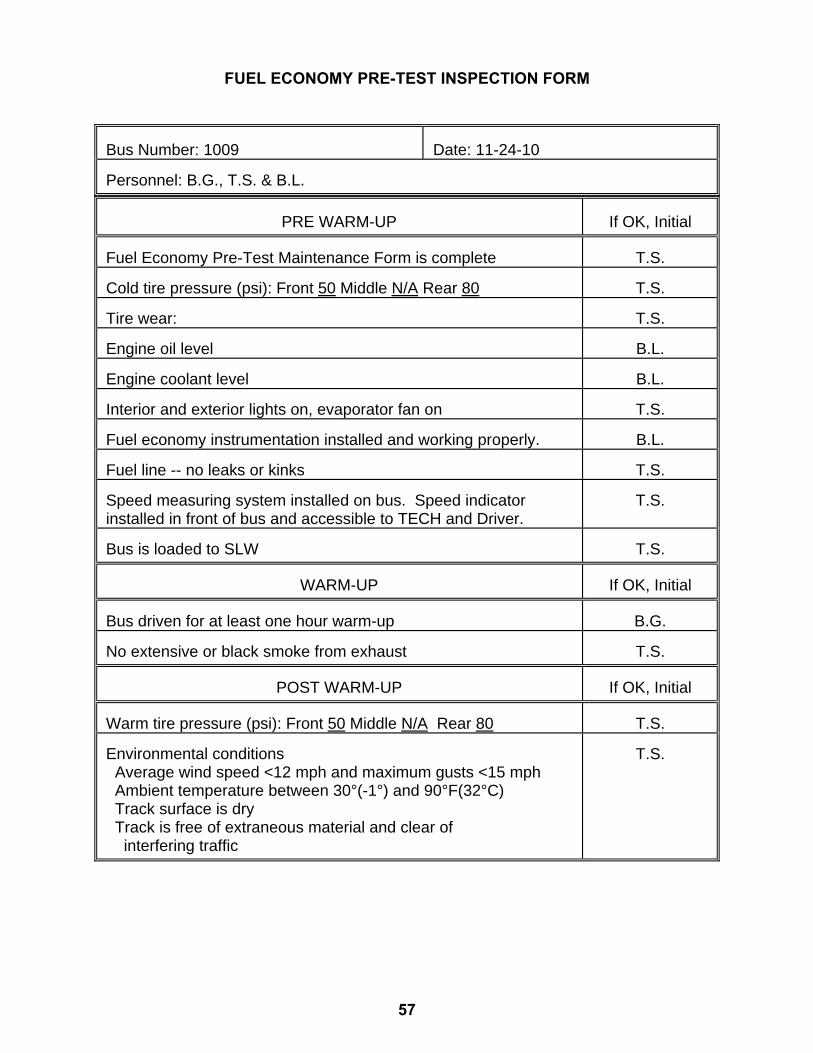
FUEL ECONOMY PRE-TEST INSPECTION FORM
Bus Number: 1009 Date: 11-24-10 Personnel: B.G., T.S. & B.L.
PRE WARM-UP
If OK, Initial Fuel Economy Pre-Test Maintenance Form is complete
T.S.
Cold tire pressure (psi): Front 50 Middle N/A Rear 80
T.S.
Tire wear:
T.S.
Engine oil level
B.L.
Engine coolant level
B.L.
Interior and exterior lights on, evaporator fan on
T.S.
Fuel economy instrumentation installed and working properly.
B.L.
Fuel line -- no leaks or kinks
T.S.
Speed measuring system installed on bus. Speed indicator installed in front of bus and accessible to TECH and Driver.
T.S.
Bus is loaded to SLW
T.S.
WARM-UP
If OK, Initial
Bus driven for at least one hour warm-up
B.G.
No extensive or black smoke from exhaust
T.S.
POST WARM-UP
If OK, Initial
Warm tire pressure (psi): Front 50 Middle N/A Rear 80
T.S.
Environmental conditions Average wind speed <12 mph and maximum gusts <15 mph Ambient temperature between 30°(-1°) and 90°F(32°C) Track surface is dry Track is free of extraneous material and clear of interfering traffic
T.S.

58
59
60
61
62
FUEL ECONOMY SUMMARY SHEET BUS MANUFACTURER :ARBOC BUS NUMBER :1009 BUS MODEL :2010 CNG Hybrid-SOM2 TEST DATE :11/24/10 FUEL TYPE : NATURAL GAS SP. GRAVITY : .5570 HEATING VALUE : 1008.10 BTU/cf FUEL TEMPERATURE : 60.00 deg F Standard Conditions : 60 deg F and 14.7 psi Density of Air : 0.0729 lb/scf --------------------------------------------------------------- CYCLE TOTAL FUEL TOTAL MILES FUEL ECONOMY FUEL ECONOMY USED (Scf) M/Scf(Measured) M/Lb(Corrected) --------------------------------------------------------------- Run # :1, CCW CBD 206.0 5.73 .03 .69 ART 89.0 3.82 .04 1.06 COM 55.0 3.82 .07 1.71 TOTAL 350.0 13.37 .04 .94 Run # :2, CW CBD 211.0 5.73 .03 .67 ART 86.0 3.82 .04 1.09 COM 52.0 3.82 .07 1.81 TOTAL 349.0 13.37 .04 .94 Run # :3, CCW CBD 209.0 5.73 .03 .68 ART 87.0 3.82 .04 1.08 COM 56.0 3.82 .07 1.68 TOTAL 352.0 13.37 .04 .94 Run # :4, CW CBD 221.0 5.73 .03 .64 ART 89.0 3.82 .04 1.06 COM 54.0 3.82 .07 1.74 TOTAL 364.0 13.37 .04 .90 --------------------------------------------------------------- IDLE CONSUMPTION (MEASURED) ---------------- First 20 Minutes Data : 72.0 Scf Last 20 Minutes Data : 66.0 Scf Average Idle Consumption : 207.0 Scf/Hr
RUN CONSISTENCY: % Difference from overall average of total fuel used
--------------- Run 1 : 1.1 Run 2 : 1.3 Run 3 : .5 Run 4 : -2.9 SUMMARY (CORRECTED VALUES) ------- Average Idle Consumption : 8.41 LB/Hr Average CBD Phase Consumption : .67 M/Lb Average Arterial Phase Consumption : 1.07 M/Lb Average Commuter Phase Consumption : 1.74 M/Lb Overall Average Fuel Consumption : .93 M/Lb Overall Average Fuel Consumption : 37.50 Miles/ Million BTU
63
7. NOISE 7.1 INTERIOR NOISE AND VIBRATION TESTS 7.1-I. TEST OBJECTIVE
The objective of these tests is to measure and record interior noise levels and check for audible vibration under various operating conditions. 7.1-II. TEST DESCRIPTION
During this series of tests, the interior noise level will be measured at several locations with the bus operating under the following three conditions: 1. With the bus stationary, a white noise generating system shall provide a uniform sound pressure level equal to 80 dB(A) on the left, exterior side of the bus. The engine and all accessories will be switched off and all openings including doors and windows will be closed. This test will be performed at the ABTC. 2. The bus accelerating at full throttle from a standing start to 35 mph on a level pavement. All openings will be closed and all accessories will be operating during the test. This test will be performed on the track at the Test Track Facility. 3. The bus will be operated at various speeds from 0 to 55 mph with and without the air conditioning and accessories on. Any audible vibration or rattles will be noted. This test will be performed on the test segment between the Test Track and the Bus Testing Center.
All tests will be performed in an area free from extraneous sound-making sources or reflecting surfaces. The ambient sound level as well as the surrounding weather conditions will be recorded in the test data. 7.1-III. DISCUSSION
This test is performed in three parts. The first part exposes the exterior of the vehicle to 80.0 dB(A) on the left side of the bus and the noise transmitted to the interior is measured. The Federal Transit Administration determined this Condition of the Interior Noise Test need not be performed.
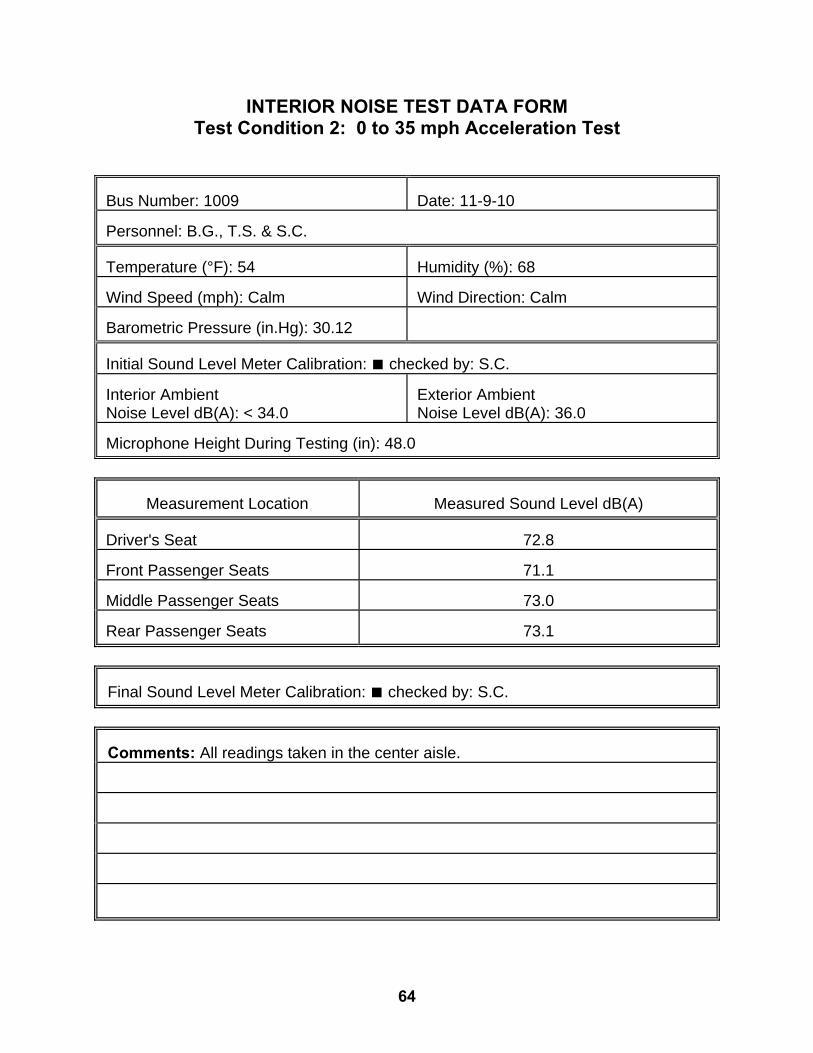
The second test measures interior noise during acceleration from 0 to 35 mph. This noise level ranged from 71.1 dB(A) at the front passenger seats to 73.1 dB(A) at the rear passenger seats. The overall average was 72.5 dB(A). The interior ambient noise level for this test was < 34.0 dB(A).
The third part of the test is to listen for resonant vibrations, rattles, and other noise
sources while operating over the road. No vibrations or rattles were noted.
64
INTERIOR NOISE TEST DATA FORM Test Condition 2: 0 to 35 mph Acceleration Test
Bus Number: 1009 Date: 11-9-10 Personnel: B.G., T.S. & S.C. Temperature (°F): 54 Humidity (%): 68 Wind Speed (mph): Calm Wind Direction: Calm Barometric Pressure (in.Hg): 30.12 Initial Sound Level Meter Calibration: ■ checked by: S.C. Interior Ambient Noise Level dB(A): < 34.0
Exterior Ambient Noise Level dB(A): 36.0
Microphone Height During Testing (in): 48.0
Measurement Location Measured Sound Level dB(A) Driver's Seat 72.8 Front Passenger Seats 71.1 Middle Passenger Seats 73.0 Rear Passenger Seats 73.1
Final Sound Level Meter Calibration: ■ checked by: S.C.
Comments: All readings taken in the center aisle.
65
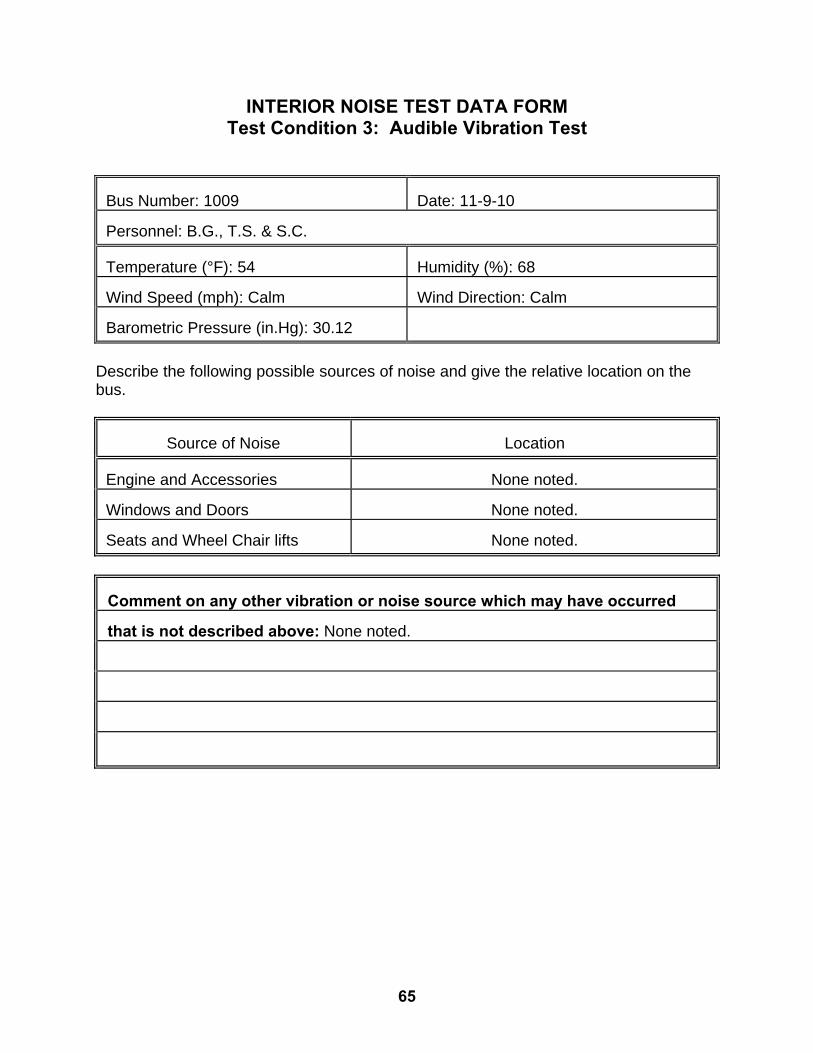
INTERIOR NOISE TEST DATA FORM Test Condition 3: Audible Vibration Test
Bus Number: 1009 Date: 11-9-10 Personnel: B.G., T.S. & S.C. Temperature (°F): 54 Humidity (%): 68 Wind Speed (mph): Calm Wind Direction: Calm Barometric Pressure (in.Hg): 30.12
Describe the following possible sources of noise and give the relative location on the bus.
Source of Noise Location
Engine and Accessories None noted. Windows and Doors None noted. Seats and Wheel Chair lifts None noted.
Comment on any other vibration or noise source which may have occurred that is not described above: None noted.

66
7.2 EXTERIOR NOISE TESTS 7.2-I. TEST OBJECTIVE
The objective of this test is to record exterior noise levels when a bus is operated under various conditions. 7.2-II. TEST DESCRIPTION
In the exterior noise tests, the bus will be operated at a SLW in three different conditions using a smooth, straight and level roadway:
1. Accelerating at full throttle from a constant speed at or below 35 mph and just prior to transmission upshift.
2. Accelerating at full throttle from standstill. 3. Stationary, with the engine at low idle, high idle, and wide open throttle.
In addition, the buses will be tested with and without the air conditioning and all
accessories operating. The exterior noise levels will be recorded.
The test site is at the PSBRTF and the test procedures will be in accordance with SAE Standards SAE J366b, Exterior Sound Level for Heavy Trucks and Buses. The test site is an open space free of large reflecting surfaces. A noise meter placed at a specified location outside the bus will measure the noise level.
During the test, special attention should be paid to:
1. The test site characteristics regarding parked vehicles, signboards, buildings, or other sound-reflecting surfaces
2. Proper usage of all test equipment including set-up and calibration 3. The ambient sound level
7.2-III. DISCUSSION
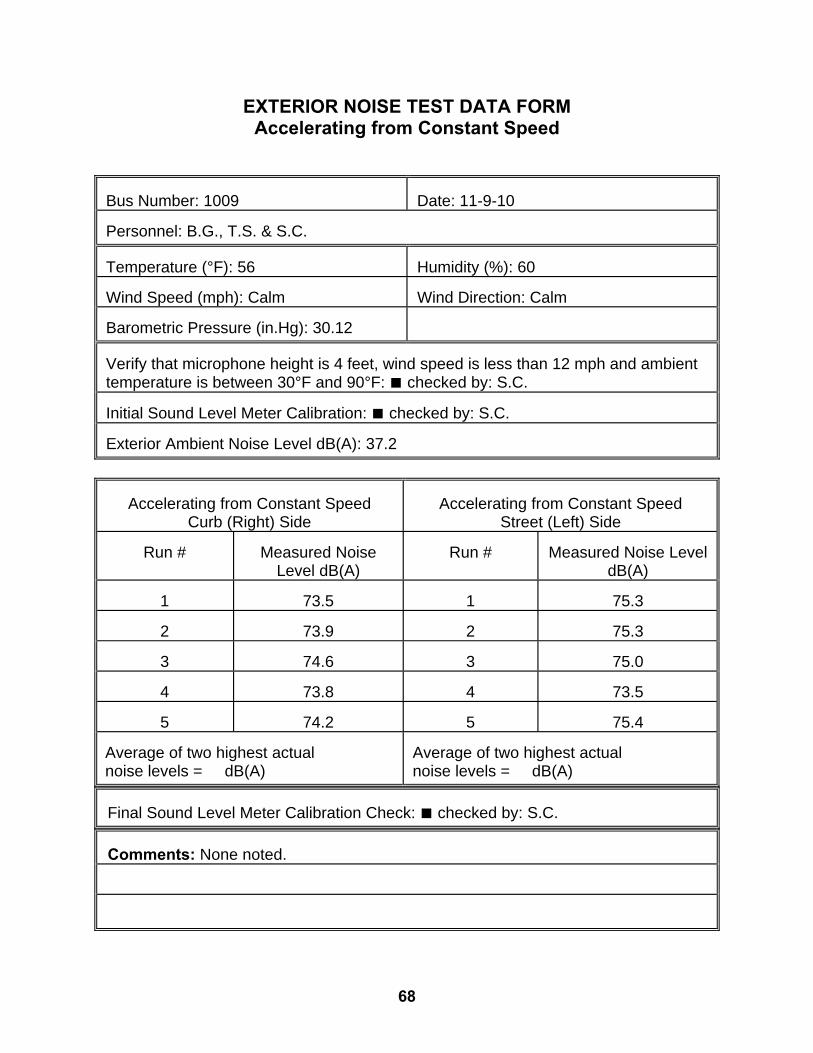
The Exterior Noise Test determines the noise level generated by the vehicle under different driving conditions and at stationary low and high idle, with and without air conditioning and accessories operating. The test site is a large, level, bituminous paved area with no reflecting surfaces nearby. With an exterior ambient noise level of 37.2 dB(A), the average test result obtained while accelerating from a constant speed was 74.4 dB(A) on the right side and 75.4 dB(A) on the left side.
67
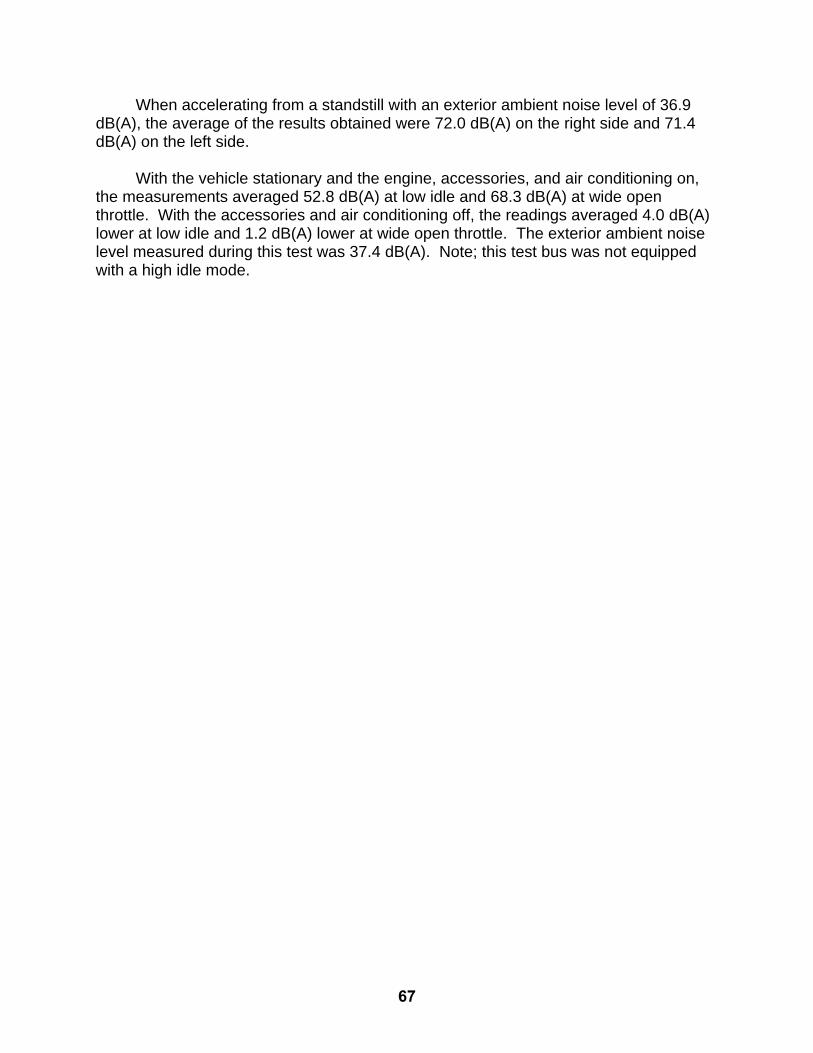
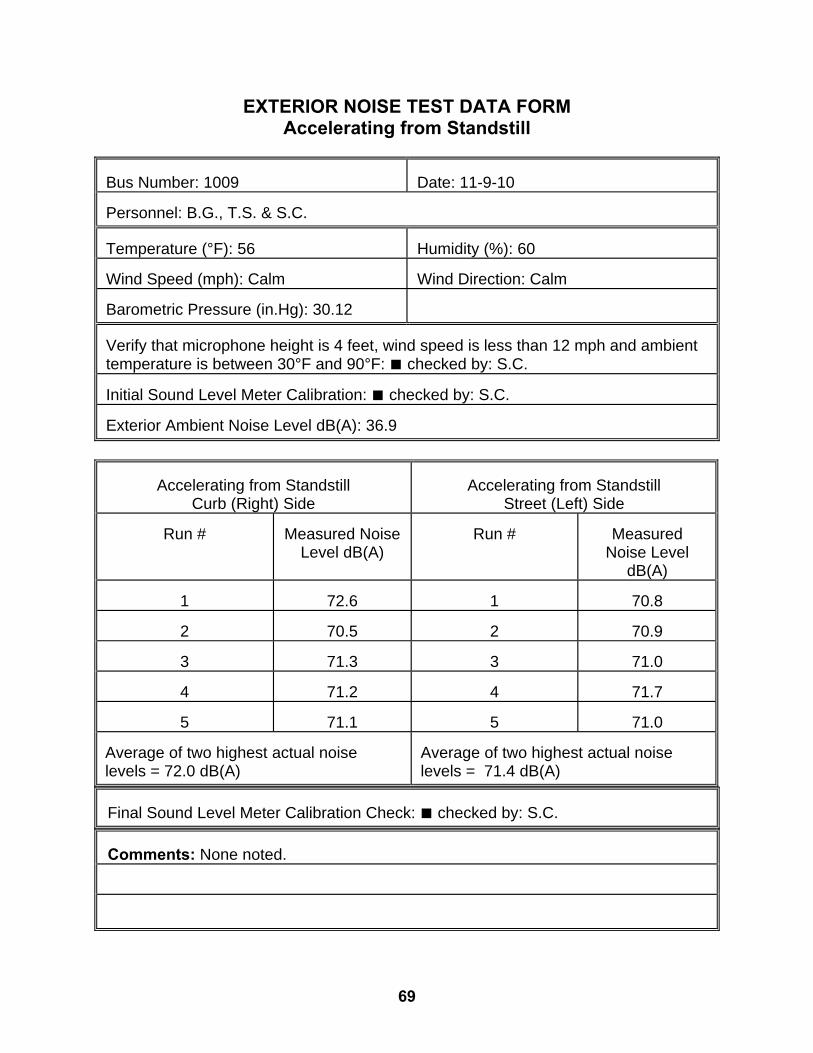
When accelerating from a standstill with an exterior ambient noise level of 36.9 dB(A), the average of the results obtained were 72.0 dB(A) on the right side and 71.4 dB(A) on the left side.
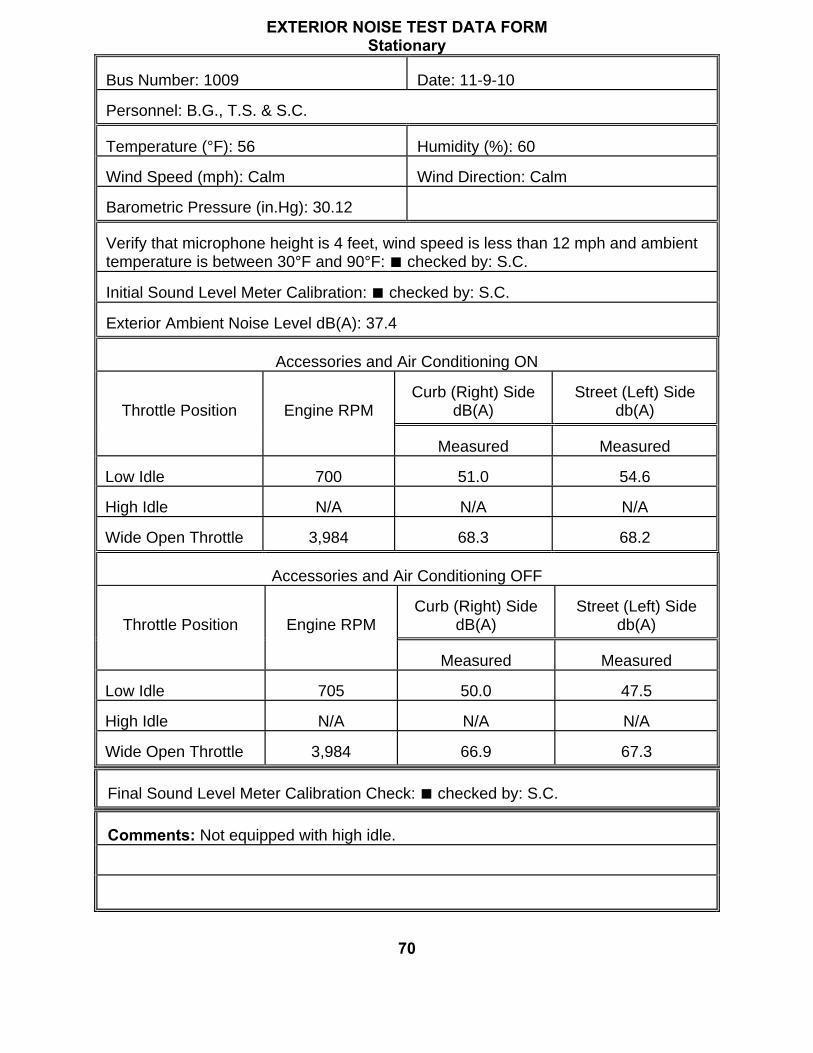
With the vehicle stationary and the engine, accessories, and air conditioning on, the measurements averaged 52.8 dB(A) at low idle and 68.3 dB(A) at wide open throttle. With the accessories and air conditioning off, the readings averaged 4.0 dB(A) lower at low idle and 1.2 dB(A) lower at wide open throttle. The exterior ambient noise level measured during this test was 37.4 dB(A). Note; this test bus was not equipped with a high idle mode.
68
EXTERIOR NOISE TEST DATA FORM Accelerating from Constant Speed
Bus Number: 1009 Date: 11-9-10 Personnel: B.G., T.S. & S.C. Temperature (°F): 56 Humidity (%): 60 Wind Speed (mph): Calm Wind Direction: Calm Barometric Pressure (in.Hg): 30.12 Verify that microphone height is 4 feet, wind speed is less than 12 mph and ambient temperature is between 30°F and 90°F: ■ checked by: S.C. Initial Sound Level Meter Calibration: ■ checked by: S.C. Exterior Ambient Noise Level dB(A): 37.2
Accelerating from Constant Speed Curb (Right) Side
Accelerating from Constant Speed Street (Left) Side
Run #
Measured Noise
Level dB(A) Run # Measured Noise Level
dB(A)
1
73.5 1
75.3
2
73.9 2
75.3
3
74.6 3
75.0
4
73.8 4
73.5
5
74.2 5
75.4 Average of two highest actual noise levels = dB(A)
Average of two highest actual noise levels = dB(A)
Final Sound Level Meter Calibration Check: ■ checked by: S.C. Comments: None noted.
69
EXTERIOR NOISE TEST DATA FORM Accelerating from Standstill
Bus Number: 1009 Date: 11-9-10 Personnel: B.G., T.S. & S.C. Temperature (°F): 56 Humidity (%): 60 Wind Speed (mph): Calm Wind Direction: Calm Barometric Pressure (in.Hg): 30.12 Verify that microphone height is 4 feet, wind speed is less than 12 mph and ambient temperature is between 30°F and 90°F: ■ checked by: S.C. Initial Sound Level Meter Calibration: ■ checked by: S.C. Exterior Ambient Noise Level dB(A): 36.9
Accelerating from Standstill Curb (Right) Side
Accelerating from Standstill Street (Left) Side
Run #
Measured Noise
Level dB(A) Run #
Measured
Noise Level dB(A)
1 72.6 1
70.8
2 70.5 2
70.9
3 71.3 3
71.0
4 71.2 4
71.7
5 71.1 5
71.0
Average of two highest actual noise levels = 72.0 dB(A)
Average of two highest actual noise levels = 71.4 dB(A)
Final Sound Level Meter Calibration Check: ■ checked by: S.C. Comments: None noted.
70
EXTERIOR NOISE TEST DATA FORM Stationary
Bus Number: 1009 Date: 11-9-10 Personnel: B.G., T.S. & S.C. Temperature (°F): 56 Humidity (%): 60 Wind Speed (mph): Calm Wind Direction: Calm Barometric Pressure (in.Hg): 30.12 Verify that microphone height is 4 feet, wind speed is less than 12 mph and ambient temperature is between 30°F and 90°F: ■ checked by: S.C. Initial Sound Level Meter Calibration: ■ checked by: S.C. Exterior Ambient Noise Level dB(A): 37.4
Accessories and Air Conditioning ON
Throttle Position
Engine RPM Curb (Right) Side
dB(A) Street (Left) Side
db(A)
Measured Measured Low Idle 700 51.0
54.6
High Idle N/A N/A
N/A
Wide Open Throttle 3,984 68.3
68.2
Accessories and Air Conditioning OFF
Throttle Position
Engine RPM Curb (Right) Side
dB(A) Street (Left) Side
db(A)
Measured Measured Low Idle 705 50.0
47.5
High Idle N/A N/A
N/A
Wide Open Throttle 3,984 66.9
67.3
Final Sound Level Meter Calibration Check: ■ checked by: S.C. Comments: Not equipped with high idle.
71
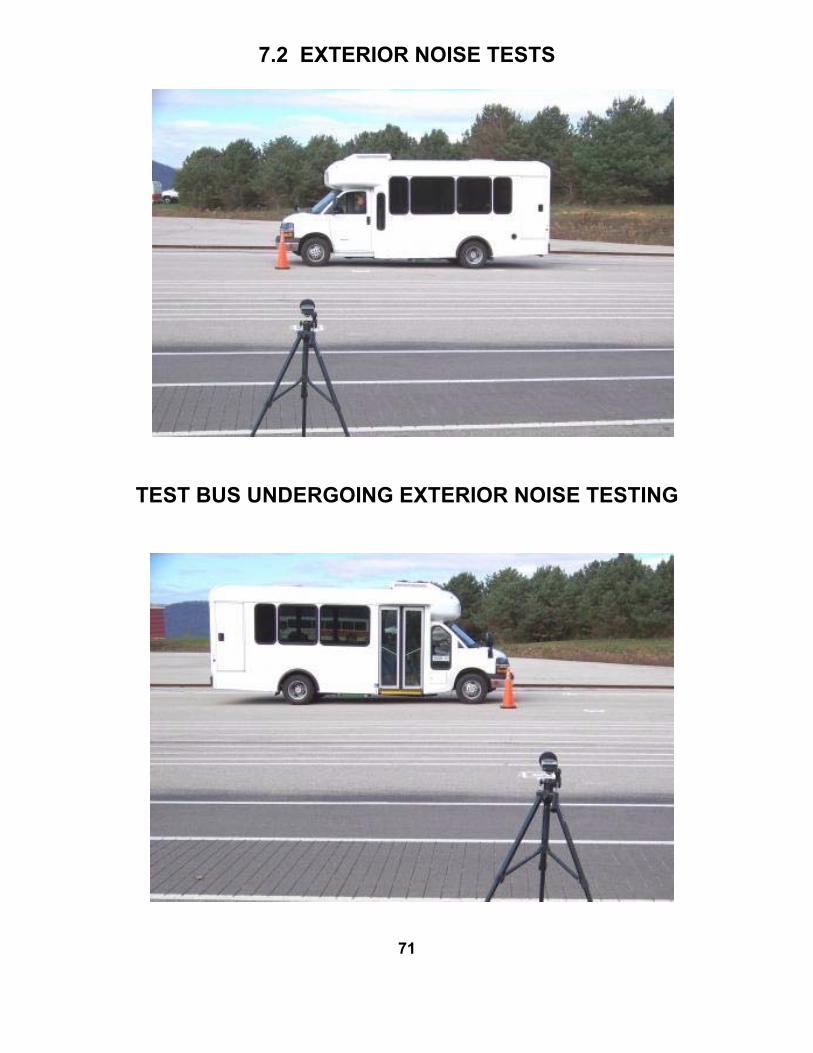
7.2 EXTERIOR NOISE TESTS
TEST BUS UNDERGOING EXTERIOR NOISE TESTING
72
8. EMISSIONS TEST – DYNAMOMETER-BASED EMISSIONS TEST USING TRANSIT DRIVING CYCLES
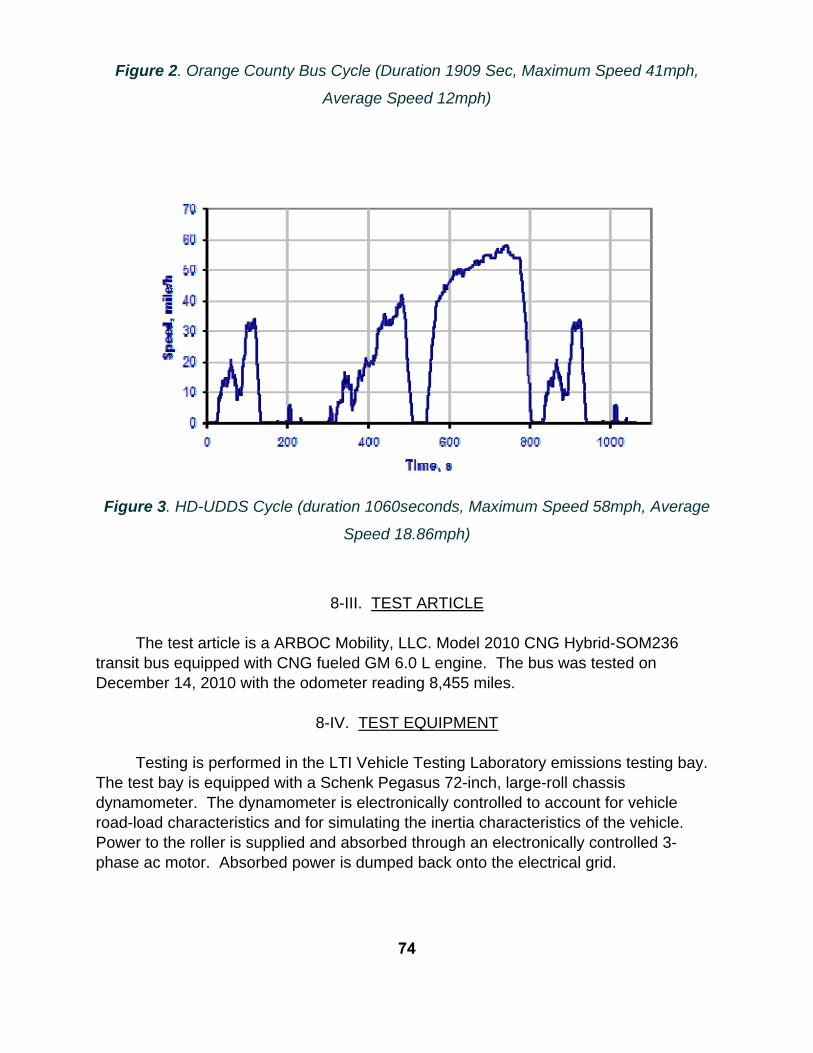
8-I. TEST OBJECTIVE The objective of this test is to provide comparable emissions data on transit buses produced by different manufacturers. This chassis-based emissions test bears no relation to engine certification testing performed for compliance with the Environmental Protection Agency (EPA) regulation. EPA's certification tests are performed using an engine dynamometer operating under the Federal Test Protocol. This emissions test is a measurement of the gaseous engine emissions CO, CO2, NOx, HC and particulates (diesel vehicles) produced by a vehicle operating on a large-roll chassis dynamometer. The test is performed for three differed driving cycles intended to simulate a range of transit operating environments. The cycles consist of Manhattan Cycle, the Orange County Bus driving cycle, and the Urban Dynamometer Driving Cycle (UDDS) and. The test is performed under laboratory conditions in compliance with EPA 1065 and SAE J2711. The results of this test may not represent actual in-service vehicle emissions but will provide data that can be used by recipients to compare buses tested under different operating conditions.
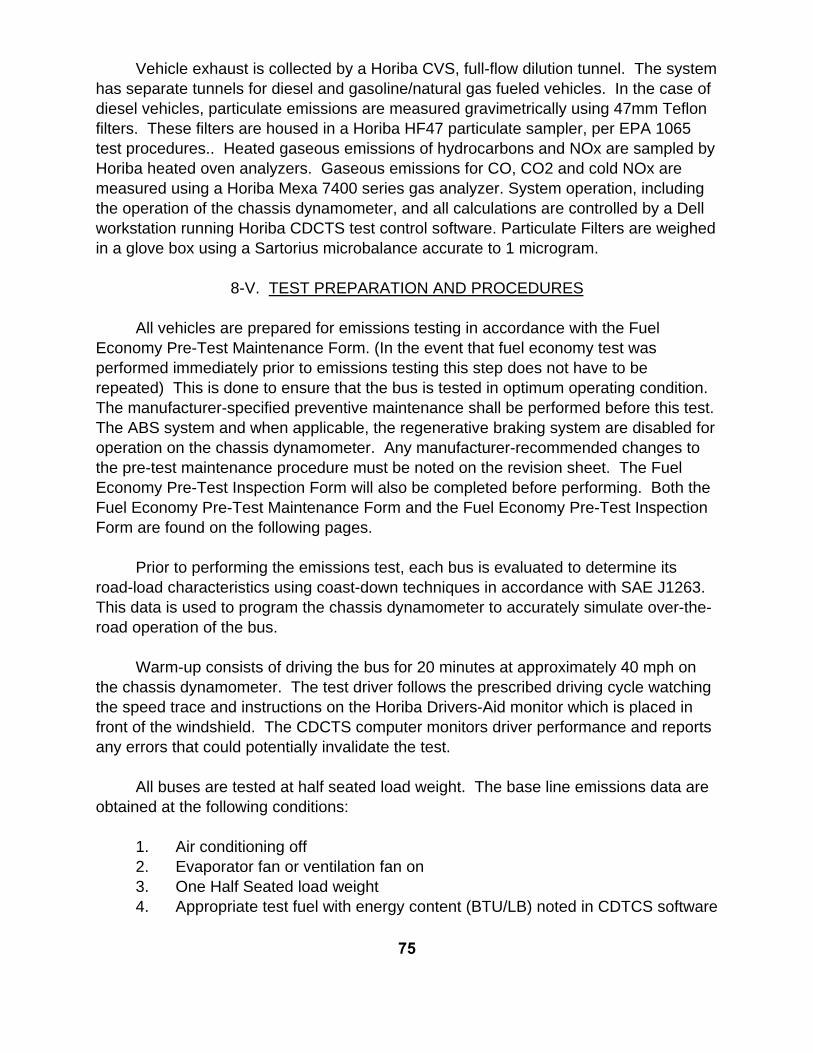
8-II. TEST DESCRIPTION This test is performed in the emissions bay of the LTI Vehicle Testing Laboratory. The Laboratory is equipped with a Schenk Pegasus 300 HP, large-roll (72 inch diameter) chassis dynamometer suitable for heavy-vehicle emissions testing. The dynamometer is located in the end test bay and is adjacent to the control room and emissions analysis area. The emissions laboratory provides capability for testing heavy-duty diesel and alternative-fueled buses for a variety of tailpipe emissions including particulate matter, oxides of nitrogen, carbon monoxide, carbon dioxide, and hydrocarbons. It is equipped with a Horiba full-scale CVS dilution tunnel and emissions sampling system. The system includes Horiba Mexa 7400 Series gas analyzers and a Horiba HF47 Particulate Sampling System. Test operation is automated using Horiba CDTCS software. The computer controlled dynamometer is capable of simulating over-the-road operation for a variety of vehicles and driving cycles. The emissions test will be performed as soon as permissible after the completion of the GVW portion of the structural durability test. The driving cycles are the Manhattan cycle, a low average speed, highly transient urban cycle (Figure 1), the Orange County Bus Cycle which consists of urban and highway driving segments (Figure 2), and the EPA UDDS Cycle (Figure 3). An emissions test will comprise of two runs for the three
73
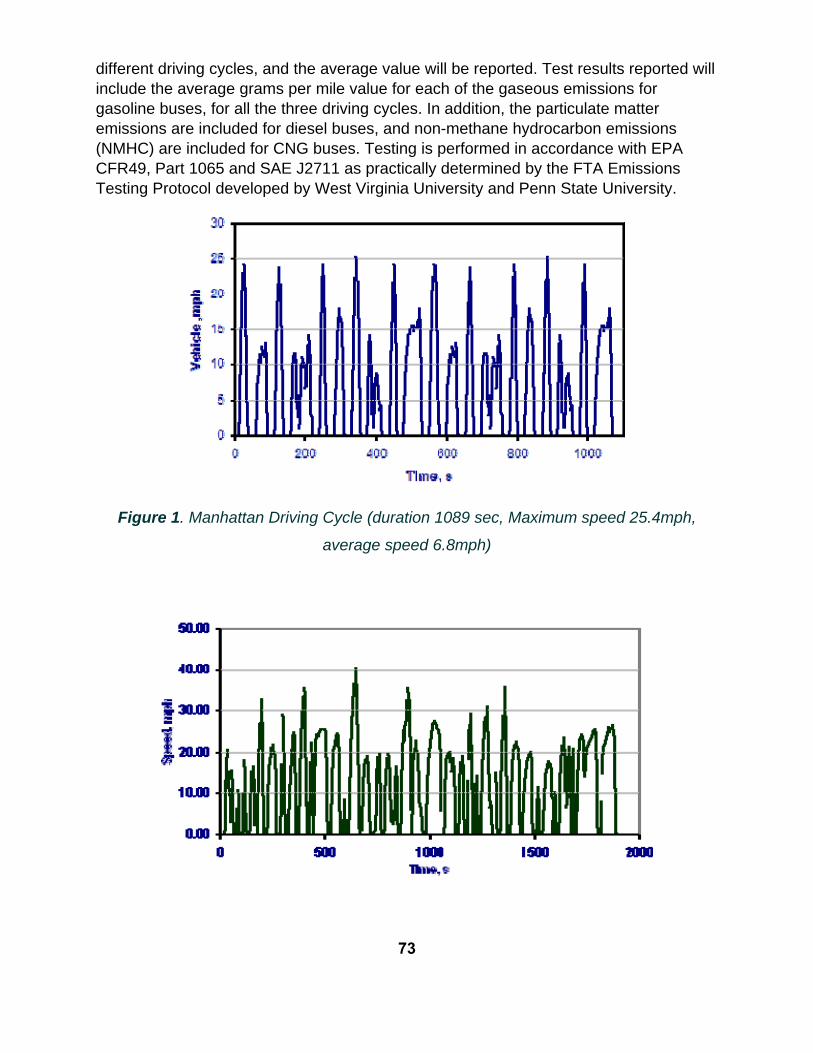
different driving cycles, and the average value will be reported. Test results reported will include the average grams per mile value for each of the gaseous emissions for gasoline buses, for all the three driving cycles. In addition, the particulate matter emissions are included for diesel buses, and non-methane hydrocarbon emissions (NMHC) are included for CNG buses. Testing is performed in accordance with EPA CFR49, Part 1065 and SAE J2711 as practically determined by the FTA Emissions Testing Protocol developed by West Virginia University and Penn State University.
Figure 1. Manhattan Driving Cycle (duration 1089 sec, Maximum speed 25.4mph,
average speed 6.8mph)
74
Figure 2. Orange County Bus Cycle (Duration 1909 Sec, Maximum Speed 41mph,
Average Speed 12mph)
Figure 3. HD-UDDS Cycle (duration 1060seconds, Maximum Speed 58mph, Average
Speed 18.86mph)
8-III. TEST ARTICLE The test article is a ARBOC Mobility, LLC. Model 2010 CNG Hybrid-SOM236 transit bus equipped with CNG fueled GM 6.0 L engine. The bus was tested on December 14, 2010 with the odometer reading 8,455 miles.
8-IV. TEST EQUIPMENT Testing is performed in the LTI Vehicle Testing Laboratory emissions testing bay. The test bay is equipped with a Schenk Pegasus 72-inch, large-roll chassis dynamometer. The dynamometer is electronically controlled to account for vehicle road-load characteristics and for simulating the inertia characteristics of the vehicle. Power to the roller is supplied and absorbed through an electronically controlled 3-phase ac motor. Absorbed power is dumped back onto the electrical grid.
75
Vehicle exhaust is collected by a Horiba CVS, full-flow dilution tunnel. The system has separate tunnels for diesel and gasoline/natural gas fueled vehicles. In the case of diesel vehicles, particulate emissions are measured gravimetrically using 47mm Teflon filters. These filters are housed in a Horiba HF47 particulate sampler, per EPA 1065 test procedures.. Heated gaseous emissions of hydrocarbons and NOx are sampled by Horiba heated oven analyzers. Gaseous emissions for CO, CO2 and cold NOx are measured using a Horiba Mexa 7400 series gas analyzer. System operation, including the operation of the chassis dynamometer, and all calculations are controlled by a Dell workstation running Horiba CDCTS test control software. Particulate Filters are weighed in a glove box using a Sartorius microbalance accurate to 1 microgram.
8-V. TEST PREPARATION AND PROCEDURES All vehicles are prepared for emissions testing in accordance with the Fuel Economy Pre-Test Maintenance Form. (In the event that fuel economy test was performed immediately prior to emissions testing this step does not have to be repeated) This is done to ensure that the bus is tested in optimum operating condition. The manufacturer-specified preventive maintenance shall be performed before this test. The ABS system and when applicable, the regenerative braking system are disabled for operation on the chassis dynamometer. Any manufacturer-recommended changes to the pre-test maintenance procedure must be noted on the revision sheet. The Fuel Economy Pre-Test Inspection Form will also be completed before performing. Both the Fuel Economy Pre-Test Maintenance Form and the Fuel Economy Pre-Test Inspection Form are found on the following pages. Prior to performing the emissions test, each bus is evaluated to determine its road-load characteristics using coast-down techniques in accordance with SAE J1263. This data is used to program the chassis dynamometer to accurately simulate over-the-road operation of the bus. Warm-up consists of driving the bus for 20 minutes at approximately 40 mph on the chassis dynamometer. The test driver follows the prescribed driving cycle watching the speed trace and instructions on the Horiba Drivers-Aid monitor which is placed in front of the windshield. The CDCTS computer monitors driver performance and reports any errors that could potentially invalidate the test. All buses are tested at half seated load weight. The base line emissions data are obtained at the following conditions: 1. Air conditioning off 2. Evaporator fan or ventilation fan on 3. One Half Seated load weight 4. Appropriate test fuel with energy content (BTU/LB) noted in CDTCS software
76
5. Exterior and interior lights on 6. Heater Pump Motor off 7. Defroster off 8. Windows and Doors closed The test tanks or the bus fuel tank(s) will be filled prior to the fuel economy test with the appropriate grade of test fuel.
77
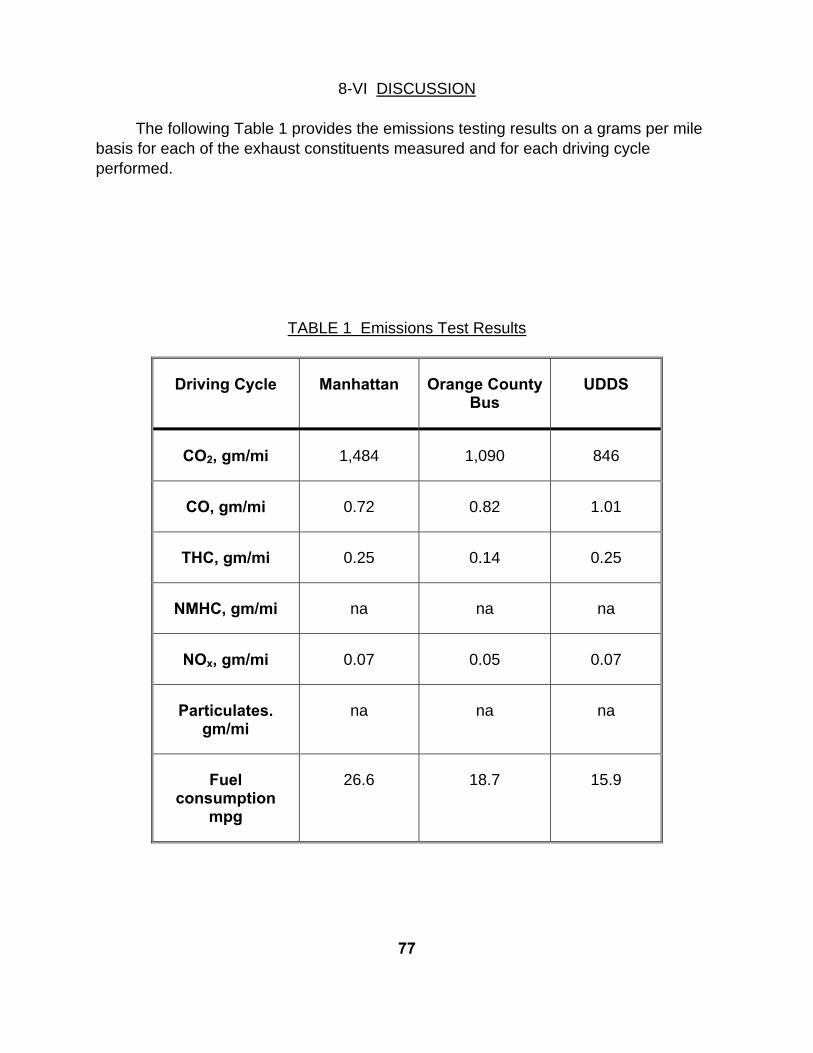
8-VI DISCUSSION The following Table 1 provides the emissions testing results on a grams per mile basis for each of the exhaust constituents measured and for each driving cycle performed.
TABLE 1 Emissions Test Results
Driving Cycle Manhattan Orange County Bus
UDDS
CO2, gm/mi 1,484 1,090 846
CO, gm/mi 0.72 0.82 1.01
THC, gm/mi 0.25 0.14 0.25
NMHC, gm/mi na na na
NOx, gm/mi 0.07 0.05 0.07
Particulates. gm/mi
na na na
Fuel consumption
mpg
26.6 18.7 15.9
78
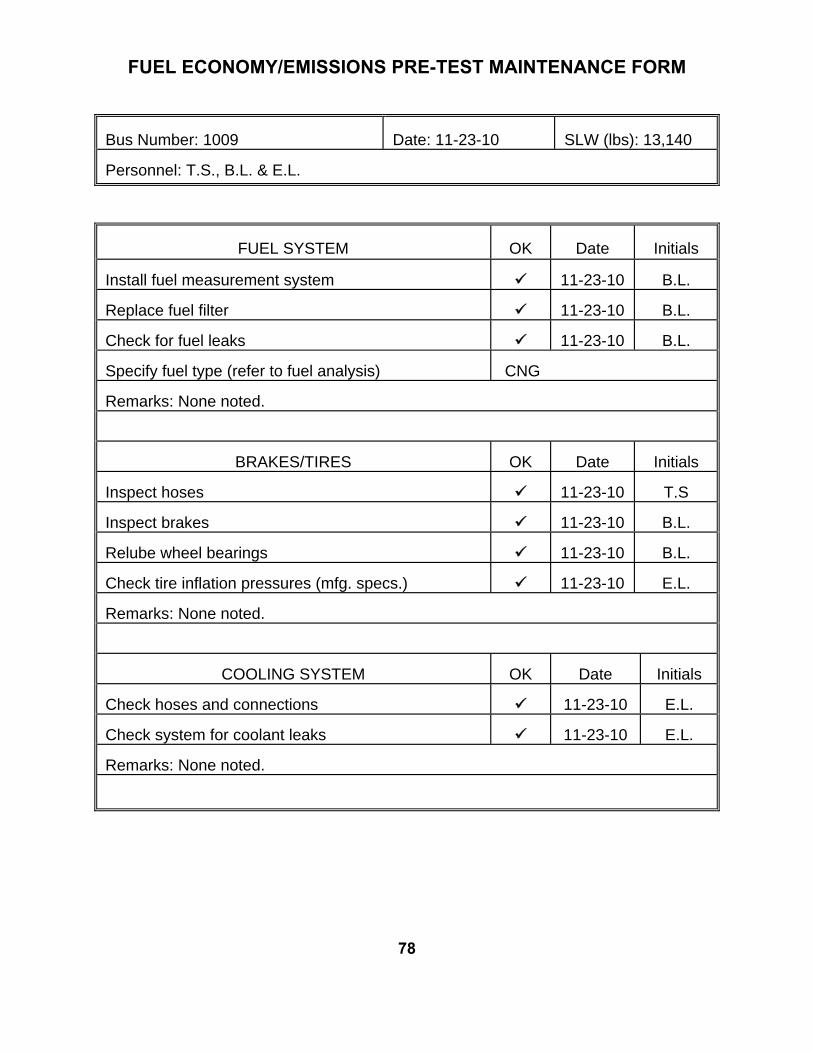
FUEL ECONOMY/EMISSIONS PRE-TEST MAINTENANCE FORM
Bus Number: 1009 Date: 11-23-10 SLW (lbs): 13,140 Personnel: T.S., B.L. & E.L.
FUEL SYSTEM OK Date
Initials
Install fuel measurement system
11-23-10 B.L.
Replace fuel filter
11-23-10 B.L.
Check for fuel leaks
11-23-10 B.L.
Specify fuel type (refer to fuel analysis) CNG Remarks: None noted.
BRAKES/TIRES OK Date
Initials Inspect hoses
11-23-10 T.S
Inspect brakes
11-23-10 B.L.
Relube wheel bearings
11-23-10 B.L.
Check tire inflation pressures (mfg. specs.)
11-23-10 E.L.
Remarks: None noted.
COOLING SYSTEM OK Date Initials
Check hoses and connections
11-23-10 E.L.
Check system for coolant leaks
11-23-10 E.L.
Remarks: None noted.
79
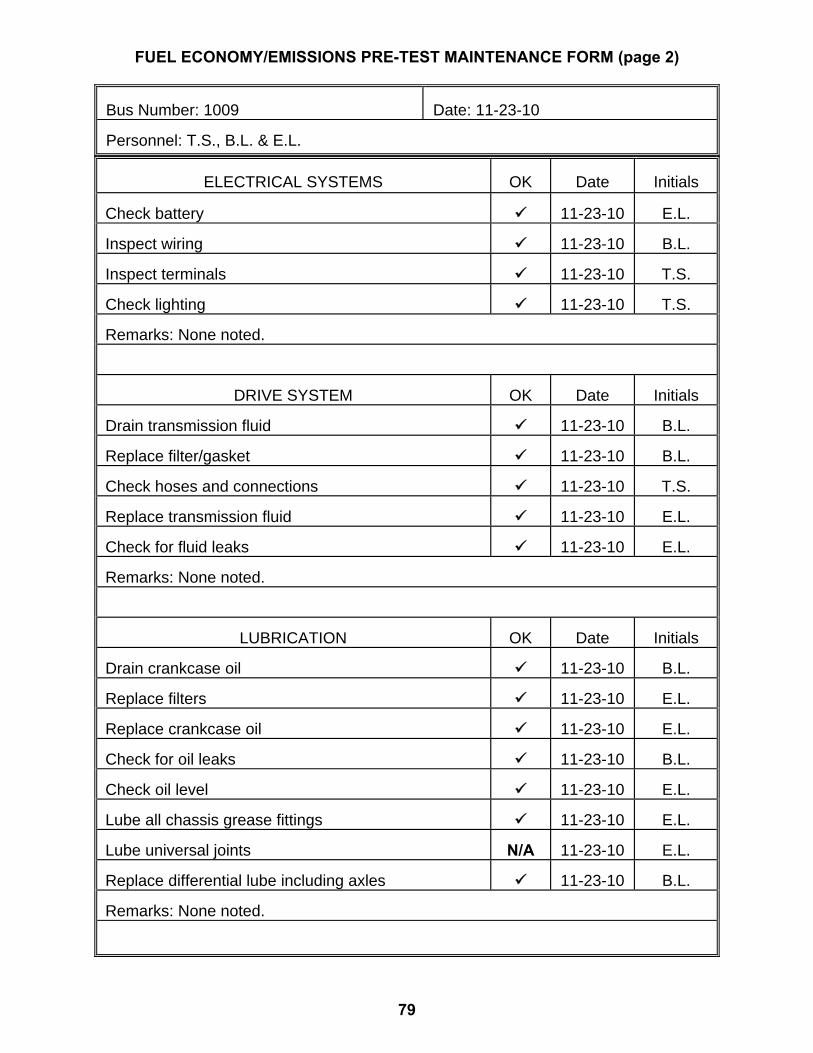
FUEL ECONOMY/EMISSIONS PRE-TEST MAINTENANCE FORM (page 2)
Bus Number: 1009 Date: 11-23-10 Personnel: T.S., B.L. & E.L.
ELECTRICAL SYSTEMS OK Date
Initials Check battery
11-23-10 E.L.
Inspect wiring
11-23-10 B.L.
Inspect terminals
11-23-10 T.S.
Check lighting
11-23-10 T.S.
Remarks: None noted.
DRIVE SYSTEM OK Date
Initials Drain transmission fluid
11-23-10 B.L.
Replace filter/gasket
11-23-10 B.L.
Check hoses and connections
11-23-10 T.S.
Replace transmission fluid
11-23-10 E.L.
Check for fluid leaks
11-23-10 E.L.
Remarks: None noted.
LUBRICATION OK Date
Initials Drain crankcase oil
11-23-10 B.L.
Replace filters
11-23-10 E.L.
Replace crankcase oil
11-23-10 E.L.
Check for oil leaks
11-23-10 B.L.
Check oil level
11-23-10 E.L.
Lube all chassis grease fittings
11-23-10 E.L.
Lube universal joints N/A
11-23-10 E.L.
Replace differential lube including axles
11-23-10 B.L.
Remarks: None noted.
80
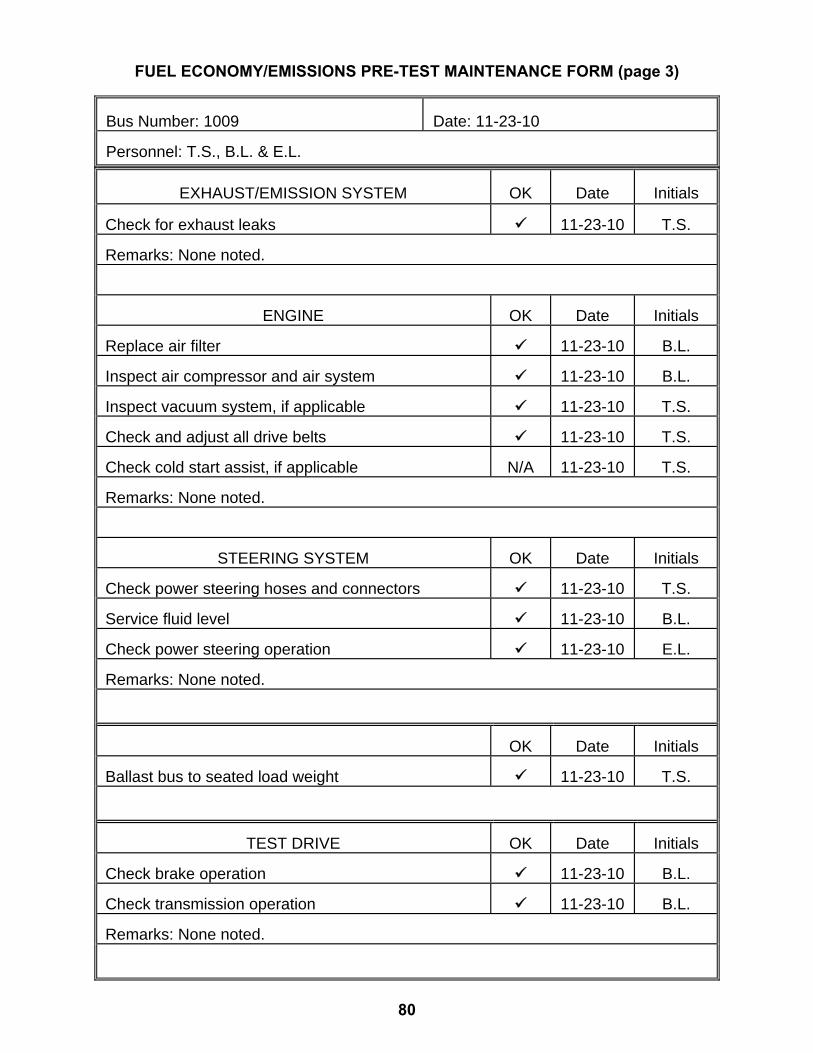
FUEL ECONOMY/EMISSIONS PRE-TEST MAINTENANCE FORM (page 3)
Bus Number: 1009 Date: 11-23-10 Personnel: T.S., B.L. & E.L.
EXHAUST/EMISSION SYSTEM OK Date
Initials Check for exhaust leaks
11-23-10 T.S.
Remarks: None noted.
ENGINE OK Date
Initials Replace air filter
11-23-10 B.L.
Inspect air compressor and air system
11-23-10 B.L.
Inspect vacuum system, if applicable
11-23-10 T.S.
Check and adjust all drive belts
11-23-10 T.S.
Check cold start assist, if applicable N/A
11-23-10 T.S.
Remarks: None noted.
STEERING SYSTEM OK Date
Initials Check power steering hoses and connectors
11-23-10 T.S.
Service fluid level
11-23-10 B.L.
Check power steering operation
11-23-10 E.L.
Remarks: None noted.
OK Date
Initials Ballast bus to seated load weight
11-23-10 T.S.
TEST DRIVE OK Date
Initials Check brake operation
11-23-10 B.L.
Check transmission operation
11-23-10 B.L.
Remarks: None noted.
81
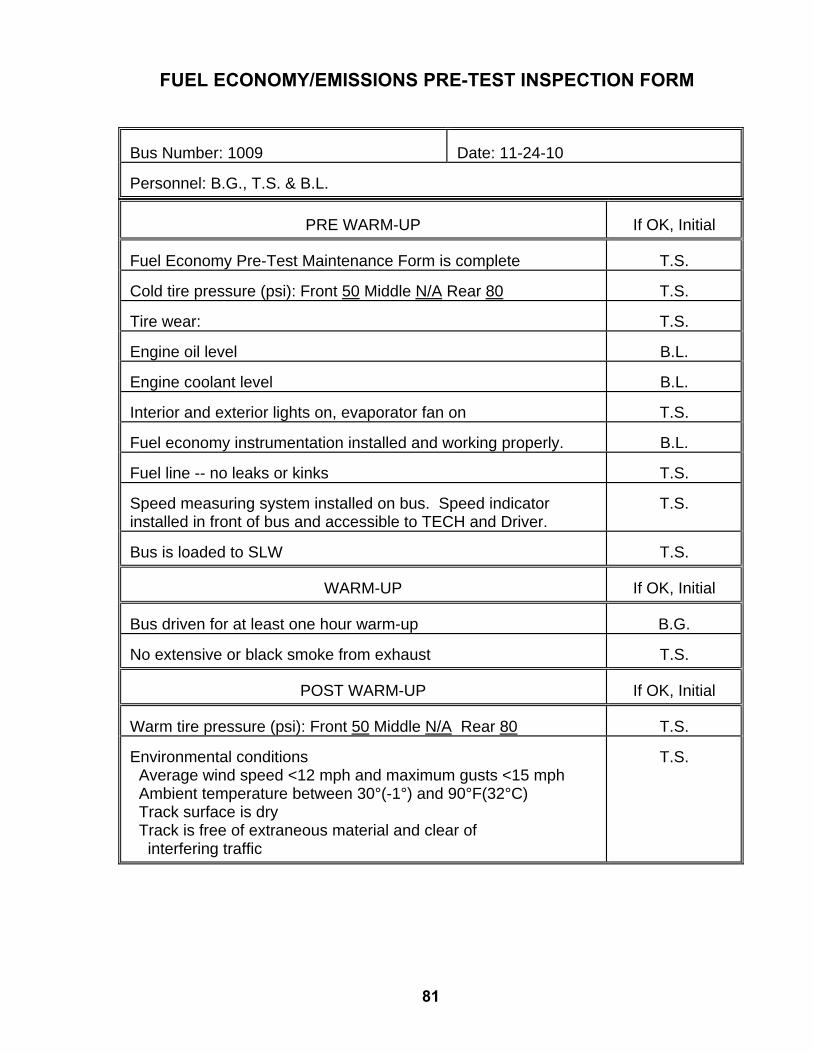
FUEL ECONOMY/EMISSIONS PRE-TEST INSPECTION FORM
Bus Number: 1009 Date: 11-24-10 Personnel: B.G., T.S. & B.L.
PRE WARM-UP
If OK, Initial Fuel Economy Pre-Test Maintenance Form is complete T.S. Cold tire pressure (psi): Front 50 Middle N/A Rear 80 T.S. Tire wear: T.S. Engine oil level B.L. Engine coolant level B.L. Interior and exterior lights on, evaporator fan on T.S. Fuel economy instrumentation installed and working properly. B.L. Fuel line -- no leaks or kinks T.S. Speed measuring system installed on bus. Speed indicator installed in front of bus and accessible to TECH and Driver.
T.S.
Bus is loaded to SLW T.S.
WARM-UP
If OK, Initial Bus driven for at least one hour warm-up B.G. No extensive or black smoke from exhaust T.S.
POST WARM-UP
If OK, Initial Warm tire pressure (psi): Front 50 Middle N/A Rear 80 T.S. Environmental conditions Average wind speed <12 mph and maximum gusts <15 mph Ambient temperature between 30°(-1°) and 90°F(32°C) Track surface is dry Track is free of extraneous material and clear of interfering traffic
T.S.