Embed Size (px)
Citation preview
Contents
Page
Education and labour markets: Analysing global patterns with the KILM ..................................... 1
1. Introduction ........................................................................................................................... 1
2. Global trends by indicator ..................................................................................................... 4
2.1. Labour force distribution by level of educational attainment ..................................... 4
2.2. Unemployment distribution by level of educational attainment ................................. 6
2.3. Unemployment rate by level of educational attainment ............................................. 8
2.4. Share of youth not in education, employment or training (NEET) ........................... 10
3. Impact of education on labour market outcomes ................................................................ 12
3.1. Unemployment and education .................................................................................. 12
3.2. Labour productivity and education ........................................................................... 14
3.3. Employment-to-population ratio and education ....................................................... 15
3.4. Share of employees and education ............................................................................ 16
4. The current situation in 12 selected countries ..................................................................... 18
4.1 Data for latest year available on the four selected indicators ................................... 18
4.2. Educational attainment compared to other key labour market indicators ................. 21
4.3. Remaining gaps in education .................................................................................... 25
4.3.1. Persistent low levels of educational attainment .............................................. 25
4.3.2. Disparities between population groups ........................................................... 25
4.3.3. Attention to qualitative factors and field of study .......................................... 27
5. Conclusion .......................................................................................................................... 28
References ..................................................................................................................................... 29
Annex ............................................................................................................................................ 30
1
Education and labour markets: Analysing global patterns with the KILM 1
1. Introduction
Education and training are at the core of any effort to increase a country’s
productivity and to improve people’s likelihood not only of accessing employment at all,
but of accessing good quality employment. The educational attainment and skills base of
the workforce have a clear impact at both the individual and the national level.
Accordingly, effective policy-making depends on understanding the ways in which
educational trends and labour market trends are related, and how these shape individual
and national well-being.
In general terms, higher levels of education are associated with greater labour market
success, enhancing the opportunities for individuals to enter the labour market in a better
position and protect them from unemployment. Where highly educated individuals are
unemployed, this may in some cases reflect their unwillingness to settle for jobs of lesser
quality than they deem appropriate based on their skill level. The effect of educational
attainment on individuals’ labour market outcomes refers not only to improved access to
employment, but also to the quality of their employment in terms of working conditions.
Higher levels of educational attainment are associated with higher salaries. Even
overeducated individuals (those in jobs that require a lower skill level than they have) earn
more, overall, than those doing the same job with no more than the skills needed (Rubb,
2003).
Educational attainment also influences other crucial aspects of working conditions,
such as the type of contract and working time arrangements. A higher educational level can
put workers in a better position to negotiate more satisfactory terms of employment.
However, in highly segmented labour markets, where casual work and temporary contracts
are common and formal permanent contracts are not widespread, human capital might be
traded off for job security. In such environments, workers with greater skills than those
required for their position are more likely to be found in permanent jobs than in temporary
ones (Ortiz, 2010). Education therefore can provide protection, to a certain extent, from
vulnerable employment. One study found that the proportion of youth in vulnerable
employment educated at only the primary level or below is greater than that of similarly
educated youth in non-vulnerable employment (Sparreboom and Staneva, 2014).
At the national level, there is a positive correlation between the proportion of highly
educated adults in the labour force in a given country and that country’s income per capita
(OECD and Statistics Canada, 2000; Holland, Liadze, Rienzo and Wilkinson, 2013). A
study involving 18 developing countries found that in most of the countries analysed, an
increase in national literacy rates was accompanied by a higher rate of national economic
growth. That is, human capital has a statistically significant positive impact on economic
growth (Vinod and Kaushik, 2007). In addition, higher levels of educational attainment are
associated with lower income inequalities, and national expenditure (per student) in
education strongly influences a country’s income distribution (Keller, 2010).
1 The analysis of this section was prepared by Rosina Gammarano and Yves Perardel with the
support of colleagues in the ILO Department of Statistics. Helpful comments on this section were
provided by Laura Brewer, Sara Elder, Lawrence Jeff Johnson, Sangheon Lee, Sandra Polaski and
Theo Sparreboom.
2
Studies on these critical linkages between education and labour markets tend to focus
on developed economies. Less is known about the corresponding dynamics in the
developing world; however, Keller’s finding cited above is particularly marked for less
developed countries. Given that levels of educational attainment remain comparatively low
in many developing countries, further exploration of such linkages is vital (ILO, 2015).
To this end, the ninth edition of the KILM includes four indicators that directly
examine the link between education and the labour market, presenting time series for a
large number of countries at all stages of development. These four indicators correspond to
table 14a, which looks at the labour force by level of educational attainment, disaggregated
by sex and age group (total, youth and adult); table 14b, covering unemployment by level
of educational attainment, disaggregated by sex and age group; table 14c, which shows
unemployment rates by level of educational attainment, also disaggregated by sex and age
group; and table 10c, containing rates for those not in education, employment or training
(NEET), disaggregated by sex.
Throughout this chapter, we use the wealth of data included in the ninth edition of the
KILM to explore the linkages between education and the labour market, and, more
specifically, to examine whether the expected relationships between educational attainment
and labour market outcomes are confirmed by the available data. The KILM offers the
advantage of allowing us to conduct this study at the global level, revealing patterns for
both developed and developing economies, and across regions.
Section 2 of the chapter begins this exploration by analysing the trends observed
during the past 10–15 years for the four indicators identified above for all countries for
which data are available. This provides a general picture of the recent evolution of the
educational attainment of the labour force worldwide. Section 3 investigates more closely
the linkages between education, labour market outcomes and economic performance, by
comparing the four education-related indicators to other KILM indicators, namely, labour
productivity (table 16a), the employment-to-population ratio (table 2b) and status in
employment (table 3).
Section 4 looks at the same indicators, focusing in more detail on a set of 12 selected
countries. These countries have been chosen to represent all income groups, as defined in
the World Bank classification of countries by income (based on GNI per capita), that is,
low income economies, lower middle income economies, upper middle income economies
and high income economies. Data for all 12 countries are available in the KILM, and the
group also covers all regions of the world. Finally, a brief section 5 concludes.
3
Box 1.1. Data on the labour market and education: Statistical issues
There are a number of challenges associated with the use of data on education, and in particular, of labour market data in relation to education. The first pertains to data availability. The preferred source for this type of data is a labour force survey, since it provides reliable information on both the educational attainment and the labour market status of individuals. Other types of household surveys and population censuses can also be used to derive these data. This means that, in general terms, it can be hard to obtain reliable and frequent statistics on the labour force by educational attainment for those countries that do not have a regular labour force or household survey in place.
Other key challenges relate to the international comparability of education statistics. The configuration of the national educational system, the levels of education required in the workplace and even traditions in terms of education are all heavily dependent on the national context. Even though there is an internationally agreed standard classification of educational levels (the International Standard Classification of Education, whose latest version dates from 2011), it cannot be assumed that educational categories used at the national level always accurately match the categories in this standard classification.
There is also the potential for confusion as to how a person’s educational level is to be defined. Ideally, when making cross-country comparisons, all data should refer to the highest level of education completed, rather than the level in which the person is currently enrolled, or the level begun, but not successfully completed. However, because data are usually derived from household surveys, the actual definition ultimately used will inevitably depend on each respondent’s own interpretation.
4
2. Global trends by indicator
In this section, we present the four KILM indicators at the centre of our analysis. We
start by comparing, for all countries with available data, the situation in 2000 (or the
closest year available) to that in the latest year available.2 The aim is to understand what
has changed during the past 15 years, and to reveal any trends for these key indicators.
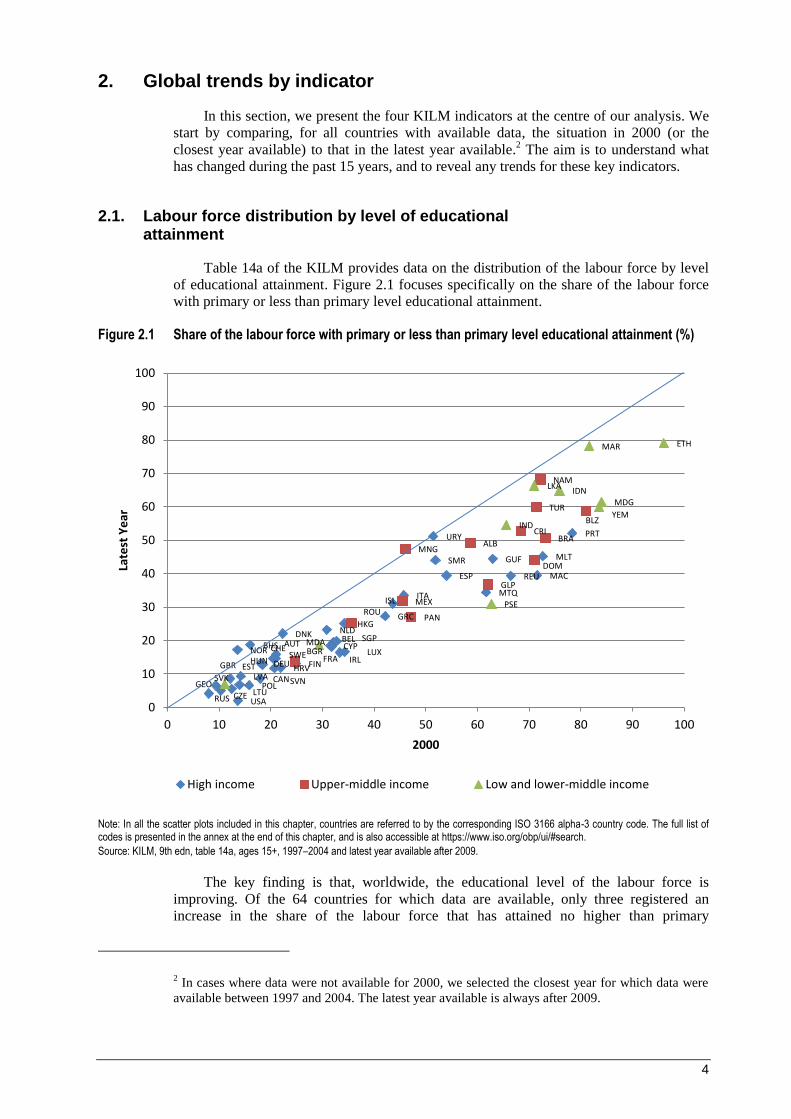
2.1. Labour force distribution by level of educational attainment
Table 14a of the KILM provides data on the distribution of the labour force by level
of educational attainment. Figure 2.1 focuses specifically on the share of the labour force
with primary or less than primary level educational attainment.
Figure 2.1 Share of the labour force with primary or less than primary level educational attainment (%)
Note: In all the scatter plots included in this chapter, countries are referred to by the corresponding ISO 3166 alpha-3 country code. The full list of codes is presented in the annex at the end of this chapter, and is also accessible at https://www.iso.org/obp/ui/#search.
Source: KILM, 9th edn, table 14a, ages 15+, 1997–2004 and latest year available after 2009.
The key finding is that, worldwide, the educational level of the labour force is
improving. Of the 64 countries for which data are available, only three registered an
increase in the share of the labour force that has attained no higher than primary
2 In cases where data were not available for 2000, we selected the closest year for which data were
available between 1997 and 2004. The latest year available is always after 2009.
AUT BHS BEL
CAN HRV
CYP
CZE
DNK
EST FIN FRA
GUF
DEU
GRC HKG
HUN
ISL
IRL
ITA
LVA
LTU
LUX
MAC
MLT
MTQ
NLD
NOR
POL
PRT
REU
RUS
SMR
SGP
SVK SVN
ESP
SWE CHE
GBR
USA
URY ALB
BLZ
BRA
BGR
CRI
DOM
GLP
MEX
MNG
NAM
PAN ROU
TUR
GEO
IND
IDN
MDA
MAR
PSE
LKA
YEM
ETH
MDG
0
10
20
30
40
50
60
70
80
90
100
0 10 20 30 40 50 60 70 80 90 100
Late
st Y
ear
2000
High income Upper-middle income Low and lower-middle income
5
educational level. Among the developed economies, the situation does not seem to have
changed appreciably. In most of these countries, the share of the labour force with no
higher than primary level educational attainment was already quite low in 2000, and has
declined only moderately over the following 15 years. Conversely, upper middle income
economies and low and lower middle income economies have tended to experience more
significant improvements, though starting from a lower educational base. The decrease in
the share of the labour force with primary or less than primary level educational attainment
is particularly striking for Macau (China) and the Occupied Palestinian Territory, where it
fell by around 30 percentage points. The corollary of this, of course, is that the proportions
of the population attaining some higher level of education have increased.
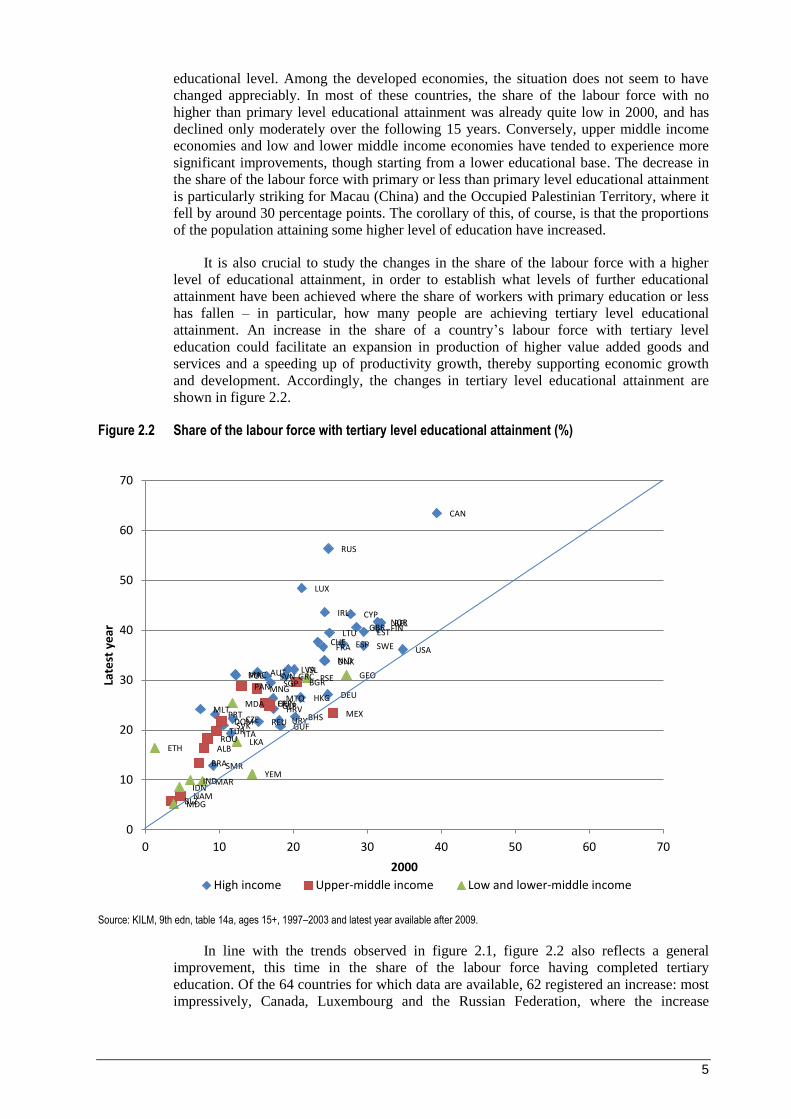
It is also crucial to study the changes in the share of the labour force with a higher
level of educational attainment, in order to establish what levels of further educational
attainment have been achieved where the share of workers with primary education or less
has fallen – in particular, how many people are achieving tertiary level educational
attainment. An increase in the share of a country’s labour force with tertiary level
education could facilitate an expansion in production of higher value added goods and
services and a speeding up of productivity growth, thereby supporting economic growth
and development. Accordingly, the changes in tertiary level educational attainment are
shown in figure 2.2.
Figure 2.2 Share of the labour force with tertiary level educational attainment (%)
Source: KILM, 9th edn, table 14a, ages 15+, 1997–2003 and latest year available after 2009.
In line with the trends observed in figure 2.1, figure 2.2 also reflects a general
improvement, this time in the share of the labour force having completed tertiary
education. Of the 64 countries for which data are available, 62 registered an increase: most
impressively, Canada, Luxembourg and the Russian Federation, where the increase
AUT
BHS
BEL
CAN
HRV
CYP
CZE
DNK
EST FIN
FRA
GUF
DEU
GRC
HKG HUN
ISL
IRL
ITA
LVA
LTU
LUX
MAC
MLT MTQ
NLD
NOR
POL
PRT REU
RUS
SMR
SGP
SVK
SVN
ESP SWE CHE
GBR
USA
URY
ALB
BLZ
BRA
BGR
CRI
DOM
GLP MEX
MNG
NAM
PAN
ROU TUR
GEO
IND IDN
MDA
MAR
PSE
LKA
YEM
ETH
MDG
0
10
20
30
40
50
60
70
0 10 20 30 40 50 60 70
Late
st y
ear
2000
High income Upper-middle income Low and lower-middle income
6
exceeded 20 percentage points, taking these three countries to the top of the rankings in
terms of share of the labour force with tertiary education in the latest year available. In
contrast, only two countries, Mexico and Yemen, experienced a (modest) decrease in the
share of the labour force with tertiary education.
One special consideration to keep in mind when looking at data referring to tertiary
education is the difference between vocational education and university degrees, since
vocational education plays a significant role in productivity and sustainable growth for
many countries. However, whether vocational education is considered secondary or
tertiary-level varies from country to country, which renders its analysis more difficult.
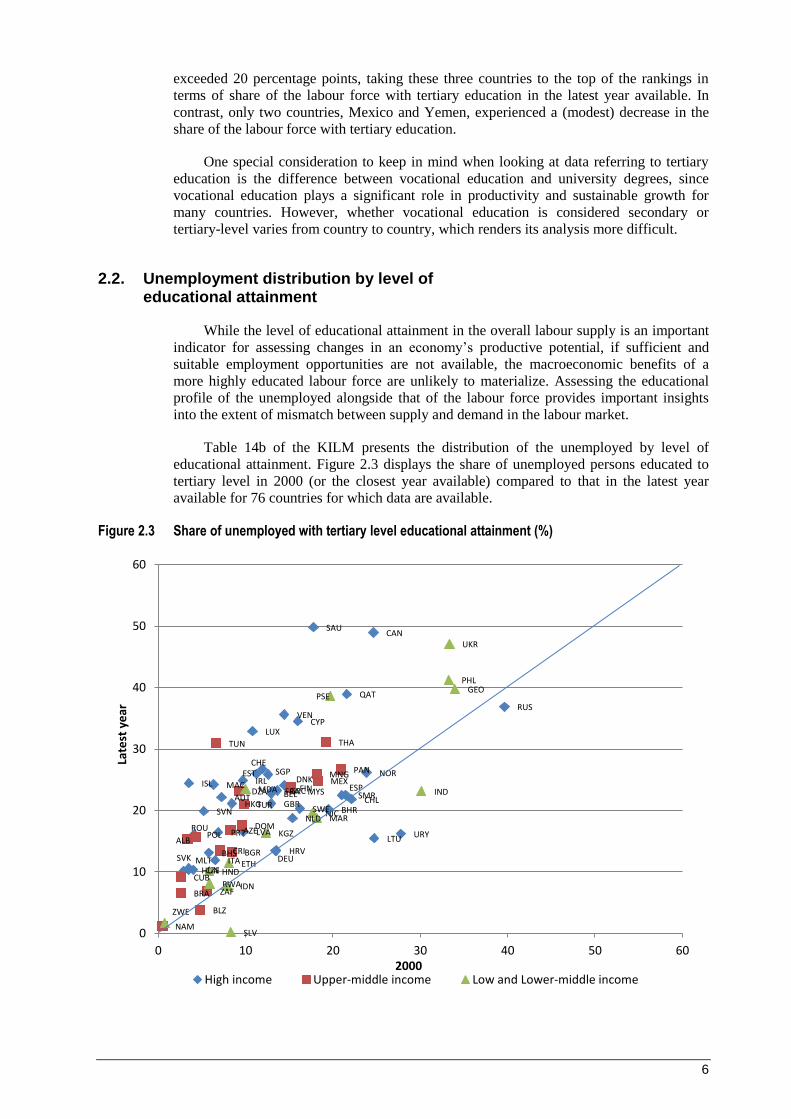
2.2. Unemployment distribution by level of educational attainment
While the level of educational attainment in the overall labour supply is an important
indicator for assessing changes in an economy’s productive potential, if sufficient and
suitable employment opportunities are not available, the macroeconomic benefits of a
more highly educated labour force are unlikely to materialize. Assessing the educational
profile of the unemployed alongside that of the labour force provides important insights
into the extent of mismatch between supply and demand in the labour market.
Table 14b of the KILM presents the distribution of the unemployed by level of
educational attainment. Figure 2.3 displays the share of unemployed persons educated to
tertiary level in 2000 (or the closest year available) compared to that in the latest year
available for 76 countries for which data are available.
Figure 2.3 Share of unemployed with tertiary level educational attainment (%)
AUT
BHS
BHR
BEL
CAN
CHL
HRV
CYP
CZE
DNK EST
FIN FRA
DEU
GRC
HKG
HUN
ISL IRL
ITA
LVA LTU
LUX
MAC
MLT
NLD
NOR
POL PRT
QAT
RUS
SMR
SAU
SGP
SVK
SVN
ESP
SWE
CHE
GBR
URY
VEN
ALB
DZA
AZE
BLZ
BRA
BGR CRI
CUB
DOM
MYS MEX MNG
NAM
PAN
ROU
ZAF
THA TUN
TUR
SLV
GEO
HND
IND
IDN
KGZ
MDA
MAR NIC
PSE
PHL
UKR
ETH
RWA
ZWE
0
10
20
30
40
50
60
0 10 20 30 40 50 60
Late
st y
ear
2000 High income Upper-middle income Low and Lower-middle income
7
Source: KILM, 9th edn, table 14b, ages 15+, 1997–2003 and latest year available after 2009.
The share of unemployed with tertiary level educational attainment declined in only
10 of these countries between 2000 and the latest year available. A trend increase in the
share of the unemployed with tertiary education is in line with the rising level of
educational attainment of the labour force experienced by most countries. However, the
findings also indicate that a higher level of education may be less and less effective in
preventing unemployment. In Saudi Arabia and Canada, the share of unemployed with
tertiary level educational attainment doubled over these years. In Tunisia, the share of
unemployed with a tertiary education increased dramatically, from only 6.6 per cent to
30.9 per cent.
Figure 2.4 focuses on the situation of youth, specifically on changes in the past 10–15
years in the share of unemployed youth with tertiary level educational attainment.
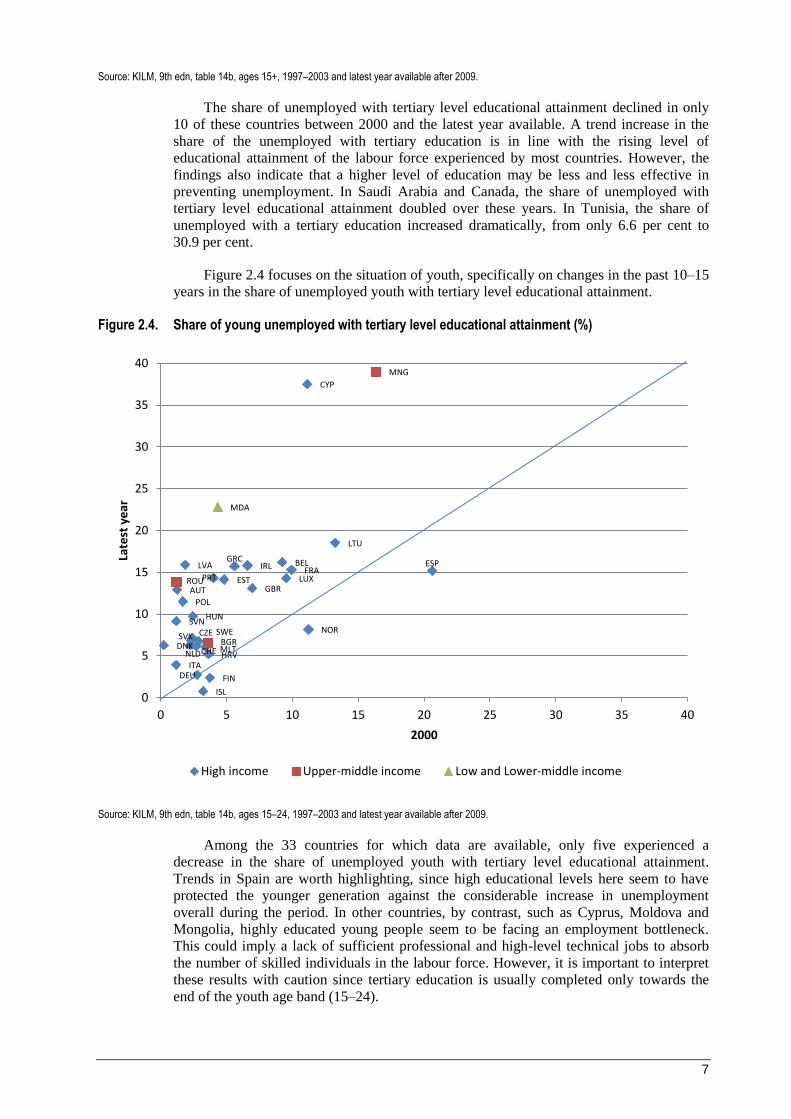
Figure 2.4. Share of young unemployed with tertiary level educational attainment (%)
Source: KILM, 9th edn, table 14b, ages 15–24, 1997–2003 and latest year available after 2009.
Among the 33 countries for which data are available, only five experienced a
decrease in the share of unemployed youth with tertiary level educational attainment.
Trends in Spain are worth highlighting, since high educational levels here seem to have
protected the younger generation against the considerable increase in unemployment
overall during the period. In other countries, by contrast, such as Cyprus, Moldova and
Mongolia, highly educated young people seem to be facing an employment bottleneck.
This could imply a lack of sufficient professional and high-level technical jobs to absorb
the number of skilled individuals in the labour force. However, it is important to interpret
these results with caution since tertiary education is usually completed only towards the
end of the youth age band (15–24).
AUT
BEL
CHE
CYP
CZE
DEU
DNK
ESP
EST
FIN
FRA
GBR
GRC
HRV
HUN
IRL
ISL
ITA
LTU
LUX
LVA
MLT NLD
NOR
POL
PRT
SVK
SVN SWE
BGR
MNG
ROU
MDA
0
5
10
15
20
25
30
35
40
0 5 10 15 20 25 30 35 40
Late
st y
ear
2000
High income Upper-middle income Low and Lower-middle income
8
2.3. Unemployment rate by level of educational attainment
Table 14c of the KILM presents data on unemployment rates by level of educational
attainment. In doing so, it provides insights into changes in demand for workers with
different education and skill levels. Figure 2.5 focuses on the unemployment rate of
persons with tertiary level education.
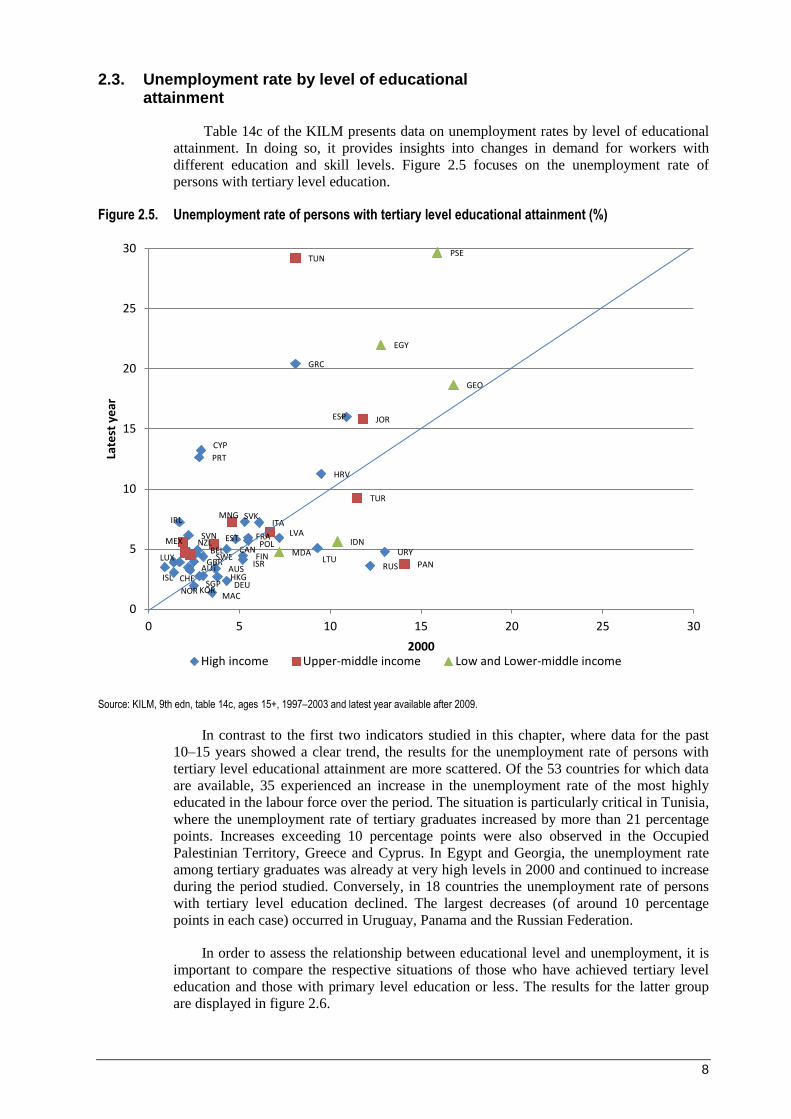
Figure 2.5. Unemployment rate of persons with tertiary level educational attainment (%)
Source: KILM, 9th edn, table 14c, ages 15+, 1997–2003 and latest year available after 2009.
In contrast to the first two indicators studied in this chapter, where data for the past
10–15 years showed a clear trend, the results for the unemployment rate of persons with
tertiary level educational attainment are more scattered. Of the 53 countries for which data
are available, 35 experienced an increase in the unemployment rate of the most highly
educated in the labour force over the period. The situation is particularly critical in Tunisia,
where the unemployment rate of tertiary graduates increased by more than 21 percentage
points. Increases exceeding 10 percentage points were also observed in the Occupied
Palestinian Territory, Greece and Cyprus. In Egypt and Georgia, the unemployment rate
among tertiary graduates was already at very high levels in 2000 and continued to increase
during the period studied. Conversely, in 18 countries the unemployment rate of persons
with tertiary level education declined. The largest decreases (of around 10 percentage
points in each case) occurred in Uruguay, Panama and the Russian Federation.
In order to assess the relationship between educational level and unemployment, it is
important to compare the respective situations of those who have achieved tertiary level
education and those with primary level education or less. The results for the latter group
are displayed in figure 2.6.
AUS AUT
BEL CAN
CHE
CYP
DEU
ESP
EST
FIN
FRA
GBR
GRC
HKG
HRV
IRL
ISL
ISR
ITA
KOR
LTU LUX
LVA
MAC NOR
NZL POL
PRT
RUS
SGP
SVK
SVN
SWE URY
JOR
MEX
MNG
PAN
TUN
TUR
EGY
GEO
IDN
PSE
MDA
0
5
10
15
20
25
30
0 5 10 15 20 25 30
Late
st y
ear
2000 High income Upper-middle income Low and Lower-middle income
9
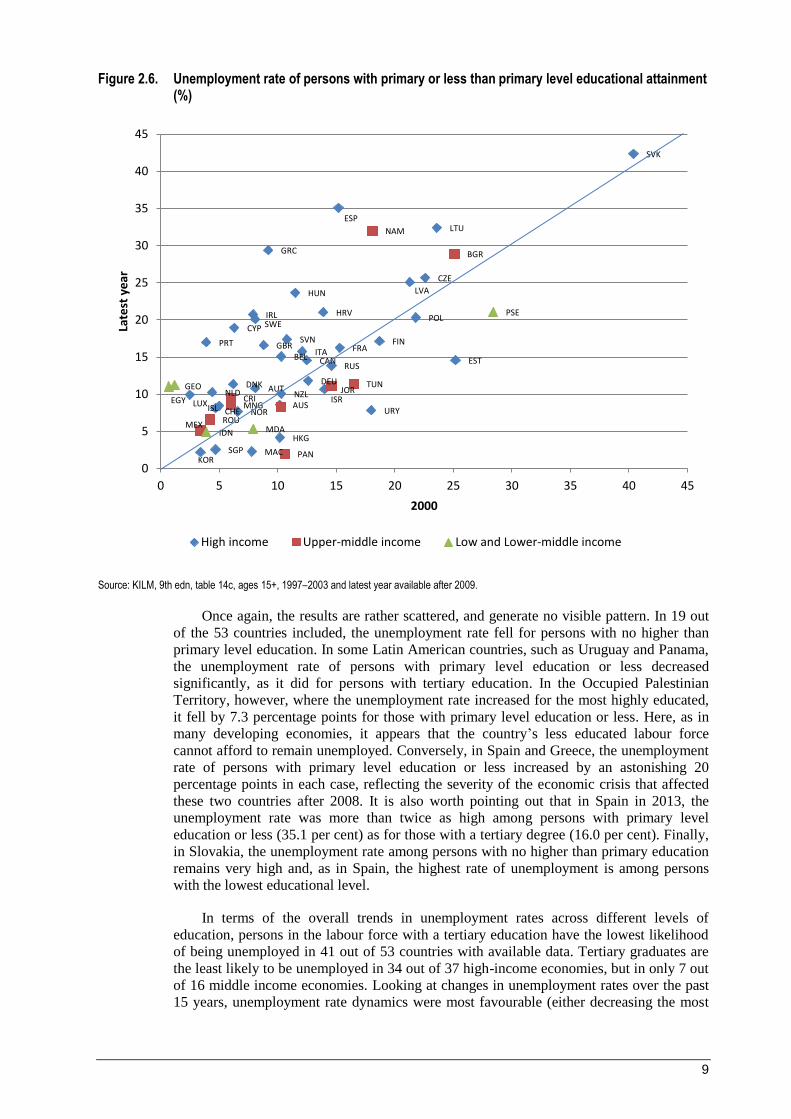
Figure 2.6. Unemployment rate of persons with primary or less than primary level educational attainment (%)
Source: KILM, 9th edn, table 14c, ages 15+, 1997–2003 and latest year available after 2009.
Once again, the results are rather scattered, and generate no visible pattern. In 19 out
of the 53 countries included, the unemployment rate fell for persons with no higher than
primary level education. In some Latin American countries, such as Uruguay and Panama,
the unemployment rate of persons with primary level education or less decreased
significantly, as it did for persons with tertiary education. In the Occupied Palestinian
Territory, however, where the unemployment rate increased for the most highly educated,
it fell by 7.3 percentage points for those with primary level education or less. Here, as in
many developing economies, it appears that the country’s less educated labour force
cannot afford to remain unemployed. Conversely, in Spain and Greece, the unemployment
rate of persons with primary level education or less increased by an astonishing 20
percentage points in each case, reflecting the severity of the economic crisis that affected
these two countries after 2008. It is also worth pointing out that in Spain in 2013, the
unemployment rate was more than twice as high among persons with primary level
education or less (35.1 per cent) as for those with a tertiary degree (16.0 per cent). Finally,
in Slovakia, the unemployment rate among persons with no higher than primary education
remains very high and, as in Spain, the highest rate of unemployment is among persons
with the lowest educational level.
In terms of the overall trends in unemployment rates across different levels of
education, persons in the labour force with a tertiary education have the lowest likelihood
of being unemployed in 41 out of 53 countries with available data. Tertiary graduates are
the least likely to be unemployed in 34 out of 37 high-income economies, but in only 7 out
of 16 middle income economies. Looking at changes in unemployment rates over the past
15 years, unemployment rate dynamics were most favourable (either decreasing the most
AUS
AUT
BEL CAN
CHE
CYP
CZE
DEU DNK
ESP
EST
FIN FRA GBR
GRC
HKG
HRV
HUN
IRL
ISL ISR
ITA
KOR
LTU
LUX
LVA
MAC
NLD
NOR
NZL
POL
PRT
RUS
SGP
SVK
SVN
SWE
URY
BGR
CRI JOR
MEX
MNG
NAM
PAN
ROU
TUN
EGY
GEO
IDN MDA
PSE
0
5
10
15
20
25
30
35
40
45
0 5 10 15 20 25 30 35 40 45
Late
st y
ear
2000
High income Upper-middle income Low and Lower-middle income
10
or increasing the least) among those with a tertiary education in 19 out of the 53 countries,
among those with secondary education in 24 out of 53 countries and among those with a
primary education in only 10 countries.
2.4. Share of youth not in education, employment or training (NEET)
Table 10c of the KILM presents data on the share of youth not in education,
employment or training (NEET). By its nature, this indicator represents a broader measure
of potential youth labour market entrants than either youth unemployment or youth
inactivity. In figure 2.7, this indicator is displayed for 2003 and for the latest year
available.
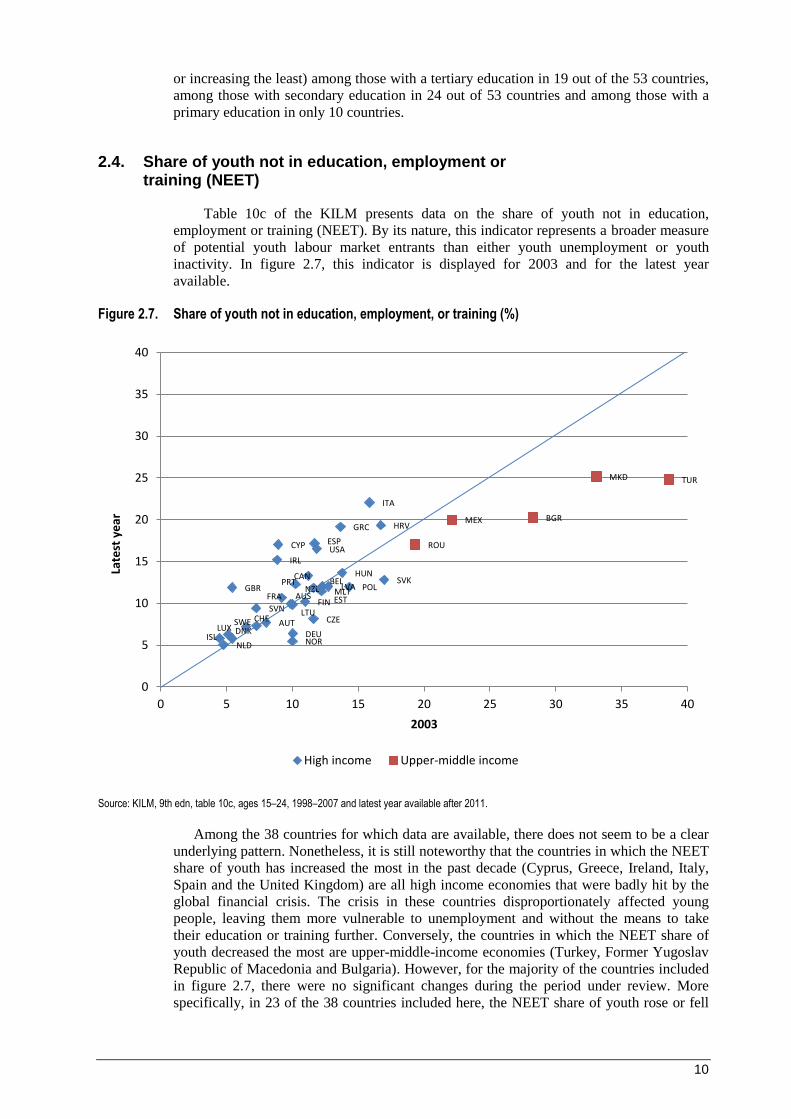
Figure 2.7. Share of youth not in education, employment, or training (%)
Source: KILM, 9th edn, table 10c, ages 15–24, 1998–2007 and latest year available after 2011.
Among the 38 countries for which data are available, there does not seem to be a clear
underlying pattern. Nonetheless, it is still noteworthy that the countries in which the NEET
share of youth has increased the most in the past decade (Cyprus, Greece, Ireland, Italy,
Spain and the United Kingdom) are all high income economies that were badly hit by the
global financial crisis. The crisis in these countries disproportionately affected young
people, leaving them more vulnerable to unemployment and without the means to take
their education or training further. Conversely, the countries in which the NEET share of
youth decreased the most are upper-middle-income economies (Turkey, Former Yugoslav
Republic of Macedonia and Bulgaria). However, for the majority of the countries included
in figure 2.7, there were no significant changes during the period under review. More
specifically, in 23 of the 38 countries included here, the NEET share of youth rose or fell
AUS
AUT
BEL CAN
CHE
CYP
CZE
DEU DNK
ESP
EST FIN FRA
GBR
GRC HRV
HUN
IRL
ISL
ITA
LTU
LUX
LVA MLT
NLD NOR
NZL POL PRT SVK
SVN
SWE
USA
BGR MEX
MKD
ROU
TUR
0
5
10
15
20
25
30
35
40
0 5 10 15 20 25 30 35 40
Late
st y
ear
2003
High income Upper-middle income

11
by less than 2.5 percentage points between 2003 (or the closest year available) and the
latest year available.
12
3. Impact of education on labour market outcomes
Having analysed trends over the past 10–15 years for the four KILM indicators
pertaining to education, with particular attention to the relationship between educational
attainment and labour market outcomes, we turn in this section to investigate whether there
are links between these indicators and other key labour market indicators, specifically
unemployment rates, labour productivity, the employment-to-population ratio and the
share of employees.
3.1. Unemployment and education
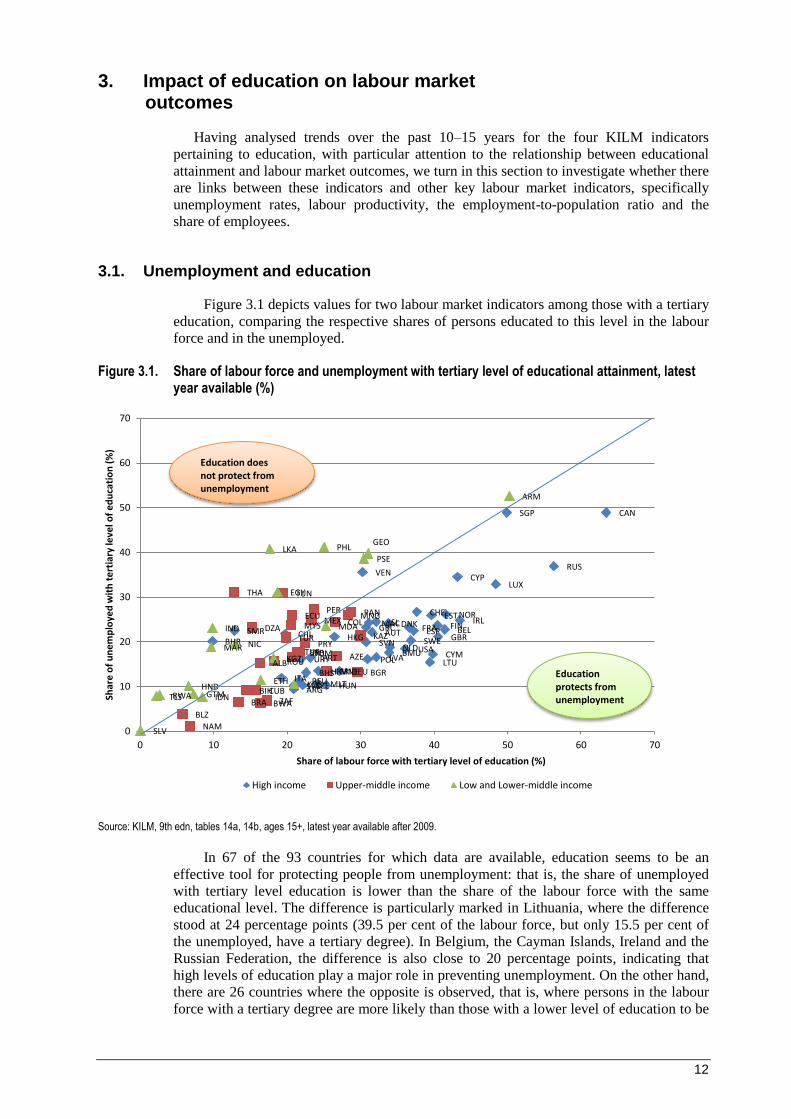
Figure 3.1 depicts values for two labour market indicators among those with a tertiary
education, comparing the respective shares of persons educated to this level in the labour
force and in the unemployed.
Figure 3.1. Share of labour force and unemployment with tertiary level of educational attainment, latest year available (%)
Source: KILM, 9th edn, tables 14a, 14b, ages 15+, latest year available after 2009.
In 67 of the 93 countries for which data are available, education seems to be an
effective tool for protecting people from unemployment: that is, the share of unemployed
with tertiary level education is lower than the share of the labour force with the same
educational level. The difference is particularly marked in Lithuania, where the difference
stood at 24 percentage points (39.5 per cent of the labour force, but only 15.5 per cent of
the unemployed, have a tertiary degree). In Belgium, the Cayman Islands, Ireland and the
Russian Federation, the difference is also close to 20 percentage points, indicating that
high levels of education play a major role in preventing unemployment. On the other hand,
there are 26 countries where the opposite is observed, that is, where persons in the labour
force with a tertiary degree are more likely than those with a lower level of education to be
BHR SMR
ITA
CHL
ARG SVK REU
URY
CZE
BHS
PRT
MLT
HRV
HUN
HKG
DEU
VEN
SVN
GRC
POL
MAC AUT ISL
LVA
DNK
BMU NLD USA
FRA
SWE ESP
CHE
LTU
EST
CYM
FIN GBR
BEL
NOR
CYP
IRL
LUX
SGP
RUS
CAN
BLZ
NAM
THA
BRA
BIH
DZA
CUB
ALB
BWA ZAF
ROU
TUN
TUR
MYS
TUR
ECU
SRB DOM PRY
MEX PER
CRI MNE
COL
AZE
MNG PAN
BGR
KAZ
SLV
TLS HND
GTM IDN
MAR
IND
NIC
LKA
KGZ
EGY
KOS
PHL
MDA
PSE
GEO
ARM
RWA
ETH
0
10
20
30
40
50
60
70
0 10 20 30 40 50 60 70
Shar
e o
f u
ne
mp
loye
d w
ith
te
rtia
ry le
vel o
f e
du
cati
on
(%
)
Share of labour force with tertiary level of education (%)
High income Upper-middle income Low and Lower-middle income
Education does not protect from unemployment
Education protects from unemployment
13
unemployed. This is especially the case in the Philippines, Sri Lanka and Thailand, where
the difference exceeds 15 percentage points. We also find considerable differences (over
10 percentage points) in Bahrain, Egypt, India and Tunisia.
An overview of the situation across countries in different income groups suggests that
higher levels of education tend to protect workers from unemployment in high income
economies. Among upper middle income economies the situation is more mixed, and in
low and lower middle income economies, people with high levels of education tend to be
more likely to be unemployed. In these developing economies, there is a clear bottleneck,
with skilled persons far outnumbering the available jobs matching their competencies and
expectations. When studying these trends in unemployment, it is crucial to take into
account the national context in terms of unemployment insurance policies. In contexts
where these are limited or do not exist, unemployment might not be seen as an option
(ILO, 2016- forthcoming). Other possible explanations for the pattern observed in low and
lower middle income economies include family income being significant enough for those
that have higher education to remain unemployed while they look for a job that fully meets
their expectations.
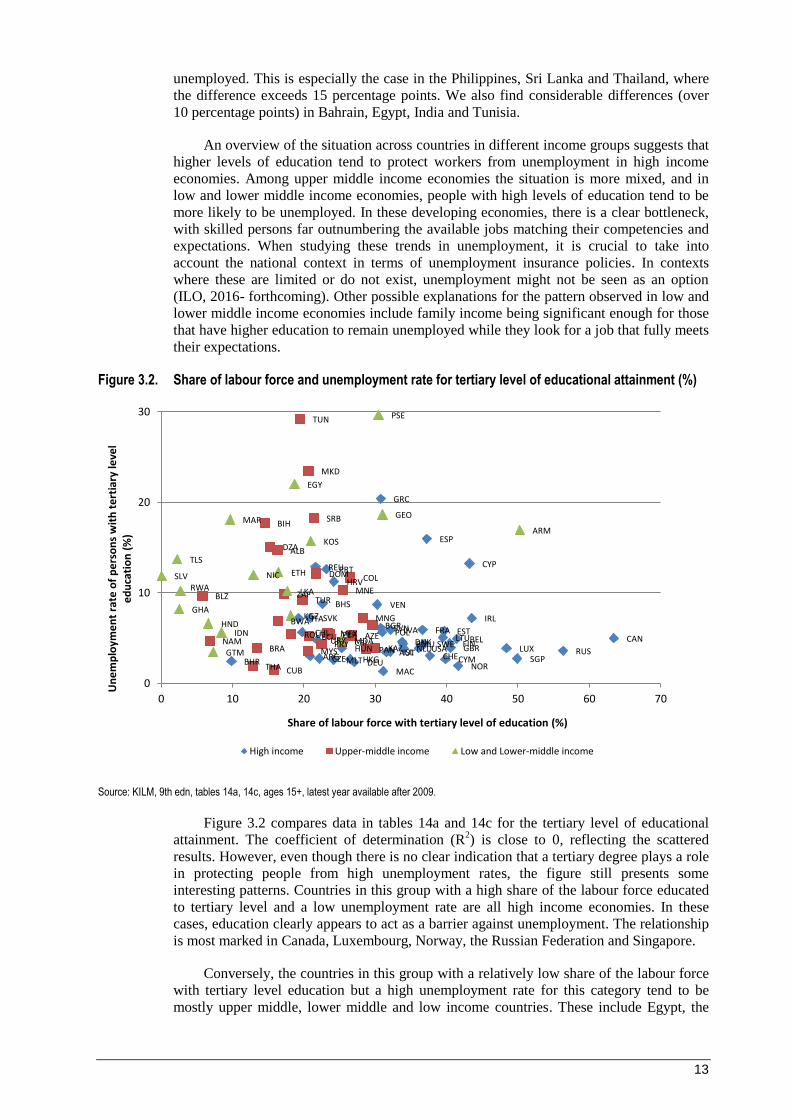
Figure 3.2. Share of labour force and unemployment rate for tertiary level of educational attainment (%)
Source: KILM, 9th edn, tables 14a, 14c, ages 15+, latest year available after 2009.
Figure 3.2 compares data in tables 14a and 14c for the tertiary level of educational
attainment. The coefficient of determination (R2) is close to 0, reflecting the scattered
results. However, even though there is no clear indication that a tertiary degree plays a role
in protecting people from high unemployment rates, the figure still presents some
interesting patterns. Countries in this group with a high share of the labour force educated
to tertiary level and a low unemployment rate are all high income economies. In these
cases, education clearly appears to act as a barrier against unemployment. The relationship
is most marked in Canada, Luxembourg, Norway, the Russian Federation and Singapore.
Conversely, the countries in this group with a relatively low share of the labour force
with tertiary level education but a high unemployment rate for this category tend to be
mostly upper middle, lower middle and low income countries. These include Egypt, the
BHR
ITA
CHL
ARG
SVK
REU
URY
CZE
BHS
PRT
MLT
HRV
HUN HKG DEU
VEN
SVN
GRC
POL
MAC
AUT ISL
LVA
DNK BMU NLD USA
FRA
SWE
ESP
CHE
LTU EST
CYM
FIN GBR BEL
NOR
CYP
IRL
LUX SGP
RUS
CAN
BLZ
NAM
THA
BRA
BIH
DZA
CUB
ALB
BWA
ZAF
ROU
TUN
TUR
MYS
MKD
ECU
SRB
DOM
PRY MEX PER
CRI
MNE
COL
AZE
MNG
PAN
BGR
KAZ
SLV
TLS
GHA
HND
GTM
IDN
MAR
NIC
LKA
KGZ
EGY
KOS
MDA
PSE
GEO
ARM
RWA
ETH
0
10
20
30
0 10 20 30 40 50 60 70
Un
em
plo
yme
nt
rate
of
pe
rso
ns
wit
h t
ert
iary
leve
l e
du
cati
on
(%
)
Share of labour force with tertiary level of education (%)
High income Upper-middle income Low and Lower-middle income
14
Former Yugoslav Republic of Macedonia, Greece, Tunisia and the Occupied Palestinian
Territory. This may seem surprising, since in these countries the tertiary educated labour
force is not very large and it might therefore be expected that these highly educated people
would easily find skilled jobs. However, in these countries there are still too few
employment opportunities for them, either because the labour market is in a crisis (Former
Yugoslav Republic of Macedonia, Greece) or because skilled jobs are lacking, revealing a
skills mismatch situation (Egypt, Occupied Palestinian Territory, Tunisia).
3.2. Labour productivity and education
This section presents information on the relationship between labour productivity
(table 16a) for the aggregate economy and tertiary education. Labour productivity, which
we define here as output per person employed, measures the efficiency with which inputs
are used in an economy to produce goods and services; it offers an indication of both
competitiveness and living standards within a country. In figure 3.3, we look at the
relationship between tertiary level educational attainment and labour productivity.
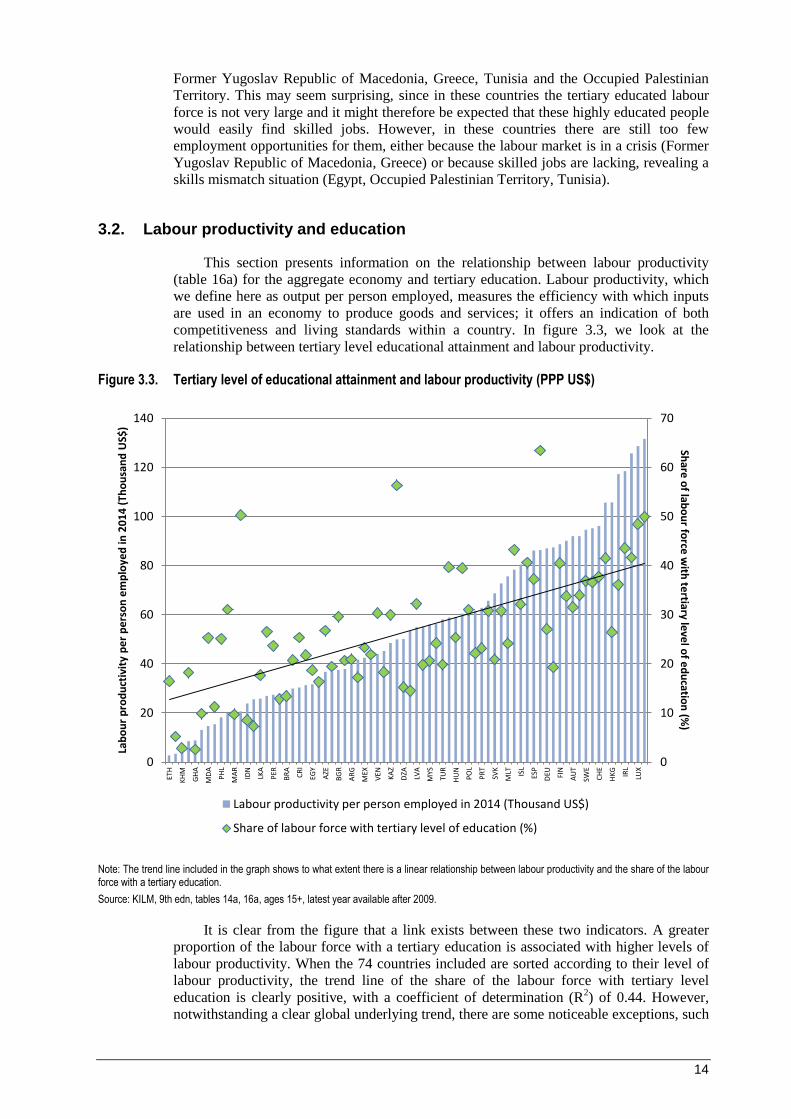
Figure 3.3. Tertiary level of educational attainment and labour productivity (PPP US$)
Note: The trend line included in the graph shows to what extent there is a linear relationship between labour productivity and the share of the labour force with a tertiary education.
Source: KILM, 9th edn, tables 14a, 16a, ages 15+, latest year available after 2009.
It is clear from the figure that a link exists between these two indicators. A greater
proportion of the labour force with a tertiary education is associated with higher levels of
labour productivity. When the 74 countries included are sorted according to their level of
labour productivity, the trend line of the share of the labour force with tertiary level
education is clearly positive, with a coefficient of determination (R2) of 0.44. However,
notwithstanding a clear global underlying trend, there are some noticeable exceptions, such
0
10
20
30
40
50
60
70
0
20
40
60
80
100
120
140
ETH
KH
M
GH
A
MD
A
PH
L
MA
R
IDN
LKA
PER
BR
A
CR
I
EGY
AZE
BG
R
AR
G
MEX
VEN KA
Z
DZA
LVA
MYS
TUR
HU
N
PO
L
PR
T
SVK
MLT IS
L
ESP
DEU FI
N
AU
T
SWE
CH
E
HK
G
IRL
LUX
Share
of lab
ou
r force
with
tertiary le
vel o
f ed
ucatio
n (%
)
Lab
ou
r p
rod
uct
ivit
y p
er
pe
rso
n e
mp
loye
d in
20
14
(Th
ou
san
d U
S$)
Labour productivity per person employed in 2014 (Thousand US$)
Share of labour force with tertiary level of education (%)
15
as Armenia, Canada and the Russian Federation, where the share of the labour force with
tertiary level education appears to be much higher than would be expected, given the
corresponding levels of labour productivity.
3.3. Employment-to-population ratio and education
Table 2b of the KILM presents data on employment-to-population ratios based on
national estimates. The employment-to-population ratio is defined as the proportion of a
country’s working-age population that is employed. A high ratio means that a large
proportion of a country’s working-age population is employed, while a low ratio means
that a large share of the working-age population is not involved directly in labour market
related activities, either because they are unemployed or (more likely) because they are not
in the labour force. In figure 3.4, this indicator is shown together with the share of the
labour force educated to tertiary level.
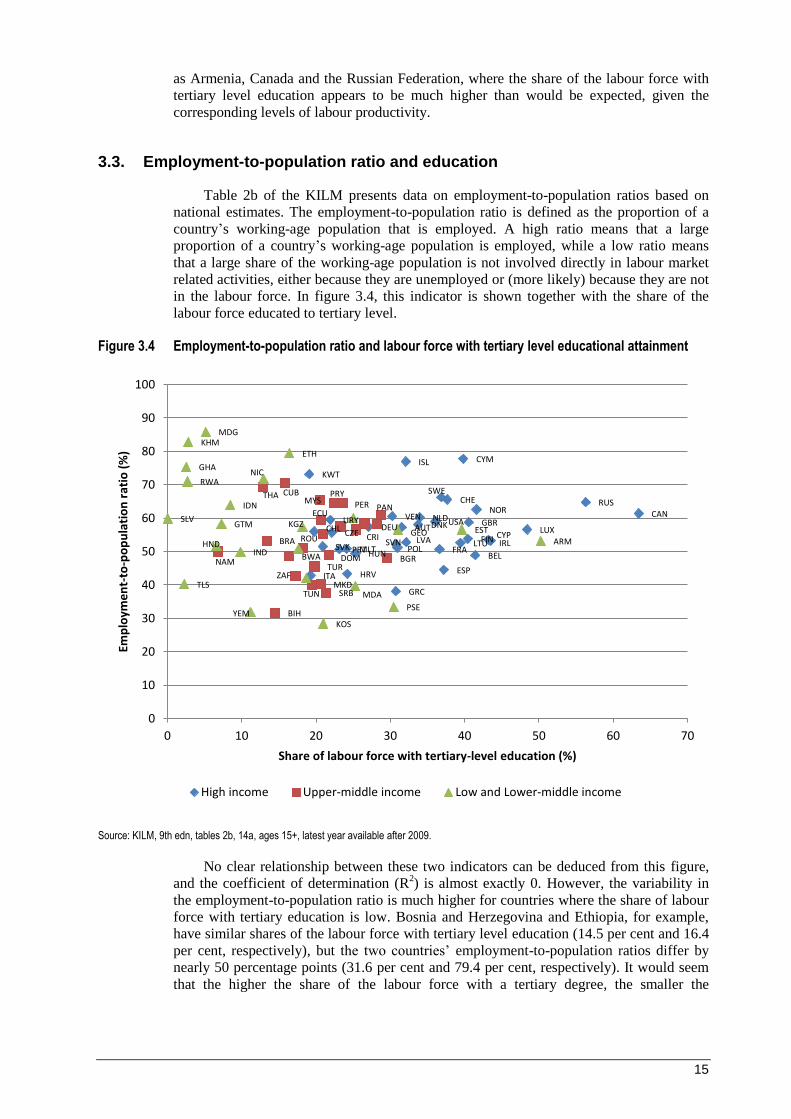
Figure 3.4 Employment-to-population ratio and labour force with tertiary level educational attainment
Source: KILM, 9th edn, tables 2b, 14a, ages 15+, latest year available after 2009.
No clear relationship between these two indicators can be deduced from this figure,
and the coefficient of determination (R2) is almost exactly 0. However, the variability in
the employment-to-population ratio is much higher for countries where the share of labour
force with tertiary education is low. Bosnia and Herzegovina and Ethiopia, for example,
have similar shares of the labour force with tertiary level education (14.5 per cent and 16.4
per cent, respectively), but the two countries’ employment-to-population ratios differ by
nearly 50 percentage points (31.6 per cent and 79.4 per cent, respectively). It would seem
that the higher the share of the labour force with a tertiary degree, the smaller the
AUT
BEL
CAN
CHE
CHL
CYM
CYP CZE DEU DNK
ESP
FIN FRA
GBR
GRC
HRV
HUN IRL
ISL
ITA
KWT
LTU
LUX LVA
MLT
NLD NOR
POL PRT
RUS
SVK SVN
SWE
URY USA VEN
BGR
BIH
BRA
BWA
CRI
CUB
DOM
ECU
MKD
MYS
NAM
PAN PER PRY
ROU
SRB
THA
TUN
TUR ZAF
ARM GEO
GHA
GTM
HND
IDN
IND
KGZ
KOS
MDA
NIC
PSE
SLV
TLS
YEM
EST
ETH KHM
MDG
RWA
0
10
20
30
40
50
60
70
80
90
100
0 10 20 30 40 50 60 70
Emp
loym
en
t-to
-po
pu
lati
on
rat
io (
%)
Share of labour force with tertiary-level education (%)
High income Upper-middle income Low and Lower-middle income
16
variability: whenever this share exceeds 45 per cent, the employment-to-population ratio
falls within the range 45–65 per cent.
3.4. Share of employees and education
Table 3 of the KILM presents data on employment by status in employment,
according to the categories set out in the 1993 International Classification by Status in
Employment (ICSE). We focus here on “employees”, the category of status in employment
that typically benefits from the highest levels of income and job security in the labour
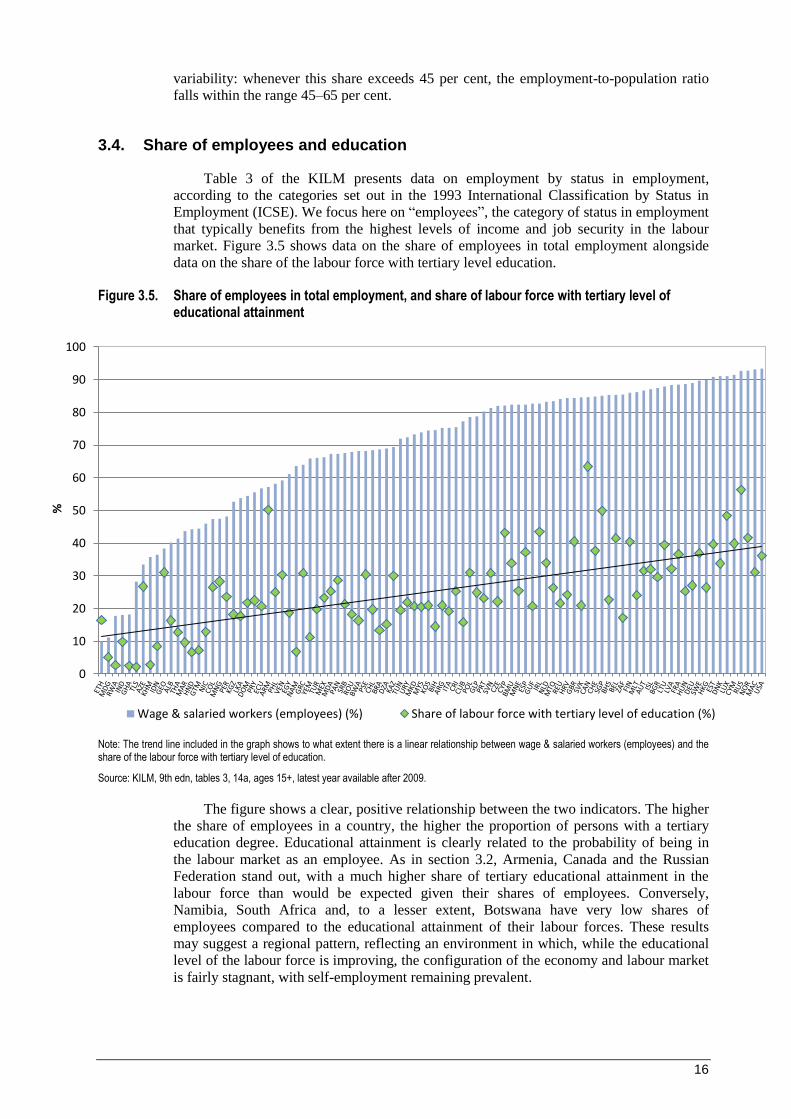
market. Figure 3.5 shows data on the share of employees in total employment alongside
data on the share of the labour force with tertiary level education.
Figure 3.5. Share of employees in total employment, and share of labour force with tertiary level of educational attainment
Note: The trend line included in the graph shows to what extent there is a linear relationship between wage & salaried workers (employees) and the share of the labour force with tertiary level of education.
Source: KILM, 9th edn, tables 3, 14a, ages 15+, latest year available after 2009.
The figure shows a clear, positive relationship between the two indicators. The higher
the share of employees in a country, the higher the proportion of persons with a tertiary
education degree. Educational attainment is clearly related to the probability of being in
the labour market as an employee. As in section 3.2, Armenia, Canada and the Russian
Federation stand out, with a much higher share of tertiary educational attainment in the
labour force than would be expected given their shares of employees. Conversely,
Namibia, South Africa and, to a lesser extent, Botswana have very low shares of
employees compared to the educational attainment of their labour forces. These results
may suggest a regional pattern, reflecting an environment in which, while the educational
level of the labour force is improving, the configuration of the economy and labour market
is fairly stagnant, with self-employment remaining prevalent.
0
10
20
30
40
50
60
70
80
90
100
%
Wage & salaried workers (employees) (%) Share of labour force with tertiary level of education (%)
17
This section of the chapter has explored the links between education and several key
labour indicators. The findings comparing educational attainment with labour productivity
and share of employees suggest a clear link between the educational level achieved within
a labour force and labour market outcomes. However, the link cannot be established with
equal confidence for all the labour market indicators studied. In particular, the
employment-to-population ratio appears to be completely independent of variations in
educational attainment.
18
4. The current situation in 12 selected countries
4.1 Data for latest year available on the four selected indicators
In the previous section the analysis incorporated all countries for which recent data
are available. In this section, we look in greater detail at the current situation in a selection
of 12 countries covering all levels of development. Table 4.1 lists the 12 countries, along
with selected labour market data and income group for each.
Table 4.1. Key information for selected countries Country Working-age
population (000s, aged 15+)
Employment-to-population ratio (%)
Unemployment rate (%)
World Bank income group
Canada 29 952 61.4 6.9 High income
Germany 71 875 57.4 5.0 High income
Algeria 29 100 36.2 9.8 Upper middle income
Brazil 157 000 64.0 4.8 Upper middle income
Mexico 90 875 56.9 4.8 Upper middle income
Thailand 55 636 69.4 0.8 Upper middle income
Egypt 58 572 42.1 13.2 Lower middle income
El Salvador 4 572 59.9 5.9 Lower middle income
Kyrgyzstan 3 942 57.2 8.3 Lower middle income
Philippines 67 814 60.0 6.8 Lower middle income
Cambodia 10 811 82.8 0.3 Low income
Ethiopia 57 948 79.4 4.5 Low income
Sources: World Bank, ILOSTAT, KILM, 9th edn, latest year available.
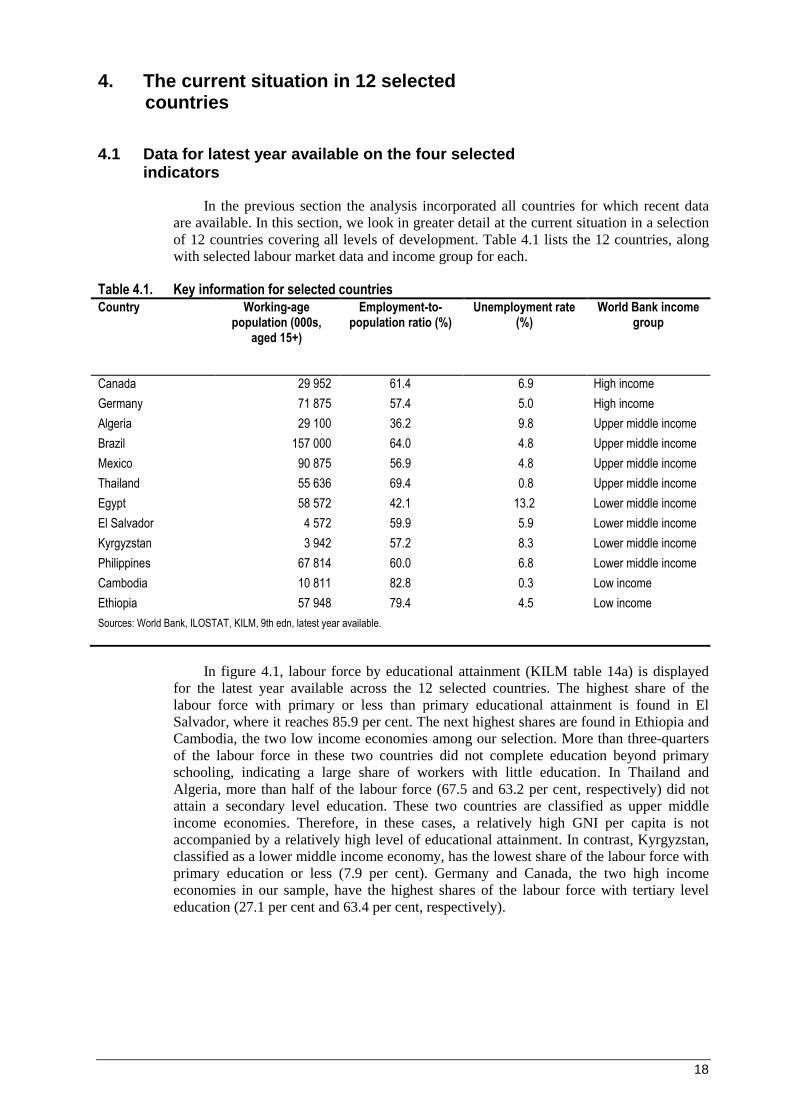
In figure 4.1, labour force by educational attainment (KILM table 14a) is displayed
for the latest year available across the 12 selected countries. The highest share of the
labour force with primary or less than primary educational attainment is found in El
Salvador, where it reaches 85.9 per cent. The next highest shares are found in Ethiopia and
Cambodia, the two low income economies among our selection. More than three-quarters
of the labour force in these two countries did not complete education beyond primary
schooling, indicating a large share of workers with little education. In Thailand and
Algeria, more than half of the labour force (67.5 and 63.2 per cent, respectively) did not
attain a secondary level education. These two countries are classified as upper middle
income economies. Therefore, in these cases, a relatively high GNI per capita is not
accompanied by a relatively high level of educational attainment. In contrast, Kyrgyzstan,
classified as a lower middle income economy, has the lowest share of the labour force with
primary education or less (7.9 per cent). Germany and Canada, the two high income
economies in our sample, have the highest shares of the labour force with tertiary level
education (27.1 per cent and 63.4 per cent, respectively).
19
Figure 4.1. Labour force by level of educational attainment
Source: KILM, 9th edn, table 14a, ages 15+, latest year available.
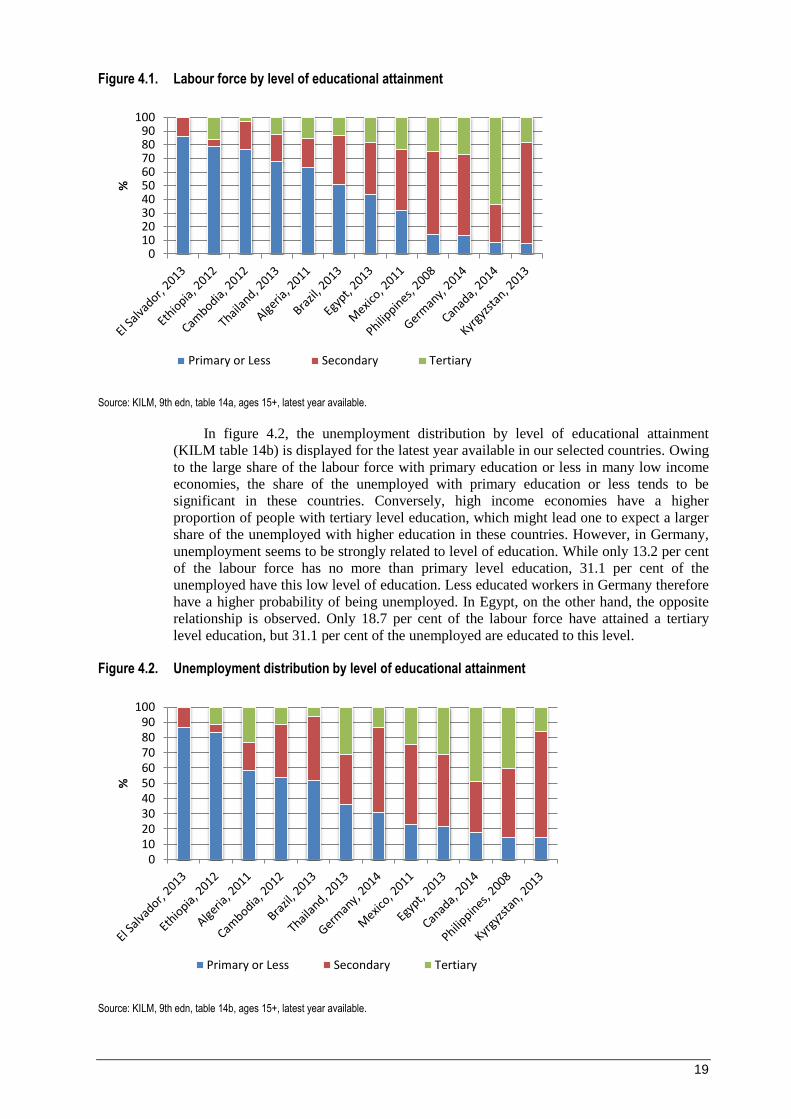
In figure 4.2, the unemployment distribution by level of educational attainment
(KILM table 14b) is displayed for the latest year available in our selected countries. Owing
to the large share of the labour force with primary education or less in many low income
economies, the share of the unemployed with primary education or less tends to be
significant in these countries. Conversely, high income economies have a higher
proportion of people with tertiary level education, which might lead one to expect a larger
share of the unemployed with higher education in these countries. However, in Germany,
unemployment seems to be strongly related to level of education. While only 13.2 per cent
of the labour force has no more than primary level education, 31.1 per cent of the
unemployed have this low level of education. Less educated workers in Germany therefore
have a higher probability of being unemployed. In Egypt, on the other hand, the opposite
relationship is observed. Only 18.7 per cent of the labour force have attained a tertiary
level education, but 31.1 per cent of the unemployed are educated to this level.
Figure 4.2. Unemployment distribution by level of educational attainment
Source: KILM, 9th edn, table 14b, ages 15+, latest year available.
0102030405060708090
100%
Primary or Less Secondary Tertiary
0102030405060708090
100
%
Primary or Less Secondary Tertiary
20
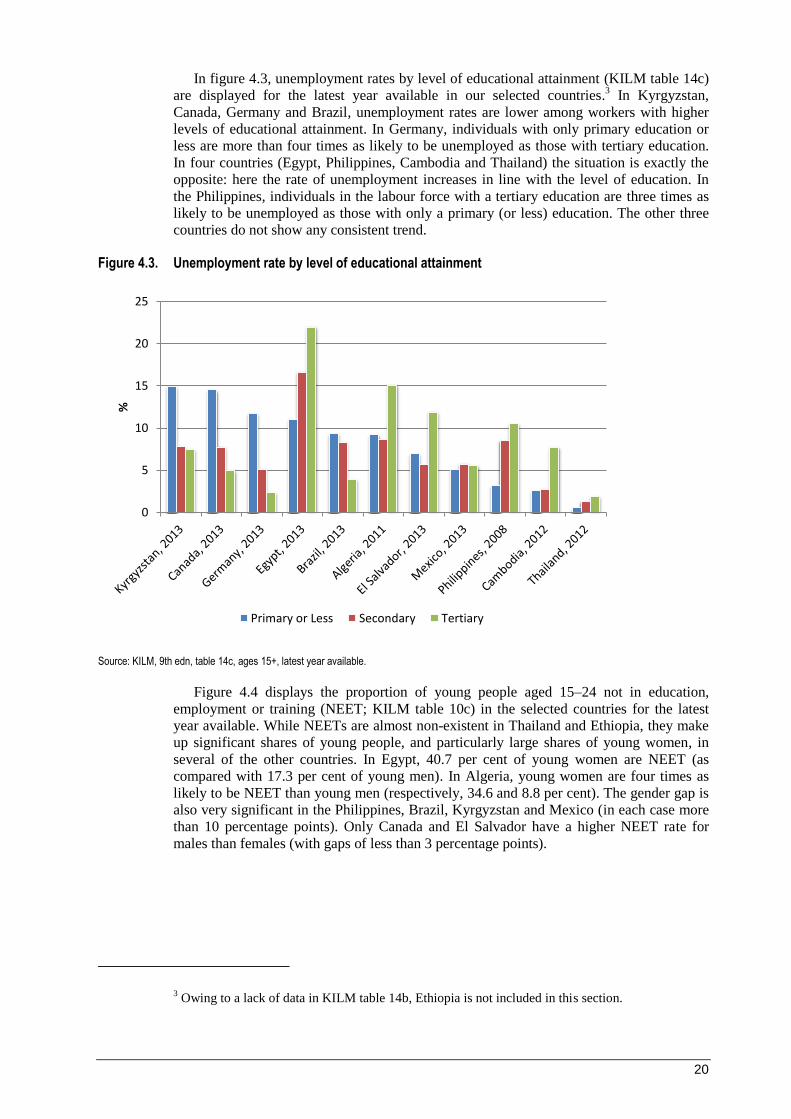
In figure 4.3, unemployment rates by level of educational attainment (KILM table 14c)
are displayed for the latest year available in our selected countries.3 In Kyrgyzstan,
Canada, Germany and Brazil, unemployment rates are lower among workers with higher
levels of educational attainment. In Germany, individuals with only primary education or
less are more than four times as likely to be unemployed as those with tertiary education.
In four countries (Egypt, Philippines, Cambodia and Thailand) the situation is exactly the
opposite: here the rate of unemployment increases in line with the level of education. In
the Philippines, individuals in the labour force with a tertiary education are three times as
likely to be unemployed as those with only a primary (or less) education. The other three
countries do not show any consistent trend.
Figure 4.3. Unemployment rate by level of educational attainment
Source: KILM, 9th edn, table 14c, ages 15+, latest year available.
Figure 4.4 displays the proportion of young people aged 15–24 not in education,
employment or training (NEET; KILM table 10c) in the selected countries for the latest
year available. While NEETs are almost non-existent in Thailand and Ethiopia, they make
up significant shares of young people, and particularly large shares of young women, in
several of the other countries. In Egypt, 40.7 per cent of young women are NEET (as
compared with 17.3 per cent of young men). In Algeria, young women are four times as
likely to be NEET than young men (respectively, 34.6 and 8.8 per cent). The gender gap is
also very significant in the Philippines, Brazil, Kyrgyzstan and Mexico (in each case more
than 10 percentage points). Only Canada and El Salvador have a higher NEET rate for
males than females (with gaps of less than 3 percentage points).
3 Owing to a lack of data in KILM table 14b, Ethiopia is not included in this section.
0
5
10
15
20
25
%
Primary or Less Secondary Tertiary
21
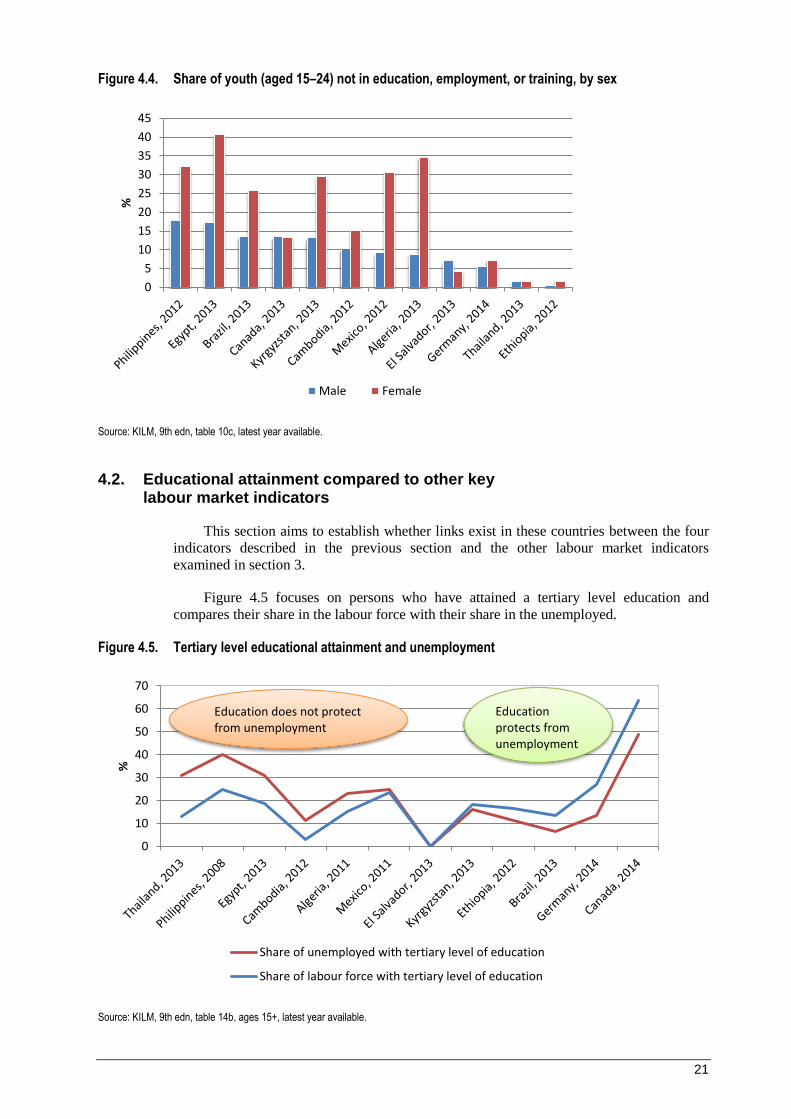
Figure 4.4. Share of youth (aged 15–24) not in education, employment, or training, by sex
Source: KILM, 9th edn, table 10c, latest year available.
4.2. Educational attainment compared to other key labour market indicators
This section aims to establish whether links exist in these countries between the four
indicators described in the previous section and the other labour market indicators
examined in section 3.
Figure 4.5 focuses on persons who have attained a tertiary level education and
compares their share in the labour force with their share in the unemployed.
Figure 4.5. Tertiary level educational attainment and unemployment
Source: KILM, 9th edn, table 14b, ages 15+, latest year available.
0
5
10
15
20
25
30
35
40
45%
Male Female
0
10
20
30
40
50
60
70
%
Share of unemployed with tertiary level of education
Share of labour force with tertiary level of education
Education does not protect from unemployment
Education protects from unemployment
22
In only five of our sample of countries is the share of unemployed with a tertiary
degree actually lower than the share of persons in the labour force with a tertiary degree.
Moreover, only in Canada and Germany is the difference significant (greater than 10
percentage points). In Canada, 63.4 per cent of the labour force but only 48.9 per cent of
the unemployed have a tertiary degree. Thus in Canada (and in Germany) investing in
one’s education can be seen as a means of reducing the probability of becoming
unemployed. On the other hand, seven countries show the opposite result, with tertiary
graduates comprising a disproportionately large share of the unemployed. The largest
relative disadvantage among tertiary graduates is observed in Egypt, the Philippines and
Thailand. In Thailand, only 12.8 per cent of the labour force but 31 per cent of the
unemployed have a tertiary degree. This indicates a bottleneck, with too many skilled
persons for the number of available jobs matching their competencies and expectations. In
Thailand, the overall unemployment rate remains very low, but in Egypt and Philippines,
those with a tertiary degree often have difficulty finding jobs matching their level of
education.
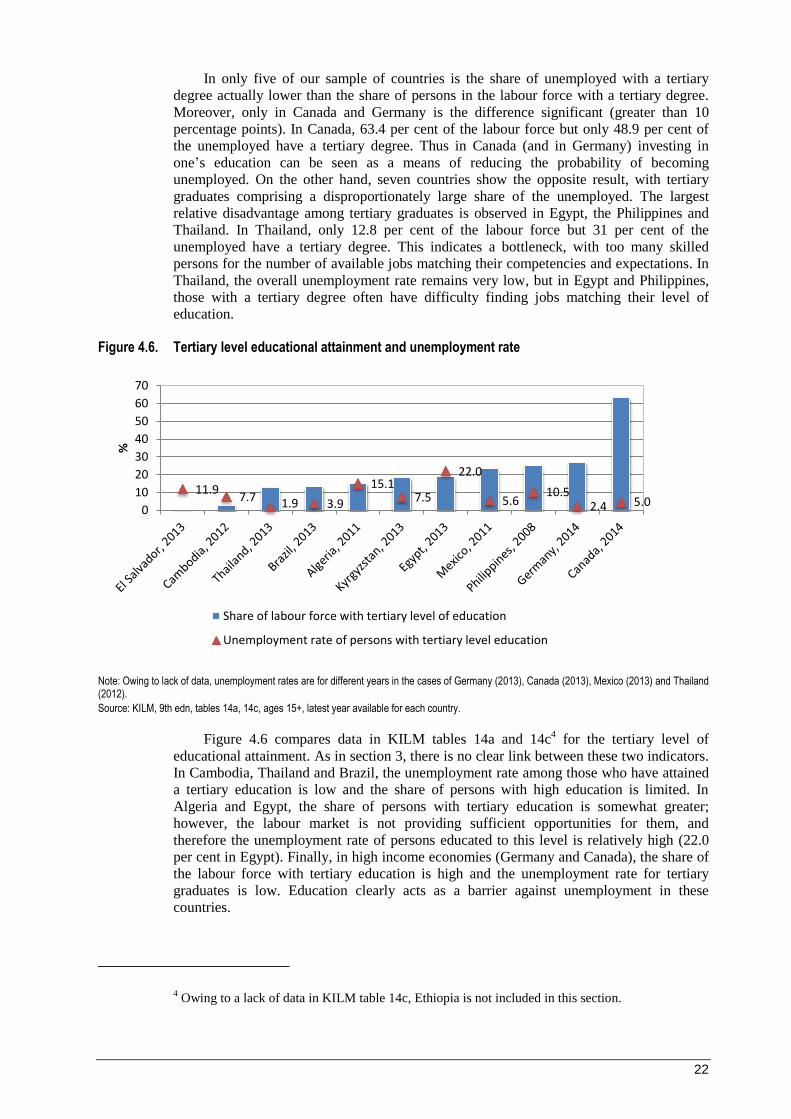
Figure 4.6. Tertiary level educational attainment and unemployment rate
Note: Owing to lack of data, unemployment rates are for different years in the cases of Germany (2013), Canada (2013), Mexico (2013) and Thailand (2012).
Source: KILM, 9th edn, tables 14a, 14c, ages 15+, latest year available for each country.
Figure 4.6 compares data in KILM tables 14a and 14c4 for the tertiary level of
educational attainment. As in section 3, there is no clear link between these two indicators.
In Cambodia, Thailand and Brazil, the unemployment rate among those who have attained
a tertiary education is low and the share of persons with high education is limited. In
Algeria and Egypt, the share of persons with tertiary education is somewhat greater;
however, the labour market is not providing sufficient opportunities for them, and
therefore the unemployment rate of persons educated to this level is relatively high (22.0
per cent in Egypt). Finally, in high income economies (Germany and Canada), the share of
the labour force with tertiary education is high and the unemployment rate for tertiary
graduates is low. Education clearly acts as a barrier against unemployment in these
countries.
4 Owing to a lack of data in KILM table 14c, Ethiopia is not included in this section.
11.9 7.7 1.9 3.9
15.1 7.5
22.0
5.6 10.5
2.4 5.0 0
10
20
30
40
50
60
70
%
Share of labour force with tertiary level of education
Unemployment rate of persons with tertiary level education
23
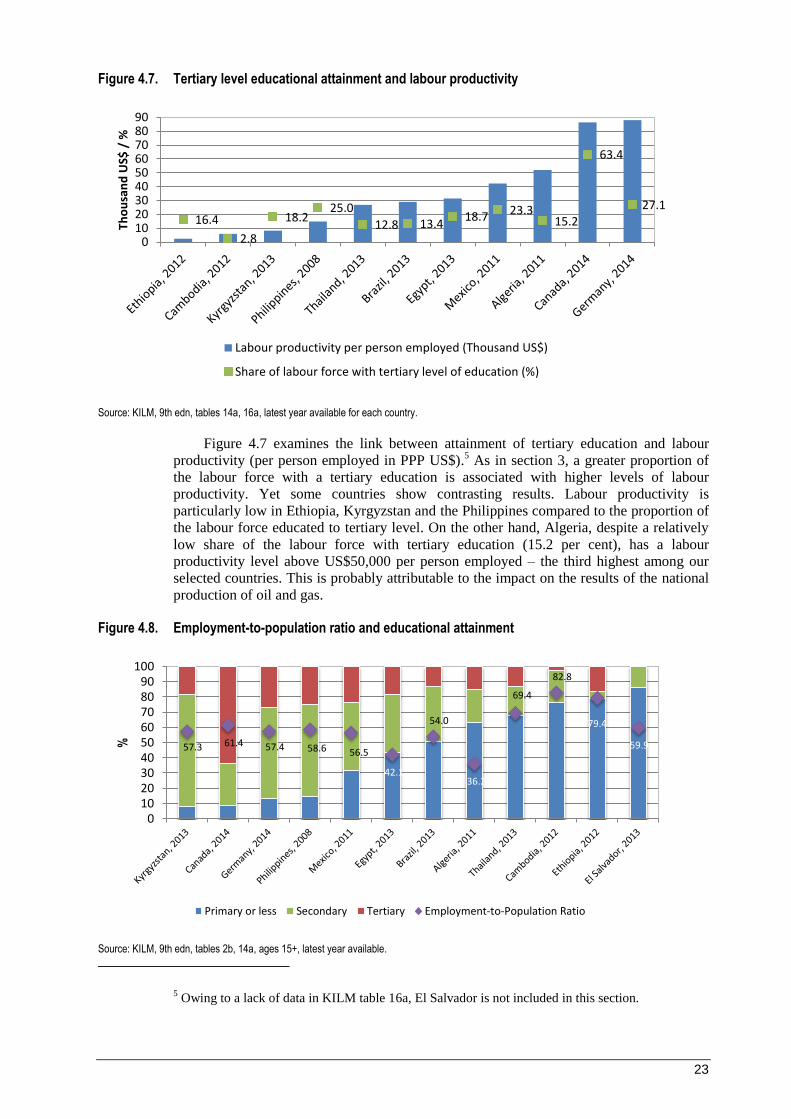
Figure 4.7. Tertiary level educational attainment and labour productivity
Source: KILM, 9th edn, tables 14a, 16a, latest year available for each country.
Figure 4.7 examines the link between attainment of tertiary education and labour
productivity (per person employed in PPP US$).5 As in section 3, a greater proportion of
the labour force with a tertiary education is associated with higher levels of labour
productivity. Yet some countries show contrasting results. Labour productivity is
particularly low in Ethiopia, Kyrgyzstan and the Philippines compared to the proportion of
the labour force educated to tertiary level. On the other hand, Algeria, despite a relatively
low share of the labour force with tertiary education (15.2 per cent), has a labour
productivity level above US$50,000 per person employed – the third highest among our
selected countries. This is probably attributable to the impact on the results of the national
production of oil and gas.
Figure 4.8. Employment-to-population ratio and educational attainment
Source: KILM, 9th edn, tables 2b, 14a, ages 15+, latest year available.
5 Owing to a lack of data in KILM table 16a, El Salvador is not included in this section.
16.4
2.8
18.2 25.0
12.8 13.4 18.7 23.3
15.2
63.4
27.1
0102030405060708090
Tho
usa
nd
US$
/ %
Labour productivity per person employed (Thousand US$)
Share of labour force with tertiary level of education (%)
57.3 61.4 57.4 58.6 56.5
42.1
54.0
36.2
69.4
82.8
79.4
59.9
0102030405060708090
100
%
Primary or less Secondary Tertiary Employment-to-Population Ratio
24
In figure 4.8, the employment-to-population ratio is displayed together with a
breakdown of educational attainment in the 12 selected countries. As in section 3, the data
do not show a clear relationship between educational attainment and employment-to-
population ratio. Countries with the lowest shares of primary or less educational attainment
(Kyrgyzstan, Canada, Germany, Philippines and Mexico) all have employment-to-
population ratios between 50 and 60 per cent. Among countries with lower average
educational attainment, there is a wide range of employment-to-population ratios, from
Egypt (42.1 per cent) and Algeria (36.2 per cent) to Thailand (69.4 per cent), Cambodia
(82.8 per cent) and Ethiopia (79.4 per cent). El Salvador has an employment-to-population
ratio of 59.9 per cent, similar to those of Canada and the Philippines, despite having a very
different structure of educational attainment. These data show no obvious pattern that
could establish a link between levels of education and employment-to-population ratios.
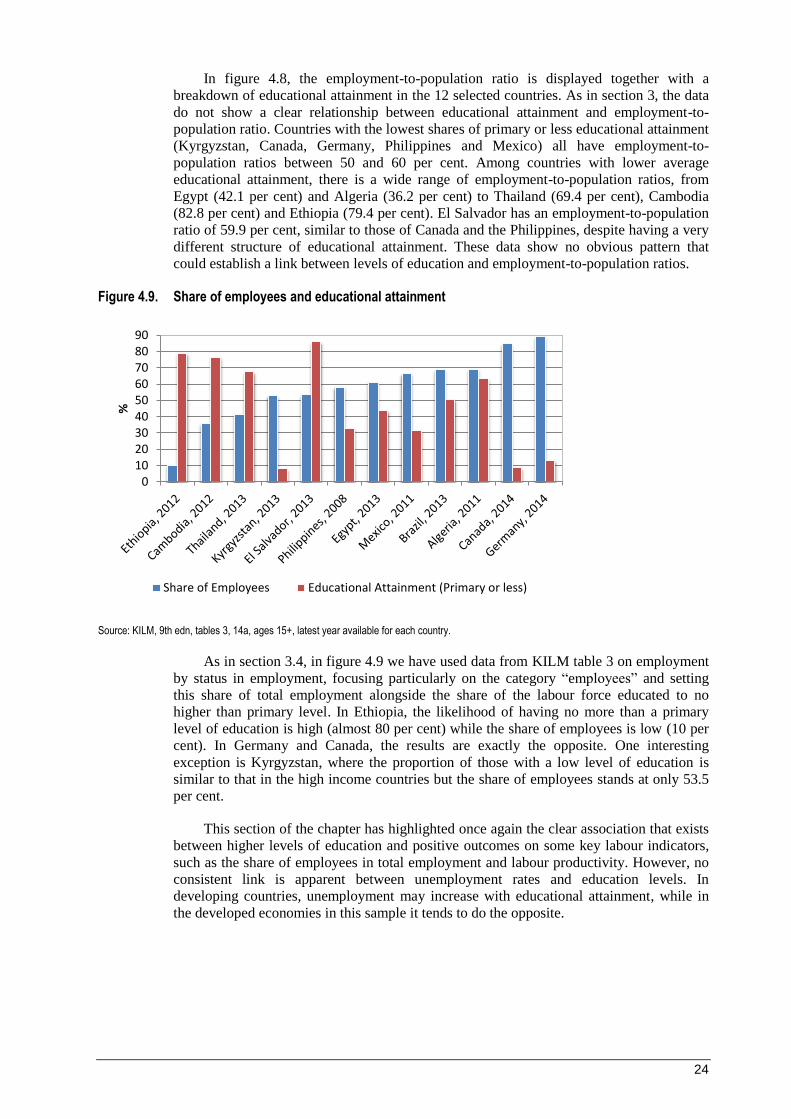
Figure 4.9. Share of employees and educational attainment
Source: KILM, 9th edn, tables 3, 14a, ages 15+, latest year available for each country.
As in section 3.4, in figure 4.9 we have used data from KILM table 3 on employment
by status in employment, focusing particularly on the category “employees” and setting
this share of total employment alongside the share of the labour force educated to no
higher than primary level. In Ethiopia, the likelihood of having no more than a primary
level of education is high (almost 80 per cent) while the share of employees is low (10 per
cent). In Germany and Canada, the results are exactly the opposite. One interesting
exception is Kyrgyzstan, where the proportion of those with a low level of education is
similar to that in the high income countries but the share of employees stands at only 53.5
per cent.
This section of the chapter has highlighted once again the clear association that exists
between higher levels of education and positive outcomes on some key labour indicators,
such as the share of employees in total employment and labour productivity. However, no
consistent link is apparent between unemployment rates and education levels. In
developing countries, unemployment may increase with educational attainment, while in
the developed economies in this sample it tends to do the opposite.
0102030405060708090
%
Share of Employees Educational Attainment (Primary or less)
25
4.3. Remaining gaps in education
The study of the educational patterns of the labour force in these 12 selected countries
reveals that there are still some gaps that remain to be addressed, particularly in developing
economies. Here we will present the main areas for improvement.
4.3.1. Persistent low levels of educational attainment
There are still a considerable number of countries where a significant share of the
labour force is educated to no higher than primary level. The six countries in our sample
with the highest share of the labour force having only primary education or less (El
Salvador, Ethiopia, Cambodia, Thailand, Algeria and Brazil) are all low or middle income
economies. More specifically, in El Salvador, Ethiopia, Cambodia, Thailand and Algeria,
the percentage of the labour force educated to primary level or below is well over 60 per
cent. This shows that there is still much to be done to increase general levels of educational
attainment in low and middle income economies, including to improve access to higher
quality employment.
4.3.2. Disparities between population groups
Research shows (UNESCO, 2015a, b) that there are still strong disparities in
educational attainment and in returns to education not only between countries with
different levels of income and development, but also between different population groups
within countries. Of particular concern is the persistence of vulnerable groups for whom
access to quality education is very difficult.
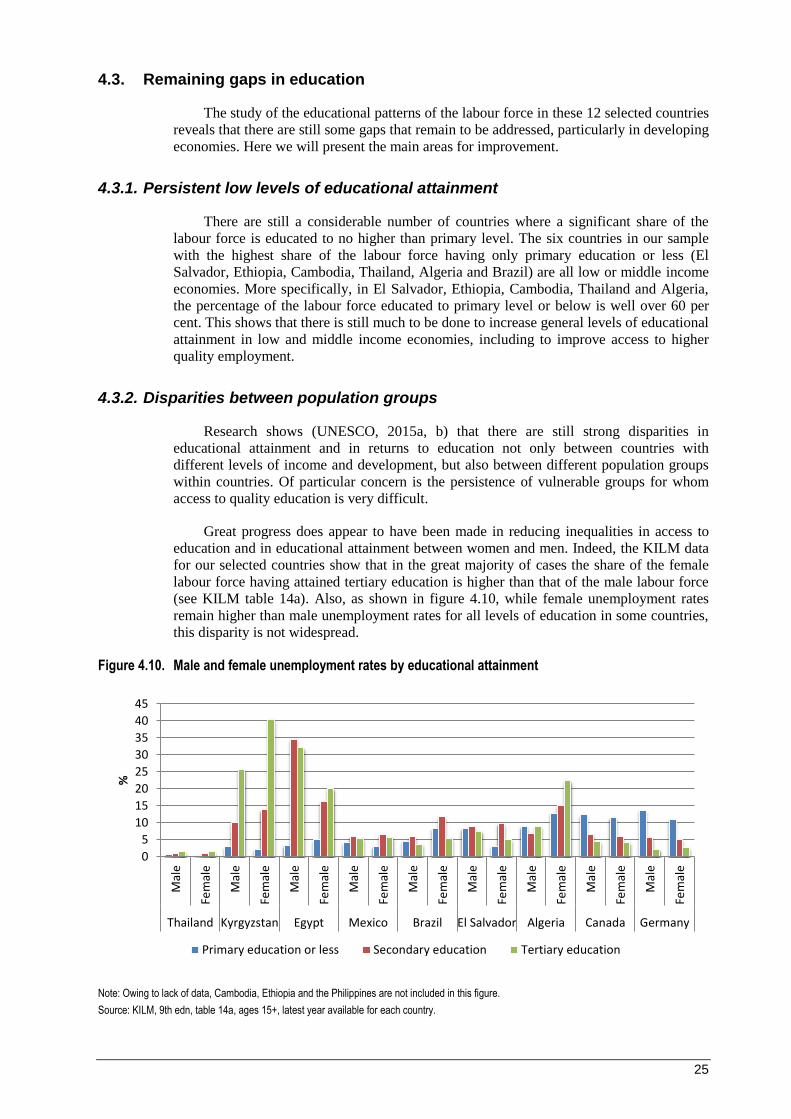
Great progress does appear to have been made in reducing inequalities in access to
education and in educational attainment between women and men. Indeed, the KILM data
for our selected countries show that in the great majority of cases the share of the female
labour force having attained tertiary education is higher than that of the male labour force
(see KILM table 14a). Also, as shown in figure 4.10, while female unemployment rates
remain higher than male unemployment rates for all levels of education in some countries,
this disparity is not widespread.
Figure 4.10. Male and female unemployment rates by educational attainment
Note: Owing to lack of data, Cambodia, Ethiopia and the Philippines are not included in this figure.
Source: KILM, 9th edn, table 14a, ages 15+, latest year available for each country.
0
5
10
15
20
25
30
35
40
45
Mal
e
Fem
ale
Mal
e
Fem
ale
Mal
e
Fem
ale
Mal
e
Fem
ale
Mal
e
Fem
ale
Mal
e
Fem
ale
Mal
e
Fem
ale
Mal
e
Fem
ale
Mal
e
Fem
ale
Thailand Kyrgyzstan Egypt Mexico Brazil El Salvador Algeria Canada Germany
%
Primary education or less Secondary education Tertiary education
26
However, even though progress has been made in reducing gender disparities in
educational attainment, girls still face major obstacles in accessing school in some parts of
the world. It is important to address these barriers, to ensure that girls around the world
have the opportunity to complete secondary and, where appropriate, tertiary education
(UNESCO, 2012).
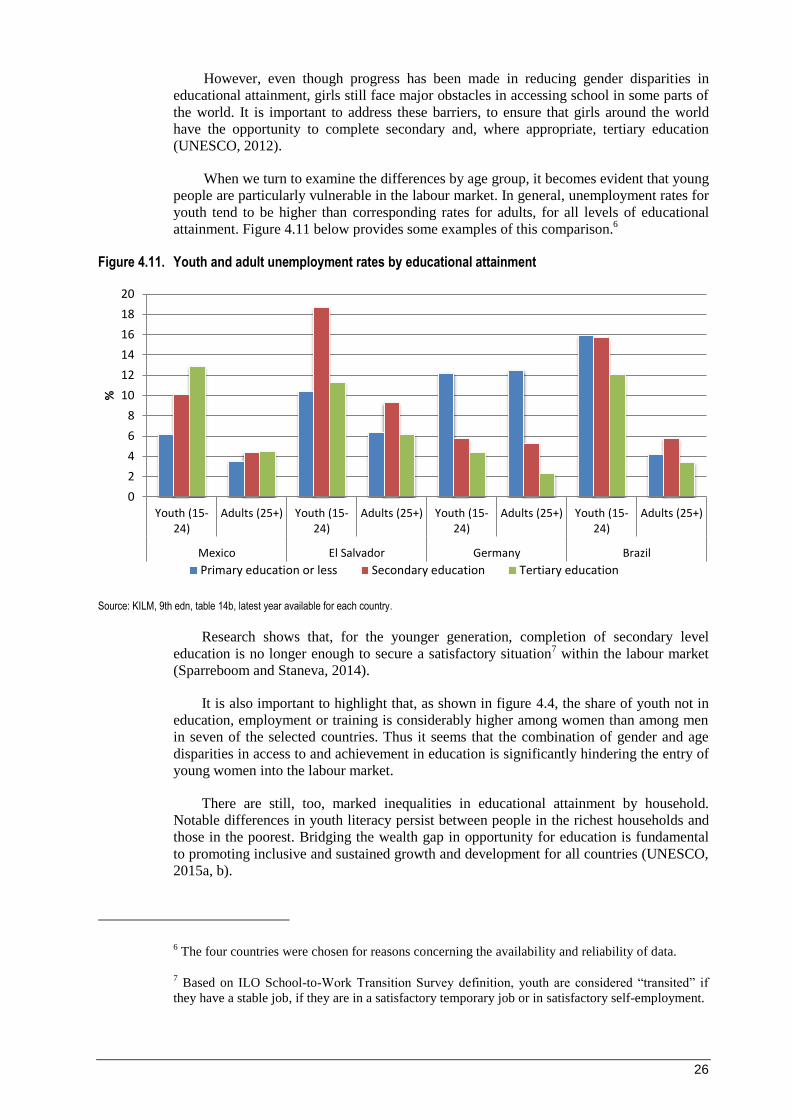
When we turn to examine the differences by age group, it becomes evident that young
people are particularly vulnerable in the labour market. In general, unemployment rates for
youth tend to be higher than corresponding rates for adults, for all levels of educational
attainment. Figure 4.11 below provides some examples of this comparison.6
Figure 4.11. Youth and adult unemployment rates by educational attainment
Source: KILM, 9th edn, table 14b, latest year available for each country.
Research shows that, for the younger generation, completion of secondary level
education is no longer enough to secure a satisfactory situation7 within the labour market
(Sparreboom and Staneva, 2014).
It is also important to highlight that, as shown in figure 4.4, the share of youth not in
education, employment or training is considerably higher among women than among men
in seven of the selected countries. Thus it seems that the combination of gender and age
disparities in access to and achievement in education is significantly hindering the entry of
young women into the labour market.
There are still, too, marked inequalities in educational attainment by household.
Notable differences in youth literacy persist between people in the richest households and
those in the poorest. Bridging the wealth gap in opportunity for education is fundamental
to promoting inclusive and sustained growth and development for all countries (UNESCO,
2015a, b).
6 The four countries were chosen for reasons concerning the availability and reliability of data.
7 Based on ILO School-to-Work Transition Survey definition, youth are considered “transited” if
they have a stable job, if they are in a satisfactory temporary job or in satisfactory self-employment.
0
2
4
6
8
10
12
14
16
18
20
Youth (15-24)
Adults (25+) Youth (15-24)
Adults (25+) Youth (15-24)
Adults (25+) Youth (15-24)
Adults (25+)
Mexico El Salvador Germany Brazil
%
Primary education or less Secondary education Tertiary education
27
Finally, we need to consider the situation of migrants in respect of their access to
education and the labour market in host countries. Extraordinary efforts are needed to
ensure that migrant youth have equitable access to the acquisition of the skills they need to
enter the labour market (UNESCO, 2015a, b). The increasing flows of labour migration are
also creating an urgent need to consider the “internationality” of educational qualifications
and other educational arrangements.
4.3.3. Attention to qualitative factors and field of study
This chapter is based primarily on quantitative indicators. Nevertheless, it is crucial to
bear in mind the qualitative factors that also influence the role of education in labour
market outcomes. For example, a study of 11 African countries found that in all these
countries “learning deficits”, that is, lack of ability to provide all students with the
necessary knowledge, skills, cultural and social understandings etc., are considerably
greater than simple “access deficits”, that is, the lack of universal enrolment in the
schooling system (Spaull and Taylor, 2015). Another study revealed that the cognitive
skills of the population are much more closely linked to individual earnings, income
distribution and economic growth than they are to level of educational attainment alone.
The authors found that international comparisons incorporating cognitive skills show much
larger skills deficits in developing countries than those generally derived solely from
educational enrolment and attainment measures (Hanushek and Woessmann, 2008). The
key point arising from both these examples is that an exclusive focus on enrolment and
educational attainment may generate misleading inferences.
The quality and relevance of the national schooling system (in terms of compulsory
education, for instance) will also strongly influence the impact of educational attainment
on the individual’s labour market status, and on returns to education in general.
With respect to tertiary education, the choice of the field of study and its relevance in
the labour market will greatly influence returns to education. Ideally, all individual choices
of field of study should be made in a way that their sum would align skills and educational
supply closely with skills and educational demand, thus minimizing mismatch. However,
given the difficulty in predicting future demand for skills, aiming at this ideal is likely to
remain a challenge.
28
5. Conclusion
This overview of educational patterns among the labour force has revealed the
importance of educational attainment in achieving satisfactory labour market outcomes.
Education has a positive effect not only in facilitating access to employment, but also in
improving the chances of gaining quality employment. Thus, it is clear that promoting
higher levels of educational attainment should remain a priority for countries where a large
share of the labour force has received only primary education or less.
In some countries there seems to be a mismatch between supply of and demand for
skilled labour. Where the demand is lower than the supply, high levels of education are
unlikely to protect against unemployment. However, in some national contexts highly
educated individuals may have higher expectations in terms of potential jobs, and be less
willing to compromise. In other contexts, a high level of educational attainment can
provide individuals with easier access to jobs of better quality, offering higher salaries,
improved working conditions, permanent contracts, full-time employment and other
benefits.
In addition to its positive effects at the individual level, increased educational
attainment, coupled with sufficient productive employment opportunities, can also have a
positive impact at the national level, promoting inclusive economic growth and helping to
reduce income inequalities.
29
References
Elder, S. 2015. What does NEETs mean and why is the concept so easily misinterpreted?,
Work4Youth Technical Brief No. 1 (Geneva, ILO).
Hanushek, E.A.; Woessmann, L. 2008. “The role of cognitive skills in economic
development”, in Journal of Economic Literature, Vol. 46, No. 3, pp. 607–68.
Holland, D.; Liadze, I; Rienzo, C; Wilkinson, D. 2013. The relationship between graduates
and economic growth across countries, BIS Research paper No. 110.
International Labour Organization (ILO). 2008. Conclusions on skills for improved
productivity, employment growth and development, International Labour Conference
(Geneva, ILO).
International Labour Organization (ILO), Employment Policy Department. 2015. Global
employment trends for youth 2015: Scaling up investments in decent jobs for youth,
(Geneva, ILO).
International Labour Organization (ILO). 2016 - Forthcoming. The Global Women’s
Trends Report (Geneva, ILO).
Keller, K.R.I. 2010. “How can education policy improve income distribution? An
empirical analysis of education stages and measures on income inequality”, in Journal of
Developing Areas, Vol. 43, No. 2, pp. 51–77.
Organisation for Economic Co-operation and Development (OECD); Statistics Canada.
2000. Literacy in the information age: Final report of the international adult literacy
survey (Paris).
Ortiz, L. 2010. “Not the right job, but a secure one: Over-education and temporary
employment in France, Italy and Spain”, in Work, Employment and Society, Vol. 24, No. 1,
pp. 47–64.
Rubb, S. 2003. “Overeducation in the labour market: A comment and re-analysis of a
meta-analysis”, in Economics of Education Review, Vol. 22, No. 6, pp. 621–29.
Sparreboom, T.; Staneva, A. 2014. Is education the solution to decent work for youth in
developing economies? Identifying qualifications mismatch from 28 school-to-work
transition surveys, Work4Youth Publication Series No. 23 (Geneva, ILO).
Spaull, N.; Taylor, S. 2015. “Access to what? Creating a composite measure of educational
quantity and educational quality for 11 African countries”, in Comparative Education
Review, Vol. 59, No. 1, pp. 133–65.
United Nations Educational, Scientific and Cultural Organization (UNESCO). 2012. Youth
and skills: Putting education to work, EFA Global Monitoring Report (Paris).
—. 2015a. Education for All 2000–2015: Achievements and challenges, EFA Global
Monitoring Report (Paris).
—. 2015b. Education 2030: Equity and quality with a lifelong learning perspective.
Insights from the EFA Global Monitoring Report’s World Inequality Database on
Education (WIDE), Policy Paper 20 (Paris).
Vinod, H.D.; Kaushik, S.K. 2007. “Human capital and economic growth: Evidence from
developing countries”, in American Economist, Vol. 51, No. 1, pp. 29–39.
30
Annex
International Organization for Standardization country codes
ISO 3166 – alpha 3
Code Country
ABW Aruba
AFG Afghanistan
AGO Angola
AIA Anguilla
ALB Albania
AND Andorra
ANT Netherlands Antilles
ARE United Arab Emirates
ARG Argentina
ARM Armenia
ASM American Samoa
ATG Antigua and Barbuda
AUS Australia
AUT Austria
AZE Azerbaijan
BDI Burundi
BEL Belgium
BEN Benin
BFA Burkina Faso
BGD Bangladesh
BGR Bulgaria
BHR Bahrain
BHS Bahamas
BIH Bosnia and Herzegovina
BLR Belarus
BLZ Belize
BMU Bermuda
BOL Bolivia, Plurinational State of
BRA Brazil
BRB Barbados
BRN Brunei Darussalam
BTN Bhutan
BWA Botswana
CAF Central African Republic
CAN Canada
CHA Channel Islands
CHE Switzerland
CHL Chile
CHN China
CIV Côte d'Ivoire
CMR Cameroon
COD Congo, Democratic Republic of the
COG Congo
COK Cook Islands
COL Colombia
COM Comoros
CPV Cape Verde
CRI Costa Rica
CUB Cuba
Code Country
CUW Curaçao
CYM Cayman Islands
CYP Cyprus
CZE Czech Republic
DEU Germany
DJI Djibouti
DMA Dominica
DNK Denmark
DOM Dominican Republic
DZA Algeria
ECU Ecuador
EGY Egypt
ERI Eritrea
ESH Western Sahara
ESP Spain
EST Estonia
ETH Ethiopia
FIN Finland
FJI Fiji
FLK Falkland Islands (Malvinas
FRA France
FRO Faeroe Islands
FSM Micronesia, Federated States of
GAB Gabon
GBR United Kingdom
GEO Georgia
GGY Guernsey
GHA Ghana
GIB Gibraltar
GIN Guinea
GLP Guadeloupe
GMB Gambia
GNB Guinea-Bissau
GNQ Equatorial Guinea
GRC Greece
GRD Grenada
GRL Greenland
GTM Guatemala
GUF French Guiana
GUM Guam
GUY Guyana
HKG Hong Kong, China
HND Honduras
HRV Croatia
HTI Haiti
HUN Hungary
IDN Indonesia
IMN Isle of Man
IND India
31
Code Country
IRL Ireland
IRN Iran, Islamic Republic of
IRQ Iraq
ISL Iceland
ISR Israel
ITA Italy
JAM Jamaica
JEY Jersey
JOR Jordan
JPN Japan
KAZ Kazakhstan
KEN Kenya
KGZ Kyrgyzstan
KHM Cambodia
KIR Kiribati
KNA Saint Kitts and Nevis
KOR Korea, Republic of
KOS Kosovo
KWT Kuwait
LAO Lao People's Democratic Republic
LBN Lebanon
LBR Liberia
LBY Libya
LCA Saint Lucia
LIE Liechtenstein
LKA Sri Lanka
LSO Lesotho
LTU Lithuania
LUX Luxembourg
LVA Latvia
MAC Macau, China
MAF Saint Martin (French part)
MAR Morocco
MCO Monaco
MDA Moldova, Republic of
MDG Madagascar
MDV Maldives
MEX Mexico
MHL Marshall Islands
MKD Macedonia, the former Yugoslav
Republic of
MLI Mali
MLT Malta
MMR Myanmar
MNE Montenegro
MNG Mongolia
MNP Northern Mariana Islands
MOZ Mozambique
MRT Mauritania
MSR Montserrat
MTQ Martinique
MUS Mauritius
MWI Malawi
MYS Malaysia
Code Country
MYT Mayotte
NAM Namibia
NCL New Caledonia
NER Niger
NFK Norfolk Island
NGA Nigeria
NIC Nicaragua
NIU Niue
NLD Netherlands
NOR Norway
NPL Nepal
NRU Nauru
NZL New Zealand
OMN Oman
PAK Pakistan
PAN Panama
PER Peru
PHL Philippines
PLW Palau
PNG Papua New Guinea
POL Poland
PRI Puerto Rico
PRK Korea, Democratic People's Republic
of
PRT Portugal
PRY Paraguay
PSE Occupied Palestinian Territory
PYF French Polynesia
QAT Qatar
REU Réunion
ROU Romania
RUS Russian Federation
RWA Rwanda
SAU Saudi Arabia
SDN Sudan
SEN Senegal
SGP Singapore
SHN Saint Helena
SLB Solomon Islands
SLE Sierra Leone
SLV El Salvador
SMR San Marino
SOM Somalia
SPM Saint Pierre and Miquelon
SRB Serbia
SSD South Sudan
STP Sao Tome and Principe
SUR Suriname
SVK Slovakia
SVN Slovenia
SWE Sweden
SWZ Swaziland
SXM Sint Maarten (Dutch part)
SYC Seychelles
SYR Syrian Arab Republic
32
Code Country
TCA Turks and Caicos Island
TCD Chad
TGO Togo
THA Thailand
TJK Tajikistan
TKL Tokelau
TKM Turkmenistan
TLS Timor-Leste
TON Tonga
TTO Trinidad and Tobago
TUN Tunisia
TUR Turkey
TUV Tuvalu
TWN Taiwan, China
TZA Tanzania, United Republic of
UGA Uganda
UKR Ukraine
URY Uruguay
USA United States
UZB Uzbekistan
VCT Saint Vincent and the Grenadines
VEN Venezuela, Bolivarian Republic of
VGB British Virgin Islands
VIR United States Virgin Islands
VNM Viet Nam
VUT Vanuatu
WLF Wallis and Fortuna Islands
WSM Samoa
YEM Yemen
ZAF South Africa
ZMB Zambia
ZWE Zimbabwe