Embed Size (px)
Citation preview
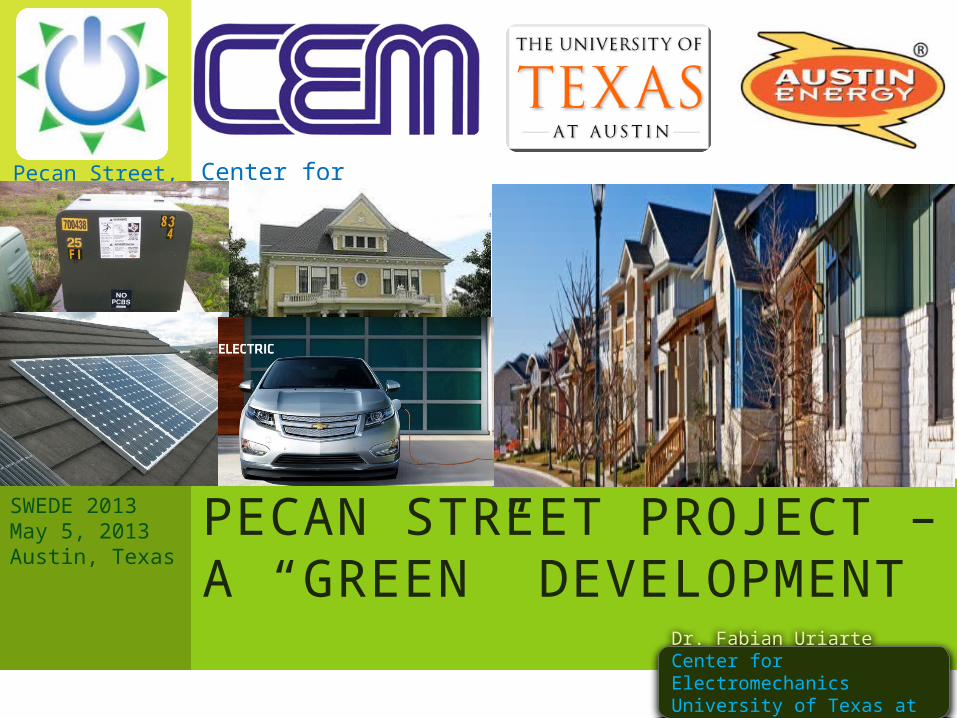
PECAN STREET PROJECT – A “GREEN” DEVELOPMENT
Center for ElectromechanicsPecan Street, Inc.
SWEDE 2013May 5, 2013Austin, Texas
Dr. Fabian UriarteCenter for ElectromechanicsUniversity of Texas at Austin

SMART GRID LOCATION
Pecan Street offices
Mueller Community
Texas Advanced Computing Center
Ctr. for Electromechanics
pecanstreet.org

Homes 735
Transformers 94
Solar panels 200
Electric vehicles 100
One-line Diagram

TRANSFORMER LOAD*
240/120V
*One possible combination
Circuit feed (7.2 kV)
20-40 xfms.
Homes per transformer:Maximum: 11Mode: 8Minimum: 4

Phase A
Phase B
Phase C
0
50
100
150
200
250
300
350
Xfms
EVs
PVs
Homes
2145
28
3354
19
60 86
32
186
333
216
Coun
tLOAD DISTRIBUTION BY
PHASE
(Electric Vehicles)
(Photovoltaic Arrays)
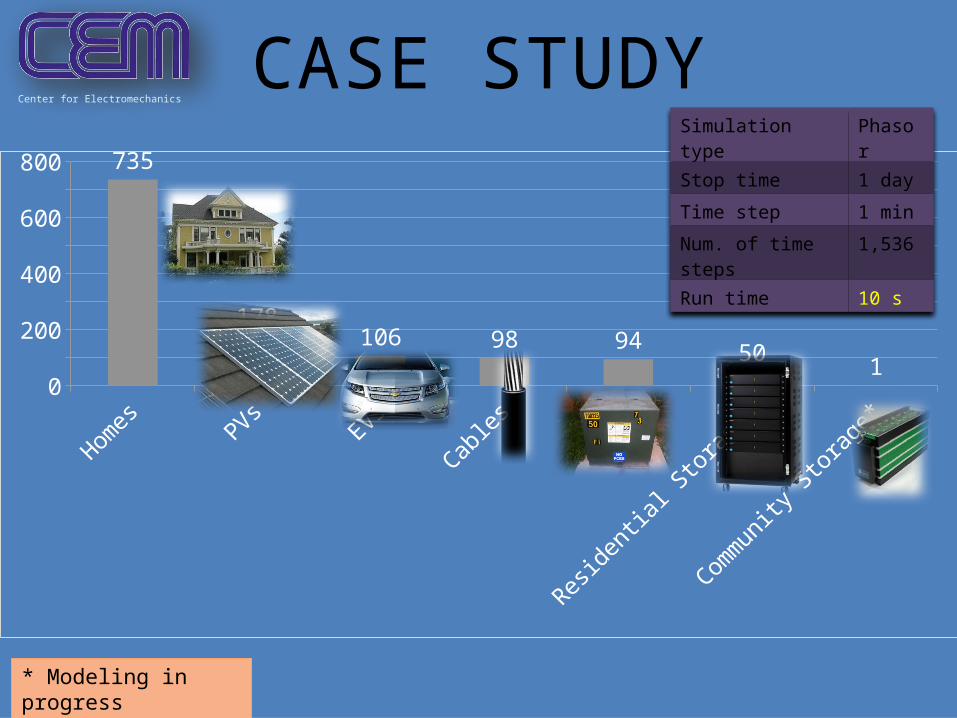
CASE STUDY
Homes PVs EVs Cables Xfms Residential Storage*
Community Storage*
0
100
200
300
400
500
600
700
800735
178
106 98 9450
1
* Modeling in progress
Center for Electromechanics
Simulation type Phasor
Stop time 1 day
Time step 1 min
Num. of time steps 1,536
Run time 10 s
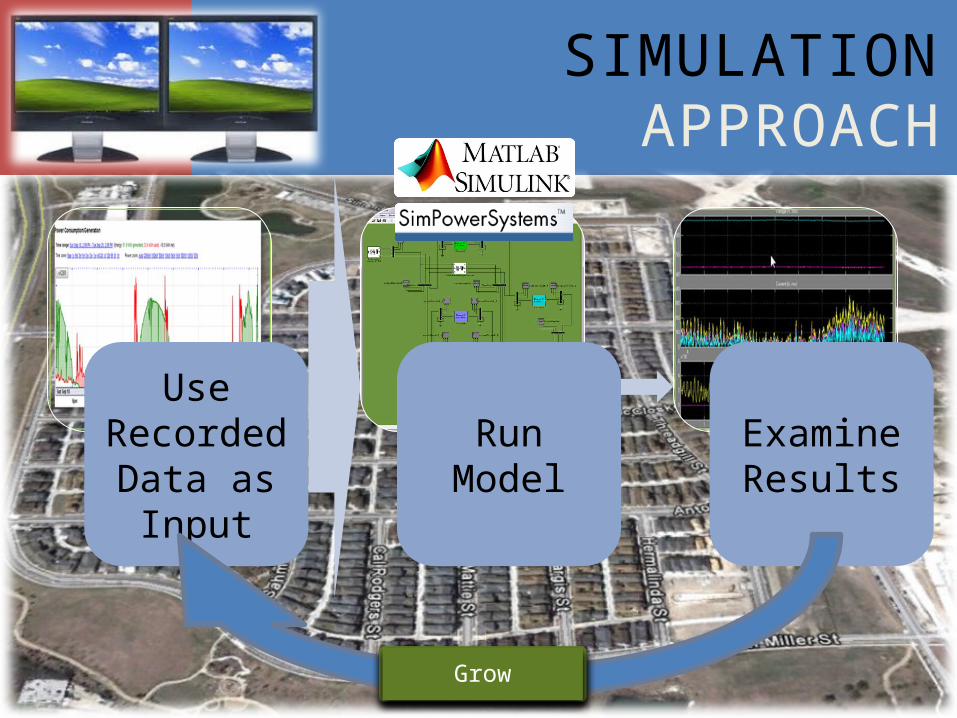
SIMULATION APPROACH
Use Recorded Data as Input
Run Model
Examine Results
Grow

RESIDENTIAL LOAD
Real Data

PV GENERATION
Real Data
0.5 - 1 MW of distributed PV generation daily

EV LOAD
Mix of 120 V and 240 V charging > 4 PM

TRANSFORMERS THROUGHPUT

TRANSFORMER UTILIZATION
•High PV/Load ratio causes reverse flows•Can increase or decrease xfm. utilization
AfterPVs and EVs
BeforePVs and EVs

CHANGE IN TRANSFORMER LOAD
Example (blue areas):
•Usage before: 25 % (fwd. direction)
•Usage after: 5 % (reverse direction)
•Change: 20 %
•“-” or “<0” shows reduction in utilization
•“>0” means increase in utilization
No change
PVs produce 23% increase
EVs produce 2% increase

LATERAL POWER
0 4 8 12 16 20 240
5
10
15x 10
5
Pow
er
Hours
3-phase Power
0 4 8 12 16 20 240
0.2
0.4
0.6
0.8
1
1.2
Pow
er
Facto
r (P
F)
S (kVA)
P (kW)Q (kVar)
PF
•0.5 MW reduction in real power demand•Equal reactive power demand•Power factor drops
AfterPVs and EVs
0 4 8 12 16 20 240
5
10
15x 10
5
Pow
er
Hours
3-phase Power
0 4 8 12 16 20 240
0.2
0.4
0.6
0.8
1
1.2
Pow
er
Facto
r (P
F)
S (kVA)
P (kW)Q (kVar)
PF
BeforePVs and EVs
Vars
Watts
VA
PF
Vars
Watts
VAPF
As seen from here
0 4 8 12 16 20 240
20
40
60
80
100
Hours
Am
ps
Feeder Current(w/PVs; w/EVs)
Ia
IbIc
Avg. Current
0 4 8 12 16 20 240
10
20
30
40
50
60
70
80
90100
Am
ps
Hours
Avg. Current and %-Unbalance
0 4 8 12 16 20 240
10
20
30
40
50
60
70
80
90100
Per
cent
(%
)
Avg. Current.
Unbalance
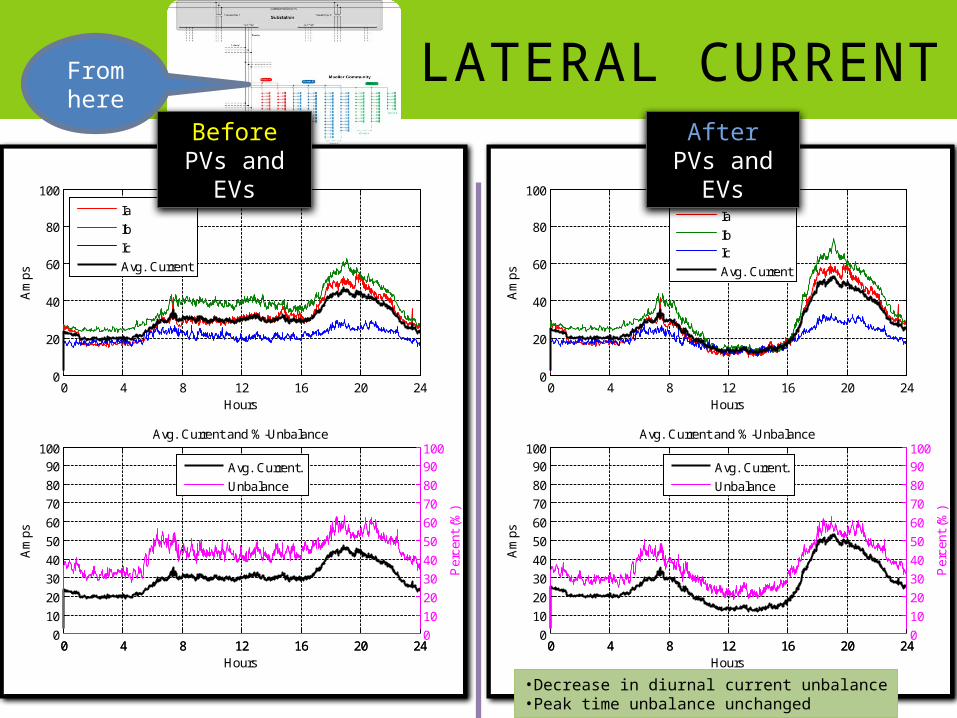
LATERAL CURRENT
•Decrease in diurnal current unbalance•Peak time unbalance unchanged
0 4 8 12 16 20 240
20
40
60
80
100
Hours
Am
ps
Feeder Current(no PVs; no EVs)
Ia
Ib
Ic
Avg. Current
0 4 8 12 16 20 240
10
20
30
40
50
60
70
80
90100
Am
ps
Hours
Avg. Current and %-Unbalance
0 4 8 12 16 20 240
10
20
30
40
50
60
70
80
90100
Per
cent
(%
)Avg. Current.
Unbalance
AfterPVs and EVs
BeforePVs and EVs
From here

DISTRIBUTION LOSSES
0 4 8 12 16 20 240
5
10
Hours
Cable Losses
kW
0 4 8 12 16 20 240
10
20
30
40
50
Dol
lars
Electrical losses
Dollar losses at $0.13/kWh
0 4 8 12 16 20 240
5
10
15
Hours
Transformer Losses
kW
0 4 8 12 16 20 240
10
20
30
40
50
Dol
lars
Electrical losses
Dollar losses at $0.13/kWh
0 4 8 12 16 20 240
5
10
15
20
25
Hours
Distribution Losses (cables + xfms.)kW
0 4 8 12 16 20 240
10
20
30
40
50
Dol
lars
Electrical losses
Dollar losses ($0.13/kWh)
0 4 8 12 16 20 240
5
10
Hours
Cable Losses
kW
0 4 8 12 16 20 240
10
20
30
40
50
Dol
lars
Electrical losses
Dollar losses at $0.13/kWh
0 4 8 12 16 20 240
5
10
15
Hours
Transformer Losses
kW
0 4 8 12 16 20 240
10
20
30
40
50
Dol
lars
Electrical losses
Dollar losses at $0.13/kWh
0 4 8 12 16 20 240
5
10
15
20
25
Hours
Total Distribution Losses (cables + xfms.)
kW
0 4 8 12 16 20 240
10
20
30
40
50
Dol
lars
Electrical losses
Dollar losses ($0.13/kWh)
Increase due to EVs
Xfm losses almost unchanged
$45/day = $16k/year
AfterPVs and EVs
BeforePVs and EVs
Reduction due to PVs
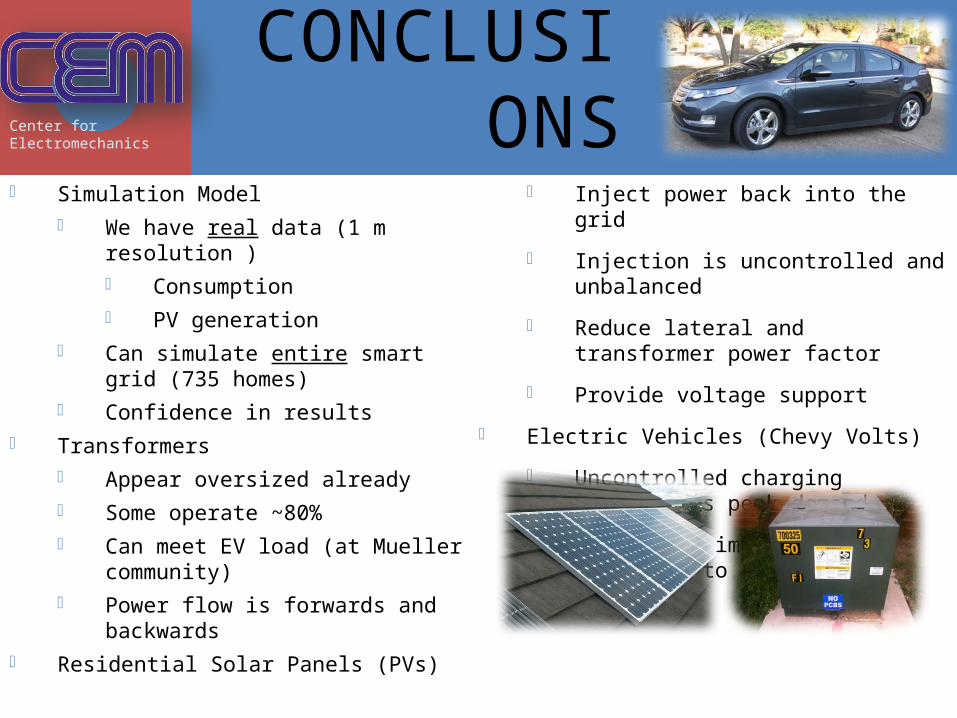
CONCLUSIONSCenter for Electromechanics
Simulation Model We have real data (1 m resolution )
Consumption PV generation
Can simulate entire smart grid (735 homes) Confidence in results
Transformers Appear oversized already Some operate ~80% Can meet EV load (at Mueller community) Power flow is forwards and backwards
Residential Solar Panels (PVs)
Inject power back into the grid
Injection is uncontrolled and unbalanced
Reduce lateral and transformer power
factor
Provide voltage support
Electric Vehicles (Chevy Volts)
Uncontrolled charging exacerbates peak demand
Electrical impact appears small due to transformer sizing

ACKNOWLEDGEMENTS
Pecan Street, Inc.
• Brewster McCrackenexecutive director
• Bert Haskelltechnology director
• Ariane Beckprogram manager
• Chris Holcombdata analysis
• Dan Weisbergeconomic strategy
UT Austin
• Dr. Kwasinski & Amir Toliyatsolar arrays
• Dr. Baldick & David Tuttleelectric vehicles
• Dr. Edgar, Wesley Cole, Robert Fares, and Akshay Sriprasadenergy storage
Austin Energy
• Kurt Stogdillutility strategist
• Charles Robinson distribution planning
• Sharon Bickfordsystems engineering
Center for Electromechanics
• Robert Hebnerdirector
• John Herbstprogram manager

QUESTIONS
Fabian Uriarte
Center for ElectromechanicsThe University of Texas at Austin
utexas.edu/research/cem10100 Burnet Road, Austin, TX
Hours
Tra
nsfo
rmer
#
Transformer Load (%-VA) (w/PVs & EVs)
Circuit 1
Circuit 2
Circuit 3
Circuit 4
Circuit 5
0 4 8 12 16 20 24
10
20
30
40
50
60
70
80
90
-40%
-20%
0%
20%
40%
60%
80%
Center for Electromechanics
Hours
Tra
nsfo
rmer
#
Secondary Voltages (w/PVs & EVs)
Circuit 1
Circuit 2
Circuit 3
Circuit 4
Circuit 5
0 4 8 12 16 20 24
10
20
30
40
50
60
70
80
90
230V (95.8%)
235V (97.9%)
240V (100%)
245V (102.1%)
0 4 8 12 16 20 240
5
10
15x 10
5
Pow
er
Hours
3-phase Power
0 4 8 12 16 20 240
0.2
0.4
0.6
0.8
1
1.2
Pow
er
Facto
r (P
F)
S (kVA)
P (kW)Q (kVar)
PF