Embed Size (px)
Citation preview
Oxy’s Digital TransformationOccidental Petroleum Corporation
September 6, 2017
Jody ElliottSenior Vice President, President, Oxy Oil and Gas
Yanni CharalambousVice President, CIO Information Technology
David BowlbyVice President, Data Management and Analytics
2
Forward-Looking StatementsPortions of this presentation contain forward-looking statements and involve risks and uncertainties that could materially affect expected
results of operations, liquidity, cash flows and business prospects. Actual results may differ from anticipated results, sometimes materially,
and reported results should not be considered an indication of future performance. Factors that could cause results to differ include, but are
not limited to: global commodity pricing fluctuations; supply and demand considerations for Occidental's products; higher-than-expected
costs; the regulatory approval environment; not successfully completing, or any material delay of, field developments, expansion projects,
capital expenditures, efficiency projects, acquisitions or dispositions; uncertainties about the estimated quantities of oil and natural gas
reserves; lower-than-expected production from development projects or acquisitions; exploration risks; general economic slowdowns
domestically or internationally; political conditions and events; liability under environmental regulations including remedial actions; litigation;
disruption or interruption of production or manufacturing or facility damage due to accidents, chemical releases, labor unrest, weather,
natural disasters, cyber attacks or insurgent activity; failure of risk management; changes in law or regulations; reorganization or
restructuring of Occidental's operations; or changes in tax rates. Words such as “estimate,” “project,” “predict,” “will,” “would,” “should,”
“could,” “may,” “might,” “anticipate,” “plan,” “intend,” “believe,” “expect,” “aim,” “goal,” “target,” “objective,” “likely” or similar expressions
that convey the prospective nature of events or outcomes generally indicate forward-looking statements. You should not place undue reliance
on these forward-looking statements, which speak only as of the date of this presentation. Unless legally required, Occidental does not
undertake any obligation to update any forward looking statements, as a result of new information, future events or otherwise. Material risks
that may affect Occidental’s results of operations and financial position appear in Part I, Item 1A “Risk Factors” of the 2016 Form 10-K.
Use of non-GAAP Financial InformationThis presentation includes non-GAAP financial measures. You can find the reconciliations to comparable GAAP financial measures on the
“Investors” section of our website.
Cautionary Statements
3
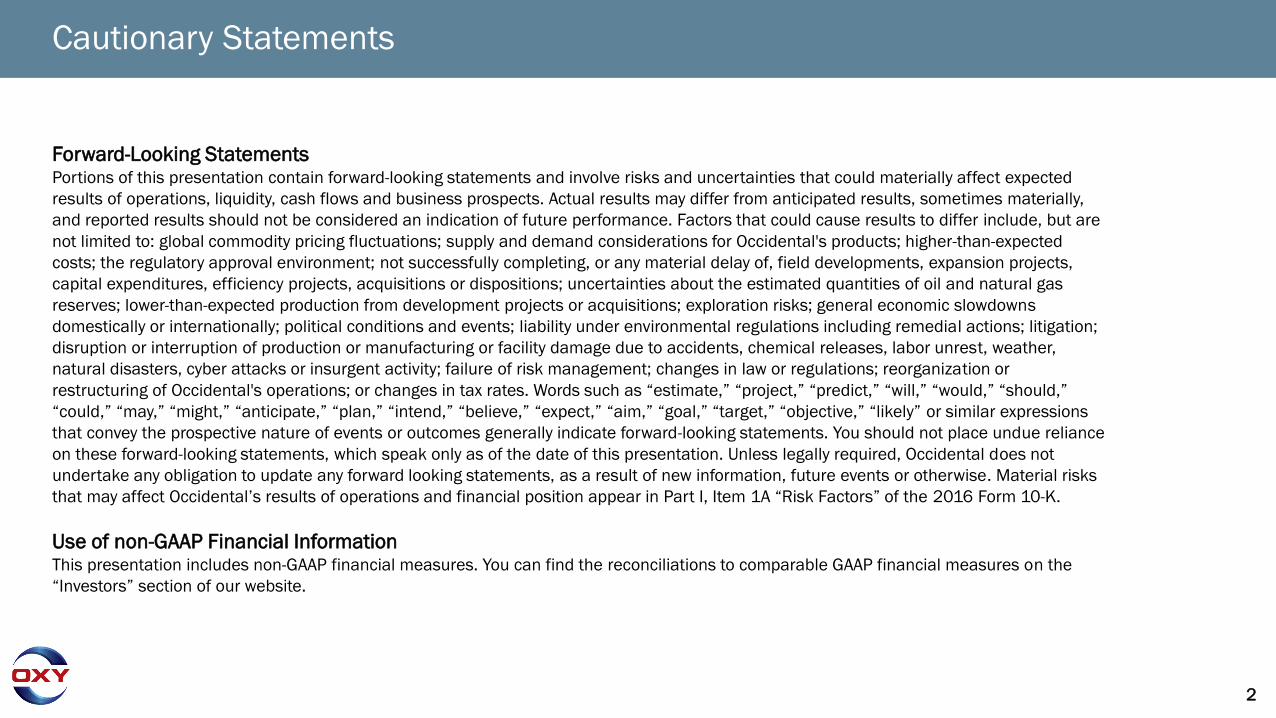
Agenda
• Introduction
• Oxy’s Journey to Digital Transformation
• Re-Imagined Oilfield (RIO) – What’s Next
• Driving Value Through Data Analytics
4
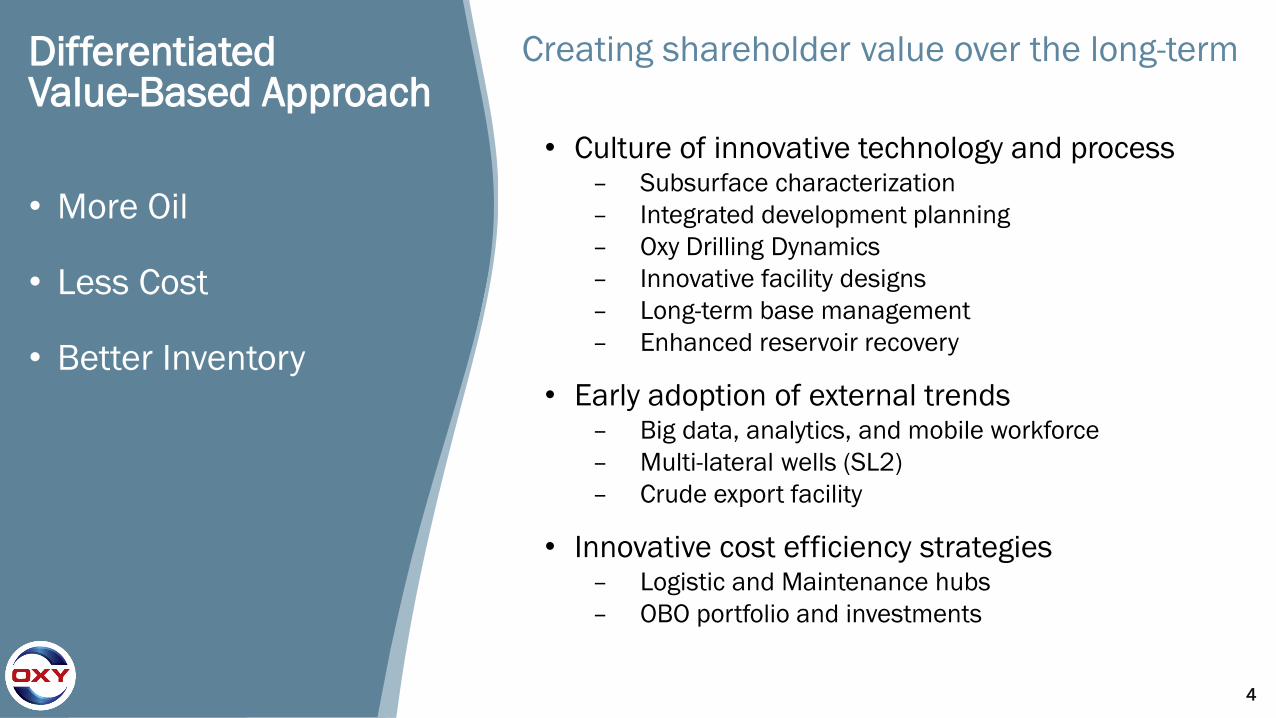
Differentiated Value-Based Approach
• More Oil
• Less Cost
• Better Inventory
Creating shareholder value over the long-term
• Culture of innovative technology and process– Subsurface characterization
– Integrated development planning
– Oxy Drilling Dynamics
– Innovative facility designs
– Long-term base management
– Enhanced reservoir recovery
• Early adoption of external trends– Big data, analytics, and mobile workforce
– Multi-lateral wells (SL2)
– Crude export facility
• Innovative cost efficiency strategies– Logistic and Maintenance hubs
– OBO portfolio and investments
5
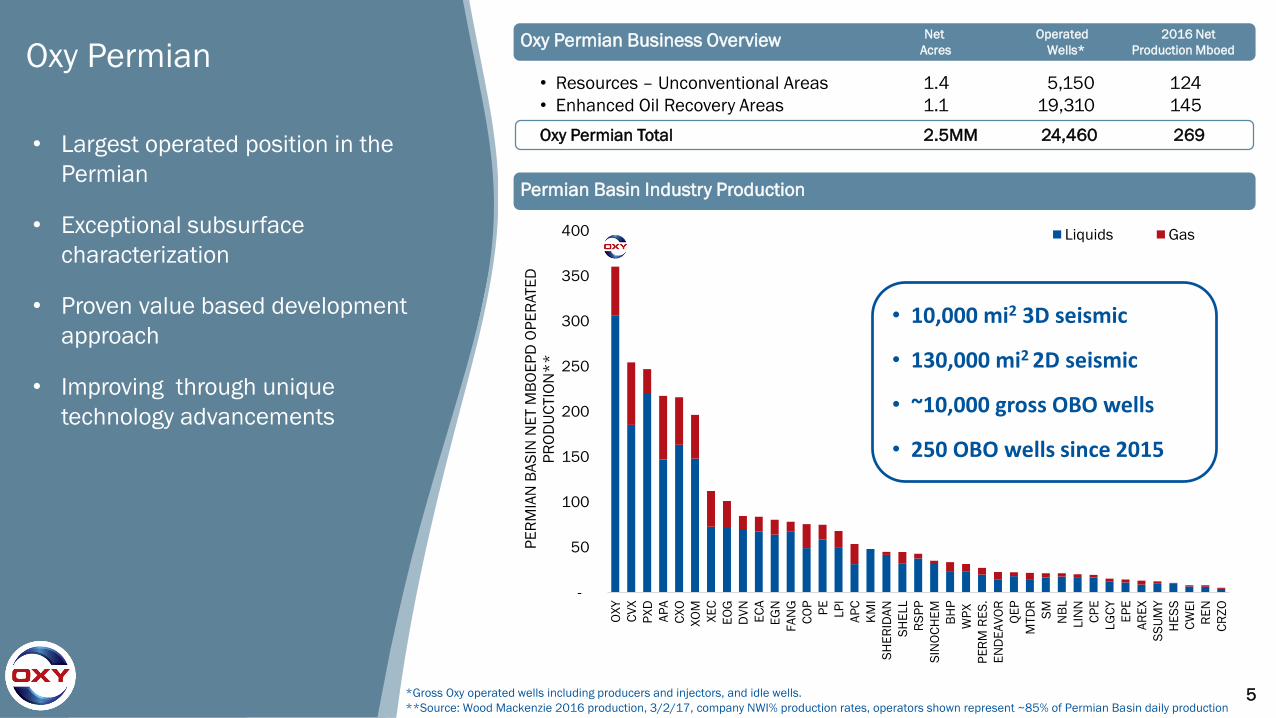
Oxy Permian
• Largest operated position in the
Permian
• Exceptional subsurface
characterization
• Proven value based development
approach
• Improving through unique
technology advancements
• Resources – Unconventional Areas 1.4 5,150 124
• Enhanced Oil Recovery Areas 1.1 19,310 145
Oxy Permian Total 2.5MM 24,460 269
-
50
100
150
200
250
300
350
400
OX
Y
CV
X
PX
D
AP
A
CX
O
XO
M
XE
C
EO
G
DV
N
EC
A
EG
N
FA
NG
CO
P
PE
LP
I
AP
C
KM
I
SH
ER
IDA
N
SH
ELL
RS
PP
SIN
OC
HE
M
BH
P
WP
X
PE
RM
RE
S.
EN
DE
AV
OR
QE
P
MTD
R
SM
NB
L
LIN
N
CP
E
LG
CY
EP
E
AR
EX
SS
UM
Y
HE
SS
CW
EI
RE
N
CR
ZO
PE
RM
IAN
BA
SIN
NE
T M
BO
EP
D O
PE
RATE
D
PR
OD
UC
TIO
N*
*
Liquids Gas
5
Net Operated 2016 Net
Acres Wells* Production MboedOxy Permian Business Overview
*Gross Oxy operated wells including producers and injectors, and idle wells.
**Source: Wood Mackenzie 2016 production, 3/2/17, company NWI% production rates, operators shown represent ~85% of Permian Basin daily production
Permian Basin Industry Production
• 10,000 mi2 3D seismic
• 130,000 mi2 2D seismic
• ~10,000 gross OBO wells
• 250 OBO wells since 2015
6
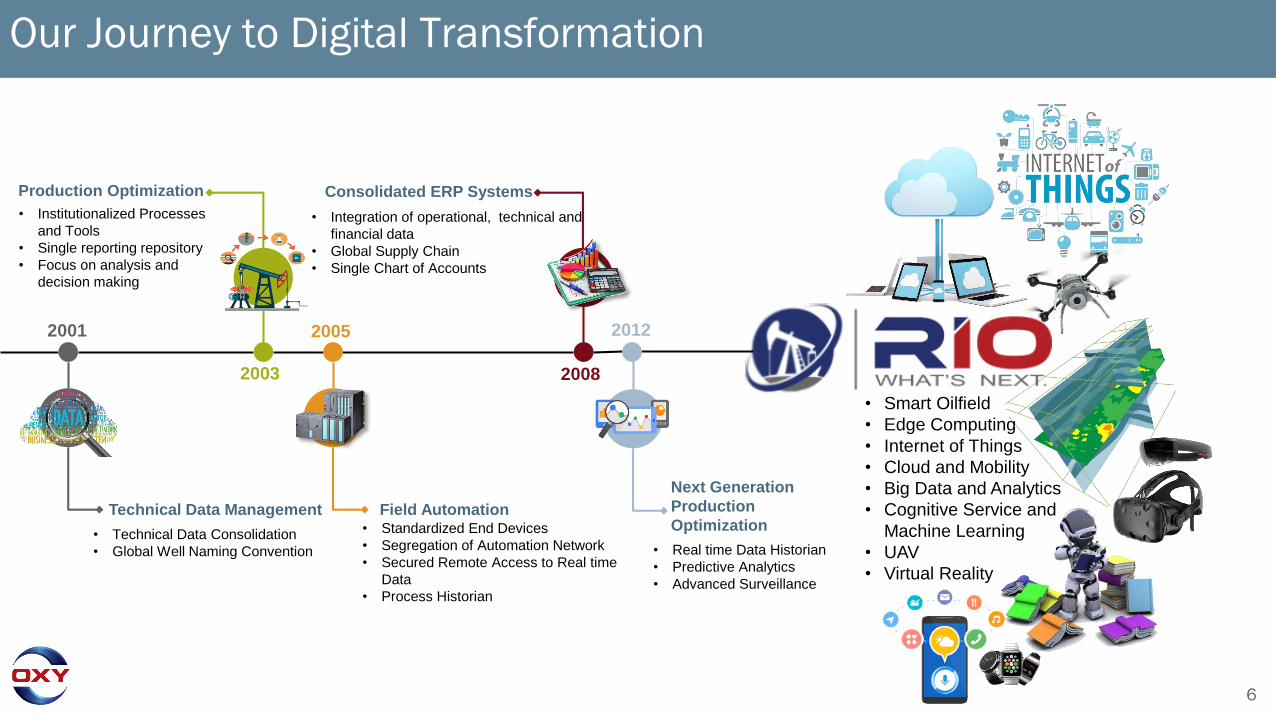
Our Journey to Digital Transformation
• Smart Oilfield
• Edge Computing
• Internet of Things
• Cloud and Mobility
• Big Data and Analytics
• Cognitive Service and
Machine Learning
• UAV
• Virtual Reality
• Real time Data Historian
• Predictive Analytics
• Advanced Surveillance
Technical Data Management
Production Optimization
Field Automation
Consolidated ERP Systems
Next Generation
Production
Optimization
• Institutionalized Processes
and Tools
• Single reporting repository
• Focus on analysis and
decision making
• Technical Data Consolidation
• Global Well Naming Convention
• Integration of operational, technical and
financial data
• Global Supply Chain
• Single Chart of Accounts
• Standardized End Devices
• Segregation of Automation Network
• Secured Remote Access to Real time
Data
• Process Historian
2001
2003
2005
2008
2012

7

8
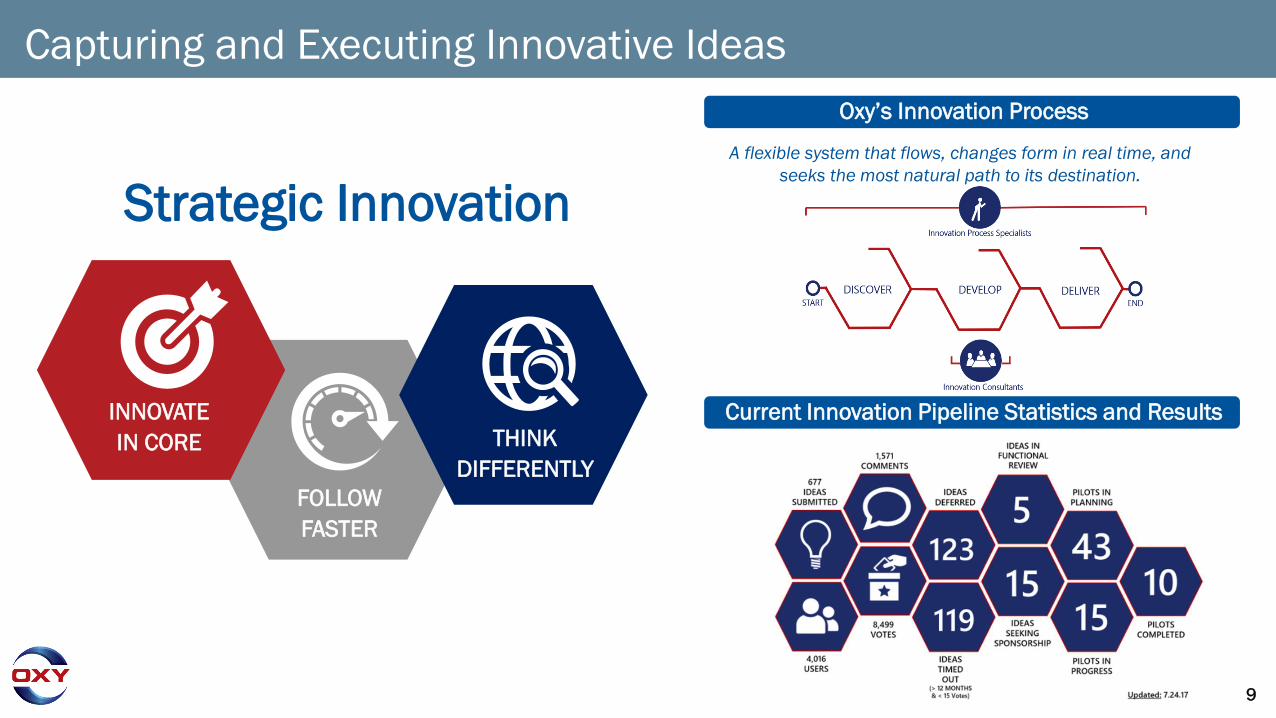
9
A flexible system that flows, changes form in real time, and
seeks the most natural path to its destination.
Current Innovation Pipeline Statistics and Results
Oxy’s Innovation Process
Capturing and Executing Innovative Ideas
INNOVATE
IN CORE
FOLLOW
FASTER
THINK
DIFFERENTLY
Strategic Innovation
10
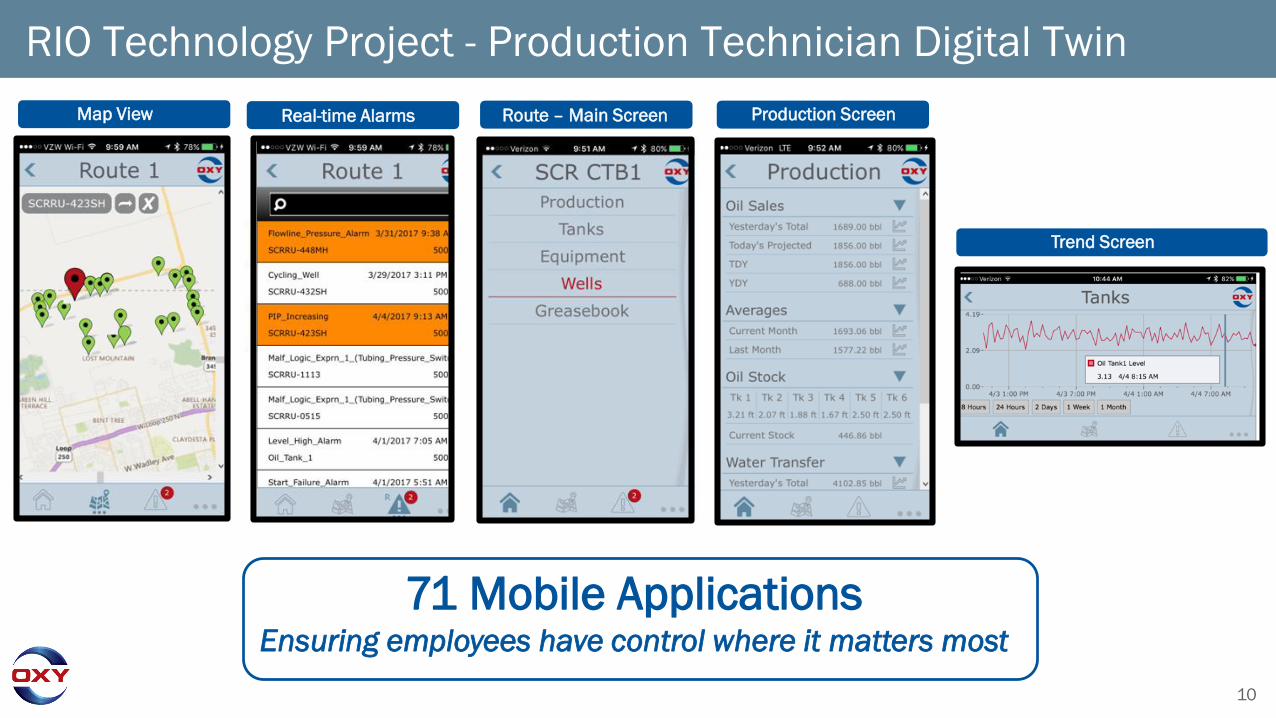
RIO Technology Project - Production Technician Digital Twin
Map View Real-time Alarms Route – Main Screen Production Screen
Trend Screen
71 Mobile ApplicationsEnsuring employees have control where it matters most

11
Oilfield of the Future

12
Oilfield of the Future
13
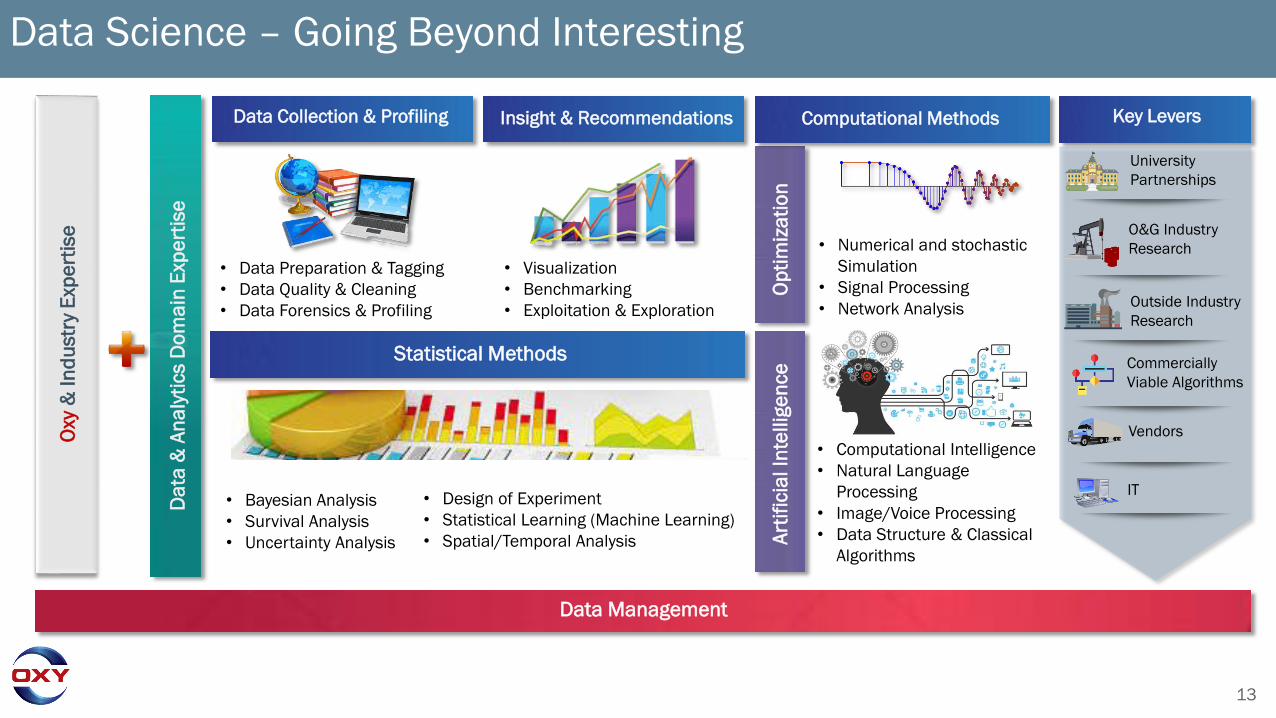
Data Science – Going Beyond InterestingO
xy&
In
du
str
y E
xpe
rtis
e
Data Management
Da
ta &
An
aly
tics D
om
ain
Exp
ert
ise
• Visualization
• Benchmarking
• Exploitation & Exploration
Insight & Recommendations
• Bayesian Analysis
• Survival Analysis
• Uncertainty Analysis
• Design of Experiment
• Statistical Learning (Machine Learning)
• Spatial/Temporal Analysis
Statistical Methods
• Data Preparation & Tagging
• Data Quality & Cleaning
• Data Forensics & Profiling
Data Collection & Profiling
• Numerical and stochastic
Simulation
• Signal Processing
• Network Analysis
• Computational Intelligence
• Natural Language
Processing
• Image/Voice Processing
• Data Structure & Classical
Algorithms
Op
tim
iza
tio
nA
rtif
icia
l In
tellig
en
ce
Computational Methods
University
Partnerships
O&G Industry
Research
Outside Industry
Research
Commercially
Viable Algorithms
Vendors
IT
Key Levers
14
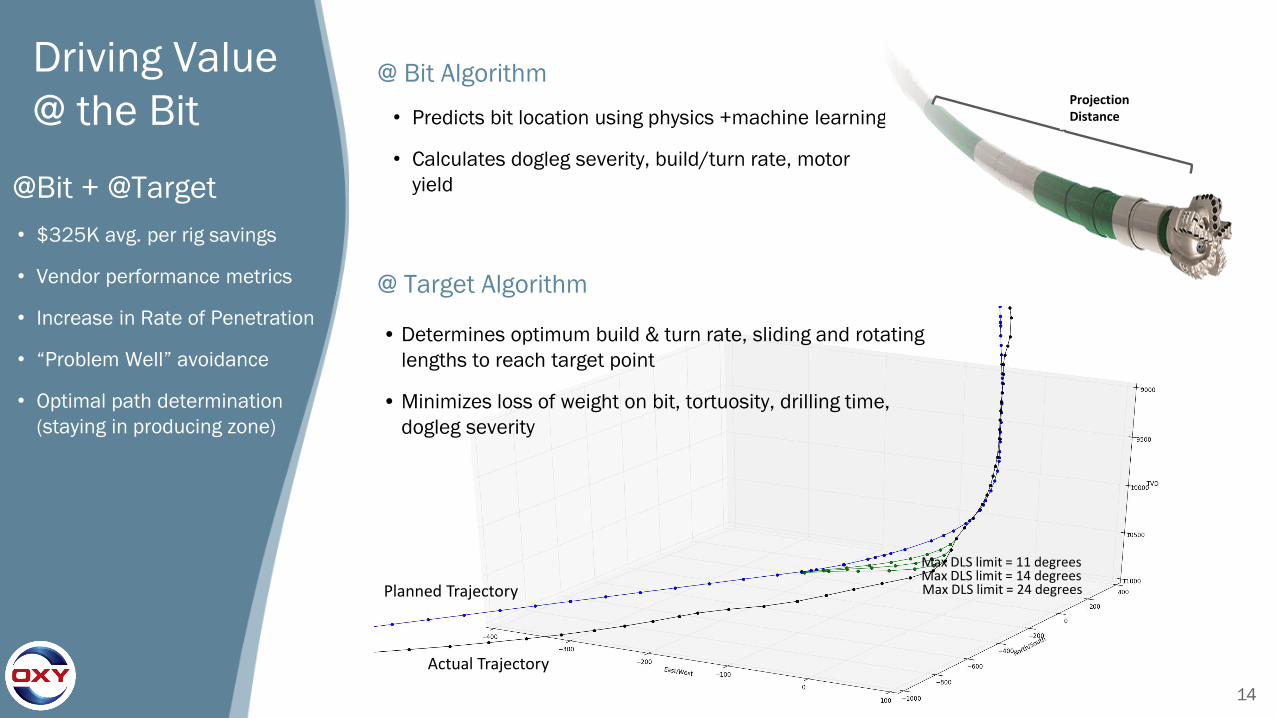
Driving Value
@ the Bit@ Bit Algorithm
• Predicts bit location using physics +machine learning
• Calculates dogleg severity, build/turn rate, motor
yield
@ Target Algorithm
• Determines optimum build & turn rate, sliding and rotating
lengths to reach target point
• Minimizes loss of weight on bit, tortuosity, drilling time,
dogleg severity
Projection Distance
Max DLS limit = 11 degreesMax DLS limit = 14 degreesMax DLS limit = 24 degreesPlanned Trajectory
Actual Trajectory
@Bit + @Target
• $325K avg. per rig savings
• Vendor performance metrics
• Increase in Rate of Penetration
• “Problem Well” avoidance
• Optimal path determination
(staying in producing zone)
15
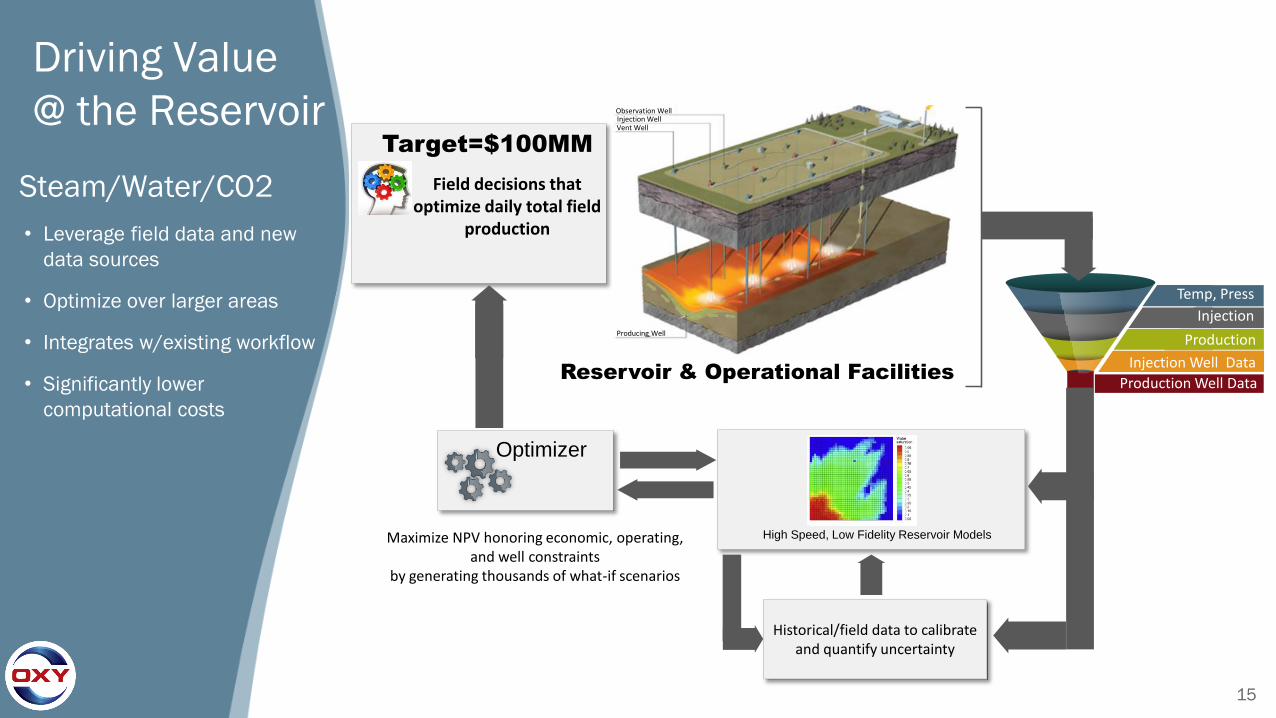
High Speed, Low Fidelity Reservoir Models
Historical/field data to calibrate and quantify uncertainty
Field decisions that optimize daily total field
production
Maximize NPV honoring economic, operating, and well constraints
by generating thousands of what-if scenarios
Observation WellInjection WellVent Well
Producing Well
Temp, Press
Production
Injection
Production Well Data
Injection Well Data
Optimizer
Reservoir & Operational Facilities
Target=$100MM
Driving Value
@ the Reservoir
Steam/Water/CO2
• Leverage field data and new
data sources
• Optimize over larger areas
• Integrates w/existing workflow
• Significantly lower
computational costs
16
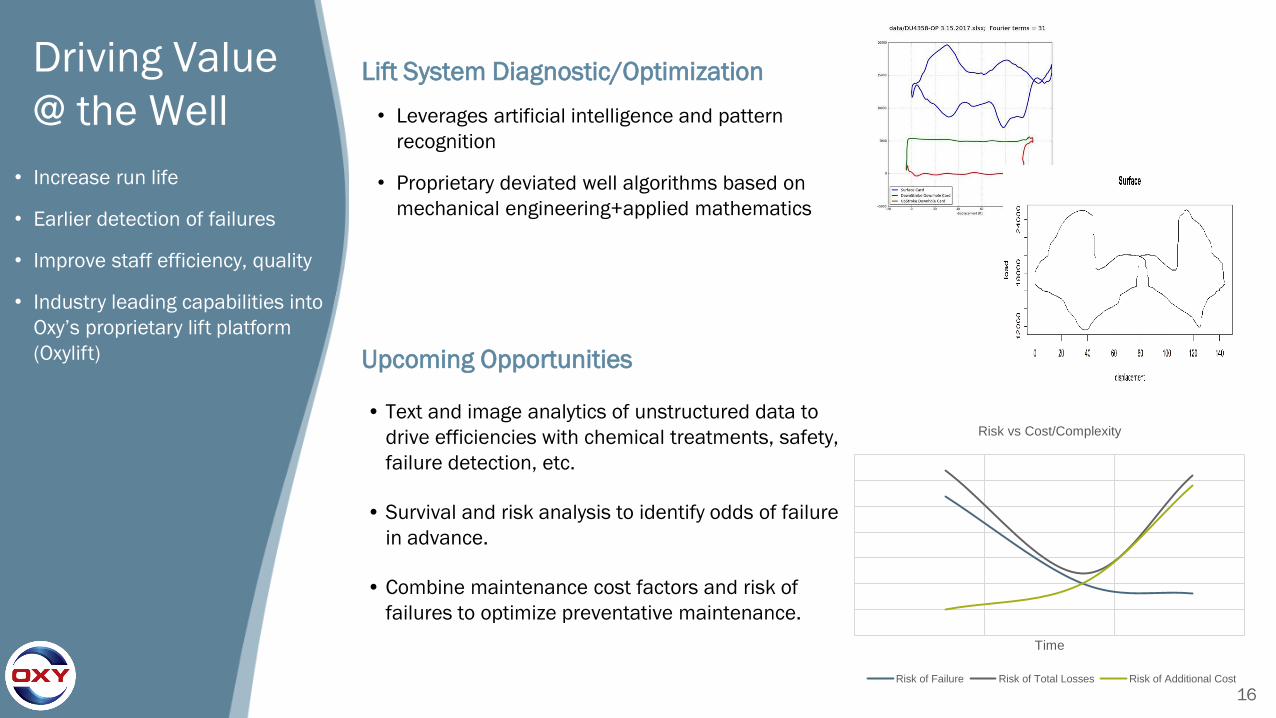
Driving Value
@ the WellLift System Diagnostic/Optimization
• Leverages artificial intelligence and pattern
recognition
• Proprietary deviated well algorithms based on
mechanical engineering+applied mathematics
Upcoming Opportunities
• Text and image analytics of unstructured data to
drive efficiencies with chemical treatments, safety,
failure detection, etc.
• Survival and risk analysis to identify odds of failure
in advance.
• Combine maintenance cost factors and risk of
failures to optimize preventative maintenance.
• Increase run life
• Earlier detection of failures
• Improve staff efficiency, quality
• Industry leading capabilities into
Oxy’s proprietary lift platform
(Oxylift)
Time
Risk vs Cost/Complexity
Risk of Failure Risk of Total Losses Risk of Additional Cost
17
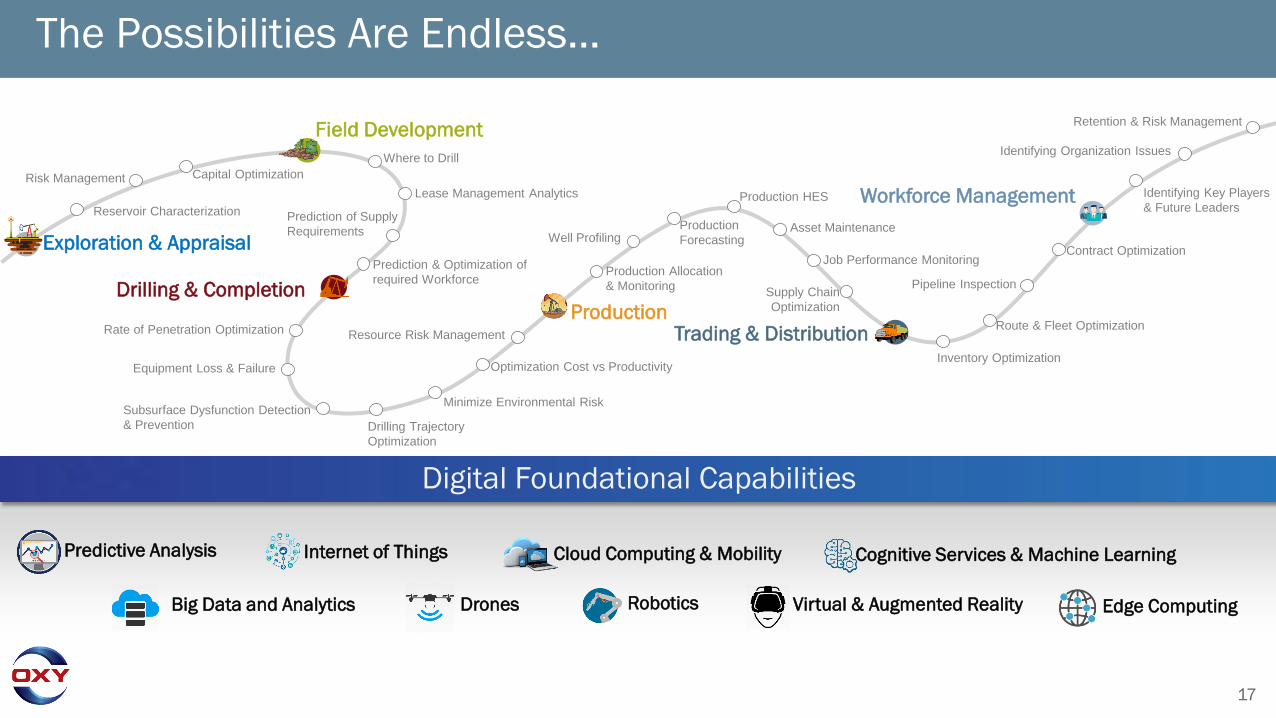
The Possibilities Are Endless…
Exploration & Appraisal
Field Development
Drilling & Completion
Trading & Distribution
Workforce Management
Production
Reservoir Characterization
Where to Drill
Lease Management Analytics
Resource Risk ManagementRate of Penetration Optimization
Production Allocation
& Monitoring
Well ProfilingProduction
ForecastingAsset Maintenance
Supply Chain
Optimization
Inventory Optimization
Route & Fleet Optimization
Pipeline Inspection
Contract Optimization
Risk Management Capital Optimization
Prediction of Supply
Requirements
Prediction & Optimization of
required Workforce
Equipment Loss & Failure
Subsurface Dysfunction Detection
& Prevention Drilling Trajectory
Optimization
Minimize Environmental Risk
Optimization Cost vs Productivity
Production HES
Job Performance Monitoring
Identifying Key Players
& Future Leaders
Identifying Organization Issues
Retention & Risk Management
Predictive Analysis
Drones Virtual & Augmented Reality
Internet of Things
Big Data and Analytics Edge Computing
Cognitive Services & Machine Learning
Robotics
Cloud Computing & Mobility
Digital Foundational Capabilities

Q&A