Embed Size (px)
Citation preview
9/4/2013
1
MDS: Current Thinking on Disease,
Diagnosis, and Treatment
David Steensma, MD FACPAssociate Professor of Medicine, Harvard Medical School
Adult Leukemia Program, Dana-Farber Cancer Institute
Hematological Oncology Service, Brigham & Women’s Hospital
Aplastic Anemia & MDS International Foundation Patient & Family Conference
Boston (Peabody), Massachusetts – September 2013
Outline
• What are myelodysplastic syndromes (MDS)?
– How common are MDS?
– Why does MDS occur (risk factors)?
• How are MDS diagnosed?
• What is the outlook (prognosis) for patients?
• How can MDS be treated?
– “Supportive care”
– Drug therapy (disease-modifying)
– Stem cell transplantation
What Are MDS?
MDS Is A Stem Cell Disorder
Neutrophil Lymphocyte
“Hematopoietic”
Acquired genetic
(DNA) damage in MDS
occurs at this level
Consequences
noted here
Four defining features of MDS
1) Marrow failure / ineffective
hematopoiesis (cytopenias)
2) Clonal hematopoiesis (abnormal
karyotype, somatic mutations)
3) Characteristic “dysplastic” hematopoietic
cell characteristic morphology
4) Instability / tendency to progress to acute
myeloid leukemia
9/4/2013
2
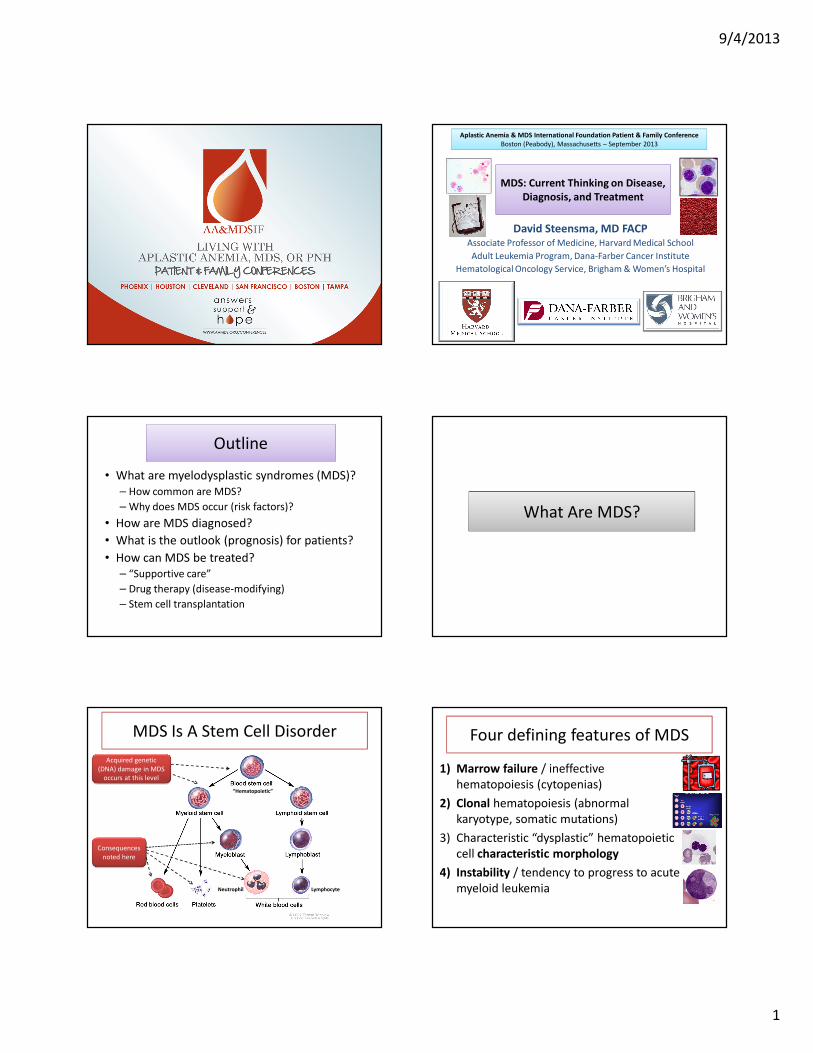
Age-dependent nature of MDS (US)
Age at MDS diagnosis (years)*P for trend < .05
0
10
20
30
40
50
< 40 40-49 50-59 60-69 70-79 ≥ 80
0.1 0.72.0
7.5
20.9
36.4*
FemalesMalesOverall
� Overall incidence in this analysis: 3.4 per 100,000
� SEER registry: ~13,000 new US cases per year
� Claims-based data: >40,000 US cases per year
Rollison DE et al Blood 2008;112:45-52.
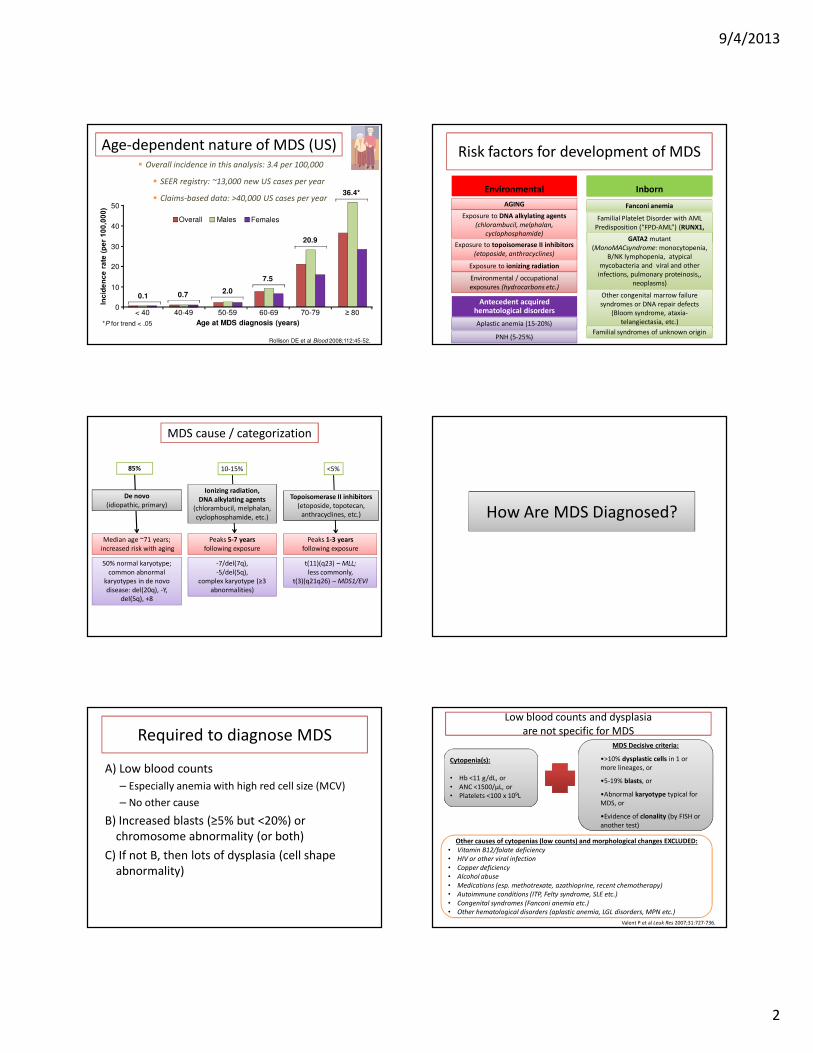
Environmental Inborn
AGING
Exposure to DNA alkylating agents
(chlorambucil, melphalan,
cyclophosphamide)
Exposure to topoisomerase II inhibitors
(etoposide, anthracyclines)
Exposure to ionizing radiation
Familial Platelet Disorder with AML
Predisposition (“FPD-AML”) (RUNX1,
CEBPA)
Environmental / occupational
exposures (hydrocarbons etc.)
GATA2 mutant
(MonoMACsyndrome: monocytopenia,
B/NK lymphopenia, atypical
mycobacteria and viral and other
infections, pulmonary proteinosis,,
neoplasms)
Risk factors for development of MDS
Antecedent acquired hematological disorders
PNH (5-25%)
Aplastic anemia (15-20%)
Other congenital marrow failure
syndromes or DNA repair defects
(Bloom syndrome, ataxia-
telangiectasia, etc.)
Familial syndromes of unknown origin
Fanconi anemia
MDS cause / categorization
De novo
(idiopathic, primary)
Ionizing radiation,
DNA alkylating agents
(chlorambucil, melphalan,
cyclophosphamide, etc.)
Peaks 5-7 years
following exposure
Peaks 1-3 years
following exposure
Topoisomerase II inhibitors
(etoposide, topotecan,
anthracyclines, etc.)
Median age ~71 years;
increased risk with aging
50% normal karyotype;
common abnormal
karyotypes in de novo
disease: del(20q), -Y,
del(5q), +8
-7/del(7q),
-5/del(5q),
complex karyotype (≥3
abnormalities)
t(11)(q23) – MLL;
less commonly,
t(3)(q21q26) – MDS1/EVI
85% 10-15% <5%
How Are MDS Diagnosed?
Required to diagnose MDS
A) Low blood counts
– Especially anemia with high red cell size (MCV)
– No other cause
B) Increased blasts (≥5% but <20%) or
chromosome abnormality (or both)
C) If not B, then lots of dysplasia (cell shape
abnormality)
Low blood counts and dysplasia
are not specific for MDS
Valent P, et al. Leuk Res. 2007;31:727-736.Valent P et al Leuk Res 2007;31:727-736.
Cytopenia(s):
• Hb <11 g/dL, or
• ANC <1500/μL, or
• Platelets <100 x 109L
MDS Decisive criteria:
•>10% dysplastic cells in 1 or
more lineages, or
•5-19% blasts, or
•Abnormal karyotype typical for
MDS, or
•Evidence of clonality (by FISH or
another test)
Other causes of cytopenias (low counts) and morphological changes EXCLUDED:
• Vitamin B12/folate deficiency
• HIV or other viral infection
• Copper deficiency
• Alcohol abuse
• Medications (esp. methotrexate, azathioprine, recent chemotherapy)
• Autoimmune conditions (ITP, Felty syndrome, SLE etc.)
• Congenital syndromes (Fanconi anemia etc.)
• Other hematological disorders (aplastic anemia, LGL disorders, MPN etc.)
9/4/2013
3
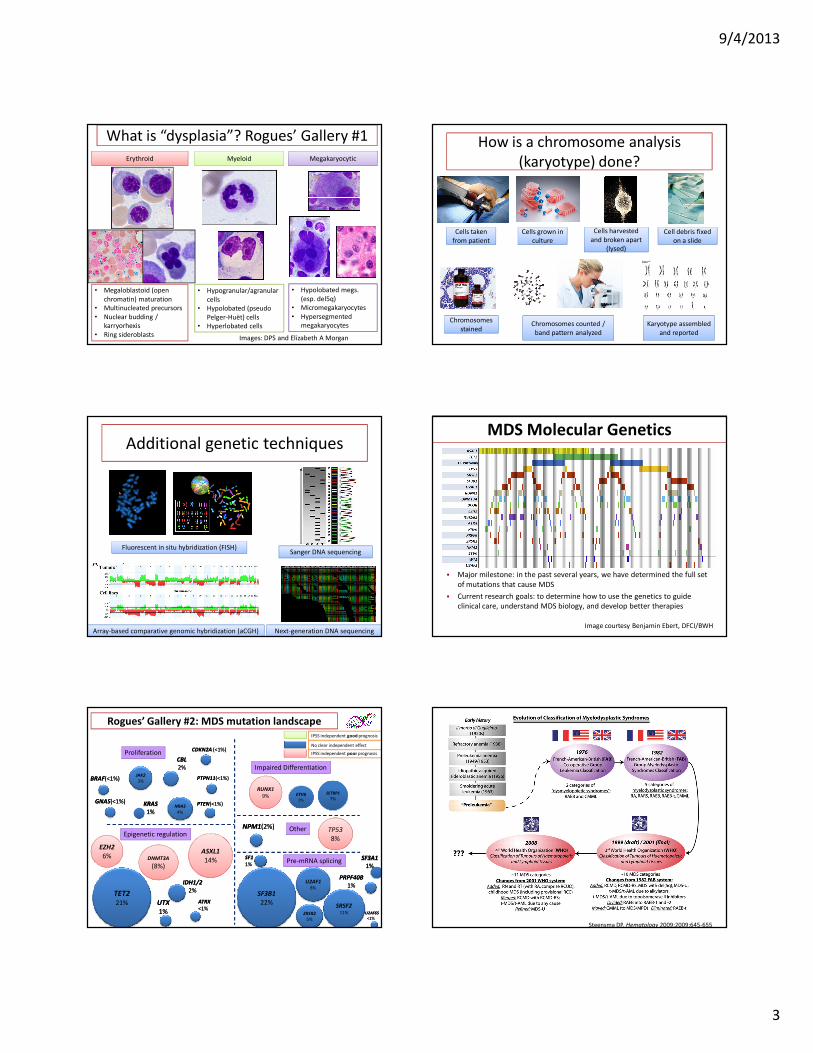
What is “dysplasia”? Rogues’ Gallery #1
Erythroid Myeloid Megakaryocytic
• Megaloblastoid (open
chromatin) maturation
• Multinucleated precursors
• Nuclear budding /
karryorhexis
• Ring sideroblasts
• Hypogranular/agranular
cells
• Hypolobated (pseudo
Pelger-Huët) cells
• Hyperlobated cells
• Hypolobated megs.
(esp. del5q)
• Micromegakaryocytes
• Hypersegmented
megakaryocytes
Images: DPS and Elizabeth A Morgan
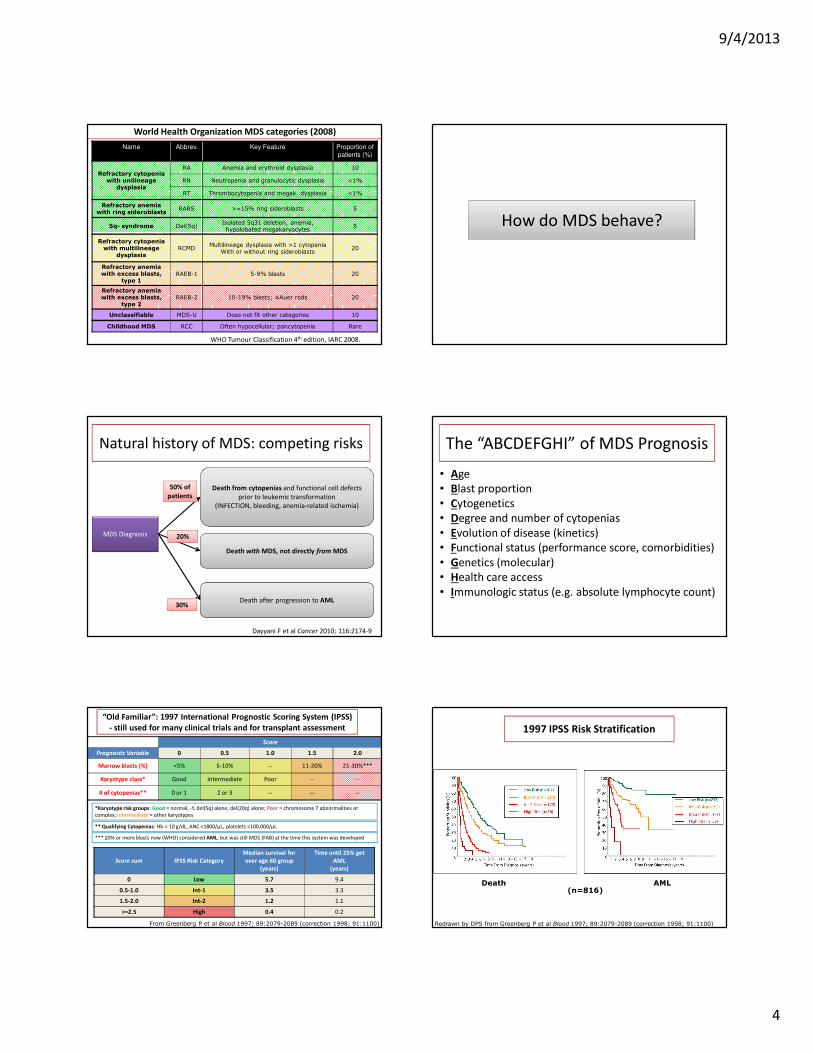
How is a chromosome analysis
(karyotype) done?
Cells taken
from patient
Cells taken
from patient
Cells grown in
culture
Cells grown in
culture
Cells harvested
(lysed)
Cells harvested
and broken apart
(lysed)
Cell debris fixed
on a slide
Cell debris fixed
on a slide
Chromosomes
stained
Chromosomes
stainedChromosomes counted /
band pattern analyzed
Karyotype assembled
and reported
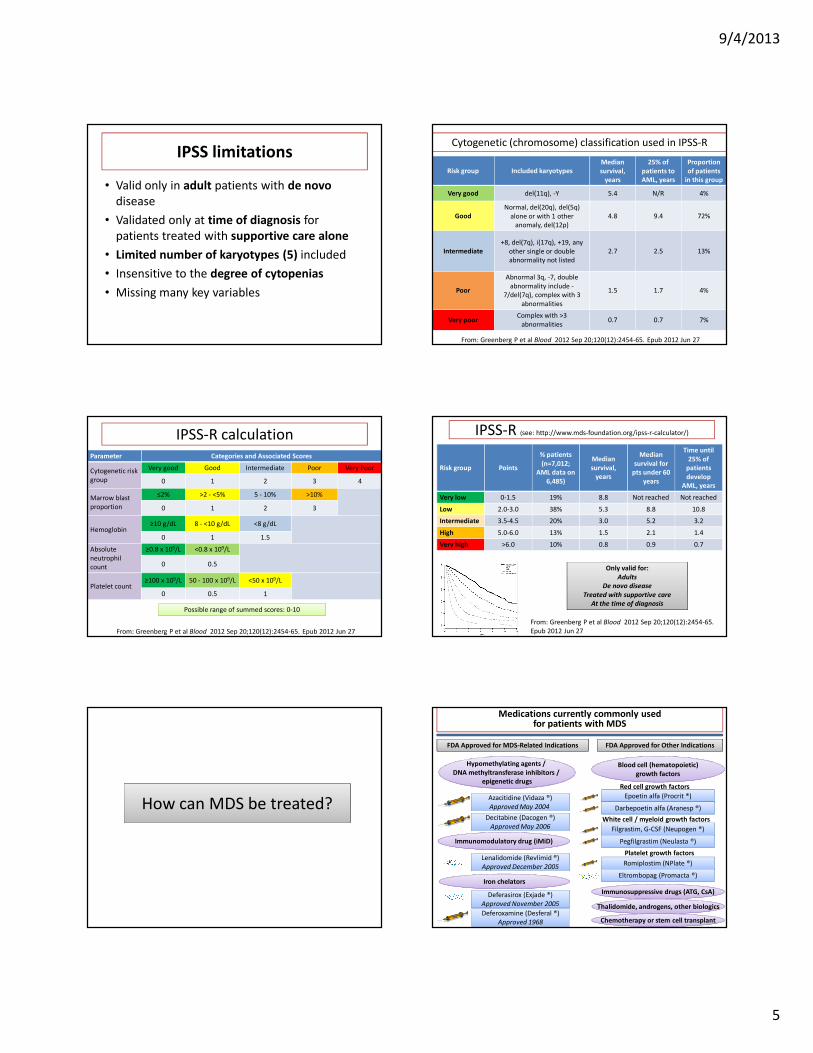
Additional genetic techniques
Fluorescent in situ hybridization (FISH)Sanger DNA sequencing
Next-generation DNA sequencingArray-based comparative genomic hybridization (aCGH)
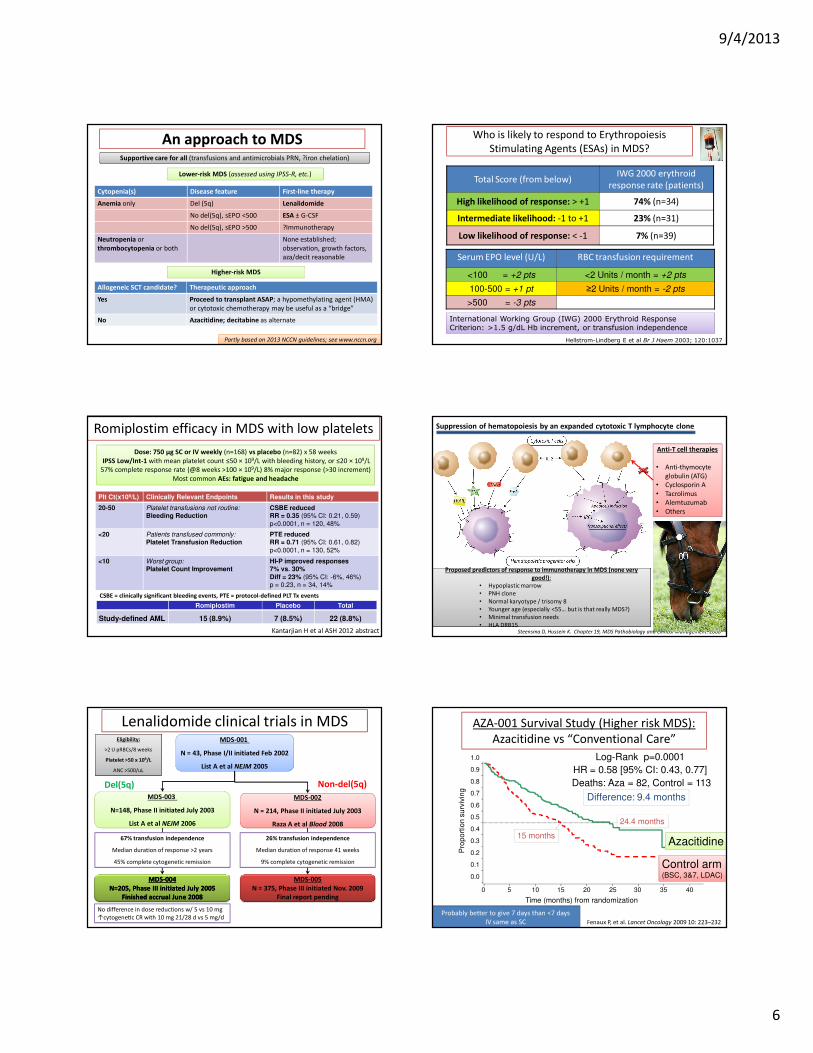
MDS Molecular Genetics
� Major milestone: in the past several years, we have determined the full set
of mutations that cause MDS
� Current research goals: to determine how to use the genetics to guide
clinical care, understand MDS biology, and develop better therapies
Image courtesy Benjamin Ebert, DFCI/BWH
TET221%
Epigenetic regulation
Proliferation
Other
Impaired Differentiation
EZH2
6%
JAK2
3%
NRAS
4%
ASXL1
14%
RUNX1
9%
TP53
8%
DNMT3A
(8%)
ETV63%
CBL CBL
2%2%
KRASKRAS
1%1%
UTX UTX
1%1%
IDH1/2IDH1/2
2%2%
NPM1NPM1(2%)(2%)
SF3B1
22%
GNASGNAS(<1(<1%)%)
BRAFBRAF(<1(<1%)%)
PTENPTEN(<1(<1%)%)
PTPN11PTPN11(<1(<1%)%)
ATRXATRX
<1%<1%
CDKN2A CDKN2A (<1(<1%)%)
IPSS independent good prognosis
IPSS independent poor prognosis
No clear independent effect
ZRSR2
5%
SRSF211%
U2AF18%
Pre-mRNA splicing SF3A1SF3A1
1%1%
PRPF40BPRPF40B
1%1%
U2AF65U2AF65
<1%<1%
SF1SF1
1%1%
SETBP1
7%
Rogues’ Gallery #2: MDS mutation landscape
Steensma DP. Hematology 2009;2009:645-655
9/4/2013
4
World Health Organization MDS categories (2008)
Name Abbrev. Key Feature Proportion of patients (%)
Refractory cytopenia with unilineage
dysplasia
RA Anemia and erythroid dysplasia 10
RN Neutropenia and granulocytic dysplasia <1%
RT Thrombocytopenia and megak. dysplasia <1%
Refractory anemia with ring sideroblasts
RARS >=15% ring sideroblasts 5
5q- syndrome Del(5q)Isolated 5q31 deletion, anemia, hypolobated megakaryocytes
5
Refractory cytopenia with multilineage
dysplasiaRCMD
Multilineage dysplasia with >1 cytopeniaWith or without ring sideroblasts
20
Refractory anemia with excess blasts,
type 1RAEB-1 5-9% blasts 20
Refractory anemia with excess blasts,
type 2RAEB-2 10-19% blasts; ±Auer rods 20
Unclassifiable MDS-U Does not fit other categories 10
Childhood MDS RCC Often hypocellular; pancytopenia Rare
WHO Tumour Classification 4th edition, IARC 2008.
How do MDS behave?
Natural history of MDS: competing risks
MDS Diagnosis
Death from cytopenias and functional cell defects
prior to leukemic transformation
(INFECTION, bleeding, anemia-related ischemia)
Death with MDS, not directly from MDS
Death after progression to AML
50% of
patients
30%
20%
Dayyani F et al Cancer 2010; 116:2174-9
The “ABCDEFGHI” of MDS Prognosis
• Age
• Blast proportion
• Cytogenetics
• Degree and number of cytopenias
• Evolution of disease (kinetics)
• Functional status (performance score, comorbidities)
• Genetics (molecular)
• Health care access
• Immunologic status (e.g. absolute lymphocyte count)
“Old Familiar”: 1997 International Prognostic Scoring System (IPSS)
- still used for many clinical trials and for transplant assessment
Score
Prognostic Variable 0 0.5 1.0 1.5 2.0
Marrow blasts (%) <5% 5-10% -- 11-20% 21-30%***
Karyotype class* Good Intermediate Poor -- --
# of cytopenias** 0 or 1 2 or 3 -- -- --
From Greenberg P et al Blood 1997; 89:2079-2089 (correction 1998; 91:1100)
*Karyotype risk groups: Good = normal, -Y, del(5q) alone, del(20q) alone; Poor = chromosome 7 abnormalities or
complex; Intermediate = other karyotypes
** Qualifying Cytopenias: Hb < 10 g/dL, ANC <1800/μL, platelets <100,000/μL
*** 20% or more blasts now (WHO) considered AML, but was still MDS (FAB) at the time this system was developed
Score sum IPSS Risk Category
Median survival for
over age 60 group
(years)
Time until 25% get
AML
(years)
0 Low 5.7 9.4
0.5-1.0 Int-1 3.5 3.3
1.5-2.0 Int-2 1.2 1.1
>=2.5 High 0.4 0.2
1997 IPSS Risk Stratification
Redrawn by DPS from Greenberg P et al Blood 1997; 89:2079-2089 (correction 1998; 91:1100)
(n=816)Death AML
9/4/2013
5
IPSS limitations
• Valid only in adult patients with de novo
disease
• Validated only at time of diagnosis for
patients treated with supportive care alone
• Limited number of karyotypes (5) included
• Insensitive to the degree of cytopenias
• Missing many key variables
Risk group Included karyotypes
Median
survival,
years
25% of
patients to
AML, years
Proportion
of patients
in this group
Very good del(11q), -Y 5.4 N/R 4%
Good
Normal, del(20q), del(5q)
alone or with 1 other
anomaly, del(12p)
4.8 9.4 72%
Intermediate
+8, del(7q), i(17q), +19, any
other single or double
abnormality not listed
2.7 2.5 13%
Poor
Abnormal 3q, -7, double
abnormality include -
7/del(7q), complex with 3
abnormalities
1.5 1.7 4%
Very poorComplex with >3
abnormalities0.7 0.7 7%
From: Greenberg P et al Blood 2012 Sep 20;120(12):2454-65. Epub 2012 Jun 27
Cytogenetic (chromosome) classification used in IPSS-R
Parameter Categories and Associated Scores
Cytogenetic risk
group
Very good Good Intermediate Poor Very Poor
0 1 2 3 4
Marrow blast
proportion
≤2% >2 - <5% 5 - 10% >10%
0 1 2 3
Hemoglobin≥10 g/dL 8 - <10 g/dL <8 g/dL
0 1 1.5
Absolute
neutrophil
count
≥0.8 x 10⁹/L <0.8 x 10⁹/L
0 0.5
Platelet count≥100 x 109/L 50 - 100 x 109/L <50 x 109/L
0 0.5 1
Possible range of summed scores: 0-10
From: Greenberg P et al Blood 2012 Sep 20;120(12):2454-65. Epub 2012 Jun 27
IPSS-R calculation
Risk group Points
% patients
(n=7,012;
AML data on
6,485)
Median
survival,
years
Median
survival for
pts under 60
years
Time until
25% of
patients
develop
AML, years
Very low 0-1.5 19% 8.8 Not reached Not reached
Low 2.0-3.0 38% 5.3 8.8 10.8
Intermediate 3.5-4.5 20% 3.0 5.2 3.2
High 5.0-6.0 13% 1.5 2.1 1.4
Very high >6.0 10% 0.8 0.9 0.7
Only valid for:
Adults
De novo disease
Treated with supportive care
At the time of diagnosis
From: Greenberg P et al Blood 2012 Sep 20;120(12):2454-65.
Epub 2012 Jun 27
IPSS-R (see: http://www.mds-foundation.org/ipss-r-calculator/)
How can MDS be treated?
Hypomethylating agents / Hypomethylating agents /
DNA methyltransferase inhibitors /
epigenetic drugs
Azacitidine (Vidaza ®)
Approved May 2004
Azacitidine (Vidaza ®)
Approved May 2004
Decitabine (Dacogen ®)
Approved May 2006
Decitabine (Dacogen ®)
Approved May 2006
Iron chelators
Lenalidomide (Revlimid ®)
Approved December 2005
Lenalidomide (Revlimid ®)
Approved December 2005
FDA Approved for MDS-Related Indications FDA Approved for Other Indications
Immunomodulatory drug (iMiD)
Deferasirox (Exjade ®)
Approved November 2005
Deferasirox (Exjade ®)
Approved November 2005
Blood cell (hematopoietic)
growth factors
Epoetin alfa (Procrit ®)
Darbepoetin alfa (Aranesp ®)
Filgrastim, G-CSF (Neupogen ®)
Pegfilgrastim (Neulasta ®)
Red cell growth factors
White cell / myeloid growth factors
Romiplostim (NPlate ®)
Eltrombopag (Promacta ®)
Platelet growth factors
Immunosuppressive drugs (ATG, CsA)Immunosuppressive drugs (ATG, CsA)
Chemotherapy or stem cell transplantChemotherapy or stem cell transplant
Thalidomide, androgens, other biologicsThalidomide, androgens, other biologicsDeferoxamine (Desferal ®)
Approved 1968
Deferoxamine (Desferal ®)
Approved 1968
Medications currently commonly used for patients with MDS
9/4/2013
6
An approach to MDS
Cytopenia(s) Disease feature First-line therapy
Anemia only Del (5q) Lenalidomide
No del(5q), sEPO <500 ESA ± G-CSF
No del(5q), sEPO >500 ?Immunotherapy
Neutropenia or
thrombocytopenia or both
None established;
observation, growth factors,
aza/decit reasonable
Lower-risk MDS (assessed using IPSS-R, etc.)
Higher-risk MDS
Allogeneic SCT candidate? Therapeutic approach
Yes Proceed to transplant ASAP; a hypomethylating agent (HMA)
or cytotoxic chemotherapy may be useful as a “bridge”
No Azacitidine; decitabine as alternate
Supportive care for all (transfusions and antimicrobials PRN, ?iron chelation)
Partly based on 2013 NCCN guidelines; see www.nccn.org
Who is likely to respond to Erythropoiesis
Stimulating Agents (ESAs) in MDS?
Total Score (from below)IWG 2000 erythroid
response rate (patients)
High likelihood of response: > +1 74% (n=34)
Intermediate likelihood: -1 to +1 23% (n=31)
Low likelihood of response: < -1 7% (n=39)
Hellstrom-Lindberg E et al Br J Haem 2003; 120:1037
International Working Group (IWG) 2000 Erythroid Response Criterion: >1.5 g/dL Hb increment, or transfusion independence
Serum EPO level (U/L) RBC transfusion requirement
<100 = +2 pts <2 Units / month = +2 pts
100-500 = +1 pt ≥2 Units / month = -2 pts
>500 = -3 pts
Romiplostim efficacy in MDS with low platelets
Plt Ct(x109/L) Clinically Relevant Endpoints Results in this study
20-50 Platelet transfusions not routine:
Bleeding ReductionCSBE reduced RR = 0.35 (95% CI: 0.21, 0.59)
p<0.0001, n = 120, 48%
<20 Patients transfused commonly:
Platelet Transfusion ReductionPTE reduced RR = 0.71 (95% CI: 0.61, 0.82)
p<0.0001, n = 130, 52%
<10 Worst group:
Platelet Count ImprovementHI-P improved responses7% vs. 30%
Diff = 23% (95% CI: -6%, 46%)p = 0.23, n = 34, 14%
CSBE = clinically significant bleeding events, PTE = protocol-defined PLT Tx events
Dose: 750 μg SC or IV weekly (n=168) vs placebo (n=82) x 58 weeks
IPSS Low/Int-1 with mean platelet count ≤50 × 109/L with bleeding history, or ≤20 × 109/L
57% complete response rate (@8 weeks >100 × 109/L) 8% major response (>30 increment)
Most common AEs: fatigue and headache
Romiplostim Placebo Total
Study-defined AML 15 (8.9%) 7 (8.5%) 22 (8.8%)
Kantarjian H et al ASH 2012 abstract Steensma D, Hussein K. Chapter 19, MDS Pathobiology and Clinical Management. 2008
Anti-T cell therapies
• Anti-thymocyte
globulin (ATG)
• Cyclosporin A
• Tacrolimus
• Alemtuzumab
• Others
Proposed predictors of response to immunotherapy in MDS (none very
• HLA DRB15
Proposed predictors of response to immunotherapy in MDS (none very
good!):
• Hypoplastic marrow
• PNH clone
• Normal karyotype / trisomy 8
• Younger age (especially <55… but is that really MDS?)
• Minimal transfusion needs
• HLA DRB15
Suppression of hematopoiesis by an expanded cytotoxic T lymphocyte clone
Lenalidomide clinical trials in MDS
Del(5q) Non-del(5q)
MDS-001
N = 43, Phase I/II initiated Feb 2002
List A et al NEJM 2005
MDS-003
N=148, Phase II initiated July 2003
List A et al NEJM 2006
MDS-002
Raza A et al Blood 2008
MDS-002
N = 214, Phase II initiated July 2003
Raza A et al Blood 2008
Eligibility:
>2 U pRBCs/8 weeks
Platelet >50 x 109/L
ANC >500/uL
MDSMDS--004004
N=205, Phase III initiated July 2005N=205, Phase III initiated July 2005
Finished accrual June 2008Finished accrual June 2008
MDS-005
N = 375, Phase III initiated Nov. 2009
Final report pending
67% transfusion independence
Median duration of response >2 years
45% complete cytogenetic remission
26% transfusion independence
Median duration of response 41 weeks
9% complete cytogenetic remission
No difference in dose reductions w/ 5 vs 10 mg
↑cytogene^c CR with 10 mg 21/28 d vs 5 mg/d
AZA-001 Survival Study (Higher risk MDS):
Azacitidine vs “Conventional Care”
Log-Rank p=0.0001
HR = 0.58 [95% CI: 0.43, 0.77]
Deaths: Aza = 82, Control = 113
0 5 10 15 20 25 30 35 40
Time (months) from randomization
0.0
0.1
0.2
0.3
0.4
0.5
0.6
0.7
0.8
0.9
1.0
Pro
po
rtio
n s
urv
ivin
g
Control arm(BSC, 3&7, LDAC)
Azacitidine
Difference: 9.4 months
24.4 months
15 months
Fenaux P, et al. Lancet Oncology 2009 10: 223–232
Probably better to give 7 days than <7 days
IV same as SC
9/4/2013
7
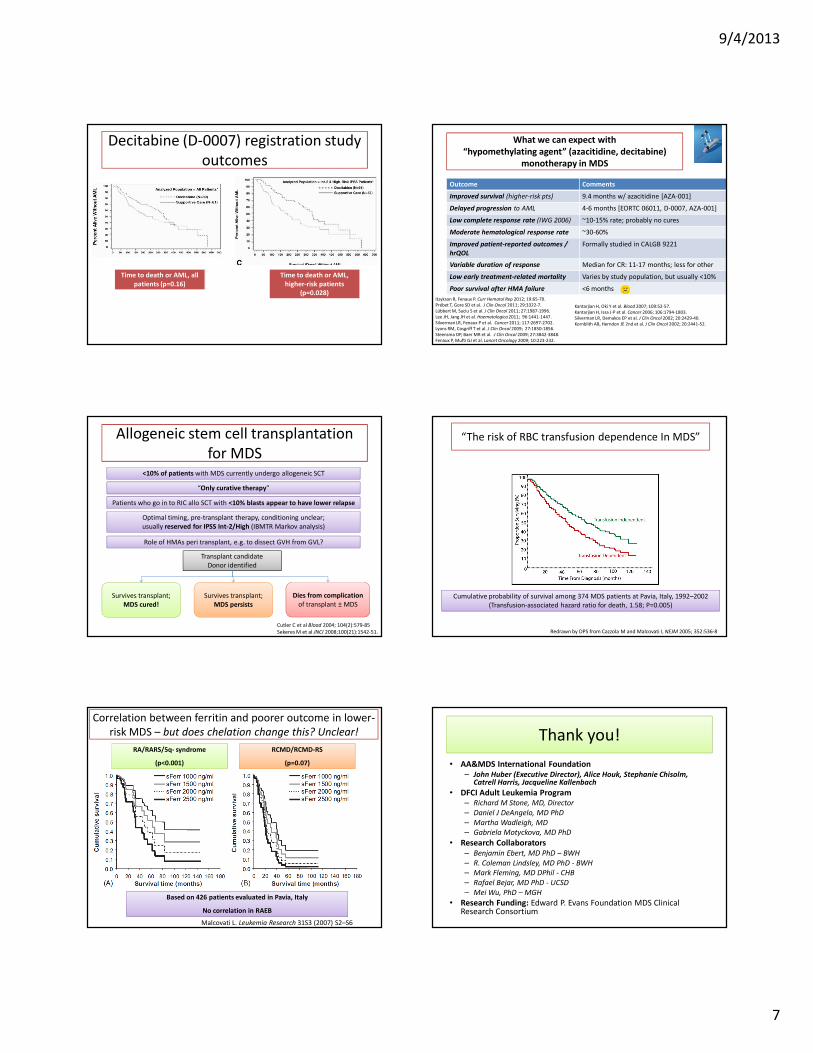
Decitabine (D-0007) registration study
outcomes
Time to death or AML, all
patients (p=0.16)
Time to death or AML,
higher-risk patients
(p=0.028)
What we can expect with
“hypomethylating agent” (azacitidine, decitabine)
monotherapy in MDS
Outcome Comments
Improved survival (higher-risk pts) 9.4 months w/ azacitidine [AZA-001]
Delayed progression to AML 4-6 months [EORTC 06011, D-0007, AZA-001]
Low complete response rate (IWG 2006) ~10-15% rate; probably no cures
Moderate hematological response rate ~30-60%
Improved patient-reported outcomes /
hrQOL
Formally studied in CALGB 9221
Variable duration of response Median for CR: 11-17 months; less for other
Low early treatment-related mortality Varies by study population, but usually <10%
Poor survival after HMA failure <6 months
Itzykson R, Fenaux P. Curr Hematol Rep 2012; 19:65-70.
Prébet T, Gore SD et al. J Clin Oncol 2011; 29:3322-7.
Lübbert M, Suciu S et al. J Clin Oncol 2011; 27:1987-1996.
Lee JH, Jang JH et al. Haematologica 2011; 96:1441-1447.
Silverman LR, Fenaux P et al. Cancer 2011; 117:2697-2702.
Lyons RM, Cosgriff T et al. J Clin Oncol 2009; 27:1850-1856.
Steensma DP, Baer MR et al. J Clin Oncol 2009; 27:3842-3848.
Fenaux P, Mufti GJ et al. Lancet Oncology 2009; 10:223-232.
Kantarjian H, Oki Y et al. Blood 2007; 109:52-57.
Kantarjian H, Issa J-P et al. Cancer 2006; 106:1794-1803.
Silverman LR, Demakos EP et al. J Clin Oncol 2002; 20:2429-40.
Kornblith AB, Herndon JE 2nd et al. J Clin Oncol 2002; 20:2441-52.
Allogeneic stem cell transplantation
for MDS<10% of patients with MDS currently undergo allogeneic SCT
“Only curative therapy”
Survives transplant;
MDS cured!
Survives transplant;
MDS persists
Patients who go in to RIC allo SCT with <10% blasts appear to have lower relapse
Transplant candidate
Donor identified
Dies from complication
of transplant ± MDS
Optimal timing, pre-transplant therapy, conditioning unclear;
usually reserved for IPSS Int-2/High (IBMTR Markov analysis)
Cutler C et al Blood 2004; 104(2):579-85
Sekeres M et al JNCI 2008;100(21):1542-51.
Role of HMAs peri transplant, e.g. to dissect GVH from GVL?
Cumulative probability of survival among 374 MDS patients at Pavia, Italy, 1992–2002
(Transfusion-associated hazard ratio for death, 1.58; P=0.005)
Redrawn by DPS from Cazzola M and Malcovati L NEJM 2005; 352:536-8
“The risk of RBC transfusion dependence In MDS”
Malcovati L. Leukemia Research 31S3 (2007) S2–S6
Correlation between ferritin and poorer outcome in lower-
risk MDS – but does chelation change this? Unclear!
Based on 426 patients evaluated in Pavia, Italy
No correlation in RAEB
RA/RARS/5q- syndrome
(p<0.001)
RCMD/RCMD-RS
(p=0.07)
Thank you!
• AA&MDS International Foundation– John Huber (Executive Director), Alice Houk, Stephanie Chisolm,
Catrell Harris, Jacqueline Kallenbach
• DFCI Adult Leukemia Program– Richard M Stone, MD, Director
– Daniel J DeAngelo, MD PhD
– Martha Wadleigh, MD
– Gabriela Motyckova, MD PhD
• Research Collaborators– Benjamin Ebert, MD PhD – BWH
– R. Coleman Lindsley, MD PhD - BWH
– Mark Fleming, MD DPhil - CHB
– Rafael Bejar, MD PhD - UCSD
– Mei Wu, PhD – MGH
• Research Funding: Edward P. Evans Foundation MDS Clinical Research Consortium