Embed Size (px)
Citation preview
THE JOURNAL OF COMPARATIVE NEUROLOGY 247:398-415 (1986)
Organization of the Callosal Connections of Visual Areas V1 and V2 in
the Macaque Monkey
HENRY KENNEDY, COLETTE DEHAY, AND JEAN BULLIER Laboratoire de Neuropsychologie Experimentale, Unite 94, INSERM,
69500 Bron, France
ABSTRACT The interhemispheric efferent and afferent connections of the V1N2
border have been examined in the adult macaque monkey with the tracers horseradish peroxidase and horseradish peroxidase conjugated to wheat germ agglutinin. The V1N2 border was found to have reciprocal connections with the contralateral visual area V1, as well as with three other cortical sites situated in the posterior bank of the lunate sulcus, the anterior bank of the lunate sulcus, and the posterior bank of the superior temporal sulcus.
Within V1, callosal projecting cells were found mainly in layer 4B with a few cells in layer 3. Anterograde labeled terminals were restricted to layers 2,3,4B, and 5 . In extrastriate cortex, retrograde labeled cells were in layers 2 and 3 and only very rarely in infragranular layers. In the posterior bank of the lunate sulcus, labeled terminals were scattered throughout all cortical layers except layers 1 and 4. In the anterior bank of the lunate sulcus and in the superior temporal sulcus, anterograde labeled terminals were largely focused in layer 4.
Callosal connections in all contralateral regions were organized in a columnar fashion. Columnar organization of callosal connections was more apparent for anterograde labeled terminals than for retrograde labeled neu- rons. In the posterior bank of the lunate sulcus, columns of callosal connec- tions were superimposed on regions of high cytochrome activity.
The tangential extent of callosal connections in V1 and V2 was found to be influenced by eccentricity in the visual field. Callosal connections were denser in the region of V1 subserving foveal visual field than in cortex representing the periphery. In V1 subserving the fovea, callosal connections extended up to 2 mm from the V1N2 border and only up to 1 mm in more peripheral located cortex. In area V2 subserving the fovea, cortical connec- tions extended up to 8 mm from the V1N2 border and only up to 3 mm in peripheral cortex.
Key words: visual cortex, cytochrome oxidase, horseradish peroxidase
Extrinsic cortical connections can be placed in one of two groups: those that connect cortical areas within one hemi- sphere (associational or intrahemispheric connections) and those that link areas that belong to each hemisphere (inter- hemispheric connections) (Fisken et al., '75). It is generally believed that, in the visual system, connections between cortical areas link regions subserving a common part of the visual field. This raises a problem for interhemispheric connections, since the visual space represented within ex- trastriate areas of each hemisphere is almost entirely re- stricted to the contralateral visual hemifield so that callosal
0 1986 ALAN R. LISS, INC.
connections originating or terminating in cortical regions subserving parts of the visual field other than the vertical meridian must link noncorresponding points on the cortex. In view of this particularity of interhemispheric connec- tions, it is important to determine whether they differ from associational connections in other respects. In the present study we have therefore set out to determine, by using sensitive neuronal tracers, to what extent interhemispheric
Accepted January 8, 1986.
CALLOSAL CONNECTIONS OF VISUAL AREAS V1 AND V2 IN MACAQUE 399
connections of the V1N2 border in the macaque comply with the principles governing associational connections.
The concept of hierarchical or sequential processing orig- inally proposed by Hubel and Wiesel ('62, '65) to account for receptive field types in areas 17, 18 and 19 of the cat has recently been extended by Maunsell and Van Essen ('83) in an attempt to explain the relationships between the richly interconnected areas of the monkey visual cortex. The hi- erarchical relationships these authors propose are based on the general finding that forward and feedback projections can be distinguished on the basis of the laminar distribu- tion of the corticocortical cell bodies and their terminals (Kuypers et al., '65; Spatz et al., '70; Jones and Wise, '77; Kaas et al., '77a; Tigges et al., '77, '81; Wong-Riley, '78; Rockland and Pandya, '79; Weller and Kaas, '81; Maunsell and Van Essen, '83; Kennedy and Bullier, '85).
Connections between pairs of cortical areas are largely considered to be reciprocal and this is implicit in the clas- sification by Maunsell and Van Essen ('83) of the hierarchi- cal relationship between two areas so that a forward projection is reciprocated by a feedback projection. Using this scheme, these authors propose a ranking of 7 of the 10 known visual areas into 6 hierarchical levels. Of the 7 areas classified only 2 (V2 and MT) were found to occupy the same hierarchical level. This is perhaps rather surprising, considering the extensive connections of V1 to all these different areas (see Table 2 in Maunsell and Van Essen, '83). A major problem with the ranking of visual areas by Maunsell and Van Essen is that the hierarchical difference between any two areas is relative and never absolute, since the laminar distribution of corticocortical cell bodies is never purely of a forward or feedback type (Maunsell and Van Essen, '83; Kennedy and Bullier, '85). Interhemi- spheric interconnections provide an interesting test of this scheme proposed by Maunsell and Van Essen. Whereas the equivalence of hierarchical status of V4 and MT is deduced from their connectivity, clearly that of the V1N2 border in each hemisphere is already known. Therefore, the laminar distribution of callosal connections of V1N2 border should denote unambiguously the laminar distribution between cortical areas at equivalent hierarchical levels.
Unlike projections from the thalamus to area V1 (Blasdel and Lund, '83), connections between cortical areas are not organized in a strict point-to-point fashion. In this way, a small region in area V1 will interconnect with wide cortical regions in each extrastriate area (Perkel et al., '85; Zeki, '71). The extent of this divergence is characteristic of the connections between a given pair of cortical areas and con- stitutes a characteristic feature reflecting the processing carried out by the connections between the two areas. Since it is known that the V1N2 border represents the vertical meridian (Daniel and Whitteridge, '61), the extent of its contralateral projection, when correlated to visuotopic maps, will provide a measure of divergence. The degree of diver- gence will be of paramount importance for the functional interpretation of this connection.
A number of anatomical features such as lateral genicu- late nucleus (LGN) input (Myerson et al., '77; Connolly and Van Essen, '84) and cytochrome oxidase staining (Living- stone and Hubel, '84; Kennedy et al., '85b) have been re- ported to differ in cortex subserving central and peripheral visual fields. There have also been reports on an influence of eccentricity on associational connections. Area V1 sub- serving the fovea provides an input to V4 and does not project to V3A, whereas the converse is true of area V1
subserving the peripheral visual field (Zeki, '78b, '80). These connectional differences of cortex subserving central and peripheral vision make physiological sense if the analysis carried out in each extrastriate area emphasizes a specific feature of the visual world such as color or movement (Zeki, '78a). In view of the suggested role of the callosal connec- tions of the V1N2 border in binocular depth discrimination across the midline (Blakemore, '69, '70; Mitchell and Blake- more, '70), one might expect either the extent or the inten- sity of these connections to be influenced by eccentricity.
Early anatomical studies of callosal connectivity were carried out on primates and showed that callosal connec- tions were not evenly distributed across the cerebral hemi- sphere (Beevor, 1891; Valkenburg, '13; Myers, '62; Cragg and Ainsworth, '69; Zeki, '70; Karol and Pandya, '71; Fis- ken et al., '75). These studies revealed that within the visual cortex, there were callosal and acallosal regions. One major acallosal region was identified as area V1. However, subsequent studies have shown, in a number of mamma- lian species including the rat (Olavarria and Van Sluyters, '831, mouse (York and Caviness, '751, hamster (Dursteler et al., '79; So and Jen, '82; Rhodes and Fish, '83), rabbit (Swadlow et al., '78; Chow et al., '81)' squirrel (Gould, '841, cat (Innocenti and Fiore, '76; Shatz, '77; Segraves and Ro- senquist, '82a), and tree shrews (Sesma et al., '841, that although callosal projecting neurons are concentrated along the V1N2 border, they are found, albeit to a lesser extent, within area V1. The comparison of these results with pre- vious work in primates suggested therefore that absence of callosal projecting neurons in area V1 was a characteristic primate feature. However, in a recent study on prosimian and New World primates, Cusick et al. ('84) showed that callosal connections extend several millimeters into area V1 in these species. These authors concluded that the cal- losal connectivity of the prosimian and New World primate conforms to a common mammalian pattern and that the restriction of callosal connections to the outer border of area 17 is a specialization of the visual system of some higher primates. However, it is necessary to be cautious when considering negative findings of callosal projecting neurons in area 17 of Old World monkeys, since previous studies (Lund et al., '75; Winfeld et al., '75; Rockland and Panyda, '79; Van Essen et al., '82) had been carried out with insen- sitive horseradish peroxidase histochemical techniques em- ploying 3,3'-diaminobenzidine in the incubating medium. We have set out to rectify this by using HRP and HRP conjugated with wheat germ agglutin which, when pro- cessed by Mesulam's procedure (Mesulam et al., '801, is an extremely sensitive anterograde and retrograde neuronal tracer. A preliminary report of these results has been pub- lished elsewhere (Bullier et al., '85).
METHODS Three adult cynomolgus monkeys (Macaca irus) were used
in this study. Following premedication with 2 mg chlor- promazine (LargactiP), animals were anesthetized with ke- tamine hydrochloride (20 mgkg i.m.) followed by a 5050 solution of alfaxolone-alfadolone (Alfatesine3 in saline.
Axonal tracers used in this study were 2% saline solution of wheat germ agglutinin conjugated to horseradish perox- idase (WGA-HRP) or 30% saline solution of horseradish peroxidase (HRP). Tracers were delivered by pressure injec- tion with Hamilton syringes.
A large craniotomy was performed and the dura reflected to reveal the full extent of the lunate sulcus on the dorso-
400 H. KENNEDY, C. DEHAY, AND J. BULLIER
lateral cortical surface. The V1N2 border was injected in all three animals. The anterior limit of V1 can sometimes be detected from the pattern of blood vessels on the surface of the brain. It is usually located 3-4 mm posterior to the lunate sulcus. The V1N2 border was injected from the most ventral lateral limit of the lunate sulcus to within 10 mm of the interhemispheric midline. Injections were made at a shallow angle to the cortical surface and 0.1 p1 of tracer was delivered per 1 mm. So as to ensure complete filling of the V1N2 border, 2 (BK016) or 3 (BK017, M19) long injec- tions each separated by 1-2 mm were made parallel to the lunate sulcus. The first injection was separated by 2 mm from the lunate sulcus so that the cortical surface injected extended 5-7 mm posterior to the lunate sulcus. In one animal (BK017) the injections were limited to the V1N2 border and this animal received a total of 4.0 pl of WGA- HRP. The other two animals, M19 (HRP) and BK016 (WGA- HRP), received additional injections in the prelunate gyrus. In BK016 injections were also made in the anterior bank of the h a t e sulcus.
Following a 41- to 48-h survival period, the animals were transcardially perfused with 200 ml of saline followed by 2 liters of a solution of 1% paraformaldehyde and 1.25% glu- taraldehyde in phosphate buffer and 1 liter of 10% sucrose solution, in phosphate buffer. After 12 h in the 10% sucrose solution the brains were blocked and cut on a freezing microtome. Sections were cut parasagittally (BK016 and BK017) or horizontally (M19). Adjacent sections were pro- cessed for HRP histochemistry (Mesulam et al., '80) and cytochrome oxidase histochemistry (Wong-Riley, '79).
Sections of the hemisphere contralateral to injections were traced and the position of labeled neurons recorded by means of an X-Y plotting table electronically coupled to the microscope stage. The pial border and blood vessels were outlined and served as landmarks. Histological borders were determined by projecting either the adjacent cytochrome oxidase-stained section onto the plots of labeled cells or by counterstaining the section used for plotting.
RESULTS HRP-WGA has the advantage of providing a potentially
restricted pick-up zone; this tracer was injected along the V1N2 border of one animal (BK0171, and the extent of connections of the contralateral hemisphere with V1 and V2 will be inferred from the results in this animal. HRP, having a wider pick-up zone, can ensure complete filling of axon terminals; this label was massively injected in V1, the V1N2 border, and the posterior bank of the lunate sulcus in one animal (M19) and at the same sites plus the anterior bank of the lunate sulcus and the prelunate gyrus in an- other monkey (BK016). The results from BK017 and M19 and BK016 are used to compare the configuration of con- nections of the V1N2 border to the contralateral homo- logue with the connections of the V1N2 border with the ensemble of contralateral visual areas.
Callosal connections to extrastriate cortex Hetemtopic connections. The pattern of retrograde and
anterograde labeling in the contralateral hemisphere fol- lowing injections limited to the V1N2 border (case BK017) is shown in Figure 1. Here the brain has been sectioned parasagittally and low section numbers correspond to more lateral levels. Four cortical loci of callosal connections are apparent: one in area 17 and three separate loci in extras- triate cortex. In cortex immediately adjacent to area 17,
callosal connections are found in the more lateral sections extending down to the fundus of the lunate sulcus and the posterior bank of the inferior occipital sulcus. In more me- dial sections, as the lunate sulcus becomes deeper, labeling is found in two distinct regions in the lunate sulcus: a first region adjacent to V1, consisting of patches of callosal con- nections almost certainly entirely within V2, and a second region in the fundus of the lunate sulcus. Progressing fur- ther medially, the zone of callosal connections at the fundus of the lunate sulcus shifts over to the lower part of the anterior bank of the lunate sulcus before disappearing. The fourth and most anterior locus of callosal connections is found in the posterior bank of the superior temporal sulcus.
This extensive labeling of the contralateral hemisphere raises the question of heterotopicity of callosal connections, that is to say, the existence of projections linking the Vli V2 border to regions other than its contralateral homo- logue. One possible cause of these findings is that the HRP- WGA might have spread from the site of injection and been picked up in regions ipsilateral to the injection site corre- sponding to the heterotopic regions of labeling in the con- tralateral hemisphere. This would suppose diffusion of label down to the fundus of the lunate sulcus (i.e., a distance of 4-8 mm) and, even more unlikely, to the ipsilateral supe- rior temporal sulcus. In fact the pick-up zone of the HRP- WGA injection was extremely small, as demonstrated by the small size of projection zones in the superior colliculus and the very narrow column of back-filled cells in the re- gion representing the vertical meridian within the lateral geniculate nucleus. Further, when injections were extended to the prelunate gyrus (in BK016), additional regions of callosal connections were found on the upper part of the anterior bank of the lunate sulcus as well as on the prelun- ate gyrus. Since labeling did not occur in these regions in BK017, this must mean that HRP-WGA did not leak across the lunate sulcus in this animal. These results show conclu- sively, therefore, that the V1N2 border receives and pro- jects heterotopically to two sites, one in the fundus of the lunate sulcus and the other in the posterior bank of the superior temporal sulcus.
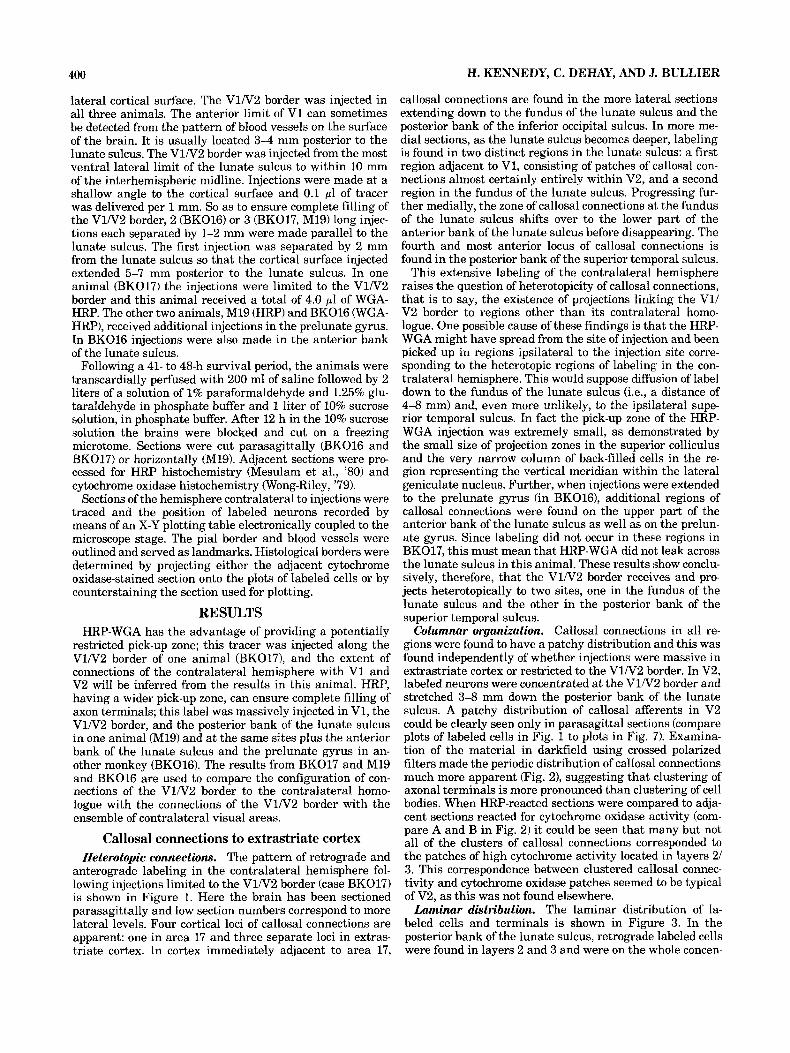
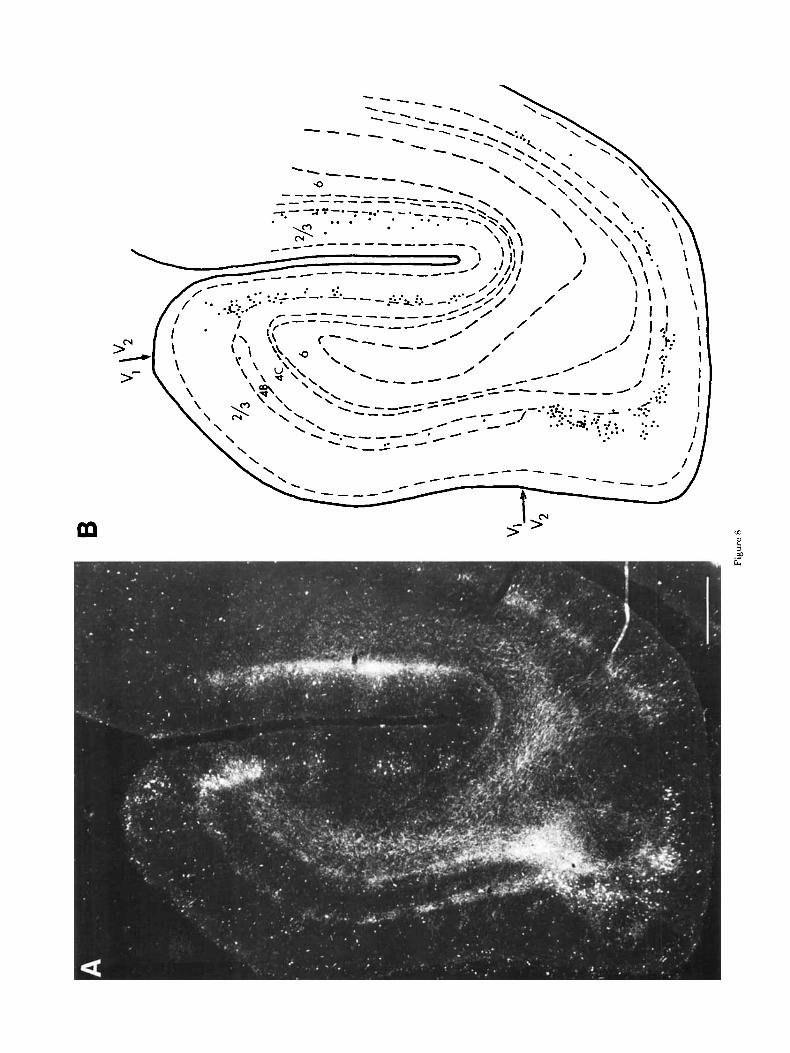
Columnar organization. Callosal connections in all re- gions were found to have a patchy distribution and this was found independently of whether injections were massive in extrastriate cortex or restricted to the V1N2 border. In V2, labeled neurons were concentrated a t the V1N2 border and stretched 3-8 mm down the posterior bank of the h a t e sulcus. A patchy distribution of callosal afferents in V2 could be clearly seen only in parasagittal sections (compare plots of labeled cells in Fig. 1 to plots in Fig. '7). Examina- tion of the material in darkfield using crossed polarized filters made the periodic distribution of callosal connections much more apparent (Fig. 21, suggesting that clustering of axonal terminals is more pronounced than clustering of cell bodies. When HRP-reacted sections were compared to adja- cent sections reacted for cytochrome oxidase activity (com- pare A and B in Fig. 2) it could be seen that many but not all of the clusters of callosal connections corresponded to the patches of high cytochrome activity located in layers 21 3. This correspondence between clustered callosal connec- tivity and cytochrome oxidase patches seemed to be typical of V2, as this was not found elsewhere.
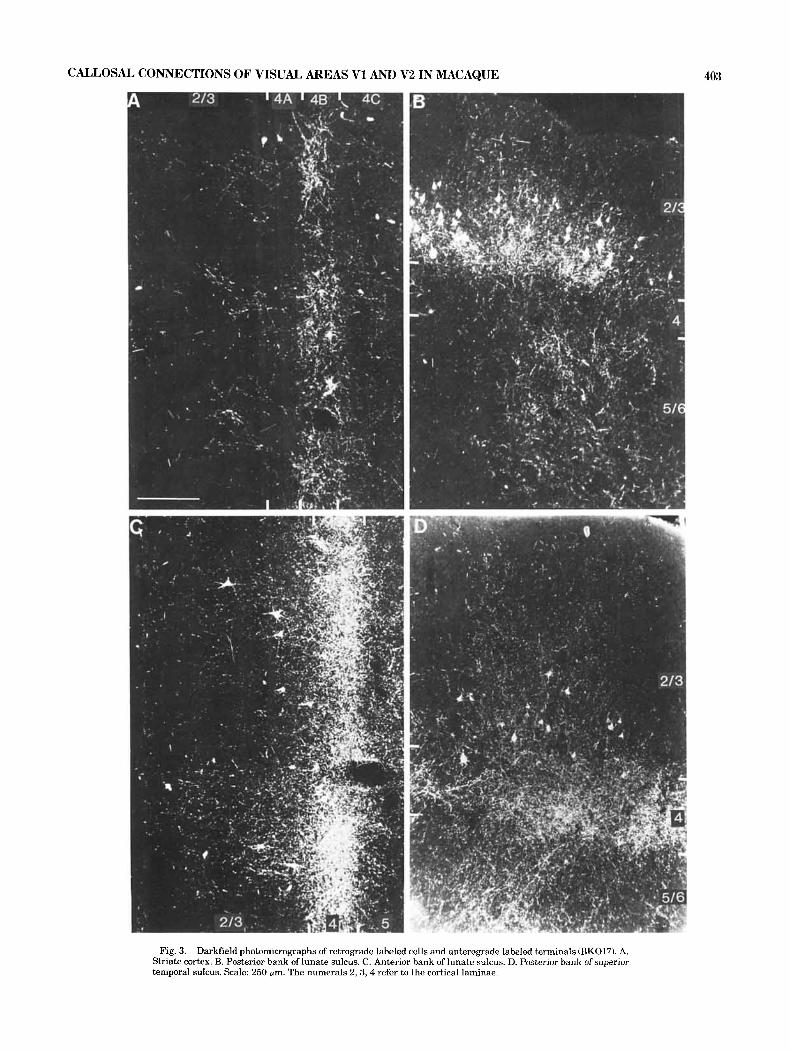
Laminar distribution. The laminar distribution of la- beled cells and terminals is shown in Figure 3. In the posterior bank of the lunate sulcus, retrograde labeled cells were found in layers 2 and 3 and were on the whole concen-
CALLOSAL CONNECTIONS OF VISUAL AREAS V1 AND V2 IN MACAQUE 401
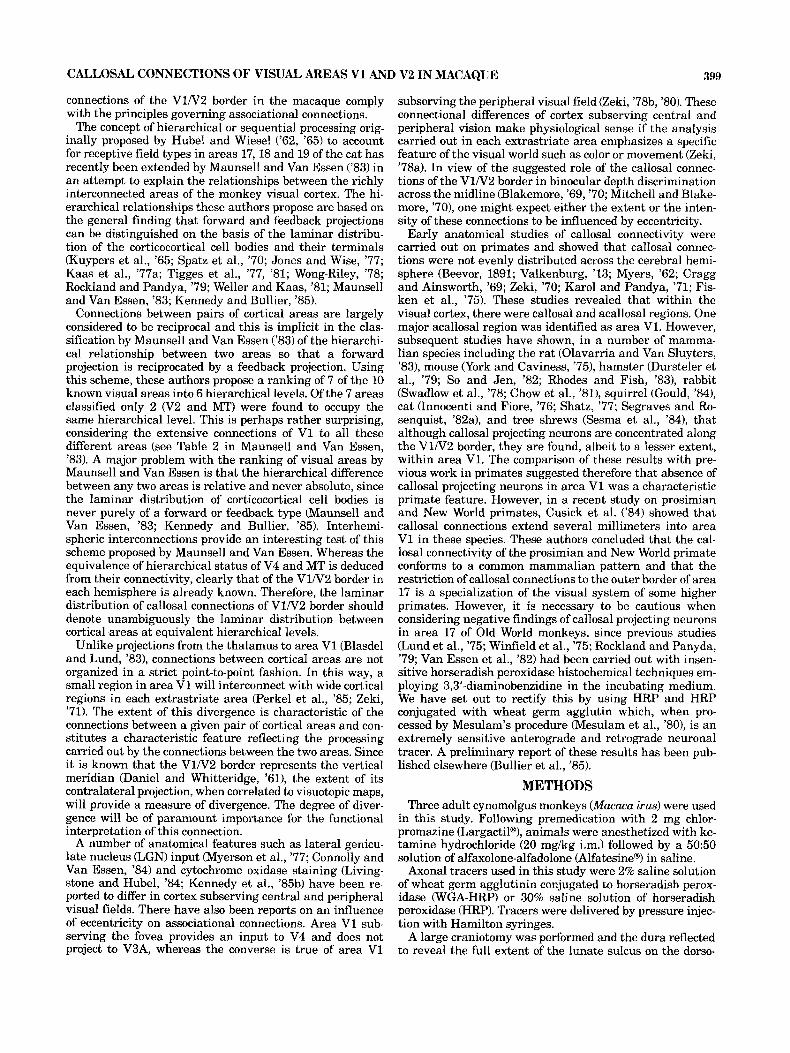
Fig. 1. Parasagittal sections of the occipital lobe (BK017) showing distribution of retrograde labeled cells (black dots) and anterograde labeled terminals and fibers (hatching) following injection of the contralateral V1/ V2 border with HRP-WGA. Low section numbers correspond to lateral levels and high numbers to more medial levels. Scale: 2 mm.
trated at the bottom of layer 3 (Fig. 6B). Anterograde label- ing was relatively sparse and and was found in all cortical layers (Fig. 3B). There did appear to be less anterograde labeling in layer 4 in cortex immediately adjacent to striate cortex corresponding to the visual area V2 (Figs. 3B, 6B). In all three animals, including BK017, anterograde label- ing was much stronger in cortical regions anterior to area V2 (Figs. 3,8). In these regions, neurons projecting into the callosum and their site of termination appeared to be lo-
cated in different laminae. In the anterior bank of the lunate sulcus, retrograde labeled cells were located in lay- ers 2 and 3 and the terminals of callosal axons in layer 4 (Figs. 3C, 8A). The exact location of labeled cells within layers 2 and 3 varied according to the patchy distribution of callosal connections: within patches of callosal connec- tions, labeled cells were found throughout the entire width of layers 2 and 3; outside patches, labeled cells were con- fined to the bottom of layer 3 (Figs. 3C, 8A).
402 H. KENNEDY, C. DEHAY, AND J. BULLIER
Fig. 2. Parasagittal adjacent sections of the posterior bank of the lunate sulcus (BK017) showing the location and distribution of callosal afferents and labeled terminals following HRP-WGA injection of the contralateral V1N2 border. A. Patch-like distribution of cytochrome oxidase activity in
V2. B. Darkfield photomicrograph of adjacent section using cross-polarized filters that made it possible to visualize labeling of neuronal processes including axon terminals. Under these conditions the patchy distrlbution of callosal connections is very clear. Scale: 2 mm.
The posterior bank of the superior temporal sulcus showed a distribution of dense terminals focused in layer 4 and parent cell bodies in layers 2 and 3 (Fig. 3D) similar to that found in the anterior bank of the lunate sulcus. However, an additional zone of callosal terminals was found in layer 6 in the suDerior ternDora1 sulcus.
in V1 is characteristic, consisting of fine dust-like HRP reaction product typical of axonal terminals, on either side of a region that is relatively free of HRP reaction product. These two arms of label in V1 showing callosal connections come together at the V1N2 border giving a typical U shape. The region between the two arms of the U is traversed by occasional axons that course in a direction away from the V1N2 border into the white matter. In some cases, these Callosal connections of striate cortex
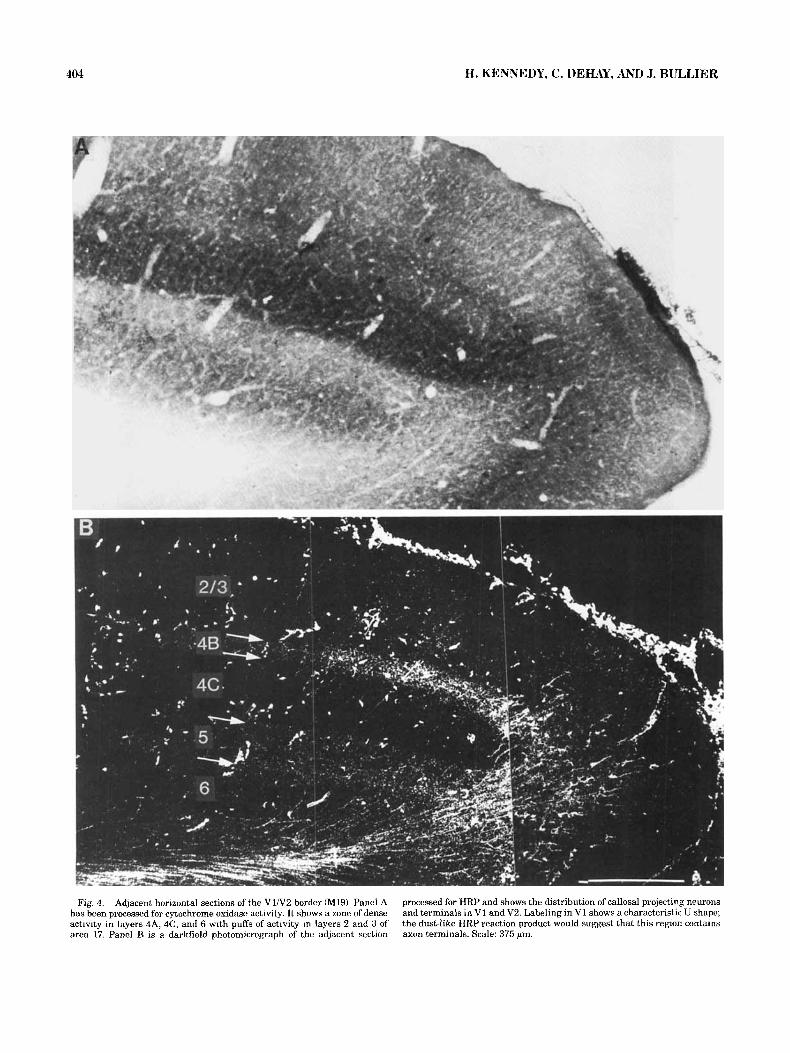
Both HRP-WGA and HRP injections revealed callosal connections to the contralateral area V1. We have followed the lamination scheme proposed by Brodmann (Billings- Gagliardi et al., '74). The density of labeling was relatively sparser than in extrastriate cortex and characterized by two distinctive bands of label in infra- and supragranular layers (Fig. 4B). In Figure 4B the extent of callosal connec- tion in V1 is shown at a site about 1 cm medial to the foveal representation in the cortex. At this level, callosal connec- tions extended up to about 1 mm into area V1 although, in more central regions, the extent could be greater (see fur- ther). Overall, callosal connections were restricted in V1 to a 1- to 2.5-mm-wide band of cortex laying adjacent to the V1N2 border that terminated abruptly so that V1 consisted of a callosal and acallosal component. The pattern of label
axons can be traced to a retrograde labeled cell (Fig. '6), but in others it is not possible to decide if these are retrograde of anterograde labeled axons or collaterals of retrograde labeled cells.
The disposition of callosal connectivity in V1, its abrupt discontinuity at the boundary with V2 making a tuning fork pattern, is reminiscent of the change in layer 4 be- tween these two areas. This is immediately apparent when one compares adjacent sections processed for HRP and cy- tochrome oxidase activity (Figs. 4, 5). This shows that cal- losal terminals are mostly restricted to layers 4B and 5, thus avoiding the zones of high cytochrome activity (Fig. 5).
In addition, there was a region of less intense labeling in layers 2 and 3. This labeling was especially definite in cortex subserving central visual field (Fig. 3A). In area 17,
CALLOSAL CONNECTIONS OF VISUAL AREAS V1 AND V2 IN MACAQUE
Fig. 3. Darkfield photomicrographs of retrograde labeled cells and anterograde labeled terminals (BK017). A. Striate cortex. B. Posterior bank of lunate sulcus. C. Anterior bank of lunate sulcus. D. Posterior bank of superior temporal sulcus. Scale: 250 pm. The numerals 2 , 3 , 4 refer to the cortical laminae.
403
404 H. KENNEDY, C. DEHAY, AND J. BULLIER
Fig. 4. Adjacent horizontal sections of the V1N2 border (M19). Panel A has been processed for cytochrome oxidase activity. I t shows a zone of dense activity in layers 4A, 4C, and 6 with puffs of activity in layers 2 and 3 of area 17. Panel B is a darkfield photomicrograph of the adjacent section
processed for HRP and shows the distribution of callosal projecting neurons and terminals in V1 and V2. Labeling in V1 shows a characteristic U shape; the dust-like HRP reaction product would suggest that this region contains axon terminals. Scale: 375 pm.
CALLOSAL CONNECTIONS OF VISUAL AREAS V1 AND V2 IN MACAQUE 405
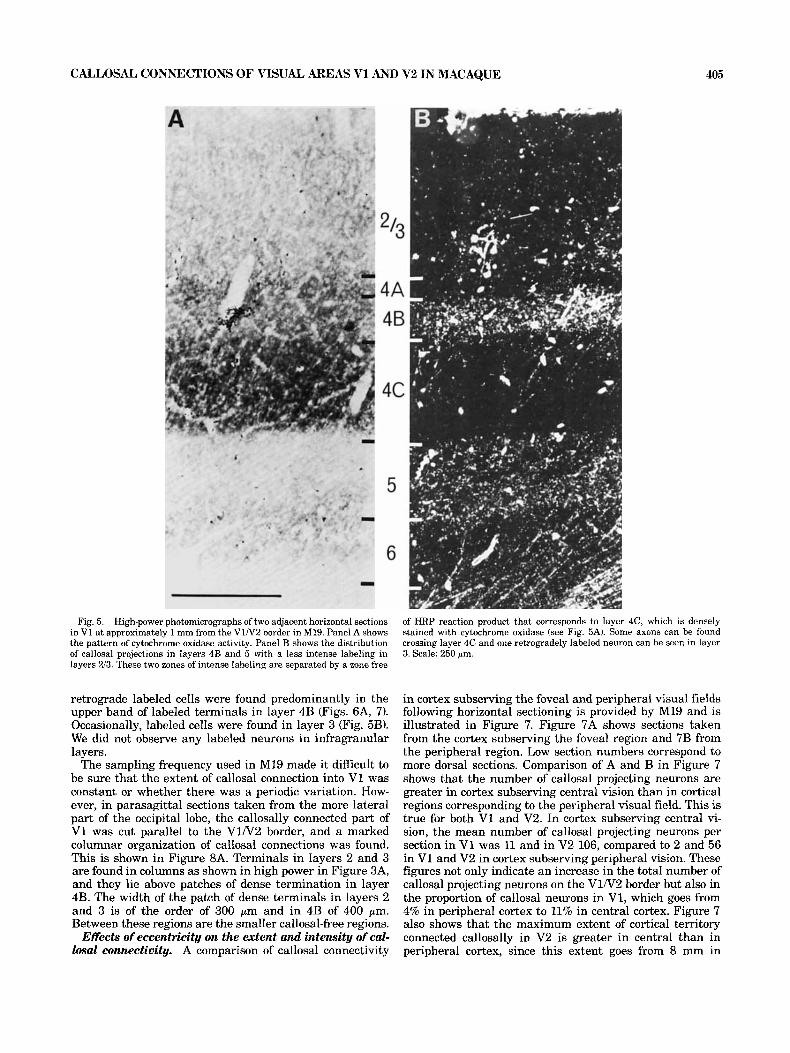
Fig. 5. High-power photomicrographs of two adjacent horizontal sections in V1 at approximately 1 mm from the V1N2 border in M19. Panel A shows the pattern of cytochrome oxidase activity. Panel B shows the distribution of callosal projections in layers 4B and 5 with a less intense labeling in layers 213. These two zones of intense labeling are separated by a zone free
of HRP reaction product that corresponds to layer 4C, which is densely stained with cytochrome oxidase (see Fig. 5A). Some axons can be found crossing layer 4C and one retrogradely labeled neuron can he seen in layer 3. Scale: 250 pm.
retrograde labeled cells were found predominantly in the upper band of labeled terminals in layer 4B (Figs. 6A, 7). Occasionally, labeled cells were found in layer 3 (Fig. 5B). We did not observe any labeled neurons in infragranular layers.
The sampling frequency used in M19 made it difficult to be sure that the extent of callosal connection into V1 was constant or whether there was a periodic variation. How- ever, in parasagittal sections taken from the more lateral part of the occipital lobe, the callosally connected part of V1 was cut parallel to the V1N2 border, and a marked columnar organization of callosal connections was found. This is shown in Figure 8A. Terminals in layers 2 and 3 are found in columns as shown in high power in Figure 3A, and they lie above patches of dense termination in layer 4B. The width of the patch of dense terminals in layers 2 and 3 is of the order of 300 pm and in 4B of 400 pm. Between these regions are the smaller callosal-free regions.
Effects of eccentricity on the extent and intensity of cal- losal connectivity. A comparison of callosal connectivity
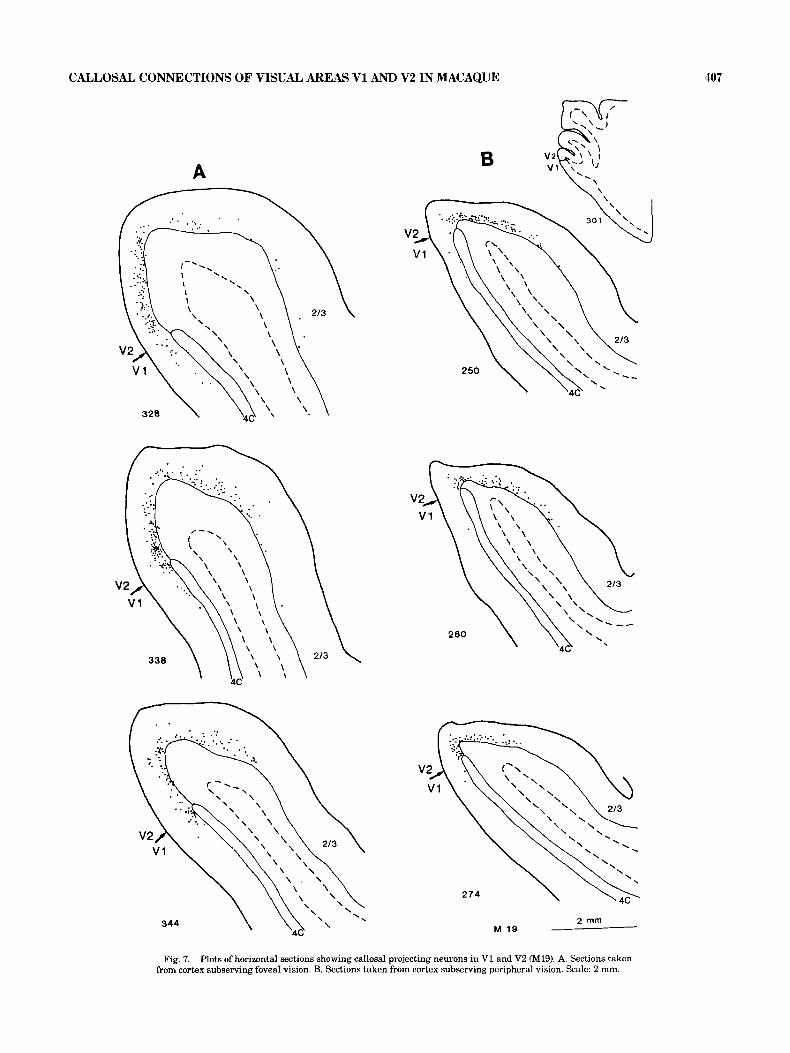
in cortex subserving the foveal and peripheral visual fields following horizontal sectioning is provided by M19 and is illustrated in Figure 7. Figure 7A shows sections taken from the cortex subserving the foveal region and 7B from the peripheral region. Low section numbers correspond to more dorsal sections. Comparison of A and B in Figure 7 shows that the number of callosal projecting neurons are greater in cortex subserving central vision than in cortical regions corresponding to the peripheral visual field. This is true for both V1 and V2. In cortex subserving central vi- sion, the mean number of callosal projecting neurons per section in V1 was 11 and in V2 106, compared to 2 and 56 in V1 and V2 in cortex subserving peripheral vision. These figures not only indicate an increase in the total number of callosal projecting neurons on the V1N2 border but also in the proportion of callosal neurons in V1, which goes from 4% in peripheral cortex to 11% in central cortex. Figure 7 also shows that the maximum extent of cortical territory connected callosally in V2 is greater in central than in peripheral cortex, since this extent goes from 8 mm in
406 H. KENNEDY, C. DEHAY, AND J. BULLIER
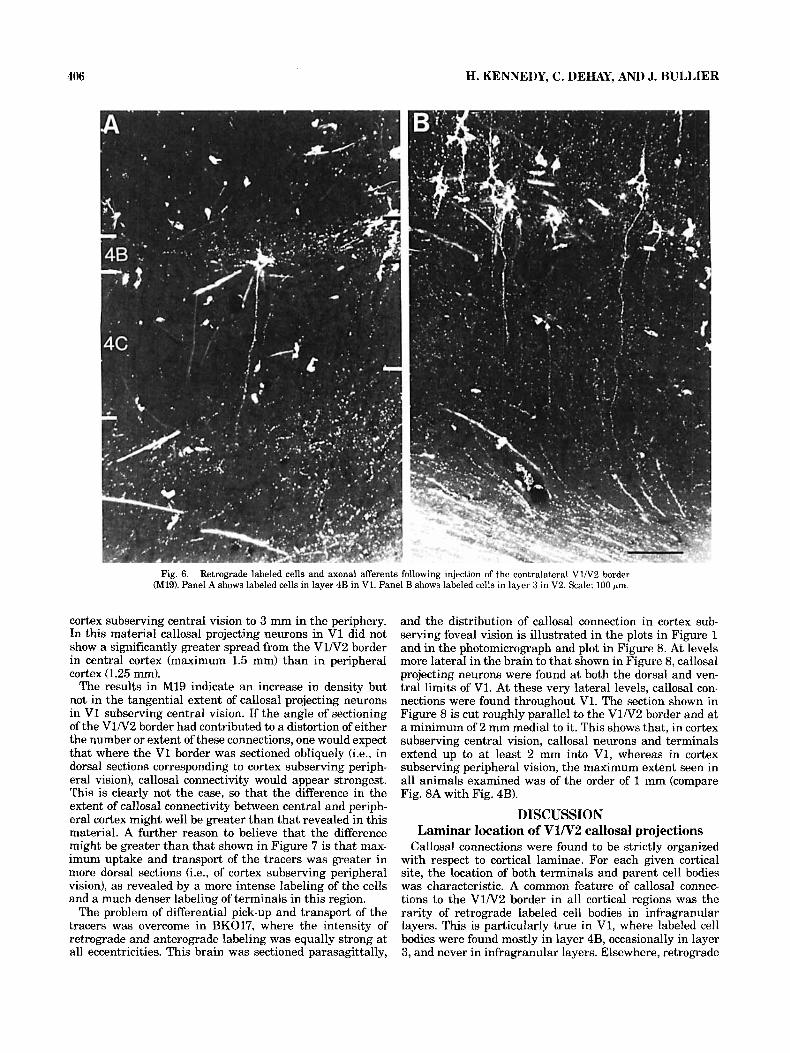
Fig. 6. Retrograde labeled cells and axonal afferents following injection of the contralateral V1N2 border (M19). Panel A shows labeled cells in layer 4B in V1. Panel B shows labeled cells in layer 3 in V2. Scale: 100 p m .
cortex subserving central vision to 3 mm in the periphery. In this material callosal projecting neurons in V1 did not show a significantly greater spread from the V1N2 border in central cortex (maximum 1.5 mm) than in peripheral cortex (1.25 mm).
The results in M19 indicate an increase in density but not in the tangential extent of callosal projecting neurons in V1 subserving central vision. If the angle of sectioning of the V1N2 border had contributed to a distortion of either the number or extent of these connections, one would expect that where the V1 border was sectioned obliquely (i.e., in dorsal sections corresponding to cortex subserving periph- eral vision), callosal connectivity would appear strongest. This is clearly not the case, so that the difference in the extent of callosal connectivity between central and periph- eral cortex might well be greater than that revealed in this material. A further reason to believe that the difference might be greater than that shown in Figure 7 is that max- imum uptake and transport of the tracers was greater in more dorsal sections (i.e., of cortex subserving peripheral vision), as revealed by a more intense labeling of the cells and a much denser labeling of terminals in this region.
The problem of differential pick-up and transport of the tracers was overcome in BK017, where the intensity of retrograde and anterograde labeling was equally strong at all eccentricities. This brain was sectioned parasagittally,
and the distribution of callosal connection in cortex sub- serving foveal vision is illustrated in the plots in Figure 1 and in the photomicrograph and plot in Figure 8. At levels more lateral in the brain to that shown in Figure 8, callosal projecting neurons were found at both the dorsal and ven- tral limits of V1. At these very lateral levels, callosal con- nections were found throughout V1. The section shown in Figure 8 is cut roughly parallel to the V1N2 border and a t a minimum of 2 mm medial to it. This shows that, in cortex subserving central vision, callosal neurons and terminals extend up to at least 2 mm into V1, whereas in cortex subserving peripheral vision, the maximum extent seen in all animals examined was of the order of 1 mm (compare Fig. 8A with Fig. 4B).
DISCUSSION Laminar location of V1N2 callosal projections
Callosal connections were found to be strictly organized with respect to cortical laminae. For each given cortical site, the location of both terminals and parent cell bodies was characteristic. A common feature of callosal connec- tions to the V1N2 border in all cortical regions was the rarity of retrograde labeled cell bodies in infragranular layers. This is particularly true in V1, where labeled cell bodies were found mostly in layer 4B, occasionally in layer 3, and never in infragranular layers. Elsewhere, retrograde
CALLOSAL CONNECTIONS OF VISUAL AREAS V1 AND V2 IN MACAQUE
'. 8 \
2 rnm M 19
Fig. 7. Plots of horizontal sections showing callosal projecting neurons in V1 and V2 (M19). A. Sections taken from cortex subserving foveal vision. 3. Sections taken from cortex subserving peripheral vision. Scale: 2 mm.
407
>" >- m
CALLOSAL CONNECTIONS OF VISUAL AREAS V1 AND V2 IN MACAQUE 409
IPSILATERAL CORTICO-CORTICAL CONNECTIONS
A) Feedforward B) Feedback C) Lateral connection (eg V 1 -MT) (eg MT- V 1) (eg V 4 d M T )
.............
A ............. ............. ............. ............. 4 A AAA
AAA 4
--Lx CONTRALATERAL CORTICO-CORTICAL .CONNECTIONS
D) VI/V2--V3 or M T E) V l I V 2 - V l F) V l / V 2 - V 2
AAA AAA 4 4 ............. ............. ............. .............
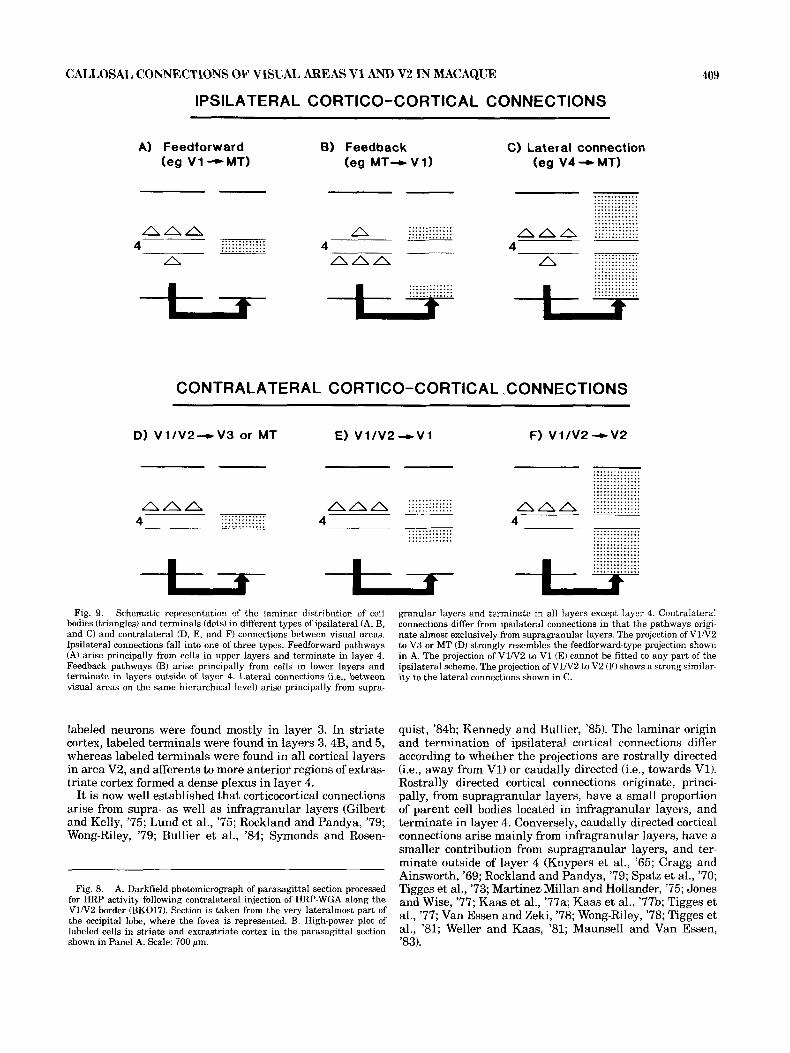
-t-lf* Fig. 9. Schematic representation of the laminar distribution of cell
bodies (triangles) and terminals (dots) in different types of ipsilateral (A, B, and C) and contralateral fD, E, and F) connections between visual areas. Ipsilateral connections fall into one of three types. Feedforward pathways (A) arise principally from cells in upper layers and terminate in layer 4. Feedback pathways (B) arise principally from cells in lower layers and terminate in layers outside of layer 4. Lateral connections (i.e., between visual areas on the same hierarchical level) arise principally from supra-
labeled neurons were found mostly in layer 3. In striate cortex, labeled terminals were found in layers 3,4B, and 5, whereas labeled terminals were found in all cortical layers in area V2, and afferents to more anterior regions of extras- triate cortex formed a dense plexus in layer 4.
It is now well established that corticocortical connections arise from supra- as well as infragranular layers (Gilbert and Kelly, '75; Lund et al., '75; Rockland and Pandya, '79; Wong-Riley, '79; Bullier et al., '84; Symonds and Rosen-
Fig. 8. A. Darkfield photomicrograph of parasagittal section processed for HRP activity following contralateral injection of HRP-WGA along the V1N2 border fBK017). Section is taken from the very lateralmost part of the occipital lobe, where the fovea is represented. B. High-power plot of labeled cells in striate and extrastriate cortex in the parasagittal section shown in Panel A. Scale: 700 pm.
granular layers and terminate in all layers except layer 4. Contralateral connections differ from ipsilateral connections in that the pathways ori&+ nate almost exclusively from supragranular layers. The projection of V l N 2 to V3 or MT (D) strongly resembles the feedforward-type projection shown in A. The projection of V1N2 to V1 (E) cannot be fitted to any part of the ipsilateral scheme. The projection of V1N2 to V2 (F) shows a strong similar- ity to the lateral connections shown in C.
quist, '84b; Kennedy and Bullier, '85). The laminar origin and termination of ipsilateral cortical connections differ according to whether the projections are rostrally directed (i.e., away from V1) or caudally directed (i.e., towards Vl). Rostrally directed cortical connections originate, princi- pally, from supragranular layers, have a small proportion of parent cell bodies located in infragranular layers, and terminate in layer 4. Conversely, caudally directed cortical connections arise mainly from infragranular layers, have a smaller contribution from supragranular layers, and ter- minate outside of layer 4 (Kuypers et al., '65; Cragg and Ainsworth, '69; Rockland and Pandya, '79; Spatz et al., '70; Tigges et al., '73; Martinez-Millan and Hollander, '75; Jones and Wise, '77; Kaas et al., '77a; Kaas et al., '77b; Tigges et al., '77; Van Essen and Zeki, '78; Wong-Riley, '78; Tigges et al., '81; Weller and Kaas, '81; Maunsell and Van Essen, '83).
410 H. KENNEDY, C. DEHAY, AM) J. BULLIER
The principal argument in favor of rostrally and caudally directed projections underlying different types of cortical processing stems from comparison with thalamocortical connections. By analogy with the projection of the LGN to layer 4 of area V1, rostrally directed projections are consid- ered to be of the feedforward and caudally directed projec- tions of the feedback type. Feedforward projections are thought to link ascending levels and feedback descending levels in a hierarchy of processing stages (Rockland and Pandya, '79; Maunsell and Van Essen, '83). This distinction between feedback and feedforward connections has permit- ted a ranking of visual areas according to hierarchical prominence. However, there are difficulties with a rigid application of this principle, since both types of connections have been found to arise from infra- and supragranular layers, so that feedback and feedforward connections can be differentiated only from the relative proportions of infra- and supragranular layer neurons (Maunsell and Van Es- sen, '83; Kennedy and Bullier, '85). As we shall see, callosal connections can be incorporated into this scheme only with great difficulty.
The callosal projection of V1 arises uniquely from supra- granular layers and so, in terms of its origin, is of a feed forward-type projection. The termination of callosal affer- ents in V1 avoids layer 4 and is typical of a feedback projection (see Fig. 4). Clearly, therefore, the reciprocal connections of V1 with the contralateral V1N2 border are in both directions, simultaneously feedforward and feed- back in type, and they underline a breakdown of the Maun- sell and Van Essen scheme in so far as terminals of the feedback type (i.e., terminals restricted to infra- and supra- granular layers) can originate from parent cell bodies in supragranular layers. In V2, callosal terminals terminate mainly in cortical layers other than layer 4 and originate in supragranular layers. This pattern is as would be pre- dicted by the Maunsell and Van Essen ('83) scheme, since it is similar to the pattern between V4 and MT that was found by those authors and described by them as lateral connections between cortical areas on a similar hierarchi- cal level (see C and F in Fig. 9). The projection of extrastri- ate cortex (i.e., the anterior bank of the lunate sulcus and the posterior bank of the superior temporal sulcus) to the contralateral V1N2 border is almost exclusively from su- pragranular layers and therefore typical of forward-type projection. The reciprocal projections from the V1N2 bor- der to these regions terminate in layer 4 and are therefore also of the forward type. Clearly, connections of the V1N2 border with the contralatera1 heterotopic sites are recipro- cal but are not complementary, being forward-type projec- tion in both directions.
The projection site in the anterior bank of the lunate sulcus can be assimilated to V3 and that in the superior temporal sulcus to MT. These results show that, except for V2, the callosal projections of the V1N2 border cannot be characterized in terms of their laminar location in the same way as associational connections. Therefore this shows that projections between the two hemispheres fall in a special class of cortical connectivity, and this is further underlined by the fact that neurons of a given site in extrastriate cortex projecting to ipsilateral and contralateral V1N2 bor- der originate from almost mutually exclusive laminar lo- cations (compare the present results to the findings of Kennedy and Bullier, '85).
Columnar organization of callosal connections There is increasing evidence that extrinsic cortical con-
nections are not evenly distributed throughout either their
area of origin or their target areas. By making restricted injections of neuronal tracers within one area, patches of retrograde andlor anterograde label are observed in affer- ent and efferent areas (Gilbert and Kelly, '75; Jones et al., '75; Goldman and Nauta, '77; Wong-Riley, '78; Rockland and Pandya, '79; Gilbert and Wiesel, '81; Tigges et al., '81; Weller and Kaas, '83; Bullier et al., '84; Livingstone and Hubel, '84; Shipp and Zeki. '85). It is therefore not surpris- ing that interhemispheric connections are also organized in a columnar fashion. In our material we found evidence of columnar organization in every region of cortex labeled by contralateral injection, including V1. However, this colum- nar organization was not abolished by the extensive corti- cal injections, showing that truly alternating callosal and acallosal regions exist within single areas. In this respect callosal columnar organization may be different from that of ipsilateral connections, where increasing the extent of the injection results in a disappearance of the columns (Gilbert and Wiesel, '81; however, see Tigges et al., '81). Recent results have shown that the segregation of cortico- cortical pathways within area V2 correlates with the pat- tern of cytochrome oxidase staining (Livingstone and Hubel, '82, '84; De Yoe and Van Essen, '84; Shipp and Zeki, '85) and that pulvinar input is concentrated in these same re- gions (Livingstone and Hubel, '82). The present results show that neural activity in most regions of high cyto- chrome activity in V2 can be modulated by the contralat- era1 V l N 2 border. This would make sense for a particular subset of cytochrome oxidase stripes, the thick stripes, where true binocular cells are found (Hubel and Living- stone, '85).
Previous studies have shown a columnar organization of interhemispheric connections in V2 in a number of primate species as well as in the tree shrew (Myers, '62; Newsome and Allman, '80; Van Essen et al., '82; Cusick et al., '84; Sesma et al., '84). Our results agree with these studies in that they show that the columnar organization is only very weakly apparent for the distribution of callosal projecting neurons and far more pronounced for callosal terminals, as observed in callosal connections of more anterior parts of the brain (Schwartz and Goldman-Rakic, '84).
Comparison of callosal connectivity in Macaque with that in other species
Early anatomical studies in Macaques reported an ab- sence of callosal inputs into area V1 (Mettler, '35; Myers, '62; Cragg and Ainsworth, '69; Zeki, '70). However, with the advent of more sensitive techniques, occasional fibers were reported in the 0.5-1 mm or so of area V1 adjacent to area V2 (Fisken et al., '75; Van Essen et al., '82). Studies using HRP did not lead to labeling of cells in area V1 following either injections in the contralateral hemisphere or in the splenium (Lund et al., '75; Winfield et al., '75; Rockland and Pandya, '79). These studies therefore con- cluded that area V1 receives a sparse callosal input from the contralateral extrastriate cortex but that it does not itself contain neurons projecting into the callosum. Such an organization of callosal connectivity would be surprising insofar as it could be an example of nonreciprocal cortical connectivity-almost certainly rare in cortical connections (Weller and Kaas, '81; Segraves and Rosenquist, '82b; Maunsell and Van Essen, '83; Symonds and Rosenquist, '84a). The first indication that this might not be the case came from Spatz and Kunz ('841, who reported retrograde labeled cells in V1 several hundred microns from the V1/
- V2 border after contralateral injections of WGA-HRP. The
CALLOSAL CONNECTIONS OF VISUAL AREAS V1 AND V2 IN MACAQUE 411
present results show that callosal connections in area V1 are reciprocal, since labeled neurons were found through- out the 2-mm extent where labeled terminals were found.
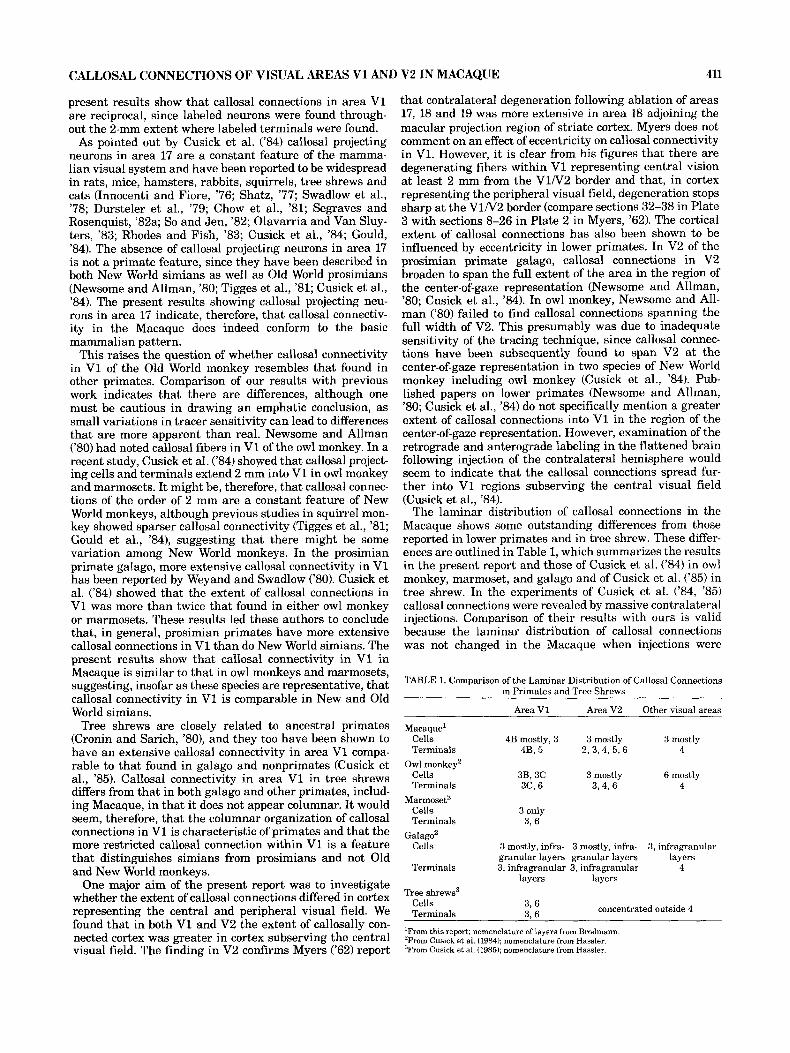
As pointed out by Cusick et al. ('84) callosal projecting neurons in area 17 are a constant feature of the mamma- lian visual system and have been reported to be widespread in rats, mice, hamsters, rabbits, squirrels, tree shrews and cats (Innocenti and Fiore, '76; Shatz, '77; Swadlow et al., '78; Dursteler et al., '79; Chow et al., '81; Segraves and Rosenquist, '82a; So and Jen, '82; Olavarria and Van Sluy- ters, '83; Rhodes and Fish, '83; Cusick et al., '84; Gould, '84). The absence of callosal projecting neurons in area 17 is not a primate feature, since they have been described in both New World simians as well as Old World prosimians (Newsome and Allman, '80; Tigges et al., '81; Cusick et al., '84). The present results showing callosal projecting neu- rons in area 17 indicate, therefore, that callosal connectiv- ity in the Macaque does indeed conform to the basic mammalian pattern.
This raises the question of whether callosal connectivity in V1 of the Old World monkey resembles that found in other primates. Comparison of our results with previous work indicates that there are differences, although one must be cautious in drawing an emphatic conclusion, as small variations in tracer sensitivity can lead to differences that are more apparent than real. Newsome and Allman ('80) had noted callosal fibers in V1 of the owl monkey. In a recent study, Cusick et al. ('84) showed that callosal project- ing cells and terminals extend 2 mm into V1 in owl monkey and marmosets. It might be, therefore, that callosal connec- tions of the order of 2 mm are a constant feature of New World monkeys, although previous studies in squirrel mon- key showed sparser callosal connectivity (Tigges et al., '81; a u l d et al., '84), suggesting that there might be some variation among New World monkeys. In the prosimian primate galago, more extensive callosal connectivity in V1 has been reported by Weyand and Swadlow ('80). Cusick et al. ('84) showed that the extent of callosal connections in V1 was more than twice that found in either owl monkey or marmosets. These results led these authors to conclude that, in general, prosimian primates have more extensive callosal connections in V1 than do New World simians. The present results show that callosal connectivity in V1 in Macaque is similar to that in owl monkeys and marmosets, suggesting, insofar as these species are representative, that callosal connectivity in V1 is comparable in New and Old World simians.
Tree shrews are closely related to ancestral primates (Cronin and Sarich, '80), and they too have been shown to have an extensive callosal connectivity in area V1 compa- rable to that found in galago and nonprimates (Cusick et al., '85). Callosal connectivity in area V1 in tree shrews differs from that in both galago and other primates, includ- ing Macaque, in that it does not appear columnar. It would seem, therefore, that the columnar organization of callosal connections in V1 is characteristic of primates and that the more restricted callosal connection within V1 is a feature that distinguishes simians from prosimians and not Old and New World monkeys.
One major aim of the present report was to investigate whether the extent of callosal connections differed in cortex representing the central and peripheral visual field. We found that in both V1 and V2 the extent of callosally con- nected cortex was greater in cortex subserving the central visual field. The finding in V2 confirms Myers ('62) report
that contralateral degeneration following ablation of areas 17, 18 and 19 was more extensive in area 18 adjoining the macular projection region of striate cortex. Myers does not comment on an effect of eccentricity on callosal connectivity in V1. However, it is clear from his figures that there are degenerating fibers within V1 representing central vision at least 2 mm from the V1N2 border and that, in cortex representing the peripheral visual field, degeneration stops sharp at the V1N2 border (compare sections 32-38 in Plate 3 with sections 8-26 in Plate 2 in Myers, '62). The cortical extent of callosal connections has also been shown to be influenced by eccentricity in lower primates. In V2 of the prosimian primate galago, callosal connections in V2 broaden to span the full extent of the area in the region of the center-of-gaze representation (Newsome and Allman, '80; Cusick et al., '84). In owl monkey, Newsome and All- man ('80) failed to find callosal connections spanning the full width of V2. This presumably was due to inadequate sensitivity of the tracing technique, since callosal connec- tions have been subsequently found to span V2 at the center-of-gaze representation in two species of New World monkey including owl monkey (Cusick et al., '84). Pub- lished papers on lower primates (Newsome and Allman, '80; Cusick et al., '84) do not specifically mention a greater extent of callosal connections into V1 in the region of the center-of-gaze representation. However, examination of the retrograde and anterograde labeling in the flattened brain following injection of the contralateral hemisphere would seem to indicate that the callosal connections spread fur- ther into V1 regions subserving the central visual field (Cusick et al., '84).
The laminar distribution of callosal connections in the Macaque shows some outstanding differences from those reported in lower primates and in tree shrew. These differ- ences are outlined in Table 1, which summarizes the results in the present report and those of Cusick et al. ('84) in owl monkey, marmoset, and galago and of Cusick et al. ('85) in tree shrew. In the experiments of Cusick et al. ('84, '85) callosal connections were revealed by massive contralateral injections. Comparison of their results with ours is valid because the laminar distribution of callosal connections was not changed in the Macaque when injections were
TABLE 1. Comparison of the Laminar Distribution of Callosal Connections in Primates and Tree Shrews
Macaque' Cells Terminals
Owl monkey' Cells Terminals
Cells Terminals
Galago' Cells
Terminals
Marmoset'
Area V1 Area V2 Other visual areas
4B mostly, 3 3 mostly 3 mostly 4B, 5 2 , 3 , 4 , 5 , 6 4
3B, 3C 3 mostly 6 mostly 3C, 6 3 , 4 , 6 4
3 only 3,6
3 mostly, infra- 3 mostly, infra- 3, infragranular granular layers granular layers layers 3, infragranular 3, infragranular 4
layers layers Tree shrews3
concentrated outside 4 Cells 3 , 6 Terminals 3 ,6
'From this report: nomenclature of layers from Brodmann. 'From Cusick et al. (1984): nomenclature from Hassler. 3From Cusick et al. (1985); nomenclature from Hassler
412 H. KENNEDY, C. DEHAY, AND J. BULLIER
extended to include prelunate gyrus. Callosal connections in area V1 in Macaque are similar to those reported in owl monkey and marmoset in that they originate uniquely from supragranular layers. Galago resembles tree shrews and other nonprimates in that callosal connections in area V1 originate from supra- and infragranular layers. It would seem, therefore, that both the origin and extent of caIlosal connections in area V1 indicate a greater similarity be- tween Old and New World simians than between Old World simians and prosimians. This similarity between Old and New World monkeys in the origins of the projections is not found in the distribution of terminals. We have shown that the site of termination of callosal fibers in area V1 in Macaques is in layers 4B and 5, whereas in the New World monkeys it is in layers 3C and 6 (Cusick et al., '84). In their study on New World simians, Cusick et al. ('84) followed Hassler's nomenclature (Hassler, '66). Layer 3C in this scheme corresponds to layer 4B of Brodmann (Billings-Gag- liardi et al., '74) so that differences in laminar distribution between callosal afferents in New and Old World simians are to be found in infragranular and not supragranular layers. Layers 5 and 6 are both output layers projecting predominantly to superior colliculus and lateral geniculate, so that the level of termination of callosal connections in infragranular layers in area V1 in Old World and New World simians constitutes a very fundamental difference in cortical wiring. This difference in callosal connectivity could constitute a characteristic feature distinguishing between New and Old World monkeys, and in this context it would be most interesting to know in which infragranular layer callosal terminals are situated in area V1 of galago.
As we have seen, the laminar distribution of callosal connections in striate cortex is very different in Macaques and New World monkeys. This contrasts with the laminar distribution in extrastriate areas, which is similar in the two groups of primates. In area V2 in New and Old World monkeys, the majority of cells projecting contralaterally were located in layer 3, with a more widespread distribu- tion than in area V1. Callosal terminals were found throughout all layers and were heaviest in layers 3 and 4. As one moves further rostrally across the cortex in both Macaques and New World monkeys, retrograde labeled cells continue to be found principally in layer 3, but callosal terminals become focused in layer 4. The laminar distribu- tion of callosal connections in cortex anterior to area V2 of galago and tree shrews resembled each other and differed from that found in simians, since they failed to show con- centrated terminals in layer 4 and had a far greater propor- tion of retrograde labeled cells in infragranular layers.
Functional significance Injection of the V1N2 border led to labeling in the contra-
lateral visual cortex at a number of distinct loci including the contralateral homologue of the injection site. The con- nection of a cortical locus to contralateral regions other than its homologue has been observed in rat, cat, and mon- key and has been referred to as heterotopicity (Mettler, '35; Nauta and Bucher, '54; Zeki, '71; Segraves and Rosenquist, '82b). Heterotopicity is an example of divergence of cortical connections permitting a given cortical region to interact with a number of cortical areas, and it is well documented in the primate visual system (Spatz and Tigges, '72; Tigges et al., '74; Wagor et al., '75). Heterotopicity may well be a general feature of callosal connections, since it has been demonstrated for interhemispheric connections outside of
the visual system (Kaas et al., '77b; Hedreen and Yin, '81). The present results show that the V1N2 border has recip-
rocal connections with a number of visual cortical areas, including those situated in the anterior bank of the lunate sulcus and in the superior temporal sulcus. Comparison of the pattern of interhemispheric connections following injec- tion of the VUV2 border shows an overall similarity with the ipsilateral connections. Injection in V1 near the V1N2 border reveals extensive ipsilateral connections including cortical regions housing V3, V3A, V4, and MT (Perkel et al., '85). Although the cortical regions connected to the ipsilateral V1N2 border are more extensive than are the zones of interhemispheric connections, it appears that the two sets of interconnections overlap, as originally suggested by Mettler ('35). In this way, the interhemispheric connec- tions of the V1N2 border with the anterior bank of the lunate sulcus and the superior temporal sulcus are localized foci that are contained within the sphere of influence of the ipsilateral V1N2 border. These results show that diver- gence of cortical connections is characteristic of both cal- losal and associational connections. The intensity of the anterograde labeling was heavier in these heterotopic sites, and furthermore it was focused in layer 4, the same layer that receives axon terminals from ipsilateral area V1 and V2. The fact that ipsilateral and callosal connections over- lap raises the possibility that the information processing of the V1 and V2 input to at least two different sites in extra- striate cortex could be modulated by activity in the contra- lateral V1N2 border.
Concerning corticocortical connections, there are theoret- ical arguments in favor of organizational principles that respect a topography that is not strictly related to the visual field. As one moves away from primary visual areas, visual fields get bigger, the anatomical correlate of which is increasing convergence of feedforward pathways and di- vergence of feedback pathways. The outcome of this is not necessarily an erosion of topography but rather a shift of emphasis away from a retinal topography, to a topography that respects some other, perhaps functional, principles. Such a connectivity could be the basis of cortical integrative mechanisms that lie at the basis of higher cortical functions (Barlow, '81). It has been proposed that the projections from the contralateral hemisphere can serve to increase the size of receptive fields so that they straddle the midline into the ipsilateral visual hemifield, as has been noted in inferior temporal cortex mocha-Miranda et al., '75) and in the vicin- ity of the V1N2 border (Kennedy, Orban, Martin, and Whitteridge, unpublished).
For callosal connections to serve to increase the receptive fields across the vertical meridian, it is necessary that the receptive fields of neurons thus connected actually include the vertical meridian. A number of experiments have shown that there is an association of callosal connectivity with the cortical representation of the line of decussation of the retina (the vertical meridian) (Choudhury et al., '65; Hubel and Wiesel, '67; Sanides, '78). However, the extent of callo- sally connected extrastriate cortex is very great (Van Essen and Zeki, '78; Van Essen et al., '82; Cusick et al., '84), certainly much greater than that of the regions where the receptive fields of neurons include the vertical meridian. Electrophysiological mapping of callosally connected cortex has shown that although there is a correlation with the vertical meridian representation, it is at best only approxi- mate (Van Essen and Zeki, '78; Newsome and Allman, '80). Furthermore, it has been reported in rabbits, cats, and monkeys that extrastriate cortex subserving the peripheral
CALLOSAL CONNECTIONS OF VISUAL AREAS V1 AND V2 IN MACAQUE 413
visual field is connected in a point-to-point fashion with the contralateral cortex subserving the mirror-symmetrical portion of the visual field (Spatz and Tigges, '72; Tigges et al., '74; Wagor et al., '75; Chow et al., '81).
Thus, it would appear that some callosal connections con- cern cortical regions coding the periphery of the visual field. These connections between cortical regions subserving dif- ferent visual hemifields could be responsible for the phe- nomena observed by Rizzolatti and Camarda ('77). These authors noted that the receptive fields of neurons in the posterior medial suprasylvian area of the cat could be influ- enced by simultaneous presentation of a second stimulds anywhere in the visual field, including the ipsilateral hem- ifield. In any case, it i s difficult to conceive that callosal connections that impinge on cortex subserving the periph- eral visual field contribute to the visual response in some sort of additive fashion. It could be that in these situations, activity in the corpus callosum serves to gate feedforward activity from more posterior cortex. There is psychophysical evidence in favor of interhemispheric modulation of associ- ational activity, since Lassonde ('85) has reported that cal- losal agenesis or section of the corpus callosum interferes with the intrahemispheric processing that is involved with depth perception.
Since the work of Hubel and Wiesel ('701, a number of authors have argued that areas V1 and V2 play a role in stereoscopic vision (Poggio and Fischer, '77; Kennedy et al., '85a). Stereopsis across the midline requires interconnec- tions between neurons with receptive fields situated within the ipsilateral and contralateraI hemifields (Blakemore, '69, '70). This could be provided by the callosal connections of V1 and V2. Evidence for a representation of the ipsilateral visual hemifield in V1 (Kennedy et al., '85a) and V2 (Van Essen and Zeki, '78; Kennedy et al., '85a) is in keeping with this hypothesis. However, Van Essen and Zeki ('78) found evidence of receptive fields extending into the ipsilateral visual hemifield even after section of the corpus callosum. It would appear, therefore, that partial decussation along the vertical meridian could also provide the anatomical substrate for stereopsis on the midline, as suggested by Bishop ('79).
Callosal connections of V1 could serve to complete intrin- sic connectivity of the area by extending the range of lat- eral connections of neurons situated near the V1N2 border. It is becoming increasingly evident that long-range intrin- sic cortical connections play an important role in the elab- oration of a number of receptive field properties including orientation selectivity, receptive field size, and excitatory or inhibitory influences from regions outside the classically defined receptive field (for a review see Gilbert, '85). These lateral connections extend up to 4 mm (Lund, '73; Fisken et al., '75) and are mostly restricted to laminae 4B and 5, where we found callosal connections. In the absence of callosal connections, a neuron situated at the virtual V1 border will make intrinsic connections mostly with neurons in V1 situated at some distance from the V1N2 border. Its local connectivity will therefore be markedly asymmetrical compared to neurons situated at some distance from the V1N2 border. Callosal connections between areas V1 of each hemisphere will complete the horizontal connectivity of neurons near the border so that the territory of local interaction of these neurons will be fully symmetrical. Con- sistent with this hypothesis is the fact that callosal connec- tions in V1 extend up to 2 mm for species as diverse as cat (Shatz, '77; Segraves and Rosenquist, '82a,b), tree shrew (Sesma et al., '841, and macaque.
ACKNOWLEDGMENTS We are grateful to NoeIle Boyer and Pascale Giroud for
technical assistance, and to Franqoise Girardet and Michele Rouviere for typing the manuscript. Funding by the Minis- tere de la Recherche et de la Technologie (MRT) grant No. 83.C.0907 is gratefully acknowledged.
LITERATURE CITED Barlow, H.B. (1981) Critical limiting factors in the design of the eye and
visual cortex. Proc. R. Soc. Lond. B 2121-34. Beevor, C.E. (1891) 111. On the course of the fibers of the cingulum and the
posterior part of the corpus callosum and fornix in the marmoset mon- key. Phil. Trans. R. Soc. Lond. 182B:135-200.
Billings-Gagliardi, S., V. Chan-Palay, and S.L. Palay (1972) A review of lamination in area 17 of the visual cortex of Macaca mulatta. J. Neuro- cytol. 3:619-629.
Bishop, P.O. (1979) Binocular vision. In R.A. Moses (ed): Ader's Physiology of the Eye. St. Louis: C.V. Mosby, pp. 575-649.
Blakemore, C. (1969) Binocular depth discrimination and the nasotemporal division. J. Physiol. 205t471-497.
Blakemore, C. (1970) Binocular depth perception and the optic chiasm. Vision Res. 10:43-47.
Blasdel, G.G., and J.S. Lund (1983) Termination of afferent axons in ma- caque striate cortex. J. Neurosci. 3:1389-1413.
Bullier, J., H. Kennedy, and W. Salinger (1984) Branching and laminar origin of projections between visual cortical areas in the cat. J. Comp. Neurol. 228t329-341.
Bullier, J., C. Dehay, and H. Kennedy (1985) Callosal connections of the visual cortex in newborn and adult Old World monkeys (Macaca irus). J. Physiol. 365t43P.
Choudhury, B.P., D. Whitteridge, and M.E. Wilson (1965) The function of the callosal connections of the visual cortex. Quart. J. Psychol. 50914- 219.
Chow, K.L., H.D. Baumhack, and R. Lawson (1981) Callosal projections of the striate cortex in the neonatal rabbit. Exp. Brain Res. 42122-126.
Connolly, M., and D.C. Van Essen (1984) The representation of the visual field in parvocellular and magnocellular layers of the lateral geniculate nucleus in the macaque monkey. J. Comp. Neural. 226t544-564.
Cragg, B.G., and A. Ainsworth (1969) The topography of the afferent projec- tions in the circumstriate visual cortex of the monkey studied by the Nauta method. Vision Res. 9333-747.
Cronin, J.E., and V.M. Sarich (1980) Tupaiid and archonta phylogeny: The macromolecular evidence. In W.P. Luckett (ed): Comparative Biology and Evolutionary Relationships of Tree Shrews. New York Plenum, pp. 293-312.
Cusick, C.G., H.J. Gould, and J.H. Kaas (1984) Interhemispheric connec- tions of visual cortex of owl monkeys (Aotus trivirgatus), marmosets (Callithrix jacchus), and galagos (Galago crassicaudatus). J. Comp. Neu- ral. 230t311-336.
Cusick, C.G., M.G. Mac Avoy, and J.H. Kaas (1985) Interhemispheric con- nections of cortical sensory areas in tree shrews. J. Comp. Neurol. 235t111-128.
Daniel, P.M., and D. Whitteridge (1961) The representation of the visual field on the cerebral cortex in monkeys. J. Physiol. 159t203-221.
De Yoe, E.A., and D.C. Van Essen (1984) Neurons projecting to MT and V4 from macaque V2 are segregated into discrete stripe-like patches. Sac. Neurosci. Abstr. 10:934.
Dursteler, M.R., C. Blakemore, and L.J. Garey (1979) Projections to the visual cortex in the golden hamster. J. Comp. Neurol. 183t185-204.
Fisken, R.A., L.J. Garey, and T.P.S. Powell (1975) The intrinsic association and commissural connections of area 17 of the visual cortex. Phil. Trans. R. Soc. B. 272:487-536.
Gilbert, C.D. (1985) Horizontal integration in the neocortex. Trends Neu- rosci. 8t160-165.
Gilbert, C.D., and J.P. Kelly (1975) The projections of cells in different layers of the cat's visual cortex. J. Comp. Neural. 163t81-106.
Gilbert, C.D., and T.N. Wiesel (1981) Projection bands in visual cortex. Neurosci. Abstr. 7:356.
Goldman, P.S., and W.J.H. Nauta (1977) Columnar distribution of cortico- cortical fibers in the frontal association, limbic, and motor cortex of the developing rhesus monkey. Brain Res. 122393-413.
Gould, H.J. (1984) I11 Intrahemispheric connections of the visual cortex in the gray squirrel (Sciurus carolinensis). J. Comp. Neural. 22.3:259-301.
414 H. KENNEDY, C. DEHAY, AND J. BULLIER
Gould, H.J., R.W. Rieck, and J.T. Weber (1984) The pattern of interhemi- spheric connections in the visual cortex of squirrel monkeys. Neurosci. Abstr. 1Ot730.
Hassler, R. (1966) Comparative anatomy of the central visuai systems in day- and night-active primates. In R. Hasslcr and H. Stephen (eds): Evolution of the Forebrain. Stuttgart: Thieme-Verlag, pp. 419-434.
Hedreen, J., and T.C.T. Yin (1981) Homotopic and heterotopic callosal affer- ents of caudal inferior parietal lobule in macaca mulatta. J. Comp. Neural. 197:605-621.
Hubel, D.H., and M.S. Livingstone (1985) Complex-unoriented cells in a subregion of primate area 18. Nature 315325-327,
Hubel, D.H., and T.N. Wiesel (1962) Receptive fields, binocular interaction and functional architecture in the cat’s visual cortex. J. Physiol. 160:106- 154.
Hubel, D.H., and T.N. Wiesel (1965) Binocular interaction in striate cortex of kittens reared with artificial squint. J. Neurophysiol. 28:1041-1059.
Hubel, D.H., and T.N. Wiesel (1967) Cortical and callosal connections con- cerned with the vertical meridian of the visual fields in the cat. J. Neurophysiol. 30:1561-1573.
Hubel, D.H., and T.N. Wiesel(1970) Stereoscopic vision in macaque monkey. Nature 225:41-42.
Innocenti, G.M., and L. Fiore (1976) Morphological correlates of visual field transformation in the corpus callosum. Neurosci. Lett. 2245-252.
Jones, E.G., and S.P. Wise (1977) Size, laminar and columnar distribution of efferent cells in the sensory-motor cortex of monkeys. J. Comp. Neu- rol. 175.391-438.
Jones, E.G., H. Burton, and R. Porter (1975) Commissural and cortico- cortical “columns” in the somatic sensory cortex of primates. Science 190572-574.
Kaas, J.H., and C.S. Lin (1977a) Cortical projections of area 18 in owl monkeys. Vision Res. 17:739-741.
Kaas, J.H., C.S. Lin, and E. Wagor (1977h) Cortical projections of posterior parietal cortex in owl monkeys. J. Comp. Neurol. 171:387-408.
Karol, E.A., and D.N. Pandya (1971) The distribution of the corpus callosum in the rhesus monkey. Brain 94:471-486.
Kennedy, H., and J. Bullier (1985) A double-labelling investigation of the afferent connectivity to cortical areas V1 and V2 of the macaque mon- key. J. Neurosci. 5r2815-2830.
Kennedy, H., K.A.C. Martin, G.A. Orban, and D. Whitteridge (1985a) Recep- tive field properties of neurons in visual area 1 and visual area 2 in the baboon. Neuroscience 14r405-415.
Kennedy, H., J. Bullier, and C. Dehay (198513) Cytochrome oxidase activity in the striate cortex and lateral geniculate nucleus of the newborn and adult macaque monkey. Exp. Brain Res. 61.204-209.
Kuypers, H.G.J.M., M.K. Szwarcbart, M. Mishkin, and H.E. Rosvold (1965) Occipitotemporal corticocortical connections in the rhesus monkey. Exp. Neurol.. 11245-262.
Lassonde, M. (1985) The facilitatoiy action of the corpus callosum. In F. Lepore, M. Ptito, and H. Jasper (eds): Two Hemispheres, One Brain. New York: Alan R. Liss, pp. 385-402.
Livingstone, M.S., and D.H. Hubel (1982) Thalamic inputs to cytochrome oxidase-rich regions in monkey visual cortex. Proc. Natl. Acad. Sci. USA 79:6098-6101.
Livingstone, M.S., and D.H. Hubel (1984) Anatomy and physiology of a color system in the primate visual cortex. J. Neurosi. 4r309-356.
Lund, J.S. (1973) Organization of neurons in the visual cortex, area 17, of the monkey (Macaca mulatta). J. Comp. Neural. 147r455-496.
Lund, J.S., R.D. Lund,A.E. Hendrickson, A.H. Bunt, andA.F. Fuchs(1975) The origin of efferent pathways from the primary visual cortex, area 17, of the macaque monkey as shown by retrograde transport of horseradish peroxidase. J. Comp. Neurol. 164r287-304.
Martinez-Millan, L., and H. Hollander (1975) Corticocortical projections from striate cortex of the squirrel monkey (Saimiri sciureus). A radioau- tographic study. Brain Res. 83:405-417.
Maunsell, J.H.R., and D.C. Van Essen (1983) The connections of the middle temporal visual area (MT) and their relationship to a cortical hierarchy in the macaque monkey. J. Neurosci. 32563-2586.
Mesulam, M.M., E. Hegarty, H. Barbas, K.A. Carson, E.C. Gower, A.G. Knapp, M.B. Moss, and E.G. Mufson (1980) Additional factors influenc- ing sensitivity in the tetramethyl benzidine method for horseradish peroxidase neurohistochemistry. J. Histochem. Cytochem. 28:1255-1259.
Mettler, F. (1935) Corticofugal fiber connections of the cortex of Macaca mulatta. The occipital region. J. Comp. Neurol. 61221-236.
Mitchell, D.E., and C. Blakemore (1970) Binocular depth perception and the corpus callosum. Vision. Res. 1Or49-54.
Myers, R.E. (1962) Commissural connections between occipital lobes of the monkey. J. Comp. Neurol. 118rl-16.
Myerson, J., P. Manis, F. Miezin, and J. Allman (1977) Magnification in striate cortex and retinal ganglion cell layer of owl monkey: A quanti- tative comparison. Nature 198:855-857.
Nauta, W.J.H., and V.M. Bucher (1954) Efferent connections of the striate cortex in the albino rat. J. Comp. Neurol. 100:257-286.
Newsome, W.T., and J.A. Allman 11980) Interhemispheric connections of visual cortex in the owl monkey Aotus trivirgatus and the bushbaby, Galago senegalensis. J. Comp. Neurol. 194:209-233.
Olavarria, J., and R.C. Van Sluyters (1983) Widespread callosal connections in infragranular visual cortex of the rat. Brain Res. 279.233-237.
Perkel, D., J. Bullier, and H. Kennedy (1985) Topography of afferent projec- tions to monkey striate cortex. Neurosci. Abstr. I1:68.11.
Poggio, G.F., and B. Fischer (1977) Binocular interaction and depth sensitiv- ity in striate and prestriate cortex of behaving rhesus monkey. J. Neu- rophysiol. 40: 1392-1405.
Rhodes, R.W., and S.E. Fish (1983) Bilateral enucleation affects visual callosal but not corticostriate or corticogeniculate projections in ham- sters. Exp. Brain Res. 51t451-462.
Rizzolatti, G., and R. Camarda (1977) Influence of the presentation of remote visual stimuli on the responses of cat area 17 and lateral suprasylvian area. Exp. Brain R.es. 29:107-122.
Rocha-Miranda, L.E., D.B. Bender, C.G. Gross, and M. Mishkin (1975) Visual activation of neurons in inferotemporal cortex depends on striate cortex and forebrain commissures. J. Neurophysiol. 38t474-491.
Rockland, K.S., and D.N. Pandya (1979) Laminar origins and terminations of cortical connections to the occipital lobe in the rhesus monkey. Brain Res. 179t3-20.
Sanides, D. (1978) The retinotopic distribution of visual callosal projections in the suprasylvian visual areas compared to the classical visual areas 17, 18,19 in the cat. Exp. Brain Res. 212t249-270.
Schwartz, M.L., and P.S. Goldman-Rakic (1984) Callosal and intrahemis- pheric connectivity of the prefrontal association cortex in rhesus mon- key: Relation between intraparietal and principal sulcal cortex. J. Comp. Neurol. 226:403-420.
Segraves, M.A., and A.C. Rosenquist (1982a) The distribution of the cells of origin of callosal projections in cat visual cortex. J. Neurosci. 2:1079- 1089.
Segraves, M.A., and A.C. Rosenquist (198213) The afferent and efferent callosal connections of retinotopically defined areas in cat cortex. J. Neurosci. 21090-1107.
Sesma, M.A., V.A. Casagrande, and J.H. Kaas (1984) Cortical connections of area 17 in tree shrew. J. Comp. Neurol. 230:337-351.
Shatz, C.J. (1977) Anatomy of interhemispheric connections in the visual system of Boston Siamese and ordinary cats. J. Comp. Neurol. 173:497- 518.
Shipp, S., and S. Zeki (1985) Segregation of pathways leading from area V2 to areas V4 and V5 of macaque monkey visual cortex. Nature 315322- 325.
So, K.F., and L.S. Jen (1982) Visual callosal, corticotectal, and corticogeni- culate projections in golden hamsters. Brain Behav. Evol. 21:125-136.
Spatz, W.B., and B. Kunz (1984) Area 17 of anthropoid primates does participate in visual callosal connections. Neurosci. Lett. 48t49-53.
Spatz, W.B., and J. Tigges (1972) Experimental-anatomical studies on the “middle temporal visual area MT” in primates. I. Efferent corticocorti- cal connections in marmoset callithrix jacchus. J. Comp. Neurol. 146r451- 464.
Spatz, W.B., J. Tigges, and M. Tigges (1970) Subcortical projections, cortical associations, and some intrinsic interlaminar connections of the striate cortex in the squirrel monkey (Saimiri). J. Comp. Neurol. 14Or155-174.
Swadlow, H.A., T.G. Weyand, and S.G. Waxman (1978) The cells of origin of the corpus callosum in rabbit visual cortex. Brain Res. 156t129-134.
Symonds, L.L., and A.C. Rosenquist (1984a) Corticocortical connections among visual areas in the cat. J. Comp. Neurol. 229:l-38.
Symonds, L.L., and A.C. Rosenquist (198413) Laminar origins of visual cor- ticocortical connections in the cat. J. Comp. Neural. 229:39-47.
Tigges, J., W.B. Spatz, and M. Tigges (1973) Reciprocal point-to-point con- nections between parastriate and striate cortex in the squirrel monkey (Saimiri). J. Comp. Neurol. 148r481-490.
CALLOSAL CONNECTIONS OF VISUAL AREAS V1 AND V2 IN MACAQUE 415
Tigges, J., W.B. Spatz, and M. Tigges (1974) Efferent corticocortical fiber connections of area 18 in the squirrel monkey (Saimiri). J. Comp. Neu- rol. 158:219-236.
Tigges, J., M. Tigges, and A.A. Perachio (1977) Complementary laminar terminations of afferents to area 17 originating in area 18 and in the lateral geniculate nucleus in squirrel monkey. J. Comp. Neurol. 176r87- 100.
Tigges, J., M. Tigges, S. Anschel, N.A. Cross, W.D. Letbetter, and R.L. McBride (1981) Areal and laminar distribution of neurons interconnect- ing the central visual cortical areas 17, 18, 19 and MT in squirrel monkey (Saimiri). J. Comp. Neurol. 202r539-560.
Valkenburg, C.T. von (1913) Experimental and pathologico-anatomical re- searches on the corpus callosum. Brain 36t119-165.
Van Essen, D.C., and S.M. Zeki (1978) The topographic organization of rhesus monkey prestriate cortex. J. Physiol. 277r193-226.
Van Essen, D.C., N.T. Newsome, and J.L. Bixby (1982) The pattern of interhemispheric connections and its relationship to extrastriate visual areas in the macaque monkey. J. Nenrosci. 2265-283.
Wagor, E., C.S. Lin, and J.H. Kaas (1975) Some cortical projections of the dorsomedial visual area (DM) of association cortex in the owl monkey Aotus trivirgatus. J. Comp. Neurol. 163:227-250.
Weller, R.E., and J.H. Kaas (1981) Cortical and subcortical connections of visual cortex in primates. In C.N. Woolsey (ed): Cortical Sensory Orga- nization, Vol. 2: Multiple Visual Areas. Clifton, NJ: Humana, pp. 121- 155.
Weller, R.E., and J.H. Kaas (1983) Retinotopic patterns of connections of area 17 with visual areas V2 and MT in macaque monkeys. J. Comp.
Neurol. 220:253-279
Weyand, T.G., and H.A. Swadlow (1980) Interhemispheric striate projections in the prosimian primate Galago senegalensis. Brain Behav. Evol. 17:473-477.
Winfield, D.A., K.C. Gatter, and T.P.S. Powell (1975) Certain connections of the visual cortex of the monkey shown by the use of horseradish perox- idase. Brain Res. 92456-461,
Wong-Riley, M. (1978) Reciprocal connections between striate and prestriate cortex in squirrel monkey as demonstrated by combined peroxidase histochemistry and autoradiography. Brain Res. 147r159-164.
Wong-Riley, M. (1979) Columnar corticocortical interconnections within the visual system of the squirrel and macaque monkeys. Brain Res. I62r201- 217.
York, C.H., and US . Caviness (1975) Interhemispheric neocortical connec- tions of the corpus callosum in the normal mouse: A study based on anterograde and retrograde methods. J. Comp. Neurol. 164.233-246.
Zeki, S.M. (1970) Interhemispheric connections of prestriate cortex in mon- key. Brain Res. 19:63-75.
Zeki, S.M. (1971) Convergent input from the striate cortex of the superior temporal sulcus in the rhesus monkey. Brain Res. 28r338-340.
Zeki, S.M. (1978a) Functional specialisation in the visual cortex of the rhesus monkey. Nature 274:423-428.
Zeki, S.M. (1978b) The cortical projections of foveal striate cortex in rhesus monkey. J. Physiol. (Lond.) 277227-244.
Zeki, S.M. (1980) A direct projection from area V1 to area V3A of rhesus monkey visual cortex. Proc. R. SOC. Lond. B 207:499-506.

![EFFECT OF COHERENT MOVING STIMULUS ON THE VISUAL …Figure 4: Subcortical and cortical pathways in the macaque monkey. [4] 2.4 Motion Detection Mechanism MT is an important area in](https://img.pdfslide.us/doc/110x75/6077031c7b9ba83b4c752414/effect-of-coherent-moving-stimulus-on-the-visual-figure-4-subcortical-and-cortical.jpg)