Embed Size (px)
Citation preview
Organization and Development of Brain Stem Auditory Nuclei of the Chicken: Tonotopic Organization of N. magnocellularis and N. laminaris
EDWIN W RUBEL AND THOMAS N. PARKS Department of Psychology, Yale University, New Haven, Connecticut 06520
ABSTRACT Extracellular recordings of responses to tone-burst stimulation were used to determine the tonotopic organization of n. magnocellularis (NM) and n. laminaris (NL) in hatchling chickens. NM cells show "primary-like" response patterns to ipsilateral stimulation, and are arranged in dorso-ventral isofrequency columns. Units responding to the highest frequency tones (about 4,100 Hz) are situated at the rostromedial pole of the medial division. Units with lower characteristic frequencies (CF's) are found at successively caudal and lateral sites, until extremely low CF's (<500 Hz) are represented dorsoventrally in the caudolateral tail of the lateral division. No evidence was found of auditory input to the region which receives projections from the macula lagena. NL re- ceives polarized, binaural, excitatory input. Units have similar CF's and thresh- olds to tones presented to either ear. The tonotopic organization in NL matches that found in NM - high CF's rostromedially and low CF's caudal and lateral. Quantitative procedures were developed for relating CF to the position of a unit within either nucleus. These analyses account for 79% and 89% of the fre- quency variance found within NM and NL, respectively, and predict the CF of a neuron by its position within each nucleus.
Three lines of research have led to in- creasing interest in the avian auditory system. First, a large body of literature on bird vocalization (Hinde, '69) has led to studies relating behavioral capacities to structure and function of the auditory sys- tem (Schwartzkopff, '55; Winter, '63; Ko- nishi, '69, '70). Second, the unique phylo- genetic position of Aves, as the other major class evolving from reptiles, has led to valuable insights into the possible ori- gins of the mammalian neural structures (Bock, '69; Boord, '69; Nauta and Karten, '70) and increased understanding of the avian auditory pathways (Boord, '61, '68; Boord and Rasmussen, '63; Karten, '67, '68). Finally, a body of research by Gott- lieb ('71), indicating that species-typical vocalizations may influence the develop- ment of perceptual abilities, has provoked interest in the ontogeny of the avian audi- tory system (Konishi, '73; Saunders, Coles and Gates, '73).
This paper represents the first of a series of investigations on the organization and development of two brain stem auditory nuclei in the chicken: n. magnocellularis
J. COMP. NEUR., 164: 411-434.
and n. laminaris. These nuclei were chosen for study because of their relatively simple relationships to the periphery and to each other, as well as their relatively homoge- neous cytoarchitecture (Boord, '69). Nu- cleus magnocellularis receives its main afferent projections from cochlear and lagenar ganglion cells, central axons of which distribute in an orderly fashion to terminate in characteristic bulbs of Held on the cell bodies and dendrites of n. mag- nocellularis neurons (Boord and Rasmus- sen, '63). Nucleus laminaris neurons are arranged in a concave monocellular layer of cell bodies lying ventral, lateral, and rostral to n. magnocellularis. The binaural projection to n. laminaris from n. magno- cellularis is spatially segregated such that the contralateral input terminates in the ventrolateral neuropil region while the ip- silateral axons terminate in the dorso- medial neuropil region (Ramon y Cajal, '08; Boord, '68; Parks and Rubel, '75). The cell bodies of n. laminaris appear to re- ceive mixed ipsi- and contralateral inner- vation (Benes, Parks and Rubel, unpub- lished observations).
411
412 EDWIN W RUBEL AND THOMAS N. PARKS
Neurophysiological investigations of n, magnocellularis in the pigeon (Stopp and Whitfield, ’61) have stressed the similari- ties of mammalian and avian tuning curves and the relatively small frequency range that is characteristic of this and other avian species. Konishi (’69) concentrated on the relationship between the frequency- intensity thresholds of brain stem auditory units and species-typical vocalizations of songbirds. The general pattern of tono- topic organization of brain stem auditory units has been described for the house sparrow and embryonic duckling by Ko- nishi (‘69, ’73). Yet a detailed description of tonototopic organization in n. magno- cellularis is not available for any avian species.
Less data are available on n. laminaris. Although the spatially-segregated bilateral innervation pattern has been confirmed experimentally (Boord, ’68), information on binaural response properties and tono- topic organization of the cells is not avail- able.
In the present investigation standard microelectrode recording procedures were used to study the response of n. magnocel- lularis and n. laminaris units to tonal stimuli applied to one or both ears of hatch- ling chickens. The binaural nature of n. laminaris cells is described, as is the tono- topic organization within each nucleus. Quantitative procedures, relating charac- teristic frequency to neuronal position, were developed in order to assess the sta- bility of tonotopic organization across sub- jects and to generate equations predicting the characteristic frequency of a neuron from its position in n. magnocellularis or n. laminaris.
MATERIALS AND METHODS
Subjects and surgical procedures Subjects for the present study were 52
Red Cornish or White Leghorn hatchling chickens 5-15 days old. Eggs were obtained fkom a commercial breeder and incubated in our laboratory. Weights ranged from 50 to 150 gm.
Chicks were initially anesthetized with intraperitoneal injections of 0,003 ml/gm body wt. of Equithesin (Jensen-Salsbery Laboratories) and hydrated with 2 3 ml of 5% dextrose in 0.9% NaCl. The feathers were clipped from the head area including
the ear-flaps. Following a midline incision, the skin overlying the posterior cranial bones was retracted and small woodscrews were inserted into the parietal bones over each hemisphere. Dental acrylic, attached to the beak and the skull screws, secured the bird’s head to a specially designed head-holder, the neck muscles were re- tracted to expose the foramen magnum, and the occipital bones were removed to expose the cerebellar cortex. In most sub- jects, the middorsal sinus was ligated in two places between the anterior cerebral vein and the middle cerebral vein. The sinus was then cut and the entire cere- bellum aspirated to expose the floor of the fourth ventricle. Cochlear nerve fibers coursing rostromedially over the medullary surface and a large blood vessel which lies above the caudomedial portion of n. mag- nocellularis served as landmarks. In later experiments the cerebellum and vascular system were left intact and the electrode was introduced through the cerebellum. This procedure results in less pulsation and, therefore, superior recording con- ditions.
Throughout the surgical preparation and the recording session, body tempera- ture was maintained at 38-39°C. Nocicep tive reflexes were monitored and controlled by intramuscular injections of Equithesin.
Stimulus presentation Stimuli were white-noise or pure-tone
bursts, 50 msec in duration, with 10 msec rise and fall times. The inter-stimulus in- tervals were two seconds in early experi- ments and one and one-half seconds in later experiments. White noise was used to locate units and tone bursts were used for CF determination. Sound presentation equipment included a Wavetek model 134 function generator, Grason-Stradler 901B noise generator and 829E electronic switch, and Hewlett-Packard 350D attenuator. Stimuli were delivered to either ear through brass adaptors which were attached to calibration earphones from the Brijel and Kjaer Probe Microphone Kit (B & K no. UA0040). The brass adaptors, with ear- phones attached, were sealed to the exter- nal auditory meatus to create a “closed system.” Each earphone assembly was cal- ibrated over the range from 0.1 to 10 kHz using a B & K 114“ condenser microphone
BRAIN STEM AUDITORY NUCLEI OF T H E CHICKEN 413
(no. 4135) and a B & K Frequency Ana- lyzer (no. 2107). Sound frequencies were determined on line, using a General Radio 1151A digital Time and Frequency Meter. Since earphone assemblies were attached to both ears, “characteristic frequency” (CF) and threshold (re 0.0002 dynes/cmZ) could routinely be determined for stimula- tion of each ear.
Recording procedures Cellular activity was recorded through
glass-insulated tungsten microelectrodes constructed by procedures based on Hubel (’57), Baldwin et al. (’65), Merrill and Ainsworth (‘72), and Parker et al. (’73). Electrodes had 5-20 pm of exposed tip and a shaft diameter of 10-40 Fm. Poten- tials from the electrode, with reference to a grounded neck muscle, were amplified, filtered to pass 300 Hz-10 kHz, displayed on one beam of a storage oscilloscope (CRO), aurally monitored, recorded on magnetic tape (Sony no. TC-650) and led to a pulse height discriminator (Frederick Haer). The output of the discriminator was used for compiling post-stimulus-time (PST) histo- grams (Ortec Model 4620/4621) and was continuously monitored along with the stimulus on a second beam of the CRO. A second CRO was used to monitor the wave- form of neural unit activity and the output of the histogram analyzer. Evoked poten- tials were displayed by eliminating the high pass filter, and they were averaged using an Ortec Signal Averager.
Under visual inspection, through a Zeiss operating microscope, the electrode was lowered to the pial surface, taking care to avoid any blood vessels. Contact with the surface could be detected over the audio monitor and by a slight dimpling of the medulla. In preparations where the cere- bellum was intact, contact with the me- dulla was indicated by a sharp rise in background activity and small units re- sponding to auditory stimuli. The electrode was slowly lowered into the tissue while broad-band noise bursts (approximately 80 dB re 0.0002 dynes/cm2) were presented to both ears. When units either activated or inhibited by the stimulus were encoun- tered, the microdrive was stopped and the response was “tuned.” Both well-isolated units and clusters with 2-1 individual spikes were used. Within the nuclear
groups, individual units of a small cluster consistently showed similar response prop- erties.
Characteris tic frequency determination The characteristic frequency (CF) was
first determined manually by slowly chang- ing frequency and intensity until the low- est threshold combination was determined. This procedure was carried out independ- ently for stimulation of each ear. The manually-determined CF was then con- firmed by compiling PST histograms to that frequency and to frequencies 100-200 Hz above and below that CF at 5-15 dB above the thresholds. Units were consid- ered binaural if threshold intensities to stimulation of each ear was within 10 dB.
Each active neural unit or small cluster of units encountered within an electrode penetration was analyzed and the corre- sponding electrode depth was noted. Small “marking” lesions were placed at points of special interest (usually as the electrode was withdrawn) by passing 10-20 @amps for 5-10 seconds through the recording electrode (the anode). Penetrations were made in rows and the position of each pen- etration was marked on a grid. Penetra- tions were at 0.2 mm or 0.3 mm intervals within a row and rows were spaced 0.3 or 0.4 mm apart. The rows were usually started at the most rostromedial site in order to avoid damage to the majority of afferent fibers which course rostromedially. In most experiments only one or two rows of electrode penetrations were carried out in order to facilitate localization of elec- trode tracks.
Histological procedures At the termination of each experiment
the animal was sacrificed by an overdose of Equithesin and a knife cut was made through the brain stem at the angle of the electrode penetrations and parallel to the row($. The head was then immersed in Bouin’s solution for 24 hours, the brain stem was removed, blocked and embedded in paraffin. The block was serially sec- tioned at 10-20 Frn in a plane parallel to the knife cut. All sections were mounted and stained with thionin.
The positions of the electrode tracks were first identified by viewing sections alternately with phase and transmitted
414 EDWIN W RUBEL AND THOMAS N. PARKS
light microscopy. Reconstructions were then prepared by tracing electrode tracks onto X 256 projections of the appropriate sections. Tissue shrinkage was determined for each brain by one or more of the fol- lowing measures: distance between two adjacent electrode tracks within a row; distance between two marking lesions placed within a single electrode track; or distance between the brain surface and a marking lesion. Although shrinkage varied considerably between animals (14-56% ), the different measures yielded consistent results within any one brain. Only data obtained from recording sites within a nu- clear boundary are reported, although au- ditory responses were reliably recorded from non-nuclear regions surrounding n. magnocellularis and n. laminaris.
Quantitative analysis The “mapping” procedures outlined
above are relatively standard and have proven reliable for qualitative descriptions of sensory and motor system organization within a large variety of animals (Rose et al., ’59; Potter, ’65; Johnson et al., ’68; Allman and Kaas, ’71; Rubel, ’71). Less common are quantitative analyses of nu- clear organization which are based on elec- trophysiologically-defined response prop- erties of the neurons. Thus, the methods used for these analyses are described in more detail in figure 1 which diagram- matically shows the method used in the present study.
A n accurate two-dimensional reconstruc- tion of each nucleus was used to determine the medic-lateral and rostrc-caudal per- centile positions of recording sites for each experimental brain sectioned in the coronal or parasagittal plane. The data, relating characteristic frequency to rostro-caudal and medic-lateral position, were then sub- jected to individual and multiple linear regression analyses. These statistical anal- yses were used to indicate the extent to which the characteristic frequency of a neuron can be predicted by its position in n. magnocellularis or n. laminaris.
RESULTS
Nissl-stained sections through the brain stem at two rostro-caudal levels, showing the normal appearance of n. magnocellu- l a i s and n. laminaris in the hatchling
chicken, are reproduced in figures 12 and 13.
The electrophysiological data reported here are representative of findings from 132 responsive electrode penetrations through n. magnocellularis and/or n. la- minaris. These penetrations yielded 526 units or unit clusters, within the nuclear boundaries, for which the CF was deter- mined. Although spike amplitude gener- ally increased by 200400 pv as an elec- trode entered the nuclear areas, clear unit responses were regularly found while the electrode traversed the region occupied by afferent axons above n. magnocellularis, and in the neuropil regions between n.
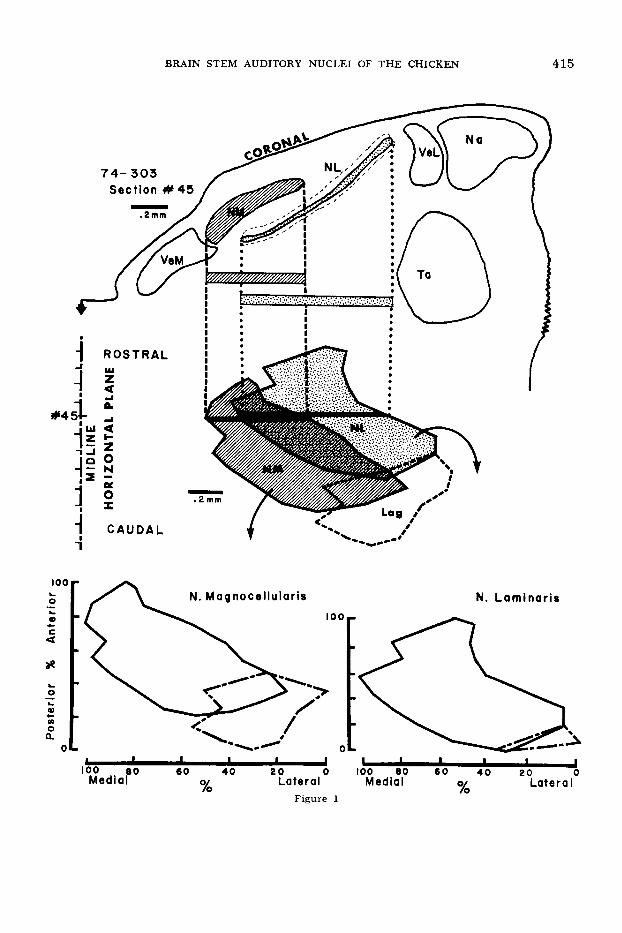
Fig. 1 Method for constructing planar projec- tions of n. magnocellularis (NM) and n. laminaris (NL). Serial sections through the brain stem of a Red Cornish hatchling chicken were cut a t 10 h m in the coronal plane and stained with thionin. Be- ginning with the most rostra1 section through n. laminaris (NL), the right dorsal medulla was traced a t a linear m a g d c a t i o n of X 128. A stage micrometer was used to insure that all areas of the field were equally magnified. One such tracing (section no. 45) is shown at the top of the figure, with n. magnocellularis (NM) and n. laminaris (NL) shaded and stippled, respectively.
The mediolateral extent of each nucleus was then determined (shaded and stippled bars) and indicated in the appropriate medio-lateral and rostrocaudal position on a horizontal plane, as shown for section no. 45 by the black bars in the middle part of the figure. The rostrocaudal dimen- sion was, of course, also subjected to linear mag- nification of X 128. Thus, the middle part of the figure shows an accurate horizontal projection of n. magnocellularis (shaded) and n. laminaris (stip- pled) with reference to the midline of the brainstem (shown at left). The area outlined by the dashed lines, at the caudolateral pole of the nuclear com- plex is the cytoarchitecturally distinct ventro- lateral subdivision (NMvL of Boord, ’69), where n. magnocellularis and n. laminaris merge. This area, although unresponsive to sound (RESULTS), is traditionally considered part of the avian coch- lear nuclear complex (Bcmrd and Rasmussen, ’63) and is therefore included in our maps. It has been labeled “Lag,” however, in view of its innervation from the lagenar, rather than cochlear, portion of the posterior ramus of the eighth nerve (DIS- CUSSION).
In the lower section, the planar projections of the two nuclei are separated, but retain their rostrocaudal and medio-lateral orientations. Each nucleus was divided into a percentile grid and the position, in percentile from posterior-to-anterior and lateral-to-medial, of recording sites, from a n y brain which was sectioned in the parasagittal or coronal plane, could be entered on this grid.
Lag, lagenar projection area; Na, n. angularis; VeL, nucleus vestibularis lateralis; VeM, n. ves- tibularis medialis; Ta, nucleus tangentialis (Cajal).
BRAIN STEM AUDITORY NUCLEI OF THE CHICKEN 415
C A U D A L i
N. Magnocellularis N. L a m i n a r i s
I I I I 1 I I I
Lateral Medial
I I 1 I 100 60 60 40 2 0 0 100 6 0 6 0 4 0 2 0 0
Lateral % Figure 1
% Medial
416 EDWIN W RUBEL AND THOMAS N. PARKS
# 75-802 ( I b) CF-2.62 kHz th-33db
2415 Hz 4 4 db
20
Y 2 6 2 6 Hr 43 db
Q 40- v)
20- 0
-
Jc: 0- -I v 4 0 2 8 4 5 H z
4 5 d b 2ok 0
I TIME ( m s e c )
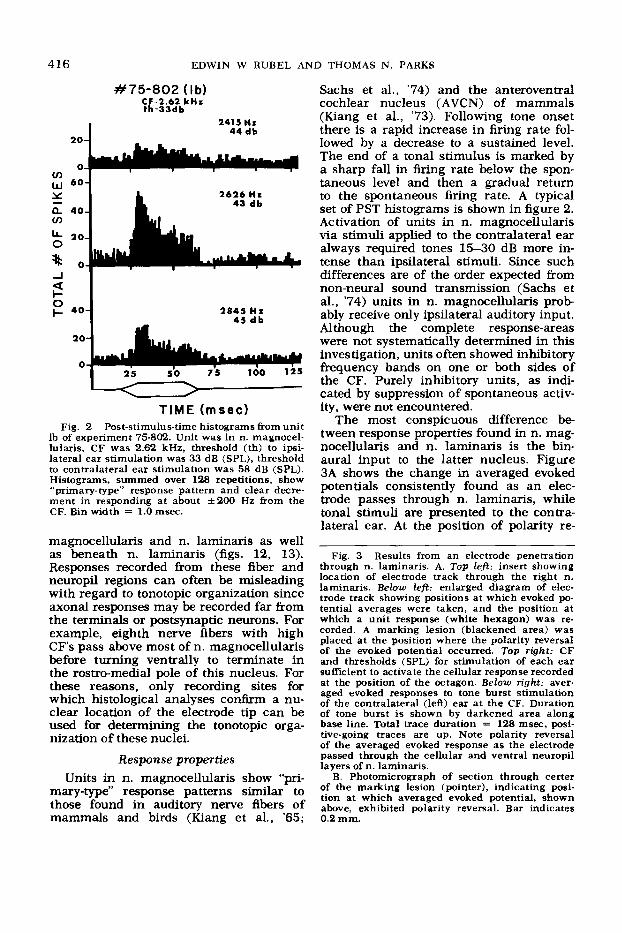
Fig. 2 Post-stimulus-time histograms &om unit lb of experiment 75-802. Unit was in n. magnocel- lularis, CF was 2.62 kHz, threshold (th) to ipsi- lateral ear stimulation was 33 dB (SPL), threshold to contralateral ear stimulation was 58 dB (SPL). Histograms, summed over 128 repetitions, show “primary-type” response pattern and clear decre- ment in responding at about k200 Hz &om the CF. Bin width = 1.0 msec.
magnocellularis and n. laminaris as well as beneath n. laminaris (figs. 12, 13). Responses recorded from these fiber and neuropil regions can often be misleading with regard to tonotopic organization since axonal responses may be recorded far from the terminals or postsynaptic neurons. For example, eighth nerve fibers with high CF’s pass above most of n. magnocellularis before turning ventrally to terminate in the rostro-medial pole of this nucleus. For these reasons, only recording sites for which histological analyses confirm a nu- clear location of the electrode tip can be used for determining the tonotopic orga- nization of these nuclei.
Response properties Units in n. magnocellularis show “pri-
mary-type” response patterns similar to those found in auditory nerve fibers of mammals and birds (Kiang et al., ’65;
Sachs et al., ’74) and the anteroventral cochlear nucleus (AVCN) of mammals (Kiang et al., ’73). Following tone onset there is a rapid increase in firing rate fol- lowed by a decrease to a sustained level. The end of a tonal stimulus is marked by a sharp fall in firing rate below the spon- taneous level and then a gradual return to the spontaneous firing rate. A typical set of PST histograms is shown in figure 2. Activation of units in n. magnocellularis via stimuli applied to the contralateral ear always required tones 15-30 dB more in- tense than ipsilateral stimuli. Since such differences are of the order expected from non-neural sound transmission (Sachs et al., ’74) units in n. magnocellularis prob- ably receive only ipsilateral auditory input. Although the complete response-areas were not systematically determined in this investigation, units often showed inhibitory frequency bands on one or both sides of the CF. Purely inhibitory units, as indi- cated by suppression of spontaneous activ- ity, were not encountered.
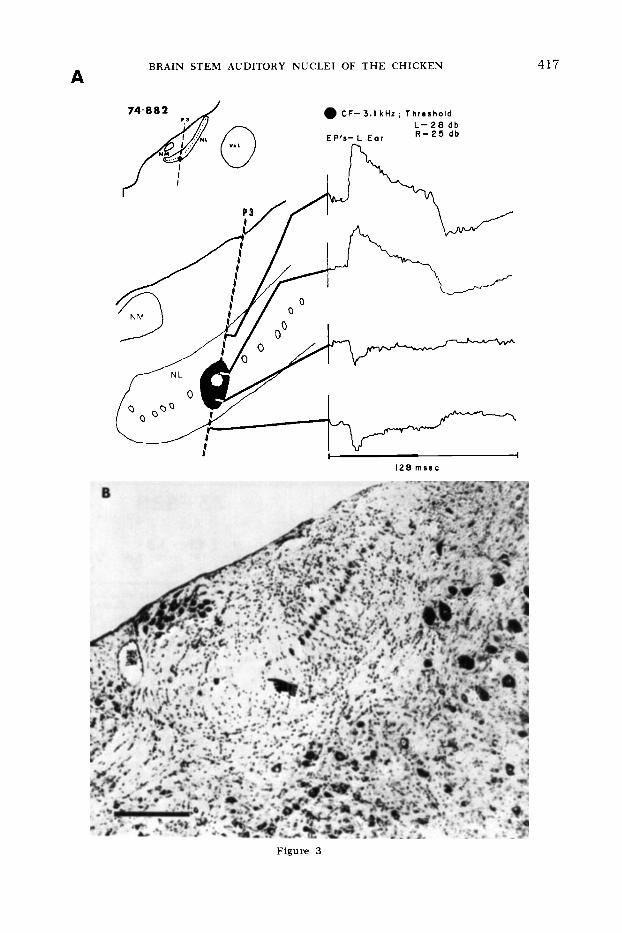
The most conspicuous difference be- tween response properties found in n. mag- nocellularis and n. laminaris is the bin- aural input to the latter nucleus. Figure 3A shows the change in averaged evoked potentials consistently found as an elec- trode passes through n. laminaris, while tonal stimuli are presented to the contra- lateral ear. At the position of polarity re-
Fig. 3 Results from an electrode penetration through n. laminaris. A. Top left: insert showing location of electrode track through the right n. laminaris. Below left: enlarged diagram of elec- trode track showing positions at which evoked po- tential averages were taken, and the position at which a unit response (white hexagon) was re- corded. A marking lesion (blackened area) was placed at the position where the polarity reversal of the evoked potential occurred. Top right: CF and thresholds (SPL) for stimulation of each ear sufficient to activate the cellular response recorded at the position of the octagon. Below right: aver- aged evoked responses to tone burst stimulation of the contralateral (left) ear a t the CF. Duration of tone burst is shown by darkened area along base line. Total trace duration = 128 msec, posi- tive-going traces are up. Note polarity reversal of the averaged evoked response as the electrode passed through the cellular and ventral neuropil layers of n. laminaris.
B. Photomicrograph of section through certer of the marking lesion (pointer), indicating posi- tion at which averaged evoked potential, shown above, exhibited polarity reversal. Bar indicates 0.2 mm.
A BRAIN STEM AUDITORY NUCLEI OF THE CHICKEN 417
I i \- CF- 3.1 k H z , T h r e s h o l d
L- 2 8 d b EP’r -L E a r R - 2 5 db
I 128 m s e c
Figure 3
418 EDWIN W RUBEL AND THOMAS N. PARKS
I
I 73-808
LATERAL
POST. .+ANT.
MEDIAL - .2mm
I
73-809
1.4 1.6 1.8 2.6 3.6 8 . 8 8
1.9 2.8 3.1 I 8 8 8
2.4 2.6 8 .
2.4 2.7 2.8 3.0 3.7 0 8 8 . 8 8 0 I
73-845
3.1 8 0
2.4 8
~-
73-830 1.4
1.3 1.3
1.4 1.6 0 1.3 8 8
1.7 1.9 2.4 0 8 . 8
73-836 1.3 1.9 2.4 2.7 3.1
0 8 8 8 . 8 0
73-807
1.8 8
3.1
3.2
3.5
8 2.3
8
8
8 2.3
8
73-828
.9 1.1 1.8 ' 1.6 2.4 8 8 8
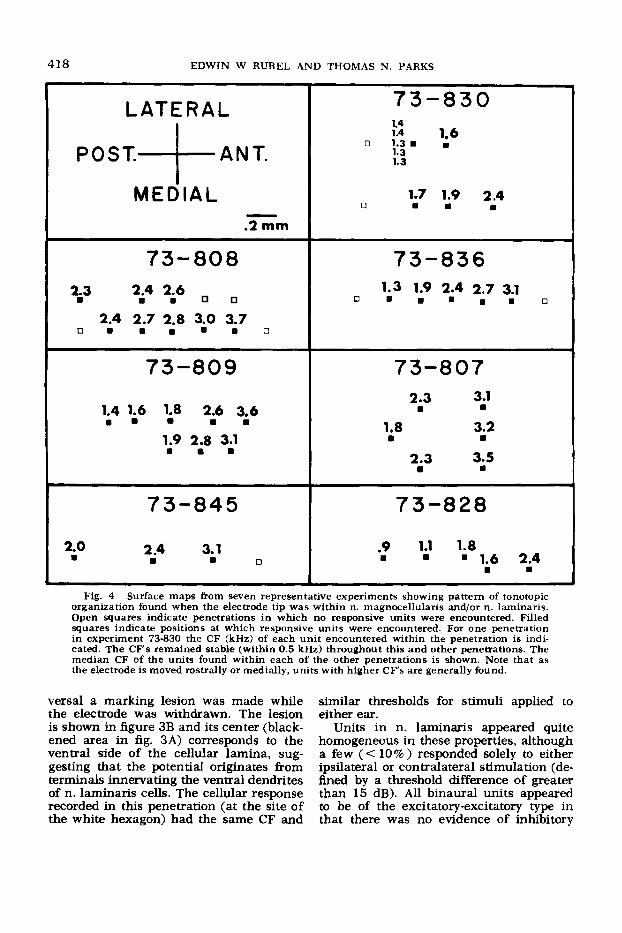
Fig. 4 Surface maps from seven representative experiments showing pattern of tonotopic organization found when the electrode tip was within n. magnocellularis and/or n. laminaris. Open squares indicate penetrations in which no responsive units were encountered. Filled squares indicate positions at which responsive units were encountered. For one penetration in experiment 73-830 the CF (kHz) of each unit encountered within the penetration is indi- cated. The C F s remained stable (within 0.5 kHz) throughout this and other penetrations. The median CF of the units found within each of the other penetrations is shown. Note that as the electrode is moved rostrally or medially, units with higher CFs are generally found.
versa1 a marking lesion was made while the electrode was withdrawn. The lesion is shown in figure 3B and its center (black- ened area in fig. 3A) corresponds to the ventral side of the cellular lamina, sug- gesting that the potential originates from terminals innervating the ventral dendrites of n. laminaris cells. The cellular response recorded in this penetration (at the site of the white hexagon) had the same CF and
similar thresholds for stimuli applied to either ear.
Units in n. laminaris appeared quite homogeneous in these properties, although a few (< 10% ) responded solely to either ipsilateral or contralateral stimulation (de- fined by a threshold difference of greater than 15 dB). All binaural units appeared to be of the excitatory-excitatory type in that there was no evidence of inhibitory
BRAIN STEM AUDITORY NUCLEI OF THE CHICKEN 419
6 5 4 3 8 \ \ 8
7 \
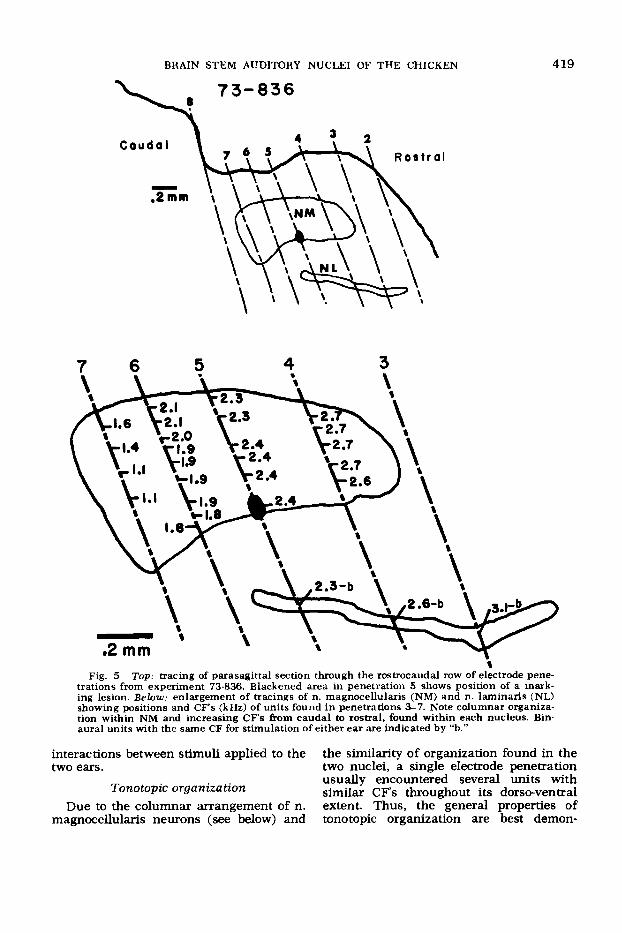
% Fig. 5 Top: tracing of parasagittal section through the rostrocaudal row of electrode pene-
trations from experiment 73-836. Blackened area in penetration 5 shows position of a mark- ing lesion. Below: enlargement of tracings of n. magnocellularis (NM) and n. laminaris (NL) showing positions and CF’s (kHz) of units found in penetrations %7. Note columnar organiza- tion within NM and increasing CF’s &om caudal to rostral, found within each nucleus. Bin- aural units with the same CF for stimulation of either ear are indicated by “b.”
interactions between stimuli applied to the two ears.
Tonotopic organization
the similarity of organization found in the two nuclei, a single electrode penetration usually encountered several units with similar CF’s throughout its dorso-ventral
Due to the columnar arrangement of n. extent. Thus, the general properties of magnocellularis neurons (see below) and tonotopic organization are best demon-
420 EDWIN W RUBEL AND THOMAS N. PARKS
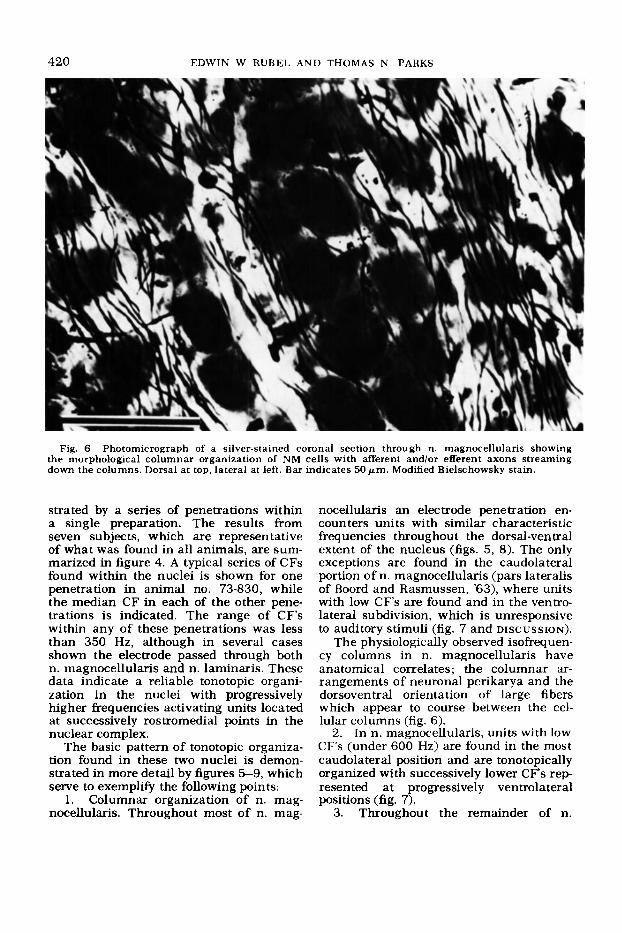
Fig. 6 Photomicrograph of a silver-stained coronal section through n. rnagnocellularis showing the morphological columnar organization of NM cells with afferent and/or efferent axons streaming down the columns. Dorsal at top, lateral at left. Bar indicates 50 fim. Modified Bielschowsky stain.
strated by a series of penetrations within a single preparation. The results from seven subjects, which are representative of what was found in all animals, are sum- marized in figure 4. A typical series of CFs found within the nuclei is shown for one penetration in animal no. 73-830, while the median C F in each of the other pene- trations is indicated. The range of CF’s within any of these penetrations was less than 350 Hz, although in several cases shown the electrode passed through both n. magnocellularis and n. laminaris. These data indicate a reliable tonotopic organi- zation in the nuclei with progressively higher frequencies activating units located at successively rostromedial points in the nuclear complex.
The basic pattern of tonotopic organiza- tion found in these two nuclei is demon- strated in more detail by figures 5-9, which serve to exemplify the following points:
1. Columnar organization of n. mag- nocellularis. Throughout most of n. mag-
nocellularis an electrode penetration en- counters units with similar characteristic frequencies throughout the dorsal-ventral extent of the nucleus (figs. 5, 8). The only exceptions are found in the caudolateral portion of n. magnocellularis (pars lateralis of Boord and Rasmussen, ’63), where units with low CF’s are found and in the ventro- lateral subdivision, which is unresponsive to auditory stimuli (fig. 7 and DISCUSSION).
The physiologically observed isofrequen- cy columns in n. magnocellularis have anatomical correlates; the columnar ar- rangements of neuronal perikarya and the dorsoventral orientation of large fibers which appear to course between the cel- lular columns (fig. 6).
2. In n. magnocellularis, units with low CF’s (under 600 Hz) are found in the most caudolateral position and are tonotopically organized with successively lower C F s r e p resented at progressively ventrolateral positions (fig. 7).
3. Throughout the remainder of n.
BRAIN STEM AUDITORY NUCLEI OF THE CHICKEN 421
magnocellularis a tonotopic organization is evident with sequentially higher CF’s found rostral and medial to units display- ing lower CF’s (figs. 5, 8).
4. Units in n. laminaris are also ar- ranged tonotopically in a manner which matches the organization found in n. mag- nocellularis; progressively higher CF’s are found as the electrode is moved rostrally and/or medially in the nucleus (figs. 5, 8, 9).
In n. magnocellularis the range of unit CF’s found in our sample was 200-4,lOO Hz and in n. laminaris the unit CF‘s ranged from 170 to 3,800 Hz. It is expected that units with lower CF‘s are present in both nuclei but limitations of the sound delivery system prevented extensive sam- pling at very low frequencies.
Quantitative analyses For the quantitative analysis of tono-
topic organization in n. magnocellularis and n. laminaris each nucleus is consid- ered only in two dimensions, rostrocaudal and medio-lateral. This can be justified by the facts that: (a) n. magnocellularis can be considered two-dimensional with respect to characteristic frequencies, due to the physiological demonstration of dorso-ven- tral isofrequency columns; and @) n. laminaris in the hatchling chicken is mor- phologically a two-dimensional monocellu- lar lamina (fig. 12).
With the methods described above and the planar projections (fig. 1) it is possible to specify the rostro-caudal and medio- lateral location of any responsive unit from a n y brain that has been sectioned in the
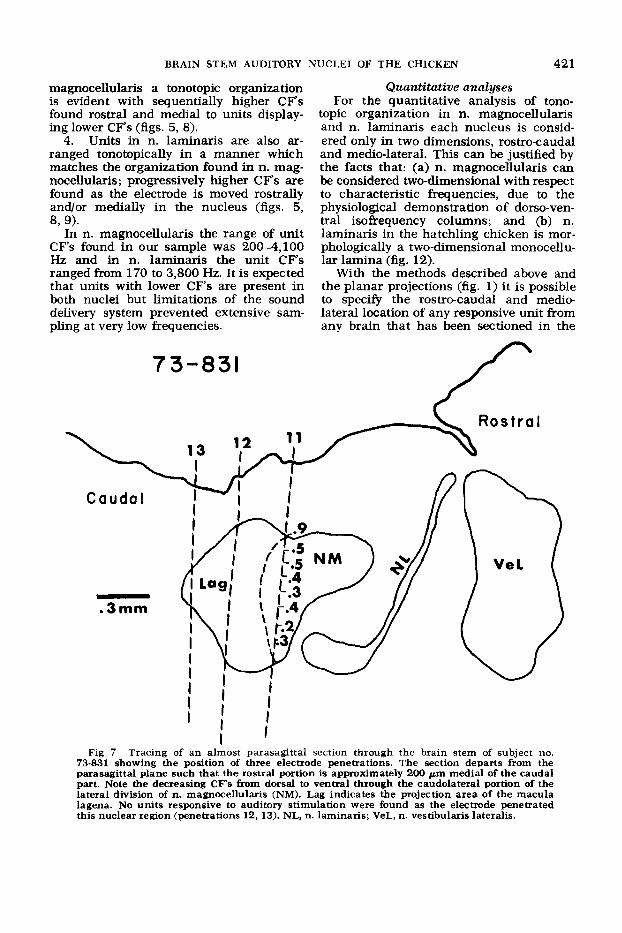
73-831
Fig 7 Tracing of an almost parasagittal section through the brain stem of subject no. 73-831 showing the position of three electrode penetrations. The section departs from the parasagittal plane such that the rostral portion is approximately 200 pm medial of the caudal part. Note the decreasing C F s from dorsal to ventral through the caudolateral portion of the lateral division of n. magnocellularis (NM). Lag indicates the projection area of the macula lagena. No units responsive to auditory stimulation were found as the electrode penetrated this nuclear region (penetrations 12, 13). NL, n. laminaris; VeL, n. vestibularis lateralis.
422 EDWIN W RUBEL AND THOMAS N. PARKS
coronal or parasagittal plane. Thus, the surface, and the relationships between the posterior-an terior and lateral-medial per- characteristic frequencies and anatomical centile locations serve as coordinates to locations can be quantitatively analyzed. specify the location of a unit on a Cartesian This analysis has been completed for the
I 8 8 8 I 8
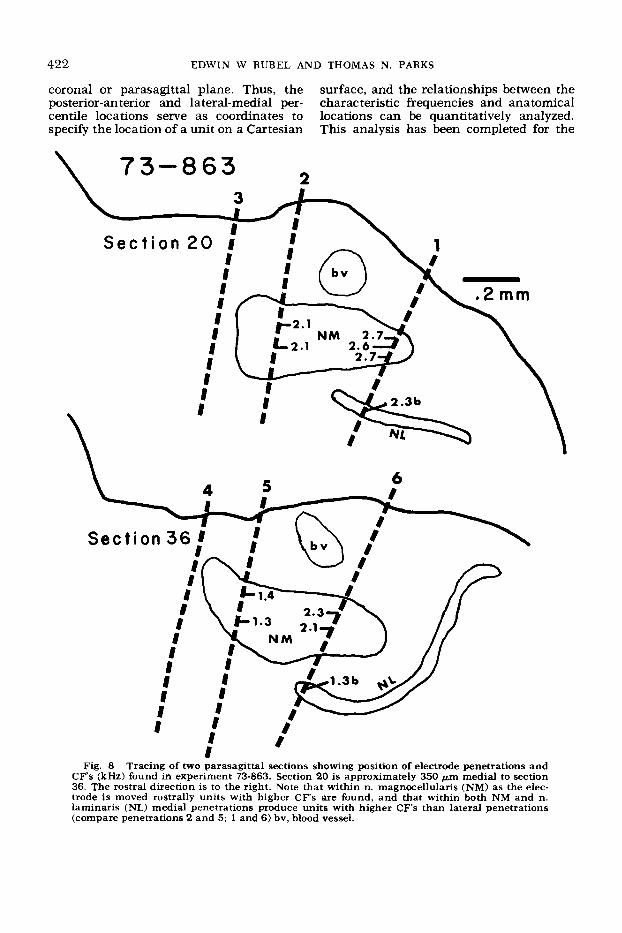
\ A 5
Fig. 8 Tracing of two parasagittal sections showing position of electrode penetrations and CF's (kHz) found in experiment 73-863. Section 20 is approximately 350 Fm medial to section 36. The rostral direction is to the right. Note that within n. magnocellularis (NM) as the elec- trode is moved rostrally units with higher CF's are found, and that within both NM and n. laminaris (NL) medial penetrations produce units with higher CF's than lateral penetrations (compare penetrations 2 and 5; 1 and 6 ) bv, blood vessel.
BRAIN STEM AUDITORY NUCLEI OF T H E CHICKEN
A
74-903
S e c t i o n 134
423
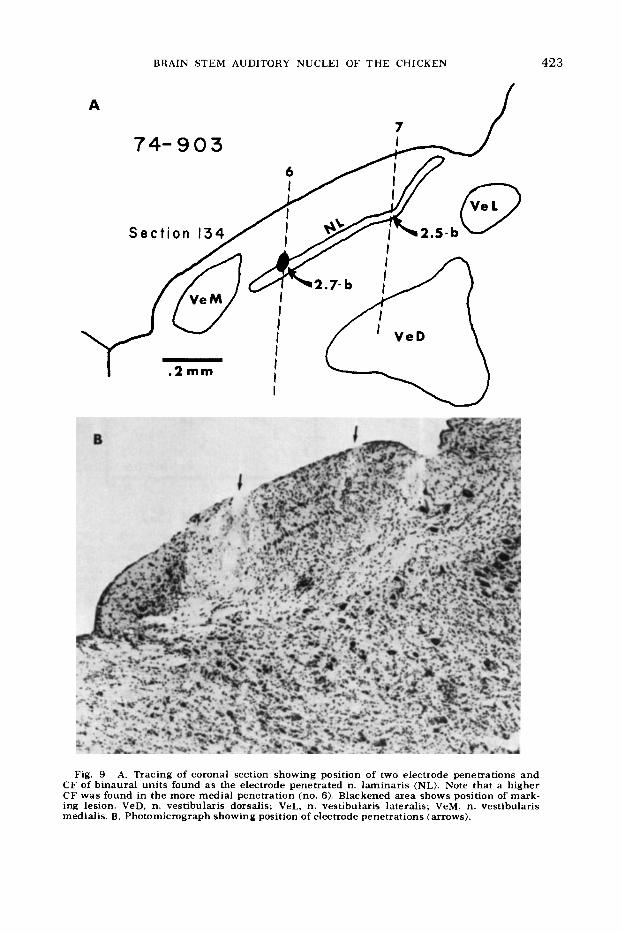
Fig. 9 A. Tracing of coronal section showing position of two electrode penetrations and C F of binaural units found as the electrode penetrated n. laminaris (NL). Note that a higher CF was found in the more medial penetration (no. 6). Blackened area shows position of mark- ing lesion. VeD, n. vestibularis dorsalis; VeL, n. vestibularis lateralis; VeM, n. vestibularis medialis. B. Photomicrograph showing position of electrode penetrations (arrows).
424
.4
n
N .3 I Y Y
Y -2 U
.ll
.4
0
2.3 Y Y
u - 2 V
.1
I B
EDWIN W RUBEL AND THOMAS N. PARKS
NM N L
D I
A
. . 5 c f - a = .41 5 c f .a = .41
I
Post-Ant
Lat-Med
P O S I T I O N (%I P O S I T I O N (%) Fig 10 Scatter plots, linear regressions, and standard errors of estimate in kHz (Scn, relating
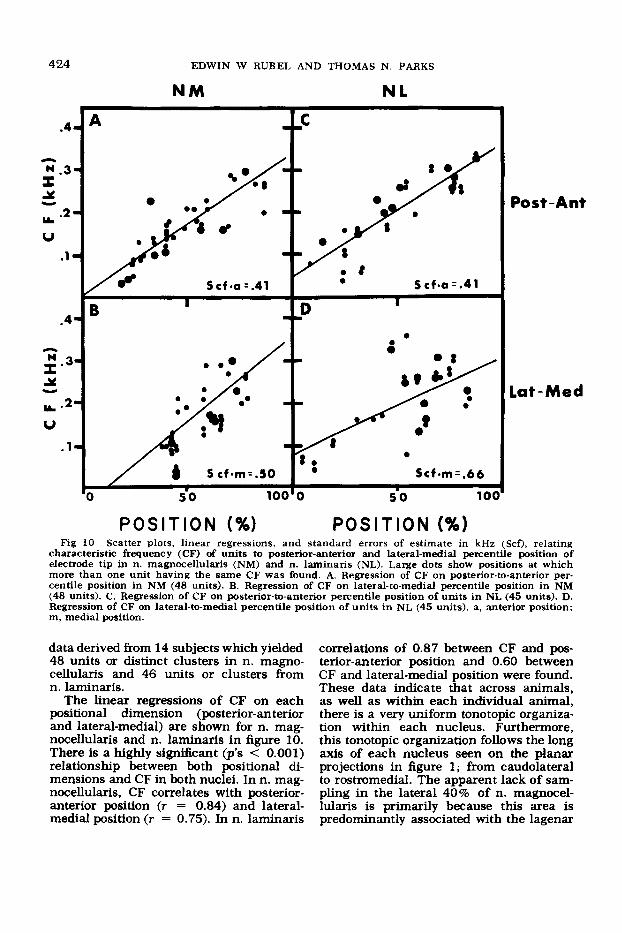
characteristic frequency (CF) of units to posterior-anterior and lateral-medial percentile position of electrode tip in n. magnocellularis (NM) and n. laminaris (NL). Large dots show positions at which more than one unit having the same CF was found. A. Remession of CF on posterior-to-anterior per- centile position in N M (48 units). B. Regression of CF on lateral-to-medial percentile position in NM (48 units). C. Regression of CF on posterior-to-anterior percentile position of units in NL (45 units). D. Regression of CF on lateral-to-medial percentile position of units in N L (45 units). a, anterior position; m, medial position.
data derived from 14 subjects which yielded 48 units or distinct clusters in n. magno- cellularis and 46 units or clusters from n. laminaris.
The linear regressions of CF on each positional dimension (posterior-anterior and lateral-medial) are shown for n. mag- nocellularis and n. laminaris in figure 10. There is a highly significant (p’s < 0.001) relationship between both positional di- mensions and CF in both nuclei. In n. mag- nocellularis, CF correlates with posterior- anterior position (7 = 0.84) and lateral- medial position (r = 0.75). In n. laminaris
correlations of 0.87 between CF and pos- terior-anterior position and 0.60 between CF and lateral-medial position were found. These data indicate that across animals, as well as within each individual animal, there is a very uniform tonotopic organiza- tion within each nucleus. Furthermore, this tonotopic organization follows the long axis of each nucleus seen on the planar projections in figure 1; from caudolateral to rostromedial. The apparent lack of sam- pling in the lateral 40% of n. magnocel- lularis is primarily because this area is predominantly associated with the lagenar
BRAIN STEM AUDITORY NUCLEI OF THE CHICKEN 425
N. Magnocel lular is ,, 4.0 /
L
3.0 - N
s I Y
25 5 0 7 5 100 POSITION P-A a L-M (%I POSITION P-A 8 L-M (%I
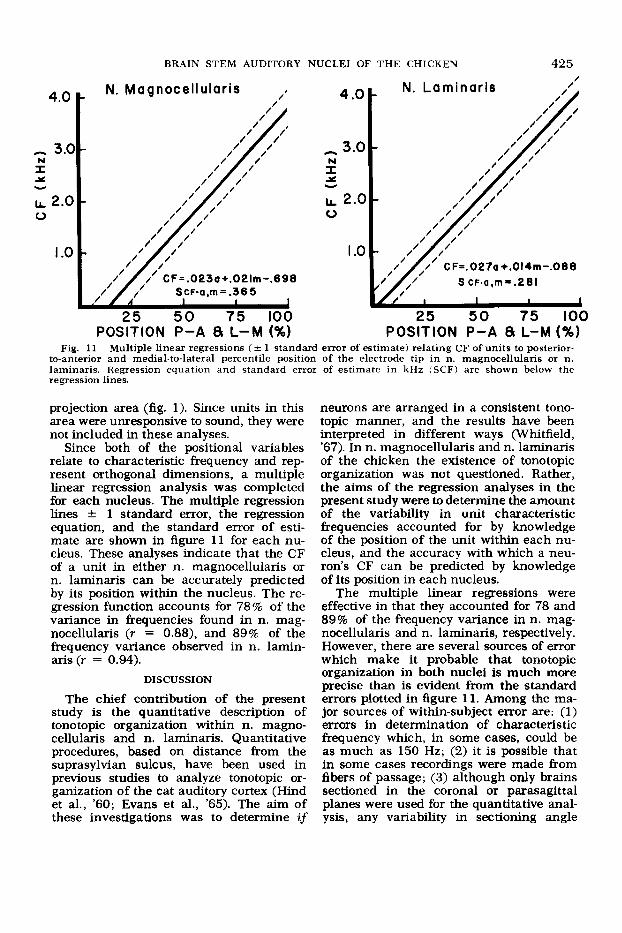
Fig. 11 Multiple linear regressions (+- 1 standard error of estimate) relating CF of units to posterior- to-anterior and medial-to-lateral percentile position of the electrode tip in n. magnocellularis or n. laminaris. Regression equation and standard error of estimate in kHz (SCF) are shown below the regression lines.
projection area (fig. 1). Since units in this area were unresponsive to sound, they were not included in these analyses.
Since both of the positional variables relate to characteristic frequency and rep- resent orthogonal dimensions, a multiple linear regression analysis was completed for each nucleus. The multiple regression lines f 1 standard error, the regression equation, and the standard error of esti- mate are shown in figure 11 for each nu- cleus. These analyses indicate that the CF of a unit in either n. magnocellularis or n. laminaris can be accurately predicted by its position within the nucleus. The re- gression function accounts for 78% of the variance in frequencies found in n. mag- nocellularis (r = 0.88), and 89% of the frequency variance observed in n. lamin- aris (r = 0.94).
DISCUSSION
The chief contribution of the present study is the quantitative description of tonotopic organization within n. magno- cellularis and n. laminaris. Quantitative procedures, based on distance from the suprasylvian sulcus, have been used in previous studies to analyze tonotopic or- ganization of the cat auditory cortex (Hind et al., '60; Evans et al., '65). The aim of these investigations was to determine if
neurons are arranged in a consistent tono- topic manner, and the results have been interpreted in different ways (Whitfield, '67). In n. magnocellularis and n. laminaris of the chicken the existence of tonotopic organization was not questioned. Rather, the aims of the regression analyses in the present study were to determine the amount of the variability in unit characteristic frequencies accounted for by knowledge of the position of the unit within each nu- cleus, and the accuracy with which a neu- ron's CF can be predicted by knowledge of its position in each nucleus.
The multiple linear regressions were effective in that they accounted for 78 and 89% of the frequency variance in n. mag- nocellularis and n. laminaris, respectively. However, there are several sources of error which make it probable that tonotopic organization in both nuclei is much more precise than is evident from the standard errors plotted in figure 11. Among the ma- jor sources of within-subject error are: (1) errors in determination of characteristic frequency which, in some cases, could be as much as 150 Hz; (2) it is possible that in some cases recordings were made from fibers of passage; (3) although only brains sectioned in the coronal or parasagittal planes were used for the quantitative anal- ysis, any variability in sectioning angle
426 EDWIN W RUBEL AND THOMAS N. PARKS
introduces error in the percentile estimates; and (4) any deviations of the tonotopic or- ganization from the horizontal plane, as occurs in the caudo-lateral end of n. mag- nocellularis and the rostral end of n. la- minaris, introduces error into the analysis. Between-subject error is contributed by the combination of data from many sub- jects in preparing the composite maps. Although this is necessary to determine regression functions for use in future in- vestigations (see below), small differences in nuclear size and shape, differences in sectioning angle and slight differences in histological procedures introduce variabil- ity into the data. Although these factors were not controlled in the present study the “close fit” of the multiple regression analyses indicate that they do not repre- sent major sources of variation.
There are also reasons to assume that a non-linear function would be more ap- propriate for the analysis of sensory or- ganization. Differential development of particular regions within sensory systems has been the subject of much investigation (e.g. Welker et al., ’64; Konishi, ’69). When the result is an increase in the relative cellular area devoted to a particular range of the energy spectrum or amount of re- ceptor surface, a non-linear analysis may become progressively more appropriate. If, however, the hypertrophy is manifest in increased cellular density or in nuclear expansion in a dimension not related to the parameter under investigation (e.g. the dorseventral dimension of n. magno- cellularis) linearity is not disrupted. In addition, Clopton et al. (‘74) note that at some levels of the mammalian auditory system, particularly the basilar membrane and ventral cochlear nucleus, logarithmic functions relating distance to CF provide better predictions than linear functions. As the audible frequency range of animals increases, the difference betweem log and linear functions becomes increasingly im- portant. Thus in avian species, which are characterized by a relatively small fie- quency range, a linear analysis is probably appropriate. More empirically, a logarith- mic transformation applied to the frequen- cy parameter of our data did not appreci- ably change the outcomes of the analyses presented above.
Despite errors introduced by use of com- posite data and linear analyses, the re- gression procedures have shown that the tonotopic organization of n. magnocellu- laris and n. laminaris is quite uniform across animals of approximately the same age and breed; and that a large proportion of the CF variation is related to the posi- tion of a neuron within each nucleus. In other words, it is possible to predict the C F of a neuron by its relative position with- in either nucleus.
The use of quantitative analyses of grouped data provides several advantages over traditional “mapping” methods. First, quantitative data of this nature provide an expandable data-base to which new ob- servations can be added and with which the observations of other investigators can be directly compared (Clopton et al., ’74). From such findings the replicability of our observations can be directly determined and variations among taxonomic groups can be quantitatively assessed.
A second advantage involves the dis- covery of other properties of neural orga- nization besides receptotopic organization. For example, van Noort’s (‘69) observations on the AVCN of the cat, as well as the data presented above for n. magnocellularis, suggest that these nuclei are composed of isofrequency planes arranged in a tono- topic manner. While it is possible that all of the cells within a plane are functionally redundant, it is also conceivable that cells within one plane are systematically orga- nized in some fashion. Quantification of the tonotopic dimensions makes it possible to systematically investigate orthogonal dimensions of the nuclei. In this respect two interesting questions are: Is the supe- rior-to-inferior dimension of the basilar membrane represented orthogonally to the tonotopic organization in n. magnocellu- laris? Is the other dimension of the n. laminaris cell lamina systematically related to the position of a sound in space (i.e. to time differences of sound reaching the two ears; see Parks and Rubel, ’75).
Quantification of sensory system orga- nization across subjects also has important advantages for studying changes in neu- ronal properties as a function of age, ex- perimental manipulations, or pathology. For example, independent prediction of
BRAIN STEM AUDITORY NUCLEI OF THE CHICKEN 427
the neural elements normally activated by a particular environmental event (e.g. a particular tonal frequency band) makes i t possible to study the specific effects of en- vironmental enrichment or deprivation on the physiology, biochemistry and structure of those neural elements, as compared to cells normally activated by a different fre- quency range.
Comparisons with other avian species The tonotopic organizatiom of n. magno-
cellularis observed in the present study is consistent with the results of previous in- vestigations on other avian species. Boord and Rasmussen ('63) demonstrated that fibers innervating the distal portion of the pigeon basilar membrane terminate in the caudolateral region of n. magnocellularis and that successively proximal areas pro- ject to progressively rostromedial areas of n. magnocellularis. It is generally accepted that low-frequency sound is transduced in the distal portions of the basilar membrane and higher frequencies more proximally (Pearson, '72; Bekesy, '60). The results of Boord and Rasmussen, therefore, would predict the tonotopic organization observed in the present study and in previous studies on sparrows and embryonic ducks (Konishi, '69, '73).
The response characteristics of n. mag- nocellularis cells in the hatchling chicken also appear similar, with respect to lat- erality, post-stimulus-histogram contour, frequency range and intensity thresholds, to what has been reported previously. Char- acteristic frequencies of units observed in this study ranged from 0.2 to 4.1 kHz. Al- though a considerably larger range has been observed in many songbirds (Konishi, '69, '70) and Sachs et al. ('74) report a few pigeon auditory nerve fibers responding in the 5-6 kHz range, behavioral, evoked- potential and single-unit investigations of species without highly specialized vocal abilities show results similar to those of the present study (Heise, '53; Schwartzkopff, '68; Harrison and Furumoto, '71; Konishi, '73; Dooling and Saunders, '75; Saunders et al., '74). Thus a frequency range ex- tending from less than 100 Hz up to a p proximately 4 5 kHz probably represents a relatively unspecialized avian form. One discrepancy between response character-
istics of cells in n. magnocellularis of the pigeon (Stopp and Whitfield, '61) and those of the hatchling chicken is apparent. About one-fifth of the pigeon neurons could not be excited by pure-tone stimuli and had well-defined, purely inhibitory tuning curves. We observed many units in which the spontaneous activity could be inhibited by tonal stimuli, but no purely inhibitory units. In all cases the inhibitory fiequen- cies were on one or both sides of an ex- citatory band. Whether this difference is due to age (adult vs 5-15-day-old), species (pigeons vs. chickens), or anesthetic (ure- thane vs. Equithesin) cannot be deter- mined.
The tonotopic organization of n. lamin- aris has not been previously reported. It is noteworthy that this nucleus, which is innervated primarily or entirely by n. mag- nocellularis (Ramon y Cajal, '08; Sanders, '29; Boord, '68; Parks and Rubel, '75) is remarkably similar to m. magnocellularis in both shape and tonotopic Organization. The organization of connections responsi- ble for these similarities is the subject of the following paper (Parks and Rubel, '75).
Comparisons with other amniotes Manley ('70b) did not find a clear indi-
cation of tonotopic organization in the cochlear nuclei of some chelonid, iguanid and gekkonid species, but n. magnocellu- laris of Caiman is tonotopically organized in a manner similar to that in birds (Man- ley, '70a). Although these interspecific dif- ferences in tonotopic organization were attributed to variations in the elongation and tapering of the basilar membrane (Manley, '70b, '72), the absence of de- tailed histological analyses of recording sites makes it possible that an existing tonotopic organization was obscured by the relatively small size of the cochlear nuclei in some species. In any case, all species of birds and reptiles for which a tonotopic organization of n. magnocellularis has been demonstrated present a quite similar pattern, suggesting that it may represent the basic plan of organization among non- mammalian terrestrial vertebrates.
Previous authors have suggested that the magnocellular nucleus of birds and reptiles is homologous to the anteroven- tral cochlear nucleus (AVCN) of mammals
428 EDWIN W RUBEL AND THOMAS N. PARKS
(e.g. Ramon y Cajal, ’08; Boord, ’69). Neu- rons comprising the feline AVCN have been classified by several authors on the basis of both Nissl- and Golgi-stained ma- terial (e.g. Ramon y Cajal, ’09; Lorente de No, ’33; Osen, ’69a,b; Brawer et al., ’74). It is not possible to comprehensively relate the classification schemes of all authors (cf. Brawer et al., ’74), however, some interesting similarities exist between the AVCN cytoarchitecture described by Brawer et al. (‘74) and our observations on n. magnocellularis in the chicken and other avian forms. On the basis of Nissl- stained sections Brawer et al. (’74) divide the AVCN into anterior and posterior divi- sions which appear to correspond to the spherical cell areas, and globular and mul- tipolar areas, respectively, of Osen (‘69b). Nissl-stained sections through the medial and lateral divisions of NM of hatchling and embryonic chickens, embryonic ducks, and embryonic bobwhite quail reveal cel- lular characteristics similar to those de- scribed by the above authors; large and medium-sized spheroid and ovoid cells with no discernible dendritic processes and of- ten containing an eccentric nucleus. Cells conforming to Osen’s (’69b) “globular” type are interspersed throughout n. mag- nocellularis, but we have not seen any multipolar cells in the medial or lateral divisions. Observations of n. magnocellu- laris cells stained by Golgi-Kopsch and Golgi-Cox methods (Rubel and Parks, un- published observations) indicate a prepon- derance of cells similar to the “adendritic bushy” and “bushy” types described by Brawer et al. (‘74) plus a very few stellate neurons scattered throughout the nucleus. As in the pigeon (Boord and Rasmussen, ’63), the only consistent difference between cells in the medial and lateral divisions of the nucleus of chicken, quail, and duckling is that in the lateral division cells tend to be slightly smaller.
In addition to the morphological simi- larities, AVCN and n. magnocellularis also share several physiological properties. Pfeiffer (‘66a), Kiang et al. (’73) and Gold- berg and Brownell (‘73) report that units in the spherical cell region (anterior divi- sion of Brawer et al., ’74) of the AVCN have narrow, excitatory tuning curves and display “primary-like” PST histogram pat- terns to tone burst stimulation. In n. mag-
nocellularis, cells also have narrow tuning curves (Stopp and Whitfield, ’61) and pri- mary-type histogram patterns. The one contradictory finding, a large number of purely inhibitory units (Stopp and Whit- field, ’61), was not confirmed in the present investigation. The characteristic triphasic waveform seen within AVCN of the cat (Pfeiffer, ’66b; Goldberg and Brownell, ’73), which is probably related to calycoid end- ings (Li and Guinan, ’71), has not been investigated in the avian nucleus. Thus, several lines of converging evidence sug- gzst that the AVCN has remained in a rel- atively unchanged form during mammalian evolution, with the principal adaptation being that the embryonic cells, originating at the rhombic lip, migrate ventrolaterally in mammals and ventromedially in birds.
To our knowledge the only previous elec- trophysiological observations on n. lamin- airs are those of Erulkar (’55), Schwartz- kopff (‘63) and Stopp and Whitfield (’61). On the basis of evoked potential latencies Erulkar (’55) suggested that n. laminaris receives a direct projection from cochlear nerve fibers, and Stopp and Whitfield (’61), apparently, did not notice the binaural na- ture of these cells. On the basis of experi- mental anatomical studies (Boord and Ras- mussen, ’63), it is now generally accepted that the principal auditory input to n. laminaris is from the ipsilateral and con- tralateral magnocellular nuclei (Boord, ’69), and Schwartzkopff (’68) indicated that the polarization of inputs to the two sides of n. laminaris neurons “shows up in electrophysiological experiments. . .” This nucleus, which is seen in some rep tilian and apparently all avian species (Ariens-Kappers et al., ’36; Miller, ’75; Rubel, unpublished observations) has been considered homologous to the medial su- perior olivary nucleus (MSO) of mammals on the basis of morphological character- istics (Boord, ’68, ’69) and its presumed relation to sound localkation (Erulkar, ’72). The present electrophysiological ob- servations support this relationship in at least two respects. First, the distinctive laminar organization, with polarized in- puts, causes the polarity reversal of an acoustically-driven evoked potential as an electrode traverses the cellular and ven- tral neuropil layers of n. laminaris. Simi- lar observations have been made in MSO
BRAIN STEM AUDITORY NUCLEI OF THE CHICKEN 429
Galambos et al., '59; Goldberg and Brown, '68; Guinan et al., '72b). Secondly, in a very careful study of response properties of superior olivary complex units, Guinan et al. ('72a,b) found that MSO units were optimally driven by the same frequency applied to either ear and that most units were excited by a tonal stimulus to either ear. The present observations on n. lamin- aris demonstrate similar characteristics.
A note on morphological terminology The posterior ramus of the eighth cra-
nial nerve of birds is composed of three separate nerve trunks: the inferior ves- tibular nerve innervating the crista of the posterior semicircular canal, the macula of the saccule and the small macula ne- glecta; the cochlear nerve innervating the hair cells of the basilar papilla; and the lagenar nerve innervating the macula la- gena (Boord, '69). At present, the func- tion of the macula lagena is not under- stood. Although it lies at the distal end of the cochlea, there are both morphological and physiological reasons to suspect that its role is not in audition.
The macula lagena resembles a vestibu- lar more than an auditory receptor (Boord, '69) and its innervation pattern and gan- glion cell location are distinct from those of the cochlea. In addition, the size range of the axons forming the lagenar nerve is distinctly different from the cochlear por- tions of the avian eighth nerve (Boord, '69). Turning to their central projections, older studies on normal material reported that the ventrolateral division of n. mag- nocellularis receives afferents directly from the cochlear ganglion (Holmes, '03; Ramon y Cajal, '08; Sanders, '29). However, Boord and Rasmussen ('63) and Boord and Kar- ten ('74), using degeneration methods following partial destruction of cochlear and lagenar nerve segments, have gathered considerable evidence that the ventrolat- eral division of n. magnocellularis receives lagenar but not cochlear afferents. These authors conclude that the lateral and me- dial portions of n. magnocellularis receive little or no innervation from the macula lagena. Furthermore, the termination sites of the lagenar ganglion, falling outside the ventrolateral portion of n. magnocel- lularis, more closely resemble the projec- tions of the vestibular than the cochlear
portion of the eighth nerve (Boord and Karten, '74). Our observations on embry- onic and hatchling chicken tissue stained by Nissl, protargol, Golgi-Kopsch and Golgi- Cox methods (Rube1 and Parks, unpub- lished observations) indicate that the ven- trolateral division of n. magnocellularis is cytoarchitecturally distinct from both the lateral and medial divisions of n. mag- nocellularis as well as from n. angularis and n. laminaris (fig. 13). Finally, in the present study no evidence could be found that cells in the ventrolateral division of n. magnocellularis are responsive to audi- tory stimulation in the 0.1 to 5.0 kHz range.
In light of these findings, it is proposed that the ventrolateral division of n. magno- cellularis be renamed the lagenar nucleus (Lag. in figs. 1, 6, 13). A similar sugges- tion is made by Boord and Karten ('74). Such a step would remove this cell group from its present confusing association with the neighboring, but apparently function- ally distinct, cochlear nuclei and would formally recognize its close relationship with the macula lagena.
ACKNOWLEDGMENTS
We would like to express our gratitude to the following individuals: Mr. James E. Cox for the statistical analyses; Mrs. W. Craig for histological processing of the tis- sue; Mr. Gus Ogren, Mr. Nigel Cox and Mr. Fred Davis for building and maintain- ing apparatus; Mr. Loring Ingraham, Mr. J. R. H. Jackson, Ms. Laurie Miller, Mr. Daniel Smith, Ms. Peggy Stillman and Mr. Raoul Garcia y Vega for assistance during the recording sessions; Mr. M. Rosenthal for photographic work; Dr. J. I. Johnson, Mr. M. Ostapoff and Mr. H. Weingarten for helpful comments on an earlier draft of the manuscript; and Ms. Lin May for secretarial assistance. The research was supported by grant GB 31934 from the National Science Foundation.
LITERATURE CITED Allman, J. M., and J. H. Kaas 1971 Represen-
tation of the visual field in striate and adjoining cortex of the owl monkey (Aotus trivirgatus). Brain Res., 35: 8S106.
Ariens-Kappers, C. U., G. C. Huber and E. C. Crosby 1936 The Comparative Anatomy of
430 EDWIN W RUBEL AND THOMAS N. PARKS
the Nervous System of Vertebrates Including Man. Macmillan Co., New York.
1965 Glass coated tungsten microelectrodes. Science, 148: 14m1463.
Bekesy, G. 1960 Experiments in Hearing. Mc- Graw-Hill, New York.
Bock, W. J. 1969 The origin and radiation of birds. Ann. N. Y. Acad. Sci., 167: 147-155.
Boord, R. L. 1961 The efferent cochlear bundle in the caiman and the pigeon. Exp. Neurol., 3: 225-239. - 1968 Ascending projections of the pri-
mary cochlear nuclei and nucleus laminaris in the pigeon. J. Comp. Neur., 133: 523542. - 1969 The anatomy of the avian audi- tory system. Ann. N. Y. Acad. Sci., 167: 186- 198.
Boord, R. L., and H. J. Karten 1974 The distri- bution of primary lagenar fibers within the ves- tibular nuclear complex of the pigeon. Brain Behav. Evol., 10: 228-235.
Boord, R. L., and G. L. Rasmussen 1963 Pro- jection of the cochlear and lagenar nerves on the cochlear nuclei of the pigeon. J. Comp. Neur., 120: 463475.
Brawer, J. R., D. K. Morest and E. S. C. Kane 1974 The neuronal architecture of the cochlear nucleus of the cat. J. Comp. Neur., 155: 257- 300.
Clopton, B. M., J. A. Winfield and F. J. Flammino 1974 Tonotopic organization: Review and analysis. Brain Res., 76: 1-20.
Dooling, R. J., and J. C. Saunders 1975 Hear- ing in the parakeet (Melopsittacus undulatus): Absolute thresholds, critical ratios, frequency difference limens and vocalizations. J. Comp. Physiol. Psychol., 88: 1-20.
Erulkar, S. D. 1955 Tactile and auditory areas in the brain of the pigeon. J. Comp. Neur., 103: 421452. - 1972 Comparative aspects of spatial
localization of sound. Physiol. Rev., 52: 237- 360.
1965 The spatial distribution of unit characteristic frequency in the primary auditory cortex of the cat. J. Physiol. (London), 179: 238-247.
Galambos, R., J. Schwartzkopff and A. Rupert 1959 Microelectrode study of superior olivary nuclei. Am. J. Physiol., 197: 527-536.
Goldberg, J. M., and P. B. Brown 1968 Func- tional organization of the dog superior olivary complex: An anatomical and electrophysiolog- ical study. J. Neurophysiol., 31: 63-56,
Goldberg, J. M., and W. E. Brownell 1973 Dis- charge characteristics of neurons in anteroven- tral and dorsal cochlear nuclei of cat. Brain Res., 64: 35-54.
Gottlieb, G. 1971 Development of Species Iden- tification in Birds: An Inquiry into the Prenatal Determinants of Perception. Univ. of Chicago Press, Chicago.
Guinan, J. J., Jr., S. S. Guinan and B. E. Norris 1972a Single auditory units in the superior olivary complex. I: Responses to sounds and classifications based on physiological properties. Int. J. Neurosci., 4: 101-120.
Guinan, J. J., Jr., B. E. Norris and S. S. Guinan
Baldwin, H. A,, S. Frenk and J. Y. Lettvin
Evans, E. F., H. F. Ross and I. C. Whitfield
1972b Single auditory units in the superior olivary complex. 11: Locations of unit categories and tonotopic organization. Int. J. Neurosci., 4: 147-166.
Harrison, J. B., and L. Furumoto 1971 Pigeon audiograms: Comparison of evoked potential and behavioral thresholds in individual birds. J. Aud. Res., 11 : 3-2.
Heise, G. A. 1953 Auditory thresholds in the pigeon. Amer. J. Psychol., 66: 1-19.
Hind, J. E., J. E. Rose, P. W. Davies, C. N. Wool- sey, R. M. Bedamin, W. I. Welker and R. F. Thompson 1960 Unit activity in the auditory cortex. In: Neural Mechanisms of the Auditory and Vestibular Systems. G. L. Rasmussen and W. F. Windle, eds. Thomas, Springfield, Ill., pp. 201-210.
Hinde, R. A. 1969 Bird Vocalizations in Rela- tion to Current Problems in Biology and Psy- chology. Cambridge Univ. Press.
Holmes, G. 1903 On the comparative anatomy of the nervus acusticus. Trans. Roy. Irish Acad. (Dublin), Sect. B, 32: 101-144.
Hubel, D. 1957 Tungsten microelectrode for re- cording from single units. Science, 125: 549- 550.
Johnson, J. I., W. I. Welker and B. H. Pubols 1968 Somatotopic organization of raccoon dorsal column nuclei. J. Comp. Neur., 132: 144.
Karten, H. J. 1967 Organization of the ascend- ing auditory pathway in the pigeon (Columba livia). I. Diencephalic projections of the inferior colliculus (nucleus mesencephalicus lateralis, pars dorsalis). Brain Res., 6: 409-427.
1968 The ascending auditory pathway in the pigeon (Columba livia). 11. Telencephalic projections of the nucleus ovoidalis thalami. Brain Res., 11 : 134-153.
Kiang, N. Y.-S., D. K. Morest, D. A. Godfrey, J. J. Guninan, Jr. and E. C. K a n e 1973 Stimulus coding at caudal levels of the cat’s auditory nervous system. I. Response characteristics of single units. In: Basic Mechanisms in Hearing. A. R. M~ller, ed. Academic Press, New York,
Kiang, N. Y.-S., T. Watanabe, E. C. Thomas and L. F. Clark 1965 Discharge Patterns of Single Fibers in the Cat’s Auditory Nerve. MIT Press, Cambridge, Mass.
Konishi, M. 1969 Hearing, singleunit analysis and vocalizations in songbirds. Science, 166:
- 1970 Comparative neurophysiological studies of hearing and vocalizations in song- birds. Z. Vergl. Physiol., 66: 257-272. - 1973 Development of auditory neuronal
responses in avian embryos. Proc. Nat. Acad. Sci., 70: 1795-1798.
Li, R. Y.-S., and J. J. Guinan, Jr. Antidromic and orthodromic stimulation of neurons receiv- ing calyces of Held. MIT Quart. Bog. Rep., 100: 227-234.
Lorente de N6, R. 1933 Anatomy of the eighth nerve. 111. General plan of structure of the pri- mary cochlear nucleus. Laryngoscope, 43: 327- 350.
Manley, G. A. 1970a Frequency sensitivity of auditory neurons in the caiman cochlear nu- cleus. Z. Vergl. Physiol., 66: 251-256.
pp. 45s478.
11 7a1181.
BRAIN STEM AUDITORY NUCLEI OF THE CHICKEN 431
- 1970b Comparative studies of auditory physiology in reptiles. Z. Vergl. Physiol., 67: 363-381. - 1972 A review of some current concepts
of the functional evolution of the ear in terres- trial vertebrates. Evolution, 26: 608-621.
Merrill, E. G., and A. Ainsworth 1972 Glass- coated platinum-plated tungsten microelec- trodes. Med. & Biol. Eng., 10: 662-672.
Miller, M. R. 1975 The cochlear nuclei of liz- ards. J. Comp. Neur., 159: 37-06,
Nauta, W. J. H., and H. J. Karten 1970 A gen- eral profile of the vertebrate brain, with side- lights on the ancestry of the cerebral cortex. In: The Neurosciences: Second Study Program. F. 0. Schmitt, ed. Rockefeller Univ. Press, New York, pp. 7-26.
Osen, K. K. 1969a The intrinsic organization of the cochlear nuclei in the cat. Acta oto-laryng., 67: 352-359.
1969b Cytoarchitecture of the cochlear nuclei in the cat. J. Comp. Neur., 136: 453-484.
Parker, T. D., D. D. Strachan and W. I. Welker 1973 Tungsten ball microelectrodes for extra- cellular single-unit recording. EEG & Clin. Neurophysiol., 35: 647451.
Parks, T. N., and E. W Rubel 1975 Organiza- tion and development of brain stem auditory nuclei of the chicken: Organization of projections from n. magnocellularis to n. laminaris. J . Comp. Neur., 164: 43.5448.
Pearson, R. 1972 The Avian Brain. Academic Press, New York.
Pfeiffer, R. R. 1966a Classification of response patterns of spike discharges for units in the cochlear nucleus; tone-burst stimulation. Exp. Brain Res., I : 22CL235.
1966b Anteroventral cochlear nucleus: Wave forms of extracellular recorded spike po- tentials. Science, 154; 667-668.
Potter, H. D. 1965 Patterns of acoustically evoked discharges of neurons in the mesenceph- alon of the bullfrog. J. Neurophysiol., 28: 1155- 1185.
R h o n y Cqjal, S. 1908 Les ganglions termin- aux du nerf acoustique des oiseaux. Trab. Inst. Cajal Invest. Biol., 6: 19L225.
1909 Histologie du Systeme Nerveux de l'Homme et des Vertkbres. Chap. 28. Ma- loine, Paris.
Rose, J. E., R. Galambos and J. R. Hughes 1959 Microelectrode studies of the cochlear nuclei of the cat. Bull. Johns Hopk. Hosp., 104: 211-251.
Rubel, E. W 1971 A comparison of somatotopic organization in sensory neocortex of newborn kittens and adult cats. J. Comp. Neur., 143: 447- 480.
Sachs, M. B., E. D. Young and R. H. Lewis 1974 Discharge pattern of single fibers in the pigeon auditory nerve. Brain Res., 70: 431447.
Sanders, E. B. 1929 A consideration of certain bulbar, midbrain, and cerebellar centers and fiber tracts in birds. J. Comp. Neur., 49: 155- 222.
1973 The development of auditory evoked responses in the cochlea and cochlear nuclei of the chick. Brain Res., 63: 59-74.
1974 Brain-stem evoked responses as an index of hearing thresholds in one-day-old chicks and ducklings. J. Comp. Physiol. Psych., 86: 426- 431.
Schwartzkopff, J. 1955 On the hearing of birds. Auk, 72: 34tL347.
1963 Morphological and physiological properties of the auditory system in birds. Proc. XI11 Intern. Ornithol. Congr., 2: 1059-1068.
1968 Structure and function of the ear and of the auditory brain areas in birds. In: Hearing Mechanisms in Vertebrates. A Ciba Foundation Symposium. A. V. S. de Reuck and J. Knight, ebs. J & A Churchill Ltd., London, pp. 4 1 5 9 .
Stopp, P. E., and I. C. Whitfield 1961 Unit responses from brain-stem nuclei in the pigeon. J. Physiol. (London), 158: 165-1 77.
van Noort, J. 1969 The structure and connec- tions of the inferior colliculus. In: An Investiga- tion of the Lower Auditory System. Van Gor- cum, Leiden.
Welker, W. I., J. I. Johnson and B. H. Pubols 1964 Some morphological and physiological characteristics of the somatic sensory system in raccoons. Am. Zool., 4: 75-96.
Whitfield, I. C. 1967 The Auditory Pathway. Edward Arnold Ltd., London.
Winter, P. 1963 Untersuchungen an der Her- bahn von Vogeln. Z. Morph. Okol. Tiere., 52: 365-400.
Saunders, J. C., R. B. Coles and G. R. Gates
Saunders, J. C., G. R. Gates and R. B. Coles
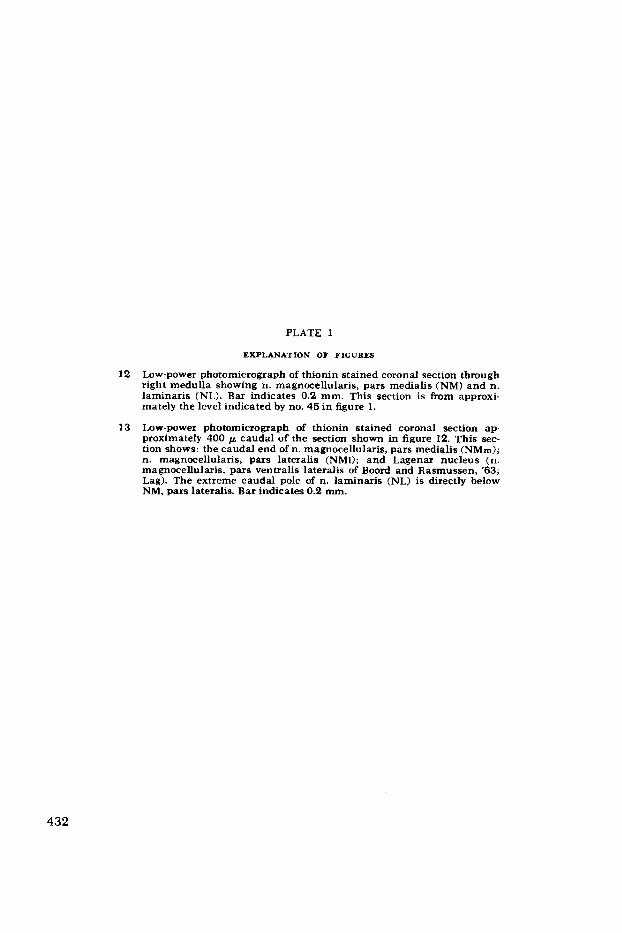
PLATE I
EXPLANATION OF FIGURES
12 Low-power photomicrograph of thionin stained coronal section through right medulla showing n. magnocellularis, pars medialis (NM) and n. laminaris (NL). Bar indicates 0.2 mm. This section is &om approxi- mately the level indicated by no. 45 in figure 1.
13 Low-power photomicrograph of thionin stained coronal section ap- proximately 400 p caudal of the section shown in figure 12. This sec- tion shows: the caudal end of n. magnocellularis, pars medialis (NMm); n. magnocellularis, pars lateralis (NMl); and Lagenax nucleus (n. magnocellularis, pars ventralis lateralis of Boord and Rasmussen, '63; Lag). The extreme caudal pole of n. laminaris (NL) is directly below NM, pars lateralis. Bar indicates 0.2 mm.
432

BRAIN STEM AUDITORY NUCLEI O F THE CHICKEN Edwin W Rube1 and Thomas N . Parks
PLATE 1
433