Embed Size (px)
Citation preview
Organization and Development of Brain Stem Auditory Nuclei of the Chicken: Ontogeny of N. magnocellularis and N. laminaris
EDWIN W. RUBEL, DANIEL J. SMITH AND LAURIE C . MILLER Department of Psychology, Y a l e University, N e w Haven, Connecticut 06520
ABSTRACT Nucleus magnocellularis (NM) and nucleus laminaris (NL) are, respectively, second- and third-order auditory nuclei in the chicken brain stem. In this report the morphogenesis of these nuclei is examined. The times of origin of the cells of these nuclei were studied with "-thymidine autoradiogra- phy. The number of cells in each nucleus and their rostro-caudal distribution within each nucleus was determined in Nissl-stained sections at 9, 11, 13, 15, 17, 19, and 21 days of incubation. For the above ages the volumes of NM and NL were also calculated planimetrically and the rostro-caudal distribution of volume within each nucleus was studied.
The results indicate that the times of origin of NM and NL neurons do not overlap - the cells of NM are formed at around 60 hours of incubation, while those of NL are formed at around 84 hours. At nine days, both nuclei have a roughly equal complement of cells; however by 21 days (hatching) the number of NM neurons has decreased by 1 8 4 , while the number of NL neurons has decreased by 84%. In both nuclei most of the cell death occurs in the period between 11 and 13 days, during which time NL assumes a laminar appearance. A rostro-caudal gradient of cell death was found for both nuclei. The times of volume increases in NM and NL commence at the end of the period of cell death, beginning at 13 days for NM and at 17 days for NL, whose cell death is more protracted. For both nuclei a rostro-caudal gradient of volumetric expansion was also found.
In the avian auditory system fibers from the cochlear ganglion enter the brain to innervate n. angularis (NA) and n. mag- nocellularis ( N M ) (Boord and Rasmussen, '63). The former region is composed of mixed cell types which are intermingled throughout the nucleus. N. magnocellu- laris, on the other hand, is well defined and relatively homogeneous in cellular characteristics and electrophysiological re- sponse properties (Boord and Rasmussen, '63; Rubel and Parks, '75). NM neurons have large round cell bodies, a few rudi- mentary dendrites, and receive large calyci- form terminals from the cochlear ganglion cells (Boord and Rasmussen, '63). In these and other characteristics, n. magnocellu- laris closely resembles, and has been con- sidered homologous to, the mammalian anteroventral cochlear nucleus( Ram6n y Cajal, '08; Boord, '69; Rubel and Parks, '75). Nucleus laminaris (NL), which in
J. COMP. NEUR., 166: 469490.
chickens is composed of a monocellular lamina throughout most of its rostro- caudal extent, receives binaural, spatially- segregated input from n. magnocellularis (Boord, '69; Parks and Rubel, '75). Axons from NM pass in the uncrossed dorsal cochlear tract to innervate the dorsal den- drites and cell bodies of the ipsilateral n. laminaris, and pass in the crossed dorsal cochlear tract to innervate the ventral den- drites and cell bodies of the contralateral NL (fig. 1).
N. magnocellularis receives a topograph- ically organized projection from the ipsi- lateral cochlea (Boord and Rasmussen, '63) and this topography is maintained in the projections from n. magnocellularis to both laminar nuclei (Parks and Rubel, '75). The result is a discrete and quantifi-
1 Present address: Department of Psychobiology,
2 Present address: Ohio State University Medical University of California, Irvine, California.
School, Columbus, Ohio.
469

470 EDWIN W. RUBEL, DANIEL J. SMITH AND LAURIE C. MILLER
Fig. 1 Schematic drawing showing the projections from the cochlea via the cochlear ganglion to n . angularis (NA) and n. magnocellularis ( N M ) ; and the spatially segregated, bilateral projections from n. magnocellularis to n. laminaris (NL) . IV - 4th ventricle.
able tonotopic organization in both n. mag- nocellularis and n. laminaris (Rube1 and Parks, '75). This simple functional organi- zation, in addition to the relative ease of manipulating avian embryos and the pos- sibilities of controlling the embryonic audi- tory environment, make these two nuclei potentially valuable for studying cellular interactions in the developing nervous system.
Relatively little information is available on the ontogeny of brain stem auditory nuclei in birds. Levi-Montalcini ('49) de- scribed the effects of otocyst removal on the morphology of n. magnocellularis and n. angularis in the chick embryo. In this classic paper she observed that otocyst removal at two days of incubation had little effect on these nuclei until after 11 days of incubation, at which time nuclear growth and cell number in n. angularis and n. magnocellularis were depressed on the operated side. Although it is evident from her results that major changes in cell size,
nuclear size and cell number occur between 13 days and hatching, Levi-Montalcini did not attempt to present a detailed analysis of normal differentiation. More recent investigations (Rebollo and Casas, '64; Rebollo and Rodriguez, '64; Rodriguez and Rebollo, '66; Knowlton, '67) have concen- trated on qualitative descriptions of coch- lea, ganglion cell, and auditory nerve development. Relatively little attention has been given to the central nuclei and no information is available regarding the times of cell origin, or of other quantita- tive characteristics of development in the auditory system.
The primary purpose of the present in- vestigation was to provide qualitative and quantitative information at the light micro- scope level on the normal ontogeny of n . magnocellularis and n. laminaris in the chicken embryo, Qualitative changes were studied in Nissl- and silver-stained tissue from embryos 5 days of incubation through hatching. The times at which n. magnocel-
BRAIN STEM AUDITORY NUCLEI OF THE CHICKEN 47 1
lularis and n. laminaris neurons pass through their fmal cycle of DNA synthesis (“cell birth-dates,’’ Sidman, ’70) was de- termined by the autoradiographic method of cumulative labeling with 3H-thymidine. FinaIIy, ceII numbers and nuclear volumes were determined for each nucleus in a series of embryos between nine days of age and hatching.
MATERIALS AND METHODS
Subjects Fertilized chicken eggs of White Leg-
horn and Red Cornish breeds obtained from local suppliers were stored at 14°C for 1-7 days and then incubated in a forced-draft incubator at 37.5”C (50-60% relative humidity) and turned four times daily. Ages were determined by considering one day as 24 hours after the beginning of incubation, one and one-half days as 36 hours, etc. Older animals (> 17 days) were transferred to a still-air incubator main- tained at 38.5”C, 60-70% relative humid- ity. These eggs were not turned. Since the developmental rate can vary with the breed and with small changes in incubation con- ditions (Hamburger and Hamilton, ’51), most qualitative and all quantitative com- parisons were made among subjects of the same breed which were incubated together. Each group of embryos incubated together is referred to as a “series.”
Qualitative observations The histological appearance of n. mag-
nocellularis and n. laminaris has been ex- amined in over 70 embryos ranging in age from 5 days through 21 days (hatching). Most observations were from four major series in which at least two animals were sacrificed at each of the following ages: 5, 7, 9, 10, 11, 12, 13, 15, 17, 19 and 21 days. In most cases the entire head was fixed by immersion in Bouin’s solution for a minimum of 24 hours. The brain or entire head (decalcified when necessary) was dehydrated through a graded series of ethanol and embedded in paraffin. Serial sections (8 or 10 pm) were cut in the coronal or sagittal plane and stained for cell bodies with thionin or for neurofibrils with Bodian’s protargol method. In order to study changes in nuclear morphology, i t was found useful, in most cases, to mount and stain every section.
Time of cell origin The times of cell proliferation in n. mag-
nocellularis and n. laminaris were studied in Red Cornish chicken embryos by auto- radiographic methods (Sidman, ’70). The principal experiment employed a single series of 30 embryos and a single shipment of [methyl-’HH] thymidine (New England Nuclear) (sp. act. 55.3 Ci/mMole; conc. 0.5 ,Ci/d in distilled H20). A multiple labeling procedure was used in which a lateral window of approximately 4 mm diameter was made over the embryo with sterile instruments and sterile chick Ringer’s (Oppenheim, et al., ’72). Under a dissecting microscope an initial dose of 10 ,Ci(20 ,I) ”-thymidine was applied to the membrane directly over the embryo. The window was then sealed with Para- film and the embryo was returned to the incubator. Three successive applications of 5 ,Ci of 3H-thymidine were made at 12- hour intervals, after which the egg was rotated approximately every 12 hours for the remainder of the incubation period (until 17 days of age). Three embryos re- ceived the initial dose of 3H-thymidine at each of the following ages: 48, 60, 72, 84, 96, 108, 120, 132, 144, and 192 hours. Twenty embryos (67% ) survived to 17 days of age at which time they were sac- rificed by decapitation. The brain was then exposed and the head was immersed in Carnoy’s solution for 3-4 hours. The brains were removed, blocked and em- bedded in paraffin. Serial sections of the brain stem were cut at 6 ,m and every fourth section was mounted onto acid- cleaned subbed slides (Rogers, ’67). The slides were dried overnight at 37”C, de- paraffinized for 24 hours in xylene, hy- drated through a graded series of ethanol and briefly air-dried. The tissue was then dipped in NTB2 emulsion (Kodak), sealed in light-tight slide boxes containing silica crystals and exposed at 4°C for 11-14 days. Slides were developed in D19, fixed, washed and stained through the emulsion with thionin (pH 4.0-4.2).
In addition to the animals discussed above, two preliminary groups received single applications of 20 ,Ci or 10 ,Ci of 3H-thymidine in chick Ringer’s solution rather than in distilled water. There were no apparent differences between the single

472 EDWIN W. RUBEL, DANIEL J. SMITH AND LAURIE C. MILLER
and multiple applications, ingly, these former groups in the analysis (table 1 ) .
and, accord- were included
The sections through n. magnocellularis and n. laminaris on both sides of the brain were examined under a X 40 objective (N.A. 1.0) independently by two experi- menters. The following rating scheme was applied to each subdivision of n . laminaris and n. magnocellularis on each section: + = over 40% of the cells clearly labeled; 2 = occasional neurons labeled, - = none of the neurons labeled. A neuron was con- sidered labeled if the grain counts over its
cells, the former being those in which the grains were too dense for actual counting. In practice, even these relatively simple procedures proved unnecessary. After scan- ning a section to determine the overall grain density and the density of the most heavily labeled cells, the presence or ab- sence of label over n. magnocellularis and n. laminaris cells was easily determined. Furthermore, there was virtually no vari- ability from section to section within any nucleus from any one brain and agreement between the two observers was almost per- fect (table 1).
Cell number and nuclear volume nucleus exceeded X Sbackground. A sub- iective distinction was also made between “heavily labeled’ and “lightly labeled” Quantitative analyses of cell number in
TABLE 1 Observed times of origin of cells in n. laminaris, n. magnocellularis, and n. lagenaris, b y t ime of first
injection of tritiated thymidine
NL N M
Brain no. Med. Lat. Med. Lat. Lag
DS EWR DS EWR RGyV1 EWR Age, l s t in j . DS EWR DS EWR
74-7 15
74-701 74-71 1 74-718
74-723 74-729
74-713 74-726
74-716 74-706 73-705 73-706
74-728 74-704 74-722 74-705
74-727 74-724 74-703 74-707
74-725
74-719 74-720 74-730
74-717 74-731
48 hr
60 hr
72 hr
84 hr
96 hr
108 hr
120 hr
132 hr
144 hr
192 hr
+ + + + + + + + + + + + + + + + + + + + + + + + + + + + + + + + + + + + + + + + t f + + + + + +
+ + - - - - - -
+ + + + + + + + + + + + + + + +
+ + + + + + + + + + + + + + + + + t
- c - -
+ + c f f t - -
Note: NL med. - n. laminaris, medial division; NL lat. - n. laminaris, lateral division; NM med. - n. mag- nocellularis, medial division; NM lat. - n. magnocellularis, lateral division; Lag. - n. lagenaris. “+” signifies heavy l$e!;ng of the nucleus (240% of the cells labeled; “t” signifies light labeling (occasional neurons la- beled); - signifies no labeled neurons. “DS,” “EWR’ and “RGyV” are the initials of observers.
1 We thank Mr. Raoul Garcia y Vega for collection of these data.
BRAIN STEM AUDITORY NUCLEI OF THE CHICKEN 473
n. magnocellularis and n. laminaris were made on a single series of Red Cornish em- bryos, from which four animals were sac- rificed at the following ages: 7, 9, 11, 13, 15, 17, 19 and 21 (hatching) days. The animals were staged according to Ham- burger and Hamilton (’51) and there was little variability among animals sacrificed at each particular time. These ages cor- responded to stages 30, 34, 36, 38, 40, 42, 44, 46, respectively. The brains were fixed by immersion in Bouin’s solution for 24 hours, dehydrated in a graded series of ethanol, embedded in paraffin, and sec- tioned through the region containing n. magnocellularis, n. angularis, and n. lami- naris. The sections were then mounted in serial order and stained with thionin.
To facilitate cell counting, preliminary tracings of NM and NL boundaries were made using a x 10 planapochromatic ob- jective (N.A. 0.32), a beam splitter, photo- tube and projection prism, for a total mag- nification of X 132. Care was taken to insure that all areas of the field were equally magnified. By nine days of age NM and NL are easily distinguished, and they both can be distinguished from the lagenar nucleus (Rube1 and Parks, ’75) by posi- tional and cytoarchitectonic criteria. How- ever, at this age medial and lateral divi- sions of NL cannot be distinguished. By 11 days a medial and a lateral division of NL are distinguishable : the former was defined as the region one cell deep; the latter was defined as being two or more cells in cross-sectional depth.
The number of cells in n. magnocellu- laris and n. laminaris on one side of the brain stem was determined in every fourth section at a magnification of X 500 using a x 40 planapochromatic objective (N.A. = 1.0) and x 12.5 occulars, into one of which a 10 x 10 reticule had been in- serted. All cells were counted which met the following criteria: discernable Nissl substance in the cytoplasm, a distinguish- able nuclear boundary and a nucleolus. No corrections for double counting were made since the probability of double counting is low when a nucleolar criterion is included and 8-10 pm thick sections are used (Konigsmark, ’70). The total number of cells in each nucleus of each animal was estimated by multiplying the number of cells counted x 4 (the sampling interval).
The following control procedures were used in an attempt to achieve an accurate representation of average cell number in each nucleus at the various ages: ( a ) At each age cell counts were completed on 2-4 subjects using the above procedures; (b) for at least two ages the number of neurons in every section through each nucleus was counted and compared to the counts obtained from every fourth sec- tion of the same tissue - this verification of sampling procedure reliability yielded counts within 4% ; (c) for two or more ages cell numbers were determined on both sides of the brain in one of the animals - this “within-subject’’ variation was always within 4% ; ( d ) for at least two ages the number of cells within each nucleus was determined on two separate occasions, separated by several weeks, by the same in- dividual - this verification of “within- experimenter” reliability yielded counts within 3%; (e) for at least two ages the number of cells in each nucleus was counted independently by two experi- menters - this index of “between-experi- menter” reliability yielded counts within 5% .
The volumetric analysis of n. magno- cellularis and n. laminaris was completed by tracing the outline of each nucleus from every fourth section of the tissue used for the cell numbers data. Nuclear bound- aries were drawn at a total linear mag- nification of X 330 using a X 25 planapo- chromatic objective (N.A. = 0.65) and care was taken to insure that all areas of the field were equally magnified. Nuclear areas were determined from the tracings with a compensating polar planimeter, multiplied by the sampling interval, con- verted to square microns, and multiplied by section thickness to determine vol- ume in p 3 . No corrections were made for possible differences in tissue shrinkage as a function of age. Tracings in NM included only the cellular area. That is, neuropil areas surrounding this nucleus were not included and nuclear subdivisions were not treated separately. NL, on the other hand, was divided into three components, each of which was measured separately; the somatic region was the area occupied by the cell bodies, the “dorsal neuropil area” was the glia-free region between the cell bodies and the glia border dorsal to the
474 EDWIN W. RUBEL, DANIEL J. SMITH AND LAURIE C. MILLER
nucleus, and the “ventral neuropil area” was the corresponding region between the cell bodies and the ventral glia rich area (fig. 3). These distinctions were made be- cause of the differential innervation of the dorsal and ventral neuropil areas from the ipsilateral and contralateral magnocellular nuclei (Parks and Rubel, ’75). The total volume of NL was considered to be the sum of these three regions.
RESULTS
Qualitative observations In Nissl- or Protargol-stained tissue
n. magnocellularis can be recognized at approximately seven days of incubation (stage 30) as a group of neogenic neurons (“neuroblasts”; Jacobson, ’70: p. 28) lying at the dorsolateral corner of the brain stem. NL cells are situated primarily ven- trad, but also extending rostrad, to NM. The two nuclei cannot be clearly distin- guished from each other or from n . angu- laris at this age. However, cells of all three nuclei have migrated away from the ven- tricular zone, where much mitotic activity is still occurring. At this age both NM and NL are composed of densely packed groups of small cells, 5-10 pm and 4-8 in diam- eter, respectively, with very little cytoplasm and no apparent dendritic processes. In silver-stained tissue a few acoustic nerve fibers can be seen entering the brain stem, but they do not appear to have penetrated into either NM or NA to any great extent and there is no evidence of terminal arbo- rizations in either nucleus. A few crossing fibers of the dorsal cochlear tract can also be seen.
By 9 days of incubation (stage 34), NL and NM can be distinguished as individual cell groups although neither have assumed the cytoarchitectural or positional charac- teristics of later stages. In Nissl-stained tissue (fig. 3A) both nuclei are composed of densely-packed cell bodies with no ap- parent subnuclear organization and are situated considerably lateral of their later position. However, silver impregnation (figs. 2A,B) reveals that a large number of presumably afferent axons are entering NM, and the crossed and uncrossed dorsal cochlear tracts are well formed. At this time the glia-free margin surrounding NL
has also formed, although it is not nearly so discrete as later (figs. 3A,B).
Between 9 and 11 days both nuclei ap- pear to be displaced to relatively more me- dial positions in the brain stem and begin to assume a more characteristic appear- ance. Cell density in NM is considerably diminished and the NL cells become aligned into a 1- or 2-cell deep sheet at the rostra1 end of the nucleus. Cell diam- eter and the ratio of cytoplasmic to nu- clear material also appear to increase con- siderably during this time. By 13 days both nuclei have largely assumed their charac- teristic forms, though the above trends, coupled with cell loss (see below), con- tinue until about 15 days of incubation. In the period between 15 days and hatch- ing there are marked increases in the neu- ropil-to-cell body ratios and the cell diam- eters within each nucleus, factors leading to large changes in nuclear volumes (see below ) .
Overall, the major qualitative changes in NM and NL during the final two-thirds of embryogenesis are: (1) during days 7-11, the cells migrate or are displaced to their final position, differentiate to assume the appearance of neurons, and appear to produce axonal processes; ( 2 ) during the period from 11-15 days the intranuclear cytoarchitecture emerges through cell-loss and alignment, i.e.. the characteristics of nuclear organization become apparent; and (3 ) in the final phase, 15-21 days, the predominant change is in the growth of cell bodies and neuropil, leading to the final differentiation of inter-nuclear or- ganization.
Cell proliferation Table 1 summarizes the observations on
times of tritiated thymidine uptake by NL and NM neurons. The two observers agreed almost perfectly on the extent of neuronal labeling within each nucleus, and there
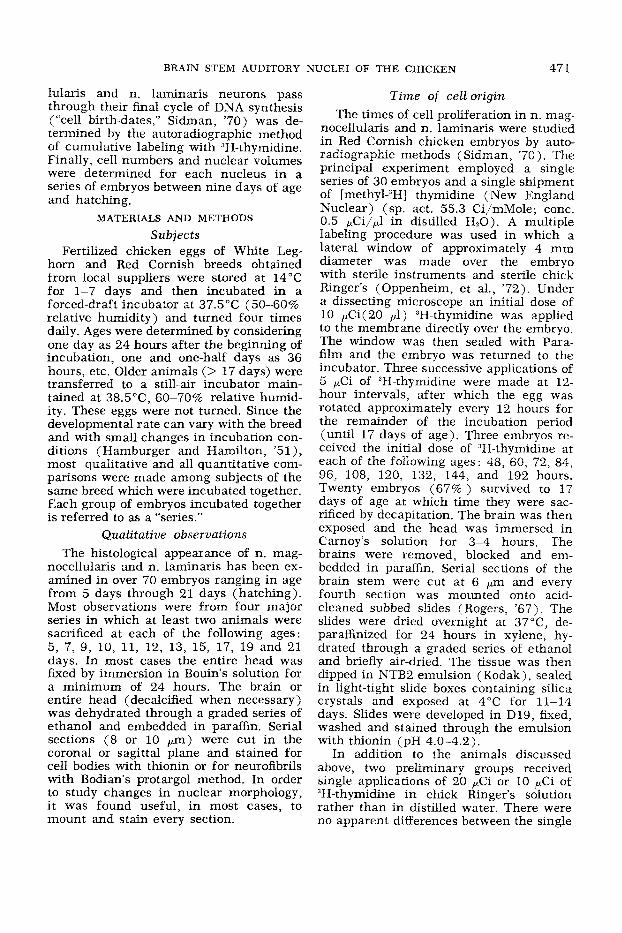
Fig. 2 A. Silver-stained section through me- dulla of 9-day chick, at level of n. magnocellu- laris (enclosed) and n. laminaris (NL). Note presence of acoustic nerve fibers (left) , and pres- ence of fibers in the crossed dorsal cochlear tract (pointer ) coursing across the dorsal medulla. Bar = 0.1 mm.
B. Higher magnification of NM from the sec- tion shown above. Note the presence of fibers in n. magnocellularis at this time. Bar = 10 pm.

BRAIN STEM AUDITORY NUCLEI OF T H E CHICKEN 475
Figure 2
476 EDWIN W. RUBEL, DANIEL J. SMITH AND LAURIE C. MILLER
Figure 3

BRAIN STEM AUDITORY NUCLEI OF THE CHICKEN 477
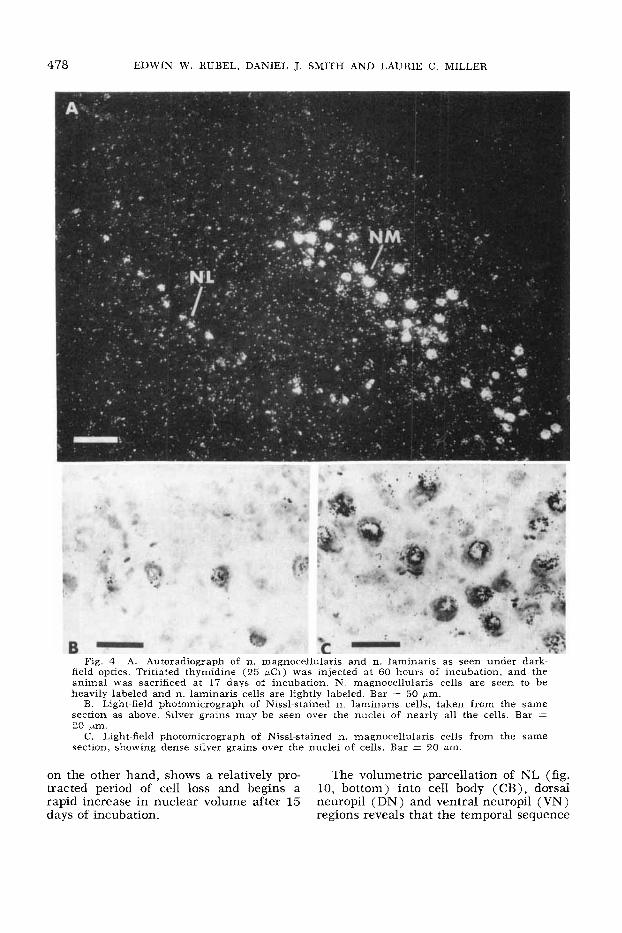
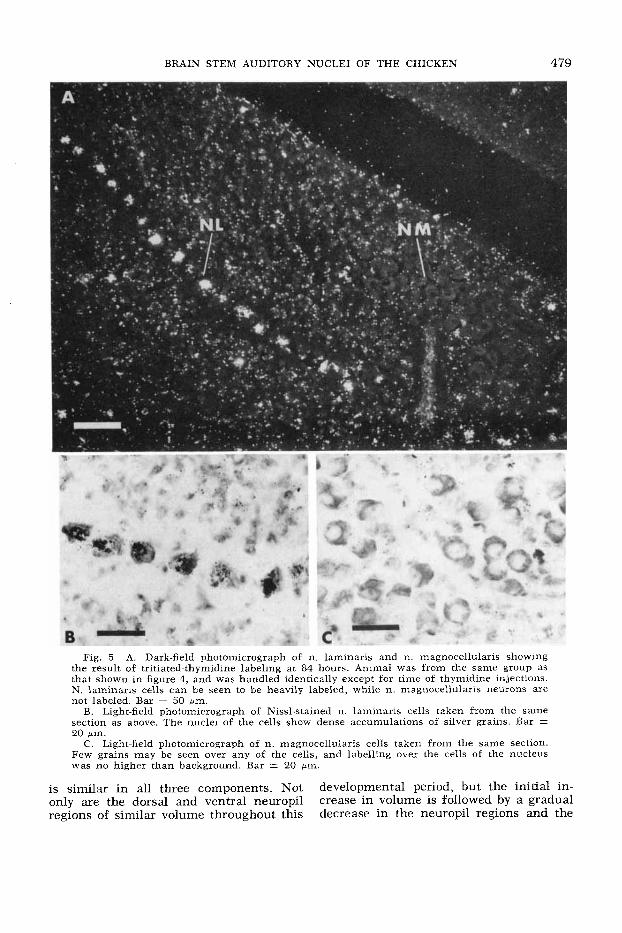
was no overlap in the final period of label- ing of NL and NM. NM cells consistently showed uptake of thymidine through 60 hours (2.5 days) of incubation with a peak at 60 hours, and in only one brain were a few labeled cells seen following a 72-hour injection. NL neurons, on the other hand, did not show “heavy labeling” following a single administration of thymidine, un- less it occurred at 84 or 96 hours of incu- bation and, with one exception, showed no labelled cells following applications later than 96 hours. Figures 4 and 5 dem- onstrate these relationships in two animals which were incubated together, and treated identically except for the time of a single application of tritiated thymidine. Admin- istration at 60 hours (fig. 4) produced heavy labeling of NM cells and relatively fewer grains over NL neurons, while an 84 hour application (fig. 5 ) resulted in only background counts over NM and heavy labeling over NL. It therefore appears that “I neurons go through their final cell division around 60 hours of incubation, after which time the cells of NL are formed. By 108 hours of incubation the en- tire population of neurons contributing to these cell groups has been formed.
Cell number The mean number of neurons in NM
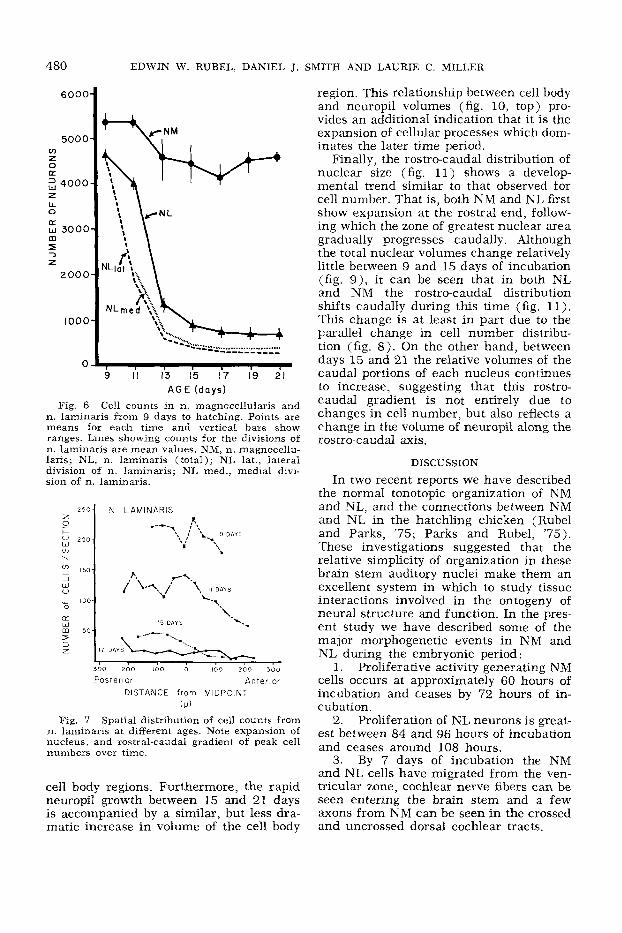
and NL during the period from 9 days of incubation through hatching (21 days) is indicated in figure 6. Also shown are the ranges of cell counts, including all of the control procedures indicated above (see METHODS). At nine days of incubation, NM contains about 5,500 neurons and this number remains relatively stable through day 11. By 13 days, there has been a cell loss of approximately 18% to 4,500 cells. The number of neurons thereafter remains relatively stable. At nine days NL contains
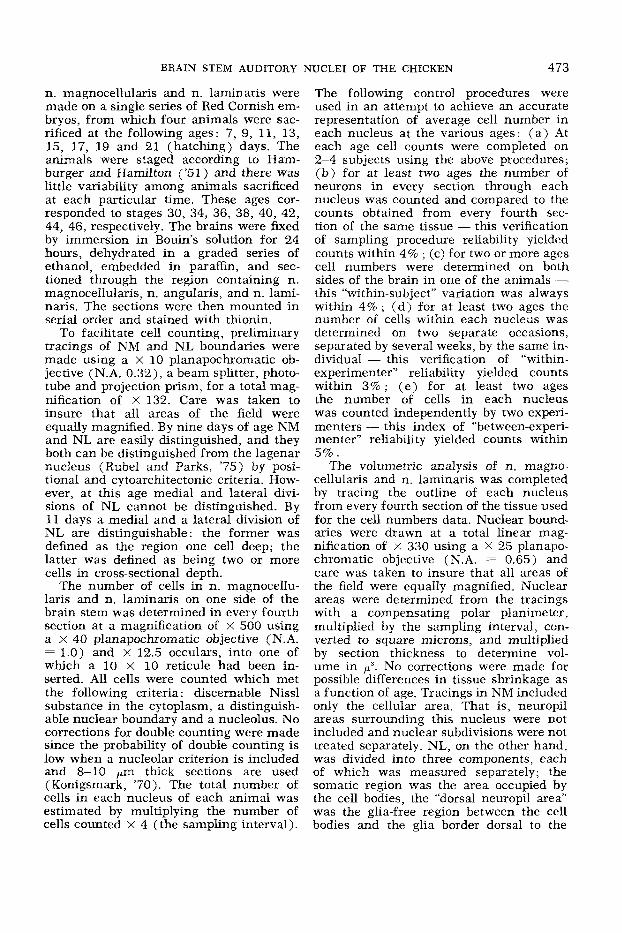
Fig. 3 A. Nissl stained section through n. magnocellularis and n. laminaris of 9-day chick. N. laminaris has not yet taken on its character- istic single-laminar appearance at this time; how- ever, the glia-free margin which surrounds it at later ages is already becoming apparent. Bar = 50 pm.
B. Nissl-stained section of n. magnocellularis and n. laminaris at 13 days of incubation. N. laminaris can be seen surrounded by glia-free neuropil, with the lateral division (right) 2-3 cells deep, and the medial division, a single-cell layer. Bar = 50 pm.
approximately 4,600 cells. Over the course of the next eight days, there appears to be an 84% loss, such that by 17 days there are only about 750 neurons in NL. It is noteworthy that although these changes are much more dramatic and occur over a much longer time course than indicated for NM, maximum cell loss in both nuclei occurs during the same period, 11-13 days.
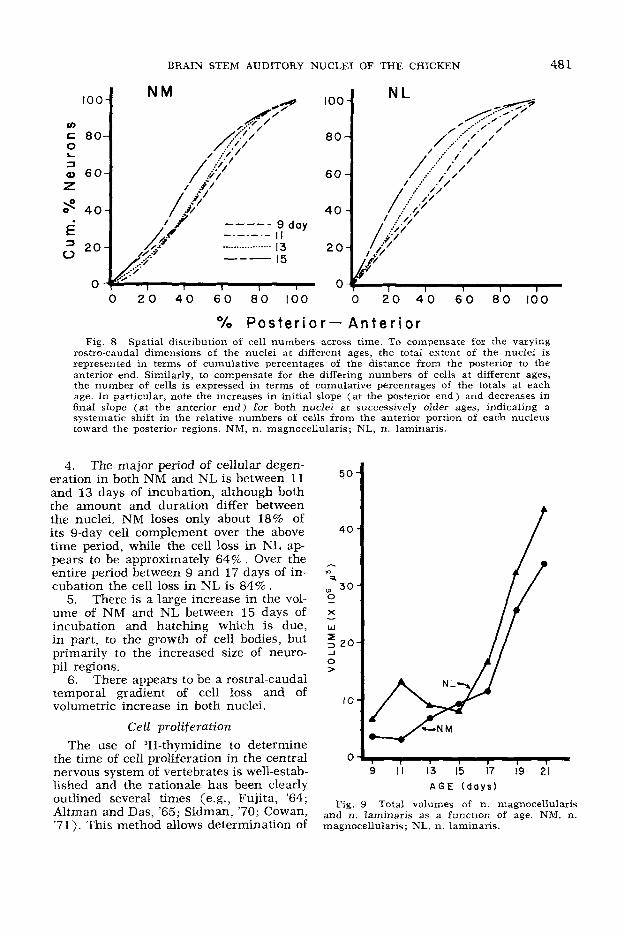
Ontogenetic changes in the rostro-caudal distributions of neurons in NM and NL are indicated in figures 7 and 8. At nine days of incubation the number of NL cells per section is relatively constant (fig. 7). As this nucleus expands longitudinally the number of cells per section declines radic- ally; initially at the rostral end and then progressively caudal. To compare the cellu- lar distributions across ages, the percent of cells at each rostro-caudal level in each brain was determined. These data were then combined for all animals of the same age and plotted as the cumulative percent- ages of cells, from the caudal to the rostral pole of each nucleus. In this way the nu- clear distribution of cell bodies can be com- pared across ages without regard to total cell numbers. These data are summarized in figures 8A,B for NM and NL respec- tively. Each curve represents the line of best fit for a particular age group. The slope at any position along a curve indi- cates the relative number of cells at that position. Over the period of 9-15 days of incubation the position of greatest slope moves progressively caudal in each nu- cleus, the trend being most dramatic in NL. Therefore, differentiation in these nu- clei, with respect to cell loss, progresses from rostral to caudal during this period.
Nuclear volumes Ontogenetic changes in total nuclear vol-
ume of NM and NL are indicated in figure 9. As was the case for cell number, the volumetric changes in the two nuclei prog- ress along a similar time course. In NL there appears to be an initial small in- crease in volume, then a fall during the period of rapid cell loss. It is noteworthy that cell loss has essentially ended by the time the nuclei begin to show their great- est expansion. That is, NM reaches a rela- tively stable number of cells by 13 days of incubation, and from that time there is a consistent increase in nuclear volume. NL,
478 EDWIN W. RUBEL, DANIEL J. SMITH AND LAURIE C. MILLER
Fig. 4 A. Autoradiograph of n. magnocellularis and n. laminaris as seen under dark- field optics. Tritiated thymidine (25 pCi) was injected at 60 hours of incubation, and the animal was sacrificed at 17 days of incubation. N. magnocellularis cells are seen to be heavily labeled and n. laminaris cells are lightly labeled. Bar = 50 pm.
B. Light-field photomicrograph of Nissl-stained n. laminaris cells, taken from the same section as above. Silver grains may be seen over the nuclei of nearly all the cells. Bar = 20 pm.
C. Light-field photomicrograph of Nissl-stained n. magnocellularis cells from the same section, showing dense silver grains over the nuclei of cells. Bar = 20 pm.
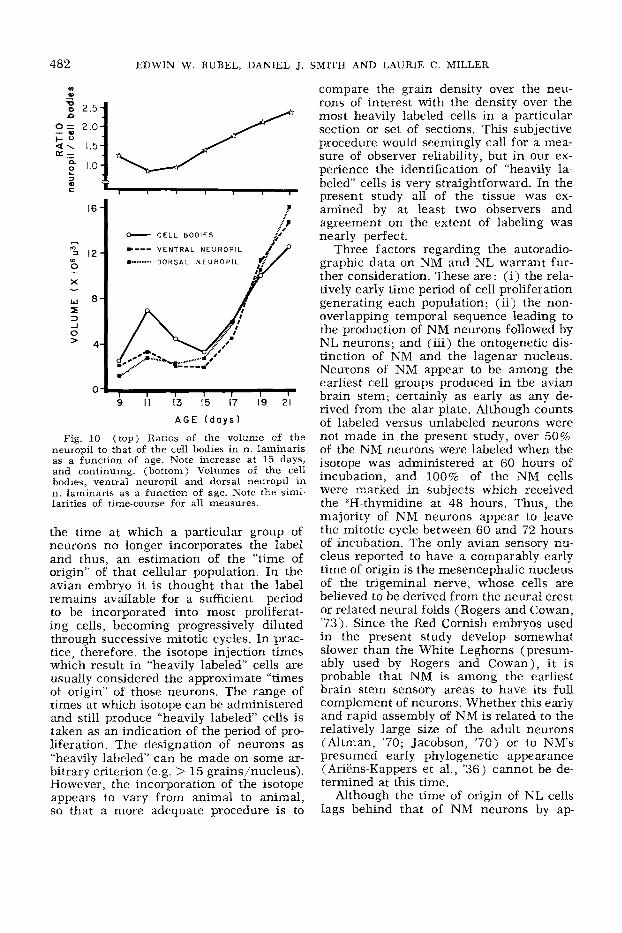
on the other hand, shows a relatively pro- The volumetric parcellation of NL (fig. tracted period of cell loss and begins a 10, bottom) into cell body (CB), dorsal rapid increase in nuclear volume after 15 neuropil (DN) and ventral neuropil (VN) days of incub ation. regions reveals that the temporal sequence
BRAIN STEM AUDITORY NUCLEI OF THE CHICKEN 479
Fig. 5 A. Dark-field photomicrograph of n. laminaris and n. magnocellularis showing the result of tritiated-thymidine labeling at 84 hours. Animal was from the same group as that shown in figure 4, and was handled identically except for time of thymidine injections. N. laminaris cells can be seen to be heavily labeled, while n. magnocellularis neurons are not labeled. Bar = 50 pm.
B. Light-field photomicrograph of Nissl-stained n. laminaris cells taken from the same section as above. The nuclei of the cells show dense accumulations of silver grains. Bar = 20 pm.
C. Light-field photomicrograph of n. magnocellularis cells taken from the same section. Few grains may be seen over any of the cells, and labelling over the cells of the nucleus was no higher than background. Bar = 20 gm.
is similar in all three components. Not only are the dorsal and ventral neuropil regions of similar volume throughout this
developmental period, but the initial in- crease in volume is followed by a gradual decrease in the neuropil regions and the
480
6000
5000 cn z 0 n 2 4000 z LL 0 a w 3000 m 5 3 z
2000
1000
0
150-
1 W 0
0 - 100-
LL W m 50- 2 3 z
EDWIN W. RUBEL, DANIEL J. SMITH AND LAURIE C. MILLER
P. f \A. jfl\. \. I1 DAYS
\ L. \. ..%
\. 15 D A Y S
I
9 I I 13 15 17 19 21 A G E (days)
Fig. 6 Cell counts in n. magnocellularis and n. laminaris from 9 days to hatching. Points are means for each time and vertical bars show ranges. Lines showing counts for the divisions of n. laminaris are mean values. NM, n. magnocellu- laris; NL, n. laminaris (total); NL lat., lateral division of n. laminaris; NL med., medial divi- sion of n. laminaris.
Posterior Anter ior DISTANCE from MIDPOINT
( P )
Fig. 7 Spatial distribution of cell counts from n. laminaris at different ages. Note expansion of nucleus, and rostral-caudal gradient of peak cell numbers over time.
cell body regions. Furthermore, the rapid neuropil growth between 15 and 21 days is accompanied by a similar, but less dra- matic increase in volume of the cell body
region. This relationship between cell body and neuropil volumes (fig. 10, top) pro- vides an additional indication that it is the expansion of cellular processes which dom- inates the later time period.
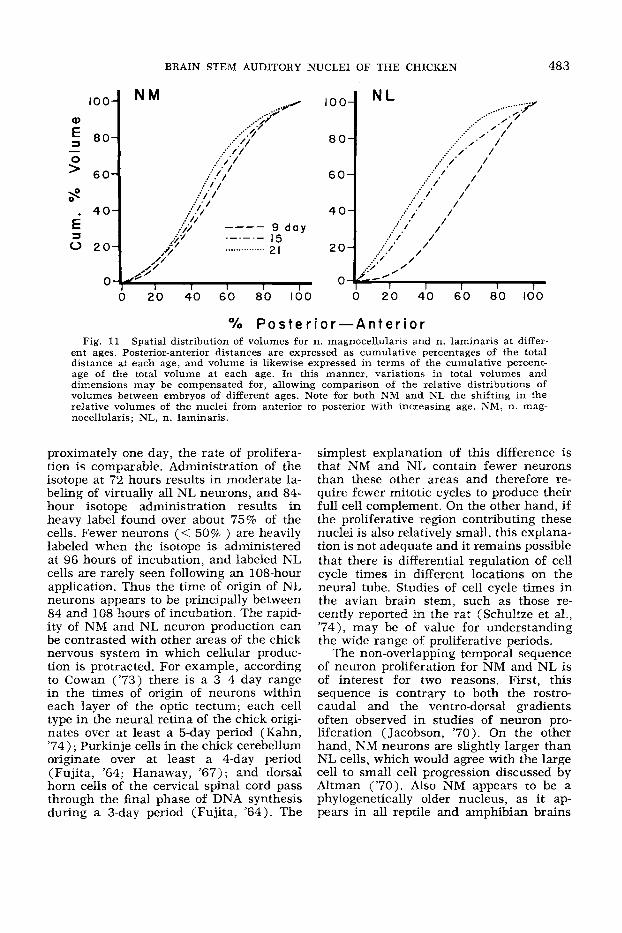
Finally, the rostro-caudal distribution of nuclear size (fig. 11) shows a develop- mental trend similar to that observed for cell number. That is, both NM and NL f i s t show expansion at the rostral end, follow- ing which the zone of greatest nuclear area gradually progresses caudally. Although the total nuclear volumes change relatively little between 9 and 15 days of incubation (fig. 9), it can be seen that in both NL and NM the rostro-caudal distribution shifts caudally during this time (fig. 11). This change is at least in part due to the parallel change in cell number distribu- tion (fig. 8). On the other hand, between days 15 and 21 the relative volumes of the caudal portions of each nucleus continues to increase, suggesting that this rostro- caudal gradient is not entirely due to changes in cell number, but also reflects a change in the volume of neuropil along the rostro-caudal axis.
-
DISCUSSION
In two recent reports we have described the normal tonotopic organization of NM and NL, and the connections between NM and NL in the hatchling chicken (Rubel and Parks, '75; Parks and Rubel, '75). These investigations suggested that the relative simplicity of organization in these brain stem auditory nuclei make them an excellent system in which to study tissue interactions involved in the ontogeny of neural structure and function. In the pres- ent study we have described some of the major morphogenetic events in N M and NL during the embryonic period :
1. Proliferative activity generating NM cells occurs at approximately 60 hours of incubation and ceases by 72 hours of in- c u bation.
Proliferation of NL neurons is great- est between 84 and 96 hours of incubation and ceases around 108 hours.
3. By 7 days of incubation the NM and NL cells have migrated from the ven- tricular zone, cochlear nerve fibers can be seen entering the brain stem and a few axons from NM can be seen in the crossed and uncrossed dorsal cochlear tracts.
2.
BRAIN STEM AUDITORY NUCLEI OF THE CHICKEN 48 1
100
u) C 80- 0
3 L
Q) 6 0 z
40
€ = 20 0
0 .
N M too
80
60
40
20
0 0 2 0 40 6 0 8 0 100 0 20 4.0 6 0 8 0 I00
o/o P o s t e r i o r - A n t e r i o r Fig. 8 Spatial distribution of cell numbers across time. To compensate for the varying
rostra-caudal dimensions of the nuclei at different ages, the total extent of the nuclei is represented in terms of cumulative percentages of the distance from the posterior to the anterior end. Similarly, to compensate for the differing numbers of cells at different ages, the number of cells is expressed in terms of cumulative percentages of the totals at each age. In particular, note the increases in initial slope (at the posterior end) and decreases in final slope (at the anterior end) for both nuclei a t successively older ages, indicating a systematic shift in the relative numbers of cells from the anterior portion of each nucleus toward the posterior regions. NM, n. magnocellularis; NL, n. laminaris.
4. The major period of cellular degen- eration in both NM and NL is between 11 and 13 days of incubation, although both the amount and duration differ between the nuclei. NM loses only about 18% of its 9-day cell complement over the above time period, while the cell loss in NL ap- pears to be approximately 64%. Over the entire period between 9 and 17 days of in- cubation the cell loss in NL is 84%.
There is a large increase in the vol- ume of NM and NL between 15 days of incubation and hatching which is due, in part, to the growth of cell bodies, but primarily to the increased size of neuro- pi1 regions.
There appears to be a rostral-caudal temporal gradient of cell loss and of volumetric increase in both nuclei.
Cell proliferation The use of 3H-thymidine to determine
the time of cell proliferation in the central nervous system of vertebrates is well-estab- lished and the rationale has been clearly outlined several times (e.g., Fujita, '64; Altman and Das, '65; Sidman, '70; Cowan, '71). This method allows determination of
5.
6.
5 0
4 0
R
w 30 o_ X
W
- I 3 2 0 J 0 >
10
I , I , 0
9 1'1 I; 15 17 19 21 A G E ( d a y s )
Fig. 9 Total volumes of n. magnocellularis and n. laminaris as a function of age. NM, n. magnocellularis; NL, n. laminaris.
482 EDWIN W. RUBEL, DANIEL J. SMITH AND LAURIE C. MILLER
UI w
- C E L L B O D I E S
V E N T R A L N E U R O P I L *---
1 1 1 1 1 4 ;I 13 15 17 19 21
A G E ( d o y s )
Fig. 10 (top) Ratios of the volume of the neuropil to that of the cell bodies in n . laminaris as a function of age. Note increase at 15 days, and continuing. (bottom) Volumes of the cell bodies, ventral neuropil and dorsal neuropil in n . laminaris as a function of age. Note the simi- larities of time-course for all measures.
the time at which a particular group of neurons no longer incorporates the label and thus, an estimation of the “time of origin” of that cellular population. In the avian embryo it is thought that the label remains available for a sufficient period to be incorporated into most proliferat- ing cells, becoming progressively diluted through successive mitotic cycles. In prac- tice, therefore, the isotope injection times which result in “heavily labeled” cells are usually considered the approximate “times of origin” of those neurons. The range of times at which isotope can be administered and still produce “heavily labeled’ cells is taken as an indication of the period of pro- liferation. The designation of neurons as “heavily labeled” can be made on some ar- bitrary criterion (e.g. > 15 grains/nucleus). However, the incorporation of the isotope appears to vary from animal to animal, so that a more adequate procedure is to
compare the grain density over the neu- rons of interest with the density over the most heavily labeled cells in a particular section or set of sections. This subjective procedure would seemingly call for a mea- sure of observer reliability, but in our ex- perience the identification of “heavily la- beled’ cells is very straightforward. In the present study all of the tissue was ex- amined by at least two observers and agreement on the extent of labeling was nearly perfect.
Three factors regarding the autoradio- graphic data on NM and NL warrant fur- ther consideration. These are: (i) the rela- tively early time period of cell proliferation generating each population; (ii) the non- overlapping temporal sequence leading to the production of NM neurons followed by NL neurons; and (iii) the ontogenetic dis- tinction of NM and the lagenar nucleus. Neurons of NM appear to be among the earliest cell groups produced in the avian brain stem; certainly as early as any de- rived from the alar piate. Although counts of labeled versus unlabeled neurons were not made in the present study, over 50% of the NM neurons were labeled when the isotope was administered at 60 hours of incubation, and 100% of the NM cells were marked in subjects which received the ’H-thymidine at 48 hours. Thus, the majority of NM neurons appear to leave the mitotic cycle between 60 and 72 hours of incubation. The only avian sensory nu- cleus reported to have a comparably early time of origin is the mesencephalic nucleus of the trigeminal nerve, whose cells are believed to be derived from the neural crest or related neural folds (Rogers and Cowan, ’73). Since the Red Cornish embryos used in the present study develop somewhat slower than the White Leghorns (presum- ably used by Rogers and Cowan), i t is probable that NM is among the earliest brain stem sensory areas to have its full complement of neurons. Whether this early and rapid assembly of NM is related to the relatively large size of the adult neurons (Altman, ’70; Jacobson, ’70) or to NMs presumed early phylogenetic appearance (Ariens-Kappers et al., ’36) cannot be de- termined at this time.
Although the time of origin of NL cells lags behind that of NM neurons by ap-
BRAIN STEM AUDITORY NUCLEI O F THE CHICKEN 483
100.
Q)
80. 3
0 ' 60. -
is €
4 0
3 0 2 0
0
100
80
6 0
4 0
20
0
N
2'0 410 610 a0 Id0
O/O Po s t e r i o r-A n t e r i o r Fig. 11 Spatial distribution of volumes for n. magnocellularis and n. laminaris at differ-
ent ages. Posterior-anterior distances are expressed as cumulative percentages of the total distance at each age, and volume is likewise expressed in terms of the cumulative percent- age of the total volume at each age. In this manner, variations in total volumes and dimensions may be compensated for, allowing comparison of the relative distributions of volumes between embryos of different ages. Note for both NM and NL the shifting in the relative volumes of the nuclei from anterior to posterior with increasing age. NM, n. mag- nocellularis; NL, n. laminaris
proximately one day, the rate of prolifera- tion is comparable. Administration of the isotope at 72 hours results in moderate la- beling of virtually all NL neurons, and 84- hour isotope administration results in heavy label found over about 75% of the cells. Fewer neurons (< 50% ) are heavily labeled when the isotope is administered at 96 hours of incubation, and labeled NL cells are rarely seen following an 108-hour application. Thus the time of origin of NL neurons appears to be principally between 84 and 108 hours of incubation. The rapid- ity of NM and NL neuron production can be contrasted with other areas of the chick nervous system in which cellular produc- tion is protracted. For example, according to Cowan ('73) there is a 3-4 day range in the times of origin of neurons within each layer of the optic tectum; each cell type in the neural retina of the chick origi- nates over at least a 5-day period (Kahn, '74); Purkinje cells in the chick cerebellum originate over at least a 4-day period (Fujita, '64; Hanaway, '67); and dorsal horn cells of the cervical spinal cord pass through the final phase of DNA synthesis during a 3-day period (Fujita, '64). The
simplest explanation of this difference is that NM and NL contain fewer neurons than these other areas and therefore re- quire fewer mitotic cycles to produce their full cell complement. On the other hand, if the proliferative region contributing these nuclei is also relatively small, this explana- tion is not adequate and it remains possible that there is differential regulation of cell cycle times in different locations on the neural tube. Studies of cell cycle times in the avian brain stem, such as those re- cently reported in the rat (Schultze et al., '74), may be of value for understanding the wide range of proliferative periods.
The non-overlapping temporal sequence of neuron proliferation for NM and NL is of interest for two reasons. First, this sequence is contrary to both the rostro- caudal and the ventro-dorsal gradients often observed in studies of neuron pro- liferation (Jacobson, '70). On the other hand, NM neurons are slightly larger than NL cells, which would agree with the large cell to small cell progression discussed by Altman ('70). Also NM appears to be a phylogenetically older nucleus, as it ap- pears in all reptile and amphibian brains
484 EDWIN W. RUBEL, DANIEL J. SMITH AND LAURIE C. MILLER
while NL seems to be missing in most, but not all, reptiles (Miller, '75). Second, in another case where a presynaptic cell group originates before its post-synaptic target group (locus coeruleus and cerebel- lar Purkinje cells), Lauder and Bloom ('74) speculate that there may be an inter- action in the ventricular zone whereby the early maturing cells influence the differ- entiation or migration of cells with which they will later form synaptic connections. On the other hand, there is little evidence to support this hypothesis and a number of cases have been found where proliferation occurs in the opposite sequence (Pierce, '74) or in a mixed sequence (Kahn, '74).
One rather common finding is that cell groups which will later be in synaptic con- tact pass through one another during the migratory phase of development (Angevine and Sidman, '61; Miale and Sidman, '61; Hanaway, '67; Cowan, '71; Langman et al., "71). This migratory pattern has led to the suggestion that cellular interactions during nerve cell migration may influence the pat- tern of synaptic connections which will later be manifest (Angevine and Sidman, '61 ). Indirect support for this hypothesis is provided by the observations that: ( a ) neuroblasts often maintain processes at- tached to both the internal and external limiting membranes (Berry and Rogers, '65; Langman et al., '71), and the perikarya of neogenic neurons may mi- grate through these protoplasmic processes (Morest, '70); (b) neogenic neurons can be influenced by their local milieu during migration (Weston and Butler, '66; Weston, '71); and ( c ) migratory pathways may follow the course of prospective fiber tracts (Hicks and D'Amato, '68). In the case of NM and NL, i t is possible that prolifera- tion occurs at the same place in the rhombic lip, leading to a first wave of cells which becomes NM and then to another wave which becomes NL. NL cells may then migrate through NM (Smith and Rubel, unpublished observations) and, at that time, establish a "blueprint" for later connections. Although this scheme is purely hypothetical, such cellular interac- tions might be investigated particularly well in NM and NL since: ( a ) it is known that there is a relatively punctate topo- graphic projection from NM to NL (Parks
and Rubel, '75); and ( b ) the two nuclei have non-overlapping times of origin which allows the marking of NL neuroblasts with- out marking any NM cells.
A final point regarding the present re- sults on cell proliferation concerns the sub- divisions of NM. We have previously sug- gested that the brain stem area which receives projections from the macula la- gena (n . magnocellularis, pars ventralis lateralis of Boord and Rasmussen, '63) be considered a separate nucleus, n. lagenaris (Rubel and Parks, '75). Supporting this suggestion, the present autoradiographic material shows that cells in the lagenar nucleus go through their final mitotic cycle around 96 hours. Thus the lagenar nucleus arises as a contemporary of NL (and of n . angularis), some 24 hours after NM neurons cease to incorporate labeled thy- midine.
Cell death Embryological cell death in the central
nervous system has received a great deal of attention in recent years. There are several excellent reviews of this literature (Ja- cobson, '70; Prestige, '70; Cowan, '73; Rogers and Cowan, '73), and Hamburger ('75) has recently summarized the avail- able and needed information regarding this phenomenon. The present discussion will, therefore, be limited to a few points directly related to our investigations of NM and NL.
We have not been able to locate any previous studies in which embryological cell death was studied in two cell groups with known synaptic relations. With re- gard to this relationship there are several interesting similarities and differences be- tween the nuclei. First, both NM and NL show maximum cell loss between 11 and 13 days of incubation. Thus, there is a considerable delay between proliferation and cell degeneration in both nuclei, and the delay serves to bring the two nuclei into ontogenetic synchrony.
Several factors have been implicated in control of the extent and timing of cell death. For example, it has been shown that cell death can be influenced by the "target cells" of a neuron population (Hamburger and Levi-Montalcini, '49; Hamburger, '58; Cowan and Wenger, '67; Cowan, '73). This

BRAIN STEM AUDITORY NUCLEI OF THE CHICKEN 485
factor, however, probably does not account for the timing of cell death in NM and NL since NM axons are seen in the vicinity of both the ipsilateral and contralateral lami- nar nuclei by 9 days of incubation. It is also known that embryological cell death can be influenced by the removal of affer- ents to a cell group (Levi-Montalcini, '49; Jacobson, '70), suggesting that an "appro- priate" amount or kind of synpatic inner- vation may influence normal cell death. The time of synaptogenesis in NM and NL has not been established. If synapse for- mation does coincide with the period of cell death there must be considerable delay between the arrival of afferent fibers to each nucleus and synapse formation (see also Rodriguez and Rebollo, '66; Knowlton, '67). Finally, another event which may coincide with the time of rapid cell loss in NM and NL is the onset of cochlear function (Vanzulli and Garcia-Austt, '63; Saunders et al., ' 73 ) . That is, electrical activity of afferent fibers may play a role in regulating cell death. This suggestion has, of course, been made by several au- thors (Levi-Montalcini, '49; Jacobson, '70); and Rogers and Cowan ('73) have cau- tioned that for further elucidation of the hypothetical relationships between cell death and the establishment of either affer- ent or efferent functional connections it is necessary to know exactly when these syn- aptic connections are made and when they become functional. In this regard the avian auditory system may prove extremely use- ful : the principal afferent and efferent con- nections of both NM and NL have been studied in detail (Boord, '69; Parks and Rubel, '75); it is possible to perform em- bryologic manipulations on the cochlea (Levi-Montalcini, '49); and synaptic func- tion at these levels can be studied neu- rophysiologically in the intact embryo (Konishi, '73; Rubel, unpublished observa- tions).
In contrast to similarities in early cell number and in the timing of cell loss is the large difference between NM and NL in the magnitude of cell death. The 84% nor- mal cell loss seen in NL ranks with the 75% loss in the mesencephalic nucleus of the trigeminal nerve (Rogers and Cowan, '73) as one of the most striking examples of this phenomenon reported. Yet the 18%
loss of NM neurons is relatively modest (Cowan, '73). We can offer no explanation for this radical difference in cell death in the two nuclei. Interestingly, NL assumes its characteristic monocellular lamina form during this period, possibly as a direct re- sult of cell loss. Another laminated cell group, the isthmo-optic nucleus (ION ), is also thought to acquire its characteristic cytoarchitecture through cell death (Cowan and Wenger, '68; Sohal and Narayanan, '74). The actual process by which the laminated cytoarchitecture is formed in either NL or ION is not known, but some light could be shed on this problem by carefully studying the distribution of pyk- notic cells in NL to determine their posi- tions relative to those which survive.
The rostro-caudal temporal gradient ob- served during cell loss in both nuclei and during lamina formation in NL may indi- cate that the nuclear regions which cor- respond to the proximal (or basal) portion of the basilar membrane differentiate prior to nuclear areas receiving projections from more distal (or apical) regions. Knowlton ('67) reports a corresponding proximo- distal differentiation gradient in the basilar membrane and hair cells of chicks, and a similar basilar-apical sequence has been observed in mammalian cochlear develop- ment (Foss and Flottorp, '74). Cells in NM and NL are tonotopically organized with high frequencies represented rostromedi- ally (Rubel and Parks, '75) and it is gen- erally accepted that progressively more basilar portions of the mammalian and avian inner ear respond to successively higher frequency stimuli (Von Bekksy, '60). Therefore it is somewhat paradoxical that behavioral and neurophysiological re- sponses can be first evoked by stimuli of relatively low frequency (i.e. under 1,000 Hz) in both birds (Konishi, '73; Saunders et al., '73) and mammals (Foss and Flot- terp, '74). Although Saunders et al. ('73) suggest that the initial unresponsiveness of chick embryos to stimuli greater than 1,000 Hz is due to failure of the fluid-filled middle ear to transmit higher frequencies, Foss and Flottorp ('74) argue that attenu- ation by fluid in the middle ear will be ap- proximately equal across the audible fre- quency range.
An alternative explanation of the appar-
486 EDWIN W. RUBEL, DANIEL J. SMITH AND LAURIE C. MILLER
ent discrepancy between the morphological development of the cochlea and the ontog- eny of neurophysiological and behavioral responsiveness is that a gradual ontogene- tic change in the transduction properties of the basilar membrane takes place dur- ing embryogenesis. In this case, the basal region would initially respond to only low frequencies and gradually become respon- sive to successively higher frequencies, while progressively apical parts of the cochlea would start coding low frequen- cies. This scheme would indicate that rela- tively low-frequency stimulation, which is probably the only acoustic range available to the avian or mammalian embryo (Gott- lieb, '71; Walker et al., '74), might influ- ence development throughout the auditory system. Careful studies of synaptogenesis in conjunction with ontogenetic studies of cellular response properties must be under- taken, therefore, in order to understand the discrepancy between morphological and physiological ontogeny of the audi- tory system, and for determining the influ- ence of acoustic stimulation upon its de- velopmen t.
Volumetric analysis Before discussing any conclusions drawn
from the volumetric data, a major prob- lem with these analyses warrants consid- eration. We did not determine the extent of tissue shrinkage resulting from the histo- logical processing. Thus, the values given are, at best, monotonically related to the true sizes, which will vary as a function of fixation and dehydration procedures.
Despite this caveat, some aspects of the volumetric analyses deserve additional at- tention. The major point of interest is the parallel nature of the developmental changes seen in NM and NL. That is, in each nucleus there was relatively little change in volume until the termination in cell death. Then, in the 4-day period from 17 days to hatching, each nucleus showed rapid growth. Although during the earlier period volumetric increases may have been masked to some extent by cell death, the finding that the volumes of the neuropil as well as the cellular region of NL showed accelerated growth during the 17-21 day period suggests that the nuclei have en- tered upon a different phase of differentia-
tion. Synchronous growth of functionally- related cell groups has also been described in the visual system of the golden hamster (Ptacek and Fagan-Duben, '74), where cell density decreases and cell size in- creases in both the visual cortex and supe- rior colliculus in a parallel fashion.
In addition to the temporal correlation between NM and NL growth, several con- vergent factors suggest that functional ac- tivity in the auditory pathways may play a regulative or stimulative role in this late phase of cellular and neuropil growth. For example, in NL the neuropil regions in- crease even more dramatically than the area occupied by cell bodies, as indicated by the ratio of these two measures (fig. 10). It is not known at present whether the ac- celerated neuropil growth is due primarily to axonal or dendritic expansion, but the fact that i t is delayed at least eight days after the arrival of afferent axons indi- cates that it is not merely the presence of afferent fibers which is responsible for this growth. Thus, if growth of these neuropil regions is totally under intrinsic control, the temporal correlation of the growth of NL with that of NM is not explained, and if this NL growth is regulated by the mere presence of axons from NM, the temporal lag is not understood.
Behavioral and ultrastructural data also indicate that functional activity in the aud- itory pathways may be involved in the growth of NM and NL. Although Saun- ders et al. ('73) have described brain stem evoked potential responses to intense sound beginning around embryonic day 12 in the chicken, we have not been able to observe behavioral responses to audi- tory stimulation until day 15 (Jackson and Rubel, unpublished observations). In the mammalian visual system similar growth phenomena have repeatedly been shown to be dependent upon the integrity of visual stimulation (see Globus, '75, for review). Thus, the late phase of nuclear growth in the avian auditory system may be another example of the regulative control which afferent activity can exert on neuronal on- togeny.
CONCLUSION
The present report has dealt with some aspects of normal development in n. mag- nocellularis and n. laminaris of the chicken
BRAIN STEM AUDITORY NUCLEI OF THE CHICKEN 487
embryo. These data have been discussed principally in terms of possible roles of cellular interactions in regulating the dif- ferentiation of neurons and neuronal net- works. The rationale behind this emphasis has been that this preparation possesses a number of highly desirable characteristics for future research on the mechanisms regulating neural development. Among the qualities demonstrated in previous reports are :
1. Relatively homogeneous cell types and cytoarchitecture within both NM and NL (Boord and Rasmussen, '63; Boord, '68 ).
2. Unambiguous nuclear boundaries, definable physiologically and anatomically (Rubel and Parks, '75).
3. A very consistent and quantifiable tonotopic organization in NM and NL (Rubel and Parks, '75).
A topographic projection from the cochlea onto the cell bodies of NM neu- rons (Boord and Rasmussen, '63) and a spatially segregated bilateral projection from NM and NL neurons (Parks and Rubel, '75). This allows a relatively precise specification of the source of input to each membrane surf ace.
5. Relatively large changes in fre- quency-coding behavior that extend into the post-hatching period (Rubel and Rosen- thal, '75).
Dramatic changes in NL dendrite morphology as a function of denervation, indicating a highly specific interaction be- tween presynaptic and postsynaptic ele- ments (Benes et al., '75).
In the present report the following char- acteristics have been added :
7. The neurons of NM and NL go through their h a 1 phase of DNA synthesis over a restricted time period and NL cells can be labeled independently of NM neu- rons.
8. The period of cell loss does not over- lap with proliferation times.
9. Cell loss occurs over a rather short time period, has a definite spatial gradient, and, in the case of NL, is quite extensive.
10. Lamination of NL is temporally correlated with cell loss.
11. The total volumes of NM and NL increase rapidly after the period of cell
4.
6.
loss, as does the ratio of neuropil to total perikaryon areas in NL.
These factors, in conjunction with the accessibility of the chick embryo for sur- gical and pharmacological manipulations, for neurophysiological studies, and for control of the external sound environment suggest that the brain stem auditory path- ways of the avian embryo will be an ex- cellent preparation for investigations of cellular interactions in the developing ner- vous system.
ACKNOWLEDGMENTS
We thank Mrs. Winnefred Craig for her valuable assistance in histological process- ing of the tissue; Roy Rada and Philip Dibner for helping with the initial investi- gations leading up to this report; J. R. H. Jackson and T. N. Parks for critically reading earlier drafts of the manuscript. Special thanks are due to Mr. Raoul Garcia y Vega for helping to process and analyze the autoradiographic tissue. Supported by grant #GB 31934 from the National Sci- ence Foundation.
LITERATURE CITED Altman, J. 1970 Postnatal neurogenesis and
the problem of neural plasticity. In: Develop- mental Neurobiology. W. A. Himwich, ed. Thomas, Springfield, pp. 197-237.
Altman, J., and G. D. Das 1965 Autoradio- graphic and histological evidence of postnatal hippocampal neurogenesis in rats. J. Comp. Neur., 124: 319-336.
Angevine, J. B., Jr., and R. L. Sidman 1961 Autoradiographic study of cell migration dur- ing histogenesis of cerebral cortex in the mouse. Nature, 192: 766-768.
Ariens-Kappers, C. V., G. C. Huber and E. C. Crosby 1936 The Comparative Anatomy of the Nervous System of Vertebrates Including Man. MacMillan Co., New York.
Bekesy, G. V. 1960 Experiments i n Hearing. McGraw-Hill, New York.
Benes, F. M., T. N. Parks and E. W. Rubel 1975 Dendritic atrophy following deafferenta- tion in nucleus laminaris of the chicken: An E. M. morphometric analysis. Report presented at the 5th Annual Meeting of the Society for Neurosciences. Neuroscience Abstracts, I ; 669.
Berry, M., and A. W. Rogers 1965 The migra- tion of neuroblasts in the developing cerebral cortex. J. Anat. (London), 99: 691-709.
Boord, R. L. 1969 The anatomy of the avian auditory system. Ann. N. Y. Acad. Sci., 167: 186-198.
Boord, R. L., and G. L. Rasmussen 1963 Pro- jection of the cochlear and lagenar nerves on the cochlear nuclei of the pigeon. J. Comp. Neur., 120: 463475.
488 EDWIN W. RUBEL, DANIEL J. SMITH AND LAURIE C. MILLER
Cowan, W. M. 1971 Studies on the develop- ment of the avian visual system. In: Cellular Aspects of Neural Growth and Differentiation. D. C. Pease, ed. University of California Press, Los Angeles, pp. 171-222.
1973 Neuronal death as a regulative mechanism in the control of cell number in the nervous system. In: Development and Aging in the Nervous System. M. Rockstein, ed. Aca- demic Press, New York, pp. 19-41.
Cowan, W. M., and E. Wenger 1967 Cell loss in the trochlear nucleus of the chick during normal development and after radical extirpa- tion of the optic vesicle. J. Exp. Zool., 164: 267-280.
Foss, I., and G. Flottorp 1974 A comparative study of the development of hearing and vision in various species commonly used in experi- ments. Acta Otolaryng., 77: 202-214.
Fujita, S. 1964 Analysis of neuron differentia- tion in the central nervous system by tritiated thymidine autoradiography. J. Camp. Neur., 122: 311-328.
Globus, A. 1975 Brain morphology as a func- tion of presynaptic morphology and activity. In: The Developmental Neuropsychology of Sensory Deprivation. A. H. Riesen, ed. Aca- demic Press, New York.
Gottlieb, G. 1971 Ontogenesis of sensory func- tion i n birds and mammals. In: Biopsychology of Development. E. Tobach et al., eds. Academic Press, New York.
Hamburger, V. 1958 Regression versus periph- eral control of differentiation in motor hypo- plasia. Amer. J. Anat., 102: 365-410.
Cell death in the development of the lateral motor column of the chick embryo. J. Camp. Neur., 160: 535-546.
Hamburger, V., and H. L. Hamilton 1951 A series of normal stages in the development of the chick embryo. J. Morph., 88: 49-92.
Hamburger, V., and R. Levi-Montalcini 1949 Proliferation, differentiation and degeneration in the spinal ganglia of the chick embryo under normal and experimental conditions. J. Exp.
Hanaway, J. 1967 Formation and differentia- tion of the external granule layer of the chick cerebellum. J. Camp. Neur., 131: 1-14.
Hicks, S. P., and C. J. DAmato 1968 Cell mi- gration to the isocortex in the rat. Anat. Rec., 160: 619-634.
Jacobson, M. 1970 Developmental Neurobiol- ogy. Holt, Rinehart and Winston, New York.
Kahn, A. J. 1974 An autoradiographic analysis of the time of appearance of neurons in the developing chick neural retina. Devel. Biol., 38: 30-40.
Knowlton, V. Y. 1967 Correlation of the devel- opment of membranous and bony labyrinths, acoustic ganglion, nerves, and brain centers of the chick embryo. J. Morph., 121: 179-208.
Konigsmark, B. W. 1970 Methods for the count- ing of neurons. In: Contemporary Research Methods in Neuroanatomy. W. J. H. Nauta and S. 0. E. Ebbesson, eds. Springer-Verlag, New York, pp. 315-340.
1975
ZOO^., 11 1 : 457-501.
Konishi, M. 1973 Development of auditory neu- ronal responses in avian embryos. Proc. Nat. Acad. Sci., 70: 1795-1798.
Langman, J., M. Shimada and C. Haden 1971 Formation and migration of neuroblasts. In: Cellular Aspects of Neural Growth and Differ- entiation. D. C. Pease, ed. University of Cali- fornia Press, Los Angeles, pp. 33-59.
Lauder, J. M., and F. E. Bloom 1974 Ontog- eny of monoamine neurons in the locus coeru- leus, raphe nuclei and substantia nigra of the rat. I. Cell differentiation. J. Camp. Neur., 155: 469482.
Levi-Montalcini, R. 1949 The development of the acoustico-vestibular centers in the chick embryo in the absence of the afferent root fibers and of descending fiber tracts. J. Camp. Neur., 91: 209-242.
MiaIe, I. L., and R. L. Sidman 1961 A n auto- radiographic analysis of histogenesis in the rat cerebellum. Exp. Neural., 4: 277-296.
Miller, M. R. 1975 The cochlear nuclei of liz- ards. J. Comp. Neur., 159: 375-406.
Morest, D. K. 1970 A study of neurogenesis in the forebrain of opossum pouch young. Z. Anat. Entwick1.-Gesch., 130: 265-305.
Oppenheim, R. W., and H. L. Levin 1975 Short- term changes in incubation temperature: Be- havioral and physiological effects in the chick embryo from 6 to 20 days. Devel. Psychobiol.,
Oppenheim, R. W., H. Levin and M. S. Harth 1972 An investigation of various egg-opening techniques for use in avian behavioral em- bryology. Devel. Psychobiol., 6: 53-68.
Parks, T. N., and E. W. Rubel 1975 Organiza- tion and development of the brain stem audi- tory nuclei of the chicken: Organization of pro- jections from n. magnocellularis to n. lami- naris. J. Comp. Neur., 164: 435-448.
Pierce, E. T. 1973 Time of origin of neurons in the brain stem of the mouse. In: Prog. Brain Res., 40: D. H. Ford, ed. Elsevier, New York, pp. 53-68.
Prestige, M. C. 1970 Differentiation, degenera- tion, and the role of the perphery: Quantita- tive considerations. In: The Neurosciences: Second Study Program, F. 0. Schmitt, ed. Rockefeller University Press, New York, pp. 53-61.
Ptacek, J. M., and L. Fagan-Dubin 1974 De- velopmental changes in neuron size and dens- ity in visual cortex and superior colliculus of the postnatal golden hamster. J. Camp. Neur., 158: 237-242.
Ramon y Cajal, S. 1908 Les ganglions termi- naux du nerf acoustique des oiseaux. Trab. Inst. Cajal Invest. Biol., 6: 195-225.
Rebollo, M. A, , and M. Casas 1964 Desarrollo del organo de corti y de la via auditiva en el embrion de pollo. I. Histogenesis del Brgano de Corti. An. Fac. Med. Montevideo, 49: 35-41.
Rebollo, M. A., and M. M. Rodriguez 1964 Desarrollo del organo de corti y de la via audi- tiva en el embrion de pollo. 11. Histogenesis del Ganglio de Corti. An. Fac. Med. Montevideo, 49: 42-46.
8: 103-115.
BRAIN STEM AUDITORY NUCLEI OF THE CHICKEN 489
Rodriguez, M. M., and M. A. Rebollo 1966 Desarrollo del organo de corti y de la via auditiva en el embrion de pollo. 111. Nervio cochlear. An. Fac. Med. Montevideo, 51: 40-44.
Rogers, A. W. 1973 Techniques of Autoradiog- raphy. Elsevier, New York.
Rogers, L. A., and W. M. Cowan 1973 The de- velopment of the mesencephalic nucleus of the trigeminal nerve in the chick. J. Comp. Neur., 147: 291-320.
Rubel, E. W., and T. N. Parks 1975 Organiza- tion and development of the brain stem audi- tory nuclei of the chicken: Tonotopic organiza- tion of n. magnocellularis and n. laminaris. J. Comp. Neur., 164: 411-434.
Rubel, E. W., and M. H. Rosenthal 1975 The ontogeny of auditory frequency generalization in the chicken. J. Exp. Psychol.: Animal Behav. Proc., I : 287-297.
Saunders, J. C., R. B. Coles and G. R. Gates 1973 The development of auditory evoked responses in the cochlea and cochlear nuclei of the chick. Brain Res., 63: 59-74.
Schultze, B., B. Nowak and W. Maurer 1974 Cycle times of the neural epithelial cells of various types of neuron in the rat. A n auto- radiographic study. J. Comp. Neur., 158: 207- 218.
Sidman, R. L. 1970 Autoradiographic methods and principles for study of the nervous system with thymidine-Hs. Contemporary Research Methods in Neuroanatomy. W. J. H. Nauta and S . 0. E. Ebbesson, eds. Springer-Verlag, New York, pp. 252-274.
Sohal, G. S., and C. H. Narayanan 1974 The development of the isthmo-optic nucleus in the duck (Anas platyrhynchos). I. Changes in cell number and cell size during normal develop- ment. Brain Res., 77: 243-255.
Vanzulli, A,, and E. Garcia-Austt 1963 Devel- opment of cochlear microphonic potentials in the chick embryo. Acta Neurol. Lat.-Amer., 9: 19-23.
Walker, D., 3 . Grimwade and C. Wood 1971 Intrauterine noise: A component of the fetal environment. Amer. J. Obstet. Gynec., 109: 91-95.
Weston, J . A. 1971 Neural crest cell migration and differentiation. In: Cellular Aspects of Neu- ral Growth and Differentiation. D. C. Pease, ed. University of California Press, Los Angeles, pp. 1-22.
Weston, J. A,, and S. L. Butler 1966 Temporal factors affecting localization of neural crest cells in the chicken embryo. Devel. Biol., 14: 246-266.


![Road Traffic Noise and its Effect on Brain Stem Auditory ... · [2]. Among all objective methods of hearing evaluation, brainstem auditory evoked potential is considered the most](https://img.pdfslide.us/doc/110x75/5f5d38a1dfd4a155386e996d/road-traffic-noise-and-its-effect-on-brain-stem-auditory-2-among-all-objective.jpg)