Embed Size (px)
Citation preview
Med. J. Cairo Univ., Vol. 62, No.1, March (Suppi.): 257-272, 1994.
Auditory Brain Stem Response in Noise Induced Permanent Hearing Loss
_ AHMED TAHA, M.D.; SHERIFSHAABAN, M.D.;
HA2334 ABOUL OYOUN, M.D.;
MOHAMMED M. MASHALY, M.D. and SHERIF M. ADLY, M.Sc.
The Ear, Nose and Throat De&r&en& Faculty of
Medicine,Tairo University
Abstract
Noise exposure usually leads to hearing loss, most severe in the range
of 4 to 8 KHz, that seems highly probable due to cochlear lesion which
could be explored by the measruement of auditory brain-stem response
(ABR.). There is general agreement that the sensory-neural hearing loss is
due to the degeneration of the outer and inner hair cells. This study included
twenty male individuals, chosen from textile factories, age ranged between
25 and 45 years duration of exposure to noise is from five‘years up to thirty
years. In addition ten normal subjects were included in the study as a con-
trol group. Both the study and control groups were submitted to full history,
full ear, nose and throat examination and audiological examination (pure
tone and speech audiometry- emmittancemetry and evoked response audiom-
etry).
The objectives of the stuL3, are :
1. To prove the existence of tbe cochlear affection in noise induced hearing
loss by means of ABR.
2. to study the effect of noise exposure on speech discrimination ability.
3. To study the latency intensity function curve in the noise induced senso-
ry-neural hearing loss as compared to a normal subject.
4. To study the effect of the period of noise exposure on the hearing thres-
hold level.
257
258 Ahmed Taha, et al.
Introduction
SUBJECTIVELY, noise is an unpleas-
ant sound if compared to speech and music.
But objectively, noise is a complex sound
having little or no periodicity, the wave-
form not being repeated at any calculably
regular interval or time, such sound when
it is of moderate or high intensity and long
standing duration, will produce that un-
pleasant sensation to be called noise. Noise
is formed of mixture of waves caused by a
very large number of pure tones of diffeent
frequencies, not harmonically related [l].
Chronic noise-induced auditory damage
is characterized by sensory-neural hearing
loss affecting the high frequencies. There is general agreement that it is probably due to a degeneration of the outer and inner
hair cells [2, 3, 41.
The retro-cochlear involvement ob-
served by other authors is still uncertain
P, 6, 71.
The effect of noise on hearing is a ma-
jor public health and environmental prob-
lem in our society. Noise is reported to be the source of many undesirable effects on mental and physical health [S]. The only well established effect of noise on health is
that of noise-induced hearing loss [9].
Noise is classified as steady or non
steady [lo]. The steady sounds are those
which are continuous and remain relatively constant in intensity for a long period of
.i time, and the non steady sounds are further differentiated into fluctuating, intermittent,
and impulsive sounds (11).
The physical parameters of noise de-
pend on the noise spectrum, exposure in-
tensity, exposure duration and time vary-
ing noise levels. [12] Noise damage is in
!he 4 KHz region (actually 3 to 6 Khz). It
is felt to center around processes in the in-
ner ear rather than the more peripheral por-
tions of the ear, e.g. the region of the organ
of corti about 8 to 10 mm from the basal
end (which corresponds to the 4 KHz re-
gion of the audiogram). [13] The pillar
cells in the basal portion of the organ of
corti are rather sensitive to noise exposure
at least as sensitive as the hair cells. [14]
Intense low frequency stimuli have been
observed to cause damage in the base of
the cochlea in some cases commensurate
with that occurring in the region related to
the frequency of the exposure frequency
[15,16]. The intense sound exposure can
alter the oxygen tension in the cochlea, so
implying some sound-induced changes in
the cochlear blood supply [17] . The ox-
ygen is very important to metabolic pro-
cesses, such as oxidative phosphorylation,
the process by which cells derive their en-
ergy. If he oxygen supply is reduced due
to abnormal constriction and/or atrophy of
blood vessels, normal metabolic processes
would be expected to break down [18].
But still this vascular theory is debatable,
as ischemia first damages nerve fibres and
inner hair cells, in contrast to noise-which
injures the outer hair cells initially. The
otherwise normal process of degeneration
in the cochlear vascular system which
occurs throughout life may be accelerated
Aubitory Brain Stem Response in Noise Deafness 259
by noise exposure and other adverse condi-
tion [3].
In fact, the primary effect of noise is
on the hair ceils with the observed changes
in the blood vessels of the cochlea being
secondary [19]. With very high levels of
exposure, typically more than 130 dB
sound pressure level (SPL) for brief dura-
tion, the first effects on the structures of
the hearing organ are likely to be mechani-
cal in nature [20].
The early effect of noise seems to take
place at the co&ear level, while the degen-
eration of central auditory connections can
become evident later, so later there will be
abundant evidence of neuronal cell loss
and atrophy of the spiral ganglion, in the
axonal endings of the ascending cochlear
nerve fibres, in the ventral cochlear nucie-
us, in the adjacent regions of the antroven-
tral and dorsal co&ear ones, in the superi-
or olivary complex, lateral leminscal nuclei
and ventral nucleus of the inferior collicu-
lus [21].
It is also suggested that the location of
central degeneration following partial de-
struction of the organ of corti corresponds
to the tonotopic organization of the co-
chiear nerve. In summary, the central le-
sions seen to follow and reflect peripheral
changes [22].
Histopathological changes in human
cochlea exposed to noise were studied from
a collection of temporal bones obtained at
autopsy. These changes were correlated
with available audiograms and occupation-
al history recorded of the same subject. The evaluation of cochlear lesions was
based on the study of cytocochleograms (it
is a curve indicating the percentages of hair
ceils present), in terms of an “ideal pat- tern” of three outer rows and a single inner
row, this is done millimeter by millimeter throughout the entire length of the basilar membrane [3].
It is known that the different kinds of
noise can lead to different damage pat-
terns, which may be caused by different
kinds of mechanical events in the cochlea
even at correspondingly equivalent sound
levels [23, 24, 251. The temporal char-
acteristics, the critical intensity and espe-
cially the individual susceptibility to dam-
age can influence the severity of the noise-
induced trauma [26&
Bohne [271 traced the progression of degeneration of the organ of corti, includ-
ing some of the fine structural changes fol- lowing traumatic noise exposure:
1. Within theftrst hour after exposure :
The only signs of damage are found as a slight swelling and displacement of outer hair cells about 4 mm from the basal end of
the hearing organ. There are detectable changes in the cellular contents particularly
increased infoldings of endoplasmic reticu- lum, few outer hair cells are actually miss- ing, and all inner hair cells are present.
2. One and half hours after exposure :
. .
The outer hair cells show increased swelling, furhter alterations in the endo- piasmic reticulum and fusing of the ste-
reocilia.
260 Ahmed Taha, et al.
3. Two hours post exposure :
Outer hair cells over about a 1 mm
segment of the basilar membrane are lost
apparently because of rupturing from con-
tinued swelling of the cell bodies, small
holes may be seen in the reticular lamina,
the surface of the organ of corti, in places
once occupied by hair cells.
4, Beyond two hours :
Both supporting and inner hair cells
begin to show signs of damage. And by
14 days essentially, 1 mm of the organ of
corti is missing, the final stage of perma-
nent damage appears to take about 2
months to develop [28].
Material and Methods
This study was conducted in Hearing
and Speech institute at Embaba. The
study included 20 male individuals (20
ears) chosen from textile factories, age
ranged between 25 to 45 years, duration of
exposure to noise was for more than 5
years, 8 hours / day, 6 days per week.
They were not exposed to head trauma, or
ototoxic drugs. In addition 10 normal
subjects (10 ears) were included in the
study as a control group, they had no his-
tory of ear diseases for at least 2 months
before examination, and no history of up-
per respiratory tract infection at time of
examination.
Both groups (study and control) were
subjected to full E. N. T. examination,
audiometric, tympanometric and examina-
tion by the evoked response audiometry
(ERA).
Pure tone audiometry was performed
in sound treated room, the audiometer was
Madsen Model OB 822. The air conduc-
tion threshold for frequencies 500 to 4000
Hz reported
Typmanometry was performed using
immittancemeter (Amplaid Model 720).
Immittancemetry, tympanometry and
acoustic reflex thresholds were estimated.
Evoked response audiometry (ERA)
was performed using Madsen Model
2250, and it was done with these parame-
ters:
1. Stimuluspurumeters :
a - Type of the stimulus: Click rarifac-
tion of 0.25 msec duration.
b - Intensity : 90, 70, 50 and 30 dB
C
hearing level (HL) which is deliv-
ered through headphone TDH 39.
Repetition rate of 20 click / sec-
ond.
d - Num&r of sweeps is 1000 sweeps.
2. Recordingparameters :
a - Pass and filter 150 - 1500 Hz.
b - Sweep time : 10 msec.
As regards electrode location in the
ABR, three electrodes were used, two of
which were connected to the preamplifier
inputs with the other electrode serving as
Aubitory Brain Stem Response in Noise Deafness 261
ground [29]. The active (positive) elec-
trode was placed on the vertex, where a
small area of skin was shaved prior to ver-
tex placement, and the reference (negative)
electrode was adherent to an assumed inac-
tive (neural) site which was the ipsilateral
earlobe with the contralateral counterpart
earlobe reserved for the ground electrode.
The electrode site was cleaned with
acetone solution to remove dirt and natural
oils, and the electrode was affixed to the
patient with conductive electrode gel as re-
ported by Newton and Barratt (301.
Results
This study included 20 subjects (20
ears), all were males. Age ranged between
25 to 50 years, with a mean of 34 years.
The mean duration of noise exposure was
20 * 3.2 years, with a range between 7 to
30 years. Results of the present study were
interpreted in the following manner :
1. Estimation of the mean and standard de-
viation (S.D.) of different parameters of
pure tone audiometry (PTA), tympa-
nometry and auditory brainstem evoked
response (ABR), as obtained from
tables (1, 2,3 and 4).
2.. Comparing the mean of the control
group and study group as regard statis-
tical significance by using “t” test
(tables 1,2,3 and 4).
3.. Correlation between period of noise ex-
posure and hearing loss (figure 1).
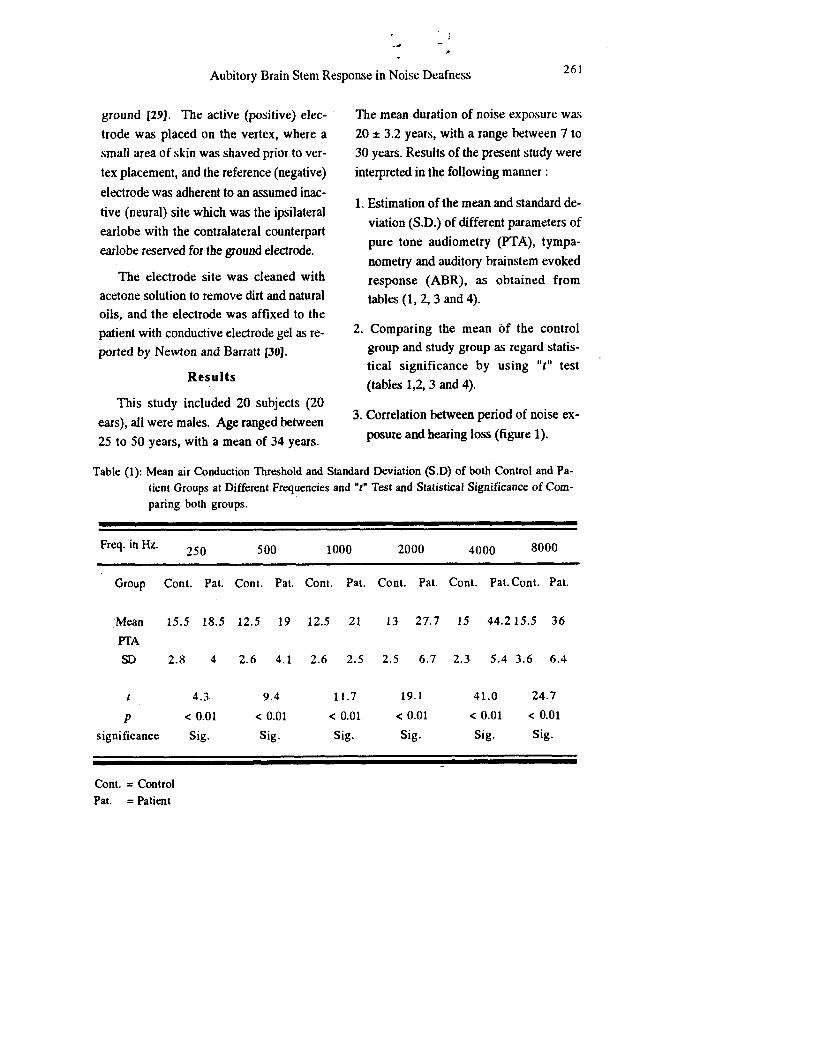
Table (1): Mean air Conduction Threshold and Standard Deviation (S.D) of both Control and Pa-
tient Groups at Different Frequencies and “t” Test and Statistical Significance of Com-
paring both groups.
Freq. in Hz. 250 500 1000 2000 4000 8000
Group Cont. Pat. Cont. Pat. Cont. Pat. Cont. Pal. Cont. Pal. Cont. Pat.
‘Mean 15.5 18.5 12.5 19 12.5 21 13 27.7 15 44.2 15.5 36
PI-A
SD 2.8 4 2.6 4.1 2.6 2.5 2.5 6.7 2.3 5.4 3.6 6.4
I 4.3 9.4 11.7 19.1 41.0 24.7
P < 0.01 < 0.01 < 0.01 < 0.01 < 0.01 < 0.01
significance Sig. Sig. Sig. Sig. Sig. Sig.
Cont. = Control
Pat. = Pati’ent
262 Ahmed Taha, et al.
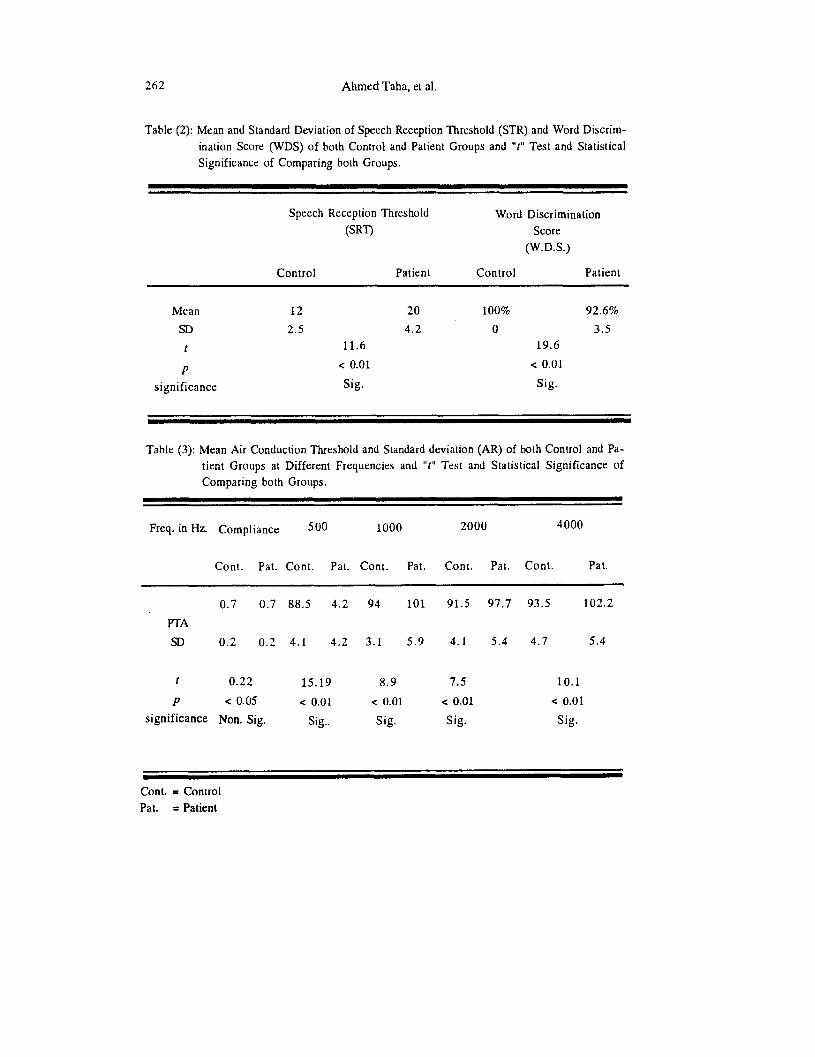
Table (2): Mean and Standard Deviation of Speech Reception Threshold (STR) and Word Discrim-
ination Score (WDS) of both Control and Patient Groups and “t” Test and Statistical
Significance of Comparing both Groups.
Speech Reception Threshold
(SRT)
Word Discrimination
Score
(W.D.S.)
Control Patient Control Patient
Mean 12 20 100% 92.6%
SD 2.5 4.2 0 3.5
t 11.6 19.6
P < 0.01 < 0.01
significance Sig. Sig.
Table (3): Mean Air Conduction Threshold and Standard deviation (AR) of both Control and Pa-
tient Groups at Different Frequencies and “t” Test and Statistical Significance of
Comparing both Groups.
Freq. in Hz. Compliance 500 1000 2000 4000
Cont. Pat. Cont. Pat. Cont. Pat. Cont. Pat. Cont. Pat.
0.7 0.7 88.5 4.2 94 101 91.5 97.7 93.5 102.2
PTA
SD 0.2 0.2 4.1 4.2 3.1 5.9 4.1 5.4 4.7 5.4
t 0.22 15.19 8.9 7.5 10.1
P < 0.05 < 0.01 < 0.01 < 0.01 < 0.01
significance Non. Sig. Sig.. Sig. Sig. Sig.
Cont. = Control
Pal. = Patient
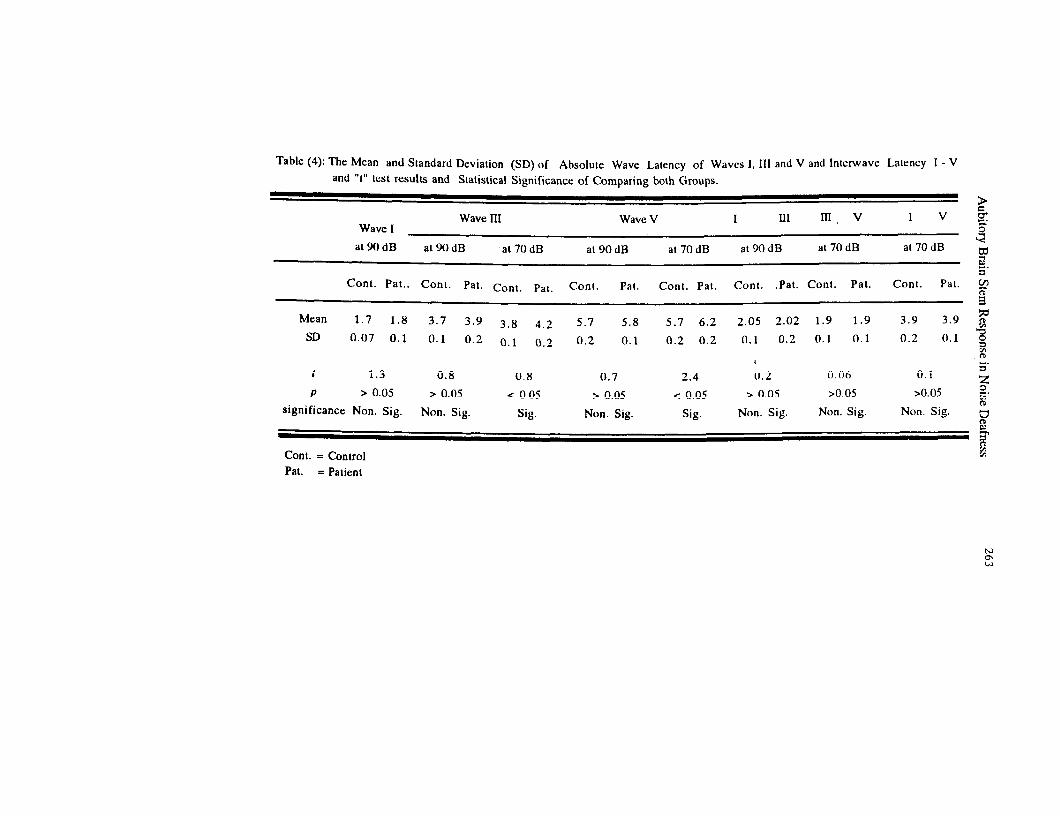
Table (4): The Mean and Standard Deviation (SD) of Absolute Wave Latency of Waves I, III and V and Intcrwve Latency 1 - V and “f’ lest results and Statistical Significance of Comparing both Groups.
9
Wave III Wave V I In II,v I V ?$ Wave I
at9OdB <
al9OdB at 70 dB at 90 dB at 70 dB at9OdB at 70 dB at 70 dB F 6’
Cont. Pat.. Cont. Pal. Cont. Pat. Cont. Pal. Cont. Pal. Conl. .Pat. Conl. Pat. Cont. Pal. $?
5
Mean 1.7 1.8 3.7 3.9 3 8 4.2 5.7 5.8 5.7 6.2 2.05 2.02 1.9 1.9 3.9 3.9 F SD 0.07 0.1 0.1 0.2 0.1 0.2 0.2 0.1 0.2 0.2 0.1 0.2 0.1 0.1 0.2 0.1 2
E I I 1.3
6’ 0.8 0.8 0.7 2.4 0.2 0.06 0.1
5 P > 0.05 > 0.05 < 0.05 > 0.05 < 0.05 > 0.05 >0.05 >0.05 -.
significance Non. Sig. ?z
Non. Sig. Sig. Non. Sig. Sig. Non. Sig. Non. Sig. Non. Sig. u t-t & 2
Cont. = Control M
Pat. = Patient
264 Ahmed Taha, et al.
0 30 so m 90 da
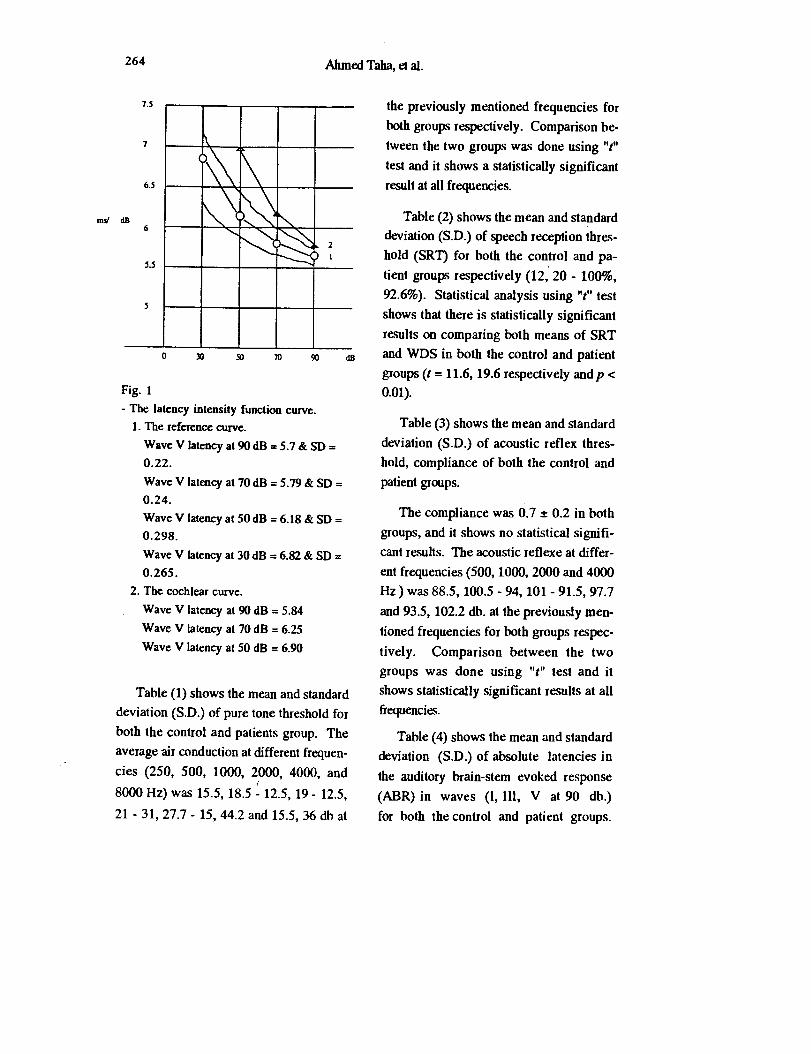
Fig. 1
- The latency intensity function curve.
1. The reference curve.
Wave V latency at 90 dB = 5.7 & SD =
0.22.
Wave V latency at 70 dB = 5.79 & SD =
0.24.
Wave V latency at 50 dB = 6.18 & SD =
0.298.
Wave V latency at 30 dB = 6.82 & SD =
0.265.
2. The cochlcar curve.
Wave V latency at 90 dB = 5.84
Wave V latency at 70 dB = 6.25
Wave V latency at 50 dB = 6.90
Table (1) shows the mean and standard
deviation (SD.) of pure tone threshold for
both the control and patients group. The
average air conduction at different frequen-
cies (250, 500, 1000, 2000, 4000, and
8000 Hz) was 15.5, 18.5 f 12.5, 19 - 12.5,
21 - 31,27.7 - 15, 44.2 and 15.5, 36 db at
the previously mentioned frequencies for
both groups respectively. Comparison be-
tween the two groups was done using “t”
test and it shows a statistically significant
result at all frequencies.
Table (2) shows the mean and standard
deviation (SD.) of speech reception thres-
hold (SRT) for both the control and pa-
tient groups respectively (12,‘20 - lOO%,
92.6%). Statistical analysis using “t” test
shows that there is statistically significant
results on comparing both means of SRT
and WDS in both the control and patient
groups (t = 11.6, 19.6 respectively andp c
0.01).
Table (3) shows the mean and standard
deviation (S.D.) of acoustic reflex thres-
hold, compliance of both the control and
patient groups.
The compliance was 0.7 A 0.2 in both
groups, and it shows no statistical signifi-
cant results. The acoustic reflexe at differ-
ent frequencies (500,1000,2000 and 4000
Hz) was 88.5, 100.5 - 94, 101 - 91.5,97.7
and 93.5, 102.2 db. at the previously men-
tioned frequencies for both groups respec-
tively. Comparison between the two
groups was done using “t” test and it
shows statistically significant results at all
tkequencies.
Table (4) shows the mean and standard
deviation (S.D.) of absolute latencies in
the auditory brain-stem evoked response
(ABR) in waves (1, 111, V at 90 db.)
for both the control and patient groups.
Aubitory Brain Stem Response in Noise Deafness 265
It was 1.7, 1.8 - 3.7, 3.9 and 5.7, 5.8 milli- control and patient groups, (table 4)
second (ms) for both groups respectively. shows that it was 3.8, 4.2 millisecond
There was no statistically significant re- (ms) for wave III at 70 db for the control ,
suits by using “t” test on comparing both and patient groups and this parameter was
groups. statistically significant.
As regards the absolute latencies of As regards absolute latencies of wave V
wave III and wave V, test at 70 db for both at 70 db. it was 5.7, 6.2 millisecond (ms)
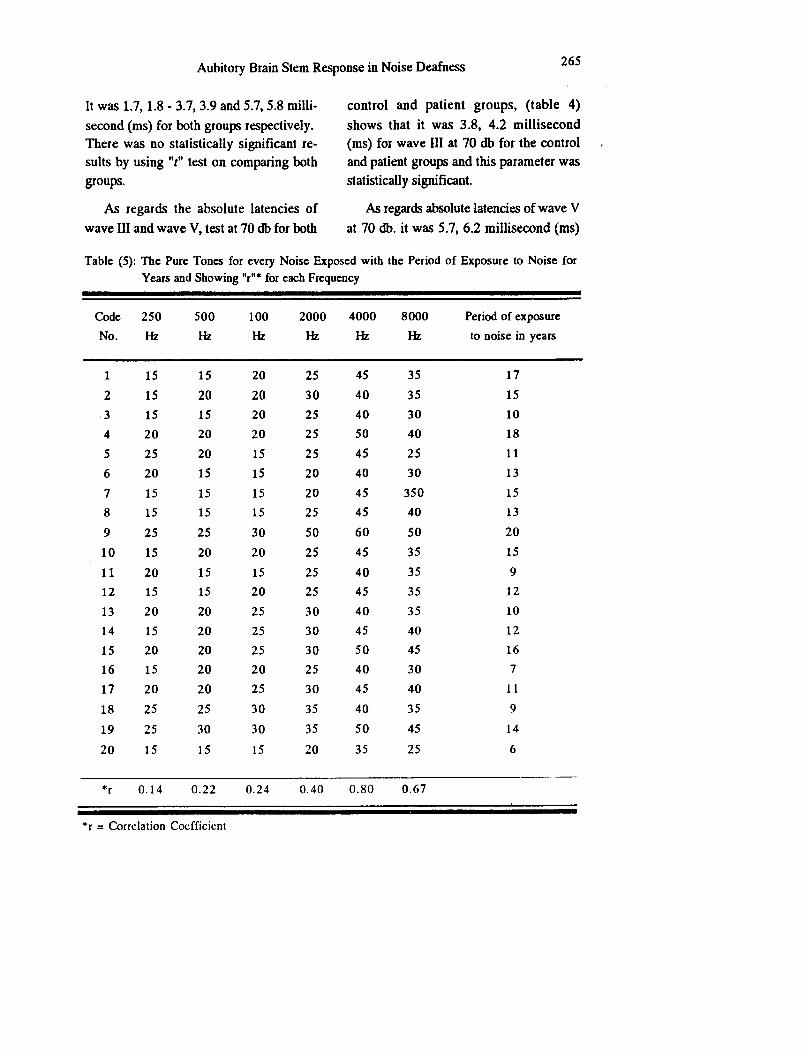
Table (5): The Pure Tones for every Noise Exposed with the Period of Exposure to Noise for
Years and Showing “r”* for each Frequency
Code 250 500 100 2000 4000 8000 Period of exposure
No. I-k M M M Hz M to noise in years
1 15 15 20 25 45 35 17
2 15 20 20 30 40 35 15
.3 15 15 20 25 40 30 10
4 20 20 20 25 50 40 18
5 25 20 15 25 45 25 11
6 20 15 15 20 40 30 13
7 15 15 15 20 45 350 15
8 15 15 15 25 45 40 13
9 25 25 30 50 60 50 20
10 15 20 20 25 45 35 15
11 20 15 15 25 40 35 9
12 15 15 20 25 45 35 12
13 20 20 25 30 40 35 10
14 15 20 25 30 45 40 12
15 20 20 25 30 50 45 16
16 15 20 20 25 40 30 7
17 20 20 25 30 45 40 I1
18 25 25 30 35 40 35 9
19 25 30 30 35 50 45 14
20 15 15 15 20 35 25 6
*r 0.14 0.22 0.24 0.40 0.80 0.67
*I = Correlation Coefficient
266 Ahmed Taha, et al.
for both control and patient groups and it
was also statisticaly significant.
Table (4) shows the mean and standard
deviation (S.D.) of the interwave interval
(I, III, III - V and I-V) at 90 db for both
control and patient groups, and it was 2.0,
2.0 - 1.9, 1.9 and 3.9,3.9 millisecond (ms)
for both group respectively, and it was sta-
tistically insignificant.
Table (5) shows the hearing threshold
at different frequencies (250 to 8000 Hz)
with the period of exposure worker. The
corielation coefficient (r) is at 250 Hz =
0.14, at 500 Hz = 0.22, at 1000 Hz = 0.24,
at 2000 Hz = 0.40, at 4000 Hz = 0.80 and
at 8000 Hz = 0.67.
Figure (1) shows the latency intensity
curve, for both the control and patient
groups. At high intensities the two curves,
control (reference) and patient curves are
similar approximately, and as the intensity
decreases, there was diverging of the study
subjects curve from the reference curve.
Discussion
This work aimed to study the effect of
noise exposure on speech discrimination
ability, latency intensity function curve in
the noise-induced sensory-neural hearing
loss and to study the effect of the period
of noise exposure on the hearing threshold
level. The study included 20 subjects (20
ears) exposed to niose, all were males.
They had a complaint of hearing impair-
ment and tinnitus. Their age ranged be-
tween 25 to 45 years, older subjects were
excluded fo avoid the effect of presbycusis,
in addition, subjects who received ototoxic
drugs, with history of diabetes, history of
renal and hepatic diseases were also ex-
cluded
The study included 10 normal subjects
(10 ears) as a control group. Pure tone au-
diometry was performed, the average bone
conduction of noise exposed subjects and
control subjects at frequencies 500 to 4000
Hz were reported
From table (1) we found the fol-
lowing :
1. All frequencies for 250 to 8000 Hz
(in the audiogram) gave statistically sig-
nificant differences in hearing threshold
levels where the hearing sensitiviy was
less in the noise exposed workers than the
control group. These differences showed
the following characteristics:
a - They were more prominent for high
frequencies (2000, 4000 and 8000 Hz)
than low and moderate frequencies (250,
500 % 1000 Hz), so starting to increase
from 2000 Hz and tries to return again at
8000 Hz, but still more than normal.
b - Maximal affection of hearing thres-
hold was at 4000 Hz, where the signifi-
cance (T = 41.08) being the most noise
sensitive frequency [31].
2. Aso from table (2), we found that in
the speech reception threshold (SRT) there
was singificance in the difference between
the cdntrol and the study groups, it was
beiter in control group, as T = 11. 64.
Ad-dory Brain Stem Response in Noise Deafness
3. In the same table (2), as regards the
word discrimination score (WDS), there
was statistical significant difference
between the control and the study groups
(T = 19.6).
In our work, there were 4 workers of
the noise exposed individuals complained
from difficulties in undersanding speech,
and this represented 20% of the total num-
ber of the study group. This unexpected
poorer discrimination was suggestive of
their sensory-neural hearing loss, which
was of neural affection rather than pure co-
chlear lesion [3,4].
From table (3), we found that:
1. The compliance of the middle ear
was not affected in the noise exposed sub-
jects, when compared with those of the
control group (no significant difference) T
= 0.22, because the lesion was a cochlear
lesion and the middle ear was not affected
from the noise exposure.
2. Although the stapedial muscle reflex
thresholds were within normal for both
control and study groups, still there were
significant differences at al1 frequencies
tested (at 500 Hz t = 15.19, at 1000 Hz t
= 8.92, at 2000 Hz = 7.56 and at 4000 Hz
t = 10.13) these normal values of acoustic
reflex thresholds were considered as evi-
dence of cochlear site of the lesion due to
the recruitement phenomenon.
Also, it was found that there was a
subjective feeling of tinnitus which was
the major complaint of the noise exposed
individuals. These were 8 workers from
the study group (20 subjects) so this rep-
resented about 40% of the total number
that complained from tinnitus. It is no-
ticed that the tinnitus was the earliest
symptom in the noise-induced hearing loss
in individuals, which was followed by
difficuty in understanding speech, then
hearing deterioration followed at last.
From table (4) ABR absolute latencies
showed the following:
1. Wave 1 at 90 dB: It was slightly
prologned in latencies of the study group
than the control group, but this difference
failed to reach a significant level (T =
1.34) andp c 0.05. Some Workers [32]
proved that wave is not shifted or pro-
longed except at low intensities.
2. Wave III at dB: Although the abso-
lute latency of this wave had longer laten-
cy in the study group, yet the difference
was statistically insignificant (T = 0.81)
and p c 0.05.
3. Wave V at 90 dB: The same results
of the above waves I & III were found also
for wave V at this intensity level, (90 dB),
the longer latency of the study group still
showed no statistical significance (T =
0.78) and p e 0.05. Picton ey al [33]
stated that wave V latency was not affected
at high intensities.
4. Wave III at 70 dB: Its latency
showed a statistical significance between
the control and the study groups, as the
latency of wave III of the noise exposed
268 Ahmed Taha, et al.
subjects was longer than that of the normal
subjects (T = 2.23) andp c 0.05. Drift
et al [34] stated that at cochlea1 hearing
loss, waves III & V are longer than the
normal subjects.
5. Wave V at 70 dB: Its latency
showed a statistically significant difference
between the control and study groups (T =
2.41) andp c 0.05 .
6. Wave V at 50 dB: Its latency was
longer in the study group, except in one
subject of the study group, where wave V
was absent, and its audiogram was show-
ing hearing loss up to 60 dB level at 4000
Hz, (T = 3.173) and p c 0.01. At co-
&ear hearing loss wave V was not be af-
fected except at low intensities [35] .
7. Wave V at 30 dB : Wav V was not
present in all the study group (absent from
all the noise exposed workers), at the same
time it was present at 30 dB in all the con-
trol group subjects. This finding is in
agreement with the hearing sensitivity of
both group individuals [36] as ABR was
used for hearing assessment.
From the above we found that:
- At high intensity levels e.g. 90 dB,
the affection of the wave V was minimal or
absent (insignificant).
- While at intensity 70 dB, there was
greater affection of the Wave V latency
[35), in the moderate intensitties as 50
dB, the prolongation in the latency of
wave V was highly significant [35]. And
this was due to the recruitment of the
cochlear phenomenon.
From table (4): ABR interwave inter-
vals showed the following :
1. For the interwave interval (IWI) I-III
there was no significant difference between
the IWI I - Ill of the control and the study
groups (T = 0.20) andp > 0.05.
2. As regards the interwave interval
, (IWI) III - V there was no statistical signif-
icance between that of the control subjects
and the study group, the significance test T
= 0.06 andp > 0.05.
3. Accordingly interwave interval (IWI)
I-V there was no statistical significant dif-
ference between the I-V IWI in the control
and that of the study groups, as the T =
0.181 p > 0.05.
Figure (1) showed the latency intensity
function curve of wave V for both the con-
trol and study subjects. The curve ob-
tained from the normal subjects was drown
as a reference curve for the study group. The curve representing the latency values
of wave V of the study group was consid-
ered as typical response for the cochlear
hearing loss, where the latency at high in-
tensity level (90 dB) was at normal value,
while as the intensity decreased the laten-
cey prolonged till the response disappeared
at the hearing thresholds. This was due to
the rlxruitement phenomenon which charac-
terised the cochlear hearing loss, 1341.
Aubitory Brain Stem Response in Noise Deafness 269
The correlation coefficient (r):
As regard the values of “t” were:
0.20 to 0.40 = low correlation.
0.40 to 0.60 = moderate correlation.
0.60 to 0.80 = high correlation.
0.80 to 1.00 = extra-high correaltion.
So from table (5), we found that, asfhe
period of exposure was increased as the
hearing sensitivity was decreased at high
frequencies (2000,400O and 8000 Hz) but
most prominent at 4000 Hz as “t” at 250
Hz = 0.14 (no correlation), “t” at 500 Hz
= 0.22 (low correlation), “t” 1000 = 0.24
(low correlation), “t” at 4000 Hz = 0.80
(extra-high correlation) and “1” at 8000 Hz
= 0.67 (high correlation).
‘From our work we noticed that there
was no previous audiograms or any records
for the workers to compare them with the
audiograms or the ABR tracings done in
this work. The audiograms must be done
as one of the pre-employment examian-
tions, to be kept as a document to show
the effect of noise on hearing and in evalu-
ation of the degree of the workers disabili-
ty due to noise.
Although the noise level in engins in
most departments were more than 95 dB,
many countries as Canada and France con-
sider 85 dB as a critical level above which
hearing protection must be seriously con-
sidered [33].
Conclusion:
The aim of this work was to study the
effect of continuous industrial noise on
hearing of the workers by using the audito-
ry brain-stem response (ABR). The total
number of twenty noise exposed workers
were chosen from textile factories, and ten
not exposed subjects as control group.
All of the two groups were males, their
ages ranged from 25 up to 50 years old
All of them were subjected to a sheet for
occupational deafness. Clincical otological
examination was carried out at Hearing and
Speech institute at Embaba. All the sub-
jects had clinically normal ears, with intact
mobile tympanic membranes, with no his-
tory of ear diseases, no head trauma or oto-
toxic drug administration. All of the con-
trol and noise exposed workers were
subjected to audiometric tests, speech tests,
tympanometric tests and brain-stem re-
sponse audiometry tests.
The struiy revelaed that:
1. There was no pre-employment audi-
ograms or follow up audiograms.
2. The 4000 Hz frequency was the first
and the most frequency to be affected fol-
lowed by 3000 and 2000 Hz respectivly.
3. The average heating losses at 2,3 and
4 KHz must be taken as the level of hear-
ing loss instead of the all frequencies from
250 to 8000 Hz, as the noise affect the
high frequencies, most prominent at 4
270 Ahmed Taha, et al.
4. The wave V disappeared at low in-
tensities as regard the degree of hearing
loss at frequencies 2 and 4 KHz, which
was related to the period of exposure to
noise.
ears exposed to noise, in Henderson Ha-
mernick, Dosanjk, Mills, effect of noise
on hearing pp. 82 - 85. Raven Press, New
York, 1976.
5. The latency intensity curve was
usedio confirm the cochlear hearing loss,
and to differentiate it from the conductive
and retro-cochlear hearing loss.
4. WARD, W. D.; SANTI, P. A.; DUVALL, A.
J., JURNER, C. W.: Total energy and criti-
cal intensity concepts in noise damage.
Ann. Otol. Rhinol. Laryngol., 90 : 584 -
590, 1981.
.6. The Interwave intervals in the ABR
were not affected in the coch&ar hearing
loss, but only there was a delay in the ab-
solute latency of wave V at low intensi-
ties.
5. STARR, A.: Suppression of single neuron
activity in the cochlear nucleus of cat fol-
lowing sound stimulation. J. Neurology,
26 : 416 - 431, 1965.
6.
7. As the period of exposure to noise
was increased, the hearing sensitivity was
diminished
BENITZ, L. D., ELDREGE, D. M., TEM-
PER, J.W.: Temporary threshodl shift in
chinchilla : Electra-physiological correla-
tion. J. Acoustic Sot. Am. 528: 115-123,
1972. 8. Lastly, the protection from noise was
very important to keep the hearing sensi-
tivity not affected.
7.
References
1. HIRSH, 1. J. and WARD W.D.: Recovery of
the auditory threshold after strong acous-
tic stimulation. J. Acoustic,. Sot.
America, 24: 131, 1952.
SALVI, R.J.: Central components of the
temporary threshold shift. In Henderson,
Hamernik, Dosangjh, Mills, Effects of
noise on hearing p.p. 102 - 109 Raven
Press, New York, 1976.
8. BURNS, W.: (Chapters 9 & 10) in Noise
and man. 2 nd ed. pp 189-251. Lipincott,
Philadelphia, 1973.
2. CORSO, J. F.: Presbycusis as a complicat- 9. KRYTER, K.D.: The efects of noise on
ing factor in evaluating noise induced man. Academic Press, New York, 1970.
hearing loss, in Henderson, Hanernik, 10. AMERICAN NATIONAL STANDARDS IN-
Dosanjh, Mills, effects of noise on hear- STITUE.: Aemrican National Specifica-
ing pp. 28-40. Raven Press, New York, tion for sound level meters. ANSI 4,
1976.. 1971.
3. HAWKINS, J.E.; JOHNSON, L.E.: Patterns
of sensory-neural degeneration in human
11. GOLDSEIN, B. A. : Early identifitcation
of hearing - impaired infants : Public law
Aubitory Brain Stem Response in Noise Deafness 271
94 - 142. International Journal of Pediat-
ric Otorhinolaryngology, 1 (3): 181
191, 1979.
12. MELNICK, W.: Temporary and perma-
nent threshodl shift. (ed.) Lipscomb, D.
M. Department of audiology and speech
pathology, (Univesityh Park Press),
1978.
13. SCHUKNECHT, H. F.: Pathology of the
ear. Harvard University Press, Cambri-
dege. pp. 302 - 308, 1974.
14. BOHNE, B. A.: Mechanisms of noise
damage in the inner ear. In D. Henderson,
R. P. Harmernik, D. S. Dosanjh, and H.
Mills (eds.): Effects of noise on hearing,
pp. 41 - 68. Raven Press, New York,
1976.
15. DOLAN, T. R., H.W. ADES, G. BRED-
BERG, and W. D. NEFF.: Inner ear dam-
age and hearing loss after exposure to
tones of high intensity. Acta Otolaryn-
gol., 80 : 343 - 352, 1975.
16. FRIED, M. P.; S.E. DUDEK, and B.A.
BOHNE.: Basal turn cochlear lesions fol-
lowing exposure to low frequency noise,
Trans. Am. Acad. Ophthalmol. Otol.. 82:
285 - 298, 1976.
17. MISRAHY, G. A.; SHINABARGER.
E.W., and ARNOLD, J. E.: Changes in co-
chlear endolymphatic oxygen availabili-
ty. Action potential and following as-
phyxia and exposure to loud sounds. I.
Acoustic Sot. America, 30 : 701 - 704,
1958.
18. SCHNEIDER, EA.: A contribution to the
physiology of the perilymph. Part III. on
the origin of noise - induced hearing loss.
Ann. Otol. Rhinol. Laryngol., 83 : 406 -
412, 1974.
19. DUVALL. A. J., W. D., and LAUKALA, K.
E.: Stria Ultrastructure and vessel trans-
port in acoustic trauma. Ann. oto. Rhin-
01. Laryngol., 83 : 498 - 511, 1974.
20.LURIE, M.H., DAVIS, H., and HAWKINS,
I.E. Acoustic trauma of the organ of corti
in the Guinea pig. Laryngoscope, 54:
375 - 386., 1944.
21. WARD, W.D.; DUVALL, A.J.: Behavioral
and Ultrastructural correlates of acoustic
trauma. Ann. Otol. Rhinol. Laryngol.;
80 : 1 - 16, 1971.
22. MOREST, D. K., JONES, D.R.; KWOK.
S., ARD, M.D.; BOHNE, B.: Response of
the brain stem to acoustic damage of the
cochlea. ARO, Clearwater Beach, p. 5,
1987.
23. NILSSON, P.; DUNN, D.E.; Erlandsson,
B.; Grenner, J. HAKANSON , H.;
IVARSSON, A.; WERSALLS, J.: Conclu-
sions from animal experiments on the ef-
fect of steady state and impulse noise as a
public health problem. Proc. 4th. Int.
Congr. Torno (Italy) Vopl. 1, pp. 159-
170, 1983.
24. BOHNE, B. A.; YOHMAN, L: The diffe-
renliall effect of excessive exposure to
noise on the apical and basal turns of the
cochlea. ARO.., Clearwater Beach, p. 5,
1987.
272 Ahmed Taha, et al.
25LIBERMAN, M.C., DODDS, L.W.: Co-
chlear patology in noise-induced hearing
10~s: comparison of reversible and irre-
versible lesions. ARO, Clearwater Beach,
p. 2, 1987.
26.WARD, W.D.; SANTI, P.A.; FABRY,
D.A.: The total energy and equal energy
principles in the chinchilla, in Rossi,
.noise as public health problem. Proc. 4th
Int. Conger. Torino (Italy) Vol. 1, pp.
399-405, 1983.
27. BOHNE, B. A.: Safe level for noise expo-
sure.. Ann. Otol., 85 : 711 - 724. 1976.
28.SPOENDLIN, H.: Anatomical changes fol-
lowing various noise exposure. In D.
Headerson, R.P., Hamernik, D. S. do-
sanjh, and J. H., Mills (eds.) efects of
noise on hearing, pp. 69-89, Raven
Press, New York, 1976.
29. SCHWARTZ, D.M.: Normative aspects of
ABR. In the auditory brain-stem response
(eds.) Jacobson, J. T., (College, Hill
Press, San Diego) California. 5: 65 - 83,
1985.
30. NEWTON, E. and BARRATT, H. J.: An
.evaluation of the use of auditory brain
stem electric response lets in paediatric
audiological assessment. Int. J. Ped.
Otol. Rhinol. Laryngol., 5: 139.. 1983..
31.DRIFT, J. F. C., BROCAAR, M. P.,
ZANTEN, G. A.V: The relation between
the pure tone audiograms and the click au-
ditory brain-stem response threshold in
cochlear hearing loss. Audiology, 26 : 1 -
10, 1987.
32. EGGERMONT. J., and ODENTHAL D. W.:
Frequency selective masking in electro-
cochleography. Revue de laryngologie,
95 (7-Q 489- 496, 1974.
33.PICTON, T.W.WO0DSD.L.; BARIBEAU-
BRAWN, J. and HEARLY T.M.: Evoked
potential audiometry J. Otolaryngol. 6 :
90-119, (1977).
34.DRIFT, J. F. C., BROCAAR, M. P.,
ZANTEM, G. A. V., LAMORE, P. J. J. : In
accuracies in the measurement of auditory
brain-stem response data in normal hear-
ing and cochlear hearing loss. Audiology
27 : 109-118, 1988.
35. SELTERS, W. A.; and BRACKMANN.
D.E.: Acoustic tumor detection with
brain-stem electric response audiometry.
Arch. Otolaryngol., 103 : 183, 1977.
36. JACOBSON, J.T.: An overview of the au-
ditory brain-stem response. In: Jacobson,
J. T. (ed.), the auditory brain-stem re-
sponse. pp. 313 (Taylor and Francis,
London), 1985.