Embed Size (px)
Citation preview
Afolabi et al., Cogent Engineering (2017), 4: 1287248http://dx.doi.org/10.1080/23311916.2017.1287248
CHEMICAL ENGINEERING | RESEARCH ARTICLE
Optimizing the rheological properties of silica nano-modified bentonite mud using overlaid contour plot and estimation of maximum or upper shear stress limitRichard O. Afolabi1*, Oyinkepreye D. Orodu1, Vincent E. Efeovbokhan2 and Oluwatosin J. Rotimi1
Abstract: An optimization based statistical (response surface) approach was used to evaluate the rheological properties of bentonite mud treated with silica nanopar-ticles. The overlaid contour plot established the feasible region for the various factor settings from multiple regression equations. The steepest method was used to fur-ther determine the optimal factor settings for minimum rheological properties and this was established at 6.3 wt.% bentonite content and 0.94 wt.% silica nanopar-ticles. The rheological properties of the bentonite mud containing and without silica nanoparticles was evaluated using a Hyperbolic (new) model and related with other oil industry based models: Herschel Bulkley, Sisko, Casson. The hyperbolic rheologi-cal model estimated the rheological behaviour of the nano-modified mud satis-factorily while also predicting a shear stress limit for the nano-modified mud. The maximum shear stress limit values for 6.3, 13 and 15 wt.% mud were 14.59, 61.74 and 107.4 Pa respectively. Upper shear stress values obtained from a 1.5 wt.% silica
*Correspondence: Richard O. Afolabi, Department of Petroleum Engineering, Covenant University, P.M.B 1023, Ota, Nigeria E-mails: [email protected], [email protected]
Reviewing editor:Zhibing Zhang, University of Birmingham, UK
Additional information is available at the end of the article
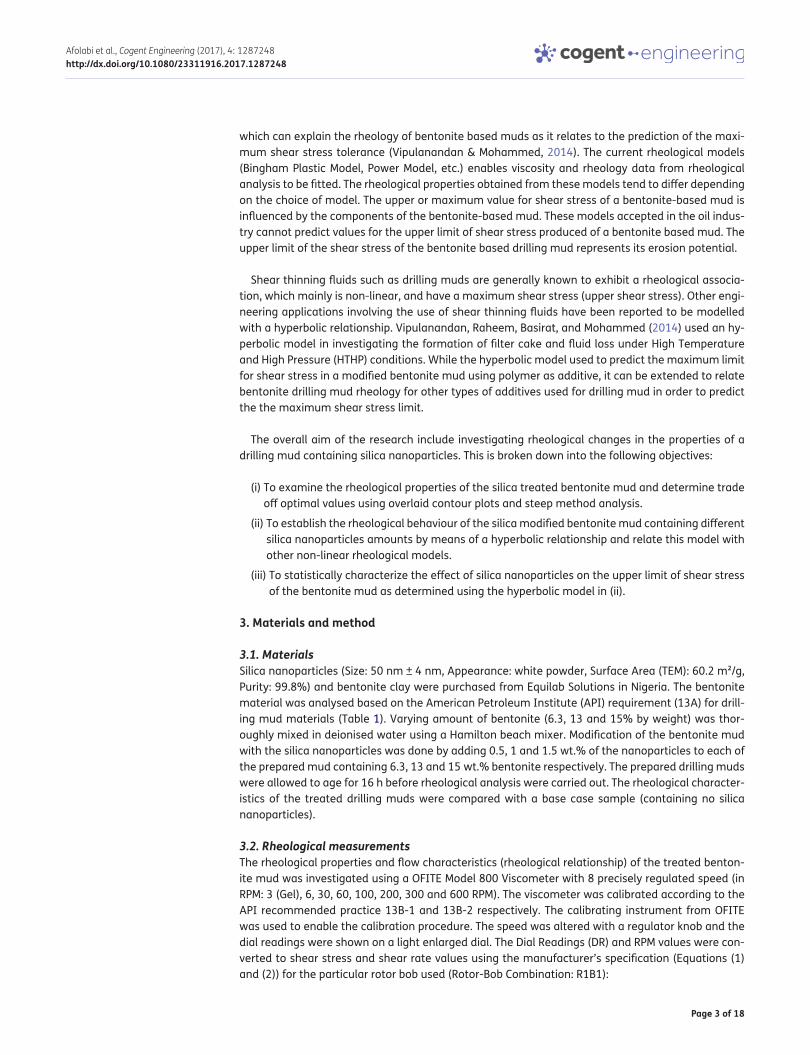
ABOUT THE AUTHORSMr Richard O. Afolabi is currently on his doctorate programme in Covenant University, Ota, Nigeria. Mr. Afolabi's research interests broadly encompasses the development of nanomaterials for application relevant to the oil and gas industry.
Dr Oyinkepreye D. Orodu has varied Oil & Gas industry experience spanning field operations and academia. Dr. Orodu current research interest includes “decision analysis and stochastic modelling of optimal well utilization for multi- well systems”, “Characterization and modelling of flow units” and “Niger Delta Heavy Oil Producibility Evaluation (HOPE)”.
Dr Vincent E. Efeovbokhan has varied experience spanning field operations and academia. His areas of core competence include alternative energy-biodiesel; product formulations (De-emulsifiers for crude oil treatment); environmental pollution control (bio-remediation).
Dr Oluwatosin J. Rotimi is an earth scientist with varied experience spanning Africa and the Far East. His areas of core competence include Seismic modelling (structural and stratigraphic), Sequence stratigraphy, Geostatistics, Environmental Geophysics and Petrophysics.
PUBLIC INTEREST STATEMENTOil and gas exploration and development is gradually shifting from onshore to deep offshore, which are under extreme environmental conditions. Drilling operations represents a critical part of oil and gas development hence the need to improve the rheological properties of the major ingredient of drilling operation, which is the drilling mud. Nanotechnology has provided the needed platform in improving drilling mud performance in deep offshore conditions. In this research work done, silica nanoparticles were used as additives in drilling mud and its rheological properties studied. The rheological behaviour was studied using conventional oil and gas models and this was compared with a new hyperbolic model. The hyperbolic model was able to go a step further and predict a new rheological property, which is the maximum or upper shear stress limit for drilling muds.
Received: 17 August 2016Accepted: 23 January 2017First Published: 29 January 2017
Page 1 of 18
© 2017 The Author(s). This open access article is distributed under a Creative Commons Attribution (CC-BY) 4.0 license.
Richard O. Afolabi
Page 2 of 18
Afolabi et al., Cogent Engineering (2017), 4: 1287248http://dx.doi.org/10.1080/23311916.2017.1287248
nanoparticle modified 6.3, 13 and 15 wt.% bentonite mud were 22.27, 72.62 and 171.3 Pa respectively, which represents an increment of 34.5 to 37.4% in the upper limit of shear stress. The effect of silica nanoparticles on the upper shear stress limit was quantified using a response surface design.
Subjects: Materials Science; Nanoscience & Nanotechnology; Chemical Engineering
Keywords: bentonite clays; silica nanoparticles; rheology; optimization; shear stress; contour plots; drilling mud; hyperbolic model
1. IntroductionCurrent research trends in most fields of study have shown a gradual shift to nanotechnology. In other words, the world is scaling down with respect to technological innovations and inventions and this has developed research interest in this area of technology, as it is the current domain for minia-turization with respect to scientific advancement. The oil and gas industry is not left out from this advancement as different areas from exploration, drilling to development and production have wit-nessed gradual research into the application of nanotechnology (Hoelscher, Stefano, Riley, & Young, 2012; Zakaria, Husein, & Hareland, 2012). Drilling operation is necessary for the confirmation of oil and gas beneath the earth surface and a major important ingredient in this operation is the drilling fluid which is often called drilling mud (Mahmoud, Nasr El-Din, Vryzas, & Kelessidis, 2016; Sehly et al., 2015). The use of nanoparticles as additives in bentonite drilling mud formulation is still relatively new in the petroleum industry. The addition of nanoparticles in the bentonite mud can be made into the desired viscosity and fluid loss attributes with varying amount of bentonite. This makes a good case for drilling mud formulation due to their ability to modify rheological attributes and fluid loss characteristics of the mud. Besides this, there has been no reported environmental impact of nano-particle modified drilling mud. The use of nanoparticle for Water Based Muds (WBMs) in shale forma-tions have shown how effective nanoparticles are in preventing fluid loss due to their small size (Hoelscher et al., 2012; Jung, Zhang, Chenevert, & Sharma, 2013; Sadeghalvaad & Sabbaghi, 2015; Zakaria et al., 2012).
2. Literature reviewThe flow characteristics of drilling fluids is one of the major influencing factor in the design, optimi-zation and construction of oil and gas wells . The use of nanoparticles in drilling mud formulation has been reported to improve wellbore quality of shale formations by preventing the infiltration of mud containing water into the formation. This is achieved through its small size and large surface area. Nanoparticles can also influence rheological and thixotropic properties for drilling mud application. Hole cleaning often requires the removal of drilled cuttings and this is often done by passing the drilling mud through the drill string down to the drill bit where it exits into the hole and lifts the cut-tings through the annulus to the surface. (Jung et al., 2013; Sadeghalvaad & Sabbaghi, 2015; Zakaria et al., 2012). Wyoming bentonite clays which represent the major ingredient in the formulation of drilling muds has been used over the years in performing functions such as the transport of drilled rock cuttings from the reservoir to the surface, preventing the loss of fluid into reservoir formations through the formation of filter cake on the reservoir rock surface, maintaining adequate hydrostatic pressure against formation pore pressure and erosion of reservoir rock during drilling operation. The presence of bentonite and other additives are essentially used to control and modify fluid loss char-acteristics and rheological properties such as yield stress, apparent viscosity, gel strength, plastic viscosity and the maximum shear stress limit. The higher limit of the shear stress or upper shear stress limit of the bentonite-based mud is an indication of how well the drilling mud erodes the rock formation. The lower limit of the shear stress or yield stress that can be created by the bentonite-based mud is a measure of resistance to flow or stress needed to initiate flow of the mud. This prop-erty better represents the pumpability of the mud.
Drilling muds exhibit non-Newtonian rheological behaviour and do not obey the direct relationship of rheological behaviour involving shear stress/shear rate. Restrictions exist on rheological models,
Page 3 of 18
Afolabi et al., Cogent Engineering (2017), 4: 1287248http://dx.doi.org/10.1080/23311916.2017.1287248
which can explain the rheology of bentonite based muds as it relates to the prediction of the maxi-mum shear stress tolerance (Vipulanandan & Mohammed, 2014). The current rheological models (Bingham Plastic Model, Power Model, etc.) enables viscosity and rheology data from rheological analysis to be fitted. The rheological properties obtained from these models tend to differ depending on the choice of model. The upper or maximum value for shear stress of a bentonite-based mud is influenced by the components of the bentonite-based mud. These models accepted in the oil indus-try cannot predict values for the upper limit of shear stress produced of a bentonite based mud. The upper limit of the shear stress of the bentonite based drilling mud represents its erosion potential.
Shear thinning fluids such as drilling muds are generally known to exhibit a rheological associa-tion, which mainly is non-linear, and have a maximum shear stress (upper shear stress). Other engi-neering applications involving the use of shear thinning fluids have been reported to be modelled with a hyperbolic relationship. Vipulanandan, Raheem, Basirat, and Mohammed (2014) used an hy-perbolic model in investigating the formation of filter cake and fluid loss under High Temperature and High Pressure (HTHP) conditions. While the hyperbolic model used to predict the maximum limit for shear stress in a modified bentonite mud using polymer as additive, it can be extended to relate bentonite drilling mud rheology for other types of additives used for drilling mud in order to predict the the maximum shear stress limit.
The overall aim of the research include investigating rheological changes in the properties of a drilling mud containing silica nanoparticles. This is broken down into the following objectives:
(i) To examine the rheological properties of the silica treated bentonite mud and determine trade off optimal values using overlaid contour plots and steep method analysis.
(ii) To establish the rheological behaviour of the silica modified bentonite mud containing different silica nanoparticles amounts by means of a hyperbolic relationship and relate this model with other non-linear rheological models.
(iii) To statistically characterize the effect of silica nanoparticles on the upper limit of shear stress of the bentonite mud as determined using the hyperbolic model in (ii).
3. Materials and method
3.1. MaterialsSilica nanoparticles (Size: 50 nm ± 4 nm, Appearance: white powder, Surface Area (TEM): 60.2 m²/g, Purity: 99.8%) and bentonite clay were purchased from Equilab Solutions in Nigeria. The bentonite material was analysed based on the American Petroleum Institute (API) requirement (13A) for drill-ing mud materials (Table 1). Varying amount of bentonite (6.3, 13 and 15% by weight) was thor-oughly mixed in deionised water using a Hamilton beach mixer. Modification of the bentonite mud with the silica nanoparticles was done by adding 0.5, 1 and 1.5 wt.% of the nanoparticles to each of the prepared mud containing 6.3, 13 and 15 wt.% bentonite respectively. The prepared drilling muds were allowed to age for 16 h before rheological analysis were carried out. The rheological character-istics of the treated drilling muds were compared with a base case sample (containing no silica nanoparticles).
3.2. Rheological measurementsThe rheological properties and flow characteristics (rheological relationship) of the treated benton-ite mud was investigated using a OFITE Model 800 Viscometer with 8 precisely regulated speed (in RPM: 3 (Gel), 6, 30, 60, 100, 200, 300 and 600 RPM). The viscometer was calibrated according to the API recommended practice 13B-1 and 13B-2 respectively. The calibrating instrument from OFITE was used to enable the calibration procedure. The speed was altered with a regulator knob and the dial readings were shown on a light enlarged dial. The Dial Readings (DR) and RPM values were con-verted to shear stress and shear rate values using the manufacturer’s specification (Equations (1) and (2)) for the particular rotor bob used (Rotor-Bob Combination: R1B1):
Page 4 of 18
Afolabi et al., Cogent Engineering (2017), 4: 1287248http://dx.doi.org/10.1080/23311916.2017.1287248
Based on the API specification 13A, Equations (3) to (5) was used in estimating the rheological attributes of the prepared drilling mud.
�600 and �300 are the dial readings at 600 and 300 RPM respectively. The viscosity values were calcu-lated using the relationship in Equation (6) as specified in the OFITE operational manual (1cp is equivalent to 10−3 Pas).
where η is the viscosity in cp, K is the machine constant of rotor – bob combination (R1B1) = 300, F is the spring factor = 1 for the R1B1 combination.
4. Development of rheological modelBased on the rheological results obtained using the viscometer, the bentonite mud (both the base case and the modified sample) exhibited shear thinning characteristic behaviour with yield point and this is non-linear. In order to fit a rheological model to predict this shear-thinning attribute, certain conditions must be satisfied (Vipulanandan & Mohammed, 2014):
(1)1RPM = 1.7023 s−1 RPM−1
(2)1DR = 1.065Ib
100ft2= 0.5107 Pa
(3)Plastic viscosity (PV), cp = �600 − �300
(4)Yield point (YP),Ib
100ft2= �300 − PV
(5)Apparent viscosity (AV), cp = �600∕2
(6)� = KF�
RPM
(7)𝜏 = 𝜏0 when �� = 0
(8)d𝜏
d��> 0
(9)d2𝜏
d��2< 0
Table 1. Bentonite physical requirements
*API requirements.
Requirements Specification Mud sampleViscometer dial reading at 600 RPM* 30, minimum 30
Viscometer dial reading at 300 RPM – 23
Plastic viscosity – 7
Yield point – 16
Yield point/Plastic viscosity ratio* 3, maximum 2.29
Mud weight – 8.6 ppg
Specific gravity – 1.3
Filtrate volume* 15 cm3, maximum 14 cm3
Page 5 of 18
Afolabi et al., Cogent Engineering (2017), 4: 1287248http://dx.doi.org/10.1080/23311916.2017.1287248
where τ is the shear stress, �� is the shear rate, τ0 is the yield stress and τ* is the maximum shear stress limit. Four rheological models were used in predicting the shear thinning attributes of the mud samples. The models were subjected to the conditions represented in Equations (7) to (10). The four models are: Herschel Bulkley, Sisko, Casson and Hyperbolic. Based on these conditions, it was ob-served that the Herschel Bulkley, Sisko and Casson models satisfies conditions (7) to (9) but not (10). In order words, they cannot predict the shear stress limit of the drilling fluid. The hyperbolic model on the other hand satisfies the conditions (7) to (10).
4.1. Herschel Bulkley rheological modelThe Herschel Bulkley model relates shear stress to shear rate using three parameters which is repre-sented mathematically in Equation (11).
where τ01, τ, ��, n, and K1 represents the yield stress, shear stress, shear rate, flow constant and con-sistency factor respectively. Flow constant describes the shear thickening (n > 1) and shear thinning (n < 1) features of fluids. When n = 1 and τ01 = 0, Equation (11) reduces to the Newtonian model.
4.2. Sisko rheological modelThe Sisko model relates shear stress to shear rate using three parameters which is represented mathematically in Equation (12).
where K2 is the coefficient of viscosity, K3 is the consistency coefficient and m is the flow index of the fluid. m < 1 represents a pseudoplastic (shear thinning) fluid, m > 1 represents a dilatant (shear thickening) fluid and m = 1 correspond to a Newtonian fluid.
4.3. Casson rheological modelThe Casson model relates shear stress to shear rate using two parameters which is represented mathematically in Equation (13).
where K4 and τ02 are the model constant and yield stress respectively.
4.4. Hyperbolic rheological modelA hyperbolic model similar to what was used by Vipulanandan and Mohammed (2014) was applied to investigate the rheological relationship of silica treated bentonite muds. The mathematical expression for the model is shown in Equation (14):
where τ03 is the yield stress, A and B are the model parameters.
4.5. Accuracy of rheological model estimationsThe accuracy and comparison of the various model predictions were quantified using the Root Mean Square Error (RMSE), residual plot analysis (A residual is the difference among the experimental y-value obtained from the scattered plot and the modelled y-value obtained from regression analy-sis) and the coefficient of determination (R2) values obtained from the non-linear regression analysis of the constitutive models with the experimentally obtained rheological data. The RMSE and R2 expressions are represented in Equations (15) and (16)
(10)𝜏 = 𝜏∗ when �� = ∞
(11)𝜏 = 𝜏01 + K1��n
(12)𝜏 = K2�� + K3��m
(13)𝜏1∕2 = 𝜏
1∕2
02+ K
1∕2
4��1∕2
(14)𝜏 = 𝜏03 +��
A + B��
Page 6 of 18
Afolabi et al., Cogent Engineering (2017), 4: 1287248http://dx.doi.org/10.1080/23311916.2017.1287248
where yi = experimental data obtained3 from rheological analysis, xi = estimated data obtained from the fitted relationship, y = mean of the experimental data, x = mean of estimated data from fitted model and N = number of data points. The model parameters were obtained from nonlinear regression analysis of the various constitutive models with the experimental rheological data and are summarized in Tables 6a–6d.
4.6. Effect of bentonite content and silica nanoparticles on the rheological properties and maximum shear stressThe effect of bentonite content and amount of silica nanoparticles on the rheological properties and upper limit of shear stress of the bentonite mud was investigated using a response surface design. The response surface design was used with the experimental results to select factors (the bentonite content and amount of silica nanoparticles) that influence the maximum shear stress limit and rheological features (yield point, plastic viscosity, apparent viscosity) of the drilling mud significantly. The response surface design was carried out using Minitab 17 (Minitab Inc. USA). The range of factors used and the levels of the factors were based on the preliminary experimental results (Table 2). Analysis of Variance, which is also called ANOVA, was applied to estimate the suitability of using the response surface model after which optimization experimentations was used to obtain the suitable settings for the factors using the overlaid contour plot analysis (to determine the feasible region for the optimal values of the response variable) and the steepest method analysis (this analysis was based on the steepest ascent and descent path until the response neither increase or decrease). The response variables (rheological properties) were obtained based on Equations (3)–(5) while the max-imum shear stress limit of the drilling mud was calculated based on Equation (14) using the hyper-bolic model.
5. Results and discussion
5.1. Rheological properties of modified drilling mud
5.1.1. Response surface designOptimization of factors like bentonite content (X) and amount of silica nanoparticles (Y) were exam-ined. In this work, the effect of these parameters on the rheological properties (Plastic viscosity (PV), Apparent viscosity (AV) and Yield point (YP)) was determined through a screening procedure using a response surface design. Table 3 shows the outcome of the experiment carried out. The analysis of variance in Table 4 shows that the bentonite content, amount of silica nanoparticles and the interac-tion between them were significant factors (p-value of <0.05 was used as the limit point) which im-pacts the rheological properties (PV, YP and AV) of the silica nano-modified drilling mud. The linear
(15)RMSE =
�∑n
i=1(yi − xi)2
N
(16)R2 =
⎛⎜⎜⎜⎝
∑i(xi − x)(yi − y)�∑
i(xi − x)2�∑
i(yi − y)2
⎞⎟⎟⎟⎠
2
Table 2. Factor setting for response surface designVariable Notation Unit Level
Low HighBentonite content X wt.% 6.3 15
Silica nanoparticles Y wt.% 0 1.5

Page 7 of 18
Afolabi et al., Cogent Engineering (2017), 4: 1287248http://dx.doi.org/10.1080/23311916.2017.1287248
regression equations obtained from the regression analysis of the response surface design are listed below:
From Equations (17) to (19), the bentonite content (X) and amount of silica nanoparticles (Y) have different impact on the response variables (PV, YP and AV). This indicates that in maximizing the rheological properties, the factors or terms in the regression equations with positive coefficients have to increase while those with negative coefficients must be decreased.
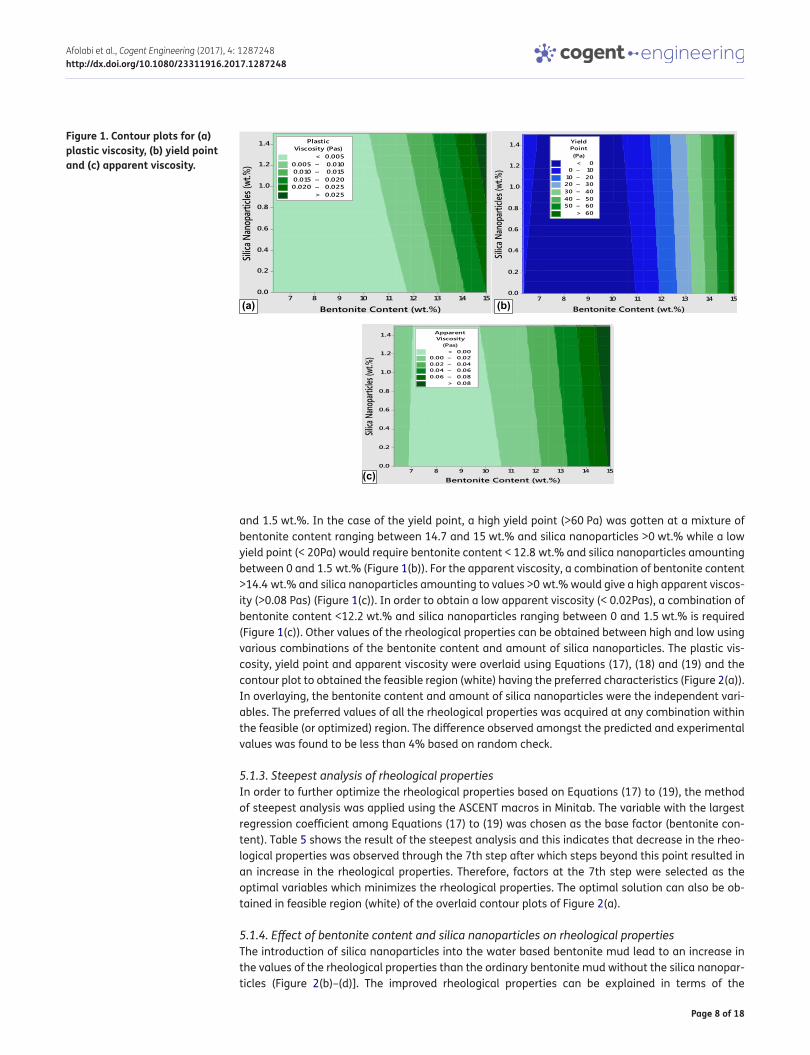
5.1.2. Overlaid contour plot analysis of rheological propertiesContour plots were produced from the regression Equations (17)–(19) obtained from the regression analysis using Minitab. Figure 1(a) shows the contour plot for plastic viscosity which showed that high plastic viscosity (>0.025 Pas) was attained at a combination of bentonite content 14.5–15 wt.% and silica nanoparticles greater than 0.9wt% while low plastic viscosity (< 0.005 Pas) was attained using a combination of bentonite content <10.2 wt.% and silica nanoparticles amounting between 0
(17)PV = 0.0413 − 0.00918X − 0.00542Y + 0.000517X2 + 0.000754XY R2 = 0.9655
(18)YP = 128.32 − 31.94X + 2.85Y + 1.8453X2 R2 = 0.991
(19)AV = 0.1701 − 0.04072X − 0.00679Y + 0.002324X2 + 0.001101XY R2 = 0.997
Table 3. The response surface design and the measured rheological properties (responses)
*Variables in un-coded levels.
Run order Bentonite content (wt.%)*
Silica nanoparticles
(wt.%)*
Plastic viscosity (Pas)
Yield point (Pa)
Apparent viscosity (Pas)
X Y1 6.3 0.0 0.0034 2.1449 0.0055
2 6.3 0.5 0.0035 2.5535 0.0060
3 6.3 1.0 0.0036 2.5535 0.0061
4 6.3 1.5 0.0037 2.6046 0.0063
5 13.0 0.0 0.0120 22.982 0.0350
6 13.0 0.5 0.0130 25.535 0.0375
7 13.0 1.0 0.0130 28.089 0.0405
8 13.0 1.5 0.0130 31.663 0.0440
9 15.0 0.0 0.0170 62.816 0.0785
10 15.0 0.5 0.0230 68.945 0.0905
11 15.0 1.0 0.0280 66.391 0.0940
12 15.0 1.5 0.0300 67.923 0.0955
Table 4. Effects and regression coefficients for plastic viscosity, yield point and apparent viscosity
Variable Plastic viscosity Yield point Apparent viscosityEstimated
effectRegression coefficient
p-value Estimated effect
Regression coefficient
p-value
Estimated effect
Regression coefficient
p-value
Constant – 0.00423 0.041 – −0.430 0.009 – 0.00382 0.051
X 0.02095 0.01048 0.000 64.06 32.03 0.000 0.08365 0.04183 0.000
Y 0.00391 0.00196 0.049 4.275 2.137 0.025 0.00741 0.00370 0.004
X² 0.01958 0.00979 0.002 69.83 34.92 0.000 0.08796 0.04398 0.000
XY 0.00492 0.00246 0.043 – – – 0.00718 0.00359 0.009
Page 8 of 18
Afolabi et al., Cogent Engineering (2017), 4: 1287248http://dx.doi.org/10.1080/23311916.2017.1287248
and 1.5 wt.%. In the case of the yield point, a high yield point (>60 Pa) was gotten at a mixture of bentonite content ranging between 14.7 and 15 wt.% and silica nanoparticles >0 wt.% while a low yield point (< 20Pa) would require bentonite content < 12.8 wt.% and silica nanoparticles amounting between 0 and 1.5 wt.% (Figure 1(b)). For the apparent viscosity, a combination of bentonite content >14.4 wt.% and silica nanoparticles amounting to values >0 wt.% would give a high apparent viscos-ity (>0.08 Pas) (Figure 1(c)). In order to obtain a low apparent viscosity (< 0.02Pas), a combination of bentonite content <12.2 wt.% and silica nanoparticles ranging between 0 and 1.5 wt.% is required (Figure 1(c)). Other values of the rheological properties can be obtained between high and low using various combinations of the bentonite content and amount of silica nanoparticles. The plastic vis-cosity, yield point and apparent viscosity were overlaid using Equations (17), (18) and (19) and the contour plot to obtained the feasible region (white) having the preferred characteristics (Figure 2(a)). In overlaying, the bentonite content and amount of silica nanoparticles were the independent vari-ables. The preferred values of all the rheological properties was acquired at any combination within the feasible (or optimized) region. The difference observed amongst the predicted and experimental values was found to be less than 4% based on random check.
5.1.3. Steepest analysis of rheological propertiesIn order to further optimize the rheological properties based on Equations (17) to (19), the method of steepest analysis was applied using the ASCENT macros in Minitab. The variable with the largest regression coefficient among Equations (17) to (19) was chosen as the base factor (bentonite con-tent). Table 5 shows the result of the steepest analysis and this indicates that decrease in the rheo-logical properties was observed through the 7th step after which steps beyond this point resulted in an increase in the rheological properties. Therefore, factors at the 7th step were selected as the optimal variables which minimizes the rheological properties. The optimal solution can also be ob-tained in feasible region (white) of the overlaid contour plots of Figure 2(a).
5.1.4. Effect of bentonite content and silica nanoparticles on rheological propertiesThe introduction of silica nanoparticles into the water based bentonite mud lead to an increase in the values of the rheological properties than the ordinary bentonite mud without the silica nanopar-ticles (Figure 2(b)–(d)]. The improved rheological properties can be explained in terms of the
Figure 1. Contour plots for (a) plastic viscosity, (b) yield point and (c) apparent viscosity.
(a) (b)
(c)

Page 9 of 18
Afolabi et al., Cogent Engineering (2017), 4: 1287248http://dx.doi.org/10.1080/23311916.2017.1287248
dispersion ability of the silica nanoparticles to be well distributed and interact more efficiently on the bentonite clays. Previous characterization of bentonite clay samples has shown that silicon dioxide (or silica) make a large proportion of the chemical composition of bentonite clays (James, Mesubi, Adekola, Odebunmi, & Adekeye, 2008; Karnland, 2010; Lim, Gomes, & Kadir, 2013; Omole, Adeleye, Falode, Malomo, & Oyedeji, 2013). It could be suggested that that the interaction between the silica nanoparticles and the constituent silica compounds in the bentonite clays may explain the increased
Table 5. Points along the path for steepest ascent and descent and observed plastic viscosity, yield point and apparent viscosity of sample at the pointsRun No. Bentonite
content (wt.%)
Silica nanoparticles
(wt.%)
Plastic viscosity
(Pas)
Yield point (Pa)
Apparent viscosity
(Pas)Base 10.65 0.750 0.00413 −0.40496 0.00373
1 Base - 6Δi 36.75 −0.390 0.39348 1,445.60 1.79922
2 Base - 5Δi 32.40 −0.200 0.28279 1,030.01 1.28464
3 Base - 4Δi 28.05 −0.010 0.19042 684.261 0.85619
4 Base - 3Δi 23.70 0.180 0.11637 408.341 0.51388
5 Base - 2Δi 19.35 0.370 0.06064 202.257 0.25769
6 Base - Δi 15.00 0.560 0.02322 66.0085 0.08765
Δi −4.350 0.190
7 Base + Δi 6.300 0.940 0.00336 3.01695 0.00594
8 Base + 2Δi 1.950 1.130 0.02090 76.2742 0.09429
9 Base + 3Δi −2.400 1.320 0.05676 219.366 0.26876
10 Base + 4Δi −6.750 1.510 0.11095 432.295 0.52937
11 Base + 5Δi −11.10 1.700 0.18346 715.058 0.87611
12 Base + 6Δi −62.50 7.440 0.27428 1,067.65 1.30899
Figure 2. (a) Overlaid contour plot for plastic viscosity, yield point and apparent viscosity, (b) effect of silica nanoparticles on plastic viscosity, (c) effect of silica nanoparticles on yield point and (d) effect of silica nanoparticles on apparent viscosity.
(b)
(c) (d)
(a)
Page 10 of 18
Afolabi et al., Cogent Engineering (2017), 4: 1287248http://dx.doi.org/10.1080/23311916.2017.1287248
rheological properties of the silica modified drilling mud. Nanoparticles have high surface areas per volume and this will allow for communication of the nanoparticles with the bentonite matrix and surrounding water-based drilling fluid. The surface area of nanoparticles tends to act as active sites for attachment with functional groups and can impact on chain entanglement and thus produce a variation in the properties of the matrix. Thus, the nanoparticles and base fluid may be linked or bonded together directly or through certain intermediate chemical linkages to improve the rheologi-cal attributes of water based drilling mud. This could also be explained by consideration of synergy of homo-coagulation of between silica nanoparticles and hetero-coagulation of silica nanoparticles with bentonite particles in the suspension (Ismail, Aftab, Ibupoto, & Zolkifile, 2016; Jung et al., 2011). These observations are also corroborated by the regression analysis carried out in Equations (17)–(19) which shows that the interaction (denoted XY) between bentonite content (X) and amount of silica nanoparticles (Y) likewise the interaction between clay particles (denoted X2) have to be in-creased in order to have increased plastic viscosity and apparent viscosity. The yield point on the order tend to increase due to accumulation of solids resulting from the increased amount of nano-particles (Y) and interaction between bentonite particles (X2).
5.2. Rheological models for nano-modified drilling mudFlow attributes and characteristics of the modified bentonite mud was modelled based on the rheo-logical relationship using a hyperbolic model and this was compared to the Herschel Bulkley, Casson and Sisko models as shown in Figures 3–5.
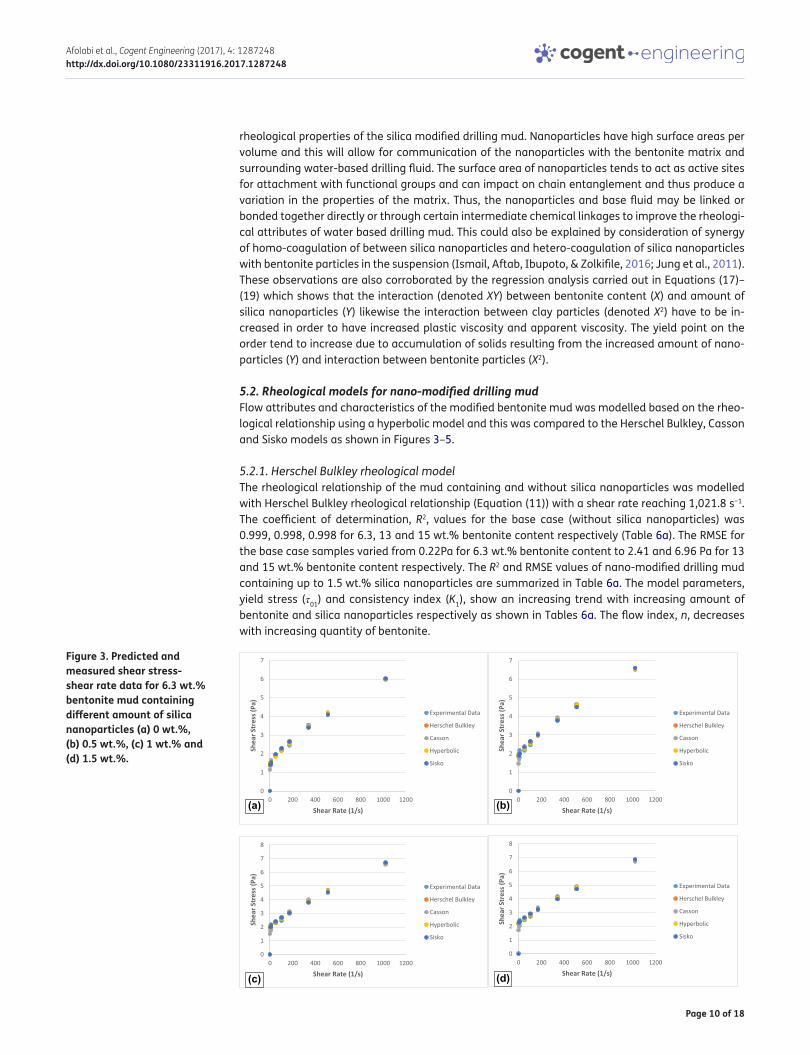
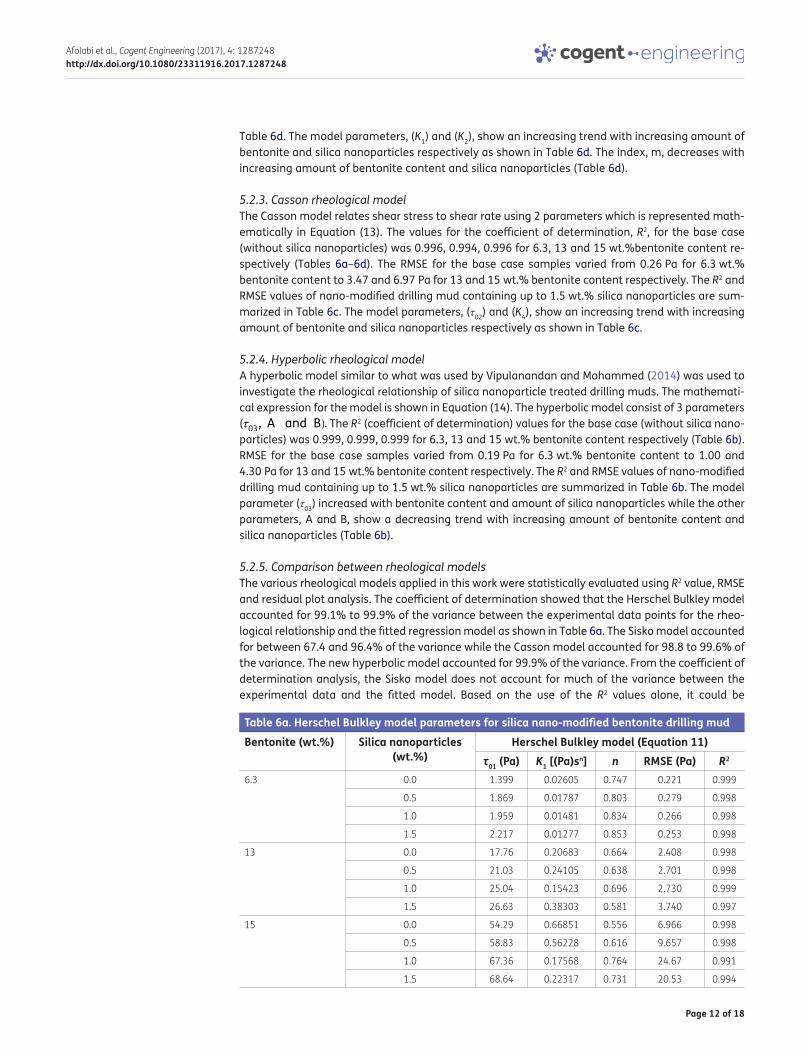
5.2.1. Herschel Bulkley rheological modelThe rheological relationship of the mud containing and without silica nanoparticles was modelled with Herschel Bulkley rheological relationship (Equation (11)) with a shear rate reaching 1,021.8 s−1. The coefficient of determination, R2, values for the base case (without silica nanoparticles) was 0.999, 0.998, 0.998 for 6.3, 13 and 15 wt.% bentonite content respectively (Table 6a). The RMSE for the base case samples varied from 0.22Pa for 6.3 wt.% bentonite content to 2.41 and 6.96 Pa for 13 and 15 wt.% bentonite content respectively. The R2 and RMSE values of nano-modified drilling mud containing up to 1.5 wt.% silica nanoparticles are summarized in Table 6a. The model parameters, yield stress (τ01) and consistency index (K1), show an increasing trend with increasing amount of bentonite and silica nanoparticles respectively as shown in Tables 6a. The flow index, n, decreases with increasing quantity of bentonite.
Figure 3. Predicted and measured shear stress-shear rate data for 6.3 wt.% bentonite mud containing different amount of silica nanoparticles (a) 0 wt.%, (b) 0.5 wt.%, (c) 1 wt.% and (d) 1.5 wt.%.
(a) (b)
(c) (d)
Page 11 of 18
Afolabi et al., Cogent Engineering (2017), 4: 1287248http://dx.doi.org/10.1080/23311916.2017.1287248
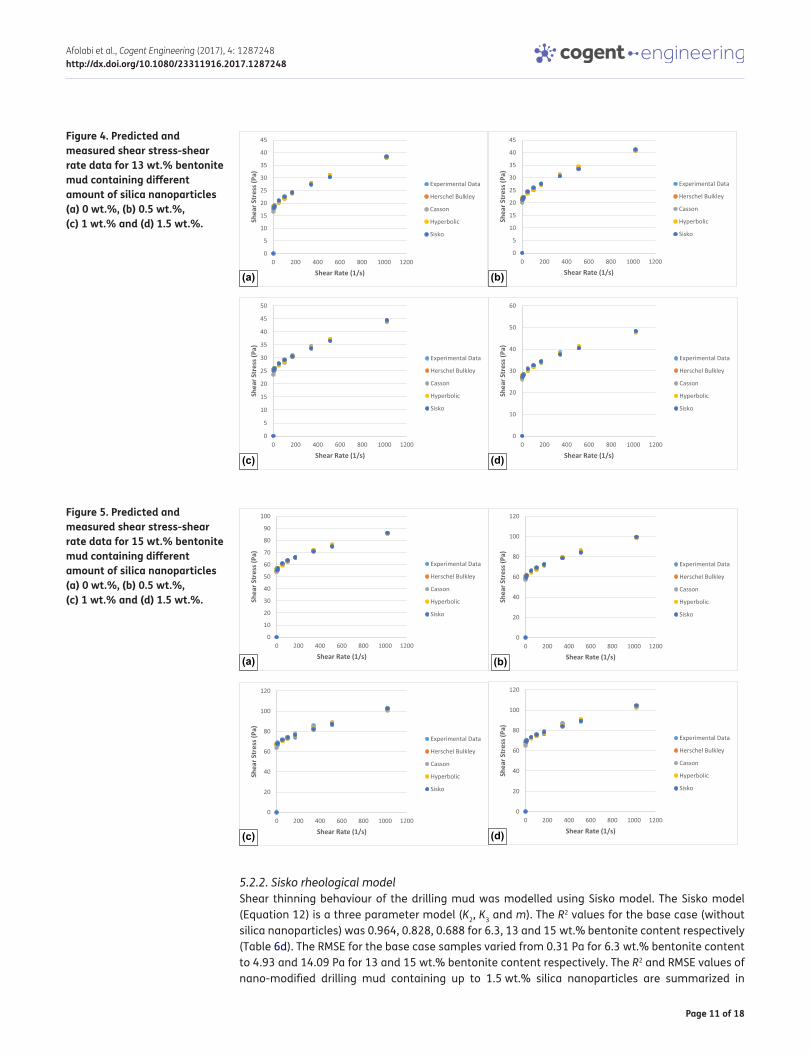
5.2.2. Sisko rheological modelShear thinning behaviour of the drilling mud was modelled using Sisko model. The Sisko model (Equation 12) is a three parameter model (K2, K3 and m). The R2 values for the base case (without silica nanoparticles) was 0.964, 0.828, 0.688 for 6.3, 13 and 15 wt.% bentonite content respectively (Table 6d). The RMSE for the base case samples varied from 0.31 Pa for 6.3 wt.% bentonite content to 4.93 and 14.09 Pa for 13 and 15 wt.% bentonite content respectively. The R2 and RMSE values of nano-modified drilling mud containing up to 1.5 wt.% silica nanoparticles are summarized in
Figure 4. Predicted and measured shear stress-shear rate data for 13 wt.% bentonite mud containing different amount of silica nanoparticles (a) 0 wt.%, (b) 0.5 wt.%, (c) 1 wt.% and (d) 1.5 wt.%.
(a) (b)
(c) (d)
Figure 5. Predicted and measured shear stress-shear rate data for 15 wt.% bentonite mud containing different amount of silica nanoparticles (a) 0 wt.%, (b) 0.5 wt.%, (c) 1 wt.% and (d) 1.5 wt.%.
(a) (b)
(c) (d)
Page 12 of 18
Afolabi et al., Cogent Engineering (2017), 4: 1287248http://dx.doi.org/10.1080/23311916.2017.1287248
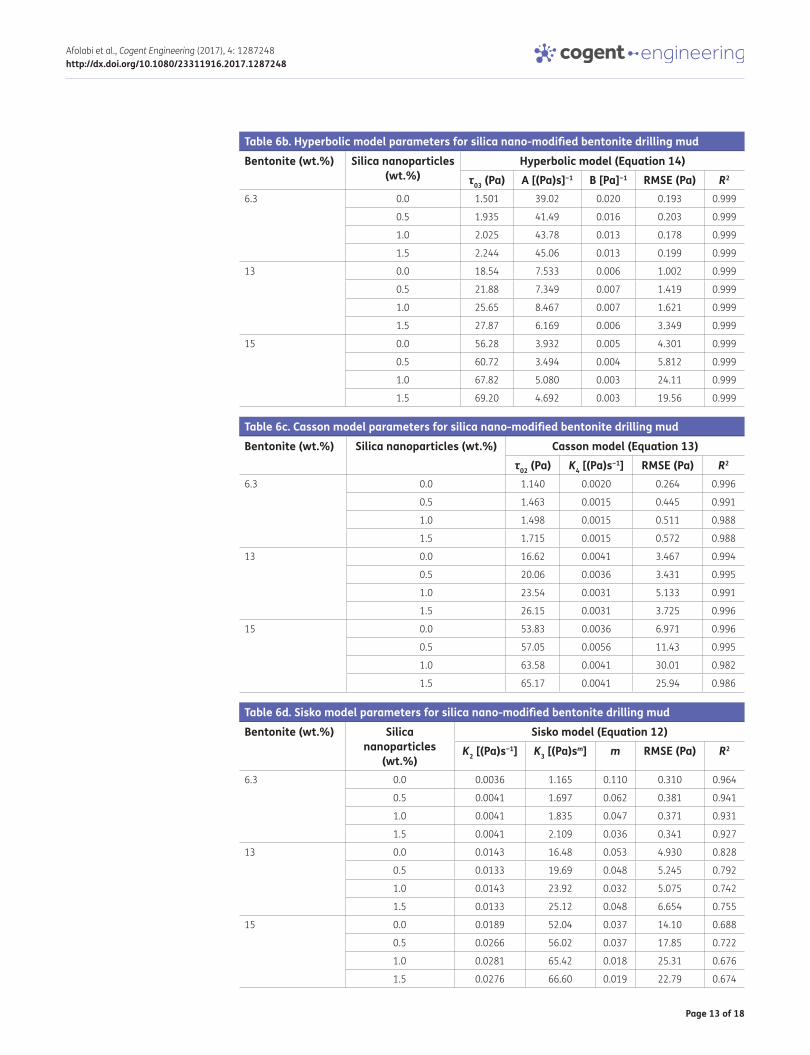
Table 6d. The model parameters, (K1) and (K2), show an increasing trend with increasing amount of bentonite and silica nanoparticles respectively as shown in Table 6d. The index, m, decreases with increasing amount of bentonite content and silica nanoparticles (Table 6d).
5.2.3. Casson rheological modelThe Casson model relates shear stress to shear rate using 2 parameters which is represented math-ematically in Equation (13). The values for the coefficient of determination, R2, for the base case (without silica nanoparticles) was 0.996, 0.994, 0.996 for 6.3, 13 and 15 wt.%bentonite content re-spectively (Tables 6a–6d). The RMSE for the base case samples varied from 0.26 Pa for 6.3 wt.% bentonite content to 3.47 and 6.97 Pa for 13 and 15 wt.% bentonite content respectively. The R2 and RMSE values of nano-modified drilling mud containing up to 1.5 wt.% silica nanoparticles are sum-marized in Table 6c. The model parameters, (τ02) and (K4), show an increasing trend with increasing amount of bentonite and silica nanoparticles respectively as shown in Table 6c.
5.2.4. Hyperbolic rheological modelA hyperbolic model similar to what was used by Vipulanandan and Mohammed (2014) was used to investigate the rheological relationship of silica nanoparticle treated drilling muds. The mathemati-cal expression for the model is shown in Equation (14). The hyperbolic model consist of 3 parameters (�03, A and B). The R2 (coefficient of determination) values for the base case (without silica nano-particles) was 0.999, 0.999, 0.999 for 6.3, 13 and 15 wt.% bentonite content respectively (Table 6b). RMSE for the base case samples varied from 0.19 Pa for 6.3 wt.% bentonite content to 1.00 and 4.30 Pa for 13 and 15 wt.% bentonite content respectively. The R2 and RMSE values of nano-modified drilling mud containing up to 1.5 wt.% silica nanoparticles are summarized in Table 6b. The model parameter (τ03) increased with bentonite content and amount of silica nanoparticles while the other parameters, A and B, show a decreasing trend with increasing amount of bentonite content and silica nanoparticles (Table 6b).
5.2.5. Comparison between rheological modelsThe various rheological models applied in this work were statistically evaluated using R2 value, RMSE and residual plot analysis. The coefficient of determination showed that the Herschel Bulkley model accounted for 99.1% to 99.9% of the variance between the experimental data points for the rheo-logical relationship and the fitted regression model as shown in Table 6a. The Sisko model accounted for between 67.4 and 96.4% of the variance while the Casson model accounted for 98.8 to 99.6% of the variance. The new hyperbolic model accounted for 99.9% of the variance. From the coefficient of determination analysis, the Sisko model does not account for much of the variance between the experimental data and the fitted model. Based on the use of the R2 values alone, it could be
Table 6a. Herschel Bulkley model parameters for silica nano-modified bentonite drilling mudBentonite (wt.%) Silica nanoparticles
(wt.%)Herschel Bulkley model (Equation 11)
τ01 (Pa) K1 [(Pa)sn] n RMSE (Pa) R2
6.3 0.0 1.399 0.02605 0.747 0.221 0.999
0.5 1.869 0.01787 0.803 0.279 0.998
1.0 1.959 0.01481 0.834 0.266 0.998
1.5 2.217 0.01277 0.853 0.253 0.998
13 0.0 17.76 0.20683 0.664 2.408 0.998
0.5 21.03 0.24105 0.638 2.701 0.998
1.0 25.04 0.15423 0.696 2.730 0.999
1.5 26.63 0.38303 0.581 3.740 0.997
15 0.0 54.29 0.66851 0.556 6.966 0.998
0.5 58.83 0.56228 0.616 9.657 0.998
1.0 67.36 0.17568 0.764 24.67 0.991
1.5 68.64 0.22317 0.731 20.53 0.994
Page 13 of 18
Afolabi et al., Cogent Engineering (2017), 4: 1287248http://dx.doi.org/10.1080/23311916.2017.1287248
Table 6b. Hyperbolic model parameters for silica nano-modified bentonite drilling mudBentonite (wt.%) Silica nanoparticles
(wt.%)Hyperbolic model (Equation 14)
τ03 (Pa) A [(Pa)s]−1 B [Pa]−1 RMSE (Pa) R2 6.3 0.0 1.501 39.02 0.020 0.193 0.999
0.5 1.935 41.49 0.016 0.203 0.999
1.0 2.025 43.78 0.013 0.178 0.999
1.5 2.244 45.06 0.013 0.199 0.999
13 0.0 18.54 7.533 0.006 1.002 0.999
0.5 21.88 7.349 0.007 1.419 0.999
1.0 25.65 8.467 0.007 1.621 0.999
1.5 27.87 6.169 0.006 3.349 0.999
15 0.0 56.28 3.932 0.005 4.301 0.999
0.5 60.72 3.494 0.004 5.812 0.999
1.0 67.82 5.080 0.003 24.11 0.999
1.5 69.20 4.692 0.003 19.56 0.999
Table 6c. Casson model parameters for silica nano-modified bentonite drilling mudBentonite (wt.%) Silica nanoparticles (wt.%) Casson model (Equation 13)
τ02 (Pa) K4 [(Pa)s−1] RMSE (Pa) R2
6.3 0.0 1.140 0.0020 0.264 0.996
0.5 1.463 0.0015 0.445 0.991
1.0 1.498 0.0015 0.511 0.988
1.5 1.715 0.0015 0.572 0.988
13 0.0 16.62 0.0041 3.467 0.994
0.5 20.06 0.0036 3.431 0.995
1.0 23.54 0.0031 5.133 0.991
1.5 26.15 0.0031 3.725 0.996
15 0.0 53.83 0.0036 6.971 0.996
0.5 57.05 0.0056 11.43 0.995
1.0 63.58 0.0041 30.01 0.982
1.5 65.17 0.0041 25.94 0.986
Table 6d. Sisko model parameters for silica nano-modified bentonite drilling mudBentonite (wt.%) Silica
nanoparticles (wt.%)
Sisko model (Equation 12)K2 [(Pa)s−1] K3 [(Pa)sm] m RMSE (Pa) R2
6.3 0.0 0.0036 1.165 0.110 0.310 0.964
0.5 0.0041 1.697 0.062 0.381 0.941
1.0 0.0041 1.835 0.047 0.371 0.931
1.5 0.0041 2.109 0.036 0.341 0.927
13 0.0 0.0143 16.48 0.053 4.930 0.828
0.5 0.0133 19.69 0.048 5.245 0.792
1.0 0.0143 23.92 0.032 5.075 0.742
1.5 0.0133 25.12 0.048 6.654 0.755
15 0.0 0.0189 52.04 0.037 14.10 0.688
0.5 0.0266 56.02 0.037 17.85 0.722
1.0 0.0281 65.42 0.018 25.31 0.676
1.5 0.0276 66.60 0.019 22.79 0.674
Page 14 of 18
Afolabi et al., Cogent Engineering (2017), 4: 1287248http://dx.doi.org/10.1080/23311916.2017.1287248
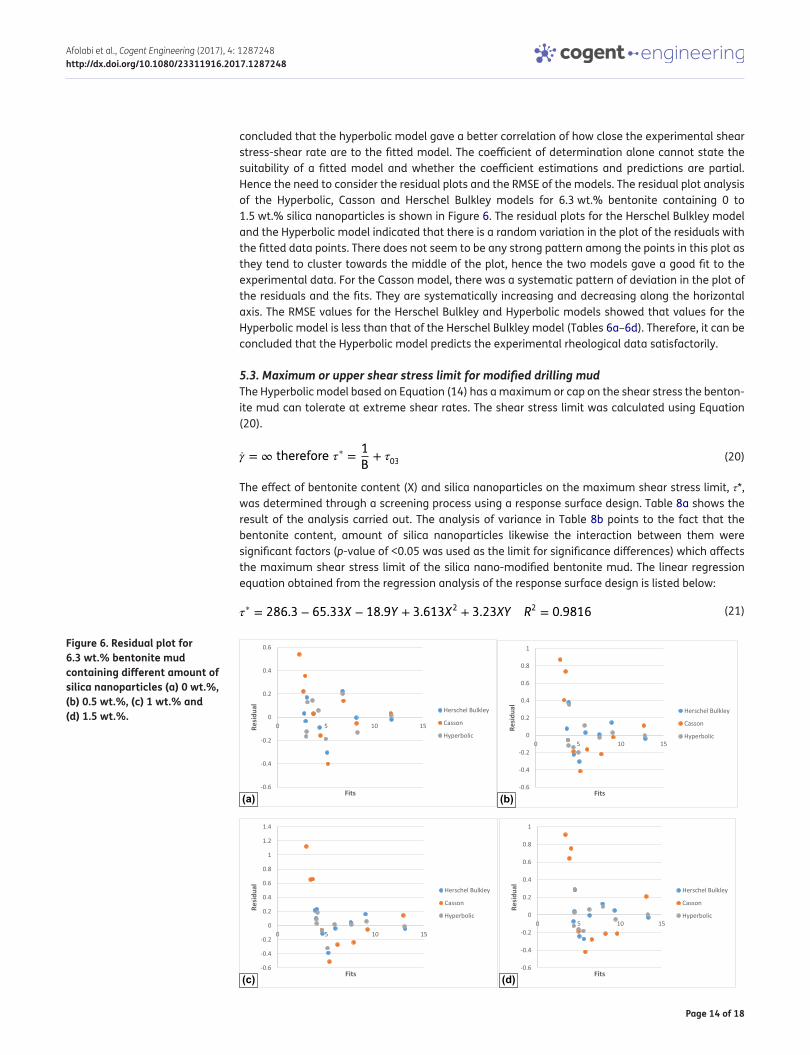
concluded that the hyperbolic model gave a better correlation of how close the experimental shear stress-shear rate are to the fitted model. The coefficient of determination alone cannot state the suitability of a fitted model and whether the coefficient estimations and predictions are partial. Hence the need to consider the residual plots and the RMSE of the models. The residual plot analysis of the Hyperbolic, Casson and Herschel Bulkley models for 6.3 wt.% bentonite containing 0 to 1.5 wt.% silica nanoparticles is shown in Figure 6. The residual plots for the Herschel Bulkley model and the Hyperbolic model indicated that there is a random variation in the plot of the residuals with the fitted data points. There does not seem to be any strong pattern among the points in this plot as they tend to cluster towards the middle of the plot, hence the two models gave a good fit to the experimental data. For the Casson model, there was a systematic pattern of deviation in the plot of the residuals and the fits. They are systematically increasing and decreasing along the horizontal axis. The RMSE values for the Herschel Bulkley and Hyperbolic models showed that values for the Hyperbolic model is less than that of the Herschel Bulkley model (Tables 6a–6d). Therefore, it can be concluded that the Hyperbolic model predicts the experimental rheological data satisfactorily.
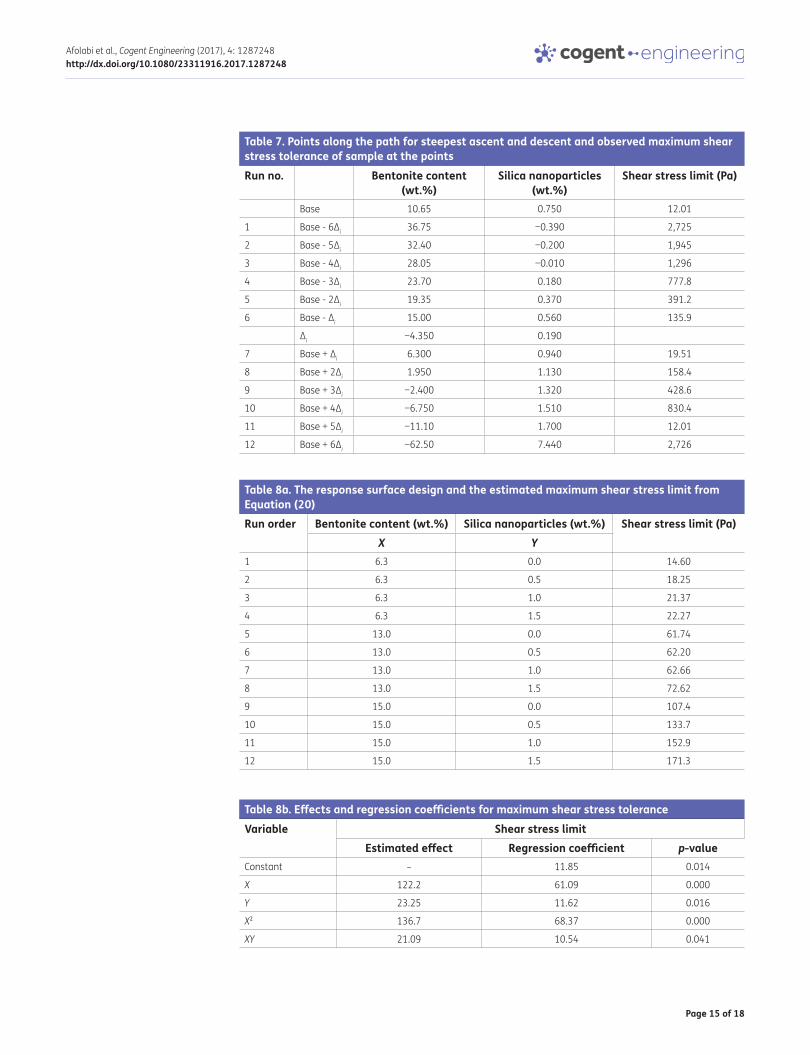
5.3. Maximum or upper shear stress limit for modified drilling mudThe Hyperbolic model based on Equation (14) has a maximum or cap on the shear stress the benton-ite mud can tolerate at extreme shear rates. The shear stress limit was calculated using Equation (20).
The effect of bentonite content (X) and silica nanoparticles on the maximum shear stress limit, τ*, was determined through a screening process using a response surface design. Table 8a shows the result of the analysis carried out. The analysis of variance in Table 8b points to the fact that the bentonite content, amount of silica nanoparticles likewise the interaction between them were significant factors (p-value of <0.05 was used as the limit for significance differences) which affects the maximum shear stress limit of the silica nano-modified bentonite mud. The linear regression equation obtained from the regression analysis of the response surface design is listed below:
(20)�� = ∞ therefore 𝜏∗ =
1
B+ 𝜏03
(21)�∗ = 286.3 − 65.33X − 18.9Y + 3.613X2 + 3.23XY R2 = 0.9816
Figure 6. Residual plot for 6.3 wt.% bentonite mud containing different amount of silica nanoparticles (a) 0 wt.%, (b) 0.5 wt.%, (c) 1 wt.% and (d) 1.5 wt.%.
(a) (b)
(c) (d)
Page 15 of 18
Afolabi et al., Cogent Engineering (2017), 4: 1287248http://dx.doi.org/10.1080/23311916.2017.1287248
Table 7. Points along the path for steepest ascent and descent and observed maximum shear stress tolerance of sample at the pointsRun no. Bentonite content
(wt.%)Silica nanoparticles
(wt.%)Shear stress limit (Pa)
Base 10.65 0.750 12.01
1 Base - 6Δi 36.75 −0.390 2,725
2 Base - 5Δi 32.40 −0.200 1,945
3 Base - 4Δi 28.05 −0.010 1,296
4 Base - 3Δi 23.70 0.180 777.8
5 Base - 2Δi 19.35 0.370 391.2
6 Base - Δi 15.00 0.560 135.9
Δi −4.350 0.190
7 Base + Δi 6.300 0.940 19.51
8 Base + 2Δi 1.950 1.130 158.4
9 Base + 3Δi −2.400 1.320 428.6
10 Base + 4Δi −6.750 1.510 830.4
11 Base + 5Δi −11.10 1.700 12.01
12 Base + 6Δi −62.50 7.440 2,726
Table 8a. The response surface design and the estimated maximum shear stress limit from Equation (20)Run order Bentonite content (wt.%) Silica nanoparticles (wt.%) Shear stress limit (Pa)
X Y1 6.3 0.0 14.60
2 6.3 0.5 18.25
3 6.3 1.0 21.37
4 6.3 1.5 22.27
5 13.0 0.0 61.74
6 13.0 0.5 62.20
7 13.0 1.0 62.66
8 13.0 1.5 72.62
9 15.0 0.0 107.4
10 15.0 0.5 133.7
11 15.0 1.0 152.9
12 15.0 1.5 171.3
Table 8b. Effects and regression coefficients for maximum shear stress toleranceVariable Shear stress limit
Estimated effect Regression coefficient p-valueConstant – 11.85 0.014
X 122.2 61.09 0.000
Y 23.25 11.62 0.016
X² 136.7 68.37 0.000
XY 21.09 10.54 0.041

Page 16 of 18
Afolabi et al., Cogent Engineering (2017), 4: 1287248http://dx.doi.org/10.1080/23311916.2017.1287248
From on Equation (21), the bentonite content (X) and amount of silica nanoparticles (Y) have dif-ferent impact on the maximum shear stress limit. This shows that in maximizing the shear stress limit, the factors or terms in the equation with positive coefficients have to increase while those with negative coefficients must be decreased. Contour plot produced from the regression equation showed that high shear stress limit (>150 Pa) was found at a combination of bentonite content 14.2–15 wt.% and silica nanoparticles greater than 0.4 wt.% (Figure 7(a)) while low maximum shear stress limit (<25.5 Pa) was gotten using a combination of bentonite content <12 wt.% and silica nanoparticles amounting between 0 and 1.5 wt.% (Figure 7(a)). For the overlaid contour plot analy-sis, the bentonite content and amount of silica nanoparticles were the independent variables. The preferred values of the maximum shear stress limit could be acquired at any combination within the feasible (white) region (Figure 7(b)). Further optimization of the shear stress limit based on the method of steepest analysis was applied using the ASCENT macros in Minitab. The variable with the largest regression coefficient among Equation (21) was chosen as the base factor (bentonite con-tent). Table 7 shows the outcome of the steepest analysis and this indicates that a decrease in the maximum shear stress limit was achieved at the 7th step after which steps after this point resulted in high values for the maximum shear stress limit. Therefore, factors at the 7th step were chosen as the optimal variables which minimizes the maximum shear stress limit. The optimal solution can also be obtained in feasible region (white) of the overlaid contour plot of Figure 7(b). The maximum shear stress limit of the drilling mud was observed to increase with increasing bentonite content and amount of silica nanoparticles (Figure 7(c)). Equation (21) shows the regression model of the relationship between the bentonite content and silica nanoparticles. This demonstrates that the interaction (denoted XY) between bentonite content (X) and amount of silica nanoparticles (Y) like-wise the interaction between clay particles (denoted R2) have to be increased in order to have in-creased maximum shear stress limit. Theoretically, the synergy between the interaction between bentonite clay particles and that between bentonite and silica nanoparticles tend to explain the ef-fect on the maximum shear stress limit of the nano-modified drilling mud. In order words, the shear stress limit of the nano-modified mud is enhanced by the interaction (bonding) of the silica nanoparticles within the clay matrix. The large surface area of the nanoparticles provides this bond-ing sites with the clay particles.
Figure 7. (a) Contour plot for shear stress limit, (b) overlaid contour plot for shear stress limit and (c) effect of silica nanoparticles and bentonite content on maximum shear stress limit.
(a)
(c)
(b)
Page 17 of 18
Afolabi et al., Cogent Engineering (2017), 4: 1287248http://dx.doi.org/10.1080/23311916.2017.1287248
6. ConclusionIn this work, the rheological characteristics and maximum or upper shear stress limit of bentonite mud treated with silica nanoparticles was studied. The bentonite mud was modified with up to 1.5% silica nanoparticles by weight. Based on this investigation and rheological modelling, the following conclusions can be drawn:
(1) The addition of silica nanoparticles up to 1.5 wt.% modified the rheological properties and shear stress limit of the bentonite mud. The changes observed in the properties are as a result of the bentonite content and amount of silica nanoparticles in the mud.
(2) The influence of bentonite content and amount of silica nanoparticles on the rheological prop-erties was quantified using a response surface design. An overlaid contour plot and steep method was used to identify the optimal combination of bentonite and silica nanoparticles.
(3) The maximum shear stress limit was predicted using a hyperbolic model while the traditional oil industry models (Herschel Bulkley, Casson, Sisko etc.) can only predict an infinite shear stress limit.
(4) The hyperbolic model was a good fit for the shear stress-shear rate relationship. This was con-cluded based on the residual plot analysis, root mean square error and coefficient of determination.
(5) The hyperbolic relationship estimated the upper shear stress limit produced by 6.3, 13 and 15 wt.% mud as 14.59, 61.74 and 107.4 Pa respectively. The upper shear stress limit of a 1.5 wt.% silica nanoparticle treated 6.3, 13 and 15 wt.% bentonite mud were 22.27, 72.62 and 171.3 Pa respectively.
FundingThe authors received no direct funding for this research.
Author detailsRichard O. Afolabi1
E-mails: [email protected], [email protected] ID: http://orcid.org/0000-0001-8514-6479Oyinkepreye D. Orodu1
E-mail: [email protected] E. Efeovbokhan2
E-mail: [email protected] J. Rotimi1
E-mail: [email protected] ID: http://orcid.org/0000-0002-3166-11061 Department of Petroleum Engineering, Covenant University,
P.M.B 1023, Ota, Ogun State, Nigeria.2 Department of Chemical Engineering, Covenant University,
P.M.B 1023, Ota, Ogun State, Nigeria.
Citation informationCite this article as: Optimizing the rheological properties of silica nano-modified bentonite mud using overlaid contour plot and estimation of maximum or upper shear stress limit, Richard O. Afolabi, Oyinkepreye D. Orodu, Vincent E. Efeovbokhan & Oluwatosin J. Rotimi, Cogent Engineering (2017), 4: 1287248.
ReferencesHoelscher, K. P., Stefano, G., Riley, M., & Young, S. (2012).
Application of nanotechnology in drilling fluids. SPE International Oilfield Nanotechnology Conference (pp. 1–7). Noordwijk: Society of Petroleum Engineers.
Ismail, A. R., Aftab, A., Ibupoto, Z. H., & Zolkifile, N. (2016). The novel approach for the enhancement of rheological properties of water-based drilling fluids by using multi-walled carbon nanotube, nanosilica and glass beads.
Journal of Petroleum Science and Engineering, 139, 264–275. http://dx.doi.org/10.1016/j.petrol.2016.01.036
James, O. O., Mesubi, M. A., Adekola, F. A., Odebunmi, E. O., & Adekeye, J. I. (2008). Beneficiation and characterization of a bentonite from North-Eastern Nigeria. Journal of North Carolina Academy of Science, 124, 154–158.
Jung, C. M., Zhang, R., Chenevert, M., & Sharma, M. (2013). High performance water-based mud using nanoparticles for shale reservoirs. Unconventional Resources Technology Conference (pp. 1–7). Denver, CO: Society of Petroleum Engineers.
Jung, Y., Barry, M., Lee, J.-K., Tran, P., Soong, Y., Martello, D., & Chyu, M. (2011). Effect of nanoparticle-additives on the rheological properties of clay-based fluids at high temperature and high pressure. AADE National Technical Conference and Exhibition (pp. 1–4). Houston, TX: American Association of Drilling Engineers.
Karnland, O. (2010). Chemical and mineralogical characterization of the bentonite buffer for the acceptance control procedure in a KBS-3 repository. Stockholm: Swedish Nuclear Fuel and Waste Management Company/Clay Technology AB.
Lim, S. C., Gomes, C., Kadir, Z. A. A., & Abidin, M. (2013). Characterizing of bentonite with chemical, physical and electrical perspectives for improvement of electrical grounding systems. International Journal of Electrochemical Science, 8, 11429–11447.
Mahmoud, O., Nasr El-Din, H., Vryzas, Z., & Kelessidis, V. (2016). Nanoparticle based drilling fluids for minimizing formation damage in HP/HT applications. SPE International Conference and Exhibition on Formation Damage and Control (pp. 1–26). Lafayette, LA: Society of Petroleum Engineers.
Omole, O., Adeleye, J. O., Falode, O., Malomo, S., & Oyedeji, O. A. (2013). Investigation into the rheological and filtration properties of drilling mud formulated with clays from Northern Nigeria. Journal of Petroleum and Gas Engineering, 4(1), 1–13.
Page 18 of 18
Afolabi et al., Cogent Engineering (2017), 4: 1287248http://dx.doi.org/10.1080/23311916.2017.1287248
© 2017 The Author(s). This open access article is distributed under a Creative Commons Attribution (CC-BY) 4.0 license.You are free to: Share — copy and redistribute the material in any medium or format Adapt — remix, transform, and build upon the material for any purpose, even commercially.The licensor cannot revoke these freedoms as long as you follow the license terms.
Under the following terms:Attribution — You must give appropriate credit, provide a link to the license, and indicate if changes were made. You may do so in any reasonable manner, but not in any way that suggests the licensor endorses you or your use. No additional restrictions You may not apply legal terms or technological measures that legally restrict others from doing anything the license permits.
Cogent Engineering (ISSN: 2331-1916) is published by Cogent OA, part of Taylor & Francis Group. Publishing with Cogent OA ensures:• Immediate, universal access to your article on publication• High visibility and discoverability via the Cogent OA website as well as Taylor & Francis Online• Download and citation statistics for your article• Rapid online publication• Input from, and dialog with, expert editors and editorial boards• Retention of full copyright of your article• Guaranteed legacy preservation of your article• Discounts and waivers for authors in developing regionsSubmit your manuscript to a Cogent OA journal at www.CogentOA.com
Sadeghalvaad, M., & Sabbaghi, S. (2015). The effect of the TiO2/polyacrylamide nanocomposite on water-based drilling fluid properties. Powder Technology, 272, 113–119. http://dx.doi.org/10.1016/j.powtec.2014.11.032
Sehly, K., Chiew, H.-L., Li, H., Song, A., Leong, Y., & Huang, W. (2015). Stability and ageing behaviour and the formulation of potassium-based drilling muds. Applied Clay Science, 104, 309–317. http://dx.doi.org/10.1016/j.clay.2014.12.013
Vipulanandan, C., & Mohammed, A. S. (2014). Hyperbolic rheological model with shear stress limit for acrylamide polymer modified bentonite drilling muds. Journal of
Petroleum Science and Engineering, 122, 38–47. http://dx.doi.org/10.1016/j.petrol.2014.08.004
Vipulanandan, C., Raheem, A., Basirat, B., & Mohammed, A. S. (2014). New kinetic model to characterize the filter cake formation and fluid loss in HPHT process. Offshore Technology Conference (pp. 1–17). Houston, TX: Offshore Technology Conference.
Zakaria, M. F., Husein, M., & Hareland, G. (2012). Novel nanoparticle-Based Drilling Fluid with Improved Characteristics. SPE International Oilfeild Nanotechnology Conference (pp. 1–6). Noordwijk: Society of Petroleum Engineers.