Embed Size (px)
Citation preview

~v~ :::::! ~
~{\~
RUTGERS THE STATE UNIVERSITY OF NEW JERSEY
Onshore Support Bases
for
OCS Oil and Gas Development:
IMPLICATIONS
FOR
NEW JERSEY
Center for Coastal and Environmental Studies

Onshore Support Bases for
OCS Oil and Gas Development:
IMPLICATIONS FOR NEW JERSEY
This report was prepared by the Center for Coastal and Environmental Studies at Rutgers - The State University of New Jersey for the Office of Coastal Zone Management, Division of Marine Services, New Jersey Department of Environmental Protection with financial assistance from the Office of Coastal Zone Management, National Oceanic and Atmospheric Administration, U.S. Department of Commerce, under the provisions of Section 305 of the Federal Coastal Zone Management Act, P.L. 92-583.

Onshore Support Bases for
OCS Oil and Gas Development:
IMPLICATIONS FOR NEW JERSEY
by Bruce H. Hoff Mary T. Sheil Norbert P. Psuty Leland G. Merrill, Jr. James K. Mitchell* George S. MCLaren B. Budd Chavooshian*
Cartography Charles Ogrosky Beth Burcher Philip Caselli Roy Little
September 1977
Dr. Norbert P. Psuty, Director Center for Coastal and Environmental Studies Rutgers - The State University of New Jersey Doolittle Hall - Busch Campus New Brunswick, New Jersey 08903
* Dept. of Environmental Resources - Cook College Rutgers - The State University of New Jersey
iii

'-' ~qlNE SERVICES
~tatr nf Nrru 3Jrrsry DEPARTMENT OF ENVIRONMENTAL
PROTECTION TRENTON
September 1977
Jear Friend of the Coast:
PLEASE ADDRESS REPLY TO:
P. 0. BOX 1889
TRENTON. N. J. 08625
This study, Onshore Support Bases for OCS Oil and Gas Develo ment: Im lications for New Jerse , is the ~atest in t e series o consu tant reports commissioned ~y the Department of Environmental Protection concerning coastal management issues.
This report is part of an on-going process of cefining coastal energy facility siting policies. The st~dy offers intriguing analyses and recommendations that will help federal, state, county, and municipal government officials, industry representatives, and interest groups debate the costs and benefits to New Jersey of offshore activity and make detailed plans ~or related onshore facilities.
We will be very pleased to receive any comments on :his report which will help the Department to carry out ~ts coastal planning responsibilities. Please share your ~~itten comments with me at your convenience.
Thank you for your continuing interest in New ~ersey's coastal management program.
Enclosure
Sincerely yours,
'1/GWlAt-..>~ David N. Kinsey, Chief Office of Coastal Zone Management
v

TABLE OF CONTENTS
LIST OF t-iAPS, TABLES, AND FIGURES Pa9e
ix
ACKNOWLEDGE.HENTS xiii
EXECUTIVE SU~-iARY XV
Chapter 1
Chapter 2
Chapter 3
Chapter 4
Chapter 5
Chapter 6
Chapter 7
Appendices
METHODOLOGY FOR SITING OCS SUPPORT BASES . . . • . . •
GULF COAST AND NORTH SEA PERSPECTIVES ON MIDDLE ATLANTIC OCS DEVELOPHENT . . . . . . . . . • . . . . .
SCENARIOS OF POTENTIAL OIL AND GAS DEVELOPMENT . . . . . . . .
SITE SELECTION
Part One HYPOTHETICAL SITES SELECTED FOR SUPPORT BASE DEVELOPMENT
Part Two NON-SELECTED SITES ..
OPPORTUNITIES FOR THE ASSESS~ffiNT AND REDUCTION OF ADVERSE IMPACTS OF OCS SUPPORT BASE DEVELOPMENT . . . . . .
FUTURE CONFLICTS AND OPPORTUNITIES IN ONSHORE SUPPORT BASE PLANNING
MAJOR FINDINGS, CONCLUSIONS AND REC0t.1MENDATIONS TO NEW JERSEY'S OCZM . . . . . . . • . . . •
1
15
19
63
63
155
167
175
181
A. DERIVATION OF MULTIPLIERS . . . . . • 191 B. STATUTORY NET DEBT LIMIT . • . . 193 C. MEETINGS WITH PUBLIC AND
PRIVATE GROUPS . • . 195 D. FOOTNOTES . . . . . . . . . • . . 203 E. BIBLIOGRAPHY . . . . . . . . • • . . 207 F. PROJECT DESCRIPTION OF NAVIGATION
CHANNELS; U.S. ARMY CORPS OF ENGINEERS . . . . . . . . . . . . . . 215
G. PERMIT HANDBOOK • . . . . . • 225 H. HOSPITAL UTILIZATION REPORTS. . . . . 227
vii

1 2 3
4
5 6 7 8
9
10 11 12 13
14 15 16 17
18
19
LIST OF }1APS, TABLES, AND FIGURES
MAPS
State of New Jersey • . . . • . . . . . . . Atlantic City - Absecon Inlet Topography . . Absecon Inlet - U.S. Army Corps Project
Map • . . . . . . . . . . . . . . . . . Atlantic City - Absecon Inlet - Current
Land Use . . . . . . . . . . . . . . . . . . . Atlantic City - Pleasantville Topography .... N.Y. - N.J. Port Authority District Raritan River - U.S. Army Project Map ... N.Y. and N.J. Channels - U.S. Army Corps
Pro j e c t Map . . . . . . . . . . . . . . Raritan River to Arthur Kill, N.J., Cut-off Channel . . . . . . . . . . . . . .
Perth Amboy Topography . . . . . . . Perth Amboy Site - Current Land Use Cape May Topography . . . . . . . . . . . . Cold Spring Inlet - u.s. Army Corps Project
Map . . . . . . . . . . . . . . . . . • . . Cold Spring Inlet - Cape May Site ...... . Camden Site - Current Land Use . . . .. . Camden Topography Map . . . . . . . Delaware River - U.S. Army Corps Project
t1ap . . . . . . . . . . . . . . . . . . . . . . Maurice River - U.S. Army Corps Project
Map . . . . . . . . . . . . . . . . . . . . . . Manasquan River - U.S. Army Corps Project ~1ap . . . . . . . . . . . . . . . .
TABLES
Chapter 3 3.1 Mobile Rig Activity: Rig Time, Breakdown by
Geographical Areas . . . . . . . . . . . . 3.2 Exploratory Rig Years of Effort Necessary to
Discover Various Resource Levels in the Baltimore Canyon Trough ......... .
3.3 Estimates of Exploratory and Developmental Drilling Rigs Required for Resource Estimates . . . . . . . . . . . . . . . . .
3.4 Direct OCS Employment - Exploratory Opera-
3.5 3.6 3.7 3.8
3.9
tions . . . . . . . . . . . . . . . . . . . Direct Wages Earned - Exploratory Operations . . Adjustments for Economies of Scale . . . . . Permanent Service Base Land Use Requirements Origin of Employment for Development Activities . . . . . . . . . . . . . . . .
Direct OCS Employment and Wages - Permanent Service Bases (Peak Year) . . . . . . . • .
ix
65 69
70
73 85
105 106
107
108 115 117 134"
135 137 147 148
149
157
163
24
25
26
29 29 30 31
32
33

3.10
3.11
3.12
3.13
3.14 3.15
3.16
3.17
3.18
3.19 3.20 3.21 3.22
Employment at Pipeline Installation Service Base and Lay Barge Spread . . . . . .
Wages Paid for Pipeline Installation Service Base and Lay Barge Spread Employment . . . . . . . . . . . .
Employment for Platform Installation Base and Offshore Operations Supporting Platform Installations Per Year . . .
Wages Paid for Platform Installation Related Employment During Peak Year . . .
Diving Repair Base Employment and Wages .... Direct Land Use Demands for the No Find, Medium Find, and High Find Scenarios . . . . . . . . . . . . . . . . . .
Summary of Employment at Support Bases During Peak Year of Activity ........ .
Origin-of-Employment at Support Bases During Peak Year of Activity .....
Wages Earned at Support Bases During Peak Year Activity ............ .
Total OCS-Generated Employment . . . . . . New Resident Population ......... . New Resident Pupil Population .... . Housing Units Demand by New Resident
Employees . . . . . . . . . . . . . .
Chapter 4 4.1 Siting Criteria for a Permanent
4.2
4.3
4.4 4.5 4.6 4.7 4.8
4.9 4.10
4.11
4.12
4.13 4.14
4.15 4.16
4.17
Service Base . . . . . . . . Project Review For Service Base, Atlantic City . . . . . . . . . . . . . . . .
Permits For Construction of Base, Atlantic City .......... .
Permits For Operation, Atlantic City . Typical Fuel Storage Tank Emissions .. Typical Transfer Emissions . . . . . Sources of Noise at Service Bases Materials Transported, Atlantic City
Service B-ase . . . . . . . . . . . . . . Truck Trips, Atlantic City Service Base ... Direct OCS Employment and Wages, Atlantic City ...... .
Project Review For Service Base, Perth Amboy . . . . . . . . . . . . . . .
Permits For Construction of Base, Perth Amboy . . . . . . . . . . . . . . .
Permits For Operation, Perth Amboy Direct OCS Employment and livages, Perth Amboy . . . . . . . . . . . .
Direct OCS Employment and Wages, Cape May Materials Transported, Cape May
Service Base . . . . . . . . . . . . . . Truck Trips, Cape May Service Base ..... .
X
Page
39
40
43
44 47
49
50
51
52 57 58 58
59
67
89
90 92 95 97
100
101 101
102
123
124 126
130 141
142 143

Chapter 7 7.1 Site Selection Summary
1 2 3 4
J?IGURES
Marine Service Base Prototype Atlantic City - Absecon Inlet - Site Plan Perth Amboy - Site Plan Major Phases of OCS Operations
xi
Page 184
3 83
119 182

ACKNOWLEDGEMENTS
The authors wish to express their thanks to the numerous persons in the University, private industry, and Federal, State, and Local governments who contributed information for the preparation of this report. Special thanks are extended to Ms. Lorraine Caruso, Dr. Richard K. Brail, Dr. Joseph Schisler, Mr. Stephen Deeter, and Dr. Karl F. Nordstrom. The cooperation of the New Jersey Cooperative Extension Agents of the coastal counties in assembling data was also appreciated, especially Mr. Charles Dupras, Atlantic County Agent. The assistance of planners in coastal counties was integral to the report and include: Mr. Eugene Ely, Atlantic County Planning Board; Mr. James Fong, Middlesex County Planning Board, Mr. R. Carl Rubalcava, Cape May County Planning Board; Ms. Joan Batory and Mr. Jerry Lennon, Camden County Environmental Agency; Mr. Jack Rosenberg, Monmouth County Planning Board; Dr. Eugene Vivian, Consultant to Burlington County Planning Board; Ms. Judy Scotland and Ms. Czeslawa Zimolzak, Cumberland County Planning Board; Mr. Charles Romink, Gloucester County Planning Board; Ms. Leslie Bennet, Ocean County Planning Board; Mr. Christopher Warren, Salem County Planning Board; and Mr. Joseph Kazar, Union County Planning Board. The following staff persons are warmly thanked for their cooperation in producing the manuscript: Ms. J. Joanna Bednar, Ms. Barbara L. Jackson, Ms. Melinda C. Bellafronte, and Ms~ Joan C. Mackey.
·Xiii

EXECUTIVE SUMMARY
This report details the physical, environmental, social, economic, and institutional impacts of siting the following onshore support facilities for Outer Continental Shelf (OCS) petroleum and natural gas activities on New Jersey's coast:
Temporary Service Bases;
Permanent Service Bases;
Support Bases for Platform lnstallation and Pipeline Installation;
Maintenance and Repair Yards;
Pipe Coating Yards.
Recommendations are made concerning these bases in terms of:
Sites that are suitable and sites that are not suitable for the various support activities;
Estimates of likely benefits and conversely· adverse impacts from construction and operation of various types of bases;
Mitigating measures to minimize potential adverse impacts from these bases;
Guidelines on how to obtain all necessary governmental permits to construct and operate these bases.
Siting requirements are derived from the New England River Basins Commission RALI/Factbook (1976) , and information produced in conferences with industrial representatives. Prospective support base sites from the Northern New Jersey port area, the Atlantic Shoreline, and the Delaware Bay coast up to Camden were considered. Attention was given to sites in the New York - N.J. Port Authority area, Manasquan Inlet, Absecon Inlet (Atlantic City), Cold Spring Inlet (Cape May), Maurice River, and the port of Camden.
Analytical techniques to evaluate these sites were developed and applied. Three levels of petroleum and gas recovery were assumed to provide a no find, medium find, and high find scenario. The impacts were assessed at three levels of support base activities associated with the scenarios.
Several major findings and conclusions resulted from this study. Little impact on New Jersey will result until an actual find is made. The Perth Amboy site for all o~ the bases would produce fewer negative impacts and more beneficial effects than any of the other sites under the
XV

methods of this study. The construction and operating of bases at the Atlantic Coastal sites would produce more negative impacts and fewer beneficial effects than the North Jersey site. Development of a support base at Maurice River was found to yield a preponderance of nega-tive impacts. Camden was found to be too distant from the offshore drilling sites on advice of industry but was found to be satisfactory for limited services.
Not found limiting to base development were labor and social services (except the latter at Atlantic City) . Seriously limiting to the study itself was the lack of detailed natural resource data in the coastal area such as water quality, inventories of the biota, and air quality. Additionally, economic and other social data limited assessment of impacts in that area. Excellent beginnings to accumulate data have been made, but a better base is mandatory. Thus, recommendations are made to the OCZM to increase the data base for natural resources and in the social and legal areas. Additionally, the advantages of redevelopment of empty or abandoned sections of the New Jersey portion of the Port Authority of New York and New Jersey is pointed out as a coastal zone management goal. Conversely, the Atlantic coastal areas (Sandy Hook to Cape May) and Delaware Bay are recommended to be conserved for resorts, recreation, and fishing. The Great B?Y Estuarine System and Cedar Swamp are indicated as candidates for preservation under the Federal Coastal Zone Management Act of 1973 (CZMA). Opportunities to work with other State Departments are pointed out.
For a second level of information in this report, the interested reader should consult Chapter 7 on Major Findings and Conclusions and Recommendations to OCZM. Assuming a positive find of offshore resources, further information is generated in Chapter 5 on Opportunities for the Assessment and Reduction of Adverse Impacts of OCS Support Base Development.
xvi
CHAPTER 1
METHODOLOGY FOR SITING OCS SUPPORT BASES
1.0 Introduction
Onshore support bases are the logistical links between onshore and offshore activities for the exploration, development, and production of oil and gas on the outercontinental shelf. The number and size of the bases and the intensity of activity at the bases is directly related to the amount and spatial distribution of the reserves found on the outercontinental shelf.
In order to model the potential need for support bases, the demands of the support bases on the existing land-based systems, and the impacts of these bases, it is necessary to establish the basis for ascertaining the full range of requirements for these facilities. In this case, service base requirements are derived from the RALI/ Factbook (1976). This publication indentifies the onshore support that accompanies offshore exploration and production and further establishes the criteria for siting. Unless otherwise specified, all values associated with siting of onshore support functions are derived from the RALI/Factbook. Calculations for offshore rigs are based on averages assigned to a 15,000 foot well.
l.l Classification of Support Bases
Onshore support bases perform a variety of functions and are classified in the following manner:
temporary service base
permanent service base
platform and pipeline installation bases
repair and maintenance yards
pipe coating yard
1.1.1 Temporary Service Base
Temporary service bases are facilities to support exploration and exploratory drilling. The bases are comparatively small operations and are usually leased on a short-term basis; however, the service base size and the amount of vessel activity are functions of the number and kinds of exploration vessels and drilling rigs being served.
A temporary base includes: berthage for supply and crew boats, dock space for loading and unloading, warehousing and open storage areas, storage tanks for fuels-

2
water-cements-drilling muds, a helipad, and office and communication facilities.
Base requirements include:
5-10 acres at an all weather harbor
15-20 feet of draft at all levels of tide
200 feet of wharf space per drilling rig (economies of scale exist when more rigs are served)
nearby service facility for repair and maintenance of vessels
facilities for delivery of fresh water - ~5,200,000
gallons/year/rig
facilities for storage of fuel - ~26,000 barrels/ rig/year during drilling
1.1.2 Permanent Service Base
The permanent service base performs essentially the same functions as the temporary base, and is set up after the commercial find has been made to support exploration and development drilling. The land and port area is generally leased on a long-term basis or purchased. The land acreage requirement may range from 20 to 75 acres for each base, depending on the availability of land at dockside and intensity of activity offshore.
To reduce supply boat "turn-around" time and transportation costs, the onshore base location should be within 150 miles of the OCS lease tracts. The other base requirements are the same as described above for a temporary service base.
1.1.3 Platform and Pipeline Installation Bases
A number of vessels, called a "spread", are required for the installation of pipelines or platforms. Bases to supplythese ships and barges are usually set up by the companies involved in the installation process; they require waterfront acreage, warehouse space, and service and maintenance facilities. Siting of the installation service base is usually within close proximity to the platforms or pipelines locations.
Port requirements include:
5 acres of land to support a pipeline installation or up to 4 platforms installations per year

FIGURE 1 MARINE SERVICE BASE PROTOTYPE.
,,II •1'1
22
~3/ 8
/""'-~ I QUAYS/DE FEM:>ERS 2 EXTENDED QUAY-DEEP DRAFT 3 DOLPHIN 4 ROLL ON I ROLL OFF FACIUTY ~ AFT HANDLI4G FACfUT'I" 6 POINTS FOR WATER/FUEL/MOOICEMENT 7 R£1NFORCED AREAS fCK HEAVY LIFTING
n I
·_j
I I I
J =1
24
24
!l QUAY APRON 9 FLOOOI...IGH TlNG TOWERS
10 MtXJ n CEMENT SILOS II WAREHOUSES
r--------,121 I I 9
L _______ .J
24
r-------,
I I L _______ .J
-----24
I
~!
8
16 GASCU'EnAVIATI0'4 FUEL 17 DIESEL FUEL Ia WORKSHOP
12 BASE OPERATDIIS OFFICE· 2nd fbor 13 WAREHOUSE OFFICES
19 EXPLOSIVES STORAGE 20 I'EUCOPTER PAD 21 GUARD MOUSE
14 PORTABLE WATER TANK e DRILL WATER TANK
22 OFFICE 8UILDING Z3 CQAIMI..t\ICA TIONS TOWER 24 OPEN STORAGE
_j
25 RESERVED for F!JTtJR£ EXPANSION
Source: "Marine Service Bases For Offshore Oil Developltlent" Department of Community and Regional Affairs State of Alaska
3

200-400 feet of wharf space for each "spread"
15-20 feet of draft at the dockside at all levels of tide
A waterway five times the width of the largest vessel must be provided to allow for maneuvering if and when such vessels enter the harbor
1.1.4 Repair and Maintenance Yards
Any port supporting recreation and commercial boating activities usually have ship repair facilities located nearby. Existing repair and maintenance firms need only augment their present capabilities to meet the repair and maintenance needs of OCS-related vessels, rigs, fixed offshore platforms, and equipment. However, new demands will occur with specialized diving equipment to work in the offshore zone.
OCS activities require services that include:
Hull repair and maintenance requiring that vessels be partially or completely pulled out of the water
Mechanical repairs to drive trains, diesel engines, gears, and to any equipment onboard a vessel, platform, or rig
Electronic repairs of radio, radar, loran, compasses, fathometers, automatic pilot mechanisms, gyro compasses, etc.
Storage of deep sea submersibles and other diving equipment needed at the rig sites
Repairs may take place at the onsite location, a small yard in the nearby harbor area, or at a major ship yard within towing distance. Services by repair and maintenance firms are required on a 24 hour, seven day per week schedule.
1.1.5 Pipe Coating Yards
Steel pipes that transport oil and gas from the OCS area may be coated with all or some of the following chemicals in order to prevent corrosion and overcome flotation:
asphalt
petroleum thinner
5

6
bituminous mastic compound
polyurethane foam
whitewash mixture of hydrated lime
concrete
iron ore aggregate
The pipes average 40 feet in length and range from 6 to 44 inches in diameter. They are usually coated between April and November, year-round coating operations require special precautions to prevent the mixing, application, and curing water from freezing.
There are two types of pipe coating yards:
permanent plant
portable plant ("railhead operation")
A portable plant is usually set up on 30 acres of land to coat a limited length of pipeline (20-50 miles) in one season. A permanent pipe coating plant is usually established under a long-term contract on 100-150 acres of land. This site is capable of storing 300 miles of pipe of varying sizes.
Siting requirements include:
an area near or adjacent to a waterway (this is ideal, but a site further inland may also be used)
rail access
major highway access
95% of the land area for open storage
soil capable of bearing the weight of large volumes of pipe and raw materials
land surface with no more than three percent slope, it should be well-drained soil with a low water table
750 feet of marginal wharf space to load out two supply barges
channel depth of 20 to 30 feet if iron ore delivered by ship, 10 feet at all levels of tide for barges

1.2 Development of Criteria for Service Bases
1.2.1 Industry's Standards
Proximity to Offshore Lease Sale No. 40
Oil companies prefer to locate service bases in all weather harbors as close as possible to their offshore operations. Exploratory operations supported through temporary service bases, are more flexible in their siting than permanent service bases. Temporary bases are usually leased on a short-term basis and are located as far away from exploratory tracts as 230 miles. This is evident from the intent of oil companies to support exploratory operations for Lease Sale No. 40
7
from Quonset Point, Davisville, Rhode Island. This flexibility is reduced after development drilling commences, because onshore support will be from permanent service bases. Here, long term operating costs of operations must be taken into account. The closer a permanent base is sited to offshore operations, the greater the economies in operating costs. Permanent service bases, therefore, should be sited within 150 miles of the offshore leased tracts.
Channel Depth and Wharf Space
The channel depth required for OCS operations is 15-20 feet mean low water (mlw) . This is required because the supply boats, or workboats as they are sometimes called, and other vessels involved in operations have a draft when fully loaded of 14-18 feet. These are oceangoing vessels ranging in size from 150-225 feet in length with a beam up to 45 feet. Operators prefer a 20 foot draft because it allows a margin of safety in operating these vessels that are valued from two to four million dollars. It also takes into account the fact that a channel dredged to 20 feet may in fact be less than that due to shoaling and natural processes occuring shortly after dredging.
The wharf space required is dictated by the size of the vessel utilized. The oceangoing vessels, of more recent design, will require 200 feet of wharf space to allow them to load the required supplies for OCS drilling. This 200 feet per rig for wharf space is the commonly accepted standard for deepwater OCS operations. This number is reduced when more than one rig is serviced from a base and economies are realized.
Transportation Access
Transportation access is a very important criteria in siting. Good access permits rapid and efficient

8
movement of materials that must be delivered to support bases. Four modes of transportation are discussed as related to OCS activities: water, rail, highway, and air.
The most important factor in water transportation is the transfer of materials from support bases to the ocs by supply boats. These operations strive to minimize "turn around time", the time needed to load a boat and return to the offshore rigs. Harbors that have easy access to ocean waters and minimal conflicts with other types of traffic are preferred by supply boat operators. This minimizes turn around times and operating costs by permitting the maximum number of trips in a time period.
In addition to supply boats, other kinds of vessels are used in OCS activities. Coated pipes are normally loaded on barges or workboats to be delivered to offshore pipelaying areas. A dockside area, although not needed for pipe coating yards, is required for the loading of coated pipe shipped by rail or highway from the pipe coating yard. While it is possible that the shipment of drilling muds, cements, and pipes may be made by sea rather than over land, it is not a normal mode of transport for these materials.
Rail access to dockside is the preferred method of shipment of supplies to a base. Materials that are shipped from plants in the Gulf area, such as drilling muds, would be moved more efficiently by rail. If rail to dockside is not obtainable, supplies are shipped to a railhead area and then loaded on trucks for delivery. The same method would be employed for cements, tubular goods, and various other supplies. Therefore, direct rail access would minimize impacts on road networks adjacent to bases.
Highway access is essential if rail does not service a site. Interstate highways with limited access are preferred because they reduce travel times and expenses in the delivery of supplies to a base. The closer a limited access highway is to a site, the better that site meets transportation criteria. Designated u.s. Highways and State Highways are alternatives which receive good but less desirable designations. These roads normally accommodate truck traffic and are designated as commercial routes. Access to a site that would require extensive travel on local streets that normally do not accommodate such traffic, would cause conflicts with local traffic and generally be incompatible for performance and safety reasons.
Air access is needed to facilitate the transfer of crews by helicopter to the offshore rigs, as well as the need for airports that can transfer crews back to their home states. Good air access also allows supervisory

personnel to move from their headquarters in the Gulf Coast to the offshore sites in the shortest amount of time. Thus, an airport that has scheduled service or can accommodate charter service is preferred.
Acreage Required
The acreage required for onshore support bases is dependent on the type of base sited. Pipe coating yards require 100 to 150 acres for a permanent yard and a railhead operation requires 30 acres. Approximately 5 acres of land are required for a base supporting a pipeline installation or up to four platform installations per year. Acreage requirements for temporary and permanent service bases are estimated at 5 acres per offshore drilling rig. This would include open storage space, parking, warehouses, and a helicopter pad. The transfer of helicopter operations and associated parking to an airport facility will reduce the acreage per rig to 3.5 acres. Permanent service bases are usually 20 acres or greater in size, thus permitting economies of scale and more efficient operation.
Fresh Water Delivery Capabilities
For each rig engaged in exploratory and development drilling, approximately 5,200,000 gallons of fresh water per year is required. Of this amount, 460,000 gallons must be potable for drinking and cooking purposes. This translates into approximately 14,250 gallons per rig per day. These figures are based on each rig drilling four 15,000 foot wells per year. As the depth of wells drilled varies, so will the requirements for fresh water. This water is usually obtained from a municipal water supply system and is pumped into holding tanks below deck in a supply boat. The water is then transported to the drilling site and off-loaded through flexible hoses.
Soil Bearing Capacity
Certain areas at support bases require high load bearing capacity soils. These areas include: storage areas for coated and uncoated pipes, apron areas at service bases, and the internal road networks over which supplies are moved. The bearing capacity needed for storage of coated and uncoated pipes is dependent upon the size of the pipe and the stacking heights. The apron area at a service base is the area adjacent to dockside that is reinforced to facilitate the loading of supplies. This area would support mobile cranes of 15 to 125 ton capacities and storage tanks for drilling muds, cements, and possibly water and fuel. The loads produced by these tanks are dependent upon the height of the tank constructed and the specific gravity of its contents. Drilling muds have a specific gravity of approximately 2.0, and therefore,
9

10
exert higher loads than fuels or water. However, if a constraining factor for a site was soil bearing capacity, it could be overcome through engineering techniques. 1 To accurately access any site, test borings must be made to determine the ability of that land to bear loads.
Repair and Maintenance Facilities
Repair and maintenance yards that employ skilled labor capable of repairing diesel engines, electronic equipment, hulls and rigs are essential to OCS operations. These facilities are generally of two types; boat repair facilities and specialized rig and platform related repairs. Boat and electronic repairs usually occur at a boat yard, but can be accomplished by skilled crews at service bases on a 24 hour basis. Only if major repairs are needed will a boat require servicing at a shipyard. Minimizing down time is important in keeping operating costs low and efficient. Rig and platform related repairs are performed at sea and are supported from onshore bases of generally less than 5 acres.
Labor Market Conditions
Two labor factors enter into siting criteria; unemployment rates and unions. Oil companies would prefer to site in an area where unemployment is relatively high so that they could draw from a labor pool without causinq wages to rise appreciably. The existence of a labor pool also allows for the selection of employees with the desired skills.
The presence of unions may affect the siting of a support base. Wage levels for OCS related employment have traditionally been high when compared to other industrial jobs in the area. This has discouraged the formation of unions that might interfere with these operations. Industry sources have stated that work stoppage or slow downs by unions would pose not only economic problems but safety hazards as well. Supplies and equipment required to maintain safety standards and prevent well blow outs are needed in a timely manner to prevent injury to personnel and damage to the environment. Union practices, it is feared, might interupt the delivery of supplies and precipitate such a crisis. In a recent survey conducted by "Ocean Industry", a trade magazine, it was pointed out that when the primary base of operation is expanded outside the Gulf Coast area, the specter of unions looms on the horizon. 2 It should be noted that unions have become more flexible in their demands and have realized that some of their practices have caused jobs to move elsewhere. Recent experience in Perth Amboy, in attracting a steel company, for example, has shown that unions are willing to negotiate new work practices.

Social Infrastructure
In an effort to meet the needs of their personnel, oil companies will try to choose an area that has some
11
social infrastructure. Cinemas, recreational activities, and night time entertainment are considered important in keeping the worker happy and therefore productive. Support base areas also require a full complement of services necessary for the family including schools and hospitals. These requirements are generally met in New Jersey, with the northern part of the state delivering more of such services because of its urbanization.
Quality of Life
There has been some concern expressed about the "quality of life" in New Jersey. Executives who will direct operations, if bases are sited in New Jersey, are apprehensive about living conditions in the New York metropolitan area, and the quality of services delivered. An executive's conception of an area's living conditions will affect his desire to site in an area as well as the ability to retain key personnel.
Political Constraints
Oil company representatives have indicated that one reason for siting a service base in Davisville, Rhode Island was political acceptance. The governor of that state met with the oil companies and invited them to set up operations at the former naval base.
The industry realizes that they are often viewed as the uncooperative corporation that surreptitously plans facilities without regard to community policies and constraints. In order to overcome this negative image, the industry has been very receptive t·o invitations from local and State officials to meet and discuss OCS operations. Public relations personnel, technicians, and executives from the American Petroleum Institute, Exxon, Shell, Texaco, and other companies have spent a considerable amount of time meeting with various representatives of states that are located along the Atlantic Coast. The intent of the industry is to provide information on onshore and offshore operations, establish lines of communications, and assess the political atmosphere. Where state or local policies and regulations are negative toward OCS development, industry representatives have indicated that they will attempt to site facilities outside those areas.
1.2.2 Environmental and Socio-economic Criteria
12
Ecosystem of an Area
Development in environmentally sensitive areas supporting a productive ecosystem should be avoided. An environmental assessment of an area should be performed to determine the impact and feasibility of the construction of service bases. The assessment should include data on topography, geology, wildlife, water quality, and marine productivity.
Compatibility with Surrounding Land and Water Uses
A support base should be compatible with uses that are adjacent and nearby. It should conform with municipal master plans and should not conflict with residential areas, recreational uses, resort-commercial activities, or historic sites. An inventory of the surrounding land and water uses must be conducted to determine compatibility of support base operations with those uses.
Capabilities of Local Services
In siting a support base, demands are placed ~pon the infrastructure of a locality to deliver services to the base and the new population generated by such an activity. A support base will place further demands on the water supply and sewer facilities of a locality. In addition, the population growth requires the delivery of police, fire, educational, heath care, and other social servicesQ In order to assess these new demands, the infrastructure must be examined to determine how services are delivered at present and what are the capacities to absorb growth and expand services. The assessment should include an analysis of the debt limitation of the municipality and county authorities that deliver these services.
1.3 Application of Support Base Criteria to New Jersey Sites
Planning for development and for preservation of our resource base is one of the responsibilities of the New Jersey Office of Coastal Zone Management in the Department of Environmental Protection. A specific planning process has been identified in a Program Development statement delivered to the Washington OCZM (1976). 3 The process includes the presentation of basic resource inventory information followed by analysis of impacts, opportunities, and constraints. The end product is a synthesis which approaches a solution by virtue of the relative weight of negative and positive factors.
This study will follow an approach similar to that cited above in an attempt to identify the many factors that apply in site selection for support base development. The purpose is to run through the procedures and better define the model

for site evaluation. The siting criteria previously identified will be placed against specific sites. Advantages of the sites will be detailed as well as probable impacts and the constraints that apply. Based on an analysis of the positive and negative factors, a conclusion will be reached that will be site specific but will also apply to the broad category of ecologic and land use systems of which that site is a member. Thus, the site evaluation process will produce information on support base development in much of the coastal zone of New Jersey.
13


CHAPTER 2
GULF COAST AND SCOTTISH NORTH SEA PERSPECTIVES ON MIDDLE ATLANTIC OCS DEVELOPMENT
2.1 Introduction Several areas of the world have recently experienced
offshore oil and gas development similar to that which is contemplated off the coast of New Jersey (e.g. Arabian Gulf, Bass Strait, North Sea, Santa Barbara Channel, Gulf of Mexico). Experiences in two of these areas, the Scottish North Sea and the U.S. Gulf Coast, is sufficiently well-documented to provide baselines for assessing the likely general pattern of onshore consequences of OCS exploration in the middle Atlantic region.
Although no definitive studies have been undertaken, it is generally assumed that, on balance, the Gulf Coast oil and gas industry has had detrimental physical effects, mixed social consequences, and beneficial economic results in onshore areas. 1 This contrasts with Scotland. There, impacts on the physical environment have been negligible. Except in a few sites, economic benefits have been conferred on some regions with costs being disproportionately borne by oil-impacted localities, and highly disruptive social, political, and other consequences have occurred. 2 By comparison, it seems likely that New Jersey would suffer more serious physical disruptions than Scotland, but perhaps less deleterious problems than those of the central Gulf Coast. Further, the socio-economic impacts on the state are likely-to be serious in the event of a large "strike", but this is more attributable to the size and density of New Jersey's population and its attendant land use demands, than - as in the Scottish case - to its social and economic heterogeneity.
_A detailed comparison of onshore effects requires consideration of at least 8 major parameters:
offshore physical environment size and areal distribution of the resource base timing and speed of offshore development spatial pattern of offshore development size of onshore area affected physical characteristics of the onshore area socio-economic, policy, and planning aspects of the onshore area linkages to attendant processing and marketing demands
2.2 U.S. Gulf Coast of Mexico The Gulf of Mexico is a relatively shallow and calm
weather environment which encompasses the majority of proven U.S. offshore hydrocarbon reserves. These resources are distributed among inland fields, oil and gas pockets lying below the extensive wetlands and lagoons of Louisiana and Texas, and in submerged Gulf tracts. For the past 30 years, the pattern of new development has shifted gradually seaward

16
toward waters of 200-600 ft. and greater depths. Offshore exploration has shifted seaward throughout this period, with new finds occurring generally on the fringes of already developing areas.
Little OCS-related or other settlement occurs along the hurricane-, subsidence-, and erosion-plagued Louisiana Gulf Coast. Elsewhere, onshore facilities tend to be located in protected sites away from the open coastline. Onshore support bases, service and repair centers, platform fabrication yards, pipelines and pipe coating plants, processing and distribution facilities are scattered along harbors, rivers, bays, bayous, and artificial channels at various distances from the 1500 mile shoreline stretching between Brownsville and Tampa.
The Gulf Coast is a low-lying, lightly populated, predominately rural area, highly dependent on agriculture and fishing. It has a history of limited land use and environmental quality controls and of public policies favorable to large scale coastal zone industrialization. A vast integrated oil, gas, and petrochemical industry developed since the end of World War II now supplies products to major markets throughout the northeastern and midwestern United States.
Destruction of wetlands by pipeline excavations and drainage derangement has been a major problem along the Gulf Coast. Health and safety hazards connected with hazardous substances in refineries and petrochemical industries, and widespread associated air and water pollution are also serious negative impacts. Some small nearshore support base communities have experienced disruptive competition for dock and harbor space between recreational and commercial fishing boats and OCS supply vessels. Further, although oil and gas facilities are major employers and tax revenue generators in many counties and parishes, they also impose significant demands for public services on local communities. 3 Despite the negative environmental and social effects, the economic base of Louisiana and, to a lesser extent, Texas is heavily dependent on offshore oil and gas related income.
2.3 Scotland Scottish offshore waters are deep, cold and stormy, and
are characterized by unstable sea bed conditions. Oil and gas reserves are located more than 100 miles offshore in 2 distinct mid-sea areas. Within less than 10 years, a major new OCS province has been discovered, explored, and brought into production at a scale sufficient to supply most, and eventually all, of Britain's domestic oil and gas demands.
Most OCS related facilities are located on, or close to, the 300 mile long Scottish east coast. This is an area of hard rocky headlands, plentiful natural and man-made harbors, scattered sand~ beaches, and few wetlands. There are no significant flood, subsidence, erosion, or other natural hazards onshore.

The coastal region contains a mixture of closely settled agricultural land, fishing communities, small market towns and tourist centers, and large diversified industrial and commercial cities. Land use and environmental planning controls are theoretically strong but, in practice, of varying efficacy. Apart from limited oil facilities in the heavily developed Central Lowlands, between Glasgow and Edinburgh, the Scottish hinterland lacks an oil and gas industry similar to that of the u.s. Gulf Coast. Most products are now destined for English markets or overseas ~xport.
Negative OCS related impacts included crowded harbors, which helped drive fishing crews away from oil support ports; severely strained public transportatio~ and infrastructure systems, such as housing shortages; and heavy demands on limited supplies of developable land. Labor shortages developed and a labor force migrated from the rural hinterland to urbanizing areas in the north of Scotland. Highly paid oil support workers from Scotland and foreign countries caused the dislocation of locals by outbidding them for the limited supply of housing and local services. Foreign workers caused particular concern because they were not socially and culturally compatible with the resident populations and the Government's failure to provide sufficient housing and public services exacerbated the conditions. Traditional Scottish industries and those attracted by recent public subsidies under economic development plans began to decay. Large scale industrialization penetrated remote, scenically attractive areas that previously held semisubsistence economies. The regional planning strategy of focused and balanced industrialization was outflanked, and the political support for regional independence of Scotland from the United Kingdom was greatly strengthened. In contrast, northeast Scotland was one of the few areas of the British Isles to escape economic stagnation during the early 1970's.
2.4 Prospects for New Jersey OCS development impacts in the middle Atlantic region
are unlikely to coincide with either the Gulf Coast of Scottish experiences. Instead, some combination of both is to be expected.
With its environmentally sensitive combination of heavily used barrier islands and fragile wetlands exposed to serious storm, flood, and erosion hazards, and its lack of good natural deepwater harbors, the New Jersey coast is especially vulnerable to landscape modifications which usually accompany large scale industrialization. The Pine Barrens, containing rare and endangered species, provides a recreational preserve for the megalopolitan corridor and overlies the State's premier untapped fresh water reserves. These pinelands are highly susceptible to ecosystem disruptions by pipelines, gas processing plants, and related :acilities. Maritime salt water intrusion and severely overtaxed water supply and waste treatment systems are virtually endemic to the New Jersey oceanfront counties.
17

18
Local resorts and in recent years the development of residential communities have been burdened by a sustained inmigration of people in search of permanent homes and vacation residences.
Concentrations of oil refineries, petrochemical plants, and other attendant facilities presently exist in the state in the lower Raritan Valley and near Raritan Bay, and provides for only one-quarter of the voracious regional demand for fuel and petroleum products. These industries are largely responsible for the region's failure to meet air quality standards. Expansion induced by Baltimore Canyon oil and gas discoveries may result in new facilities being located in the industrial sections or closer to New Jersey's relatively unpolluted Atlantic shoreline. Links between these facilities and public health problems have been suggested and could prove to have adverse impacts on the recreational and tourist activities as well.
Clearly, open spaces, recreational land, relatively unmodified ecosystems, productive wetlands, fresh underground water, unpolluted air, inshore fisheries, and boating areas are at a premium in the nation's most urbanized state. The possibility of additional coastal zone growth due to casino gambling in Atlantic City; nuclear power stations, or energy parks, in Ocean and Salem counties; offshore nuclear power plants; deepwater ports; retirement communities; and necessary transportation system improvements underscores the increased loadings that would result from OCS support facilities in the Atlantic coastal zone. While the latter do not necessarily generate catastrophic negative impacts by themselves, they may lead to further industrialization in the development and production phases of oil and gas recovery, thus, paving the way for large scale modification of hitherto undeveloped sites, and may act synergistically with the previously noted activities to significantly reduce the quality of life, and drive up the cost of living, in the coastal zone.

CHAPTER 3
SCENARIOS OF POTENTIAL OIL AND GAS DEVELOPMENT
3.1 Introduction
It is necessary to estimate the onshore impacts that might result from OCS exploration and development. This is accomplished by assessing the implications of the Gulf Coast and Scottish North Sea experiences on the Mid-Atlantic region and by developing three postulated OCS scenarios: No Find, Medium Find and High Find. The impact of each of the scenarios may be established by the following three measures:
1. Assignment of amounts of recoverable resources to each scenario from published estimates;
2. Projection of the number of drilling rigs required to discover and recover those resources; and
3. Calculation of the type and amount of onshore support required for drilling rigs and the recovery of the associated reserves.
The impact analysis is performed for each of the 3 scenarios and is specific in terms of the type, amount, and timing of onshore support.
The No Find Scenario will require only helicopter base operations in New Jersey, whereas, the Medium and High Find scenarios will need a full complement of services including helicopter base operations, permanent service bases, pipe coating yards, pipeline and platform installation bases, and repair and maintenance yards.
In order to develop these scenarios, a number of assumptions are made:
1. The method of exploration and recovery of resources will continue to be separate activities;
2. Resources will be transported to landfall areas by pipelines;
3. The demands for exploratory rigs and platform construction will be met in a reasonable amount of time;
4. Helicopter operations will occur in the Atlantic City region, thus, reducing acreage requirements at service bases; and

20
5. The leased tr,acts will be developed in a manner consistent with_ ~edexal laws and policies at the time of the sale in August, l976.
Estimates- are made for each s.cenario to determine the direct OCS land use demands and direct employment opportunities. Given this information, conclusions may be reached as to the degree of development and its associated socio-economic impacts. These estimates of impacts are conservative because in all liklihood ocs support will be provided from other Mid-Atlantic states as well as New Jers_ey.
3.2 Methodology for Establishing Scenarios
3.2.l Introduction
Resource potential estimates for the Mid-Atla~~ic, Baltimore Canyon are addressed in this section. Estimates of resources for Lease Sale No. 40 have been made by various Federal agencies, but only fragmentary information is known about subsequent lease sales te.g. No. 49 and No. 59). However, t~is fragmentary information has been taken into accou~t along with_ published estimates to give a more realistic picture of eventual development pressures o~ the New Jersey zone.
Since no exploratory wells have ever been drilled off the Atlantic Coast, all present estimates of recoverable hydrocarbon resources in the Baltimore Canyon are merely educated guesses. Most are scaled down versions of national estimates which are then-selves subject to wide variations. It is quite possible tha.t economically recoverable oil or gas deposits will not be found in the Baltimore Canyon. Alternatively, it is also possible that very large fields of either of both resources will be discovered. Oil company spokesmen suggest that, of the approximately 10 off-shore "frontier" regions being considered for exploration under the 1974 accelerated OCS leasing prograw, tracts off the Mid-Atlantic coast rank perhaps third in resource potential. 1
The existing range of Baltimore Canyon resource estimates varies from 2.4-5.2 billion barrels of oil (bbls), and 2.5-16.2 trillion cubic feet of natural gas. 2 Although the Federal Appeals Court lifted a ban imposed by a Federal District Court in Brooklyn, New York on August 25, 1977, the possibility still exists of further delays if the decision is appealed to the U.S. Supreme Court by Suffolk County, New York or environmental groups. If such delays in

exploration continue, it is possible that subsequent lease sale exploration could begin shortly thereafter, thereby increasing the exploration effort required for rapid recovery.
Three levels of resource recovery have been selected to illustrate exploration scenarios:
1. Zero discovery of oil or gas (No Find Scenario);
2. 1.4-2.6 billion barrels of oil and 4.4-8.1 trillion cubic feet of natural gas discovered (Medium Find Scenario) ; and
3. 5.2 billion barrels of oil and 1.6 trillion cubic feet of natural gas discovered (High Find Scenario) .
For each scenario, no account is taken of different spatial and temporal patterns of discovery, unexpected delays after exploration drilling commences, and significant changes in the price of oil or gas which would affect recoverable resource potentials.
3.2.2 Exploratory Operations Derivation
In combination with the 3 levels of resource recovery, 3 methods have been utilized to determine numbers and timing of exploration rigs off the New Jersey coast:
(a) A range of published estimates of rig requirements for Lease Sale No. 40 and related Baltimore Canyon exploration is available from documents prepared by the Bureau of Land Management, consultants to ·the American Petroleum Institute, the Council of Environmental Quality, and the Congressional Office of Technology Assessment. 3
(b) Total rig commitments can be estimated on the basis of assumptions about drilling rates and thoroughness of exploration; and
(c) Rig commitment data are available for analagous oil and gas fields in the Gulf Coast and the North Sea.
Published Estimates
From published data it can be deduced that 10-20 exploration rigs may be required at any one time during
21

22
the maximum exploration phase in the Uedium Recovery Scenario. Assuming proportionate effort, up to 40 exploration rigs may be required to discover 5.2 billion barrels of oil and l6.2 trillion cubic feet of natural gas (High Recovery Scenario) . For a medium find, exploration drilling may continue over a l5 year period with most activity occurring within the first 5 to 7 years. During the peak period it is estimated that drilling will occur at the rate o: 4 wells/rig/year. No information is presently available in the length of the exploration period for larger finds. 4 The extent of the overlap bet~ee~ exploration and development drilling is unk~o~~. but the period of greatest drilling intensity waul~ probably occur 5-10 years after the start of exploration.
One source has estimated that 200-800 development wells could be drilled from a 10-15 year per~od to recover 0.4-2.6 billion barrels of oil and a proportionate quantity of natural gas (i.e. MediUI:l Recovery Scenariol. Assuming that 1/5 of these wells are drilled in the peak activity year, this represents a ~4xinurn drilling rate of approximately 4 wells/platforr:i/·year.
Drilling Assumptions
93 tracts have been leased as a consequence ~: QCS Sale No. 40. Further sales may produce acdit~o~al leases in adjacent areas. The theoretical ~~p€r limit for number of exploration wells is apprcxi~~tely l per tract. Such a heavy expenditure o: dr~::~~~ effort is unlikely in practice. Many tracts w~:: probably remain undrilled but some will recie·:e ::-JOre than one exploration well.
If all Lease Sale No. 40 tracts are dril:~~. 93 exploration wells will be completed. At t~e ra~e ::: 3 wells/rig/year, this requires a total o: 31 ex:::::ration rig years of effort. Industry sources s~;;es~ that most exploration drilling will take place :~ ~~e initial 2 years of offshore activity. Data :r~= ::::shore fields with longer exploration time hor:zo~s ind~cate that 1/4 to 1/3 of total exploratlC~ •e::s are drilled in the peak activity year. 7~~s, a~ average of 8 to 15 exploration rigs may be :le-cessar~· during the peak activity year. As a general r~:e, double this number of rigs will be working at ~~e maximum perios of activity within that year (1.e. l6 to 30 rigs).
As previously noted, such intense levels o! exploration are unlikely Actual number of explora-

tion rigs will be somewhat less than thes.e tota.ls. However, such. reducti.ons. may be more than offset by exploratory drilling in nearby later leased sa.le tracts. This may overlap in time with Lease Sale No. 40 exploration. Since complete exploration assumptions are not related to total reserves discovered, these figures have not been pro-rated for Medium and High Find Scenarios.
Analogous Oil and Gas Provinces - MAFLA and North Sea Experiences
The recent Florida (MAFLA) experience provides some indication of the likely scale of exploration in a situation where no recoverable resources are found. A total of $1.49 billion was paid for 87 tracts in the eastern Gulf of Mexico on December 20, l974. After 14 months of drilling and 15 dry holes, active exploration has been abandoned in this area. 5 Minimal onshore impacts occurred during this period.
Given the larger numbers of tracts and favorable geological structures, and the slower and more difficult drilling conditions off the Mid-Atlantic coast, a similar unsuccessful exploration effort in the Lease Sale No. 40 area would produce approximately 18 holes over a 16 month period using 5-6 exploration rigs.
Six rigs, based in Davisville, Rhode Island, were already under contract for such work prior to the voiding of Lease Sale No. 40 by the federal court's action (February 1977). Assuming that all explora-tion companies continue to find Davisville a satisfactory site, although some have expressed dissatisfaction, it is thus unlikely that - apart from a helicopter base in the Atlantic City area - any other New Jersey facility would be utilized for offshore support under the No Find Scenario.
Two areas of the British North Sea have produced commercial oil and gas discoveries within the past 7 years. Differences between the intensity of exploration and the size of proven reserves for the Southern Scottish and the Shetland regions illustrate divergent exploration scenarios. It is likely that Baltimore Canyon exploration will bear some similarity to one or the other pattern.
23

Mobile Rig Activity: Rig Time (in 1964 1965 1966
East of Shetland
Southern Scotland
East of England Q~02 2.6 6.4
West of Shetland
West of England
Total All Areas 0.02 2.6 6.4
TABLE 3.1
rig years) Breakdown by GeograEhical Areas 1967 1968 1969 1970 1971 1972
0.8 2.7
0.8 0.8 2.1 2.2 3.2 4.1
8.0 5.2 5.3 3.1 1.2 1.9
0.1
0.3
8.8 6.0 7.7 5.3 5.2 8.8
1973 1974 1975 Total (1964-75
6.9 12.4 13.6 36.4
3.8 8.2 12.0 37.2
2.5 1.7 1.6 39.52
1.5 0.3 1.9
0.1 0.7 0.2 1.3
13.3 24.5 27.7 116.36
Source: U.K. Dept. of Energy Development of Oil and Gas Resources of the United Kingdom. London, 1976
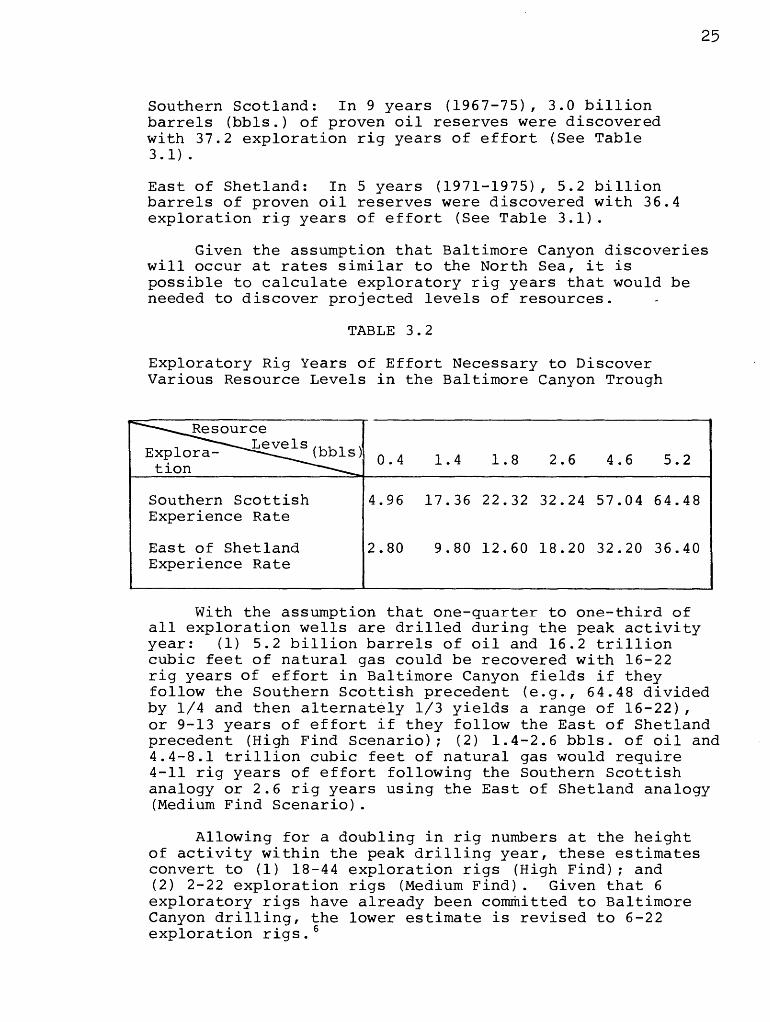
Southern Scotland: In 9 years (1967-75), 3.0 billion barrels (bbls.) of proven oil reserves were discovered with 37.2 exploration rig years of effort (See Table 3. 1) .
East of Shetland: In 5 years (1971-1975), 5.2 billion barrels of proven oil reserves were discovered with 36.4 exploration rig years of effort (See Table 3.1).
25
Given the assumption that Baltimore Canyon discoveries will occur at rates similar to the North Sea, it is possible to calculate exploratory rig years that would be needed to discover projected levels of resources.
TABLE 3.2
Exploratory Rig Years of Effort Necessary to Discover Various Resource Levels in the Baltimore Canyon Trough
Resource Levels(bbls)
0.4 1.4 1.8 2.6 4.6 5.2
Southern Scottish Experience Rate
4.96 17.36 22.32 32.24 57.04 64.48
East of Shetland Experience Rate
2.80 9.80 12.60 18.20 32.20 36.40
With the assumption that one-quarter to one-third of all exploration wells are drilled during the peak activity year: (1) 5.2 billion barrels of oil and 16.2 trillion cubic feet of natural gas could be recovered with 16-22 rig years of effort in Baltimore Canyon fields if they follow the Southern Scottish precedent (e.g., 64.48 divided by 1/4 and then alternately 1/3 yields a range of 16-22), or 9-13 years of effort if they follow the East of Shetland precedent (High Find Scenario); (2) 1.4-2.6 bbls. of oil and 4.4-8.1 trillion cubic feet of natural gas would require 4-11 rig years of effort following the Southern Scottish analogy or 2.6 rig years using the East of Shetland analogy (Medium Find Scenario) .
Allowing for a doubling in rig numbers at the height of activity within the peak drilling year, these estimates convert to (1) 18-44 exploration rigs (High Find); and (2) 2-22 exploration rigs (Medium Find). Given that 6 exploratory rigs have already been committed to Baltimore Canyon drilling, the lower estimate is revised to 6-22 exploration rigs. 6
26 \
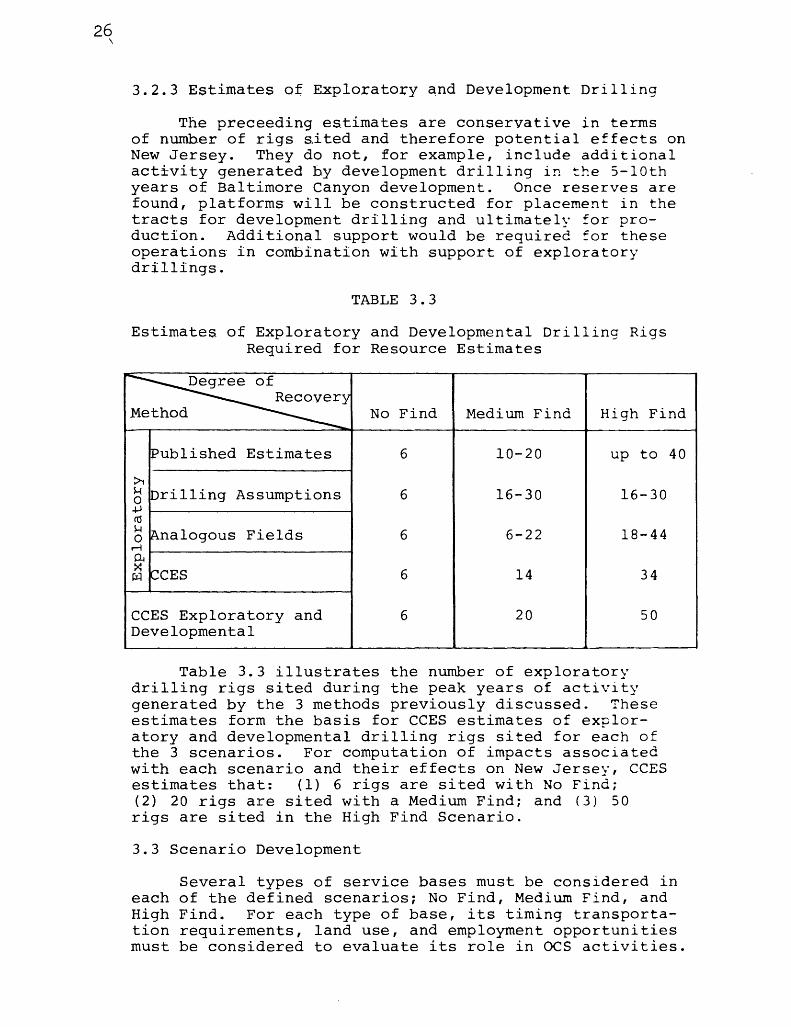
3.2.3 Estimates of Exploratory and Development Drilling
The preceeding estimates are conservative in terms of number of rigs sited and therefore potential effects on New Jersey. They do not, for example, include additional activity generated by development drilling in ~he 5-lOth years of Baltimore Canyon development. Once reserves are found, platforms· will be constructed for placement in the tracts for development drilling and ultimately for production. Additional support would be required for these operations in combination with support of exploratory drillings.
TABLE 3.3
Estimates of Exploratory and Developmental Drilling Rigs Required for Resource Estimates
~ No Find Medium Find High Find
~ublished Estimates 6 10-20 up to
>t k ~rilling Assumptions 6 16-30 16-30 0 +J ctl k Analogous Fields 6 6-22 18-44 0
l""""l 04
~ CCES 6 14 34
CCES Exploratory and 6 20 50 Developmental
Table 3.3 illustrates the number of exploratory drilling rigs sited during the peak years of activity generated by the 3 methods previously discussed. These estimates form the basis for CCES estimates of exploratory and developmental drilling rigs sited for each of the 3 scenarios. For computation of impacts associated with each scenario and their effects on New Jersey, CCES estimates that: (1) 6 rigs are sited with No Find; (2) 20 rigs are sited with a Medium Find; and (3) 50 rigs are sited in the High Find Scenario.
3.3 Scenario Development
40
Several types of service bases must be considered in each of the defined scenarios; No Find, Medium Find, and High Find. For each type of base, its timing transportation requirements, land use, and employment opportunities must be considered to evaluate its role in OCS activities.

3.3.1 Temporary Service Bases
Application
Support bases of this type normally service exploratory drilling rigs utilizing both supply boats
27
and helicopters. With the information presently available, New Jersey will support helicopter base operations in the Atlantic City region while supply boats will be based in Quonset Point, Davisville, Rhode Island. Helicopter operations are very distance sensitive because of operating costs and safety factors, thus precluding their operation from areas as far away as Davisville. The helicopters will transfer drilling crews, supervisory personnel, and will provide any emergency services that might be required. The helicopter base will be the only facility required under the No Find Scenario and will be the initial base sited for both the Medium and High Find Scenarios.
Timing
Temporary service bases are the first type of base to be established to support OCS exploratory operations. A single helicopter site of 5 acres will support 6 exploration rigs for a period of 1 to 1~ years. If reserves are not found during the initial period, operations will decline and end after 5 years. If reserves are found, activity will increase and will achieve the requirements estimated for the Medium and High Find Scenarios.
Transportation Requirements
Each exploratory rig requires one helicopter to change crews and provide service that may be needed. Since only 6 rigs will be sited on the OCS and will not be clustered, there is little chance that economies of scale can be applied to helicopter operations. Six helicopters are therefore needed to support initial exploratory operations from a temporary service base.
Land Use
Helicopter operations, when located individually at a service base, require 1 acre for a landing area and approximately one-half acre of parking for drilling crews and helicopter personnel. With the clustering of helicopter operations at one base, economies will reduce the acreage needed for the landing and operations area. The total acreage required for the base is estimated to be 5 acres with 2 acres assigned to operations areas and 3 acres to parking.

28
Employment and Wages:
Two employment opportunities will exist !or se~ Jersey residents due to the location of the helicopter base; drilling crews and helicopter personnel. It is estimated that helicopters will require a ere• of 3 a~d an exploratory drilliriq ri9 crew will employ an average of 7 2 pers-ons per rig. 7 W1 th_ 6 helicopters a:1d E exploration rigs sited, a total of 450 positior.s ~ill be available.
These positions will not necessarily be fi:led by New Jersey residents because they have limited :cb experience in this f.ield. Information preser.ted by the Offshore Operators Committee concerning Lease sa:e ~o. 40, and later for Lease Sale No. 43, contains origin of employment data for Exploration Operations.~ Emp~O)Tient was broken down into three categories; local ~ire, r.ew resident and non-resident. Local hire refers to enployees who currently reside in New Jersey; new reside:1t e~ployee means individuals who do not currently reside ir. ~ew Jersey but who will move here to work and establish residencies; and by non-resident is meant employees who do not currently reside in New Jersey, but will commute to work from their homes outside of New Jersey. Commuting to work from great distances is possible during exploratory operations because drilling rig crews might work a l4 day on/14 day off schedule.
Combining the origin-of-employment projections with the projected employment opportunities and assigning a yearly wage of $17,000 as used in the RALI/Factbook, totals by origin-of-employment and wages earned may be calculated (See Tables 3.4 and 3.5).
3.3.2 Permanent Service Bases
Application
Once recoverable resources are found, oil and service companies will attempt to locate permanent service bases as close as possible to the leased tracts, usually within a 150 mile radius. From these bases, both exploratory and development rigs would be serviced using supply boats. Helicopter operations will continue out of the Atlantic City area and all employment and land use associated with helicopter operation is assigned to that location in this analysis. The permanent service base is associated with the Medium and High Find Scenarios which require support for 20 and 50 rigs respectively.

Exploratory Rig Crews
Helicopter Crews
rE:xploratory Rig Crews
Employees per unit
72
3
TABLE 3.4 Direct OCS Employment -· Exploratory Operations
% Local Local % New #of Units Employment Employment Resident
6 36 156 32
6 50 9 50
TABLE 3.5
New Resident %Non- Non-Employment Resident Resident
138 32 138
9 N/A N/A
Source: RALI/FACTBOOK Offshore Operators Committee
Direct Wages Earned - Exploratory Operations (6 Rigs)
Local Hire
New Resident
Total for New Jersey
NonResident Total
$2,652,000 $2,346,000 $4,998,000 $2,346,000 $7,344,000
r·----------------~------------------------------------------------------------------------------, ~eli copter
Crews 153,000 153,000 306,000 N/A 306,000
r--·-----------------~-----------------------------------------------------------------------------;
~ub-Total 2,805,000 2,489,000 5,304,000 2,346,000 7,650,000
Source: RALI/FACTBOOK Offshore Operators Committee N
\.0

30
Timing
A permanent service base will be sited as early as possible after recoverable resources are found. A base could be constructed and in operation as early as two years after exploration begins if required permit procedures were initiated in a timely manner. The base or bases would continue to support OCS operations throughout an expected life span of 25 to 35 years. The peak activity period for the High Find is projected to be Years 9 and 10 when the greatest number of exploratory and developmental drilling rigs will be sited, whereas, the peak activity period for the Medium Find will occur slightly sooner in Years 7 and 8. After Year 10, activity will decline as the number of drilling rigs sited is reduced and production platforms require only periodic workover servicing.
Transportation Requirements
The number of helicopters and supply boats required in each scenario is determined by the number of rigs that are sited and will be supported from onshore bases. An examination of the distances that will probably be travelled by supply boats and helicopters indicates that up to a 150 mile limit 2 supply boats and 1 helicopter per rig will be required. However, with the level of projected activities for both scenarios, economies of scale are applicable to the number of supply boats and helicopters required (See Table 3. 6) .
Table 3.6 Adjustments ~or Economies of Scale
Helicopters Supply Boats Onshore Employment Standard Reduction Standard Reduction Standard Reduction
Total In Units Total In Units Total In Units Computation Required Computation Required Computation Required
1-5 0 1-5 0-1 7-9 1 6-8 1 6-9 1-2 10-13 2 9-11 2 10-14 2-3 14-18 3
12-14 3 15-18 3-4 19-23 4 15-17 4 19-22 4-5 24-28 5 18-20 5 23-25 5-6 29-33 6 21-23 6 26-28 6-7 34-38 7 24-26 7 29-30 7-8 39-43 8 27-29 8 31-32 8-9 44-48 9
Source: Estimates for New England/NERBC
Therefore, by extrapolating from the above table, the number of helicopters required in the Medium Find is
. reduced from 20 to ~ and for the High Find a 28% economy is applied to reduce the number required from 50 to ~-

31
Supply boat requirements are not reduced directly from Tahle, 3.6 hecause the distance to some tracts from service bases might exceed the previously noted 150 mile limit. This factor and economies of scale have been taken into account resulting in a projected 20% economy for supply boat operations. As a result, supply. boats required for the Medium Find are reduced from 40 to 32 while the High. Find requirements are reduced from lOO~o 80.
Land Use
A permanent service base will require 3.5 acres per rig for dockside operations for each rig serviced, with acreage for helicopter operations assigned to airports in the Atlantic City area. With economies of scale, the dockside acreage required may be reduced by 20% while the helicopter operation and service area may be reduced by 50%. Land use requirements are summarized in Table 3.7 for each scenario.
TABLE 3.7 Permanent Service Base Land Use Requirements
(acres)
~ Helicopter
Helicopter Operations 0 Dockside Operations Parking
Medium Find 56 8 10 20 Rigs
High Find 140 18 20 50 Rigs
Berth and Wharf Space: A 200 foot marginal wharf is needed for each rig that is being serviced offshore. However, economies of scale are applicable just as it was for land use. The RALI/Factbook suggests that a 25% economy can be applied if a number of rigs or platforms are being serviced from a permanent service base. The marginal wharf space required to service 20 rigs in the Medium Find is 3,000 linear feet and to service 50 rigs in the High Find it is 7,500 linear feet.
Employment and Wages
Three employment areas are directly related to permanent service base operation: onshore, transportation, and offshore.
Onshore support base employment for material handling is estimated to be 5 persons per rig serviced. Economies of scale are applicable from Table 3.6 and result in onshore employment of 80 in the Medium Find and 200 in the High Find.

32
Transportation employment includes crews of supply boats and helicopters. Supply boat employment is projected at 20 per vessel while helicopters will have a crew of 3. Thus, total transportation employment for the Medium Find is 685 and 1,708 for the High Find.
Offshore employment for drilling rig crews is estimated to be 64 per drilling rig. This number is an average of employment on exploratory and development rigs. It is used because the peak activity years (Years 7-10) will include both exploration and development drilling. Drilling rig crew employment will be 1280 in the Medium Find and 3200 in the High Find.
The skills required on exploratory drilling rigs and development rigs are essentially the same. Therefore, individuals with required skills can fill positions on either an exploratory or development rig. This allows calculations to be made for operations that will occur simultaneously. Industry representatives have indicated that they will strive to employ local personnel quickly to minimize the costs of transporting non-resident crews from their home states to the New Jersey area. Consequently, the origin-of-employment for development activities is used to calculate employment patterns during the peak activity years when both developmental and exploratory drilling rigs will be in operation (See Table 3. 8) .
TABLE 3.8 Origin of Employment for Development Activities
Drilling Rig Crews
Supply Boat Crews
aelicopter Crews
Onshore Base Crews
50
82
74
100
New % Resident
50
18
26
Non- % Resident
N/A
N/A
N/A
N/A
Source: Offshore Operators Committee, Hay 1976
Direct OCS employment and wages for permanent service base operations and drilling rig employment is summarized in Table 3.9. In the Medium Find, 1278 job opportunities will be filled by local hire and 767 by new resident employees. The High Find employs 3192 locals and new resident employment is projected to be 1916.

Medium Find
Employment 20 Rigs
Wages $
High Find
Employment so. Rigs
Wages $
TABLE 3.9
Direct OCS Employment and Wages - Permanent Service Bases
Peak Year
He li co_pter Supply Boats Onshore Crews Drilling Rig Crews Local New Local New Local New Local New Hire Resident Hire Resident Hire Resident Hire Resident Total
33 12 525 115 80 N/A 640 640 2,.045
561,000 204,000 8,925,000 1,955,000 1,360,000 N/A 10,880,000 10,880,000 $34,765,000
80 28 1,312 288 200 N/A 1,600 1,600 5,108
1,360,000 476,000 22,304,000 4,896,000 3,400,000 N/A 27,200,000 27,200,000 $86,836,000

34
3.3.3 ~ipe Coating Yards
Application
When recoverable resources are found in sufficient amounts to make it economically feasible to construct pipelines that transport reserves to shore, coated pipe will be needed to conduct the crude oil and gas . Pipes are coated with a combination of mastic coatings, sand, cement and iron ore for subsea placement and are then shipped directly to offshore installation sites or through permanent service bases.
In order to project the demands of pipe coating activities in New Jersey, a number of factors must be taken into consideration:
1. Amount of Reserves Discovered 2. Spatial Distribution of the Fund 3. Composition of Find - % oil, % gas 4. Number of Platforms Necessary to Recover Find 5. Routes of Pipelines to Landfall Areas
5.1 Legal Constraints 5.2 Political Constraints
6. Miles of Pipeline Needed by Diameter 7. Period Over Which Pipe Is Laid 8. Ability of Existing Pipe Coating Companies in
New Jersey to Fill Demands 9. Amount of Coated Pipe Supplied From Other Areas
Because there are information voids concerning some of the above factors, best estimates are necessary to perform the calculations of the amount of coated pipe required in each scenario. It is assumed that 300-400 miles of coated subsea pipeline will be needed in the Medium Find scenario to transport resources toandfall sites and 400-600 miles in the High Find.
Timirrg
The need for coated pipe depends on how soon recoverable resources are found and if any environmental or legal constraints delay pipeline installation. Without such delays it is expected that in the beginning of Year 3 demands for coated pipe will be generated in the High Find Scenario and in Year 4 for the Medium Find. Major transport lines are expected to be completed within three years of initial pipe coating and laying operations unless a major new find is made later in life of OCS operations. Once major pipe line requirements are met, the demand for coated pipe will decline. However, pipe of smaller diameter will be needed to add new collector lines from production platforms that may be sited up to 20 years after initial OCS operations. Therefore it can be seen that peak activity for pipe coating yards comes relatively early in the life of OCS operations, but that a continuing need for smaller diameter pipe will occur as the development continues.

Transportation Requirements
A pipe coating yard must have rail access to receive shipments of steel pipe from mills outside of New Jersey. If a pipe coating yard is sited at dockside, coating materials can be shipped directly to the yard and coated pipes can be placed on barges for shipment to offshore areas. If a yard is located inland, good highway access is required if coated pipe is to be shipped by highway to port areas for transshipment to offshore areas.
Land Use
35
Two types of plants can be established to meet the demand for coated pipes. One of these could be a permanent plant of approximately 100 acres. An alternative is to create a portable "railhead" plant of about 30 acres.
A permanent plant would be established if and when a long-term pipe coating contract has been executed with a pipeline owner or operator, or the opportunity to capture a large enough share of the market exists to justify the initial capital investment of $8 to $10 million.
A portable or "railhead operation" may be built on a smaller leased parcel of land. A 30 acre site using leased mobile equipment could coat a minimum of 50 miles of pipe per year. With proper scheduling of operations and the transportation of coated pipe immediately following its 28 day curing period, throughput could be increased.
With either base, approximately 95% of the land is used for open storage and parking, with 5% used for the coating operation. Proper scheduling reduces storage expenses and facilitates the flow of coated pipe to the pipe laying area.
It is projected that a portable plant requiring 30 acres would be sited for the Medium Find and a permanent plant of 100 acres would be sited for the High Find Scenario.
Berth and Wharf Space: A pipe coating yard does not necessarily have to be sited at a waterfront site. Pipe can be coated at an inland site and then be shipped to a waterfront site with ocean access. At this loading site, 750 feet of marginal wharf is preferred to permit two supply barges to be loaded simultaneously. A minimum channel depth of 10 feet is required for these barges.
Employment
Pipe coating yards, whether permanent or portable operations, employ approximately 175 workers during the

peak period of the coating operation. Within that peak year, operations will occur during April through October when freezing temperatures would not interfere with the curing of coated pipes. Since no special skills are required for employees at a pipe coating yard, they would be drawn completely from the local labor force.
Workers will average $11,500 per year in wages with employment over a 7 to 8 month period. Wages paid for pipe coating in a peak year, for both scenarios, will be $2,012,500. The difference between the Medium and High Scenario is that peak employment will be of longer duration in the High Find than in the Medium Find Scenario.
3.3.4 Pipeline Installation Bases
Application
The number and acreage of bases required for servicing pipeline installation in each scenario is determined by numerous factors. The most important of these factors being:
1. location of pipelines
2. number of pipelines being installed
3. diameter of pipelines
4. period over which pipeline is laid
5. number of companies laying pipe
It is projected that one platform installation base will be needed in the Medium Find and two in the High Find Scenario. Each base will support a "lay barge spread" (defined below) the pipelaying vessel and its support vessels. During the actual construction phase, it will be necessary to transfer crews to the vessels by helicopter. Thus, further demands will be placed in the Atlantic City helicopter base.
Timing
As in the case of pipe coating yards, most activity will take place in Years 3-7 when major transmission lines are completed. Later activity will continue at a reduced scale with the installation of gathering pipelines connecting the production platforms with the major transmission lines.
Transportation Requirements
A pipeline installation base will support one "lay barge spread" which consists of the following:

"Lay Barge Spread"
Lay Barge
Tugboat - to move lay barge
5 Cargo Barges
3 Tugs - to tow cargo barges
Jet Barge - buries pipeline
2 Tugs - to tow jet barge
1 Supply Boat
1 Helicopter
One "spread" will be in operation in the Medium Find Scenario and two will be operating during the peak year in the High Find Scenario.
Land Use
A pipeline installation base required approximately 5 acres per "spread" supported. Approximately 1.5 acres will be used for helicopter operations and related parking. One base would be required in the Medium Find and the High Find Scenario will require the siting of two bases with 7 acres utilized at dockside and 2 acres (economies are included) for helicopter operations. A helicopter operations base may not necessarily be located in the Atlantic City area. If a pipeline has a landfall in
37
Monmouth County, for example, helicopter operations may occur from an airport within the county if economies exist.
Berth and Wharf Space: A base would require a minimum of 200 feet of marginal wharf for each "spread" serviced. This is required for the supply boat which transports food, fuel, water equipment and supplies. Hence, 200 feet of marginal wharf is required in the Medium Find and 400 feet in the High Find Scenario.
Employment
The number of employees is determined by the personnel required by each "lay barge spread". Although much of the employment is offshore, the personnel must move through helicopter operations bases that support pipeline installations. For this reason, the offshore personnel are included as part of pipeline installation service base employment.
A "spread" employs approximately 300 people. Thus, 300 people will be employed in the Medium· Find and 600

in the High Find Scenario. Table 3.10 illustrates the types, numbers, and origin-of-employment for a single "lay barge spread". Double the employment in each category for the High Find Scenario.
Pipeline installation is a relatively short-term operation, as expressed in months worked per year and the number of years with high employment opportunities. The pipe laying season is about 7 months and employment opportunities decline once major transmission lines are installed during Years 3 through 7. For this reason, no new resident employees are anticipated.
Wages earned at a service base and a lay barge spread are shown in Table 3.11. The wages depicted in Table 3.11 refers to the Medium Find Scenario. The total of $3,113,600 in wages must be doubled to $6,227,200 for the High Find Scenario during a peak year.

TABLE 3.10
Employment at Pipeline Installation Service Base and Lay Barge Spread
Medium Find Scenario
# of % Local % Non-Resi- Local Non-# of Employees Employ- dent Employ- Employ- Resident Total
Activity Units per unit ment ment ment Employment Employment
Lay Barge 1 200 20 80 40 160 200
Jet Barge 1 35 20 80 7 28 35
Tug Boats 6 6 40 60 14 22 36
Onshore 1 6 80 20 5 1 6 Base
Supply 1 20 82 18 16 4 20 Boat
Helicopter 1 3 100 0 3 0 3 --TOTAL 85 215 300
Source: NERBC, Estimates for New England, Tables 4.57 and 4.59

. ~
~·.
TABLE 3.11
Wages Paid for Pipeline Installation Service Base and Lay Barge Spread EmpJ.oyment
Medium Find Scenario
Average Monthly # of Months # of Local Local Non-Resident Non-Resident ~cti~j..tx__ Salary Emplo~d Employees Wages Employees Wag:e_2 ____
Lay Barge -$1,500 7 40 $420,000 160 $1,680,000
Jet Barge $1,500 7 7 $ 73,500 28 $ 294,1100,0
Tug Boats $1,420 7 14 $139,160 22 $ 218,680
Onshore $1,420 7 5 $ 49,700 1 $ 9,940 Bases
! Supply $1,420 7 16 $159,040 4
,. $ 39,760
Boats
Helicopters '$1,420. 7 3 $' 29! 8;20 0 0
TOTAL 85 $8711220 215 $2,242;380
Source: NERBC, Estimates for New ··En·gland
-------.
~ 0

41
3.4.5 Platform Installation Bases
Application
Discussions with platform fabricators has revealed that platform installation bases are usually located in close proximity to platform construction yards. The transportation of the steel platform jacket is accomplished by rolling it onto a launch barge and then towing it to the installation site by tug boat. Deck and module components are loaded onto cargo barges and are also delivered to the site by tug boats. Derrick barges are required to lift the jacket and deck_sections as they are being installed. The platform installation operation would require anywhere from 3 months to 1 year to complete.
The demands placed on New Jersey during this phase will be to supply fuels, food, welding supplies, tubulars, and miscellaneous items to the offshore installation sites as well as accomodating the transfer of crews that will take place from a helicopter operations base in the Atlantic City area. Tug boats, derrick barges, and other associated vessels will be serviced from New Jersey sites, but will not necessarily enter New Jersey harbor areas because they are usually serviced at sea.
Under the Medium Find Scenario, it is estimated that a maximum of 4 platforms per year will be installed, requiring 1 platform installation base. The High Find Scenario assumes that 8 platforms will be ~installed during a peak year, thus requiring 2 platform installation bases.
Timing
The installation of platforms could begin as early as Year 3 in the High Find Scenario and continue through Year 16. Installation in the Medium Find is assumed to begin one year later, Year 4. The number of platforms installed in one year will reach its peak in Years 7 through 10 with the installation of platforms in the Medium Find tending to peak earlier than the High Find.
Transportation Requirements
Each base will require 1 supply boat and 1 helicopter to deliver supplies and transfer crews to offshore installation areas. In addition, offshore operations require tug boats and derrick barges to install the platforms and decks. Although these vessels will not enter New Jersey harbors, crew transfers will be required through a helicopter operations base. Transportation requirements for one base supporting up to 4 installations and offshore vessels installing 4 platforms per year would be:

42 4 Derrick Barges
24 Tug Boats
1 Supply Boat
1 Helicopter
Land Use
Each base supporting 4 installations per year requires 5 acres at dockside. With helicopter operations taking place from the Atlantic City area, the dockside acreage is reduced to 3.5 acres per base. Because of economies of scale, the helicopter operations will require 1 acre. Thus, the Medium Find Scenario will demand 3.5 acres at dockside and 1 acre for helicopter operations, whereas, the High Find Scenario will require two bases with a total of 7 acres at dockside and 2 acres at a helicopter operations base.
Berth and Wharf Space: Because supply boats will be needed to service the platform construction, 200 feet of marginal wharf is required for each base. The Medium Find with one base would require 200 feet of marginal wharf whereas the High Find will require 400 feet of marginal wharf for the two bases sited.
Employment
Transportation employment at the platform installation base will be 20 per supply boat, and 3 per helicopter. Onshore employment at the service base is estimated to be 6 per platform installed. With each base supporting 4 installations per year, employment is projected to be 24. However, with economies applied from Table 3.6, this number is reduced to 19. Offshore employment is projected to be 6 per tug boat and 100 per derrick barge.
Origin-of-employment for supply boat crews, helicopter crews, and onshore base crews is assumed to be the same as development activities for permanent support bases (see Table 3.8), and 25% of the offshore employment is projected to be local hire with the remainder being nonresident employment.
Table 3.12 summarizes the employment at a service base and for offshore activities supporting the installation of 4 platforms in a year. This is the level projected for the Medium Find Scenario. In the High Find Scenario, 8 platforms will be installed per year,and thus, the column totals must be doubled.

TABLE 3.12
Employment for Platform Installation Base and Offshore Operations Supporting 4 Platform Installations Per Year
Medium Find Scenario
% Local Local % New Res- New Res- % Non- Non-Employ- Employ- Employ- ident Employ- ident Resident Resident
Activity ment ment ment ment Employment Employment Employment
Onshore 19 100 19 Service Base
Supply 20 82 16 18 4 Boat
He1icop- 3 74 2 26 1 ters
Tug 144 25 36 75 108 Boats
Derrick 400 25 100 75 300 Barges
TOTAL 586 173 5 408·

44
Wage levels for tug boat and derrick barge employment will be $18,000 per year. The remaining job categories average $17,000 per year. Table 3.13 illustrates wages earned during a peak year when 4 platforms are installed in a year. The wages earned must be doubled for the High Find Scenario during a peak year.
TABLE 3.13
Wages Paid for Platform Installation Related Employment During Peak Year
Medium Find Scenario
Average Local New Resident Non-Resident Activity Salary Wages Wages Wages
Onshore $17,000 $323,000 Service Base
Supply $17,000 $272,000 $68,000 Boat
Heli- $17,000 $ 34,000 $17,000 copters
Tug $18,000 $648,000 $1,944,000 Boats
Derrick $18,000 $1,800,000 $5,400,000 Barges TOTAL $3,077,000 $85,000 $7,344,000
Total wages earned in the Medium Find Scenario is $10,506,000, of which $3,162,000 will be paid to New Jersey residents. Wages earned in the High Find Scenario will be $21,012,000, $6,324,000 of this amount will be earned by New Jersey residents.

3.4.6 Repair and Maintenance Yards
Application
Of the facilities addressed in this report, only two can be found today in New Jersey: Pipe Coating, and Repair and Maintenance Yards. The facilities required for pipe coating can be estimated using industrial reference data but this is not the case for repair and maintenance facilities.
The RALI/Factbook (p. 2 .. 10) addresses this by saying:
"Repair and maintenance yards already exist as part of the indigenous industrial infrastructure of the area adjacent to the offshore site. They will probably be servicing local industry at
45
the same time they are handling the repair and maintenance of oil industry vessels and equipment. This factor makes it unrealistic to discuss specific energy, land and waterfront requirements as can be done with other OCS related-facilities. The repair industry must be prepared to service offshore vessels and equipment whenever--and wherever --the need arises. To provide this kind of service, then, the yards should be located near the service base and harbor. Significant changes in the repair and maintenance capabilities will occur, essentially, in terms of augmenting existing services."
If a boat chartering company leases a large number of vessels in a frontier area it may establish its own branch base for operating the service with the possible inclusion of a small repair and maintenance facility. Mr. John Alcina, Vice President, Domestic Operations of Arthur Levy Boat Service, New Orleans 9 revealed that his company established a servicing area and headquarters in Brazil when 16 of its vessels were contracted for service here. Four acres would be needed to accomodate the base.
Another factor that should be considered in trying to extrapolate the requirements for repairs is the amount of repairs projected. The examination of the Gulf Coast and the North Sea experience discloses that three factors increased the amount of repairs required:
weather conditions
bottom conditions in harbors
operational depths

46
The Mid-Atlantic does not have the extreme weather conditions of the North Sea nor will it have operations taking place in depths approaching the North Sea's. If service bases are located without compromising the draft requirements, then there should be minimal hull, rudder, and propellar repairs required because tree stumps and submerged vegetation will not be present as in some areas of the Gulf Coast.
The only new facility that may be required for OCS ·activities is a Diving Repair Base that support subsea equipment repair on drilling rigs, platforms, and pipeline installations. According to the Offshore Operators Committee report, one diving repair base is projected for the Medium Find Scenario and two bases for the High Find. 1 n
Timing
A Diving Repair Base will not be sited until there is sufficient demand for its establishment. The Offshore Operators Committee projections suggest that a base will not be created until 10 to 20 rigs are sited. This number would be reached in Year 4 in the High Find and approximately Year 5 in the Medium Find.
Transportation Requirements
One vessel, requiring a 15-20 foot draft, is needed to transport specialized equipment and materials to the offshore. It will not be used as a supply boat making numerous trips to shore and back but it will carry equipment such as bell chambers or mini-subs for use offshore.
Land Use
Each base will require one-half acre at dockside to service rigs and platforms sited during peak years. The Medium Find Scenario will utilize one base of one-half acre whereas the High Find will require two bases for a total of 1 acre.
Berth and Wharf Space: In order to accommodate the specialized repair vessel, a marginal wharf of 200 feet is required. The Medium Find Scenario will thus require 200 feet of marginal wharf and the High Find 400 feet.
Employment
Employment and wages are summarized in Table 3.14 for one diving repair base that would be sited in the Medium Find Scenario. The High Find Scenario will require

two hases and thus 22 employment opportunities will exist, wi.th_ $601,920 J?aid in w.a9es.- during peak years of operation.
Employ-ment
11
TABLE 3.14
Diving Repair Bas-e Employment and WagesMedium Find s-cenario
New New Average Local Local Resident Resident Wa~e* Employment Wages· EmEloyment Wa~es·
$27,360 9 $246,240 2 $54,720
* Adjustment of 20% for inflation since 1974 is included. Source: Offshore Operators Committee
Total Wages
$300,960
47

48
3.5 Summary of Scenarios
3.5.1 Introduction
Three scenarios were postulated in this section: No Find, Medium Find, and High Find. The demands for each of the following ~unctions, if any, were then projected for each scenario:
1. Temporary Service Base 2. Permanent Service Base 3. Pipe Coating Yard 4. Pipeline Installation Base 5. Platform Installation Base 6. Repair and Maintenance Yards
In order to calculate peak year demands, assumptions are made as to which functions and how much of the function will occur during the peak period for all OCS operations within the scenario. For example, pipe coating demands peak early in the life of OCS operations while overall OCS activity is still growing. Thus, when the peak activity years for the Medium Find Scenario are reached, pipe coating operations will have already peaked and are in a stage of decline.
For summarizing the land use and employment generated during the peak activity years, three assumptions are made:
1. The peak period for all ocs operations is projected to be the peak period for permanent service base operations when the greatest number of drilling rigs are in operation and require servicing.
2. The total land use is estimated by adding the land use projections of each base, even though some of the functions have diminished in intensity of use.
3. Employment for pipe coating yards and pipeline installation bases have already peaked and are added to the other base employment at 30% of their peak employment.
3.5.2 Land Use Demands
The land use demands are projected for three kinds of uses: (1) dockside; (2) helicopter operations (at an airport) and (3) non-coastal dependent uses. These kinds of uses for each scenario are summarized in Table 3.15.

No Find
Medium Find
High Find
TABLE 3.15
Direct Land Use Demands for the No Find, Medium Find, and High Find Scenarios
Dockside
93.5-107.5
155-190
Helicopter Operations
5
20.5-29.5
42-60
(acres) Non-Coastal Lands
1
30
100
Total
5
144-167
297-350
Note: Lower acreage values include economies of scale whereas higher values do not.

No Find (Year 2)
Medium Find (Years 7-10)
High Find (Years 9-11)
Summary of Employment
Temporary Service Helicopter
TABLE 3.16
at Support Bases During Peak Year of Activity
Permanent Install- Pipe Pipeline Repair &
Service ation Coating Installa- Maintenance
\Jl 0
Base t 012erations* Base Base Yard tion Base Yards + TOTAL
N/A 450 N/A N/A N/A N/A N/A
N/A 1728 720 183 53 90 11
N/A 4114 1800 366 53 180 22
tRefers to bases from which water borne support with supply boats would occur in New Jersey
*Refers to helicopter crew employment, offshore drilling rig crews and derrick barge crews for platform installation
450
2785
6535
+Refers only to employment at Diving Repair Bases and not additional employment that could be generated at existing boat repair and maintenance yards

TABLE 3.17
Origin-of-Employment at Support Ba.ses D~ri11:g. :Peak Year of Ac.tivi ty
~ (_1) (2) (_3) (4)
Local Employment New Resident Non-Resident N.J. Employment Total of Columns
0 ("1) & (2)
No 165 147 138 312 Find
Medium 1539 838 408 2377 Find
High 3660 2059 816 5419 Find

No Find
Medium Find
High Find
TABLE 3.18
Wages Earned at Support Bases During Peak Year Activity ($)
Temp. Service Base
7,650,000
Perm. Service Base
34,765,000
86,836,000
Platform Installation Base
Pipe Coating
Yard
Pipeline Installation Base
10,506,000 609,500 932,080
21,012,000 609,500 1,868,160
Repair & Maintenance
Yard
300,960
601,920
TOTAL
7,650,000
47,115,540
110,927,580
\Jl
"'

3.5.3 Employment and Wages
Employment and wages are summarized in the categories of: (1) Employment by type of base; (2) Origin-of-employmen~ and (3) Wages earned. This information will be used in the impact analyses in succeeding sections (see Tables 3.16, 3.17, and 3.181.
3.6 Impacts of Scenarios
3.6.1 Land Use Impacts
Helicopter Operations
53
As shown in Table 3.15, the land use demands of helicopter bases is relatively small as compared to other uses. With helicopter operations scheduled to take place out of the Atlantic City area, Bader Field and the National Aviation Facilities Experiment Center (NAFEC) are the two prime airports being considered.
Bader Field is approximately 10 miles closer to the offshore leased tracts but is located in an urbanized area where helicopter operations may conflict with and cause safety problems with surrounding uses. The NAFEC facility is located in a less urbanized area and has room for expansion of services. It also has more advanced instrumentation to guide helicopter landings during unfavorable weather conditions. Although both airports seem to be able to accept greater air traffic, it is possible that new levels of use may occur once casino gambling begins in Atlantic City.
Bader Field is owned by Atlantic City but is operated by a private corporation, Atlantic City Airlines Incorporated. Donald C. Young, president of the company, indicated that no long term lease is in effect at this time and operations are conducted on a day to day basis while a master plan study for the airport is being conducted. 11
Therefore, the future use of Bader Field is not certain and will be affected by master plan recommendations.
An additional factor to consider is that the helicopter operations base will act as a work attraction center for offshore crews. Vehicular traffic will be generated by such operations and with the additional traffic caused by activities associated with casino gambling in Atlantic City it would appear that NAFEC has a locational advantage. With the helicopter operations base acting as an attraction center for jobs, demands may be placed on surrounding communities to provide housing and services for the new resident employees that may seek to locate in proximity to the helicopter base (see Socio-Economic Impacts which_ follows in this chapter). Table 3.16 illustrates the

54
number of employees that will move through helicopter operations bases during peak activity periods for each scenario. Accommodating these people and their attendant demands may put stresses on the natural and built environment.
Support Bases
The land use impacts of support base development and operation is partially dependent upon the area in which the bases will be sited. The consequences of their development in an urbanized port district will be different from development and operation in less urbanized areas presently supporting recreation, resorts, and commercial fishing. Development in each type of surrounding area is discussed below as related to dockside land use demands of 93.5-107.5 acres in the Medium Find and 155-190 acres in the High Find Scenario.
Urbanized Port District: Development of support bases in urban ports will be compatible, in most cases, with existing waterfront uses, and it is an acceptable use as determined by master .plans and economic development strategies.
In urban port areas various opportunities exist for the development of OCS support bases. There are vacant tracts of waterfront land that were formerly used for bulk material transfer operations that meet industrial siting criteria. These areas have rail access and also have a soil bearing capacity capable of supporting OCS operations with few modifications. Good highway access to these sites would also reduce conflicts and impacts on local roadways resulting from related truck traffic. The availability of large tracts would enable operations to be of sufficient size so that economies of scale could be realized.
The urban nature of the sites also means that other advantages may be present. Municipal water and s-ewer service can be extended to proposed sites and should not overload existing systems in most cases. In addition, the indigenous industrial infrastructure should also complement OCS operations. Ship repair and maintenance is obtainable and capable of servicing supply boats, and other services such as welding, food services, tools, fuels, and lubricants are also nearby.
Environmental land use impacts from service base construction and operation also appear to be minimal. Filling in of productive wetlands is not anticipated because of existing developed waterfront acreage. Extensive dredging is not required because existing federally maintained waterways meet draft requirements

and only dredging to dockside to obtain access is projected. Properly planned and designed facilities can minimize runoff and wastewater impacts by directing it into existing sewer lines for treatment before discharge. All of the support bases, except for pipecoating yards which do not require direct water access, are basically transfer facilities. There are no industrial polluting processes except for impacts on air and water quality associated with the operation of supply boats and onshore operating equipment such as trucks, cranes, and mobile equipment. If pollutants are introduced into the air and waterways, it will be by accident resulting from equipment failure or human error. Environmental impacts from such accidents would be less detrimental in urban settings than in more ecologically sensitive areas along New Jersey's Atlantic coastline.
Recreation, Resort, and Commercial Fishing Ports: Development of support bases in port areas along New Jersey's Atlantic coastline will produce increased land use pressures in an area that is already experiencing intense development demands. Competing uses such as sport boating, sport and commercial fishing, housing and commercial development are presently competing for limited amounts of developable land. At the same time, the above types of land use are also proposing the filling of
55
wetlands to accommodate development. These proposals conflict with federal and state objectives of maintaining and preserving extremely valuable and unrenewable resources. As a result, direct land use demands of both the Medium· and High Find Scenarios will only add to the problem of allocating developable land among competing uses while at the same time preserving and maintaining the quality of wetland resources.
Large contiguous tracts of unutilized or underutilized land suitable for development are almost non-existent. Easily developed land has been built upon and the waterways are already intensely used for recreation and commercial activities. In order to acquire tracts large enough for support bases, two options are present: (1) acquiring land presently developed for recreation and commercial uses or, (2) filling and developing upon estuarine or bayside wetlands. It is likely that large tracts will be needed thus reducing the overall land use demands. Further, needs for ship repair and maintenance facilities will be felt as well as those for warehousing, welding, food supply, tool and other indirect land uses. These uses will also conflict and compete with existing recreational and commercial uses.
Waterways on the Atlantic coast are intensively used for recreational and commercial activities during the

56
spring and summer. Additional traffic generated by OCS operations will further congest already crowded inlets and waterways and could result in dangerous conflicts between large (greater than 200') supply boats and small pleasure crafts. Further problems could also occur if unfavorable weather conditions make it necessary for supply boats to seek shelter in congested harbor areas.
The siting of support bases in recreational-resort areas will also produce conflicts in esthetics. Whereas a base can be buffered from lines of sight on land, this cannot be accomplished from the water due to the nature of its operation. The unsightliness could make the area less attractive as a recreational boating area.
Environmental land use impacts from the construction and operation of service bases can be numerous. Of primary importance is the extent of filling of productive wetlands that will be required. Construction activities in wetland areas will result in direct habitat loss, addition of suspended solids to adjacent waterways, and a deterioration of water quality~ The results are decreased productivity of the ecosystem and the destruction of organic coastal resources.
Further adverse impacts can result when dredging is required for supply boat access. Adverse dredging impacts may include: destruction or damage to aquatic organisms; changes in the quality of water, bottom sediments, and the circulation system; burial and destruction of either terrestrial or aquatic plants and animals by spoils disposal; and increased use and abuse of waterways by man.
The introduction of boat traffic to an area that formerly was inaccessable or only used by small craft can produce adverse impacts. Boat operations will result in pollutants being introduced into waterways and the increased risk of damage to natural shorelines from wakes of large operating vessels. It should also be noted that bow thrusters on supply boats will cause increased turbulance and suspension of solids resulting in decreased photosynthesis levels and necessitating increased maintenance dredging.
The demands placed on municipal services may also have adverse effects. Water supply and delivery problems presently exist in many coastal areas. Increased service demands can only complicate the problem further. Salt water intrusion is being experienced in some areas whereas distribution problems exist in other areas. The extension and further development of such services will only exacerbate existing problems.

3.6.2 Socio-Economic Impacts
Two types of impacts will be created by support bases; those associated with employment and those which create demands on the infrastructure network. The economic consequences of OCS operations must be discussed in terms of direct employment and indirect and induced economic activity as well. Jobs will be created in industries supplying materials and services to OCS operations as well as by the expenditure on goods and serviees by OCS employees. The impacts on the infrastructure will be determined largely by the amount of increased services that must be delivered to the new resident population generated by OCS activities. Two very important measures of infrastructure impact, housing and new pupil population, are calculated to identify the levels of projected demand.
Employment
The employment impacts of each of the scenarios will produce many different impacts, some measurable and some not. Estimates of the total OCS-related employment can.be made by applying a job multiplier* to the direct OCS employment for each scenario as found in Table 3.16. The amount of jobs generated is dependent on the quantity of materials supplied from the region and how much leakage in the economic system is anticipated. A multiplier of 2.5 was selected to determine the number of jobs in the region. The total OCS generated employment for each scenario is shown in Table 3.19.
TABLE 3.19
Total OCS-Generated Employment
Scenar1o Direct Job Total ocs
57
Employment Multiplier Generated Employment
No Find 450 2.5 1125
Medium Find 2788 2.5 6970
High Find 6835 2.5 17,088
Infrastructure Impacts
In order to determine the infrastructure impacts of ocs operations, the number of new resident employees must be examined. These individuals and their families will move to New Jersey and will require increased service
* Derivation of multipliers is addressed in Appendix A.

58
delivery by state, county, and municipal governments. It is estimated that for every new resident employee a total population increase of 2.85 will result. This population multiplier takes into account single new resident employees as well as individuals with families. Table 3~20 projects the new resident population for each scenario to be used to determine further infrastructure impacts.
Scenario
No Find
Medium Find
High Find
TABLE 3.20
New Resident Population
New Resident Employment
147
838
2059
Populat1on Multiplier
2.85
2.85
2.85
New Res1dent Population
419
2388
5858
The new resident population growth generated by OCS activities will require increased service delivery by municipal governments. One area that particularly concerns local governments is school-aged children. The cost o~ delivering educational services may make up as much as 80% of the operating costs in some suburban communities. Therefore, it is easily seen that this is an area of major concern. The potential influx of new students is estimated to be as great as 1467 pupils ( Tab 1 e 3 . 21 ) .
TABLE 3.21
New Resident Pupil Population
Scenario New Resident Pupil * New Resident Population Multiplier Pupil Population
No 419 0.25 105 Find
Medium 2388 0.25 597 Find
High 5868 0.25 1467 Find
* Derivation of multipliers is addressed in Appendix A.

The new resident employees will also place demands on the housing market to supply them with dwelling units. It is estimated that 0.9 dwelling units will be needed for each new resident employee.* Table 3.22 summarizes the housing units demanded for each scenario.
TABLE 3.22
Housing Units Demanded by New Resident Employees
Scenario New Resident Housing Housing Units Employment Multiplier Demanded
No 147 0.9 132 Find
Medium 838 0.9 754 Find
High 2059 0.9 1853 Find
A complicating factor in assessing infrastructure impacts is the nature of OCS operations. Work schedules
59
for offshore crews may consist of working for seven consecutive days with breaks of seven consecutive days during development and production activities. Thus, the traditional daily work-trip is eliminated and few limitations are placed on the selection of residential location by OCS workers. Experience in the Gulf Coast has shown that employees live as far away as 200 miles from support bases. However, this may not necessarily be the case in New Jersey. The MidAtlantic is a "frontier" area and thus the experience in the Gulf Coast is not directly applicable. Experiences in other "frontier" areas such as the North Sea has shown that OCS workers locate in close proximity to development areas and as a result place stresses on local service delivery. In all liklihood, the Mid-Atlantic experience will probably share characteristics of both of these previously developed areas. OCS residential location patterns will be less dispersed than the Gulf Coast experience but more dispersed than the Scottish experience.
Conclusion
Whereas the locations for the helicopter service bases is known, the sites of permanent service bases, pipeline installations, and any platform installation bases are not. Two alternatives appear to be facing New Jersey. The first is to allow oil companies to locate as near as possible to the leased areas with development proceeding in the Atlantic City-Absecon Inlet area. The second being directing OCS
* Derivation of multipliers addressed in Appendix A.

60
acti.vi t.i.es to urhani.zed ports such_ as- in the greater New York. Harbor area.
It is evident from the information presently available that the impacts from the No Find Scenario as postulated will be negligible. Employment impacts will be small and of a short-term nature. Aiteration of shorelines for servi.ce base accommodation will not be required and therefore adverse environmental effects from such construction and operation is non-existent.
The impacts for the Medium and High Find Scenarios are not completely known hut they are identifiable in general. If permanent support bases are located in the coas.tal areas. such. as Atlantic City-Absecon Inlet, severe a,dvers·e impacts may result. The area presently supports only small amounts of industrial activity. Any further development will result in the filling of valuable wetlands·. Further stresses would be placed on the ecosystem with the only possible result being the lowering of water qua,li.ty and wetland productivity. The land demands of the Medium Scenario of 93.5-107.5 acres make it obvious that the coastal area cannot absorb such uses without compromising its environmental quality. The environmental impacts of such development would be adverse effects on recreation and conunercl.al fishing operations in the Inlet. The possibility exists of both. corrunercial and recreational traffic being squeezed out by the economic forces associated with offshore activity and lessening of the Inlet's attractiveness as a recreation port. Further, OCS support siting could further complicate existing water supply and healthcare problems presently being experienced in the developing coastal region.*
Development of OCS support bases in an urbanized port area would prove to have less detrimental environmental and s.ocio-economic impacts. Urban areas can absorb the demands of the support base with fewer adverse effects as a result of their developed infrastructure and existing harbor areas.
Although there may be an increase in cost to the delivery of s.ervices to offshore rigs and platforms from the. urban port locale, there will be considerable savings. in in~rastructure set-up costs, in environmental disruption, and in site development. The potential increased cost for production would be borne by the national market. The environmental degradation and the infrastructure impacts associated with a coastal location would be localized in New Jersey.
OCS activities will cause increased pressures on the built and natural environment of New Jersey. Associated
* See Appendix H, Hospital Utilization Reports

population growth will produce service delivery problems and add to the intense pressures for development in the coastal zone. The only way for New Jersey to deal with pressures of OCS development is to direct onshore support operations to urban areas where impacts can be minimized, thus reducing haphazard development that could potentially destroy the valuable natural resources of New Jersey's Atlantic coastline.
61


CHAPTER 4
SITE SELECTION
The purpose of this study was not to select the best site in New Jersey for an onshore support base but to develop a planning methodology to determine the opportunities and constraints various land, water, and socio-economic systems pose for service base development. To achieve this purpose, the coastline of New Jersey was surveyed and the following geographical areas offering a diversity of land and water types and uses were selected for analyses.
Location Absecon Inlet, Atlantic City
N.Y.-N.J. Port Authority District CLower Arthur KillRaritan River Region)
Cold Spring Inlet, Cape May
Delaware River, Camden
Maurice River, Delaware Bay area
Hanasquan Inlet, Point Pleasant
Existing Waterfront Uses recreational, commercial, tourist
industrial, urban port district
recreational, commercial, tourist
industrial, urban port district
pristine, undeveloped waterfront
recreational, co~mercial, tourist center
Hypothetical sites were selected in Absecon Inlet, N.Y.N.J. Port Authority District, Cold Spring Inlet, and Camden for support base development (Map 1). Site plans were developed for two of the sites - Absecon Inlet in Atlantic City and Perth Amboy in the Port Authority District.
Manasquan Inlet and the Maurice River area were eliminated as hypothetical siting areas. These areas fail to meet the basic siting criteria for support base development (Table 4.1).
PART ONE
~POTHETICAL SITES SELECTED FOR SUPPORT BASE DEVELOP~lliNT
~.1 Absecon Inlet, Atlantic City
4.1.1 Proposed Use
The proposed use for the Absecon Inlet area is a ~errnanent service base. The following analysis character:zes the inlet, identifies opportunities and constraints

64
the area poses for support base development, and projects potential impacts that such developments may have on the area.
4.1.2 Identification of Land and water Types
Absecon Inlet is an oceanic inlet that leads directly to the Atlantic Ocean CSee Maps 2 & 31. The Army Corps of Engineers maintains the inlet on a yearly basis, usually dredging by the hopper method during the late spring-early summer. The channel has a width of 400 feet and is approximately 1.5 miles in length, stretching from U.S. Coast Guard Base at Clam Creek to the Atlantic Ocean. The authorized channel depth is 20 feet; however, the Corps' maintained midchannel depth for half of the project width was reported at 18.1 feet in June, 1976, (Appendix E). Information from Note Eon the NOAA Chart indicates that: "The channel in Absecon Inlet is subject to frequent change. Depths charted in the channel area are taken from surveys of 1964 - July 1976. Entrance buoys are not charted because they are frequently shifted in position." 1
Clam Creek leads to the west from the Inlet. It has an authorized or project depth of 15 feet, but its greatest depth is 7.8 feet, as reported by the Corps in June of 1976. Three basin areas gain access to the Inlet and the ocean through Clam Creek.
Absecon Inlet is a break in the barrier island system, where waters lead to a vegetated back bay. Portions of the barrier islands have been modified by residential and commerical development. Considerable areas of natural wetlands exist near the Inlet but there are also sites of fill, dredge spoil banks, and construction projects.
The Inlet is bisected by the Brigantine Bridge and for convenience, the adjacent land areas are identified as the south, west, north, and east quadrants.
4.1.3 Land and Water Use
The Inlet presently supports a variety of commerical activities and public facilities. Activities include a U.S. Coast Guard Base, the Senator Frank S. Farley State Marina, two small petroleum transfer stations (one active, with barge traffic once every 3 to 4 weeks), ship repair and maintenance yards, commercial and recreational boating and fishing activities, restaurants, motel, and a quasi-public historic area called "Gardiner's Basin". Single and multi-family housing units are located in the Delta Basin and Snug Harbor areas.

---
0 10 20 I""""! IIWit
Miles
MAP
- -!I
....... , 0
100 - "'~:·,1.,-220
0
\
\
\
\
25
9 \
50
-
-
.--.--1
LEGEND
Onshore Supporr Bo•~
L eose Sale Tracts
Accepted Btds
Accepted Btds I Htgh Royal•,
Re1ected Btds
Re,ected Btds I Htgh Roya·•,
Not Btd On
S~tpptng lane
Railroad
~ Interstate
Un•ted States
Stale
Under Construction
0
~
•
--~ Commerc•al + Mtltlary and Commttrctal +
~M_u_n_ic_•_pa_l _______________ ~
'":'-': 4
DO DO , .. , 41
Qo DO E!l~ E!JD /
DO I!][!] I!JD 0 ,~
y 23 = DO Dl!l DO 0 ...... '! D
~ - -DO DO D ~)As [X c ~ - -
D DO DO "'~ D c r---DO D DO 'I - -1
\ 75
\ D B9lQ_'
90 [6 D ex:: D D [XD!D D D - -- I
-- ___::-_ 100 o:><Jo c 't:.:::.;~-0 ,c--,,.. ,,
108)-·--..J- -· :~ .-.
~
,.~; .~.1 ~=··-1171 = ~.
........ •· . 74
THE STATE OF NEW JERSP
O~s~o-e Support Base Study -- OC S .e::s~ 5.:: ~ • A:

'1'/\11 I. I·: 4. J
SITINC CRITERIA FOR A I'~:RMANENT s~:RVICE RASE
Proximity to Water Available Wharf Boat Repair Offshore Access Acreage Space Rail & Maintenance Drilling 15-20 ft. (minimum) (minimum) Highway Access to yards Airport Water
Location Site * Draft 20 acres 200 feet Access Dockside nearb Service Deliver;)' Sewers
Atlantic City - 71 miles Yes Yes Develop- Fair No Yes Regional Municipal Limited Absecon Inlet able & Charter Water
Service Supply
Cape May - 100 miles Yes No Yes Poor No Limited Regional Well Yes Cold Spring Inlet & Charter Water
Service
Manasquan Inlet 94 miles No No Develop- Fair Spur can Yes Regional Municipal Yes able be ex- & Charter Water
tended Service Supply
Maurice River,, 140 miles No Yes Develop- Poor No Yes Regional Well No able Service Water
Edison 135 miles Yes Yes Develop- Good Yes Yes National Municipal Yes able & Inter- Water
national Supply Service
Carteret 140 miles Yes Yes Develop- Poor Yes Yes National Municipal Yes able & & Inter- Water
Existing national Supply Service
South Amboy 135 miles Yes Yes Develop- Fair Spur can Yes National Municipal Yes able be ex- & Inter- Water
tended national Supply
Perth Amoy 135 miles Yes Yes Develop- Good Yes Yes National Municipal Yes able & Inter- Water
national Supply
Camden 220 miles Yes Yes Yes Good Yes Yes National Municipal Yes & Inter- Water national Supply
., Measurements taken from Tract 100, a centrally located tract in Lease Sale 40 .
0'1 -.J

68
A sanitary landfill site occupies a large area of the west quadrant. It is owned by Atlantic City and was closed by order of DEP/Solid Waste Administration in 1975.
4.l.4 Data Deficiencies
Boat Traffic
No quantification of existing boat traffic in the Inlet is avaialble. Neither the Coast Guard nor the New Jersey Marine Police collect such data. There is presently no method available that is widely accepted for measuring the traffic capabilities of an inlet.
Landfill Site
Limited data are available on the quantity and composition of materials dumped. Although designated as a sanitary landfill site, there is no guarantee that restrictions of materials dumped was observed. In fact, the landfill site was the object of a number of directives from DEP/Solid Waste Administration siting the city for improper dumping practices.
Load Bearing Capacity of Soils
Although soil surveys conducted by the Soil Conservation Service do give indications as to the soil's performance, test borings are required for the entire area to determine the exact capacities.
Benthic Communities
Limited information is available. Studies are presently underway or in the planning stages.
Water Quality Data
Data are limited, extensive samplings have not been taken and most studies have occurred in the back bay and not in the Inlet. In 1973 the Division of Water Resources conducted a water quality study in the Brigantine area of the Inlet. Samplings at that time indicated the waters met TW-1 standards as defined by the Division of Water Resources; that is, the pH level for non-trout waters must at least fall in the range of 6.5-8.5, concentrations of dissolved oxygen must not be less than 4 milligrams per liter, and the bacterial count must meet the acceptable levels as designated by the National Shellfish Sanitation Program. Some of the samples did not indicate that COD, suspended solids, and oil and grease levels were moderately high. This is most likely a result of improper discharge of effluents into the water.

----------· .. ---... ...-.-... ....,... .__ . ·-------... -1 MAP 2
0~ a,re \:Jet...
..,1' I,,, .•
.{LJ
~~ 0Piie
Light0 0 oASTAL
A,~p.. ,~ . .. .......
;l
;}' ~1" .. >:_:~.:~~~~~'\;: . Sewage
Thorofare
) '·~ ' '.,. ~J -,t• ~~ .r!~ ·-;:~ ol lr_:l•t •
"' 00 p.~ fl.~
"""'1€-/ I
/ >· //~Q.,'b//
/ ' / / /
/ ' // :(;>~//
/ G/
.·····~\~~~ _/-Mud c·r "~ .·
. . ~~o< ' /
8/~k~i~,~i\': /
\ ..... .. 'I~~J.! v
FI-J!s . ·~~/ j )f'/' ~-:~~~':> \ ..
..-?r Q •. j I
-~P:tl\:- ·:~ ·:·t<·_.:,:: I
>dfld
I \ ' \. i ·.·
- \- -
I
I Rum Pt
I
I
I : ' / .. ,l.t~.· .... :,. .:· Sand ~· • • •. • ~· •, :::" Coast Guard
~ 1 "• •• • ~/ :"~\· Station ......, \ /".,.•• • ):- · ~.6 Tower L' ht
\ . " (.> \ ~ ;//" •(':;: J_.....'{E) 0 1 ~ Seaplane ..
·~ ·;\:._,Disposal ~::::: ~
~II;?
\\\1· .. , .. · ....... ··'·:·,~\
;_:.::,::.
\
. ~ \_/(' ~,_ o ,-,-::_~,~se ABSECON . ~ "")"' \t.,¥Lo 1 ~\ '· • - .,_ • -0'=;7~ () "·· II'" '(l,e. ~.~ 1 ,\ "
8 ... .• - ---~ / " 'I I "' /' ff \ G 'f ... ~-. I \: gu ,.·· :l ~qd_io To~w~r - . ~-~{/7! r, /' !!/f ATLANTIC,. Cl'fY· !1 \~\ C"o-1(t tl~~~rt (( ,~f.~~~
(WFF: /lr 1.. Jo ~~~ '
1 '/•~ Stack~l _." If • \•~ ,f Jf'}\#c.~~·r::J'·/(~ -;;j' 1...--:::'{~~~ z ->/ • ·.~, ~· ''• IJ '<I ,,.. I ~) \\ ,0\ \\_..-, ;:::::-~ _ •• ·~~~~ I :;~~~~·-·-~"*~.... ~ 1 ov.~,/ \\ "'1/o (.' ·~ ~?v \ ~'k/~{ ~-\
/ •r~-.t; ""~---. -~[~II ~r.·'- M. (C).:;/ ~ \\ ~·:,. 'E)"•"·~~' .~.'~\" &( .J:( ~' ---~,~ ·.·,~-~Jt -~~~;:;;._~ ··;,"·!!.YL! , y-'~ \ ~~5J' ' :•;-.;.. ~'\ \ ~ '-:. -::...-- \\_;;Y ~~' . Hackneys ;,::~~,1; :~~~~'![ ... ~-~l."'-w~~Y\~\'~~~~- \~"' ;;(( sr-1 ~ ~~\--J\~~~·.9~9~~~~ ._P1er C.:jf---.-' ~ ~1:' :~.;;::Jr[~·,'~~~·-•:!;:" • .,(~~J, ~Arm ~!~~- §jf.; ~-~"". -:'C ~\.-::e/{] !\.\ 'll\:~....-\~0' ~~ . :-... ~ ~ )N .. 1-1 · """"-\...Jfi'~·-~;~~L· • 11 '\\: \, ;. &:.~ ~<f!f:.'<"a'1!' ,~ _/· s '· ~ ( /~r~. ;-;:?' -- · -(\ ';-./ !':-'-~ 1 i'-- •• '""-. •0> t to•, I \\,•, • \\~:5: -~ 'i •I ~ \' , \~ \\....-:. \\_..:~ ~/' -::;_.. -~/:;~. if~:;!lr~7-:.1f.~t}-.f\_~Y,·~\ ~ .. ~: .. -\?'2'-~.-d)~'~~~~-'~\ J,~\)C),r/\~~~~ \~U.~~{, ~ ·.~
. , ,1; i:r • ,, .--: • .;. -•"';;;:J•// )\·~. -~ ~":}-;./"~ ,~ -~\ ~~) >-;""~...)- ~~-\\......-;:::'"\ '\,~..- \\_)\A~~~ :t ':- .1,.4 .,~.:-:- ·- ~ ';,,; ·;(,~•* "- :-, ~1.\t'~;,Y.)~ i~( ~ ,_(\--,1~~;~"'¥·"\:7\:l ~\V;;. ~ 'tt / ,,>;"_.. _ .,.. ~--,\~~ \\.A~~..-.: ~ '/•;, \\. ... ,-;::;- 'v:i:T ~. ""-> ~ ,\Y...::: ~ ,
· · Th<r~ofare_ ·· '"'c:~~)a~ib?~\\\~J~t.~C?~~r>~~\\~~\)~ ·i0< · . · ' '-"'\\..? \\ .'t.c{'\~~ \ ).?'~\.?·;\ \ ... 1 \. "'i ~ "'-t'..?P'\._ . L! ·
~
\\\--:-
,.,.,,., 1\r.tc h
·--:..---()
INLET
\ '
ib
~:;.--
vf"?
t -N-
~
11 A1rport,.,-~' rF1~~'- /j
,~/ \(~\-~~~\~z, .-/~~J~-v:~' ~~-- .· ~-~~~\1\t>~\)~~ / ~\..\q \\ . ~." -~~ ,' . ~r~~t-/~~~--=~S~:,_},~--~~~~~\,\~:~~~\~\\ f/\··'\\;\~ ·y~~-,~ SCALE 1:2400(!. ~ .~.. --~. - '\J~r ~~--f'~c·t--~a~~~"\\)!...'\'~~\ ~-" \\ ·' \\\ \, \ ~~. -~ o I 1000 o 1000 2000fEET -~ II - \~- ' ~ ~\ \\ I ':'"'\....-:::;:-" 8 fv1 • ) \• ·~ \~ ~ \ -~.. . '/ 'bC::: H I I 'tl lJ~"~\~~:~{:<' .,. _d\1~-{'~ ,..;~ ~S~ 2;~-(1(...\ \ \~~ '\.'~. \\~'fii!Ji>/ 1· ·CJ.. H H ---;;
Hypothetical Site Sources: USGS Quadrangles Atlantic City & Oceanville
)> txJ (/)
m ()
0 z
z .-m ~
~
0 """C 0 G) ::::0 )> """C :I: -<
Atlantic City I Absecon Inlet Updated Aug 1977- C C ES Cartography Laboratory- Rutgers Univ.
)> ~ .--)>
z ~
()
()
~
-<
0) CD

70
CORPS OF ENGINEERS
\t
SUB-OFFICE Scale of Feet
20 0 20 40 60 R A e=---3 E7""'3
ATLANTIC _COUNTY
1000 0 E3
U.S. ARMY
MAP3 ABSECON INLET
NEW JERSEY REVISED 30 JUNE 1973
SCALE OF FEEr 2 3 ~
4 6 7000 ~
U.S. ARMY ENGINEER DISTRICT, PHILA.

Atlantic City Master Plan
Atlantic City pres-ently has no ma,s.ter plan but has contracted for a plan to be completed by June, 1978. An interim zoning ordinance was adopted on June 27, l977 which rezoned the entire city. This ordinance will be coordinated with the master plan study to reflect the interim findings of the study. The interim findings to date have not been coordinated with the interim zoning ordinance.
4.1.5 Opportunity Analysis
Absecon Inlet is approximately 70 miles from tract 100 of Lease Sale No. 40, making it the closest harbor that has the potential to serve as an onshore staging area. The area meets many of industry's standards necessary for the siting of an onshore support base (See Table 4.1)_.
South Quadrant
This area has been extensively altered and recently used as a staging area for the construction of and outfall sewer pipe for the Atlantic County Sewer Authority. A small band of wetlands supporting Spartina aZternifZora exists at the waters edge but the remainder of the area
71
is 22 acres of undeveloped sandy fill and a developed area consisting of a motel parking lot, u.s. Coast Guard Base and State Marina. There is a petroleum transfer station adjacent to the quadrant just off Clam Creek. Boat traffic generated by the transfer station consists of a barge entering the port once every three to four weeks to transfer petroleum. The facility occupies approximately 1.5 acres of land.
West Quadrant
Forty percent of the 100 acres in this quadrant is the site of the Atlantic City sanitary landfill (closed in 1975) . Seven acres adjacent to the Brigantine Bridge supports a marina and a boat repair yard. The remaining acreage is wetlands.
East Quadrant
This quadrant is more commonly known as Rum Point; it is predominately undeveloped wetlands. There is some bare ground that is the result of the dumping of dredge spoils and there is also an area of sandy fill.
North Quadrant
This quadrant is the least disturb~d area in the Inlet. It is composed mostly of productive wetlands. There is an area of bare ground occurring as a result

72
of construction activities along Brigantine Blvd. The wetlands serve as a spawning and nesting area for various wildlife forms.
Water and Sewer Supply
Only the west and south quadrants are serviced by water lines. The Atlantic City Water Department is capable of pumping 25 million gallons per day. The 1976 summer demand for water was 13-14 million gallons per day. 2
Sewer lines are not e~sily accessible from any of the four sites.
Soil Bearing Capacity
There is no way to accurately assess the soil bearing capacity of an area without performing soil boring tests at the site selected for development activity. The vacant section of the south quadrant has been used for the construction of a sewage outfall pipe. Heavy construction equipment and trucks transported materials across this site, and this would indicate that the area is capable of supporting heavy loads.
In 1967, soil boring tests were conducted in the Inlet area by the New Jersey Department of Transportation for the construction of the Brigantine Bridge. These tests show that strata changes occur at various depths. From the surface to approximately a four foot depth, the soil is gray or brown and white medium to fine grain sand. From four feet to a twelve foot depth, there is a layer of dark gray organic silt, and from twelve feet to seventeen feet, there is again a layer of gray medium to fine grain sand. If the bottom conditions of the Inlet are similar to the above soil profile then dredge spoils may be used as landfill on a particular site proposed for development.
Labor Market
The unemployment rate in Atlantic City and Atlantic County during May 1977 was 6.5 percent and 10.0 percent, respectively. However, because of the seasonal nature of employment in the area, offseason figures may be more significant. February 1977 figures indicate the unemployment rate was 9.7 percent in the city and 12.7 percent in the county. 3 Any activity such as OCS jobs, that generates employment on a year-round basis is especially attractive, The wage level offered for this type of employment is also higher than most seasonal jobs.

MAP 4
LEGE N D
Hypothetical
Commercial
Industrial
Government
Quasi- Public
Resident ird
Vacant
Wetlands
S ite
.:_ :: ... .... · R ·,,..,,
umJoint
... ~· .. _ ... -.... ~- ... ;:. .... ~ - -


The skills of the labor force in the above region are probably not as compatible with oil industry\s needs as they are in more industrialized areas of the- state. Manufacturing employment in the region is only 12 per-· cent of the total workforce; however, the commercial fishing industry has skilled individuals who may he able to easily adapt to supply boat employment. -
4.1.6 Impact Analysis
In order to develop any area in the Inlet as a service base, dredging and filling is necessary for site preparation. The area is also subject to shoaling, and periodic maintenance dredging will be required to maintain the 15 to 20 foot draft needed for supply boat navigation. The effects associated with dredging are outlined below.
Dredging
Any dredging proposal must be considered in terms of its possible adverse and beneficial effects. The adverse effects may be summarized as:
mechanical damage to marine and aquatic organisms and removal of substrates;
changes in the quality of water, bottom sediments and circulation system;
burial and destruction of either terrestrial or aquatic plants and animals by spoil materials;
increased use and abuse of waterways by man.
Beneficial effects also result from dredging and may be summarized as:
increased depth and more efficient channels
increased nutrients in the water resulting from subaqueous dumping (although adverse effects could result in some situations)
creation of new salt marsh habitat including nesting areas for birds and turtles
increased recreational and commercial usage of the waterway
In order to determine the effects of dredging on a water body many factors must be taken into consideration. A water body must be examined to determine its physical, biological, and chemical characteristics on productivity and quality.
75

76
The physical characteristics should include bottom characteristics, depth, drainage, circulation, size, freshwater influence from upland drainage, closure and temperature. Biological productivity assessments should include species diversity, numbers of species, migratory habits and intensity of use within the system. The -examination of chemical qualities should include BOD loadings, dissolved oxygen levels, quantification of chemical pollutants, and the concentration of suspended and dissolved pollutants such as PCB's, heavy metals, etc.
In addition to the above factors, the degree of benthic habitat destruction by the removal or displacement of sediments being dredged is determined by the dredging method employed. Hydraulic dredges will most likely be used for dredging operations in inlets and channels. A hydraulic dredge is a self-contained unit that handles two phases of the dredging system. It not only removes the material, but it can dispose of it in one of three ways: (l) pumping the dredged materials through a floating pipeline to a subaerial spoil area (stationary hydraulic dredging), (2) storing it in hoppers for subsequent discharge in another area (hopper methodl or (3) pumping the material through a pipeline with subaqueous disposal approximately 80 feet to the side of the dredge (sidecasting method). Hydraulic dredges are preferred over mechanical dredges because they are more efficient, versatile and ecomonical to operate due to the continuous, self contained dredging and disposal method of operations. With hydraulic dredges, the material to be removed is first loosened and mined with water by cutter heads of water jets. Cutter heads are used if the material is consolidated and soft bottoms are removed by suction. Three basic units compose a hydraulic dredge: (1) dredge pumps, (2) agitating machinery and (31 hoisting and hauling equipment to raise and lower the cutter and suction dragheads.
Stationaly hydraulic dredges pump the mixture of spoils and water to a dredge spoils disposal site up to a distance of 3,000 ft. Here, the area is diked and the water is allowed to escape through spillways. Two problems specific to this method exist. There is a high mortality for benthic organisms due to the cutter heads used, their transportation to the disposal site, and smothering. The second problem is that terrestrial disposal of dredge spoils can cause decreased levels of marsh productivity if disposed on Spartina marsh. The highly productive Spartina which would be slow to recolonize, would be replaced by the less productive Phragmites communis whose value as food and habitat for wildlife is considerably lower. Continued dredge spoil disposal on a site would remove it permanently as a part of the productive wetland ecosystem.

77
The hopper method retains the spoils in containing hoppers. to he tranaported to an ocean disposal site. At sea the hopper doors are opened and the spoils are discharged. Two adverse impacts associated specifically with this· method exist. First, if dredged materials are retained in hoppers for a long period, mortality approaches 100 percent. Secondly, disposal of the material in offshore areas can have adverse environmental impacts on bottom organisms.
The sidecasting method is used where a dredge must operate in shallow depths. It has a draft of 6 feet as compared to 13 feet for common hopper dredges. This method is less efficient as compared to other methods of operation. ?articular problems of turbidity, nutrient levels and smothering of benthic organisms are associated with_ this method.
The above discussion examines the impacts that are specific to the method of dredging employee. The following is a discussion of impacts that are common to all types of dredging.
Increases in turbidity could be detrimental to fish eggs and larvae if dredging is conducted during the April through August period when the largest number and variety of fish eggs are present in inshore New Jersey waters. The same time period is also the spawning period for commercially important shellfish such as clams, oysters and blue crabs. While any dredging will have adverse effects, it is important to try to minimize those effects of dredging during the more desirable period of November through March. when the least damage to spawning fish and shellfish would occur. This, however, is not presently done due to increased costs of operations during winter weather conditions.
Increased nutrient levels caused by the resuspension of organic detritus and dissolved substances could compound problems that might exist by decreasing already low quantities of oxygen and causing algae blooms. Dredge discharge areas show an increase in total phosphate and nitrogen concentration which could compound the already high. level of organic nutrients whose sources are agricultural runoff, domestic sewage and industrial wastes. The extension of dredging to new areas could reintroduce synthetic organic pollutants and heavy metals that could have accumulated in industrialized or highly populated inlet areas but have had little effect on the environment because they were covered to a sufficient depth by sediment.
Frequent maintenance dredging could repeatedly destroy the biota, thus maintaining the waterway in an abnormal state. Under these conditions, habitation and recolonization could be inhibited. There is also some

78
evidence that dredged areas which. are deeper than surrounding areas become traps eor poor quality sediments and detritus which_ may be unsuitable for most benthic organisms. In addition, it should be noted that some dredge holes become anerobic.
Tertiary effects may res-ult due to increased utilization of the waterway by recreational, commercial and pollution from litter, sewage, boat oils and exhaust.
Changed circulation patterns must be examined to determine if increased or decreased flows caused changes in dissolved oxygen concentrations, temperature or salinity and the retention of pollutants. Decreased flushing could induce precipitation of sludge, blanketing the substrate and rendering it unsuitable for benthic organisms and rooted aquatics. Anadromous fish, which spawn in upstream areas, and shellfish are particularly sensitive to changes in salinity.
The impact of boat wakes from workboats could also cause problems depending upon shoreline, topographic conditions, vegetation characteristics and exposure to natural wave forces. Once again it is suggested that, in enclosed waterways with fragile ecosystems or with heavy recreational use, speed limits be imposed to minimize conflicts and adverse effects.
As stated previously, dredging cannot be accomplished without associated environmental impacts. Careful planning methods must be utilized to ensure the retention of valuable wetlands. An assessment of the stresses on existing physical, chemical and biological systems caused by dredging and dredge disposal can only be accomplished when an extensive data base has been established for each estuarine system. Each dredging proposal must then be examined against the data base to determine if valuable subaqueous species, or adjacent marsh habitat are disturbed or destroyed. Efforts must be made to have all existing and future dredging operations take place during noncritical periods so impacts can be minimized.
The Estuarine Zone
The Absecon Inlet area is part of the estuarine zone; the bay, water and marshland between the upland and the open ocean.
The wetlands act as a buffer between the sea and land. They absorb a portion of wind and storm energies and they provide large storage areas for flood and storm waters. These functions, in turn, reduce mainland erosion rates and lessen social and economic hardships caused by upland flooding and high winds. Filling wetlands may reduce their capacity to store storm or flood waters. Nonstorable storm waters could infringe on neighboring

marshes or upl~nds and cause extensive damage which otherwise may not have occurred. Development in wetlands are particularly vulnerable to wave and water damage because of their proximity to the sea.
Plant life occurs in all wetlands as marsh grasses and algae. These plants grow and die, Decay transforms their tissues into minute fragments of food and vitaminrich detritus. This detritus is suspended in the water and forms a nutritious- "soup" that is carried into tidal creeks, bay, and offshore waters. Nearly all species of sport and conunercial fish, shellfish., and other marine creatures in the estuarine zone are dependent on this "soup" for food, directly or indirectly. Tidal action transports marsh detritus into other water bodies. Some fish that never enter or utilize wetlands are dependent on the estuarine zone for the continuous enrichment of their oceanic habitat. Estuarine fauna include microscopic animal life, shellfish, crustaceans, fin fish, birds and mammals, About two-thirds of the conunercial fish_ catch_ on the Atlantic Coast is believed to be estuarine dependent. Loss of estuarine habitat could cause substantial losses of fisheries products to those dependent on high_ sustained yields for their economic well-being.
The estuary wetlands constitutes an ecosystem. The life that they support is not individualistic or self sustaining; the species interact and are interdependent. Man can easily destroy the delicate balance of the wetlands, triggering changes which infringe upon and decimate the various populations. Permits to allow for increased construction activities in the Absecon Inlet threatens not only a highly productive and high energy transfer system but also commercial and recreational activities in the surrounding region.
4.1.7 Constraint Analysis
The factors most likely to constrain the development of a support base in Absecon Inlet include:
79
1. the high productivity and high energy transfer system that may significantly be altered if the wetlands in the area are placed under construction;
2. the environmental impacts associated with dredging; 3. the interdependence of various life systems on
the estuarine ecosystems; 4. the high volume of seasonal traffic generated in
the inlet by recreational and commercial boating;*·
* Although_ no traffic counts are available, the N.J. Marine Police indicate that during peak season the inlet is very congested.

80
5. the lack of sewage eacilities to service the area; and
6. incompatibility of a s-upport base with the revitalization--of Atlantl.c City as a tourist and recreation center.
In addition to the six factors outlined above the following conditions also place constraints on the area for support base development.
Local Zoning
The Absecon Inlet area is under two political jurisdictions, Atlantic City and the City of Brigantine. The north, south, and west quadrant are located in Atlantic City. The east quadrant is in Brigantine. The interim zoning ordinance adopted in May 1977 by the governing body of Atlantic City indicates that the area is zoned "resort-conunercial". The Master Plan of Brigantine adopted in 1964 indicates that the proposed use for the east quadrant is a Marine Center. This includes commercial activities, marinas, motels, and a marine historical exhibition.
Landfill Site
The 40 acre sanitary landfill site (closed in 1975) affords little opportunity for development at this time. Environmental engineers recommend that a landfill site should be closed a minimum of ten years and ideally twenty years prior to most development activities. Any construction activities at a sanitary landfill site requires water, leachate, and gas control to prevent pollutants from being released into waterways.
Transportation Access
There is no rail line servicing any of the four quadrants. U.S. Route 30, a corridor from Philadelphia and Camden to Atlantic City is about one mile west of the rnlet area. Connecting links from the Inlet to Route 30 are two lane highways in generally poor condition. Points of intersection leading to the Brigantine Bridge are generally poorly designed for facilitating the movement oe traffic.
Navigational Access
The Brigantine Bridge has a horizontal clearance of 112 feet and a vertical clearance of 60 feet. Development of a support base on the northern side of the bridge may be restricted by the above limitations. Although the clearance limitations would not restrict supply boats, derrick barges or large supply barges may be restricted.

Casino Gambling
The State of New- Jersey recently enacted legislation to permit casino gambling within the political boundaries of Atlantic City. The advent of this activity and the potential for onshore support base has increa~ed pressure on State officials to ease environmental regulations to allow- development of the wetlands. Ratables and jobs are the ultimate prize in allowing such_ development. Atlantic City, after years of economic decline, hopes to regain its former briiliance.
Casino gambling projects are much more capital intensive than onshore support bases and may be competing for the same land areas on the Inlet. Prices for land are inflated and may have already eliminated or reduced the viability of support bases in the Inlet area. Further observations will have to be made to see at what level prices stabilize.
Aesthetics
A permanent service base consists of wharf space, warehouse and office space, and open storage area. Cranes are used to lift heavy supplies on and off the workboats. The base in appearance is typical of an industrial port. Since access to the water is a prime consideration, there is no way to buffer the water area. The land area may be buffered.with vegetation suitable for sandy soil and saltwater conditions.
4.1.8 Siting of a Permanent Service Base in Absecon Inlet
The south quadrant was selected as the site for the development of a hypothetical service base in Absecon Inlet. The area is mostly filled-in-wetlands and about 22 acres are undeveloped vacant land. The developed area of the quadrant includes a U.S. Coast Guard Base, New Jersey State Marina, and a motel.
This particular area was selected because it afforded more opportunities than any of the other sites in the Inlet. The area requires the least amount of fill on wetlands, is serviced by city water and at some expense sewer lines may be extended to the site. Oceanic and highway routes are more easily accessible from this site than the other three quadrants.
The Site Plan
Figure 2 illustrates the hypothetical service base sited in the south quadrant. The base is sited on a 22 acre tract with 1,562 feet of wharf spac~. Proposed land and water facilities include:
81

82
DOCKING FACI.LI.Tl.ES 1. three marginals wharves of 225ft., 225ft. and
212 feet respectively. 2. two berths - each 225 ft. by 125 ft. 3. 75 ft. wide reinforced concrete apron adjacent
to the dockside facilities
LAND FACILITIES 1. 16 silo steel tanks, 12 ft. wide by 35 ft. high
for storage of drilling muds and cements 2. one fuel tank with. a capacity of 35,000 bbls.
for storage of diesel fuel 3. two warehouses
a. 90,000 sq. ft. b. 120,000 sq. ft.
4. open storage area 277,500 sq. ft. 5. office space 35,000 sq. ft. 6. base operations office 4,200 sq. ft. 7. parking area
a. 80,000 sq. ft. b. 210 parking spaces
8. security station - 150 sq. ft. 9. flood lighting - 12 groupings of flood lights,
attached to warehouses and 20 foot high stanchions 10. site access
a. 50 ft. wide ingress from Brigantine Blvd. b. 50 ft. wide egress to Brigantine Bridge
underpass c. 40 ft. wide emergency access route from
Huron Avenue 11. buffer zones
a. 30 ft. wide zone along adjacent developed properties
b. 50 ft. wide zone along highways c. planting strips in buffer zones 15 to 20
feet wide with plantings a minimum of 4 feet in height that will attain a minimum height of 8 feet when mature
d. 6 ft. high bermed area with plantings adjacent to Huron Avenue
12. security chain link fence, green colored, 8 feet in height, between buffer zones and base operations
All development on the site will conform with concepts outlined in Section 5.6 on local site plans and mitigating measures.
The development and operation of a permanent service base in Absecon Inlet requires alteration of the shoreline to provide dockside access to the site. Warehouse space and open storage areas sufficient in size to store, process, and assemble all materials required for offshore operations are adjacent to dockside.

FIGURE 2
ATlANTIC C lTV - A BS:-E~C~O~N~~~~----.....,....-n~.....-Site Plan c INLET
Shor'eline D V C egeto tive Bu Her
Sto rage ~ Fuel Tonk o nd L.:__,__J W h m Diked A
ore o use • • • reo
D ... Drill ing M d
Apron • u ' and Cement
Two S to ry Build ing
-'-L£L Pa rk ing lot 0 Bose Opera t ions Q If I C e
0 Flood l ig ht 1§1 G uard Ho use
Mop prepa red by Beth Burcher 0 l ight Standa rd \_'\' Emergency Access Route


MAP5 2000 0 2000
ATLANTIC CITY- PLEASANTVILLE ELI~--~ ~-~
FEET
Sources: USGS Quadrangles Atlantic City, Pleasantville, Ocean City & Oceanville Updated Oct 1977- CCES Cartography Laboratory- Rutgers Univ.
8

86
The warehouse on the north side of the tract has a second floor operations headquarters to allow the supervisor of the base to oversee operations and to coordinate the loading and unloading of supply boats. There is an area for visitor parking located adjacent to the above warehouse. A two-story office building is situated at the western end of the site next to the main parking lot.
One diesel fuel tank is sited about 600 feet from the waterfront to minimize the possibility of a discharge into the water. The tank area is also diked to contain any. fuel spillage.
Mud and cement tanks are within 100 feet of dockside to allow these powdered materials to be blown into storage tanks that are onboard the supply vessels.
Since a service base is a twenty four hour operation facility, floodlighting is provided throughout the base. The lighting is directed so as not to impact on other activities adjacent to the base.
The reinforced concrete apron at dockside provides an area capable of supporting cranes that lift materials onto the deck of supply boats. Portable tanks will be used to hold wastewater and contaminated bilge and ballast water until these wastes can be properly disposed.
All traffic entering the site will be monitored by a guard at a security station which is located at the main entrance to the site.
Railhead Operations
Approximately six miles west of Absecon inlet in Pleasantville (Map 5) are vacant industrial sites capable of supporting small railhead operations. The area is serviced by Conrail. Some areas have spurs extended into industrially developed sites.
To minimize land use demands for a permanent service base established in Absecon Inlet, railhead operations for storage of supplies could be set up in an area such as Pleasantville. Supplies would be transported by rail from market centers to the railhead areas, stored, and then trucked to the supply base as needed for offshore operations. Local highway routes in Pleasantville connecting rail operations to U.S. Highway 30 are lined with a variety of land uses, such as industrial, residential, and commercial. These local routes presently accommodate truck traffic from commercial and industrial activities now located in Pleasantville.
An inland railhead storage supply depot is a land use option that may be implemented to reduce service

base acreage demands in a harbor area that does not have rail ~ccess.
Regulatory· Procedures for Proposed Permanent Service Base
The development of a marine service base in Absecon Inlet requires approvals from governmental agencies at
87
the federal, state, and local levels: an EIS (_environmental impact statement) is required at the state level and may also be required at the federal level.
Pre-Application Conference: The application process may begin at the option of the developer with an informal pre-application conference with the N.J. Department of Environmental Protection (DEP), Division of Marine Services, Office of Coastal Zone Management. The following documents should be presented by the applicant at this conference:
a written description of the site and proposed facility the dimension, number, and uses of proposed structures maps indicating the site's location and rough internal plan of development
DEP will candidly discuss the proposal, outline other permits that must be obtained and list the requirements for the EIS.
Formal Application Procedures: The applicant may apply simultaneously to all governmental agencies having jurisdiction over the proposed project. N.J./DEP, Office of coastal Zone Management requires the applicant to submit 20 copies of an EIS to DEP and one copy each to the following agencies:
Atlantic County Planning Board Atlantic City Planning Board Cape-Atlantic Soil Conservation District
Project Review: No application is complete for review unless the applicant has submitted all required information. Time limitations for an agency's decision begin to run when the application is declared complete for review. A plan submitted to any agency should be a complete detailed proposal covering all activities for construction and operation of the base. Each agency responsible for site plan review and approval will stipulate the documents that must be included in the permit application. If the plan is approved, the permits required by those agencies involved in the review process will be issued with the approval (See Table 4.2).
Site Plan approval at the local level must be issued by the Atlantic City Board of Adjustment. The interim zoning map adopted by the Board of Commissioners of Atlantic City on June 27, 1977 indicates that the zoning

88
i.n Abs-econ I_nlet is_ Resort--Commercial. An industrial marine base is not a permitted use; therefore, a. use variance is required to construct such a facility.
Construction Activities: Construction of a marine service base at the specific site will require several permits. Some of these permits will be issued with site plan approval. The processing time listed in Tables 4.2 and 4.3 may all be running concurrently.
Operation of the Base: Certain operations at a base in Absecon Inlet will be regulated by various governmental agencies. The restrictions listed in Table 4.4 will apply.
Fees and Time Limitations: Any fees that are required by various agencies are submitted at the time an applicant applies for approval or when the agency issues a permit. I.n some instances, t.here is a fee levied for application review and issuance of a permit.
Most approvals are granted subject to time limitations. The activity for which approval is given must be completed within a stipulated time period unless an extension is granted. Failure to comply with these time limitations negates the permit approval.
Development of the Base
As previously mentioned the Army Corps of Engineers maintains a 200 foot by 40 foot wide channel from the Atlantic Ocean to the entrance of Clam Creek. The service base sited in the south quadrant requires the development of a 75 foot wide, 2000 foot long, and 20 foot deep channel. This dredging project would require the removal of 210,000 to 230,000 cubic yards of material. This estimate is based on dimensions and soundings taken at mean low water. However, this estimate may be conservative because of natural shoaling conditions occurring in the dredged channel associated with strong tidal currents. The shoaling conditions will require maintenance 'dredging to maintain the channel at the 20 foot depth.
At $2.00 to $3.00 per cubic yard the cost of dredging a channel to the proposed service base site is estimated at $420,000 to $690,000. Dredging may be accomplished by using the hopper or hydraulic method. The hydraulic method would be less expensive because the dredge spoil could be hydraulically pumped through a 16 inch diameter pipe rather than transported. The material could be used as fill on the proposed service base site if the dredge spoils were composed mostly of medium or coarse sand rather than organic silt. If the spoil is mostly organic silt, other methods of disposal
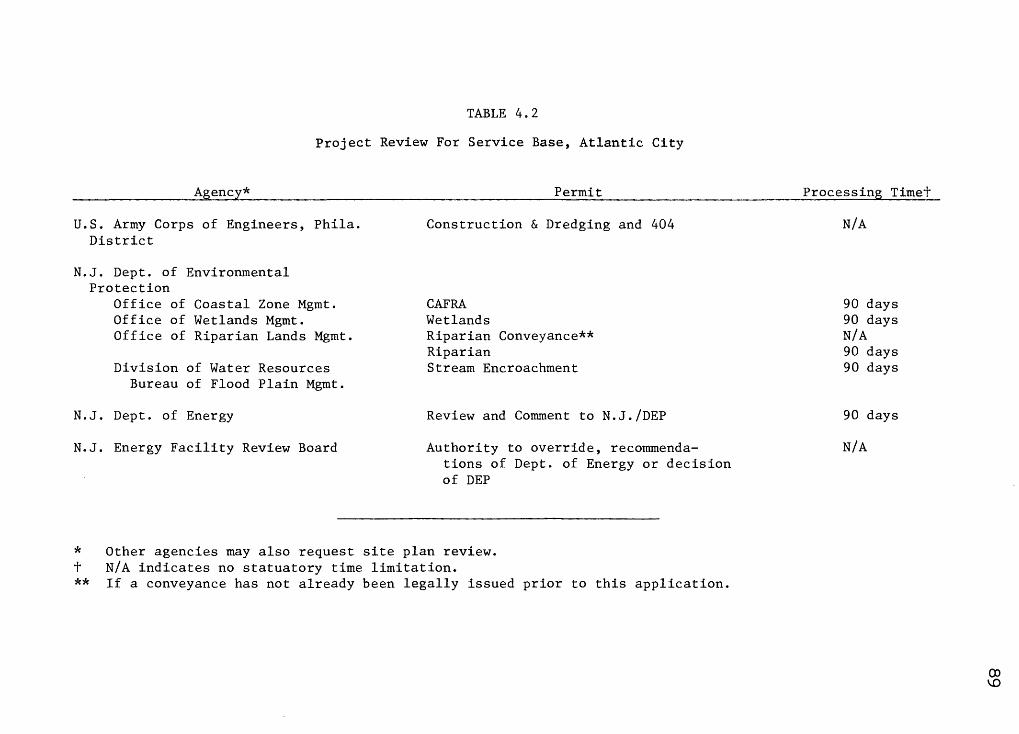
TABLE 4.2
Project Review For Service Base, Atlantic City
Agency*
U.S. Army Corps of Engineers, Phila. District
N.J. Dept. of Environmental Protection
Office of Coastal Zone Mgmt. Office of Wetlands Mgmt. Office of Riparian Lands Mgmt.
Division of Water Resources Bureau of Flood Plain Mgmt.
N.J. Dept. of Energy
N.J. Energy Facility Review Board
Permit
Construction & Dredging and 404
CAFRA Wetlands Riparian Conveyance** Riparian Stream Encroachment
Review and Comment to N.J./DEP
Authority to override, recommendations of Dept. of Energy or decision of DEP
* Other agencies may also request site plan review. t N/A indicates no statuatory time limitation. ** If a conveyance has not already been legally issued prior to this application.
Processing Timet
N/A
90 days 90 days N/A 90 days 90 days
90 days
N/A

Activity
Dredging
Transportation and disposal of dredge spoils
Removal or disturbance of soil of 5,000 sq. ft. or more
Filling of wetlands or navigable waterways
TABLE 4.3
Permits For Construction of Base, Atlantic City
Agency
Corps of Engineers N.J. /DEP
Wetlands Management Riparian Lands Management Division of Water Resources
Bureau of Flood Plain Mgmt. Office of the Director
Corps of Engineers N.J. /DEP
Wetlands Management (if disposal on Wetlands)
Division of Water Resources: Office of the Director
Cape-Atlantic Soil Conservation District
Corps of Engineers N.J./DEP
Riparian Lands Management Wetlands Management Division of Water Resources: Bureau of Flood Plain Management.
Dredging
Wetlands Riparian
Permit
Stream Encroachment Water Quality Certification
404
Wetlands
Water Quality Certification
Soil Control Certification
404
Riparian Wetlands Stream Encroachment
Processing Time
N/A
90 days 90 days
90 days N/A
N/A
90 days
N/A
30 days
N/A
90 days 90 days 90 days
\..() 0

Building Permit for Construction of facilities on land and in the water
Extension of Sewer line to existing pumping station
Connection to existing waterline
Driveway Access Road Opening Drainage .Facility
Driveway Access
Air Pollution Equipment
Corps of Engineers N.J./DEP:
(TAliLE 4.J cont'd)
Coastal Zone Management Riparian Lands Management Wetlands Management
Division of Water Resources Bureau of Flood Plain Mgmt.
Atlantic City Board of Adjustment and Department of Building Inspector
N.J. /DEP: Bureau of Air Quality
Atlantic City Dept. of Building Inspector
N.J./DEP: Division of Water Resources
Public Waste Water Facilities Element
Atlantic County Sewerage Authority
Atlantic City Water Department
N.J. Dept. of Transportation, Bureau of Highway Maintenance
Atlantic City Building Pept.
N.J./DEP Bureau of Air Pollution
Construction
CAFRA Riparian Wetlands Stream Encroachment
Building and use variance
Installation of Air Control Apparatus
Plumbing Electrical
Sanitary Sewer Facility
Sewer Utility
Utility
Driveway Access Utility opening Drainage
Driveway Access onto City Street
Construction of Air Pollution Equipment
N/A
90 days 90 days 90 days 90 days
120 days
N/A
N/A N/A
90 days
N/A
N/A
N/A N/A N/A
N/A
N/A

Operation
Right to occupy and use facilities at the base
Storage of fuels in tanks with a capacity of 35,000 bbls. and transfer of fuels to vessels
Supply boats and other vessels
Disposal of hazardous wastes accumulated at offshore and onshore facilities
TABLE 4.4
Permits For Operation, Atlantic City
Agency
Atlantic City Building Inspector
N.J./DEP and N.J. Division of Taxation
U.S. Environmental Protection Agency
U.S. Coast Guard
N.J./DEP Solid Waste Administration
Restriction
Certificate of Occupancy; all facilities must meet construction standards of the N.J. Uniform Construction Code (N.J.A.C. 5:23-1 et seq.) and must comply with all conditions of site approval
$.01 per barrel tax as stipulated in the N.J. Spill
Compensation and Control Act
Development of a Spill Prevention Control and Countermeasure Plan
Licensing of vessels and operators;
Approval and inspection of vessel equipment; Navigation Rules (CG-169)
Annual Report to Administration on quality & type of wastes;
Disposal with a regulated carrier licensed by N.J. DEP to dispose of such wastes

Workplace conditions that conform with established federal standards for general industry and maritime operations
Air Pollution Equipment
Signs along the adjacent State highway or within the rightof-way or on site
Discharge of pollutants from point sources into the water
(TABLE 4.4 cont'd)
U.S. Dept. of Labor, Regional Office, Camden, N.J.
N.J./DEP Bureau of Air Pollution
N.J./DOT Bureau of Highway Maintenance
Atlantic City Building Dept.
U.S. Environmental Protection Agency
N.J./DEP Division of Water Resources Office of the Director
Monitoring, Surveillance, and Enforcement Element
Regulations set forth in the Occupational Safety
and Health Act (29CFR 1910)
Certificate to operate air pollution equipment
Highway Occupancy Permit
Sign Ordinance
N.P.D.E.S. Permit*
Water Quality Certificate
Compliance with water quality standards and N.J. Water Pollution Control Act of 1977, c. 74
* It is anticipated that this permit will be issued by N.J./DEP Division of Water Resources sometime in 1978.

94
such. as oc~an dum~ing or ~um~ing on tne nearby sanita~y landfill site mus.t be erof>loyed ..
The use of dredge spoils as landfill requires to prevent the spoils froro flowing into the water. the dike were three feet high~ fifty acres of land needed to dispose of 230,000 cubic yards of spoil. amount of land required for disposal is inversely related to the height of the dike.
diking If
is The
Environmental Impacts Associated With Development a.nd Operation of The Base
Dredging and Filling of Wetlands: The impacts associated with dredging and filling of wetlands are outlined in Impact Analysis, section 4.1.6.
Air Eroissions: 4 The magnitude of air emissions, and other environmental impacts from a service base, will depend upon the volume of delivery, storage, and transfer of fuel, supplies, and wastes associated with the offshore oil and gas operations.
Sources of air emissions at a service base include: evaporation from fuel storage tanks; evaporation from transfer of fuel; combustion from machinery and vehicles; and accidental spills, breakage, etc.
The magnitude of impacts from these sources will depend on the number of storage tanks and vehicles as well as on the ambient air conditions. Impacts would be much greater in a non-industrialized area than in an industrially developed port.
Fuel Storage Tank Emissions: Diesel and other fuels are stored in large amounts at service bases for use by both the vessels and the drilling rigs. The volume of evaporative losses by hydrocarbons from storage tanks at a base depends on the following factors:*
*
tank design type of roof diameter and capacity color of surface paint mechanical condition of tank
The diesel fuel storage tank proposed at the hypothetical service base is one tank with a 35,000 barrel capacity.

tank location and usage patterns diurnal chan9es in tank vapor space schedule o~ emptying and !illing he£gh± of vapor space vapor pressure of stored liquids-
The three bas·ic tank designs now in use vary primarily by roof type - fixed roof, floating roo~, and variable vapor space. A fixed roof tank is the least expensive to cons·truct; it is equipped with a pressure/ vacuum vent which. responds to deviations in pressure. ·
A floating roof tank has a roof which "floats .. up and down in response to changing amounts of vapor present. The floating roof prevents the formation of vapor above the liquid surface which would otherwise escape as emessions during filling and emptying. The tank is equipped with mechanical seals to close the space between the roof and the walls. Floating roofs are sometimes covered with fixed roofs to further reduce vapor losses.
A variable vapor space tank is equipped with a diaphragm or "lifter" roof, which responds to the expansion and contraction of the vapor above the liquid surface.
Emissions from fuel storage tanks (.Table 4.5) fall into three categories: breathing losses, caused by temperature and pressure changes in the tank, are found only with fixed roof tanks; working losses from filling and emptying are found with both fixed roof and variable vapor space tanks; and standing storage losses due to improper fits between seal and tank walls are found with -floating roof tanks.
TABLE 4.5 Typical Fuel Storage Tank Emissions*
Tank Type
fixed roof breathing loss working loss
(lbs/1,000 gals. transferred)
floating roof (standing storage loss)
variable vapor space (working loss)
Kerosene Emissions lbs/day- 1,000 gals.
0.036
1.000
0.005
1.000
95
* figures for kerosene used due to unavailability of figures for diesel oil and the similarity of the two fuels. Storage temperature: 63°F.

96
The color o~ paint on the tank sur~ace has a significant effect on emission quantity, due to the heat transfer properties of vario~s colors. The use of white paint, whlch reflects the most light and heat, results in the least emissions; gray coloration can result in 50 percent more emissions than white surface.
The American Petroleum Institute has developed a formula which can be used to calculate the various types of tank losses. The following is a sample calculation to determine the hydrocarbon breathing loss for a hypothetical fixed roof tank containing kerosene.
Fixed roof breathing losses can be estimated from the formula:
B.= 2.74 WK P 0.68 01.73Ho.51 T0.50 FPC Vc 14.7-P
where: B p
D H.
T Fp c
vc K w
= =
= =
= = =
= = =
Breathing loss, lb/day-10 3 gal. capacity True vapor pressure at bulk liquid temperature, psi a CO. 4) Tank diameter, feet (90) Average vapor space height, including correction for roof volume, feet (11) Average daily ambient temperature change, °F (15) Paint factor (1.00)
Adjustment factor for tanks smaller than 20 feet in diameter Capacity of tank, barrels (50,000)
Factor dependent on liquid stored (0.014) Density of liquid at storage conditions, lbs/gal. (6. 76)
Hydrocarbon breathing loss emissions for a hypothetical fixed roof tank containing kerosene were found to be l.l1 lbs/day/1000 gallon capacity.
Fuel Transfer Emissions: The transfer of fuel from the vehicles used to deliver it into the storage tanks at the base results in evaporative emissions (Table 4.6). Fuel transfer from storage tanks to boats (which consume fuel as well as deliver large amounts to offshore sites) also causes emissions. The quantity of these vapor losses depends directly upon the temperature, density, and vapor pressure of the fuel, and how saturated the vapor space is at the time of unloading. While the fuel is being transported to the offshore sites, vapor losses enroute from the tanks on the boats can be substantial.

TABLE 4.6
Typical Fuel Transfer Emissions*
operation
tank car unloading boat unloading boat loading boat transit
emissions
0.23 lb/1000 gal. transferred 0.24 lb/1000 gal. transferred 0.27 lb/1000 gal. transferred 0.32 lb/week per 1000 gal. load
Combustion Emissions: Combustion emissions from trucks, trains, boats and helicopters will contribute hydrocarbons, carbon monoxide, and nitrogen oxides to tha air.** Heavy machinery, including cranes, offhighway trucks, and forklifts will also generate combustion emissions.
97
Dust Emissions: The major sources of dust emissions are the storage and transfer facilities for dry-pumped cement and mud. Large dust clouds can form from accidental spillage or a hose blowout. This is a major source of air emission and possibly the most visible.
Spills and Breakage: Occasional spills of fuel and other stored materials and similar daily operational losses will constitute a relatively minor source of air pollution at a service base.
Water Quality
Changes in the level of water quality is expected to occur as a result of dredging and service base operations. As indicated in the section on "Data Deficiencies", samplings taken near the Brigantine border indicated that COD, suspended solids, and oil and grease levels were moderately high in the area probably as a result of improper discharge of effluents into the water. Increased boating activity will only add to the levels of oil and grease deposits in the area. Accidental spills and the transfer of fuels at the base also pose a potential problem in terms of downgrading the water quality.
Waste Water Discharges: base results in four sources
sewage bilge water ballast water cooling water
* assumed temperature: 63°F
The operation of a service of wastewater:
assumed vapor space saturation: 20 percent assumed fuel: kerosene every similar to diesel)
** There will be no rail or helicopter operations at the hypothetical base in Absecon Inlet.

98
Sewa9e: 5 The boats that use service bases generate approximately 30 gallons of sewage daily (~er capit~). Waste water form sources such_ as galleys, sinks. showers, and laundry amount to about the same quantity. Federal controls have focused primarily on sewage discharges; however, vessels which have installed Coast Guard-approved samitary waste devices (fecal coliform count of less than 1000 per 100 ml, and no visible floating solids) prior to January 30, 1978 can continue to use those devices as long as they are functioning properly. Any sanitary devices installed after this date must meet a higher effluent standard Cfecal coliform count of less than 200 per lOQ ml and suspended solid concentration less than 140 mg per liter) or contain holding tanks for sewage as of January 30, 1980. If proper treatment and discharge procedures are followed, little environmental damage is expected.
Bilge and Ballast Water: 6 Bilge water, which collects in the lower portion of boats, often contains petroleum products and metallic compounds leaked from machinery. The quantity of bilge water per boat can be calculated from the following equation:
Q = 0.004T Where Q - average bilge water generation rate (gals/min)
T = dead weight tonnage of vessel
For example, a 200 foot supply boat weighs approximately 100 tons. According to the above equation, this boat would generate 0.4 gallons per minute of bilge water, or nearly 600 gallons per 24 hours of operation.
Ballast water is taken in by an empty cargo or supply boat after unloading to improve the handling of the vessel. Most of the ballast water used by vessels at service bases would be non-oily (oily ballast water is found mostly in oil tankers). The composition of non-oily ballast water depends on the products transported, but it is often a mixture of pollutants which were contained in the vessel, and the polluted harbor water which was added as ballast. The final composition of the ballast water is further influenced by how long and under what conditions it remains in the vessel. Ballast water often has a high biological oxygen demand and contains high concentrations of fecal bacteria and heavy metals. These substances can be toxic to aquatic organisms and often contaminate recreational waters. It is anticipated, however, that most of the ballast water used at service bases will be taken on by the vessels delivering products; only small quantities will be discharged at the base site.

99
Section 311 (3} of the Federal Water rollution Control Act Amendment of 1972 (Public Law 92-500} ~rohibits:
"The discharge of oil or hazardous substances into or upon the navigable waters of the United States, adjoining shorelines or into or upon the waters of the contiguous zone, where permitted under Article IV of the International Convention for the Prevention of the Pollution of the Sea by Oil, 1954, as amended and (B) where permitted in quantities and at times and locations or under such circumstances or conditions as the President may, by regulation, determine not to be harmful."
The Oil Pollution Control Act of 1961, which ratifies applicable sections of the 1954 International Convention for the Prevention of the Pollution of the Sea by Oil, states that discharges of oily mixtures from bilges containing lube oil drained and/or leaked from marine machinery spaces are permitted. The Oil Pollution Act also allows the discharge of ballast water from vessels other than tankers when proceeding to ports with inadequate reception facilities. Title 33, Part 153 of the Code of Federal Regulations, classifies the discharge of oil from properly functioning vessel engines as not harmful and, therefore, not prohibited.
Under these circumstances, it appears that vessels using service bases will regularly discharge ballast water, bilge water, and engine oil into coastal waters.
Cooling Water: Cooling water, which circulates through vessels while their engines are in operation, is either discharged to the surrounding water or is recirculated and air-cooled. Because of their small volume, boat engine cooling water discharges are not expected to cause serious environmental impacts.
Runoff: 7 Because of the large volume of materials moving through serivice bases, frequent small spills of stored substances will occur. Drainage waters from portions of the yard where hazardous products are stored are often diked and the materials collected for treatment and off-site disposal. Any runoff which does leave the site and reaches the surface or groundwaters will likely be industrial in nature, and will contaminate the waters.
Noise 8
Because a service base is in operation 24 hours a day, noise is generated continually. Sources of noise from a service base include pneumatic power tools, air compressors, pumps, compressed air machinery for painting and cleaning, industrial trucks, and cranes. In addition, auxiliary generators, or harbor sets, which may be present at the base, "can be bery noisy unless operators are encouraged to dampen the sound." The noise levels and

100
various controls are presented in Table 4.7.
TABLE 4.7
Sources of Noise at Service Bases
SOURCE
Pneumatic Power Tools
air compressors
generators (at 6 feet)
pumps
compressed air machinery (painting and cleaning)
industrial trucks
cranes
DECIBEL LEVEL AT OPERATOR'S POSITION
90-115
92-100
90
80-90
91-104
90
75-85
CONTROL TECHNOLOGY
sound absorbers
mufflers enclosure of equipment
not available
enclosure
mufflers
mufflers
mufflers
If a service base is located in a relatively quiet inhabited area, the noise which it generates will present a problem. Typically, a noise level increase of 30 decibels or more will result in complaints from local residents.
Fresh Water Demand
The projected number of employees at the hypothetical service base in Absecon Inlet is 336 (Table 4.10). The number of rigs to be serviced from the base is 9. Based on these figures the fresh water demand is estimated to be approximately 160,000 gallons per day. Atlantic City is capable of pumping 25 million gallons per day of water. The 1976 summer demand was 13 to 14 million gallons per day. The service base demand alone would not add appreciably to overall water usage in the city.
Truck Traffic
The amount of truck traffic generated by a permanent service base is contingent upon the number of offshore rigs the base is capable of supporting. The hypothetical service base sited in Absecon Inlet will support nine rigs. Assuming that four 15,000 foot wells

are drilled by each. rig each. year, Table 4.8 illustrates the amount o~ supplies that will move through the Absecon B.ase to support production drilling.
TABLE 4.8
Materials Transported, Atlantic City Service Base
t1aterials
Mud
Cement
Tubular goods
Fuel for drilling
Fuel for transportation
Production Drilling
2100 tons/rig/year
1144 tons/rig/year
1908 tons/rig/year
14,280 bbl/rig/year
12,800 bbl/rig/year
Total For 9 rigs/year
18,900 tons
10,296 tons
17,172 tons
128,520 bbls.
115,200 bbls.
101
The transportation of supplies by truck to a service base is restricted by allowable weight limitations on highways and the size of trucks used in transporting the equipment. A flat bed truck is capable of transporting approximately 29 tons of tubular goods, a dry bulk trailer approximately 27 tons of mud or cement, and tanker trucks approximately 6500 gallons (154.76 barrels) of fuel. Based on Table 4.8 and the above figures, Table 4.9 estimates the number of truck trips to the Atlantic-City Absecon Inlet hypothetical service base.
TABLE 4.9
Truck Trips, Atlantic City Service Base (Per Year)
Total required for Total Truck Materials 9 rigs/year tri:es/year
Mud 18,900 tons 700
Cement 10,296 tons 381
Tubular goods 17,172 tons 592
Fuel for drilling 128,520 bls 830
Fuel for trans- 115,200 bbls 774 portation
TOTAL ... 3,247

102
Based on the above figures the average daily truck traffic is estimated at 8 to 9 vehicles. In addition trucks will deliver food, tools, and parts for the offshore operations.
Although the truck traffic is not a significant amount, local road conditions and traffic conjestion in summer months could hinder the movement of supplies.
Socio-Economic Impacts Associated With Development of The Base
Table 3.6 outlines the OCS requirements when economies of scale are employed. Based on this method, the hypothetical service base in Absecon Inlet is capable of servicing 9 rigs with 15 supply boats.
The projected levels for employment, wages, housing demands, and services demands are obtained by utilizing the methodology outlined in section 3.6.2 of this report. Table 4.10 illustrates employment, origin of employment, and wages earned at the base. Total direct employment is 336 with $4,794,000 being earned by 282 local employees and $918,000 earned by 54 new resident employees.
TABLE 4.10
Direct OCS Employment and Wages, Atlantic City
Supply Boats Onshore Crews Local New Local New Hire Residents Hire Residents Total
Employment 246 54 36 0 336
Wages* ($) ~4,182,000 918,000 612,000 0 $5,712,000
* $17,000 annual salary from RALI/Factbook
New esident employees will produce new loadings on the infrastructure. The 54 new resident employees will generate a new resident population of 154 with 39 of this total being school aged children requiring service delivery. At the same time new residents will place demands on the housing market for approximately 49 units.
The employment methodology also estimates the total projected employment in the region derived from direct service base employment. It is estimated that for every direct OCS job, 2.5 employment opportunities will be generated. Thus, the 336 direct jobs will create a total of 840 in the region.

These socio-economic impacts, by themselves, are not particularly great. However, it must be pointed out that these impacts must be added to impacts generated from helicopter base operations in the Atlantic City area from which offshore crews- are transferred. It must also be cautioned that there will undoubtedly be spin-off effects that cannot be quantified at this time.
4.1.9 Conclusion
The Absecon Inlet area is primarily utilized for commercial, residential, and recreational activities. The small petroleum transfer station west of Clam Creek may be classified as an industrial use but the activity generated by that facility is minimal and does not set a precedent for industrialization of the harbor.
103
The interim zoning ordinance recently adopted by Atlantic City officials and the Brigantine City Master Plan designates the Inlet for resort-commercial activities. Industrial activities are not considered the highest and best use for the area.
The development of a service base in the Inlet would require significant alteration to an environmentally sensitive area. Extensive dredging, pile driving, and spoil disposal is necessary to develop sufficient wharf and channel access. Runoff and erosion from the waterfront site will probably increase, and as a result alteration of the biota in the area will most likely occur from increased siltation and turbidity. The wetlands in Absecon Inlet are highly productive and afford a high energy transfer system. Further encroachment upon this system through unnecessary construction activities is unwarranted.
The economic benefits derived from OCS operations may conflict with the resort economy and, thereby, reduce overall economic benefits. Atlantic City has traditionally derived an economy from commercial and tourist activities. The recently enacted State legislation restricting casino gambling activities to Atlantic City promotes the area as a major tourist center.
The rapid movement of supply vessels in and out of the harbor may conflict with commercial and pleasure boat operations in an area described by the New Jersey State Marine Police as congested.
The aesthetics of a service base operation would detract from the scenic view of the bay and wetlands. A buffer to screen the industrial base from the waterview is not feasible since this would restrict port side access.
The exploration and development of oil and gas on the OCS off the coast of New Jersey is not dependent on

104
the siting onshore operations in a coastal resort area. New Jersey has industrial port facilities with developed infrastructures within 135 to 150 miles of OCS Lease Sale No. 40.
4. 2 The New York-New- Jers-ey l?ort Authority District
4.2.1 Proposed Use
The support base proposed for the N.Y.-N.J. Port Authority District is a large permanent service base with_ capabilities for expansion to support pipeline and platform installation facilities.
4.2.2 Identification of Land and Water Types
The N.Y.-N.J. Port Authority Dis-trict encompasses an area of 1,500 square miles within a radius of approximately 25 miles from the Statue of Liberty. The specific study areas are indicated on ~1ap 6. This study is complemented by the "Onshore Support Base" study prepared by the Planning and Development Department of the N.Y.N.J. l?ort Authority for the State of New York.
The waterways are estuarine bay areas and fresh water rivers. The land area along the Arthur Kill is predominately filled tidal marsh in an urban environment. The area along the Raritan River and Bay is partially filled tidal marsh (sanitary land fill sites) and wetlands of undetermined qulaity.
The Federally Maintained Channel Depths and Widths (Map 7 1 8 1 and 9} are:
Raritan River Channel Red Root Reach east to Raritan Bay-
25 ft. (mlw) 1 200 ft. wide
Red Root Reach southwest to Crab Island ReachIS ft. lmlw) 1 200 ft. wide
Arthur Kill Channel Raritan Bay north to Ward Point Bend to Outerbridge Reach-
35 ft. (mlw) 600-800 ft. wide
4.3.3 Identification of Land and Water Uses
Raritan River-Raritan Bay Region
Edison -- predominately undeveloped tidal marsh and sanitary landfill; the township ordinance indicates zoning is H-I (heavy industrial)

NY- NJ
JERSEY
LEGEND
CD Carteret*
~Woodbridge* (J) Perth Amboy* t @South Amboy*
PORT AUTHORITY New Jersey Sites
MAP 6
(5) Woodbridge- Keasbey* @ Edison* (J) Port Kearny t
@ Port Newark t ® Greenvi lie Yards t
• Site studied by Rutgers, The State University t Site studied by New York- New Jersey Port Authority
105
DISTRICT
(i] liquid Natural Gas Facilities
Highways: ---{~-:...___ Interstate .,_
u.s. State
Under construction

DEPTH· FT.
*I ~I ~I
LEGEND f -M NEW WORK HMAINING TO B£ DONE
RARITAN RIVER, N. J. 30 JUNE 1975
SCALE OF FEET 2000 0 ~
DEPARTMENT OF THE ARMY YORK DISTRICT, CORPS OF ENGINEERS
NEW YORK, NEW YORK
I T
B A y
~
0 0\

/
It A R
• I T A y
S T A T E N
S L A N D /
/ /
--- --
A N
--
UPPER
BAY
LOWER
BAY
MAP_8
107
N.Y. AND N.J. CHANNELS GENERAL MAP
30 JUNE 1975
SCALE OF FEET
11000 0 11000
DEPARTMENT OF THE ARMY NEW YORK DISTRICT, CORPS OF ENGINEERS
NEW YORK, NEW YORK
(SHEET NO.I OF 3 SHEETS)

108
DATUM (M.l W) - 2 & F'T aELOW M.S.L
RARITAN 8 A Y
S T A T E N
I S L A N 0
/ /
/
MAP.9 __
RARITAN RIVER TO ARTHUR KILL, N.J. CUT -Of"f. CHANNEL
30 JUNE 197!5
SCALE OF FEET
1000 0 1000
DEPARTMENT DF THE ARMY NfW YDRK DISTRICT, CORPS DF ENGINEERS
NEW YORK, NEW YORK

Keasbey-Woodbridge -- land immediately east and west of the Garden State Parkway is industrially developed; zoning is light to heavy industry; existing uses include a tank farm, refractory, and electronics plant.
South Amboy -- Sanitary landfill site, unutilized coal terminal, and recreational area; proposed use along the beach on the Raritan Bay is in open space preservation; west along the River channel the zoning is industrial.
Arthur Kill Region
This area includes Perth Amboy, Woodbridge, and Carteret. The predominant use is industrial waterfront development. A small section in Perth Amboy on the lower Arthur Kill is zoned residential, as is a section in Woodbridge about 0.5 miles north of Perth Amboy.
109
Industrial uses include tank farms, bulk cargo and containership facilities, salt and sand storage areas, smelting and metal refining, and petrochemical research and development.
Water Uses In The Region
Water uses include limited recreational boating activities along the Raritan River and lower Arthur Kill and light to heavy industrial shipping activities on the Arthur Kill.
4.2.4 Data Deficiencies
Productivity of Undeveloped Wetlands
The wetlands in the study area have not been mapped by N.J./DEP, Office of Wetlands Management. The quality of these wetlands has not been determined.
Soil Bearing Capacity
The only precise method of testing the capacity of the soil to bear certain loadings on a specific site is to conduct soil boring tests. The test will determine soil type, compaction, consistency, and profile at various depths. If the area is already developed, assumptions may be made based on existing uses and the ability of the soil to bear the loadings of those uses. Where the soil presents construction and load bearing problems, engineering techniques may be employed to overcome the deficiencies.
The soil survey prepared for Middlesex County by the U.S. Department of Agriculture, Soil Conservation Service indicates that undeveloped areas along the north bank of the Raritan River are tidal marsh, and the

110
developed areas are unsurveyed but supporting an urban structure. The South Amboy area is developed urban land, filled land (sandy over tidal marsh}, and undeveloped tidal marsh. The Arthur Kill region is not surveyed in this study, however this area supports an urban industrial environment. 9 An earlier soil survey indicates that soil is man-made fill of municipal and industrial wastes, and marine tidal marsh. 1 n
Quantification of Boat Traffic
The Port Authority of N.Y. and N.J., the U.S. Coast Guard, and the Marine Police have not compiled data to quantify daily boat traffic in the Port District. There are no data presently available to determine the "carrying and spatial capacities" of the waterways in the Port Authority District.
4.2.5 Opportunity Analysis
The study areas indicated on Map 6 present varying degrees of ~pportunity for OCS support base development.
Navigational Access
Navigational access is provided to harbor facilities from the Raritan Bay by the Raritan River Channel leading west or the Arthur Kill Channel leading north. Except for the channel southwest of Red Root Reach (Edison) , the Raritan River and Arthur Kill Channels exceed the 15 to 20 feet minimum depth requirement. The Arthur Kill north to Carteret poses no bridge obstruction problems. The Raritan River (northwest of South Amboy Reach) is obstructed by two low clearance swing bridges.
Wharf Space and Available Acreage
All the sites have available waterfront acreage in excess of 20 acres, except South Amboy. In the areas along the Arthur Kill, wharf space is available; some sites require restoration of wharves and piers. The Raritan River sites in Keasbey (Woodbridge) and Edison require extensive development in terms of landfill and wharf space.
Highway Access
Highway access to all sites except Carteret is provided by means of commercial or industrial roadways which link with major New Jersey, U.S. or Interstate arterials. Carteret presently has the most inefficient transportation route. The New Jersey Turnpike, Interchange li is located in Carteret; transportation from this point ot the waterfront district is provided by means of local residential roads. A plan to construct an industrial route is awaiting state approval.

The ~erth Amboy site south of the Outerbridge Crossing provides the most efficient highway access. The site is reached from N.J. 440, an east-west freeway that interchanges with U.S. 1, u.s. 9, the New Jersey Turnpike (I-95), and I-287.
Rail Access
All sites have freight rail access adjacent to or within the waterfront industrial district.
Sewer and Water
Sewer and water lines exist or may be extended to the various sites.
Labor Market
There is an available labor force in the study area. Middlesex County has an unemployment rate of 8.2%. The specific study areas in the county have the following unemployment rates: Woodbridge, 8.1%; Perth Amboy, 10.5%; Edison, 7.6%; Carteret, 7.9%; and South Amboy, 11.9%. 11
Zoning
Local zoning as indicated in section 4.2.3 allows for industrial waterfront development.
4.2.6 Impact Analysis
The undeveloped wetlands in the Raritan River are
111
of undetermined quality; the Department of Environmental Protection has not mapped this area. Prior to development, an environmental assessment should be conducted to determine the productivity of these wetlands and their value to the ecosystem.
Development on any sanitary landfill site is not advisable until at least 10 years after the site is closed. Soil investigations must be conducted and sophisticated development procedures implemented to prevent foundation collapse, methane gas problems, and leaching of pollutants into the water supply system.
The transportation network in the Raritan-Arthur Kill Region is highly developed, allowing any onshore service base employees to live in a number of communities and still be within a 25 minute commuting distance to work. Demands on one community to provide services for new residents are not likely to occur.
4.2.7 Value Analysis
Historically, the coastal zone north of Raritan Bay has served as a highly urbanized industrial port district. This

112
mode of land and water use is not likely to change. The method of land and water development may be upgraded by implementing environmental controls and the latest technology to reduce air and water pollution. In an effort to improve the quality of life for all citizens in New Jersey and to reduce adverse impacts, this area should not be eliminated from a coastal zone management program.
If development of OCS support facilities is performed in accordance with environmental regulations, the impacts are likely to be minimal. These facilities produce less industrial activity than many of the industrial complexes that presently exist in the Port Authority District.
The political atmosphere is generally favorable toward OCS facilities in the Port Authority District. Meetings with local officials in Woodbridge, Carteret, South Amboy, Edison, and Perth Amboy indicate that support base development is an acceptable proposal for the waterfront district. Some officials, however, were concerned that a service base would not be a competitive tax ratable with other industrial proposals.
Environmental groups and shellfishermen generally concurred that if New Jersey chose to accept OCS support base development, oil companies should be directed toward industrial waterfront areas. The concensus of opinion of the general public during open discussion at public meetings held in various areas of the state indicated that northern industrialized waterfront districts were also more acceptable locations for service base development than southern New Jersey coastal areas.
4.2.8 Constraint Analysis
Constraints to development in the Raritan-Arthur Kill Region include:
wetlands
river obstructions
highway access
The Raritan River area contains undeveloped wetlands. An environmental assessment of this area is necessary.
Navigational access to sites along the Raritan River are obstructed by two bridges with vertical clearances of 8 and 28 feet. These are swing bridges, but delays in opening increases navigational times.
Access to waterfront sites in Carteret is limited by local residential routes.

channel depth
harbor traffic
L.N.G. tankers
113
Navigation on the Raritan River, southwest of, the Keasbey Reach, is limited by a maximum' maintained channel depth of 15 feet.
Traffic congestion is greater in the Upper New York Bay than in the lower Bay Region because of the merger of shipping from points north.
Liquid Natural Gas (L.N.G.) storage facilities have been constructed in Staten Island on the east bank of the Arthur Kill. These facilities are currently unutilized. If activated, the Coast Guard will close the harbor to all shipping traffic when an L.N.G. tanker enters the area. The harbor may be closed for 2 hours, according to Coast Guard sources. Middlesex County officials are concerned about additional boat traffic on the Arthur Kill if the area were open to tankers carrying liquid natural gas to storage tanks on Staten Island.
4.2.9 Specific Site Selection
The waterfront sites along the Arthur Kill have greater locational advantages for OCS facilities than sites along the Raritan River. Specifically, the southern reach of the Kill offers more opportunity for support base development because of proximity to the sea and less interference from other shipping traffic.
Perth Amboy, south of the Outerbridge Crossing, has been selected for site plan analysis. The site meets all the above criteria. It is located less than 5 miles from the Raritan Bay on the Arthur Kill Channel. The site is easily accessible from N.J. 440 Freeway. Route 440 is an east-west interchange with u.s. 9 and 1, the New Jersey Turnpike (I-95) at interchange No. 10, and I-287.
4.2.10 Siting of a Permanent Service Base in Perth Amboy
The selected site along the Arthur Kill (Map 10) is just south of the Outerbridge Crossing. It is located in an area which is predominantly industrial in nature (Map 11). Figure 4 illustrates a hypothetical site plan for a permanent service base of approximately 62.6 acres with 2,550 feet of wharf space, and has the capability to

114
support 15 offshore rigs. Proposed land and water facilities include:
Docking Facilities
1. 2550 feet of wharf space 2. 12 berths of 200 feet each 3. 75 foot wide reinforced concrete apron adjacent
to dockside facilities
Land Facilities
1. 26 silo steel tanks, 12 feet wide by 35 feet high, for storage of drilling muds and cements
2. 2 fuel tanks of 35,000 bbls. each for storage of diesel fuel
3. 3 warehouse complexes a. 135,000 sq. feet b. 135,000 sq. feet c. 43,750 sq. feet
4. Open storage - 737,000 sq. feet 5. Office space - 60,000 sq. feet 6. Parking area
a. 122,000 sq. feet b. 325 parking spaces
7. Security Station- 375 sq. feet 8. Flood Lighting - placed throughout the base, but
most intensive at dockside 9. Site Access - obtained via Route 440 and State
St. through private road to site 10. Buffer zones - adjacent uses are industrial and
buffering not required. Planted open space areas meet Perth Amboy's zoning requirements.
11. Emergency Helicopter Pad - 40,000 square feet
All of the concepts discussed in Chapter 5 (Opportunities for the Assessment and Reduction of Adverse Impacts of OCS Support Base Development) are incorporated at the base where feasible.
Development and Operation at the Base
The development of a permanent service base requires some alteration of the shoreline along the Arthur Kill. There are four deteriorated timber pile open finger piers as well as rotting barges next to the piers that must be removed prior to development. The marginal wharves illustrated in the site plan (Figure 3) are constructed to the bulkhead line incorporating fill to develop a land area up to dockside.
Adjacent to the wharves are large open areas where supplies.shipped by rail can be stored. An existing rail line services the industrial complex to the north of the site (Map 11). A rail spur can be extended to the

Hypothetical Site Perth Amboy
1000 0 1000 2000 H H H ===-:J
FEET
r.. ~r~ tr 7 . ~ -c ~ . , jg . ~ ,······.... ... . ~ - m
Sources: USGS Quadrangles Perth Amboy & Arthur Kill Updated Augl977- CCES Cartography Laboratory
Rutgers University
~ -t :I:
)>
~ o.:J 0 -< -t 0 -c 0 G) ~ )> -c :I: -<
.. .. Cll

116
southern portion of the service base from adjacent rail sidings. This extension, however, would require more site alteration than a northerly spur.
Materials that are delivered by rail include tubular goods, drilling muds, and cements. Direct rail service reduces the amount of s-torage space required at the base since supplies, such as tubular goods, can be shipped in a short period of time from manufacturing mills in Pennsylvania.
The area is easily accessible by highway transportation routes. As previously mentioned, N.J. 440 Freeway is adjacent ot the entrance to the site. Route 440 links with U.S. 9 and 1, the New Jersey Turnpike, and I-287. A rail line directly to the site, however, should substantially reduce the amount of truck traffic generated by operations at the base.
The warehouses are of sufficient size to store, process, and assemble all of the materials required offshore. One of the warehouses has a second floor operations headquarters which allows the supervisor of the base to oversee operations and to coordinate the loading and unloading of supply boats.
An office building is constructed to the rear of the site and has 60,000 square feet of space in the twostory structure. Parking for office employees is adjacent to the building. Long-term parking for supply boat crews is provided near the entrance to the base whereas spaces adjacent ot the warehouses are for individuals who make daily trips to the base.
Two diesel fuel tanks are placed on the. site approximately 500 feet from the water to reduce the possibility of spills reaching the water if dikes fail. Mud and cement tanks are positioned near the apron area in order to allow the powdered materials to be blown onboard the vessels.
A magazine for explosives up to 100 pounds in weight is placed so that it is at least 200 feet from occupied buildings as prescribed by law (see section 5.6.6 Explosives}.
Numerous floodlights are positioned at the base so that the quayside area is especially well lighted for nighttime operations as well as being directed in such a manner that the light does not shine toward the Arthur Kill or onto adjacent properties.
An emergency helicopter pad is provided in case supplies are needed in a timely manner to prevent loss of life or environmental damage at offshore drilling sites.

ARTHUR
K I L L
\ ~
\ MAP 11
lEGEND
I ndustrial
~ Commercial
U Residential
-r-+-- Railroad I Conra i l )
Existing Shoreline and Docks
0 200 400 600 800 1000
Scale in Feet
UNIVERSITY
117


FIGURE 3
• "' z 0
CONRAil
PERTH Site
AMBOY Plan
UNION CARll DE PLASTICS co.
~ O.-n Stor•e•
Q Warehouse
0 Apron
..a.&..Y.L Parkiftl Lot
:If Guor41 Houae
0 ,. .... Li ... t 0 Li .. t Sto ... ul
lEGEND
Two Story luilding
0 lose Operat•ont Office
C fu.l Tonic aftd OikH A reo
liiJ Orilli"' Much and CeMent
~ ~ Emerpncy Accna Route
OUTERIRIDGE TERMINAl, INC.
,----
• bp .. tiYOI Moe-ziM
Q Vegetative luffer
0 lll'dvtttlol lo.cf U••
0 E•ere••cr H.liport
---- Property liRM Ta~tlct --- Existi"' 5horolif'lo ond
+--+- l a ilroocl
_____ ,
\ \ _______ ,
. ' ___ ..t
' - _,
I
- I
200
S<ole In '•••


Although not shown in the site plan, cranes will move along the apron to lift supplies onto the deck of supply boats. Portable tanks can be used to hold wastewater from workboats as well as contaminated bilge and ballast water until properly disposed of.
To monitor all traffic that enters the site, a security station is provided at the entrance to the site. From here, supplies that are being shipped would be noted and unauthorized persons would be refused entry.
The plant cover on the site along the 20 foot contour line has been preserved so that site alteration is kept to a minimum. The plant cover also serves to minimize runoff and erosion that might occur if the site were altered extensively. It shoulq be added that this site was formerly used as a coal terminal and had rail lines running onto the finger piers. It appears, from site inspection and knowing its former use, that the site should be able to support storage of materials with few problems as to load bearing capacities of the soils.
A draft of 20 feet for supply boats would be required at the site. According to NOAA Chart C.&G.S.-375, present water depths at the site range from 11 feet at the north end to 18 feet at the southern end of the site. Depths of 20 to 24 feet are indicated for the middle portions of the site. This indicates that dredging is required in
121
some areas but is not necessary to gain access to the site from the Arthur Kill Channel which is maintained at a depth of 35 feet by the Army Corps of Engineers. The adjacent industrial uses north and south of the site are dredged to 35 feet at dockside to facilitate the movement of bulk cargo and container ship traffic. Dredging to dockside at the proposed site would be less extensive than the dredging that was required to develop adjacent industrial uses.
Regulatory Procedures
The development of a permanent service base in Perth Amboy on the Arthur Kill requires approvals from governmental agencies at the federal, state, and local levels. The Arthur Kill Region is not within the delineated CAFRA boundary of New Jersey, nor is it regulated by the N.J. Wetlands Act of 1970. 12
Pre-Application Conference: The application process may begin at the option of the developer with an informal pre-application conference with the N.J. Department of Environmental Protection (DEP), Division of Marine Services, Office of Riparian Lands Management and the Division of Water Resources.
The following documents should be presented by the applicant at this conference:

122
a description of the site and proposed facility, the dimension, number, and uses of proposed structures, maps indicating the site's location and rough internal plan of development.
The agencies present at the informal conference will candidly discuss the proposal and outline other requirements; if a detailed E!S is required, procedures will be explained at the conference.
Formal Application Procedures13
The applicant may apply simultaneously to all governmental agencies having jurisdiction over the proposed project. No application is complete for review unless the applicant has submitted all required information to the reviewing agency. The statutory time limitation for an agency's decision begins to run when an application is declared complete for review.
Site Plan Review: A site plan submitted to any agency should be a complete detailed proposal covering all activities for construction and operation of the base. Each agency responsible for site plan review and approval will stipulate the documents that must be included in the site plan application. If the site plan is approved, the permits required by those agencies involved in the review process will be issued with site plan approval. Table 4.11 outlines the Site Plan Review agencies.
Construction Activities: The construction of a marine service base at the specific site wil~ require several permits. Some of these permits will be issued with final site plan approval. The processing time listed in Tables 4.11 and 4.12 may all run concurrently.
Operation of the Base: Certain operations at a service base in Perth Amboy will be regulated by various governmental agencies. The restrictions listed in Table 4.l3 will apply.
Fees and Time Limitations: Any fees that are required by various agencies are submitted at the time an applicant applies for approval or when the agency issues a permit. In some instances, there is a fee levied for application review and issuance of a permit.
Most approvals are granted subject to time limitations. The activity for which approval is given must be completed within a stipulated time period unless an extension is granted. Failure to comply with these time limitations negates the permit approval.

TABLE 4.11
Project Review· For Service Base, Perth Amboy
Agency 1
U.S. Army Corps of Engineers N.Y. District
N.J. /DEP Office of Riparian Lands Mgmt.
N.J. Dept. of Energy
N.J. Energy Facility Review Board
Perth Amboy Planning Board
Middlesex County Planning Board
Permit
Construction, dredging and 404
Riparian Conveyance 3
Riparian Stream Encroachment
Review and Comment to N.J./DEP
Authority to override recommendations of Dept. of Energy or decision of N.J. DEP
Subdivision of Site Plan Approval
Preliminary Approval Final Approval
Subdivision and Site Plan Approval
1. Other agencies may request project review 2. N/A indicates no starutory time limitation
Processing Time
N/A 90 days 90 days
90 days
N/A
95 days 45 days
30 days
3. A riparian conveyance must be obtained before any approval for development on the tideflowed lands can be granted.

Activity
Dredging and Filling
Transportation & disposal of dredge spoils
Removal or disturbance of soil of 5,000 sq. ft. or more
B.uilding Permit for construction of facilities on land and in the water
TABLE 4.12
Permits For Construction of Base, Perth Amboy
Agency
U.S. Army Corps of Engineers N.J./DEP
Office of Riparian Lands Mgt. Division of Water Resources
Bureau of Flood Plain Mgt.
Office of the Director
U.S. Army Corps of Engineers
N.J./DEP Division of Water Resources Office of the Director
Freehold Soil Conservation District
U.S. Army Corps of Engineers
N.J. /DEP Office of Riparian
Lands Mgt. Division of Water Resources Bure~u of Flood Plain Mgt.
Perth Amboy Planning Board &
Building Dept.
Permit
Dredging & 404
Riparian
Stream Encroachment
Water Quality Certification
404
Water Quality Certification
Soil Control Certification
Construction
Riparian
Building
Plumb.ing Electrical
Process-ing Time
N/A
90 days
90 days
1 yr. usually issued within 1 month
N/A
1 yr. usually issued within 1 month
30 days
N/A
90 days
Is.s.ued with s.ite plan approval N/A ...
N/A

Storage facilities, 35 feet in height for fuels, muds, and cements
Storage facilities for explosives
Extension of Sewer facilities
Connection to existing city waterline
Connection to electrical utilities
Air Pollution Equipment
Road and driveway access to property
Helistop
( 1,\ I '.I I. :, . I.' 1 111 t I 'd. )
Perth Amboy Planning Board
Fi:re Dept.
U.S. Coast Guard
N.J. Dept. of Labor and Industry Office of the Mayor Fire Department
Perth Amboy Board of Adjustment
N.J. /DEP Division of Water Resources,
Public Waste Water, Facilities Element
Perth Amboy City Engineer
Perth Amboy City Engineer
Public Service Company
N.J./DEP Bureau of Air Pollution
Adjacent Property Owner
Federal Aviation Administration
N.J. Dept. of Transportation, Division of Aeronautics
Conditional Use
Bulk Storage
Handling and storage of explosives
Storage of Explosives
Use variance
Sanitary Sewer Facility
Sewer Utility
Water Utility
Electrical Utility
Construction of air pollution equipment
Easement
Approval for use of air space
Part of Site Plan Approval N/A
N/A
N/A
12Q days.
9Q days.
N/A
N/A
N/A
N/A
N/A
N/A
Approval for area of N/A defined dimension for landing and tak-ing off of helicopter

Operation
Right to occupy and use facilities at the base
Supply boats and other vessels
Discharge of pollutants from point sources into the water
Disposal of hazardous wastes accumulated at offshore and onshore facilities
TABLE 4.13
Permits For Operation, Perth Amboy
Agency
Perth Amboy Building Department
U.S. Coast Guard
U.S. Environmental Protection Agency
N.J./DEP Division of Water Resources Office of the Director Monitoring, Surveillance, and Enforcement Element
Inte~state Sanitation Commission
N.J./DEP Solid Waste Administration
Restrictions
Certificate of Occupancy; all facilities must meet construction Code (N.J.A.C. 5:23-1 et. seq.} and must comply with all provisions of site plan requirements
Licensing of vessels and operations approval and inspection of vessel equipment
Navigation Rules (CG-169)
N.P.E.E.S. Permit
Water Quality Certification Compliance with water quality
standards and N.J. Water Pollution Control Act of 1977, c.74.
Compliance with water quality standards and N.J. Water Pollution control
Annual Report to Administration on quality and type of wastes; Disposal with a regulated carrier licenses by N.J./DEP to dispose of such wastes

Workplace conditions that conform with established federal standards for general industry and maritime operations
Air Pollution Equipment
Signs at ingress to service base or on site
Storage of fuels in tanks with a capacity of 35,000 bbls. of
Recruiting Employees (Strikebreaker Clause)
(TAB.LE 4.13 cont 'd l
U.S. Dept of Labor Regional Office Belle Meade, N.J.
N.J./DEP Bureau of Air Pollution
Central Jersey Regional Air Pollution Control Commission
Perth Amboy Planning Board
Perth Amboy Building Dept. Private Property Owner
N.J./DEP and N.J. Division of Taxation
Perth Amboy, Dept. of Environmental Control
U.S. Environmental Protection Agency
Perth Amboy City Council
Regulations set forth in the Occupational Safety and Health Act of 1970
Certificate to operate air pollution equipment. Enforcement of air pollution standards
Must conform with local design regulations
Sign Permit Easement
$.01 per barrel tax as stipulated in the N.J. Spill Compensation and Control Act
Docked vessel must be enclosed with a floating boom
Development of Spill Prevention Control and Countermeasure Plan
Perth Amboy City Code 389-1 prohibits any person, firm or corporation not directly involved in a labor strike or lockout to recruit persons for employment or to secure or offer to secure employme.nt for anyone when the purpose is to have such persons take the place of striking employees
* Tt is· anticipated that this permit will he issued by N.J .IDEP Divis.ion of Water Resources so111etiroe in 1918.

128
Impact Ana.lysis *
Environmental Impacts: The development and operation of the hypothetical base should cause minimal adverse environmental impacts if mitigating measures and proper operating procedures are observed. Site alteration will require:
removal of deteriorating piers and barges filling in of low productivity wetlands consisting of Phragmi.tes: eommunis· vegetation at the north end of the site filling to extend and expand the site to the bulkhead line excavation of a small section of the site to increase marginal wharf space
Proper construction techniques should minimize adverse effects, and the removal of deteriorating waterfront piers and barges will improve existing site conditions.
Dredging operations will produce few adverse impacts. Physical conditions on the Arthur Kill do not make such factors as drainage, circulation, size, freshwater, influence, closure, and temperature applicable or critical in the assessment of dredging impacts. Bottom characteristics, such as specie productivity, and vegetation cover are not of high quality, and therefore, species destruction and vegetative destruction will not significantly alter existing ecosystems. The only adverse impact that might occur would be the resuspension of chemical pollutants, but data on bottom chemical conditions do not exist to assess this possibility. Dredging operations requiring u.s. Army Corps permits have taken place at adjacent sites on the Kill, so it would appear such operations at the hypothetical site would also be approved.
Assuming that dredge spoils are disposed of in a manner consistent with state and federal policies or disposed of onsite in the area requiring fill, environmental impacts will be negligible (For a more extensive discussion of dredging impacts see section 4.1.6).
The availability of a sewer system is another factor that affects environmental impacts. Sewer lines presently service the area and would have to be extended to the site. However, a problem exists concerning the ability of the pumping station to handle additional daytime loads. Mr. Martin Langenohl, City Engineer of Perth Amboy, suggested two solutions: ll construction of sewage-holding
* Air Emissions, Waste Water Discharges, Noise and Runoff as outlined in Section 4.1.8 and also applicable to the Perth Amboy Site.

tank.s. for dispos.al during non-peak hours, or 2) the construction of an on-site pumping station. Either of. these s-olutions could be applied to remedy the problem, or alternatively, the improvement o~ the existing municipal pumping station would correct the situation. It is evident, therefore, that solutions can be implemented so no adverse environmental impacts will result.
Concern has been expressed by Middlesex County officials- about boat traffic and safety conditions in the Arthur Kill. An examination of accident reports from Vessel Traffic Service of the U.S. Coast Guard for the years 1971-1975 reveals that 16 accidents were reported
129
between 40°-29.0 and 40°-31.5 North Latitude and 74°-08.0 and 740-18.0 West Lo~gitude, the area from the Outerbridge
Crossing south to the Raritan Bay that would be travelled by vessels from the hypothetical base. Of these 16 accidents, seven were collisions involving two vessels, three were rammings of stationary objects, and six were groundings. Coast Guard investigation of the seven collisions revealed that four were caused by equipment failure, and the remaining three were preventable in the judgement of the Coast Guard.
Additional vessel traffic generated by a permanent service base would consist of highly maneuverable 200 foot supply boats. These vessels, observing existing safety regulations, should not greatly increase the possibility of accidents occurring in the area.
Fresh Water Demands: Fresh water demands as a result of the operations at the hypothetical service base are projected to by approximately 266,000 gallons/day with 214,000 of that being transported to drilling rigs for use offshore. The projected total demand per day is not a considerable demand on the water supply. Perth Amboy is presently capable of meeting these demands. However, Perth Amboy currently is experiencing potable water delivery problems.
Perth Amboy is part of the Lower Raritan/Middlesex County area which is highly developed and faces unique water quality problems. Unlike other urban areas, it is situated directly on top of its supply. Contamination exists in this area because of overpumpage, improperly located and maintained landfills, and industrial storm runoff. 1 '+
Perth Amboy draws some of its water supply from the Farrington Aquifer. Safe yield estimates from this aquifer are considered to be under 25 million gallons per day however, DEP Water Policy and Supply Council has authorized 44 million gallons ~er day in diversion rights from the Farrington Aquifer. 5 If the safe yield data are correct, the authorized diversion rights could lead a community to overestimate its true water supply potential.

130
In addition to its own well water supply, Perth Amboy also draws water from the Middlesex Water Co. Recently Perth Amboy was forced to purchase more water from the Middlesex Water Co. when some of its own wells were closed by DEP because of chemical contamination from an improper industrial discharge.
Industrial pollution and saltwater intrusion are two problems currently threatening a safe water supply in Perth Amboy.
In recent years, Perth Amboy has experienced an industrial exodus. The Dept. of Engineering of Perth Amboy estimates that at one time the city was producing 11.5 million gallons of water per day and purchasing water to meet a total peak demand of approximately 12.25 million gallons per day. The Department now estimates current demands at 6 million gallons per day. Thus, the city contends that despite its problems in the Farrington Sands and industrial pollution, it maintains a system with surplus productive capacity.
Although it does not appear that the projected water demands of the hypothetical service base would in and of itself overburden the Perth Amboy water supply system, these demands must be considered in light of other present and future demands. If Perth Amboy is forced to purchase water from other sources to meet potable demands the resulting cost could be quite expensive.
The Middlesex County 208 Water Quality Management Planning Program is currently addressing this problem and the possibility of obtaining Coastal Energy Impact Program (C.E.I.P.) funds to deepen its water supply wells in an effort to meet OCS and other energy related demands.
Socio-Economic Impacts: The hypothetical permanent service, supporting fifteen drilling rigs with 23 supply boats will generate 522 employment opportunities (Table 4.14). Local employees will fill 439 of the positions earning $7,463,000 and 83 new resident employees will earn $1,411,000. (For a complete description of the employment methodology see section 3.3.2.)
TABLE 4.14
Direct OCS Employment and Wages, Perth Amboy
Employment
Wages* {$)
Supply
Local Hire
377
~,409,000
Boats
New Residents
83
1,411,000
Onshore Crews
Local New Hire Residents
62 .......
1,054,000 ......
Total
522
$8,874,000
* $17,00 annual salary from RALI/Factbook

The 83 new resident employees will produce new loadings on the infrastructure. A new resident population of 237 will result with 59 of that total being school-aged children requiring educational services. It is also estimated that 75 housing units will be demanded by the new resident employees.
In addition to the 522 direct OCS jobs, both indirect and induced employment will result. OCS industries and wage earners will spend money on goods and services which will in turn create further employment. It is estimated that for every direct OCS job 2.5 jobs will be generated in the region. Thus, a total of 1305 jobs will be created in OCS related functions as well as increased industrial output and service delivery throughout the region.
4.2.10 Conclusion
Few constraints to development and the environmental and socio-economic impacts associated with a permanent service base indicate that an OCS base is a recommended use on the Arthur Kill in Perth Amboy. An analysis of the zoning plan indicates that a marine terminal is compatible with existing zoning, however, storage tanks for diesel fuel require a conditional use permit, and storage of explosives requires a use variance.
The site has rail access, excellent highway access-, and will meet draft requirements with minimal changes. The possibility also exists of using the base as a comprehensive service base. It could recieve coated pipes by rail from pipe coating yards for transfer to barges for shipment to laying areas, or it could support platform installation operations. Such operations are possible if the base is developed as in the hypothetical plan or expanded to include adjacent land to the north of the site as proposed in the study conducted by the Port Authority of New York and New Jersey.
131
~conomic benefits from the operation of the base will be distributed throughout the region. Increased economic activity will not only occur in Perth Amboy, but in areas where employees live and spend their income. Perth Amboy could be at an advantage in that its ratables and, therefore, tax revenues will expand, but it will not necessarily be required to deliver services to new resident employees. Overall, increased economic activity will benefit the area and lower the present unemployment rate.
Increased traffic on the Arthur Kill should not pose significant safety problems because OCS vessels are relatively small and much more maneuverable than other vessels on the Kill. Activities at the hypothetical service base will place less demands on the area than many other industrial uses in the region. In conclusion, this site meets industry's criteria and the environmental and socio-economic criteria proposed in this study. For these

132
reasons, it is suggested that the sited hypothetical permanent service base could adequately support OCS operations.
4.3 Cold Spring Inlet, Cape May
4.3.1 Proposed Use
The proposed use for the Cold Spring Inlet area is a temporary service base designed to support one to two rigs during the exploration phase of offshore oil and gas development. This limited type of facility could service an oil company that had one or two lease tracts at the southern end of Lease Sale No. 40.
4.3.2 Identification of Land and Water Types
Cold Spring Inlet is an oceanic inlet adjacent to Cape May Harbor in Lower Township (Map 12) . The inlet channel is maintained by the Corps of Engineers at a depth of 25 feet and a width of 400 feet. The channel within the harbor is maintained at a depth of 20 feet and width of 300 feet (Map 13) . The area is characterized by waterways leading north to Jarvis Sound and west through the Cape May Canal to the Delaware Bay. Land areas are predominately tidal marshes of Spartina aZternifZora and Spartina patens with some sandy fill.
4.3.3 Identification of Land and Water Uses
Land and water uses in the inlet include a Coast Guard Base and training center, commercial fishing operations, recreational marinas, and boat repair and maintenance facilities. Residential units are located on the southern side of the harbor with few having _direct water access.
The harbor and inlet are heavily utilized during the summer as part of the intracoastal waterway system. The inlet and harbor support commercial fishing operations on a year round basis. Operations were limited in the winter of 1976-77 because of icy conditions.
4.3.4 Data Deficiencies
Quantification of Boat Traffic
According to local sources and the Coast Guard, Cape May Harbor is heavily used for recreational boating and fishing. The harbor is defined as congested in the summer season. Although the Coast Guard and N.J. Marine Polic~ have jurisdiction over boat traff~c, they have never quantifi~d the traffic in the harbor, nor have studies been performed to determine the "carrying or spatial capacity" of the area.
Soil Bearing Capacity
The only precise method of determining the soil hearing capacity of a selected site is to conduct soil boring tests at defined points. The tests will determine soil type, compaction, consistency, and profile at various depths. If the area is already developed, assumptions may be made based on existing uses and the ability of the soil to bear the loadings of those uses. The soil surveys for each N.J. County, conducted by Rutgers University College of Engineering and the U.S. Department of Agriculture, Soil Conservation Service are useful in determining the type of soil in an area and the potential of that soil to support various land uses. If the soil in a particular location presents problems for construction activities and load bearing capacities, engineering techniques may be employed to overcome deficiencies.
The specific study area for Cape May is the dredged embayment lying west of Middle Thorofare, north of the Inlet {_Map 14). The u.s. Department of Agriculture Soil Survey in 1973 indicates that the soil here is C.HH (_fill land, sandy over tidal marsh) and C85+A (tidal marsh, deep). CMH soil needs 5 to 8 feet of fill to overcome severe limitations for foundations and parking lot uses. C85+A soil is subject to tidal flooding twice daily and has severe limitations for development.
Composition of Benthic Community
Cape May Harbor is used on a year round basis and supports intensive boating activity in the summer season. Because of this boating activity and dredging in the harbor and the adjacent waterways, it is assumed that there has been sufficient turbulence to disrupt the life cycle of the benthic community. However, the impact on the biologic community in a specific location by construction activities must be determined through a detailed environmental analysis of the area.
Water Quality Data
Water quality data from the New Jersey Division of Water Resources indicate that samplings were taken in Cape May Harbor between July 1974 and November 1976. The sampling station was located about one mile southwest of the specific study area (Map 12) . There was no data collected at this specific site. Water quality was found to be good; all measured parameters were within acceptable limits. An expected seasonal cycle of water temperature, dissolved oxygen, and nutrient component make-up was observed. However, heavy metals, BOD, fecal, and total coliform concentrations were at an acceptable level throughout the year. The average level of water quality was within the acceptable-limitations set forth by the State Division of Water Resources.
133

6"
~ypothetical !Ooo SC~LE 1. 24 000 EJ:::.::EL£""3 1 000
- -· :::E: ~00 FEET -ape May
arvts Sound ~
. So~th west i Cove
:.:.:
()
)> ., m
~ )> -<

CORPS OF ENGINEERS
135
U. S.ARMY
MAP 13 COLD SPRING INLET
NEW JERSEY REVISED 30 JUNE 1969
SCALa - .....
U.S. ARMY ENGINEER DISTRICT: PHILA.
136
4.3.5 Opportunity Analysis
Cape May Harbor is. af>proximately lQQ miles· ;!;rom the offshore site of Tract No. lOQ in Lease Sale No. 40. The specific study area provides a sheltered harbor with a turning basin of 200 feet. There are approximately 450 feet of available wharf space on the north side of this. lagoon and approximately 8 acres is sandy filled land. The draft dockside is 8 to 12 feet mlw, necessitating dredging operations to provide dockside access for workboat activity. Soundings on a 1975 chart 16 indicate that the waterway leading to the lagoon has depths ranging from 15 to 24 feet mlw, thus providing sufficient draft for workboat activity. The area has access to a sewer line but is not presently connected, although under orders to do so as reported by the Cape May County Planning Board.
Cape May County Airport is approximately 4 miles from Cold Spring Inlet. The facilities provide commuter airline and charter services. It is equipped for instrument landing.
There is an unemployment rate in Lower Township of 20. 3% and in Cape May County it is 16. 4%. 17
Conversations with Cape May County officials have indicated that a small temporary service base with limited facilities would be an acceptable activity for tha area. Such an activity, if confined to existing facilities, would place minimal demands on the Cape May area.
4.3.6 Impact Analysis
The impacts associated with the operation of a support base on coastal resources are determined by the intensity of use. The lagoon requires at least 7 feet of dredging at dockside to allow workboat access. The Army Corps of Enqineers uses the hopper method t9 dredqe Cold Spring Inlet. The impacts associated with dredging are outlined in section 4.1.6. If smaller workboats requiring less than a 15 foot draft were used, these impacts could be lessened.
If OCS activities were confined to the existing facilities in the lagoon, the land and water traffic will not conflict with existing traffic patterns. These existing facilities are capable of accommodating 3 workboats of approximately 175 feet in length. Increased highway traffic generated by operations at the base would be "nuisance" traffic rather than adding appreciably to the number of vehicles on the road. The slow moving trucks delivering supplies to the service base would generally impede traffic movement.

MAP 14
COLD SPRING LEGEND
~ HYPOTHETICAl SITE
D COMMERCIAl
~ GOVERNMENT
D RESIDENTIAl
D WETlANDS
··.Map by R lttt le · ·c C.E.S. RUTGERS UNIVERSITY
JARVIS
SOUND
137


4.3.7 Value An~lysis
The study is in a selected environmentally sensitive area. 18 These Coastal waters, bays, and wetlands are designated by DEP as areas for preservation unless overriding state, economic, or social values are to be served (see section 4.l.6 on Impact Analysis, Estuarine Zone). The limiting of OCS activities to existing filled acreage and facilities would not interfere with this goal. Any expansion of facilities for marine terminal activities would not only conflict with state priorities but also local priorities for tourist and recreational activities.
Tourism and summer activities contribute a substantial sum to the ecominic base of Cape May. Tourist retail sales increased from $24.3 million in 1950 to $78.2 million in 1973. This is a total increase of 322 percent. When these figures are combined with estimates of rental income and other miscellaneous spending, it is estimated that the resort ecomomy produces between $250 and $300 million annually. Resort land uses account for 60 percent of all the developed land in the county. 19
139
In order to maintaim an environment that will continually strengthen the resort ecomony, the Cape May County Planning Board recommends the following to the county and local communities: 20
preservation of wetlands preserving and promoting agricultural industry preserving the rural character of the mainland preserving the "open air" quality of the island communities limiting the permanent population expanding tourist related facilities
A referendum will appear on the ballot in Cape May in November asking voters to decide whether or not they approve Support Base Facilities in Cape May.
From open discussions at public meetings and meetings with environmental groups and shell fishermen, the general reaction to siting of ocs facilities in Cape May was negative. The consensus was that the highest and best uses for the coastal harbor were recreational, commercial, and fishing activities.
4.3.8 Constraint Analysis
Constraining factors in siting OCS activities in the Cold Spring Inlet area include:
Water Supply - A municipal water supply is not available in the area. Harbor activities are dependent on wells that are presently servicing commercial fishing operations.

140
Rail Transportation - There is no rail line to the harbor area. Highway Access - A major highway is within l.S miles of the Inlet; however, the weight limitation on the two bridges that must be crossed to reach the harbor area is lS tons. This would limit the loadings on vehicles delivering materials to a supply base. Boat Traffic - The harbor is intensely used for recreationl and commercial activities in the sununer season. Dredge Spoils - The high productivity of some of the wetlands limits sites for dredge spoil disposal. Limited Facilities - The available wharf space and acreage limits the size of service base facilities. Zoning - A temporary or permanent service base is an industrial activity and not a permitted use under the Lower Townhip Zoning Ordinance for the Cold Spring Inlet area. Sewer System - Although a line is accessible, the area is not connected to the system.
4.3.9 Specific Site Selected for a Temporary Base Operation
The specific area in Cold Spring Inlet selected for a temporary service base is the dredged embayment leading west from Hiddle Thorofare (Hap l4). The area presently supports commercial fishing activities and in 1976 supported OCS geophysical survey activities. Adjacent uses include a marina, fishing cooperative, and a fish processing plant.
The proposed base is limited in size and capable of supporting only two rigs. The constraining factors outlined in Section 4.3.8 and the impacts associated with dredging and the filling in of highly productive wetlands place severe constraints on the area for large scale development (See Section 4.1.6).
The hypothetical siting that is proposed in this study is for Lease Sale No. 40. The recommendation is that the area not be significantly altered to develop the service facility and that the duration of use be limited to 2 to 5 years. The fact remains, however, that if a temporary facility is sited here it may exist for several years because future lease sales are scheduled to occur south of Lease Sale No. 40. The Cape May area has ~he potential of supporting offshore operations for future lease sales. The precedent set by establishing a temporary facility for Lease Sale No. 40 in Cape May may lead to activity of much longer duration than is desirable for

an area that is prima17ily resort-commercial and environmentally sensitive.
Site Analysis
The existing filled-in wetlands area is approximately eight acres, with 550 feet of developed wharf space. The navigable channel to the site ranges from 15 to 32 feet
141
in depth, only part of the channel is maintained by the Army Corps of Engineers (J1ap 13) . Approximately seven feet of dredging at dockside is necessary to obtain the 15 to 20 foot draft required for OCS supply vessels; however, for a temporary service base with limited operations, smaller supply vessels requiring less than a 15 foot draft could be used. This would reduce the amount of dredging needed.
The only site alteration recommended is dredging at dockside and construction of a reinforced concrete apron to support equipment for the loading of supplies onto vessels and to support storage tanks for fuels, mud, and cement.
A temporary service base of the size indicated on Map 14 is capable of supporting two exploratory rigs with three 175 foot supply boats.
Socio-Economic Impacts*
Direct OCS employment at the base will involve supply boat employment and onshore crew employment. Supply boat crews will be 20 per boat and onshore crew employment, including economies from Table 3.6, will total 8. Table 4.15 illustrates direct employment, origin-of-employment and wages earned.
TABLE 4.15
Direct OCS Employment and Wages, Cape May
Supply Boats* Onshore Crews* Total
Local New Local New Hire Residents Hire Residents
Employment
Wagest ($)
30
510,000
30
510,000
8 - 68
136,000 - 1,156,000
*
* t
Origin-of-Employment from Operators Committee $17,000 annual salary from RALI/Factbook
A complete description of the Socio-Economic Impacts Methodology can be found in Section 3.6.2. Environmental impacts associated with service base development and operation are outlined in section 4.1.6.

142
New Resident employment of 30 will produce a new resident population of 86. Of this total of 86, there will be approximately 21 school-aged children requiring service delivery. Demands for 27 housing units will be generated as well by these new residents.
Employment and expenditures at the base will generate still further employment. It is estimated for every direct OCS job 2.5 jobs will be generated in the region. Thus, the 68 direct OCS jobs will generate a total of 170 in the region.
Water Demand
Fresh water will be needed at the base to supply offshore exploratory drilling rigs as well as for use by service base employees. Using a daily water demand figure of 14,250 gallons for each drilling rig and 100 gallons/ day for each employee, total fresh water demand will be 35,300 gallons/day. Municipal water lines do not service the area and thus water supply is dependent upon onsite wells. Further study would be needed to determine if these wells could safely deliver this amount of water over a long time period.
Truck Traffic
Since the selected site does not have rail access supplies would have to be delivered by truck. Table 4.16 illustrates the amount of supplies that would be needed for two drilling rigs.
TABLE 4.16
Material Transported, Cape May Service Base
Total for Materials Exploratory Drilling 2 Rigs/Year
Mud 2,568 tons/rig/year 5,136 tons
Cement 1,260 tons/rig/year 2,520 tons
Tubular goods 1,820 tons/rig/year 3,640 tons
Fuel for drilling 13,272 bbl/rig/year 26,544 bbls.
Fuel for Trans- 12,800 bbl/rig/year 25,600 bbls. portation
In order to estimate the number of truck trips that would be required to deliver the supplies to the base two factors need to be considered. First, there is a 15 ton weight limit on bridges leading to the site and secondly, it is estimated that a truck which weighs 15 tons when

fully loaded would weigh 6 tons itself. Therefore a truck would have a 9 ton material capacity. Table 4.17 illustrates the number of yearly truck trips associated with_ drilling material movement. Daily traffic for drilling materials would be approximately 6 vehicles but in addition, trucks will also be delivering food, tools and parts to the base.
TABLE 4.17
Truck Trips, Cape May Service Base
Total Required for Total Truck Materials 2 rigs/Year Trips/Year
Mud 5,136 tons 571
Cement 2,520 tons 280
Tubular goods 3,640 404
Fuel for drilling 26,544 bbls. 492
Fuel for transportation 25,600 bbls. 474
TOTAL 2,221
4.3.10 Conclusion
Cape May is capable of supporting OCS activities with limited facilities. The constraints to development are
143
too severe to permit any large scale development. Other than dredging at dockside and the construction of a reinforced concrete apron along dockside, no other site alterations are recommended for the Cold Spring Harbor site. A temporary service base is set up for exploratory operations and the nature of such operations are too speculative to allow the destruction of productive wetlands and disruption of socio-economic systems.
Before state or local agencies approve the development of a temporary service base in Cold Spring Inlet, consideration must be given to future demands for facilities in the area as a result of other lease sales south of Lease Sale No. 40. A base sited initially for a limited use and a short duration tc service Lease Sale No. 40 activities may bring further development pressures. Demands may be felt to expand the facility or to continue the operation for a longer period of time to service future Lease Sales (i.e. , 49 and 59) .
Any use of Cold Spring Inlet for intensive industrial activities should be discouraged. Such an activity is not in accordance with state and local plans to preserve the coastal environment. Conflicts will also occur with recrea-tional fishing, and commercial activities that support the resort economy.

144
4.4 Camden
4.4.1 Proposed Use
Camden is capable of supporting repair and maintenance of ships by utilization or upgrading of existing facilities along the city's waterfront. In addition, a hypothetical pipe coating yard is proposed at the Beckett Street Terminal of the South Jersey Port Corporation (Map 15).
Adjacent uses at the Beckett Street Terminal include open storage facilities, warehouses, transit sheds, docking facilities for large ocean-going vessels, and rail lines. Three 25 ton gantry cranes are used at dockside to load and unload materials from ships. Open storage space is presently used on a short-term basis for storage of cargo. One area at the south end of the terminal is used for long-term storage of scrap metal. The area is zoned for industrial uses.
The property immediately to the south of the terminal is occupied by a major gypsum wallboard manufacturer. The property adjacent to the northern end of the terminal is vacant and owned by the City of Camden. Its proposed long-term use is a park, office, and laboratory facility.
4.4.2 Identification of Land and Water Types
Camden is a port city located on the Delaware River (~ap l6}. This tidal river is part of the Delaware Estuary System. The river flows south into the Delaware Bay, which empties into the Atlantic Ocean. The river channel at Camden is maintained by the U.S. Army Corps of Engineers at depths ranging from 18 to 30 feet. The authorized channel depth is 40 feet and the channel width is 600 feet (Map 17).
The soils in the port area are developed predominately in sand and gravel fluvial deposits.
4.4.3 Land and Water Uses
The Camden port district is an urbanized industrial area stretching approximately four miles from Gloucester City to the Benjamin Franklin Bridge.
The marine terminals in the study area are the Broadway and Beckett Street Terminals. The total wharf space is approximately 4,600 feet. There is over 1,000 feet of underutilized dock area.
The land is characterized by:
industries specializing in manufacturing of pressure vessel and heat exchange systems, steel

import, and pipe priming operations
bulk cargo and container cargo operations
approximately 500,000 square feet of warehouse space
approximately 400,000 square feet of transit shed space
52 acres of outdoor storage space
5 cranes capable of lifting 40 to 80 tons
8 miles of rail transportation within the terminal site
4.4.4 Data Deficiencies
Quantification of Boat Traffic
The agencies responsible for controlling marine traffic are the U.S. Coast Guard and N.J. Marine Police. Traffic counts on the Delaware are not taken by either agency, and additional inquiry indicated that traffic counts are not available for the area. There are no data presently available to determine the "traffic carrying capacity" of the river.
Soil Bearing Capacity
The only precise method of testing the capacity of the soil to bear certain loadings on a specific site is
145
to conduct soil boring tests at defined points for development. The tests will determine soil type, compaction, consistency, and profile at various depths. If the area is already developed, assumptions may be made based on existing uses and the ability of the soil to bear the loadings of those uses.
The soil surveys for each N.J. County, conducted by Rutgers University, College of Engineering and the U.S. Soil Conservation Survey, are useful in determining the type of soil in an area and the potential of that soil to support various land uses. However, where the soil presents construction and load bearing problems, engineering techniques may be employed to over come the deficiencies.
The U.S. Agriculture Soil Survey for Camden County (1961) indicates that the soil in the port district is gently sloping, grayish-brown sandy soil generally wellsuited to urban uses. The urban port district was not surveyed to determine any other qualities.

146
4.4.5 Opportunity Analysis
The use of the Camden port area as any type of onshore support facility would be compatible with existing and proposed activities in the port. Officials in the City of Camden are encouraging industrial investment in the port district as part of an ecominic revitalization of the area. They have conducted tours of the port area for state officials and oil company representatives to demonstrate the potential that the city has for support base development.
There is industrially zoned acreage available for development adjacent to terminal sites and along the waterfront. The channel depth and draft at dockside is in excess of 2Q feet. The area also has developed wharf space that could be used for OCS activities.
The infrastructure is developed:
Conrail and Chessie systems provide rail access adjacent to and within the dockside area.
Interstate Highway 295 and 676 (under construction} immediately link the area to highways leading to New York, Philadelphia, and Delaware
The area is serviced by water and sewer lines
The Lindenwold High-Speed commuter line connects Camden with ?hiladelphia and Camden County 2 l suburban communities
Other industries in the Camden area related to offshore drilling activities are:
ship repair and maintenance facility
oil spill clean-up company
diving company
dredging company
Labor Market
A labor force for OCS employment is presently available in the area; the rate of unemployment in the City of Camden is 12.7% and 8.4% in Camden County.
4.4.6 Impact Analysis
The ·use of the Camden waterfront and adjacent areas as onshore staging sites would have minimal adverse environmental impacts. The area is characterized by industrial development. In addition to the industries

LEGEND
Q Hypothetical
D Commercial
• Industrial
D Residential
D Vacant
L2j Institutional
·-
0
~ -N-
~
• . . -
147
MAP 15 CAMDEN SITE- -CURRENT LAND USE

MAP 16 CAMDEN TOPOGRAPHY
Hypothetical Site Camden
I I
I I I
I I I
~I>< Zlr:x:l ~pn >o:: ...JI[:Xl :><'"":l ~~~ zlr:il
~~z P;er 34 S I
I
I
Spruce
~ \ \
\ \ \
\ \ \
\ \ \
\ \ \
Sources: USGS Quadrangles Camden & Philadelphia Updated Aug1977-CCES Cartography laboratory
Rutgers University

CORPS OF ENGINEERS
Q
[: ;: ... L ADELPHIA
<{ COUNTY
AliA WtfERE I£W WORIC RENA INS TO BE
~ SHOWN THUS:~ TH IS AltO HAS .Ell DREDCED TO A
Xml OF 30 FEET.
CAMDEN COUNTY
Comd•n Marins Tsrminol
Pt.
149
U.S. ARMY
Ia Allontic Cily. Also Sla,. Roul•s Ia Norlh , Soulh and £osl.
BRIDGE
MAP17 DELAWARE RIVER
AT CAMDEN, N.J. REVISED 30 JUNE 1969
SCALE OF nET 1000 0 I
E3 e---3 2 3 e---3
U.S. ARMY ENGINEER DISTRICT, PHILA.

150
previ.ously mentioned, the headquarters of Campbell Soup co. and a R.C.A. ~acility are located in the waterfront area. Service base activities would not cause ~ny measurable changes to the resources of the built or natural environment.
4.4.7 Value Analysis
Energy related facilities that require water access to land within the immediate vicinity of a port area are more suitably sited, if possible, in an industrialized port district. The existing industrial activities on the Camden waterfront and the need for economic revitalization of the area are prime considerations in the selection of tha area for support base facilities.
4.4.8 Constraint Analysis
The constraining factors in siting support facilities in Camden are:
Camden is 220 miles from Tract 100, Lease No. 40; 95 miles of this distance involves navigation on the Delaware River.
Transportation costs and efficiency in delivering supplies to the drilling site are a prime locational consideration in siting a permanent service base.
Communications with petroleum industry representatives indicate that the time and distance variables are too great for Camden to efficiently serve as a permanent service base.
Ocean-going cargo vessel traffic on the Delaware River may conflict with workboat movemant.
Permanent service base activities require dockside facilities that allow it to operate without interference from other port activities.
4.4.9 Pipe Coating Yard- Hypothetical Site in Camden
The area proposed for a pipe coating facility and open storage operation (Map 15) is presently used for open storaae or is vacant. At the northern end of the site, the acreage ¥
available for the proposed use is about 14 acres with 10.6 acres owned by the city and 3.4 acres property of the terminal. These 14 acres could be used for open storage of pipes that are being cured after the coating process. At the southern end of the terminal. there are about 16 acres that could be used for open storage and a portable pipe coating plant. This type of operation would be capable of providing 20 to 50 miles of coated pipe in one season.

The available wharf space at the southern end of the terminal consists of a 150 foot wide berth. The north side dock is about SQQ feet long and the south side is 300 feet in length. Steel pipes from mills in rennsylvania and Ohio could be transported by rail directly to the Beckett Street Terminal and iron ore could be shipped by rail or water to the site.
Economic Impacts
The labor force at a pipe coating facility is mostly unskilled, and it is assumed that all labor supply will be provided by local residents.
Pipe coating is a seasonal operation. One portable pipe coating facility would employ 175 workers for a period of seven to eight months a year. The entire operation may continue for a period of four years. The annual salary for a seven to eight month working period averages $11,500. Total yearly wages would be $2,012,500.
To accommodate the 175 employees, present parking facilities located at the entrance of the Terminal would have to be expanded. These facilities can now accommodate about 200 vehicles. The present usage is about 60% of the parking capacity. There is space for expansion east of the terminal.
Environmental Impacts
The environmental impacts specifically associated with a pipe coating operation include: 22
air emission from equipment used in the coating process, particularly compressors and boilers, which emit primarily nitrogen oxides (NOx)
emission of particulates of shot and heavy metals from the pipe surface
increase in noise levels from shotblasting, 92 to 103 decibels; from mobile machinery, 75 to 90 decibels at 50 feet; from boilers and compressors, 90 decibels at 6 feet
solid waste generation that is contaminated with process chemicals, petroleum, concrete, or mastic fragments. Also wire mesh, metal drums, cables and metal straps will be generated
runoff contaminated with particulates, heavy metals, and processed chemicals
wastewarer discharges 1) process water contaminated with hydrocarbons,
alkaline substances, and suspended and
151

152
dissolved subs·tances from whitewash, sand, and gravel
21 cooling water contaminated with pa~ticulates and metal fragments
Studies undertaken by the Environmental Protection Agency CEPA} provide physical and chemical measurements of surface water quality near the site under consideration in Camden. The EPA has obtained water quality samples from two station locations near the site. Data at these stations were collected from 1967 through 1976 with the bulk of information collected in 1975 and 1976.
Data indicate heavily stressed water quality conditions. Measured values of BOD, DO, nitrogen, phosphorus, fecal and total coliform indicate stress form wastewater discharges. Physical and chemical measurements near the Camden site denote that this area has the least acceptable water quality conditions of the four study areas considered in this report.
Runoff from the several acres of open storage will be difficult to control. However, runoff from the portable plant facilities can be minimized through facility design to control water flow and to conduct wastewater treatment prior to discharge.
The pipe coating yard is temporary (4 Years) and, therefore, would not have long-term effects. Because of existing water quality conditions, this facility would not substantially change or improve present water quality in the Delaware River. A political decision based on economic benefits versus environmental costs must be made before approval of such a facility can be given.
The emissions and noise levels cited above can be reduced through the use of various pollution control devices. Dust collectors installed in the plant facility design would lower air emissions. Appropriate muffling devices on machinery can be employed to reduce noise levels. One pipe coating yard has housed its shotblasting operation in a lead-lined building, which effectively deadens the noise. 23
Indus-try, as an employer, must provide employees with appropriate safety equipment to minimize occupational hazards that might cause physical damage, The decibel levels indicated above could be detrimental if an employee were subjected to them for several hours a day. 24
Aesthetic Impacts
The aesthetic impacts from a pipe coating facility sited on the Camden industrial waterfront would be minimal when compared to existing operations. However, land use conflicts could occur at the terminal from

storage and movement of cargo that is unrelated to the pipe coating operation. Acreage at the facility would have to be more ef~iciently utilized than it is under present operations.
4.4.10 Conclusion
Conversations with oil industry representatives indicate that they consider the travel time and distance from the offshore lease tracts a severe constraining factor in selecting Camden as a permanent service base facility. However, political, social, and economic opportunities for OCS related development do exist.
The development of a pipe coating yard in Camden would not be restricted because of the distance from the OCS. A pipe coating firm schedules the transportation and processing of the pipe as soon as the contract has been signed with the oil company. The lead time required to process, coat, and transport the pipe to a lay site may be planned in advance. Rail and highway access and a deep water port are particularly attractive features for a pipe coating operation. Camden is capable of supplying all three.
The pipe coating facility sited at Beckett Street is a small temporary operation with 95% of the land used for open storage. Present land uses at the terminal indicate the soil is capable of bearing heavy loads from equipment and supplies. Long-term negative land use impacts are not anticipated as a result of the pipe coating yard. When pipe coating operations cease, the area can easily be converted to other uses. The long-term proposal for a city park north of the terminal would not be adversely impacted, assuming such a proposal is not implemented prior to discontinuance of the pipe coating operations.
There may by adverse socio-economic impacts from seasonal unemployment occurring as a result of temporary slowdown in pipe coating operations during the cold winter months. More permanent unemployment conditions will occur when the OCS pipe coating operations are terminated. During the pipe coating operations, unskilled workers can expect employment for a few years, seven to eight months a year.
It should be noted that two pipe coating yards are presently operating in New Jersey in Monmouth Junction and in North Arlington with facilities capable of supporting OCS activities. Unless the need for pipe coating activities are very intense just prior to the time pipe laying operations on the OCS begin, it is feasible that existing pipe· coating facilities will provide services to the oil industry and that no new facility will be developed.
153


PART TWO NON-SELECTED SITES
4.5 Maurice River
4.5.1 Identification of Land and Water Types
155
The Maurice River is a narrow, winding fresh water river leading south into Delaware Bay. The channel from the Bay to the mouth of the river is maintained at a depth of seven feet and a width of 150 feet. The bay and river tides are shallow, the controlling channel depth in the river north of the bay is eight feet at mlw (Map 18).
Huch of the area north of Delaware Bay to Dorchester and east and west of the Maurice River may be classified as pristine wetlands. The state has set aside 11,000 acres as a fish and wildlife management area. This area is a tidal marsh of Spartina alterniflora, Spartina patens~ and Distichlis spicata.
There are some upland properties in developed areas along the river that local officials consider suitable for industrial development.
4.5.2 Identification of Land and Water Uses
The Delaware Bay and Maurice River are prime fishing areas. There are several oyster grounds located in the Delaware Bay. The Maurice River is also a spawning area for anadromous fish. Port Norris, a town near the mouth of the Maurice River, was the most famous oyster fishing port in New Jersey until a sporozoan epidemic in the 1950's caused a severe decline in the oyster industry. One section of the town is built on oyster shellpiles. Other water activities include recreational boating and fishing, and a ship repair and maintenance yard.
Areas north of the Bay and west of the river are used for the growing and harvesting of salt hay, Spartina patens. Industrial activities include a silica sand company in Port Elizabeth, a glass sand company in Mauricetown, and clam processing plants in Leesburg and Port Norris.
The population density along the Maurice River north of the Delaware Bay is relatively low. Maurice River Township has a density of 39.5 persons per square mile, and Commercial Township has a population density of 107.9 persons per square mile. 25
4.5.3 Data Deficiencies
Quantification of Boat Traffic
The agencies responsible for controlling marine traffic on the Maurice River are the U.S. Coast Guard and the

156
N.J. Marine Police. Statistical data on the daily and seasonal boat traffic on the river are not available; however, local marina operators do keep data on the traffic generated by the use of a particular marina facility. The traffic "carrying or spatial" capacity of the Maurice River has not been determined.
Soil Bearing Capacity
The only precise method of determining the soil bearing capacity of a selected site is to conduct soil boring tests at defined points. The tests will determine soil type, compaction, consistency, and profile at various depths.
The area adjacent to the Delaware Bay is mostly an undeveloped tidal marsh. The area is subject to tidal flooding twice daily and poses severe limitations for development. Extensive fill would be required to overcome these limitations.
Some tidal marsh areas north of the Delaware Bay and west of the Maurice River are protected from tidal flooding at certain times of the year by dikes constructed to provide salt hay farms. During the salt hay growing and harvesting season, gates in the dikes are closed. In the spring, the gates are opened and the area is flooded. The farmers owning this land hold the opinion that these areas are different than tidal marsh. They claim that they are "dry". Farmers use machines in the meadows to harvest salt hay grass and trucks for transportation of the grass. 26 However, it is assumed that given natural conditions, the area would be classified as tidally-flowed lands.
4.5.4 Opportunity Analysis
The Maurice River area is suffering from ·a severe economic decline in its two major industries. A sporozoan disease has drastically effected the oyster industry. Ship repair yards that thrived under government contacts during war time eras for repair of low draft vessels; such as, mine sweepers and P.T. boats, are abandoned or operating below capacity.
Since activity in the area has traditionally been linked to the water and not land based, any economic revitalization of the area will require some development along the Bay or River. The mouth of the Maurice River is 140 miles from Lease Sale No. 40, placing it within a reasonable distance to offshore activities. A labor force is available for employment. Unemployment statistics indicate that the rates for Maurice River and Commercial Townships are 13.0% and 21.3%, respectively. Cumberland County has an unemployment rate of 11.3%. 27

CORPS OF ENGINEERS
Upstream limit of Federal Project
CHANNEL DIMENSIONS
LOCATION DEPTH WIDTH --A-B 8FT. 150FT.
B-C 7FT. lOOFT.
c-o 7FT. 60FT.
Port Norris
AREAS WHERE NEW WORK REMAINS TO BE
DONE, SHOWN THUS: f/"_01 ffi/~flZj CHANNEL ACROSS MAURICE RIVER COVE
HAS BEEN DREOGED TO A DEPTH OF 7 FEET.
NO WORK HAS BEEN DONE IN AREA AT UPPER
END OF PROJECT.
Mauricetown
157
U.S. ARMY
FIXED BRIDGE
CUMBERLAND COUNTY
Port
FIXED BRIDGE
Leesburg
River
BAY
MAP18 MAURICE RIVER
NEW JERSEY REVISED 30 JUNE 1972
SCALE OF FEET 10,000 0 10 000 EE3§c~E33C~E3E3C=======~'
U.S. ARMY ENGINEER DISTRICT, PH ILA.

158
The Dorchester Shipyard, about eight miles north_ o~ the mouth of the river, is capable o~ hull and mechanical r,epairs, including diesel engine repair on ships up to 160 feet in length. The river has a tidal range of 5.7 feet, and ships requiring drafts of 10 to 14 feet must navigate the river at high tide to reach the shipyard. OCS vessels requiring less than a 15 foot draft and measuring 160 feet or less could be accommodated at this repair facility.
4.5.5 Impact Analysis
The most positive impact from OCS development would be economic. Opportunities would not only occur as a result of industrial employment, but also from local work projects that would be needed to provide an adequate infrastructure to support industrial activity. This latter activity would, however, require capital investment of public funds for highway improvements and extension of sewer and water lines.
Environmental impacts would occur from the extensive amount of dredging required to provide workboat access to dockside areas. Most potential sites, particularly in the Delaware Bay area, would require several acres of fill for use as service base facilities. These areas are also part of the estuarine zone.*
In addition to the impacts of dredging previously outlined in section 4.1.6, it should be noted that dredging is particularly disruptive to shellfish beds and anadromous fish spawning areas. The decline in the oyster industry began in 1945, when power dredging on seed beds was first permitted. This caused the near complete removal of the brood stock from the Bay and opened the way for the intrusion of disease. In 1957, a marine blight struck the oyster beds and severly impacted the industry, lowering the harvest values from 3 million dollars in 1956 to $161,000 in 1960. 28
1975 figures from the Department of Oyster Culture at Rutgers University indicates that the oyster production value has risen to #900,000.
A channel approximately seven miles in length must be dredged in the Bay to provide workboat access to the mouth of the Maurice River or Cove area. If a site were selected anywhere along the river, dredging of the river channel would also be required. This activity would not only impact on oyster grounds in the Bay, but also on anadramous fish spawning in the River.
. * A detailed analysis of the impacts associated with dredging
and w~th filling the esturine zone is provided in section 4.1.6.

4.5.6 Value Analysis
Meetings and conversations with County and local officials, environmental groups, and shellfishermen provided input for a political analysis of priorities placed on land and water activities in the Maurice River-Delaware Bay area.
County and Local Officials
County and local ·officials view economic conditions as the most pressing problem in the area. They feel that there is enough available land in the area for preservation and development. A temporary or permanent service base is considered to be an appropriate activity for the waterfront district. Such a facility, it is felt, would not only bring new growth to an economically depressed area, but also revitalize existing ship repair yards.
Environmental Groups
Environmentalists are of the opinion that the pristine nature of the area, which includes eleven thousand acres of state-owned wildlife preserves and several thousand acres of wetlands of high productivity, precludes any industrial activity in the area. They feel that there are other more suitable locations in the state capable of accommodating OCS activities.
Shell fishermen
There was general agreement among shellfishermen that Bivalve and the Maurice River may be defined as fishing centers in New Jersey. Some oystermen agreed that they would not oppose dredging to allow for waterfront development if dredge spoils were put ashore. However, if dreding occurred in shellfish beds, they insisted that government funds should be provided to replant the beds in other locations.
This particular group provided divergent opinions on
159
the value of OCS activities in the Maurice River and Delaware Bay. Some viewed it as an economic revitalization of shipping activities and an opportunity for employment on the sea; others felt that the environmental impacts would be significant and that the result would be to reduce the number of good fishing grounds in the state. The latter group expressed the opinion that OCS activities should be directed to industrial port districts where pollution has already diminished coastal fishing grounds.
4.5.7 Constraint Analysis
The following constraints limit the opportunity for development of onshore staging facilities in the Delaware

160
Bay - Maurice River area:
Shallow bay and river channels require an extensive amount of dredging to reach a minimum standard of 15-20 foot draft
Environmental and economical cost factors involved in dredging
Destruction of valuable wetlands to provide adequate acreage along bay front areas
Narrow winding configuration of the river increases navigation time
Numerous uncharted obstructions in the river hinder navigation
Local infrastructure is generally poor - the rail line is abandoned south of Dorchester, there are no sewer or water lines servicing the area, and the major highway connector to population centers is the two lane State highway, Route 47
4.5.8 Conclusion
Although there is an existing ship repair facility located on the Maurice River that has the capabilities to service OCS vessels that require less than a 15 foot draft, for the most part the Maurice River - Delaware Bay area has a low suitability for support base development. Facilities could be developed to meet industrial siting criteria, but the cost factors would be high compared to the locational advantage. The distance to the mouth of the Maurice River from the offshore drilling a·rea is the same as it is to industrial port districts which require less development with fewer regulatory procedures. Site preparation also requires extensive alteration to a "selected environmentally sensitive area." 29

4.6 Manasquan Inlet
4.6.1 Identification of Land and Water Types
Manasquan Inlet is a oceanic inlet and is at the boundary of Monmouth and Ocean Counties. Brielle and Manasquan lie in Monmouth County, and Point Pleasant is in Ocean County.
The channel is maintained by the Army Corps of Engineers with a 12 foot depth and a width of 125 feet to the point just east of the Conrail railroad bridge on the Manasquan River. The bridge, of a bascule type, has a vertical clearance, when closed, of three feet and a horizontal clearance of 48 feet. From this area westward, the channel has a depth at mean low water of approximately 9 feet, effectively eliminating this area to navigation by deep draft vessels.
The area surrounding the inlet is both undeveloped and developed. North of the inlet is an undeveloped
161
area of approximately 50 acres that consists of Spartina alterniflora with areas of Spartina patens and Phragmites communis. The area has also been used as a dredge spoil disposal site, reducing the amount of Spartina alterniflora. Gull Island, to the south, is composed of Spartina alterniflora and has also been used as a dredge spoil disposal site.
The land types include tidal marsh, filled land over tidal marsh, and dunal hummocks, consisting of sand, gravel, and shell fragments. The majority of the land has been disturbed or developed and is low in fertility, due to filling in.
4.6.2 Identification of Land and Water Uses
Recreation and commercial fishing dominate the land and water uses surrounding Manasquan Inlet. Recreational boating and party boat fishing piers line the waters of Crabtown Creek and Wills Hole Thorofare. The surrounding area is engaged in commercial activities supported by summer tourism. Boardwalks and beaches on the Atlantic Ocean attract the overnight visitor and the vacationers that rent summer homes and cottages. Restaurants, bath houses, amusements, and recreational waters make this a very active resort area.
Dock areas that are not being used for recreational activities are actively engaged in commercial fishing. An economically viable, year-round activity, Point Pleasant fish landings are consistently among the top

162
three in the state, as reported by the National Marine Fisheries Service. Service for fishing fleet and pleasure craft is easily obtained at boat repair and maintenance facilities in the inlet.
4.6.3 Opportunity Analysis
The prime attraction of Manasquan Inlet is its proximity to the offshore leased sites. Although only 94 miles from the sites, the channel depth of 12 feet severely limits its capabilities of accommodating supply boats which require a 15-20 foot draft.
The highway transportation network to the area is limited. State highways 34, 35, and 70 service the area but are heavily utilized during the summer months. Traffic occasionally backs up when the Route 35 bridge opens to allow for boat passage on the Manasquan River. Limited access highways that allow commercial traffic are nonexistent, and the closest U.S. Highway is Route 9, which is 10 miles to the west. Conrail railroad lines cross the inlet area, as mentioned earlier, and could provide service if a spur were extended to the inlet area.
Large contiguous areas with water access are needed for support facilities. Such areas are not found on the inlet because marinas and commercial fishing operations occupy those areas which have access to the inlet. The inlet is serviced by water and sewer lines that connect to the municipal water supply and municipal or regional sewage treatment plants.
4.6.4 Impact Analysis
The use of this area as a support base-would require extensive dredging operations in the channel and to dockside. Adverse environmental effects could include:
destruction of benthic organisms
increased turbidity
resuspension of toxic materials
increased nutrient levels
decreased marsh productivity caused by dredge spoil disposal
A complete discussion of the effects can be found in section 4.1.6.

N
MONMOUTH COUNTY
T PLEASANT CANAL, FORMERLY BAYHEAD-MANASQUAN CANAL
AREA WHERE MEW IIIORK REMA INS TO BE
DOME, SHOWN THUS:~
NO WORK HAS BEEN DOME OH THE I 9 ACRE
AND 27.5 ACRE ANCHORAGES. !INACTIVE}
COUNTY
MAP19 MANASQUAN RIVER
NEW JERSEY REVISED 30 JUNE 1968
SCALE OF FEET 500 0 500 1000 1500 2000
A A H e---3 e--3
U.S. ARMY ENGINEER DISTRICT, PHI

164
Esthetic impacts would result from the use of cranes and the storage of materials at a base, since these functions cannot be buffered from viewpoints on the water. Support bases would be incompatible with existing uses.
Increased boat traffic generated by a support base would cause conflicts with existing pleasure craft use and prove especially dangerous to smaller pleasure crafts. Truck traffic would cause increased loads on the road network, congestion, and be incompatible with existing road designs.
4.6.5 Value Analysis
The economy of the area is based on tourism and commercial fishing. Any use incompatible with these activities would result in making the area less attractive and thus less viable as a resort-commercial center. The lack of industrial uses on the inlet reflect past and present decisions of public officials and the public to maintain the existing land use patterns that benefit the localities, the region, and the State. Tourism is New Jersey's second largest "industry". Management strategies of DEP that are designed to protect and improve coastal resources directly and indirectly benefit the tourist industry.
4.6.6 Constraint Analysis
A 12 foot channel, limited transportation access, existing land uses, and public values would discourage the use of the area for OCS support activities. OCS operations would require extensive land use changes, conflict with existing activities, and would not conform with the zoning and master plan of the area.
4.6.7 Conclusion
Manasquan Inlet area does not meet the basic criteria of support bases. Extensive changes would be required of land and water uses and would change the character of the communities on the inlet. For these reasons, it should not be considered for OCS operations.

CHAPTER 5
OPPORTUNITIES FOR THE ASSESSMENT ANO REDUCTION OF ADVERSE IMPACTS OF OCS SUPPORT BASE DEVELOPMENT
5.1 Introduction
During the investigation of the manner in which onshore support bases have been sited to support offshore oil and gas development throughout the world, it became apparent that there is no "master plan" for such bases. Each sited base had to take into account the physical, ecological, economic,· and political constraints of the area in which it was sited. For this reason, the bases in an area such as the Gulf Coast of the United States are different from those of the North Sea area of Scotland, and it is, therefore, expected that a base in New Jersey will differ from either of those areas.
The critical value set in the Coastal Zone of New Jersey is the very substantial tourist and recreation industry, which depends on the quantity and quality of . human experiences available in the Zone. Therefore, any process that seeks to reduce conflict between OCS activity and current uses must first identify the issues involved in the conflict,and second, to introduce methods which seek to minimize the conflicts between significant current uses and service base development.
This study has assumed at the outset that the tourist and recreation industry is a prime economic, social, and environmental resource which deserves careful study. Thus, this chapter addresses issues and measures to minimize and avoid conflict on a coastline dominated by high intensity, high quality, if mostly seasonal use.
5.2 General Base Operation Procedures
5.2.1 Infrastructure Considerations
Bases should be developed in those areas that have an infrastructure that would be able to absorb as many of the impacts associated with the base without causing undue pressures for increased services. In addition to transportation and industrial criteria, the significant infrastructural issues should include but are not limited to:
1. Administrative/Financial Capabilities; 2. Housing; 3. Water Demand; 4. Sewage Collection and Treatment; 5. Solid Waste Collection and Disposal; 6. Crime Prevention; 7. Fire Prevention; 8. Recreational Facilities; 9. Health Facilities; and
10. Educational Services.
166
5. 2. 2 ocs· Acti.vt.tie.$. th~.t Do Not Need Water Access
The impacts· on the es-tuarine zone of New Jersey ca,n be minimized if activities that do not need water access are s·ited in upland areas. OCS activities that can be sited upland include helicopter operations, open storage areas for supplies, and pipe coating yards. Although short--term economies can accrue to operators of such facilities when they are sited in coastal areas, the costs of destroyed or reduced wetland productivity are borne ny the puolic. It is, therefore, desirable to site the following activities in upland areas.
Helicopter Bases
Helicopter bases to support the transfer of crews to drilling rigs, platforms, or pipelaying vessels are not coastal dependent and should, therefore, be sited at existing airfields. This would reduce the acreage at a base by eliminating the need for one (1) acre per rig serviced at the base for a helicopter pad as well as reducing the parking spaces for offshore employees at the base. It is suggested that one helicopter pad be maintained at each base for emergency services, only if compatible with surrounding uses.
Open Storage Areas
Open storage areas for supplies at the support bases can be reduced by storing materials at an inland railhead area that would normally be receiving shipments of pipe, drilling muds, and cements since rail is the preferred method of transportation. Materials shipped by rail would have to be transshipped by truck to the support bases in those areas without direct rail access and stored at the base in any event so it would, therefore, make sense to store the material at the railhead and ship it at a time when it would be needed. This method would not require any extra loading or unloading but would decrease the total acreage needed at the valuable land-water interface.
Pipe Coating Yards
Pipe coating yards do not need direct water access to operate. A more important need is rail access to accommodate the delivery of raw materials and shipment of finished products. An investigation of pipe coating operations revealed that two companies located in New Jersey have experience in subsea pipe coating. TPCO Incorporated of Monmouth Junction and Standard Pipeprotection D.i vision of Kearny have the ability to process steel pipe used in offshore operations.

167
Both companies have rail spurs to their plants. for delivery of raw ro~terials. Thes.e spurs could also be used to ship -proces-sed pipe to port areas. ;eo;r; barge loadings. If this: is not econoiJl.ica,l. coated pipe can be trucked to port areas for loading on workhoats or barges and then tra,nsported to the pipelaying area. This would, therefore, reduce the land a,rea needed at the water's edge and allow it to be used for those activities that are coastal dependent.
5. 3 Cons-truction Scheduling in Wetlands (if deemed necessary>_
Adverse impacts can be minimized by scheduling any construction activity during the time of the year in which the least environmental damage would be incurred. This would be accomplished by constructing during the late summer and fall, when runoff from the site would least alter the ecosystem of the wetlands.
Sediment runoff causes increased turpidity and enrichment of the water column with nutrients that would alter the ecosystem. Turbidity could cause an alteration in the growth rate of plants because of the lack of light for photosynthesis thus. changing the natural balance of the endemic plant population. Enrichment of the water column can alter the photoplankton concentration and, thus, disrupt the natural cycle of growth.. Another factor would be the introduction of pollutant& such as heavy metals and paints into the sys-tem that would also alter the growth cycle.
5.4 Environmental Measures
5.4.1 Onshore
Wastewater and Runoff
Wastewater and runoff are two areas in which much concern is expressed. It is suggested that all wastewater be connected to and treated in existing sewage treatment plants. It is not recommended that septic treatment be used because of the non-filterability of the soils in the coastal zone.
Runoff control could be accomplished by the installation of catch basins and filters to trap pollutants and contaminants that should be treated or contained at the source, in accordance with area-wide waste treatment management programs required to be developed by Section 208 of the 1972 ammendments to the Federal Water Pollution Control Act.
Runoff could also be controlled by avoidance of the direct channeling of runoff water into tidal wetlands by use of porous gravel or perforated paving block surfacing with the provision of open grassed peak overflow parking areas.

168
Storage Tanks
Storage tanks for tuels should be a type that would minimize the evaporation o~ would include a recovery system. Floating roof tanks are indicated in some reports as the type that would have the least evaporation, but is also noted in taking to A.r.I. representatives that there are engineering protlems in the seals in these tanks. Further investigation is, therefore, needed as to which_ type of tank would be the best for the storage of the fuels.
5.4.2 On or In Water
Booming
Booming of workboats should be mandatory whenever a ship is loading fuels or chemicals into its holding tanks to prevent dispersal of pollutants in case of an accidental spill.
Was_-tewater From Workboats
Wastewater that would be associated with the operation of a workboat would include water from galleys, sinks, showers, laundry, and sewage effluents. The discharge of these waters are controlled by Coast Guard-approved sanitary waste devices. The standards for fecal coliform count is 1QQQ per 100 rol., and no visible floating solids for a system installed prior to January 30, l978. New standards will go into effect for any sanitary device installed after this date of coliform count less than 200 per 100 ml. and suspended solid concentration less than 140 mg. per liter. It is further stated that as of January 30, 1980 any system that cannot meet this standard would have to utilize holding tanks for sewage.
It is our judgement that any workboat operation in New Jersey's coastal waters should be required to utilize holding tanks and to discharge that wastewater into the sanitary sewers at a service base. We feel the coastal water quality should not be compromised on this issue.
Bilge Water, Ballast Water, and Engine Oil
These are three types of liquid that under existing Federal Acts would be regularly discharged into coastal waters. Bilge water could contain petroleum and heavy metals that would be toxic to marine organisms when discharged into coastal waters. Ballast water could contain the above mentioned contaminants plus fecal bacteria that would have a high biological oxygen demand.
Engine oil from properly functioning vessel engines is classified as not harmful to the marine environment by Federal Code and is also discharged into coastal waters.

The discharge of any of the above contaminants should be prohibited by changing regulations and by providing onshore tanks at the se.rvice base into which. these liquids could be pumped. The contaminants could then be treated and reused as ballast water when vessels require it or
169
be disposed of properly in a hazardous waste disposal site. This would minimize the effects of normal vessel operations.
5.5 Transportation
5.5.1 Helicopter Operations
These operations should be sited at an airport that would optimize safety and minimize conflicts with surrounding land uses. These factors are best met at NAFEC (Atlantic City Airport) where the necessary instrumentation and safety equipment to accommodate landings during adverse weather conditions.
Bader Field, on the other hand, has a number of circumstances that complicate its selection as a helicopter support base. It does not have the instrumentation of NAFEC, nor is it located in an area that would minimize conflicts with surrounding land uses. It is a privately operated facility that leases the land from Atlantic City with leasing arrangements on an informal month-to-month basis. This reflects an unresolved position of Atlantic City as to the airport's future use.
Local community sentiments favor the use of this land for a new high school and recreational area. Regional pressures for increased use of the airport to accommodate increased commercial and private air traffic have been felt as well. These factors have led us to conclude that Bader Field would not be the most acceptable airport for OCS helicopter operations.
5.5.2 Truck Traffic
Trucks should not be allowed on local streets where they would conflict with existing traffic and design criteria. Heavy truck traffic on local streets would cause safety problems, road maintenance problems, and turning problems, as well as disrupting communities through which the trucks operate.
If the existing highway network is already overutilized and no other alternative is available for the shipment of supplies to a support base, then the transportation of supplies during non-peak night hours should be considered. This option could be taken if it is compatible with surrounding land uses or if proper buffer zones have been established.

170
Service bases wor,k on a twenty~four (241 hour basis and should, there:eore, be utilized-in a manner i.n wh.ich impacts could be minimized. If the proper conditions are met, then night shipment of suppiies by truck should be considered on a site by site basis.
5.5.3 Boat Operations
Coast Guard regulations on boat operation in intracoastal waterways do not specify stringent regulations but apply in qualitative terms. The ves-sel must be operated in a safe manner, and its wake should not cause safety problems to surrounding vessels or damage the shoreline.
The State would benefit from the adoption of rules and regulations that are more stringent in regulating the speeds of vessels in waterways. Speed limits should be set in those areas where conflicts would exist with other types o£ traffic and in fragile estuarine areas where propeller cuttings and wakes would be harmful to the existing ecosystem a.nd shoreline.
5.6 Local Site Plan Analysis
5.6.1 Introduction
Site plan analysis affords the opportunity to planning boards and appropriate agencies for rational review and subsequent decision-making processes. Support base development plans must take into account specific natural and built environmental factors. Thus, site plan review is a key to avoiding unnecessary impacts by clustering development, by restricting development, or by approving development and employing mitigating measures.
All development plans must take into the account numerous factors of the built and natural environment in which_ it is proposed. Land use relationship, soil type, slope, vegetation, depth to water table, erosion, and sedimentation characteristics are only some of the factors that must be considered in reviewing a site plan. Each of these factors must be considered on a site specific basis to identify constraints to site development.
If a support base is located in an area where there would be conflicts with adjacent land uses, such as residential, commercial, or recreational uses, then particular attention must be directed to reviewing buffer zones, landscaping, and placement of activities at a site. On the other hand, if the support base is located in an industrial zone, less emphasis would be placed on reviewing buffer zones and landscaping.

Standards and design principles are also useful in establishing desirable development design objectives, hut it must be cautioned that they can be used only as general guides. The following suggestions for reviewing site plans should be considered with these factors in mind. This review should take place on a site by site basis to determine design and performance characteristics that are applicable to the specific site plan.
5.6.2 Buffer Zones
Properly planned buffer zones are essential in site development where conflicts with adjacent uses might exist. They improve esthetics, reduce noise pollution, and can render a seemingly incompatible use harmonious with its surroundings. Buffer zones can act to ameliorate possible adverse visual and noise conflicts at an onshore support base if careful consideration is taken in:
1. Placement of activities and design 2. Plant selection, size, and placement 3. Use of berms, fences, and walls.
1. Placement of activities at a support base can be very critical in minimizing adverse environmental, esthetic, and noise considerations. Activities that generate adverse off-site effects should be sited where their impacts are minimized.
Activities which generate high levels of noise should be placed in an area where they would not conflict with adjacent uses. Proper placement would also allow a properly planned buffer zone to reduce the decibel level, resulting in minimal noise infiltration.
171
Esthetically unpleasing structures can be hidden by the proper placement of buildings which at the same time reduce noise conflicts. An ugly building hiding an equally ugly function adds little to the design concept of a site plan. A thoughtful selection of building design and materials that would be compatible with surrounding uses would make that structure an asset rather than a liability.
Building materials should be wood or woodlike in an area where architectural compatibility is a desirable goal. This goal would be desirable in an area such as Atlantic City where recreational boating and marina activities are in close proximity. Earth-tones and maritime colors (_e.g. white, grey, green, black, blue, red) are Preferable to pastels and other non-maritime colors in making the design more compatible with existing patterns.
2. Plant selection is a critical factor in the buffer zone detail. With the close proximity of salt water and salt water spray in some siting areas, there must

172
be careful consideration in selecting plantings. Where possible, the species of plants should be compatible with those of surrounding shoreline areas. The following species are suggested for use on barrier island areas as being the most appropriate for soil and weather conditions: Japanese black pine, American holly, red cedar, bayberry, and Russian olive.
Plant size should also be considered in reviewing a site plan. A plan may show the proposed type of pl~nting, but it may not indicate the size and its maturity. The planting would be of little use if it was small and did not perform the function it was intended to. The plant must, therefore, be of sufficient size and maturity to insure that it will prosper in its new environment.
A method to ensure the proper selection and replacement of any dead specimens during the development phase would be to require a landscape maintenance bond. This would require a developer to post a bond for a specified time period, possibly two years, that would ensure that all plantings be maintained for that period allowing them to become established in their new environments. With this stipulation, proper selection, placement and care of plantings would be desirable from an economic standpoint of the developer.
3. Berms, fences, and walls can also be used to make a support base more harmonious with adjacent land uses. The combination of a properly placed berm that would be compatible with forms of the natural shoreline and plantings would improve a site esthetically and ameliorate noise problems at the site.
For screening purposes, fences of wood in their natural or stained tones would provide some benefit but they would best be utilized in combination with plantings in front of them to make them more visually pleasing. Chain link fence is not the kind of fence that would accomplish desired effects, but if it is used in combination with plantings and is of a green color, it would be more acceptable.
Walls of brick or stone would be more costly alternatives to the above mentioned items but a stark wall might be as unattractive as that which it hopes to hide. Plant cover would be a compatible use in making a wall more acceptible in its use.
5.6.3 Parking Requirements
Large amounts of land at support bases have been utilized for parking of base and offshore employees. It has already been noted in this report that the transfer of drilling crews will take place from airports in

Atlantic City. This would reduce the p~rking needs required at a support base th~s allowing ~or more intensive use of the site.
173
Further reductions in parking areas can be accomplished if warranted by site constraints. Supply boat crews work on a seven day on - seven day off schedule and normally utilize parking areas for that seven day period. Their long term parking needs can be satisfied by parking at an off-site location with transfer to the base accomplished by means of bus, minibus, or mass transit. This would enable a more efficient and intensive use of the site.
On-site parking should be planned in terms of those employees that work on a day to day basis that require parking. Areas should also be planned for visitors with peak overflow parking areas provided for in open grassed areas.
Controlling runoff from the parking area can be accomplished by various means and should be examined on a site by site basis. The options include:
1. Utilizing crushed rock and stone surface to allow water to be absorbed into the groundwater
2. Paving the area with a porous pavement 3. Paving in a conventional manner with installation
of catch basins and filters.
5.6.4 Storage Tanks
Various kinds of storage tanks will be utilized at support bases to store the necessary specialized products. These products include fuels, petroleum primers, drilling muds and cements, and water. The kind of tanks utilized will also aepend upon the point in time they are sited.
Mud storage tanks at a temporary service base are. portable tanks approximately twenty-six (26) feet long with a diameter of ten (10) feet supported on skids in a horizontal position. Tanks at a permanent service base would be installed on a quayside apron, be of larger volume, and have a more vertical profile approximately thirty (30) feet high. Both of these tanks must be sited at quayside because of the limited distance over which dry bulk can be pumped by compressors into the cargo hold of workboats. Fuel tank and water tank (where needed) placement is not constrained in the same manner as mud tanks. Fuel tanks should be placed in an area on the base where they can be diked to their full capacity and positioned away from the waters edge where spills might contaminate surface waters. Their placement and control measures can be dictated by the environment in which they are placed.

174
5.6.5 Lighting
Temporary and permanent service bases work on a twenty-four hour basis which dictates the need fox overhead flood lighting. If a base is sited in an industrial zone. there would probably be little conflict with_ adjacent land uses, but if sited near recreational or residential areas then conflicts might occur.
Lighting should be examined in terms of:
~. Are adjacent areas shielded from light spread? 2. Does the design of towers integrate itself with
surrounding uses? 3. Are the materials selected of compatible design
with adjacent structures? 4. Could a greater number of low height lighting
standards be used rather than a smaller number of higher standards?
5.6.6 Explosives
Explosives may be stored at permanent service bases. The explosives are used to facilitate blowing out downhole drill pipes for the purpose of oil and gas recovery. Industrial explosives are assembled with a Primacord detonator out on the drilling platform at the time of lowering the charge into the hole.
At the base, the Primacord is stored in a magazine separate from the blasting caps for safety purposes. All explosives must be located away from fuels and inhabited buildings as directed by the Bureau of Engineering and s-afety, Department of Labor and Industry, from New Jersey Administrative Code 12:~90-193.
5.6.6 Other Considerations
The site plan should also examine circulation systems leading to and within the site itself. Will large trucks have proper access to the site in terms of turning radius and non-conflict with other vehicles? Are trucks able to gain access to the highway without causing safety problems? Are they entering the traffic system through_ uncontrolled intersections? These issues must also be examined to ensure safe movement of vehicles near the site.
Are there provisions for handling solid waste in a safe and clean manner? Are these facilities properly sited on the base?
Following proper design review and performance standards for the site as a whole will minimize conflicts and make the use more compatible with environmental and the existing land use patterns.

CHAPTER 6
FUTURE CONFLICTS AND OPPORTUNITIES IN ONSHORE SUPPORT BASE PLANNING
Future coastal zone planning to deal with development must cope with the following concerns:
6.1 Regional OCS Activities
New Jersey must monitor OCS activities in other Mid-Atlantic states to determine the impacts on the State. For example, the construction of support facilities in Delaware or New York will reduce the demands on the coastal zone of New Jersey.
If a planned platform fabrication yard is sited in Virginia by the Brown and Root Construction Company, it will probably produce different impacts in New Jersey than if development platforms were supplied from the Gulf Coast. Such a yard in Virginia or any other adjacent state may reduce or eliminate entirely demands for such installations in New Jersey. At the same time, it would also reduce demands for platform installation bases in New Jersey and produce the need for only minimal support from permanent service bases.
Regional consideration by Mid-Atlantic states in concert should be given to proposals for base development. This would discourage speculative service base construction that would result in unutilized bases or the shifting of operations at the expense of another area. A service base proposal containing letters of intent or contracts with oil or service companies is the only acceptable proposal. Ventures that are undercapitalized and poorly planned will result in the destruction of valuable coastal resources without economic benefits.
These suggestions are made to help preserve New Jersey's resources as well as those of the other states. To reiterate, impacts of OCS development must be addressed through regional efforts among the states involved in order to minimize adverse effects. It is suggested that regular meetings of State officials with specific agenda to address anticipated impacts is the best approach to regional coordination.
6.2 Technology Change
New Jersey must keep abreast of changes in the operating procedures used in the exploration for and the recovery of hydrocarbon reserves. New technology utilization

176
alters the type and magnitude of onshore impacts associated with development.
Subsea well completion and production systems and floating LNG plants are two areas displaying rapid technological advancement. Continued improvement in all areas of operation will occur as observed during the period of North Sea operations.
Changes in the manner in which supplies are delivered from service bases to offshore rigs and platforms would also modify onshore impacts. The North Sea experience led to the development of ocean-going supply boats greater than 200 feet in length that could carry increased amounts of cargo. If still larger boats are utilized in the future or specialized vessels are developed that deliver only fuel, for example, then onshore impacts might change as well. Therefore, New Jersey must monitor any changes in delivery system technologies that may affect impacts on the state.
6.3 Vocational Training
In order for New Jersey to gain the economic benefits associated with OCS development, the employment opportunities generated should be filled as quickly as possible by local residents. Although some skills are OCS development specific, others such as welding, mechanical repairing, diesal engineering and electronic repairs are not. Vocational training should be directed to filling those job areas for which New Jersey residents have the best opportunity. A better understanding of the needs of oil and service companies can be accomplished through cooperative programs which identify the skills that will be required.
6.4 Boom and Bust
The most difficult feature that accompanies onshore OCS development to plan for is the cycle of rapid economic buildup and rapid economic decline. This is a common occurrence in the development of energy resources. It has happened in Scotland, Alaska, and is presently occurring in areas where coal is being recovered in our western states. These energy producing areas can provide some lessons. However, because of differences in demographic and socio-economic conditions, their experience may not apply directly to New Jersey.
There is a need to produce further inquiry concerning development in our coastal zone, the infrastructure requirements, and the economic base. Planning for these impacts early will alleviate some of the adverse effects that come with development.

6.5 Industrial Waterfront Districts
The waterfront districts in New Jersey north of Raritan Bay have traditionally been industrial and commercial ports. Any new activity introduced into the area should be evaluated in terms of impact on existing water and air quality. In areas where water or air quality is below national or state standards, new activities that significantly degrade the environment should be discouraged.
For example, although hydrocarbon (HC) air pollution data are not available at Perth Amboy, monitoring stations in nearby Elizabeth and Bayonne indicate that established
1 standards for HC are exceeded most days of the year. Any operations in a Raritan Bay - Arthur Kill site need be scrutinized to minimize HC emissions.
Development must also consider the increased interest and action of urban populations to gain increased access
177
to waterways for parks and recreational activities. Coordination in this regard,to promote upgrading of urban waterfronts, by the Office of Coastal Zone Management and the Green Acres Program is needed.
6.6 Wetlands Along the Raritan River
The unmapped acres of wetlands along the bank of the Raritan River in Middlesex County should be surveyed by the DEP/Office of Wetlands Management to determine their productivity. A local conflict may arise in that the County Master Plan depicts the area as a conservation district to protect a major aquifer. Edison and Woodbridge Township~ have zoned the north bank for industrial activity. The Raritan Center which is on an adjacent upland area is planned by its owners to expand its industrial activity to the waterfront. This prevalent type of conflict needs to be explored.
6.7 Casino Gambling and OCS Activities
Any proposed development along the coastline, especially in Atlantic and Cape May Counties, cannot be disassociated from the impacts of casino gambling. In 1976, the number of visitors to Atlantic City was estimated at 2 million, by 1990 this figure is projected to rise to 9.7 million as a result of gambling. The employment generated by the increased activity is expected to be 50,000. 2 To support this growth, demands for housing, municipal services, and tourist accommodations will increase in the coastal zone in areas outside Atlantic City.
If offshore drilling produces significant amounts of recoverable resources, the siting of OCS facilities along

178
the Atlantic coastline will create additional demands for housing and services. Further coastal zone planning should consider the potential conflicts and impacts on coastal resources generated as a result of OCS and casino gambling activities.
6.8 Some Broader Impacts Ahead
OCS oil and gas exploration is a temporary phenomenon which has limited onshore impacts. It is generally confined to those communities which contain support bases, repair yards, and related facilities. In the u.s. Gulf Coast, where exploration is still being undertaken, onshore impacts have continued to be felt over the past 30 years. In the North Sea, by contrast, the exploration phase of the Southern North Sea operations lasted less than a decade.
Nevertheless, exploration may produce important "downstream" impacts, both for the support base communities and elsewhere. Available evidence indicates that larger support base communities generally attract a variety of ancillary industries, many of which persist throughout later OCS development and production stages. 3 Firms which supported exploration rigs switch over to specialize in the maintenance of production platforms. Thus, it is quite likely that many of the diving and repair and maintenance services, specialized clothing and safety firms, catering and other activities that might cluster around support bases (in Atlantic City or Lewes, Delaware, for example) will continue in these areas after the exploration rigs and mud suppliers, etc., depart.
A secondary category of downstream impacts also affects original support base communities. Where oil and gas exploration competes with existing industries for labor, land, or other resources, it is possible that those industries may fail, may lose financially, or be forced to move to more favorable locations. Low paying resort activities and commercial fishing may be so affected. For example, fishing boats may be crowded out of harbor, dock and wharf space, or repair yards by more aggressive, richer, cashpaying oil industry vessels. In New Jersey, Port Monmouth, Point Pleasant, and Cape May are already crowded by fishing vessels. 4 Atlantic City and Lewes, Delaware are less used by fishermen, and both possess underutilized waterfront facilities which might accommodate some support activities. If fishing boats vacate existing New Jersey ports to make way for oil industry vessels, the loss may be permanent. After oil and gas are exhausted, the fishing industry may be so altered that re-establishment is impossible (e.g., Aberdeen, Scotland suffered this fate).
Alternatively, use of coastal communities for oil and gas exploration support may foreclose upon potential devel-

179
opment options at a later date. If Atlantic City continues to develop as a casino gambling center, it will attract increasing pleasure boat traffic. Marina developers may be deterred by the existence of fast moving, busy oil support vessels and the potential for conflict between commercial and recreational shipping in confined channels.
It is recognized that while there is no necessity for OCS development and production firms to invest in the same communities as exploration firms, there are strong pressures to establish maritime industries near pipeline landfall sites and onshore pipeline routes. 5
In New Jersey, these may result in further development of support base communities. The extent to which this occurs is likely to be a function of the strength and effectiveness of state and local land use controls.
6.9 Ecological Conflicts
New Jersey has heavy dependence on petroleum both as feedstacks for the chemical industry and as a large component of the State's fuel mix.* Assuming at least a moderate find scenario, apparent economies in pipinq, refining, and consuming offshore-produced oil instate will dictate land falls for pipe transmission on the coast. Thus, the proximity of southern New Jersey to tracts in Lease Sale 40 and subsequent leases places OCZM squarely on the horns of a dilemma in establishing policy guidelines.
The New Jersey Atlantic Coast is part of the Barrier Island system that is characterized as a discrete and significant ecological unit. Many environmentalists have proclaimed the protection of this system because of its contribution to our natural resource base. However, the preservation of this area at the shoreline is tied to the upland margin and the ecosystem referred to as the Pine Barrens. The Barrens form a vegetation, soils, and water quality complex that interacts directly with the barrier island system.
The location of Lease Sale 40 tracts and subsequent lease areas point to pipeline traverses through the barrier island system to a landfall in the Barrens. With such a landfall, there will be economic pressure to site processing plants, pumping stations, tank farms, and ancillary installations in the Barrens. Thus, a serious
* According to U.S. Department of Interior, 1972 figures the petro-chemical industry in New Jersey consumed 36.7% of the State's energy. Also the State's fuel mix was 67.6% petroleum as opposed to 49% for the national average.

180
conflict arises because of state and federal initiatives which have been taken to preserve the ecological system, to holdtonew strict water quality standards, and to establish a large public land trust. Giventhe general impetus for preservation of the Pine Barrens, specific steps should be taken to guard against industrial development in association with the landfall site.
In order to fully protect the public interest in developing the potentially great energy resource off the shoreline and to protect the socially, politically, and scientifically important Pine Barrens resources, a high priority should be placed on a study to create a pipeline scenario. An objective of such a study is to provide policy guidelines as well as to model the driving systems.
6.10 Conclusion
As can be seen by the conflicts and opportunities that are outlined above, New Jersey's task of managing the coastal zone will be a formidable one. Decisions affecting the future of the coastal zone must consider the major competing uses of recreation-tourism, commercial fishing, preservation of environmental quality, and energy while trying to balance them in a manner that benefits New Jersey. Such a balance can only be attained when decisions are based on adequate data and when the consequences of such decisions are fully understood. The Office of Coastal Zone Management/DEP has been and is continuing to work toward establishing an adequate data base of coastal resources and it has also initiated a cooperative energy planning effort with county planning agencies. These are the types of efforts that need be continued and expanded so that a more complete picture of the coastal zone and its resources exist.
Once such a data base is attained, then a comprehensive planning effort incorporating the major development types can be more effectively instituted. This management strategy cannot be based on incrementalism and must incorporate a broad based planning effort in which information is continually sought and effectively utilized. Other State and Federal agencies, recreation and tourist interests, commercial fishing interests, and private industry must be consulted in an ongoing effort to coordinate coastal zone management to preserve New Jersey's natural resources for future generations.

CHAPTER 7
MAJOR FINDINGS, CONCLUSIONS AND RECOMMENDATIONS TO NEW JERSEY'S OCZM
7.1 Introduction
Using the criteria established in the New England River Basins Commission's RALI/Factbook as required by the contractor and as reviewed and adjusted in conferences with oil industry representatives, an analytical methodology to assess the positive and negative physical, environmental, social, economic and institutional impacts of onshore support bases was developed. Studies of New Jersey's coastline were made and results are reported.
7.2 Major Findings and Conclusions
There are three major phases to OCS support base operation that occur in the following sequence:
Exploration
The initial stage of offshore operations seeks to identify if recoverable resources exist. Exploratory drilling rigs are leased by oil companies and positioned for drilling exploration wells. Support is provided from temporary service bases set up for this purpose. Materials for drilling are transferred by supply boats while drillin~ crews and supervisory personnel are transferred from helicopter bases.
Initial exploratory operations will take place for 1 to 1~ years allowing oil companies to make an assessment of potential resources. If no resources are discovered, operations will decline but could continue for up to 5 years. If a strike is made activity will grow rapidly, and orders for steel drilling platforms will be placed as the oil companies and service companies prepare for the development phase of OCS operations.
Development
As activity intensifies, permanent service bases are usually set up within 150 miles of the offshore tracts. These bases can be established by oil companies or by oil service companies planning to sell their services and products. Oil companies conduct only a small amount of the support activity directly but choose to subcontract much of the work to oil service companies.
As platforms are constructed in platform fabrication yards, pipeline routes are planned and orders for subsea pipelines are placed and filled at pipe coating yards. Subsea pipelines are contracted with pipelaying companies and pipeline installation service bases are

182
established to support operations.
When platforms are ready eor placement on the OCS, support is needed from a platform installation base that may be established near the offshore s-ites-. When the platforms are in place, development wells are completed as the predecision to production.
Offshore operations will peak after approximately lQ years as exploratory and development wells drilled begins to decline. Development operations could continue up to 25 years as new wells are brought into the production phase.
Production
f"\nro'"' ri ...... ~T ...... 1rvt''"\T\"'c.l"''+- T-.Ta11co ::lra rol"'"\nT'"\1o+-orl +-'ho"\7 ::1ro +-h._.on
Once development wells are conpleted, they are then connected to gathering oil and gas pipelines that lead to major transmission lines for ashore transport. The pro~ ducing wells require periodic servicing and maintenance. Far less supplies are needed in this stage.than in pre~ vious stages and consequently less onshore support is needed. As offshore activity declines, onshore support and employment decline until the life of the field ends after 25-35 years. Figure 7.1 illustrates the relation~· ships between each phase of OCS operations.
Figure 4
Major Phases of OCS Operations
Time (Years)
7.2.2 Exploratory Operations - Impacts for New Jersey
New Jersey will support a helicopter operations base at either Bader Field, Atlantic City or at the National Aviation Facilities Experiment Center (NAFEC) in Pomona.

Drilling crews and supervisory personnel will be transferred by helicopter from the above locaations because of their proximity to offshore leased tracts. Drilling supplies and equipment will be trans~erred to the offshore sites· from a temporary service base in Quonset :Point, Davisville, Rhode Island.
Impacts from the helicopter base or bases will be minimal since only minor changes will be made at either site to accommodate operations. Socio-economic impacts will be minimal as .well.
7.2.3 Development Activity
183
With a positive find of oil and gas reserves, significant demands will be placed on New Jersey's natural resources and infrastructure to support the following OCS support bases:
1. Permanent Service Base 2. Platform Installation Base 3. Pipe Coating Yard 4. Pipeline Installation Base 5. Repair and Maintenance Yards
Site Selection
The Raritan Bay - Arthur Kill area, Manasquan Inlet, Absecon Inlet (Atlantic City and Brigantine), Cold Spring Inlet (Cape May), Maurice River and Camden were studied in detail. Additionally, for all other conceivable inlets or ports were examined and found unworthy of additional study.
A comparative analysis of sites revealed that the Perth Amboy site in the New York-New Jersey Port Authority District produced the fewest adverse impacts and the most positive impacts for all OCS support bases studied. Siting exercises at Manasquan, Absecon, Cape May and the Maurice River indicated a preponderance of negative impacts. The exception being that existing facilities in Cape May and the Maurice River might be able to accommodate some OCS activities. A small temporary service in Cape May just north of Cold Spring Inlet is possible and would create minimal negative impact. A ship repair facility exists on the Maurice River and could repair shallow draft vessels if the need arises. Table 7.1 summarizes the findings on site selection.
The oil support industry and petroleum companies desire to locate bases as near Lease Sale No. 40 and subsequent lease tracts as possible. However, the accessibility of rail to dockside in the Arthur KillRaritan Bay area, close proximity to limited access arterial highways and the historically industrial nature of Perth Amboy site present important factors to balance the increased costs caused by the distance to offshore activity.

Location
Camden
Maurice River area
Cold Spring Inlet (Cape May)
Absecon Inlet (Atlantic City and Brigantine)
Manasquan Inlet
N.Y. - N.J. Port Authority District (Perth Amboy)
TABLE 7.1
Site Selection Summary
Existing Use
Industrial, Urban Port District
Mostly pristine Undeveloped waterfront, one shipyard
Recreational Commercial and Tourist Center
Recreational Commercial and Tourist Center
Recreational Commercial and Tourist Center
Industrial, Urban Port District
Development Opportunity
Limited
Low
Limited
Moderate
Low
High
Development Constraints
Low
High
High
High
High
Low
Proposed Support Base Use
Pipe coating yard Ship repair yard
Possibly ship repair of shallow draft vessels
Temporary Service base (using existing facilities only)
None
None
Temporary Service Base Permanent Service Base Pipe Coating yard Pipeline and platform Installation base Repair and Maintenance yards

Helicopter support activities were studied and it was found that the NAFEC facility in Pomona was the best location. It presents fewer 'land use conflicts, has
185
more room for the expansion associated with_ a medium or high find and has more advanced instrumentation for landings during adverse weather conditions. Commercial and charter airlines serve this facility and would accommodate the transfer of supervisory and non-resident crews from the Gulf Coast area as well.
The Port of Camden was found to be too far removed from the offshore tracts for all support bases except for a pipe coating yard. Although it has ship repair facilities it is less likely that QCS vessels would be repaired there than other areas because of the distance from permanent service bases. Pipe coating yards are not as distance sensitive as other support bases and for this reason Camden could accommodate such a base.
Impact Analysis
A major finding was the paucity of environmental data which are available to calculate quantitative impacts of support bases and their activities on the physical environmental quality. Therefore, generalized qualitative impacts are reported from these assessments. Likewise, impacts of increased boat traffic in harbor areas are stated in general terms due to lack of actual numbers of boats and traffic loads in port areas.
No labor shortages are projected for any level of find and except for schools and medical care in the Atlantic City area, social services were not found to be a limiting factor to onshore support base activity.
Highway accessibility and the diversity of types of residential living, ~ndicate that the New Jersey metropolitan area in particular will afford satisfactory life styles for technical and professional employees moving to New Jersey for the OCS development.
7.3 Improving the Coastal Zone Management ProcessLegislative Background
The management of the Coastal Zone of New Jersey relative to locating support base activity is affected by specific laws, regulations, and procedures. The New Jersey Wetlands Act, Coastal Area Facility Review Act (CAPRA), Coastal Zone Management Act (CZt1A), P.L. 92-583, the state's water quality standards, the Federal Clean Air Act and State Regulations furnish a comprehensive legislative package that places the public interest in a strong position. OCZM can develop more comprehensive programs.

186
7.4 Specific Recommendations to OCZM/DEP
7.4.1 CZMA requires the state as part of its management plan to detail areas for development and for protection. The decayed and in part abandoned or unused portions of the waterfront in Middlesex, Union, Essex,Hudson Counties and the Port of Camden or the Delaware River represent a valuable resource for redevelopment of port facilities for industry, commerce, and trade. Both the South Jersey Port Corporation and the Port AuthoritY of New York and New Jersey are receptive to development proposals.
7.4.2 OCZM can work in concert with the Department of Energy and the Department of Labor and Industry to promote redevelopment actively within the private sector. In this regard, the research and development sector of New Jersey's industrial base should be consulted for input into their process.
7.4.3 Conversely, the opportunities to create Marine and Estuarine Sanctuaries under CZMA in the Mullica River Estuary, Great Bay area, and in the Dennis Creek, Goshen Creek, and elsewhere on the Delaware Bay would give direction to the future of coastal resources.
7.4.4 There is a need to enhance the decision-making process by having an expanded data base in water quality, the biota, air quality, water quantity and other natural resource factors. Additionally social, economic and legal data are needed for the Coastal Zone in order to quantify impacts of alternative actions at the coast.
7.4.5 Manasquan Inlet permits a valuable recreational and fishing port. Under the mandates of the legislation discussed previously, OCZM should encourage the institution of present land use patterns to maintain high environmental quality. Further, industrial and commercial activity not related to or contributing to recreational or fishing activity should be discouraged.
7.4.6 Atlantic City's revitalization as a tourist center is based on a new use, casino gambling, which would not be complemented by the introduction of OCS support bases. This has apparently been realized in the interim zoning plan of Atlantic City which zones developable portions of the Absecon Inlet area as resort-commercial. The negative aesthetics of support bases and the boat traffic which they would generate would not be in the best interests of Atlantic City's economic revival. Thus this report suggests that Atlantic City's economic revival is best served by continued development as a tourist and recreation center.
187
7.4.7 The natural conditions alon9 New Jersef's Atlantic coastline and the Delaware Bay do not generally provide sheltered harbors or inlets capable of meeting the development criteria for QCS Onshore Support Bases. Although the siting criteria for OCS support bases are not particularly stringent when measured against siting criteria of other industrial waterfront uses, few opportunities are presented for such development outside of New Jersey's industrial port districts.
The development af QCS support bases· in the coastal areas of the state would require substantial alteration to the shoreline and waterways and, thus, conflict with existing coastal zone uses and functions .
... The largest industry in the coastal area, and the second largest in all New Jersey, is the recreation-resort industry which generates approximately $3 billion annually in goods and services. Much of the recreation is water-oriented. 1
7.4.8 The inlets and harbors are intensely used for recreational boating, sport and commercial fishing, clamming and oyster operations, and the support of such functions. The introduction of a new use, OCS service bases, would cause increased competition for available land and increased waterway traffic that would only add to already crowded conditions and make it less attractive as a recreation center.
7.4.9 The coastline of New Jersey does not only serve the state's residents but is also a regional tourist att~action center that continues to grow and provide services to a regional population.
7.4.10 The importance of coastal wetlands has been recognized by state legislation that limits the development of these precious, unrenewable resources that are the world's most productive areas for food production. Support base development would require the filling and destruction of wetlands and possibly set a precedent for additional development on wetlands. Neither the enhancement of the recreation-tourist industry nor the productivity of wetlands would be served by support base development in coastal areas.
In contrast, the environmental and socio-economic constraints to service base development are much less restrictive in urban port districts when compared to the constraints in the coastal zone. The industrial ports in the state offer varying degrees of opportunity for OCS support base development. Existing industrial uses

188
in the urbanized ports are ~enerally more intense and place greater demands on the environment than the activ~ities that would be generated by support bases.
Cons-training factors- to the development of these facilities in urban areas, for the most part, are related to industrial siting criteria. Service base development along the Camden waterfront is restricted because of the distance and the navigational route from Camden to the offshore lease tracts. In port districts in the northern part of the state, conflicts with supply boat operations may occur where industrial shipping traffic is intense.
7.4.11 Traffic conflicts can be reduced by siting bases in areas where channels are less restrictive to the movement of vessels and ocean access is easily obtained. The ports that have less traffic conflicts are also closer to the offshore leased tracts. For New Jersey, the lower Arthur Kill region meets this criterion better than other areas.
Industrial port districts that do not have direct ocean access are not necessarily eliminated as OCS support bases. Siting of pipecoating yards, which is less distance sensitive, would be an alternative use in such areas.
7.4.12 In terms of environmental, socio-economic, and industrial siting criteria, the industrial port districts of New Jersey are more capable of meeting the demands of support base development than the Atlantic and Delaware Bay coastline. However, if onshore and offshore activities intensify because of large finds of recoverable resources, capital expenditures to improve or develop the local infrastructure may be required of individual communities. The economic burden to meet the service demands of anticipated growth should be shared by the industry.
7.4.13 The siting of facilities in the Arthur KillRaritan Bay should take into account the fact that Federal and New Jersey policy is aimed at cleaning up the state's waterways. It is recommended thus that the status of Raritan Bay as a valuable recreational and fishing resource be recognized and that newest and highest technology be employed to prevent all waterborne effluents. It is further recommended that the private interests, OCZM and other state agencies join and seek to establish these support bases as models of nonpolluting industrial activity.
7.4.14 The Municipal Land Use Law (N.J.S.A.40:55D-42) stipulates that municipalities may require a developer to pay his pro-rata share of necessary "off-tract" improvements for water, sewer, drainage, roads, and easements. Legislation could also be enacted to allow local communities to work out agreements with industry to prepay future taxes to meet immediate demands for local services occurring as a result of onshore and offshore activities.

This prepayment tax plan may require tradeoffs as an incentive to industry. The Federal Coa~tal Energy Impact Program(~EIPl, prepared by the National Oceanic and Atmospheric Administration of Coastal Zone Management, also provides for a program of state administered federal grqnts and loans to assist local communities impacted by OCS activities.
189
7.4.15 Presently, the anticipated time span of offshore operations is estimated to be twenty-five years. Onshore operations are expected to decline around year eleven. Legislation at the state level should be passed requiring industry to restore, or convert to other uses, onshore facilities. This restoration, or alternate plan, is especially critical in areas where the developed facilities are likely to be abandoned or are located in non-industrialized ports. The concept is not to restore the area to its predeveloped state, which would in most cases be impossible, but to leave it in a condition that would allow other industrial, commercial or recreational activities to be developed. New Jersey's urban waterfront areas show the scars of previous development that has left rotting finger piers, sunken barges, vessels and other onsite structures and debris. These conditions have effectively eliminated such areas from new uses because of the high cost of rehabilitation. The avoidance of similar problems in the future is the thrust of the concept.
7.4.16 It is assumed that demands for onshore support base facilities in New Jersey will occur if oil and gas reserves are discovered in the Mid-Atlantic. These facilities will include permanent service bases, repair and maintenance yards, platform installation bases, pipecoating yards, and pipeline installation bases. New Jersey is a frontier area for permanent service bases, and pipeline and platform installation bases; however, ship repair and maintenance yards and pipecoating yards are industrial activities already sited in New Jersey and capable of expanding their services to support OCS activities. The clustering of the frontier activities will reduce adverse impacts and demands on New Jersey's resources.
Although offshore drilling and onshore support is a new activity for New Jersey, lessons can be learned from areas throughout the world where this activity has previously occurred. In these areas, substantial economic benefits from OCS activities were derived, however, this was not without environmental and social costs. The primary goal for New Jersey should be to maximize benefits and minimize costs from OCS operations. This can best be achieved by directing OCS support activities to urban industrial port districts.


APPENDIX A
DERIVATION OF MULTIPLIERS
Previous studies have utilized new resident employment projections to calculate new resident ?G?~~ati~n, ne~ Iesident pupil population, and housing units demanded by new residents. The same method is used in this report, utilizing selected multipliers to generate the indices mentioned above. Studies that have applicable multipliers are listed below, and then the selected multiplier is noted at the end of the list.
New Resident Population
1. Decisions for Delaware: Sea Grant Looks at OCS Development by Joel Goodman, University of Delaware, 1975
2. Mid-Atlantic Regional Study., for American Petroleum Institute, Woodward-Clyde Consultants, 1975.
3. OCS Oil and Gas: An Environmental Assessment, Council on Environmental Quality, 1974
CCES Selected Multiplier
New Resident Pupil Population
New Resident Employment (NRE) x 4 = New Resident Population (NRP)
NRE x 3 = NRP
NRE x 2.07 = NRP
NRE X 2 • 7 5 = NRP I
191
1. .Hid-Atlantic Regional NRE x .75 = New Resident
2.
Study, for American Petroleum Institute, Wood-ward-Clyde Consultants, 1975
ocs Oil and Gas: An Environ-mental Assessment, Council on Environmental Quality, 1974.
CCES Selected Multiplier
Pupil Popula-tion (NRPP)
NRP X .25 = NRPP
NRP x .25 NRPP
Housing Units Demanded by New Residents
1. Mid-Atlantic Regional Study, for American Petroleum Institute, Woodward-Clyde Consultants, 1975.
NRE x 1 = Housing Units Demanded

192
Housing Units Demanded by New Residents (cont.)
2. OCS Oil and Gas: An Environmental Assessment, Council on Environmental Quality, 1974
3. A Study of the New Use Demands on the Coastal Zone and Offshore Areas of New Jersey and Delaware, Braddock, Dunn and McDonald, 1976
CCES Selected Multiplier
Employment Effects
NRP = Housing Units Demanded 3.1
NRP x .325 - .363 = Housing Units Demanded
NRE x .9 = Housing Units Demanded
The employment effects of OCS operations have also been addressed in the literature. The employment effects of OCS activity in the Mid-Atlantic area will be different than the effects in an area that has experienced offshore drilling over a long period of time. New Jersey does not presently have suppliers of petroleum drilling products and services, which would cause these products to be supplied from the Gulf Coast. This "leakage" would thus reduce the indirect and induced employment associated with OCS activities within the state.
These effects have been addressed in the Mid-Atlantic Regional Study for Atlantic, Gloucester, and Camden counties. The study projected an indirect job multiplier of 0.2 and an induced job multiplier of 1.8. These multipliers, when applied to 1 direct OCS job, result in 2.16 jobs being generated in the defined region. Our conclusion, after examining the literature and discussing economic impacts with industry and consultants in the Gulf Coast, was that a larger multiplier was needed to reflect the industrial infrastructure of northern New Jersey with less leakage in the system. A multiplier of 2.5 for the combined indirect and induced employment generated was selected.
1. Mid-Atlantic Regional Study, for American Petroleum InstLtute Woodward-Clyde Consultants, 1975
CCES Selected Multiplier
Direct OCS Jobs x 2.16 = OCS Generated Employment
Direct OCS Jobs x 2.5 = OCS Generated Employment

APPENDIX B Statutory Net Debt Limit
The following is a listing of the statutory net debt of selected Counties and Townships in New Jersey compiled on June 7, 1977 from the Office of Financial Regulation and Assistance. It should be noted that the statutory net debt limit for counties is 2% and for townships 3.5%.
In the instances.where the rate is greater than the statutory net debt limit, it means that such debts over the limit were approved by the Office of Financial Regulation and Assistance. Those counties and townships that approach or are above such limitations will have problems in financing any increased service delivery that might be generated from new population growth attributable to OCS activities or any other growth pressures. It is an indicator of the financial soundness of a municipality or county and thus affects its ability to finance new capital construction.
County or Township Net Debt Date
193
Atlantic County .50% June 21, 1977 Atlantic City 2.5% December 31, 1976 Pleasantville 1.14% March 28, 1977 Somers Point .81% March 10, 1917 Linwood 5.20% December 31, 19-96 Northfield 4.59% December 31, 1976 Vetnor City 1.55% March 31, 1977 Margate .70% December 31, 1976 Longport .66% December 31, 1977 Ocean City .59% May 4, 1977 Egg Harbor 0% December. 31, 1976 Absecon City 5.95% December 31, 1976 Galloway Township .20% January 17, 1977 Mullica .25% December 31, 1976 Hammonton 1.51% April 11, 1977 Hamilton 0.21% December 31, 1977 Weymouth Township .3290% December 13, 1977 Estell Manor 0% December 31, 1976 Buena Vista .0159% December 31, 1976 Folsom Borough 0.2% May 12, 1977 Brigantine 2.93% April 101 1977
Camden County 1.96% March 15, 1977 Camden 1.79% December 31, 1976
Cape May County .56% February 1, 1977 Lower Township .66% December 31, 1977 Cape May City 1.95% May 2, 1977

194
County or Township Net Debt Date
Middlesex County 1.0055% March 3 1 1977 Perth Amboy 2.0% February ll 1977 Scotch Plains .66% December 311 1976 Watchung 2.52% December 311 1976 Fanwood 1.21% April 13 1 1977 Plainfield 1.56% December 311 1977 North Plainfield 1.25% April 4 I 1977 South Plainfield 2.19% March 281 1977 Green Brook 1.67% April 4 I 1977 Dunellen .28% December 311 1976 Bridgewater 2.43% December 31 1 1976 Edison 1.13% May 11 1 1977 Woodbridge 2.74% May 31 1977 Carteret 1.29% December 311 1976 Metuchen 2.18% March 7 1 1977 Bound Brook .76% December 311 1976 Middlesex 1.63% December 311 1976 Piscataway 1.54% May 3 I 1977 Milltown 1.24% May 9 1 1977 North Brunswick 2.20% April 181 1977 New Brunswick .73% April 6 1 1977 East Brunswick 2.08% December 311 1976 South Brunswick 2.743% May 3 1 1977 South River 2.314% April 271 1977 Sayreville 1.31% December 311 1976 South Amboy N.A. N.A. Highland Park .45% February 1 I 1977 Old Bridge 2.28% December 311 1976 Spotswood 6.31% December 311 1976 Helmetta 1.869% December 311 1976 Jamesburg .85% May 5 1 1977 Plainsboro 0.0392% December 311 1977 Cranbury 2.5582% December 311 1976 Monroe 0.16% December 311 1976

APPENDIX C
MEETINGS WITH PRIVATE AND PUBLIC GROUPS
Public-at-Large Meetings
Regional public meetings were co-sponsored by the Center for Coastal and Environmental Studies, Rutgers University and League of Women Voters of New Jersey.
April 5, 1977
April 6, 1977
April 7, 1977
- Mainland Regional High School, Linwood Atlantic County, New Jersey
- Monmouth County Administration Building, Neptune, New Jersey
- Gloucester County Community College, Sewell, New Jersey
195
April 12, 1977 - Union County Administration Building, Westfield, New Jersey
Meetings with Public and Private Groups
February 10, 1977 - CCES Rutgers University
Grace Singer
Diane Graves
Elois Douglas
Ella Cherry
Robert Corman
Stephen Levy
Darryl Caputo
Derry Bennett
- Staff member, Princeton University Environmental Studies
- Representative of New Jersey Chapter, Sierra Club
- Environmental Quality Director, League of Women Voters of New Jersey
- Coastal Committee Chairperson, League of Women Voters of New Jersey
- Representative of Department of Public Advocate of New Jersey
- Representative of Citizens Energy Coalition of New Jersey
- Associate Director, New Jersey Conservation Foundation
- Executive Director, American Littoral Society

196
Meetings with Public and Private Groups. (cont.}
February 10, 1977 - Arranged in cooperation with
Louis J. Dalberth
Willian S. Cowart
the Southern New Jersey Development Council and held at Howard Johnson's Regency Motor Hotel, Atlantic City, New Jersey.
- Director, Southern New Jersey Development Council
- Senior Vice President, Atlantic City Electric Company
Robert 0. Pettegrew - Executive Director, South Jersey Port Corporation
Robert Fisher
Gregg Crecenzo
Gene Ely
James Kelly
Oscar Harris
Michael Merrill
Anthony M. Rey
Steven J. Batzer
Robert J. Gasko
John Koczan
John Siracusa Jr.
- South Jersey Port Corporation
- Atlantic County Planning Board
- Atlantic County Planning Board
- Delaware River Port Authority
- Atlantic City Housing and Redevelopment Authority
- Consultant, Atlantic County Economic Development Committee
- General Manager ChalfonteHaddon Hall Hotel
- President, Harlan Inc. of New Jersey
- Chairman, Atlantic County Board of Chosen Freeholders
- Associate, Dames and Moore
- Siracusa Company
February 16, 1977 - CCES Rutgers University
Don Mohr - Senior County Agent, Monmouth County Cooperative Extension Service
Lorrie Hartnett - Planner, Monmouth County Planning Board

Meetings with Public and Private Groups. (_cont~)
Jack Rosenberg
Douglas Powell
James Fong
Doug Opalski
Leslie B.ennett
Don Rippey
Milton Cowan
Eric Peterson
Joe Kazar
February 27, 1977 (a.m.)
Gene Ely
Charles Dupras
Eugene Vivian
Elmwood Jarmer
- Planner, Monmouth_ County Planning B.oard
- Director of Planning, Middlesex County Planning Board
- Planner, Middlesex County Planning Board
- Planner, Middlesex County Planning B.oard
- Planner, Ocean County Planning Board
- Extension Agent - Resource Management, Ocean County Cooperative Extension Service
- Senior County Agent, Middlesex County Cooperative Extension Service
- Senior County Agent, Union County Cooperative Extension Service
- Planner, Union County Planning Board
Atlantic County Ext. Building, Mays Landing, New Jersey
- Planner, Atlantic County Planning Board
- Senior County Agent, Atlantic County Extension Service
- Planning Consultant, Burlington County Planning Board
- Planning Director, Cape May County Planning Board
R.Carl Rubilcava- Planner, Cape May County Planning Board
Joan Batory
Joe Patermo
John Ober
- Director, Camden County Environmental Agency
- Planning Director, Camden County Planning Board
- Director, Division of Economic Development, City of Camden
197

198
Meetings with Puhlic and Private Groups. (~ont.)
John Holland
Harry Fries
Jeffrey Supnich
Robert Gardner
February 27, 1977 (_p.m.)
L.Albertson Huber
Robert L. Morgan
B.arney Welch
B.ob Karol
Brenda Pecan
Maurice Ridgeway
- Planning Director, Cumberland County Planning Board
- Senior County Agent, Cumberland County Cooperative Extension Service
- Planner, Salem County Planning Board
- Senior County Agent, Salem County Cooperative Extension Service
Atlantic County Extension Building, Mays Landing, New Jersey
- Representative of Division of Fish, Game, & Shellfisheries
- President of Oyster Planters and Packers Association
- Representative of Baymen's Association, Monmouth County
- Representative of Baymen's Association for Environmental Protection
- Representative of National Sea Clammer's Association
- Representative of Baymen's Association, Ocean County
May 10, 1977 CCES Rutgers University
Alfred W. Sitarski - State Government Relations Representative, Exxon Company
William Hobokan - District Manager, Public Affairs, Ashland Oil, Inc.
Richard Hickman - Exxon Company
Oliver Papps - Associate Director, New Jersey Petroleum Council
Ken Ring - Manager, Coastal Environ-mental Activities, Shell Oil Company

199
PERSONAL COMMUNICATIONS
Alcina, John -Vice President of Domestic Operations, Arthur Levey Boat Service, Inc., Morgan City, Louisiana, March 25, 1977
Archer, Thomas -Manager, Union Carbide Corporation, Perth Amboy, N.J. June 8, 1977.
Ayers, Louis -Projects Coordinator, North American Production, Continental Oil Company, Houston, Texas, April 1, 1977.
Berry, W.L. -Senior Staff Environmental Specialist, Southern E. and ~ Region, Shell Oil Company, New Orleans, March 29, 1977.
Binetsky, Richard -Chief, Bureau of Regional Planning, Department of Community Affairs, State of New Jersey, April 27, 1977.
Clark, Philip -American Petroleum Institute, Coastal Zone Management Coordinator, April 15, 1977.
Colanzi, Edward -Commissioner of Parks and Recreation, City Hall Atlantic City, New Jersey, March 16, 1977.
Cumberland County Planning Board -Bridgeton, New Jersey, March 23, 1977.
Dalberth, Louis J. -Director, Southern Jersey Development Council, Atlantic City, New Jersey, February 10, 1977.
Dana, John -Director of Economic Development Corporation, Port Authority of Rhode Island, April 18, 1977.
Emmer, Dr. Rod -Coastal Environments, Baton Rouge, La., March 28, 1977.
Fenick, Dr. John -Mayor of Carteret, April 18, 1977.
Fong, James -Planner, Middlesex County Planning Board, New Brunswick, New Jersey, March 24, 1977.
Frishman, Steve -Publisher, South Jetty Newspaper, Port Aransas, Texas, (member Texas Coastal and Marine Council), March 31, 1977.

200
Galerne, Andre -President, International Underwater Contractors, Bronx, New York, April 20, 1977.
Godwin, Mr. -City Engineer, Edison Township, Edison, New Jersey, April 19, 1977.
Hamlin, Robert G. -Executive Director, Cumberland County Economic Development Commission, Bridgeton, New Jersey, March 23, 1977.
Hickman, Richard Manager, Environmental Conservation and Protection, Exxon Company, New Orleans, Louisiana, January 17, 1977.
Jarmer, Elmwood -Planning Director, Planning Board, Cape May County, Cape May, New Jersey, March 18, 1977.
Keller, Michael -Director of Community Development, City of Perth Amboy, New Jersey, May 20, 1977.
Kreiger, Michael -Planner, Central Planning Division, N.Y. -N.J. Port Authority, New York City, New York, March 4, 1977.
Langenohl, Martin -City Engineer, Perth Amboy, New Jersey, May 6, 1977.
Levandoski, Thomas -Director of the Industrial Commission, South Amboy, New Jersey, April 13, 1977.
Markley, Marco -New Jersey Soil Conservation Service, Somerset County, New Jersey, January 20, 1977.
Mazurek, Fred -Director, Office of Economic Development, City Hall, Perth Amboy, New Jersey, April 25, 1977.
Mitchell, Robert -Engineer, Atlantic City Sewer Company, Atlantic City, New Jersey, June 6, 1977.
Mumphrey, Dr. Tony -Urban Studies Institute, University of New Orleans, Lakefront, New Orleans, March 29, 1977.
Nicu, Mr. ~ Soils Engineer, New Jersey Department of Transportation, January 20, 1977.

Ober, John -Director of Economic Development, City of Camden, New Jersey, March 29, 1977.
Peaton, Herschel -Dresser Industries, New Orleans,
Pettegrew, Robert -Executive Director of South Jersey Port Corporation, Camden, New Jersey, March 29, 1977.
Presley, John -
201
Airport Manager, National Aviation Facility Experimental Center, Pomona, New Jersey, April 26, 1977.
Pucci, Richard -Business Administrator, City of Perth Amboy, New Jersey, April 25, 1977.
Pupek, George -Vice President, TPCO Incorporated, Monmouth Junction, New Jersey, February 2, 1977.
Ring, Ken -Manager, Coastal Environmental Activities, Southern E & P Region, Shell Oil Company, March 29 & April 15, 1977.
Rosser, Keith -New Jersey Department of Transportation, Trenton, New Jersey, March 22, 1977.
Santamaria, Thomas -Environmental Officer, City of Perth Amboy, New Jersey, April 25, 1977.
Scarry, Donald M. -Assistant Director, Office of Economic Research, Department of Labor and Industry, State of New Jersey, January 25, 1977.
Smith, Matthew -Planner, Central Planning Division, N.Y. - N.J. Port Authority, New York City, New York, March 4, 1977.
Smolney, Nicholas -City Business Administrator, South Amboy, New Jersey, April 13, 1977.
Stewart, Mike -Property Manager, City of Pleasantville, New Jersey, May 6, 1977.

202
Thomason, James -East Coast Manager, IMCO, New Orleans, Louisiana, March 22 & 30, 1977.
Walker, Dr. H.J. -Department of Geography, Louisiana State University, Baton Rouge, Louisiana, March 28, 1977.
Walsh, Robert T. -Executive Director, Carteret Industrial Association, Carteret, New Jersey, April 18, 1977.
Willermim, Edward -Planner, Atlantic County Planning Board, Atlantic City, New Jersey, April 28, 1977.
Young, Donald C. -President, Atlantic City Airlines, Operator of Bader Field, Atlantic City, New Jersey, February 27, 1977.

203
AP:PENDlX D
FOOTNOTES
Chapter 1
1. Personal Communication with. Philip A. Clark, Coastal Zone Hanagement Coordinator, American Petroleum Institute and Ken A. Ring, Environmental Activities, Shell Oil Company, April 15, 1977.
2. "1977-78 Survey and outlook for the Marine Transportation Industry," Ocean Industry, June 1977 p. 42.
3. "Revised Third Year Coastal Zone Management Program Development Grant Application," Appendix D, The Planning Process for Land and Water Use and Geographic Areas of Particular Concern, Office of Coastal Zone Management, Division of Marine Services, Department of Environmental Protection, State of New Jersey, November 1976.
Chapter 2
1. Anthony J. Mumphrey and Frederick W. Wagner, The Impacts of Outer Continental Shelf Developmen~n Lafourche Parish, Urban Studies Institute, University of New Orleans, 1976.
2. James K. Mitchell, "Onshore Impacts of Scottish Offshore Oil: Planning Implications for the Middle Atlantic States," Journal of the American Institute of Planners, Vol. 42 No. 4, October 1976.
3. Op. cit., Anthony J. Mumphrey and Frederick W. Wagner.
Chapter 3
1. Council on Environmental Quality, Environmental Quality, 1974. Washington, D.C. 107.
2. Ranges are given in the Final EIS for Lease Sale No. 40; OTA Report 1976, and in Robert E. Mattick et al., "Second Atlantic Sale May Involve Tracts off Virginia, Maryland," Oil and Gas Journal, Nov. 22, 1976.
3. u.s. Congress, Office of Technology Assessment, Coastal Effects of Offshore Energy Systems: An Assessment of Oil and Gas Systems, Deepwater Ports, and Nuclear Powerplants Off the Coast of New Jersey and Delaware, Washington, D.C., 1976, p. 125.
4. Final EIS Lease Sale No. 40. 5. Oil and Gas Journal, March 31, 1976, p. 38. 6. Figures drawn from EPA's NPDES permits 7. Offshore Operators Committee, "Industry Input to .
BLM Proposed December 1975 Lease Sale Mid-Atlantic Region," New Orleans, Louisiana, Revised nay 1976.
8. Ibid 9. Personal Communication March 25, 1977.

204
10. Op. cit., Offshore Operators Committee. 11. ?ersonal Communication with Donald C. Young,
r.ehruary 27, l977.
Chapter 4
l. NOAA Chart No. l23l6, u.s. Dept. of Commerce, National Oceanic and Atmos.pheric Association, Washington, D.C., January l977.
2. Pers-onal Communication with_ Hill McLees, Atlantic City Department of Water, March l6, l977.
3. Data compiled for May l977 by New Jersey Department of Labor and Industry, Division of Planning and Research, Office of Labor Statistics.
4. RALI/Ractbook, pp. l32 to l38 5. Ibid p.l.38 6. Ibid p.l.38-l.40 7. Ibid p.l.41 8. Ibid p.l.40-1.4l 9. Interim Soil Survey Report, Middlesex County, New
Jersey, u.s. Department of Agriculture, Feb. 1977. lO. Interim Soil Survey, Report No. lO Middlesex
County, Rutgers University, Nov. 1953 ll. Data compiled for 1-1ay l977 by New Jersey Department
of Labor and Industry, Division of Planning and Research, Office of Labor Statistics.
l2. Coastal Area Facility Review Act, N.J.S.A. 13:l9-l et. seq. Wetlands Act of l970, N.J.S.A. 13:9A-l
l3. All municipal regulations are written as though in conformity with the New Jersey Municipal Land Use Law (N.J.S.A. 40:55D-l et. seq.). Municipalities not yet conforming to this law are functioning under an extension of time.
14. "Water Quality Management Plan Alternatives," Lower Raritan/Hiddlesex County Planning Board/ Middlesex 208 Joint Venture, August 1977, pp. I-I, I-2
15. Ibid p. III-2 16. NOAA Chart C&GS 234 - Cape May Harbor
U.S. Department of Commerce 17. Data compiled for May 1977 by New Jersey Department
of Labor and Industry, Division of Planning and Research, Office of Labor Statistics.
18. Interim Land Use and Density Guidelines for the Coastal Area of New Jersey, New Jersey Department of Environmental Protection, May 1976, Map 4
19. Cape May County Comprehensive Plan, Cape May County Planning Board 1976.
20. Ibid 21. Data compiled for May 1977 by New Jersey Department
of Labor and Industry, Division of Planning and Research, Office of Labor Statistics.
22. Ibid pp.9.24, 9.26, and 9.31 23. Ibid p.9.31

24. General Industry, U.S. Dept. of Labor, OSHA, 2206, revised, January 1976, p. 99
25. "Economic Profile of Cumberland County" First Draft, Economic Development Research, Division of Planning and Research, New Jersey Dept. of Labor and Industry, December 1975.
205
26. Personal Communications with Czleslawa Zimolzak Senior Planner, Cumberland County Planning Board, Sept. 26, 1977.
27. Data compiled for Hay 1977 by New Jersey Department of Labor and Industry, Division of Planning and Research, Office of Labor Statistics, May 1977.
28. Op. cit. "Economic Profile of Cumberland County", p. 5
29. Interim Land Use and Density Guidelines, New Jersey Dept. of Environmental Protection, May 1976, Map No. 5
Chapter 6
1. Information from Division of Environmental Quality, Bureau of Air Pollution Control, Department of Environmental Protection.
2. Personal Communication, Robert Shawn, Vice President, Economic Research Associates, Consultants to Atlantic City Planning Board on Economic Impacts of Casino Gambling.
3. Keith Chapman, North Sea Oil and Gas: A Geographical Prospective, 1976, p. 146.
4. Effects on Commercial Fishing of Petroleum Development off the Northeastern United States, Woods Hole Oceanographic Institution, 1976, p. 53.
5. James K. Mitchell, "Onshore Impacts of Scottish Offshore Oil: Planning Implications for the MidAtlantic States," Journal of the American Institute of Planners, October 1976, pp.386-398.
Chapter 7
1. "An Inventory of the New Jersey Coastal Area," New Jersey Department of Environmental Protection 1975, p.6.


APPENDIX E
BIBLIOGRAPHY
Alaska Consultants, Inc.: "Marine Service Bases for Offshore Oil Development", 1976
American Institute of Architects Regional/Urban Design Assistance Team: "Atlantic City" 1975
American Petroleum Institute:
207
Environmental Protection Laws and Regulations Related to Exploration, Drilling, Production and Gas Processing Plant Operations. Washington, D.C. March 1975
Atlantic City, City of: "Interim Zoning Map" 1977
Atlantic City, N.J. City of: "Master Plan 1961, Atlantic City, N.J.", 1961
Atlantic City, City of: "Zoning Ordinance #3, 1977", 1977
Baldwin, Pamela L. and Malcolm F.: Onshore Planning for Offshore Oil:
Lessons from Scotland Washington, D.C. The Conservation Foundation, 1975
BDM Corporation: "A Study of the New Use Demands on the Coastal Zone and Offshore Areas of New Jersey and Delaware", 1976.
Brigantine, City of: "Brigantine Master Plan", 1964.
California Coastal Zone Conservation Commissions: "California Coastal Plan", 1975.
Cape May County Board of Education: "Data Book", 1976.
Cape May County Planning Board: "An Assessment of Cape May County's Open Space Resources", 1975. "Cape May County Airport"
Master Plan of Development, 1975-1995. "Cape May County Comprehensive Plan", 1976. "Economic Impact of Tourism in New Jersey" (Draft) 1976. "The Resort Economy" 1974 update Draft.

208
Continental Oil Company, Symposium on the Economics and Logistics oi Oiisnore Oil Development: "Offshore Oil Development on the Georges Bank", Stanford, Connecticut, 1976.
Council on Environmental Quality: "OCS Oil and Gas- An Environmental Assessment", April, 1974.
Cumberland County Economic Development Commission: "Industrial Directory, 1975" "Welcome to Cumberland County - A Frontier of Opportunity"
Edison, N.J. Township of: "Edison, Dynamic Pace-setter at the Crossroads of N.J." "Zoning Ordinance" Donald A. Brobst & Walden P. Pratt (eds.), United States Mineral Resources, U.S.G.S. Professional Paper 820, Wash., D.C., 1973.
Me Cullough, T.H., "Oil and Gas", United States Mineral Resources, U.S.G.S Professional Paper 820, Wash., D.C., 1973.
McKelvey, V.E., "Mineral Resources Estimates and Public Policy", in Donald A. Brobst and Walden P. Pratt (eds.) United States Minerla Resources, U.S.G.S. Professional Paper 820, Wash., D.C., 1973.
Middlesex County, Department of Industrial and Economic Development: Industrial Directory, 1975-1963, 1975.
Middlesex County Planning Board, New Brunswick, N.J.: "Long Range Comprehensive Plan Alternative." 1974. "Lower Raritan/Middlesex County 208 Water Quality Management. Planning Program - Interim Study Projections". 1976. "Middlesex County Interim Master Plan", 1970. "Water Supply Systems, Facilities Inventory - 1975" 1976.
Mitchell, James K. "Onshore Impacts of Scottish Offshore Oil: Planning Implications for the Middle Atlantic States" Journal of the American Institute of Planners, October 1976, Vol. 42, No. 4. "Adjustment to New Physical Environments Beyond The Metropolitan Fringe", Geographical Review, 66, January 1976.
Mumphrey, A.S and Others: "The tmpacts of Outer Continental Shelf"
Development on Lafourche Parish New Orleans, Louisiana, 1976.

National Ocean Industries Association Directory; 1976 Washington D.C.
New England River Basins Commission "Estimates for New England (Onshore Facilities Related to Offshore Oil and Gas Development)", Nov. 1976. "Factbook, Onshore Facilities Related to Offshore Oil and Gas Development", Nov. 1976.
209
Ocean Industry Magazine, Gulf Publishing Co., Houston Texas: Vol. 12, No. 12,. Feb., 1977 Vol. 12, No. 3, March, 1977 Vol. 12, No. 6, June, 1977
Offshore Operators Committee: "Industry Input to BLM Proposed December 1975, Lease Sale Mid-Atlantic Region", Revised May 1976, New Orleans, Louisiana.
Oil and Gas Journal, Petroleum Publishing Co., Tulsa, Oklahoma: Vol. 75, No. 12 - March 21, 1977 Vol. 75, No. 14 April 14, 1977 Vol. 75, No. 17 April 25, 1977
Perth Amboy, City of: "Municipal Code" Article XIV, XV Chapter 389.1 and A 435
Perth Amboy, City of: "Zoning Ordinance" Chapter 430 of the Code of the City of Perth Amboy Dec. 5, 1977
Port Authority of New York and New Jersey: "Undeveloped Land Adjacent to Deep Water in the Port of New York", 1975. "Support Barges for Offshore Drilling: The Port of New York Potential", 1977
Rutgers University, Center for Coastal and Environmental Studies: "Coastal zone Legislation", Sept.l976. "Oil Spills Reaction and Responsibility in New Jersey Jan. 1977. "State Government and Coastal Zone Management Jan. 1977
Rutgers University, College of Engineering, New Brunswick, N.J. : "Engineering Soil Survey" Report #5, Union County, September, 1952 Report #10, Middlesex County, November, 1953 Report #17, Camden County, February, 1955 Report #22, Practical Applications, 1957 Report #8, Ocean County, 1953 Report #19, Monmouth County, 1955 Report #18, Atlantic County, 1955

210
Rutgers University, College o:e Engineering, New Brunswick, N • J . : (con t . } Report #21, Cumberland County, 1955
Scottish. Development Department: "North Sea Oil and Gas:: Coastal planning Guidelines·'·' 1974.
State of Connecticut, Department of Environmental Protection Coastal Area Management Program "Developers Handbook", 1972
State of Delaware Planning Office, Middle Atlantic Governor's Coastal Resources Council: "l~dentification and Analysis of Mid-Atlantic Onshore ocs- ltnpacts", 1976.
State of New Jersey: "Municipal Land Use Law" N.J.S.A. 40:55 D-l et seq.
State of New Jersey: "Riparian Law" N.J.S.A. l2:3-l et seq.
State of New Jersey, Department of Community Affairs: "A Guide for Residential Design Review", Sep.l976. "A Statewide Housing Allocation Plan for N.J." Nov. 1976. "Site Plan Review and Approval", Feb., l975.
State of New Jersey, Department of Environmental Protection: Bureau of Air Pollution Control
"Air- D 14 & 13", Nov. 1970
Bureau of Solid Waste Administration "Rules of the Bureau of Solid Waste Ma~agement" July 1974.
Division of Marine Services Office of Coastal Zone Management
"An Economic Profile of Atlantic County", Dec. 1975. "Alternatives for the Coast" October 1976. "An Economic Profile of Camden County", June 1976. "An Economic Profile of Cape May County", Dec. 1975. "An Economic Profile of Cumberland County", Dec. 1975. "An Economic Profile of Middlesex County", Nov. 1976. "An Economic Profile of Ocean County", Dec. 1975. "Agriculture and the Coast: A Staff Working Paper",
Sept. 1976. "Cultural Resources", Nov. 1976. "Economic Issues and Problems in the Northeastern
Region of the N.J. Coastal Zone", May, 1976. "Economic Problems Peculiar to the South Jersey . Coastal Zone", April, 1976.
"Estuarine and Wetland Resources", Jan. 1977. "Flooding", Dec. 1976. "Groundwater Quantity and Quality in the New Jersey
Coas-tal Zone", Nov. 1976.

"Guiding the Coast Area of N.J.: The Basis and Background for Interim Land Use and Density Guidelines", 1976.
"Interim Land Use and Density Guidelines for the Coastal Area of New Jersey", May, 1976.
"Ocean Resources: Living", Jan 1977. "Ocean Resources: Mineral", Nov. 1976. "Ocean Resources: Physical", Nov. 1976.
211
"Rules and Regulations Under Coastal Area Facility Review Act", April, 1977.
"Land Movement and the Shoreline", Nov. 1976. "Surface and Coastal Water Resources of New Jersey
Parts I and II", Jan. 1977. "Call for Information:" on Coastal Energy Facility
Siting: An Analysis of Responses", March, 1977. "Upland Living Resources: Endangered and Rare
Vegetation", October, 1976. "Upland Living Resources: Endangered, Threatened,
and Wildlife", October, 1976. "Upland Mineral Resources and the Coast", Jan. 1977. "Upland Wildlife Habitats: Upland Living Resources"
Nov., 1976.
Office of Riparian Management "Rules Applicable for Permit Applications".
Office of Wetlands Management "Procedural Rules and Regulations to Implement the
Wetlands Order". "Wetland Maps of New Jersey", Scale 1:2400
Division of Water Rsources "Surrunar}r of Permits and Certifications", Jan., 1977.
State of New Jersey, Department of Health: "Descriptive Health Overview of Area V" "Hospital Long-Range Planning Data Base Supplemental
Guide to Planning Guide for Hospital Long-Range Plans", March 1976.
"New Jersey Health Statistics", 1975.
State of New Jersey, Department of Labor and Industry Bureau of Engineering and safetv
"Explosives", January 1962. "
State of New Jersey, Department of Transportation: "N.J. Airport Directory", 1974-1975. "N.J. Highway Defense Requirements Bridge Records 1'1 ,
Dec. 1975. "Highway Permits Information Booklet" Aug. 1976. "Regulations" Control of Access Driveway", Jan. 1968. "Straight Line Diagrams", 1975.
State of New Jersey, Soil Conservation Committee: "Standards for Soil Erosion and Sediment Control in
N.J." July, 1976.

212
State of New Jersey, Uniform Construction Code: "N.J.A.C. 5:23-1 et seq"
State of New York, Department of Environmental Conservation: "Support Bases for Offshore Drilling The;Port of N.Y.
Potential", 1977.
United Kingdom, Department of Energy~ Development of the Oil and Gas Resources of The United
Kingdom, London, 1976.
u.s. Congress, Office of Technology Assessment: "Coastal Effects of Offshore Energy Systems Deepwater
Ports and Nuclear Powerplants Off the Coast of N.J. and Delaware". November, 1976.
U.S. Department of Agriculture, Soil Conservation Service: "Interim Soil Survey Report, Atlantic County, N.J."
June, 1975. "Interim Soil Survey Report, Camden County, N.J.",
April 1966. "Interim Soil Survey Report, Cape May County, N.J."
Oct. 1973. "Interim Soil Survey Report, Cumberland County, N.J.",
October, 1974. "Interim Soil Survey Report, Middlesex County, N.J.",
Feb. 1977. "Interim Soil Survey Report, Ocean County, N.J.", July
1976.
U.S. Department of Interior Bureau of Land Management
"A Socioeconomic and Environmental Inventory of the North Atlantic Region", November, 1974.
"Draft Environmental Statement for Proposed Outer Continental Shelf Mid-Atlantic Oil and Gas Lease Sale (#40)", December, 1975.
"Final Environmental Statement, OCS Sale No. 40", 1976. Geological Survey
New Jersey 7.5 Minute Arthur Kill Atlantic City Camden Cape May Oceanville
Series (Topographic) Perth Amboy Philadelphia Pleasantville South Amboy Wildwood
U.S. Department of Labor and Industry: Occupational Safety and Health Administration
"All About OSHA", April 1976. "General Industry", Jan. 1976.
u.s. Department of the Army, Corps of Engineers: "Applications for Department of the Army Permits for
Activities in Waterways", EP 1145-2-1, Oct. 1, 1974. "Project and Index Map: Rivers and Harbors, Phila
delphia District", September, 1976. "Project Maps River and Harbor, N.Y. District", June
1975.

U.S. Coast Guard: "Navigation Rules, International and Inland", CG 169,
May 1, 1977
U.S. Department of Commerce, National Oceanic and Atmospheric Administration, Nautical Charts:
Harbor Charts No. 375 - Raritan R. - Raritan B. to New Brunswick No. 286 - Raritan Bay and Southern Arthur Kill No. 544 - Sandy Hook Bay No. 280 - Phil. and Camden Waterfronts
Intracoastal Waterways No. 824-SC - Sandy Hook to Little Egg Harbor No. 826-SC - Little Egg Harbor to Cape May No. 795 - Shark, Manasquan Rs. and Bay Head Harbor
Coast Charts No. 1216 - Sea Girt to Little Egg Inlet No. 1217 - Little Egg Inlet to Hereford Inlet No. 1218 - Delaware Bay No. 1219 - Cape May to Fenwick I. Light
u.s. Environmental Protection Agency: "Federal Register; Ocean Dumping", June, 1976. "Toward Cleaner Water", Jan. 1974.
213
"National Pollutant Discharge Elimination System: Application for Permit to Discharge Wastewater", July, 1973.
u.s. Environmental Protection Agency: Office of Water and Hazardous Materials
"Ocean Dumping in the U.S. - 1976", June, 1976.
University of Delaware, College of Marine Studies, Bureau of Land Management:
"A Study of the Socioeconomic Factors Relating to the Outer Continental Shelf of the Mid-Atlantic Coast", 1975.
University of Delaware, Sea Grant Program, Marine Advisory Services: "Decisions for Delaware; Sea Grant Looks at OCS
Development", 1975.
University of New Orleans, Urban Studies Institute: "The Impacts of Outer Continental Shelf Development
on Lafourche Parish", 1976.
University of Texas, Petroleum Extension Service: A Primer of Offshore Operations", 1st Ed., 1976.
Urban Pathfinders' Inc.: "Brown and Root Impact Study", Maryland, 1975. "Northampton Background Study", Maryland, 1975.
Woodward - Clyde Consultants: "Mid-Atlantic Regional Study - An Assessment of the On
shore Effects of Offshore Oil and Gas Development", 1975.

214
Woodbridge, N.J., Township of: "Woodbridge Township Zoning Ordinance of 1960", 1975.
Work Boat Magazine, Peace Publications, Louisiana: Vol. 34, No. 5, May; 1977.

APPENDIX F
PROJECT DE$CRlPTIQN OF NAVlGATl.QN CHANNELS; U.S. Aro1Y CORPS OF ENGINEERS
Map 3 ABSECON INLET, NEW JERSEY
Condition of Improvement 30 September l976
PROJECT: The existing project, adopted in 1922 and modified in 1946, provides for· an entrance channel 20 feet deep in
215
the Atlantic Ocean and through the inlet, and for an entrance channel 15 feet deep into Clam Creek, with a turning basin of like depth within Clam Creek. The project length is about 1-1/2 miles.
PROGRESS:
NEW WORK: The existing project was completed in 1957 at a cost of $307,712.
MAINTENANCE: Dredging by U.S. Hopper Dredge DAVISON commenced 28 May 1976 and was completed 29 June 1976. Removed a total of 83,470 cubic yards of material at a cost of $246,493.
CONTROLLING DEPTHS:
Date Section
June 76 Inlet Entrance Channel
June 76 Clam Creek Channel and Turning Basin
Project Depth
(Feet)
20
15
Minimum Left
Outside Quarter (Feet)
15.5
7.8
Depths {Local M ... L ... ~'Y ... ) Midchannel Right
for Half Outside Proj Width Quarter
(Feet) (Feet)
18.1 17~0
3.5 4.0
RANGE OF TIDE: In inlet gorge, 3.6 feet; and in the ocean, 4.0 feet.
PROPOSED OPERATIONS FY 1977: Dredging by U.S. hopper dredge.
NATIONAL ENVIRONMENTAL POLICY ACT OF 1969: Draft Environmental Impact Statement was forwarded to CEQ on 14 April 1972. Final Environmental Impact Statement submitted 4th Quarter, FY 1975.

2_1.6
Map 7 RARITAN RIVER, N.J.
EXISTING PROJECT (ftdopted 1919, modified 1930, 1937 and l940 provides for:
A main channel, 25 ft. deep, 300 ft. wide, from the turn in N.Y. and N.J. Channels, near Great Beds Light to the Raritan Arsenal Wharf; thence 15 ft. deep, 200 ft. wide, to the Washington Canal; thence 10 ft. deep in soft material and 11 ft. deep in rock, and generally 100 ft. wide, with widening at bends, to the Delaware and Raritan Canal entrance at New Brunswick. Length - about 13.8 miles.
A turning basin opposite Raritan Arsenal Wharf, 25 ft. deep, 300 ft. wide and 1,000 ft. long.
A south channel 25 ft. deep, 300 ft. wide, from its junction with the main channel opposite Keasbey to the upper limit of the Titanium Pigment Co. property; 15 ft. deep, 150 ft. wide to the Middlesex County Sewerage Authority Dock; thence 10 ft. deep and 150 ft. wide to the junction with the Main Channel at Crab Island.
Local cooperation.
PROGRESS: The project is about 96% complete. The work remaining to be done is the dredging of the South Channel to a depth_ of 10 ft. and 150 ft. wide for a length of 1,300 ft. to the upper junction with the main channel at Crab Island.
TIDAL DATA:
Mean Tidal Range Mean Range of Spring Tides Extreme High Tide
Extreme Low Tide
(Means based on
Mean Tidal Range Mean Range of Spring Tides Extreme High Tide Extreme Low Tide
At Perth Amboy At New Brunswick
5.1 ft. 6.1 ft.
fl2. 0 ft. (MLW) 9/12/60
- 3 • 6 f t . ( ML~\1) 3/27/55
21 years 1938-1958)
At Sayreville
5.2 ft. 6.2 ft.
5.6 ft. 6.6 ft.
+12.3 ft.(t-1LW) 9/12/60
- 3 . 5 ft. ( MLW) *
2 Years 1947-1949)
+11.8 ft. (MLW) 9/12/60 - 3. 6 ft. (ML~v) *
(Means based on 2 years 1947-1949)
* Estimated

Map 8 NEW YORK AND NEW JER.SEY CHANNELS
EXISTl.NG PROJECT (_adopted 1933, modi:eied ~9-35, 195Q_ and 19651 profices for:
217
A channel 37 ft. deep, in rock and 35 ft. deep in soft material, 500 ft. wide through Lower New York Bay, Raritan Bay and Arthur Kill to a point 1,000 ft. north o~ Smith Creek, except in the vicinities of Seguine ~oint and Ward ~oint where the width is to be 800ft.; thence 500ft. wide, to a point 1,000 ft. south of the former location of Buckwheat Island; thence 500 to 600 ft. wide passing north of Shooters Island and protected by a dike on its northern side to the junction of the channel into Newark Bay; thence 800 ft. wide through Kill Van Kull to Constable Hook; thence 1,000 ft. wide from a point opposite the east end of Constable Hook to a point near the intersection along the New Jersey Pierhead line and thence 1,400 ft. wide through Kill van Kull to Upper New York Bay with suitable easing of the bends and junctions, Length - about 31.0 miles.
Two anchorages 38 ft. deep to accommodate 5 vessels each, one in the vicinity of Sandy Hook and the other south of Perth Amboy.
Two secondary channels 30 ft. deep and 400 ft. wide, one south_ of Shooters Island and the other in Raritan Bay connecting with. Raritan River, have been completed under previous projects and are maintained under the project.
Local cooperation.
PROGRESS: The project is about 98% complete. The channels and widening of a bend at the Baltimore and Ohio Eridge included in the project have been completed to full project dimensions except for widening of the junction with Main Ship Channel to a depth of 30 ft. Perth Amboy anchorage was dredged to depths of 37 and 25 ft. deep and 1,800 ft. wide in lieu of 38 fc. deep and 1,600 fc. wide. No work has been done in the anchorage in vicinity of Sandy Hook.
TIDAL DATA:
Mean Tidal Range Mean Range of Spring Tides Extreme High Tide
Extreme Low Tide
(_Means based on
At Fort Hamilton At Perth Amboy
4.7 ft. 5.7 ft.
+10. 9 ft. (MLW) 11/7/53
- 3.9 ft. (MLW) 1/26/38
56 years 1905-1960
5.1 ft. 6.1 ft.
+12.0 ft. (MLW) 9/12/60
- 3.6 ft. (MLW) 3/27/55
21 years 1938-1958)

218
TIDAL DATA: At rort Hamilton At Elm Park (Staten Is.)
Mean Tidal Range 5.2 ft. Mean Range of Spring Tides 6.3 ft. Extreme High_ Tide +11. 3 ft. (HLW}
Extreme Low Tide
(Means based on
9/12/60 - 3. 4 ft. CMLWl
3/19/40
39 months (1940 and 1954)
4.9 ft. 5.9 ft.
+10. 9 ft. (MLW) 9/l2/60
- 3. 5 ft. CHLW) 12/8/39
24 years 1938-1961)

Map 9 RARITAN RIVER TO ARTHUR KILL CUT-OFF CHANNEL, N.J.
EXISTING PROJECT (adopted 1935) provides for:
A channel, 20 ft. deep, 800 ft. wide, to connect the Raritan River Channel with the southern end of the Arthur Kill Channel, New York and New Jersey Channels project. Length - about 1 mile.
PROGRESS: The project is completed.
COST OF CONSTRUCTION: $810,500.
TIDAL DATA: At Perth Amboy
Mean Tidal Range 5.1 ft. Mean Range ofSpring Tides 6.1 ft. Extreme High Tide f12.0 ft. (MLW) 9/12/60 Extreme Low Tide - 3.6 ft. (MLW)_ 3/27/55
(Means based on 21 years 1938-1958)
219

'220
Map 13 COLD SPRING INLET~ NEW JERSEY
Condition of Improvement 30 September lg76
PROJECT: The existing project adopted in 1907 and modified in 1945, provides for an entrance channel 25 feet deep, protected by two parallel jetties, the channel extending from the 25-foot depth contour in Atlantic Ocean to a line 500 feet harborward of a line joining the landward ends of the jetties; and a channel 20 feet deep from the entrance channel to deep water in Cape Hay Harbor. The project length is about 2-1/4 miles.
PROGRESS:
NEW WORK: The project was completed in 1942 as an emergency measure prior to formal authorization at a cost of $879,275, exclusive of $50,000 Department of the Navy funds and $100,000 contributed funds.
REHABILITATION (}1AJOR}: Contract for restoration of jetties, was completed 5 November 1965. Contract costs were $1,027,200. Total costs for rehabilitation were $1,134,346.
MAINTENANCE: None.
Minimum Depths (local M.L.W.) Left Midchannel Right
Project Outside for Half Outside Date Section Depth Quarter Project Width Quarter
(Feet) (Feet) (Feet) (Feet)
May 75 Between 25 18.5 18.5 17.9 Jetties
Apr 75 Inner End 20 20.9 24.1 23.3 of Jetties to Cape
May 75 Thence to 20 12.0 14.3 11.3 Coast Guard Wharves
RANGE OF TIDE: At landward end of west jetty, 4.3 feet.
PROPOSED OPERATIONS FY 1977:
MAINTENANCE: Dredging by U.S. Hopper Dredge.
NATIONAL ENVIRONMENTAL POLICY ACT OF 1969: Draft Environmental Impact Statement was forwarded to CEQ on 15 March 1972. Final Environmental Impact Statement submitted in 4th_ Quarter, FY 1974.

Map 17
DELAWARE RIVER AT CA}1DEN, NEW JERSEY
Condition of Improvement 30 September l976
PROJECT: The existing project was adopted in 1919 and modified in 1930 and 1945. It provides for dredging a channel with depths of 37 feet, 30 feet, and 18 feet from Cooper Point to Newton Creek at Camden, N.J. The project length is about four miles.
PROGRESS:
NEW WORK: Dredging the channel to 18 feet from Cooper Point to Kaighn Point and the 30-foot channel from Kaighn Point to Newton Creek was completed in 1924. The extension of the 30-foot channel, Kaighn Point to Camden Marine Terminal at Berkely Street, was completed in 1931. The work remaining to be done is dredging to project depth of 37 deet in front of the Camden Marine Terminal, ehich has been deferred for restudy. The costs of the completed portion of the channel were $462,906 for new work, exclusive of $15,000 contributed funds and costs for previous projects.
MAINTENANCE: None
CONTROLLING DEPTH: As of August 1973 the controlling depth at local mean low water was 19.3 feet at the northerly end near Cooper Point Project depths are well maintained in the 30-foot depth section of the channel.
RANGE OF TIDE: Over the project area, six feet.
PROPOSED OPERATIONS FY 1977: None
NATIONAL ENVIRONMENTAL PLOICY ACT OF 1969: An Environmental Impact Assessment has been circulated for comment.
221

222
Map 18 MAURICE RIVER, NEW JERSEY
Condition of Improvement 30 June 1972
PROJECT: The existing project, adopted in 1910 and modified in 1935, provides for a channel with dimensions and liroi ts. as shown, and for a turning basin 7 feet deep at Milville. The length of the project is about 24 miles.
PROGRESS:
NEW WORK: The project has- been completed except for the entrance channel and a small section at the upstream end of the project. The cost of the completed portion of the existing project is $100,984. Work remaining to be done is the deepening of the entrance channel from 7 feet to 8 feet, and the dredging of a channel 7 feet deep, 60 feet wide and 650 feet long in the upper end of the project; this work is inactive.
MAINTENANCE: Dredging was last accomplished in Fy 1941 when 11,762 cubic yards of material were removed at a cost of $0.73 per cubic yard.
CONTROLLING DEPTH: As of June 1971, the controlling depth at local mean low water was 5.0 feet in the entrance channel; in May 1967, 8.0 feet to Buckshutem Creek; 6.2 feet to a point 700 feet downstream from the mill dam; and 2.8 feet to the mill dam.
RANGE OF TIDE: At the mouth 5.7 feet; and at Millville, 6.0 feet.

Map 19 MANASQUAN RlVER, NEW JERSEY
Condition of Improveme~1t 30 September l976
PROJECT: The exis-ting project, adopted and modified in 1935 and 1945, provides for a channel 14 feet deep and 250 feet wide from Atlantic Ocean to the inner end of the north jetty; 12 feet deep and ranging from 100 feet to 300 feet wide to within 300 feet of the·New York and Long Branch Railroad bridge; a widening on the north side of the channel 8 feet deep and another 12 feet deep; and jetties protecting the inlet channel. The project length is about 1.5 miles.
PROGRESS:
223
NEW WORK: The existing project, except for miscellaneous rock removal from the channel in a small area near the end of the north jetty, was completed in June 1961; rock removal was completed in June 1963. Dredging of the two anchorages is in the inactive category. The cost of the existing project to date was $518,249, exclusive of $300,000 contributed funds, $39,000 for work on previous projects, and $555,600 for rehabilitation.
~~INTENANCE: Dredging by Government plant (Dredge DAVISON) was last conducted from 16 - 27 May 1976. A total of 33,500 cubic yards of material was removed at a cost of $95,653.
CONTROLLING DEPTHS: As of June 1976 the controlling depth at local mean low water from Atlantic Ocean to the inner end of the north jetty was 9.8 feet; and 7.8 feet to within 300 feet east of the railroad bridge.
RANGE OF TIDE: At the inlet, 3.9 feet; at highway bridge (Route 35), 3.4 feet.
PROPOSED OPERATION FY 1977: None.
NATIONAL ENVIRONMENTAL POLICY ACT OF 1969: Final Environmental Impact Statement completed 4 Quarter, FY 1975.


APPENDIX G
PERMIT HANDBOOK
A draft copy of a permit handbook was submitted to OCZM/DEP on September 1, 1977. Its exact title and table of contents are shown below:
The State of New Jersey Onshore Support Base Facilities
for OCS Oil and Gas Development
A Permit Handbook
Table of Contents
Introduction 1. Geographic Scope 2. Onshore Support Bases 3. The Environmental Impact Statement 4. The Site Plan 5. The "90 Day Law" and the Pre-application Conference 6. Energy Related Legislation 7. Hypothetical Onshore Support Base: Regulatory Procedures 8. Federal Regulatory Agencies 9. Interstate Regulatory Agencies 10. The State of New Jersey - Regulatory Agencies 11. County Government - A Regulatory Agency 12. Municipal Government - A Regulatory Agency Footnotes Bibliography
225


Licensed Patient Patient Service Beds Admissions Days
Total 30,781 1,015,011 8,831,687 M/S 22,049 681,657 6,776,078
State OB 555 28,479 121,992 of OB/GYN 1,761 97,912 384,426
New Jersey B.ED 2,590 108,626 489,742 Summary ICU 279 10,689 80,410
ICU 12 In M/S 1,987 ccu 253 13,232 74,076 ccu 12 In .r-1/S 1,837 ICU-CCU 920 43,815 247,884 ICU-CCU 62 In r-1/S 15,520 Self Care 98 5,349 19,637 Long Term 772 2,853 245,610 Psych 1,119 18,444 308,206 Rehab 78 479 18,836 Rehab COr tho} 177 3,402 40,870 T .B. 29 50 1,308 Contagion 15 24 3,718
Source: "Facility Complement and Patient Data, Yearly Sunnnary, 1976," Division of Health Planning and Resources Development, New Jersey Dept. of Health, May
Annual 1976
% of Occupancy
78.4 84.0 60.1 59.6 51.7 78.7 45.2 80.0 41.8 73.6 68.4 54.7 86.9 75.3 66.0 63.1 12.3 67.7
1977.
A. L.
8.7 9.9 4.3 3.9 4.5 7.5
5.6
5.7
3.7 86.1 16.7 39.3 12.0 26.2
154.9
s. ::r: 0 (J)
1-0 H 1-3 ~ t"i
c::: 1-3 H t"i H ~
~ 1-3 H 0 z ~ tzj 1-0 0 !::0 1-3
1\.) 1\.) ......:]
~ 1-0 1-0 tzj z 0 H ::< ::r:

Cape May Summary - 1976
LICENSED SERVICE BEDS
TOTAL 165 M/S 145 OB 10 PED 10
GENERAL HOSPITALS
PATIENT PATIENT ADMISSIONS DAYS
6,704 51,746 5,324 46,746
670 2,442 710 2,558
% OF OCCUPANCY
85.7 87.6 66.7 69.9
A.L.S.
7.7 8.7 3.6 3.6
1\) 1\) (X)

Atlantic county Summary .... l9-76
LICENSED SERVICE BEDS
TOTAL 876 M/S 665 OB/GYN 68 PED 81 ICU 12 ccu 14 ICU-CCU 36
GENERAL HOSPITALS
PATIENT PATIENT ADMISSIONS DAYS
32,895 263,376 22,749 214,492
3,767 14,397 4,306 18,767
561 2,513 345 1, 984·
1,167 11,223
% OF OCCUPANCY
82.1 88.1 57.8 63.3 57.2 38.7 85.2
A.L.S.
8.0 9.4 3.8 4.4 4.5 5.8 9.6
N N \0

GENERAL HOSPI~L ocean County Summary - 1976
LICENSED PATIENT . PATIENT % OF SERVICE BEDS ADMISSIONS DAYS OCCUPANCY A.L.S.
TOTAL 814 31,900 286,019 96.0 9.0 M/S 638 20,782 238,240 102.0 11.5 OB 18 1,276 4, 784 72.6 3.7 OB/GYN 48 3,246 11,476 65.3 3.5 PED 54 2,660 12,819 64.9 4.8 ICU 5 532 1,563 85.4 2.9 ccu 30 1,770 -10,281 93.6 5.8 ICU-CCU 21 1,634 6,856 89.2 4.2

Monmouth County Summary - 1976
SERVICE
TOTAL M/S OB/GYN PED ICU ccu ICU-CCU LONG TERM PSYCH
LICENSED BEDs
1,739 1,309
118 127
5 4
67 13 96
GENERAL HOSPITAL
PATIENT ADMISSIONS
61,733 40,318
7,602 7,489
280 300
3,717 111
1,916
PATIENT DAYS
540,018 427,680
30,736 28,493
1,570 ~,268
18,904 4,454
26,913
OCCUPANCY A.L.S.
84.8 8.7 89.3 10.6 71.2 4.0 61.3 3.8 85.8 5.6 86.6 4.2 77.1 5.1 93.6 40.1 76.6 14.0

GENERAL HOSPITALS
Middlesex County Summary ~ 1976
LICENSED PATIENT PATIENT %OF SERVICE BEDS ADMISSIONS DAYS OCCUPANCY A.L.S.
TOTAL 1,889 64,560 517,228 74.8 8.0
MIS 1,328 41,192 399,738 82.2 9.7 OB 20 407 1,491 20.4 3.7 OB/GYN 175 9,935 39,908 62.3 4.0 PED 155 6,734 28,954 51.0 4.3 ICU 15 784 3,957 72.1 5.0 ccu 4 187 1,244 85.0 6.7 ICU-CCU 70 3,583 19,006 74.2 5.3 LONG TERM 32 PSYCH 42 1,362 9,803 63.8 7.2
REHAB 48 376 13,127 74.7 34.9

GENERAL HOSPITALS
Camden County Summary - 1976
LICENSED PATIENT PATIENT % OF SERVICE BEDS ADMISSIONS DAYS OCCUPANCY A.L.S.
TOTAL 1,980 64,408 619,609 85.5 9.6 M/S 1,455 41,050 492,390 92.5 12.0 OB 18 1,396 5,547 84.2 4.0 OB/GYN 132 8,561 32,359 67.0 3.8 PED 162 6,640 30,550 51.5 4.6 ICU 50 1,601 17,855 97.6 11.2 ccu 38 1,878 13,993 100.6 7.5 ICU-CCU 29 1,677 5,086 47.9 3.0 Self care 24 708 4,192 47.7 5.9 PSYCH 42 794 12,378 80.5 15.6 REHAB 30 103 5,259 47.9 51.1

GENERAL HOSPITALS
CUmberland County Summary - 1976
LICENSED PATIENT PATIENT % OF SERVICE BEDS ADMISSIONS , DAYS OCCUPANCY A.L.S.
TOTAL 548 21,734 168,986 84.3 7.8 M/S 419 15,398 138,077 90.0 9.0 OB 18 854 3,650 55.4 4.3 OB/GYN 29 1,683 5,820 54.8 3.5 PED 56 2,527 14,890 72.6 5.9 ICU-CCU 26 1,272 6,549 68.8 5.1