Embed Size (px)
Citation preview
On the Roles of Membrane Channels in Plant Mineral Nutrition and Toxicity
by
Devrim Coskun
A thesis submitted in conformity with the requirements for the degree of Doctor of Philosophy
Cell & Systems Biology University of Toronto
© Copyright by Devrim Coskun (2016)
ii
On the Roles of Membrane Channels in Plant Mineral Nutrition
and Toxicity
Devrim Coskun
Doctor of Philosophy
Cell & Systems Biology
University of Toronto
2016
Abstract
The study of plant mineral nutrition and toxicity has made major strides recently, particularly at
the level of molecular genetics. Arguably, however, this has been at the expense of “classical”
physiology, which is of concern because critical physiological examinations of cellular and
molecular models in planta are needed if extrapolations of these models to “real-world” (field-
level) conditions are to be made. This is particularly urgent in the face of increasing
environmental degradation and global food demands. To this end, the preset work explores the
physiological role of membrane channels in higher-plant nutrition and toxicology, building upon
foundational work in nutritional physiology and applying the important new discoveries in the
areas of molecular-genetics and electrophysiology. Combining radioisotopic (42K+ and
13NH3/13NH4
+) flux kinetics and compartmentation analyses with techniques in
electrophysiology, mutant analysis, gas exchange, fluorescence imaging and tracing, and tissue
mineral-content analysis, this work investigates the involvement of inward- and outward-
rectifying Shaker-like K+ channels (KIR and KOR, respectively), nonselective cation channels
(NSCCs), and aquaporins (AQPs), in K+ and NH3/NH4+ transport under conditions of both stress
(low K+, salinity, and ammonium toxicity) and non-stress, in the intact plant. Efflux analyses
showed that KOR channels mediate K+ efflux in barley roots only at low external [K+] (<1 mM),
iii
above which transmembrane efflux ceased altogether, and demonstrated their lack of
involvement in Na+-induced K+ efflux in rice roots, an important salinity-stress response. Influx
analyses elucidated the involvement of KIR channels in high- and low-affinity K+ uptake in
barley and Arabidopsis roots, demonstrating dramatic capacity and plasticity, as well as their
relevance to salinity stress. By contrast, no evidence of NSCC activity was found under similar
conditions. Lastly, rapid transmembrane cycling of NH3, likely mediated by AQPs, was
demonstrated to underlie ammonium toxicity in barley roots, fundamentally revising the
mechanistic model of low-affinity NH3/NH4+ transport.

iv
Dedication
In loving memory of my father,
Müfit Coşkun

v
Acknowledgments
First and foremost, I would like to express my sincere gratitude to my mentor Prof. Herbert J.
Kronzucker. I thank him for opening my eyes to the wonderful world of plant biology, for
helping me find the “Ph” (in Ph.D.), and for his continual encouragement, guidance, and
commitment throughout my academic development and beyond. His encyclopedic knowledge,
scientific brilliance, and humanity, are a constant source of inspiration. I would also like to
dedicate this thesis to him on the occasion of his 50th birthday.
Many are not as fortunate as I am to say they have a wonderful teacher, let alone two (!), and so I
wish to also thank my (unofficial) supervisor Dr. Dev T. Britto, whom I have the utmost
appreciation and respect for. Dr. Britto’s intelligence, wisdom, and humour, are also truly
inspirational.
My gratitude further extends to the members of my supervisory committee (past and present),
Profs. Malcom Campbell, Andrew Mason, and Greg Vanlerberghe, for their advice and patience
throughout committee meetings. The seemingly endless number of radiotracer experiments could
not have happened without the teams at the McMaster Nuclear Reactor and CAMH Cyclotron. I
also thank the inspirational scientists that I’ve had the honour to meet, learn from, and even
collaborate with: Profs. Leon Kochian, Hans Lambers, Norman Hüner, and Tony Glass; our
encounters, brief as they may have been, have left a lasting mark.
Many thanks also to my labmates (past and present): Drs. M. Szczerba and L. Schulze, for
introducing me to graduate life and teaching me many valuable lessons; W. Huynh, for his
kindness and dedication; D. Balkos, A. Becker, A. Hamam, and R. Flam-Shepherd, for the good
company; and K. Poon, E. Oh, I. Kabir, K. Jean, M. Li, I. Tolay, A. Torun, S. Gunaseelan, A.
Sidiqi, and A. Zaheer, for all the help and collaboration.
I wish to also thank my close friends for the support and good times along the way, Sasha (who
encouraged me to join the Kronzucker lab as a lowly undergrad!), Reza, Kevin S. & Maddie,
Kyle, Kenway, Kevin H., Calvin & Rosie, and Pat.
Lastly, I thank my family for their continuous love and support throughout this crazy endeavour
and beyond. I am especially grateful to my wife, Sahara (whom I met in the Kronzucker lab and
share the record with for the most CATE runs in one day!), for her love, encouragement, and

vi
understanding. I am extremely fortunate to share with her all of life’s highs and lows, as well as
this passion called “Scienceee” (Esqueleto).
vii
Table of Contents
Abstract ........................................................................................................................................... ii
Dedication ...................................................................................................................................... iv
Acknowledgments............................................................................................................................v
Table of Contents .......................................................................................................................... vii
List of Tables ...................................................................................................................................x
List of Figures ................................................................................................................................ xi
List of Abbreviations ................................................................................................................... xiv
Chapter 1 General Introduction .......................................................................................................1
Chapter 2 Materials and Methods ....................................................................................................8
Plant Growth ........................................................................................................................8
Radiotracer Analyses ...........................................................................................................9
2.2.1 Radioisotopes ...........................................................................................................9
2.2.2 Direct Influx (DI) ...................................................................................................10
2.2.3 Compartmental Analysis by Tracer Efflux (CATE) ..............................................11
2.2.4 Pharmacological Treatments ..................................................................................12
Electrophysiology ..............................................................................................................14
Tissue-Content Analyses ...................................................................................................14
2.4.1 Flame Photometry ..................................................................................................14
2.4.2 OPA Assay .............................................................................................................15
Root Respiration ................................................................................................................15
Confocal Microscopy .........................................................................................................16
Membrane-Stability Assays ...............................................................................................16
2.7.1 Electrical Conductivity ..........................................................................................16
2.7.2 UV-Absorbance Spectrophotometry ......................................................................17
Ag+-Induced K+-Release Quantification ............................................................................17
viii
Root Water Potential, ΨR ..................................................................................................17
PTS Efflux .........................................................................................................................18
Chapter 3 K+ Efflux in Roots of Higher Plants: Mechanisms and Connections to Abiotic
Stress .........................................................................................................................................19
Regulation and Mechanism of Potassium Release from Barley Roots: An in planta 42K Analysis .......................................................................................................................19
3.1.1 Abstract ..................................................................................................................19
3.1.2 Introduction ............................................................................................................20
3.1.3 Results ....................................................................................................................22
3.1.4 Discussion ..............................................................................................................32
K+ Efflux and Retention in Response to NaCl Stress do not Predict Salt Tolerance in
Contrasting Genotypes of Rice (Oryza sativa L.) ..............................................................38
3.2.1 Abstract ..................................................................................................................38
3.2.2 Introduction ............................................................................................................39
3.2.3 Results ....................................................................................................................41
3.2.4 Discussion ..............................................................................................................58
Chapter 4 K+ Influx in Roots of Higher Plants: Mechanisms and Connections to Abiotic
Stress .........................................................................................................................................61
Capacity and Plasticity of K+ Channels and High-Affinity Transporters in Roots of
Barley (Hordeum vulgare L.) and Arabidopsis thaliana L................................................61
4.1.1 Abstract ..................................................................................................................61
4.1.2 Introduction ............................................................................................................62
4.1.3 Results ....................................................................................................................65
4.1.4 Discussion ..............................................................................................................86
Complexity of Potassium Acquisition: How Much Flows Through Channels? ................94
4.2.1 Abstract ..................................................................................................................94
4.2.2 Main text ................................................................................................................95
How High Do Ion Fluxes Go? A Re-Evaluation of the Two-Mechanism Model of K+
Transport in Plant Roots ..................................................................................................102
ix
4.3.1 Abstract ................................................................................................................102
4.3.2 Introduction ..........................................................................................................103
4.3.3 Results ..................................................................................................................107
4.3.4 Discussion ............................................................................................................115
Chapter 5 A Cautionary Tale Regarding the Use of Pharmacological Agents ............................123
Silver Ions Disrupt K+ Homeostasis and Cellular Integrity in Barley (Hordeum
vulgare L.) Roots .............................................................................................................123
5.1.1 Abstract ................................................................................................................123
5.1.2 Introduction ..........................................................................................................124
5.1.3 Results ..................................................................................................................126
5.1.4 Discussion ............................................................................................................138
Chapter 6 NH3/NH4+ Transport and Toxicity: Mechanisms and Updates on the Futile-Cycling
Hypothesis ...............................................................................................................................143
Rapid Ammonia Gas Transport Accounts for Futile Transmembrane Cycling Under
NH3/NH4+ Toxicity in Plant Roots ..................................................................................143
6.1.1 Abstract ................................................................................................................143
6.1.2 Introduction ..........................................................................................................144
6.1.3 Results ..................................................................................................................146
6.1.4 Discussion ............................................................................................................155
Chapter 7 Conclusions and Future Directions .............................................................................161
References ....................................................................................................................................167
Appendix I: Other Published Material .........................................................................................194
x
List of Tables
Table 1. Fluxes and compartmentation of K+ in roots of barley seedlings grown at either 0.1 or
1.0 mM [K+]ext, as determined by compartmental analysis by tracer efflux (CATE)................... 31
Table 2. Long-term NaCl exposure and tissue biomass and content (low-K+, NH4+ conditions). 53
Table 3. Long-term NaCl exposure and tissue biomass and content (low-K+, NO3- conditions). 54
Table 4. Long-term NaCl exposure and tissue biomass and content (high-K+, NH4+ conditions).
....................................................................................................................................................... 55
Table 5. Long-term NaCl exposure and tissue biomass and content (high-K+, NO3- conditions). 56
Table 6. Short-term NaCl exposure and K+ efflux and retention.................................................. 57
Table 7. Steady-state K+ fluxes, compartmentation, and electrophysiology of intact barley
seedling roots grown on a full nutrient medium supplemented with 10 mM NH4+ and either
0.0225 or 0.1125 mM K+ .............................................................................................................. 70
Table 8. Electrophysiological responses of barley and Arabidopsis root cells to sudden NH4+
withdrawal with or without Ca(NO3)2 .......................................................................................... 78
Table 9. Compartmental analysis in roots of intact barley seedlings grown and measured with
0.1, 1, or 40 mM K+ and the release kinetics of the apoplastic dye PTS .................................... 110
Table 10. Effects of Ag+ on the relative leakage ratio (RLR), and K+ and NH4+ contents, of roots
from barley seedlings .................................................................................................................. 135
xi
List of Figures
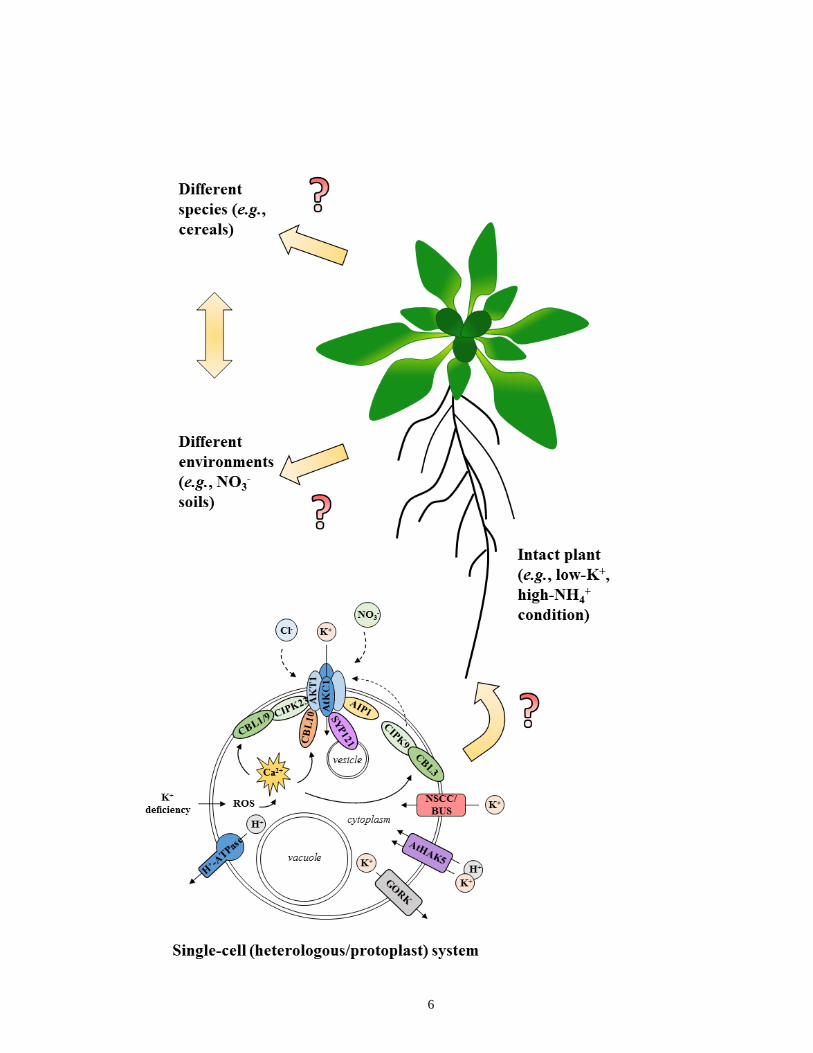
Figure 1. Summary of cellular mechanisms related to K+-channel function and regulation in roots
of Arabidopsis and its relation to higher levels of organization ..................................................... 7
Figure 2. Response of 42K+ efflux from roots of intact barley seedlings to sudden provision of
channel inhibitors .......................................................................................................................... 24
Figure 3. Response of 42K+ efflux from roots of intact barley seedlings to sudden application or
elevation of Ca2+, K+, Rb+ or Na+ ................................................................................................. 25
Figure 4. Response of 42K+ efflux from roots of intact barley seedlings to sudden provision of
NH4+, NH4NO3, or NO3
- ............................................................................................................... 27
Figure 5. K+ influx in intact barley seedlings grown at either 0.1 or 1.0 mM [K+]ext, and
introduced to sudden provision of elevated NO3-, NH4
+, or NH4NO3 .......................................... 29
Figure 6. Response of 42K+ efflux from roots of intact barley seedlings to sudden provision of
VO43-, CN-, pH 9.2, or HCO3
- ....................................................................................................... 30
Figure 7. Nutritional and cultivar comparisons of NaCl-stimulated K+ efflux from roots of intact
rice................................................................................................................................................. 43
Figure 8. Inhibitor effects of NaCl-stimulated K+ efflux from roots of intact rice ....................... 46
Figure 9. Root K+ content and short-term NaCl stress in rice ...................................................... 48
Figure 10. Correlation analysis between tissue K+/Na+ content and biomass for rice seedlings in
the presence and absence of long-term NaCl stress ...................................................................... 50
Figure 11. NaCl-stimulated K+ efflux and biomass correlation in rice ........................................ 51
Figure 12. The effects of various pharmacological and nutritional treatments, targeting either
Shaker-like K+ channels and HAK/KUP/KT transporters, or NSCCs, on steady-state K+ influx in
intact roots of barley seedlings ..................................................................................................... 69
Figure 13. The effects of various pharmacological and nutritional treatments on steady-state K+
influx in intact roots of Arabidopsis ............................................................................................. 72
xii
Figure 14. Response of 42K+ efflux from roots of intact barley seedlings grown on high NH4+ to
sudden application of various pharmacological and nutritional treatments.................................. 74
Figure 15. The effects of various pharmacological and nutritional treatments on K+ influx
stimulated due to NH4+ withdrawal in intact roots of barley seedlings ........................................ 77
Figure 16. The effects of various pharmacological and nutritional treatments on K+ influx
stimulated due to NH4+ withdrawal in intact roots of Arabidopsis ............................................... 81
Figure 17. Response of K+ influx to the duration of NH4+ withdrawal in roots of intact barley
seedlings ........................................................................................................................................ 83
Figure 18. Response of tissue K+ content to the duration of NH4+ withdrawal in barley seedlings
....................................................................................................................................................... 85
Figure 19. Schematic overview of K+ uptake in plant roots under steady-state conditions (in the
presence of high (millimolar) [NH4+]ext) ....................................................................................... 93
Figure 20. K+ influx into intact barley seedlings and the effect of ammonium withdrawal (AWE)
± Ca(NO3)2 and AWE + Ca(NO3)2 ± channel inhibitors .............................................................. 99
Figure 21. Steady-state (control) root O2 consumption in intact barley seedlings and the effect of
sudden NH4+ withdrawal (AWE) ................................................................................................ 101
Figure 22. The two-mechanism model of K+ acquisition in roots of higher plants and its
extension into the saline range .................................................................................................... 106
Figure 23. Cellular K+ efflux ceases in the low-affinity range and what is measured is
extracellular (apoplastic) in origin .............................................................................................. 109
Figure 24. Trans-membrane K+ influx saturates in the low-affinity range, despite an apparent
linear isotherm, and is inversely proportional to plant K+ status ................................................ 113
Figure 25. Plasma-membrane depolarization saturates with rising [K+]ext ................................. 114
Figure 26. The revised model of K+ acquisition in roots of higher plants .................................. 122
xiii
Figure 27. Response of NH3/NH4+ influx and efflux in roots of intact barley seedlings to 500 µM
Ag+. ............................................................................................................................................. 127
Figure 28. Response of K+ influx into roots of intact barley seedlings to Ag+, Hg2+, Au3+, Pb2+,
Cd2+, and Ni2+ ............................................................................................................................. 128
Figure 29. Response of 42K+ efflux from roots of intact barley seedlings to sudden provision of
Ag+, Hg2+, Au3+, Na+, acetazolamide, zonisamide, forskolin, Pb2+, Cd2+, and Ni2+ ................... 129
Figure 30. Response of 42K+ efflux from roots of intact barley seedlings to sudden provision of
500 µM Ag+ in combination with channel inhibitors ................................................................. 132
Figure 31. Illustration of the integration technique employed to quantify total K+ released during
treatment with 500 µM Ag+. ....................................................................................................... 136
Figure 32. Confocal micrographs showing propidium iodide staining of the cell wall and nuclei
of damaged cells from lateral root tips of intact barley seedlings treated with heavy-metal AQP
inhibitors ..................................................................................................................................... 137
Figure 33. NH3 (not NH4+) is the main permeating species in barley roots ............................... 148
Figure 34. Effect of 5-min exposure to elevated pH (pH 9.25) on root respiration in barley plants
grown with 0.01 mM K2SO4 and 5 mM of either (NH4)2SO4 or Ca(NO3)2 ............................... 150
Figure 35. Characterization of NH3/NH4+ efflux from roots of intact barley seedlings. ............ 153
Figure 36. Pharmacological profile of NH3/NH4+ influx into roots of barley seedlings at varying
external pH .................................................................................................................................. 154
Figure 37. Revised model of futile transmembrane NH3/NH4+ cycling in root cells of higher
plants ........................................................................................................................................... 160
xiv
List of Abbreviations
AIP1 AKT1-interacting PP2C 1
AKT Arabidopsis K+ transporter 1
AQP Aquaporin
ATP Adenosine triphosphate
BUS Back-up system (of K+ acquisition)
CATE Compartmental analysis by tracer efflux
CBL Calcineurin-B-like protein
CCCP Cyanide m-chlorophenyl hydrazone
CHX Cation-H+ exchanger
CIPK CBL-interacting protein kinase
CNGC Cyclic nucleotide gated channel
DES Diethylstilbestrol
DNP 2,4-dinitrophenol
EC Electrical conductivity
E:I Efflux:influx ratio
EK+ Equilibrium (Nernst) potential for K+
HAK/KUP/KT High-affinity K+/K+ uptake/K+ transporter
[K+]cyt Cytosolic K+ concentration
[K+]ext External K+ concentration
KAT K+ channel in Arabidopsis thaliana
KIR Inward-rectifying K+ channel
KM Half-saturation (Michaelis-Menten) constant
KOR Outward-rectifying K+ channel
[NH4+]ext External NH4
+ concentration
NHX Na+-H+ exchanger
NORC Nonselective outward-rectifying channel
NSCC Nonselective cation channel
OPA o-phthalaldehyde
Pf Osmotic water permeability
pKa -log10 (Acid dissociation constant)
PP2C 2C-type protein phosphatase
xv
ROS Reactive oxygen species
SHAM Salicylhydroxamic acid
SNARE Soluble N-ethylmaleimide-sensitive factor protein attachment
protein receptor
SOS Salt-overly sensitive
t½ Half-life
TEA+ Tetraethylammonium
Vmax Maximum velocity
WUE Water-use efficiency
WT Wild type
γcyt Cytosolic K+ activity coefficient
ΔΨm Membrane electrical potential
ΔΔΨm Change in membrane electrical potential
(depolarization/hyperpolarization)
ΨR Root water potential
Molecular-Genetic Nomenclature
Uppercase Protein (e.g. AtAKT1)
Uppercase italicized Gene (e.g. AtAKT1)
Lowercase italicized Mutant (e.g. atakt1)
1
Chapter 1 General Introduction
Our understanding of plant membrane channels has come a long way since Burdon-Sanderson
first corresponded with Darwin about the Venus flytrap (Dionaea muscipula), and measured the
first action potentials in plants from its leaf (Burdon-Sanderson 1873; Darwin 1875; see also
Pickard 1973; Fromm and Lautner 2007; Hedrich 2012, for a historical overview). The
mechanistic basis of this action potential, i.e. plant ion-channel activity, would not be isolated
and characterized electrophysiologically until more than a century later, following the invention
of the patch-clamp technique by Neher and Sakmann (Moran et al. 1984; Schroeder et al. 1984).
In roots, the “hidden half” of the plant, measurement of thermodynamically passive ion fluxes
(i.e. down an electrochemical gradient, as in Oertli’s “pump-leak” model, where transport of
Rb+, a K+ analogue, was explained by an active inward “pump” and a passive bi-directional
“leak” at the plasma membrane; Oertli 1967; see also Dainty 1962; Epstein et al. 1963; Laties
1969), led to the postulation that ion channels were present in root-cell membranes. However, as
with ion channels found in shoots, the electrophysiological characterization of root ion channels
(namely K+-selective channels) would not occur until the early 1990s (White and Tester 1992;
Gassmann and Schroeder 1994). This would coincide with the first cloning of plant ion channels,
i.e. KAT1 (potassium channel in Arabidopsis thaliana 1; Anderson et al. 1992), which is found
in guard cells, and AKT1 (Arabidopsis K+ transporter 1; Sentenac et al. 1992), which is
predominately found in roots. Both KAT1 and AKT1 are inward-rectifying K+ channels of the
Shaker-like (voltage-dependent) family, which is the best characterized transporter class in plants
to date (for review, see Véry and Sentenac 2003; Dreyer and Uozumi 2011).
Early physiological studies which kinetically mapped out the primary acquisition of K+ from
external solutions, using radiotracers (Epstein et al. 1963; Glass 1976; Kochian and Lucas 1982),
have been buttressed and expanded since the advent of modern molecular-genetic techniques.
For example, it is now well established that H+:K+ symporters of the HAK/KUP/KT family (e.g.
AtHAK5 in Arabidopsis [Arabidopsis thaliana]), alongside AtAKT1, catalyze the vast majority
(~80%) of K+ acquisition in Arabidopsis roots (Gierth and Mäser 2007), and this model
adequately explains, at the molecular level, Emanuel Epstein’s two-mechanism model (Epstein
2
et al. 1963), which describes K+ acquisition (in roots of barley [Hordeum vulgare]) as the sum of
activities of high- and low-affinity transport systems (HATS and LATS, respectively; Hirsch et
al. 1998; Gierth and Mäser 2007; Alemán et al. 2011; Coskun et al. 2014b). Moreover, intricate
regulatory mechanisms of K+ transport in Arabidopsis have been described at the molecular
level, such as how “low-K+ stress” can trigger a Ca2+ signaling cascade where cytosolic free Ca2+
binds to calcineurin-B-like protein 1 (CBL1) and CBL9. These proteins, in turn, interact with
CBL-interacting protein kinase 23 (CIPK23), forming a protein complex that phosphorylates and
activates AtAKT1-channel complexes (i.e. heterotetramer complexes made up of AtAKT1 and
AtKC1 subunits in Arabidopsis; Li et al. 2006; Xu et al. 2006; Lee et al. 2007; Geiger et al.
2009; see also Grefen and Blatt 2012; Subchapter 4.1; Fig. 1). In addition, channel deactivation
via a 2C-type protein phosphatase (PP2C), AKT1-interacting PP2C 1 (AIP1), has been identified
(Lee et al. 2007; Lan et al. 2011). Adding further complexity, AtAKT1-channel complexes have
been shown to also be regulated by the soluble N-ethylmaleimide-sensitive factor protein
attachment protein receptor (SNARE), SYP121, which binds directly to AtKC1, forming a
tripartite complex with AtAKT1. This complex has been shown to be essential for proper
channel functioning (Honsbein et al. 2009). SNAREs are a ubiquitous superfamily of proteins
responsible for vesicle targeting and fusion (i.e. membrane trafficking; Grefen and Blatt 2008),
and interestingly, it has been hypothesized that SYP121 is an important link between ion
transport and membrane/cell expansion (Grefen and Blatt 2008).
Despite the many breakthroughs in our understanding of K+-channel function and regulation,
many fundamental questions remain regarding the mechanisms of K+ transport in and out of
roots, both under conditions of stress and non-stress. Moreover, it is critical that in-planta
demonstrations of cellular and molecular models that are based on heterologous-expression and
protoplast systems (the bases of the models described above) be forthcoming, if extrapolations to
plant performance under “real-world” (i.e. field-level) conditions are to be realized (Fig. 1). This
is particularly important in the light of increasing environmental stresses (e.g. drought, salinity,
soil erosion, and anthropogenic “climate change” associated with greenhouse gas emissions)
which compromise plant performance, as well as a burgeoning human population that is
increasing demands on agricultural output and putting strains on land, water, and nutrient
resources (Coskun et al. 2014b).
3
One example indicating the need for increased physiological understanding involves the poorly
understood mechanisms and regulation of K+ release (efflux) from the cell, in stark contrast to
the wealth of knowledge surrounding K+ influx and accumulation (see above). Similarly, the
mechanism and relevance of Na+-induced K+ release from roots of higher plants under salinity
stress remain equivocal (Nassery 1979; Cramer et al. 1985; Shabala et al. 2006; Britto et al.
2010; Coskun et al. 2013a). To what extent outward-rectifying K+ channels are responsible for
this phenomenon remains unclear, as is the extent to which this phenomenon can be used to
screen for salt-tolerance across contrasting cultivars of agriculturally important crop species
(Chen et al. 2007; Cuin et al. 2008; Coskun et al. 2013a). With respect to K+ acquisition,
questions remain regarding the robustness of the Arabidopsis model (Alemán et al. 2011), and
whether it can be extended to crops such as rice, wheat, maize, and barley (Coskun et al. 2013c;
Coskun et al. 2014b). For example, can K+ channels like AKT1 operate at very low (e.g. 10 µM)
external K+ concentrations ([K+]ext) in cereals, as has been demonstrated in Arabidopsis (Hirsch
et al. 1998; Spalding et al. 1999)? What are the physiological roles of nonselective cation
channels (NSCCs; a class of voltage-sensitive and -insensitive membrane channels which
mediate the passive, and relatively nonselective, transport of cations, such as Na+, K+, NH4+,
Rb+, Cs+, Li+, Ca2+ and Mg2+; Demidchik et al. 2002; Demidchik and Maathuis 2007;
Kronzucker and Britto 2011) in K+ acquisition, and can their study provide insight into Na+
transport in plants (rapid NSCC-mediated influx of Na+ is a leading explanation of the
mechanism of Na+ uptake in roots under salinity-stress conditions; Munns and Tester 2008;
Kronzucker and Britto 2011)? Lastly, do K+ channels operate at very high [K+]ext (i.e. >50 mM)
and can this explain the linear nature of influx isotherms measured in the low-affinity range? A
deeper understanding of low-affinity K+ fluxes may provide important insight into the elusive
nature of Na+ transport under conditions of Na+ toxicity (i.e. salinity stress).
Another major environmental concern is ammonium toxicity in plants, the result of an
accelerated global N cycle, brought about primarily by the industrialized production (via the
Haber-Bosch process) and application of N fertilizers, as well as anthropogenic greenhouse-gas
emissions (Galloway et al. 2008; Gruber and Galloway 2008; Fowler et al. 2015). A major
hypothesis to explain the toxicity syndrome in higher plants is that of futile NH3/NH4+ cycling
across the plasma membrane of roots, whereby rapid influxes are met by nearly equal rapid
effluxes, which is postulated to result in significant metabolic burdens (Britto et al. 2001b;
4
Coskun et al. 2013b). Surprisingly, the fundamental question of which member of the conjugate
acid/base pair, NH3 or NH4+, participates in this futile cycling remained unknown until recently
(see Coskun et al. 2013b; Chapter 6). Moreover, the precise mechanism mediating this flux
remains unknown (ten Hoopen et al., 2010; Esteban et al., 2016); however, it has been
hypothesized that a pathway is via aquaporins (AQPs; see Chapter 6), which comprise a diverse
and ubiquitous group of membrane-bound proteins that facilitate the movement of water, and
small, usually uncharged molecules such as urea, glycerol, carbon dioxide, silicic acid, and
ammonia (Kozono et al. 2002; Maurel et al. 2008; Hove and Bhave 2011). While there is
evidence for AQP-mediated NH3 transport in heterologous expression systems (Jahn et al. 2004;
Holm et al. 2005; Loqué et al. 2005; Hove and Bhave 2011), a convincing in-planta
demonstration remains to be seen.
Thus, the overarching theme of this thesis is to investigate the physiological role of membrane
channels in higher-plant mineral nutrition and ion toxicity. Cellular and molecular models of
channel-mediated transport processes have been tested in intact plants and connections to plant
performance under field conditions have been drawn.
Chapter 3 investigates the fundamental mechanisms underlying K+ release (efflux) from roots
under stressed and non-stressed conditions. Subchapter 3.1 investigates the specific mechanisms
and regulations of K+ efflux in intact barley seedlings under various nutritional regimes and
sheds light on the thermodynamic shifts in plant K+ transport as a function of [K+]ext from the
efflux perspective, while also characterizing key N-source (NO3- vs. NH4
+) effects. Subchapter
3.2 investigates the mechanism of Na+-induced K+ efflux in roots of rice seedlings, and addresses
the issue of whether the extent of Na+-induced K+ efflux can be used as a measure of overall
plant salt tolerance. Using three cultivars of rice varying in sensitivity to salinity, as well as a
nutritional matrix varying in K+ level, N source, and N level, this work investigates Na+-induced
K+ efflux and its correlation with cultivar performance on high NaCl.
Chapter 4 explores the mechanisms of K+ influx in roots of higher plants. Subchapter 4.1
investigates the relative contributions of HAK/KUP/KT high-affinity transporters, AKT1-
channel complexes, NSCCs, and hitherto genetically unidentified “back-up systems” (BUS) (as
evident in the athak5 atakt1 double-knock-out mutant in Arabidopsis) to K+ uptake. Subchapter
4.2 further extends this work by exploring anion effects (Cl-, SO42-, and NO3
-) on K+ influx, root
5
respiration, and pharmacological sensitivity, underscoring new additions to the current model of
K+ acquisition. Subchapter 4.3 explores the upper limits of K+ acquisition, asking: how high do
channel-mediated K+ fluxes go? Above 10 mM [K+]ext, linear influx isotherms based on
radiotracer analyses suggest ion channels are capable of extraordinarily high flux capacity. We
critically re-examine the two-mechanism model of K+ influx (first developed by Epstein; see
above), and investigate the involvement of extracellular (apoplastic) fluxes in ion transport,
particularly in the saline range.
Chapter 5 serves as an introduction into the study of NH3/NH4+ fluxes under ammonium toxicity.
To test the hypothesis that low-affinity NH3 fluxes are mediated by AQPs, 13NH3 fluxes were
examined under the influence of well-established heavy-metal AQP inhibitors, Hg2+, Au3+, and
Ag+ (Preston et al. 1992; Niemietz and Tyerman 2002). The discovery of the surprising side
effects of these inhibitors on K+ transport and cellular membrane integrity serve as a cautionary
note on the use of pharmacological inhibitors.
Chapter 6 begins to elucidate the nature of NH3/NH4+ transport in roots of higher plants under
ammonium toxicity. This chapter explores the relative contribution of each species of the
conjugate acid/base pair (NH3/NH4+) to the futile transmembrane cycling observed under these
conditions. Taking the lessons learned from Chapter 5, the hypothesis that AQPs permeable to
NH3 (i.e. aquaammoniaporins) mediate such fluxes were further investigated. This work paves
the way for future studies exploring the mechanism and regulation of rapid NH3 gas fluxes under
ammonium toxicity and will contribute to understanding and addressing this important global
environmental issue.
Note regarding organization of thesis: The bulk of this thesis has been published in peer-
reviewed journals. These papers have been reformatted and presented as subchapters in this
thesis. For the sake of brevity, and to avoid redundancy, the ‘Materials and Methods’ sections
from each paper have been amalgamated into a single chapter (Chapter 2), since many of the
preparations and experiments throughout the thesis are variations of the same procedures. The
reader may refer to this chapter while reading the research chapters. Similarly, detailed
introductions to each topic can be found in the beginning of each research chapter.
6
7
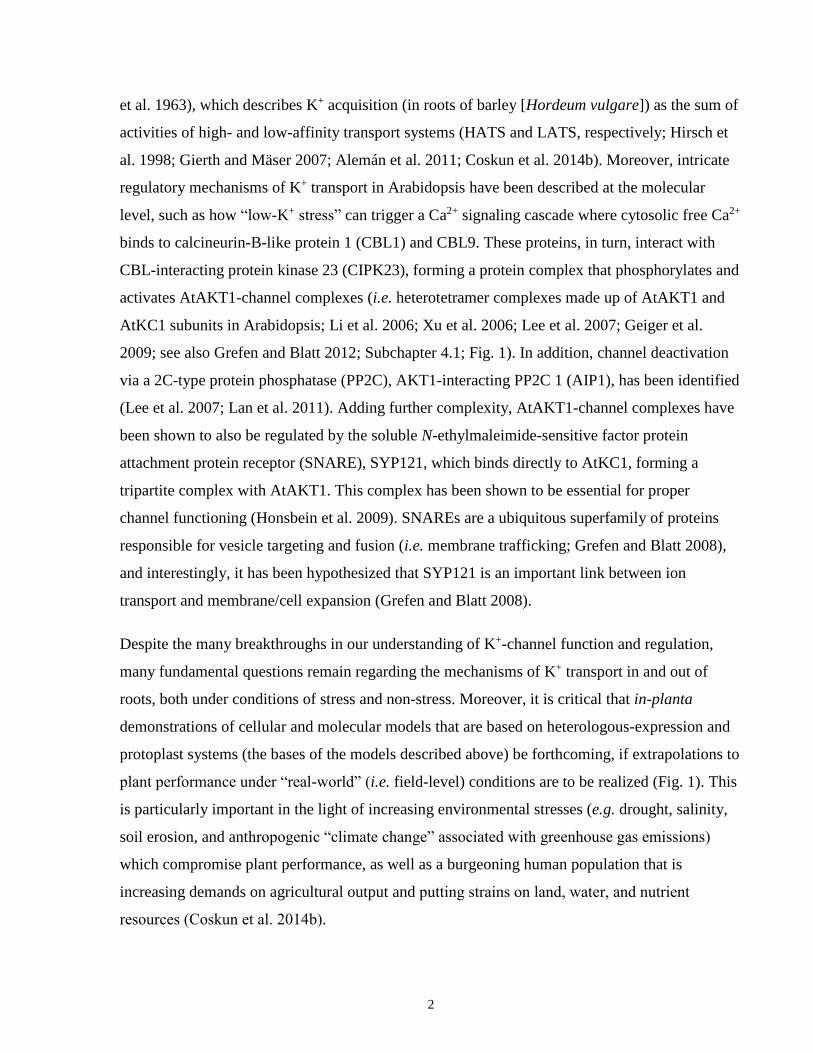
Figure 1. Summary of cellular mechanisms related to K+-channel function and regulation in
roots of Arabidopsis and its relation to higher levels of organization. In single-cell
(heterologous/protoplast) systems, the K+-channel heterotetrameric complex AtAKT1-AtKC1
can mediate K+ acquisition from low (micromolar) external concentrations ([K+]ext) and in the
presence of NH4+. External K+ deficiency is sensed by the cell and results in ROS production
which leads to cellular Ca2+ signaling cascades. Ca2+ binds to CBL proteins to either directly
modulate AtAKT1 (see CBL10) or activate protein kinases (CIPK23) that phosphorylate
AtAKT1 and activate the channel complex. By contrast, the protein phosphatase AIP1 can
dephosphorylate AtAKT1 and thereby inactivate the complex. CBL3-CIPK9 also regulates K+
acquisition, although via indirect mechanisms. The SNARE protein SYP121 interacts with
AtKC1 to activate the channel complex and also facilitates membrane trafficking and cell
expansion via vesicular fusion. Anions (Cl- and NO3-) may also modulate channel activity, albeit
only at high (millimolar) [K+]ext. Other potential means of K+ acquisition involve non-selective
cation channels (NSCCs), which may or may not represent the K+ ‘backup system’ (BUS). Also,
the high-affinity transporter AtHAK5 mediates H+-coupled K+ symport under conditions of
thermodynamically active K+ uptake (powered by the H+-ATPase). Lastly, the K+ channel
GORK mediates cellular K+ efflux under passive-release conditions. Importantly, in-planta links
to many cellular-mechanistic characterizations require further exploration. Once such links are
made, broader applications can be developed, such as with species (e.g. cereals) and to
conditions relevant to agriculture. Figure derived from Coskun et al. (2014b).
8
Chapter 2 Materials and Methods
Plant Growth
Barley seeds (Hordeum vulgare L. cv ‘Metcalfe’) were surface-sterilized for 10 min in 1%
sodium hypochlorite, and germinated under acid-washed sand for 3 d before placement in 12- or
14-L plastic hydroponic vessels containing aerated, modified Johnson’s barley solution (0.5 mM
NaH2PO4, 0.25 mM MgSO4, 0.2 mM CaSO4, 25 µM H3BO3, 20 µM FeEDTA, 2 µM ZnSO4, 0.5
µM MnSO4, 0.5 µM CuSO4, and 0.125 µM Na2MoO4), pH 6.3–6.5 (adjusted with 1 M NaOH),
for an additional 4 d. The growth solutions were modified to provide potassium (as K2SO4,
except for Subchapter 4.2, where KCl was also used), at various concentrations (see text). N was
supplied as either Ca(NO3)2 or (NH4)2SO4, at various concentrations (see text). To ensure that
plants remained at a nutritional steady state, solutions were exchanged on days 5 and 6 (for
plants grown on [K+]ext ≤0.1 mM) or on day 5 only (for all other growth conditions). A subset of
experiments also involved plants grown on a nutrient-deprived solution of 200 µM CaSO4 (see
text). Plants were grown in walk-in growth chambers under fluorescent lights with an irradiation
of ~200 µmol photons m-2 s-1 at plant height, for 16 h d-1 (Philips Silhouette High Output F54T5 ⁄
850HO; Philips Electronics Ltd, Markham, ON, Canada). Daytime temperature was 20 °C,
night-time temperature was 15 °C, and relative humidity was approximately 70%.
Rice seeds (Oryza sativa L., cvs. ‘IR29’, ‘IR72’, and ‘Pokkali’) were surface-sterilized with 1%
sodium hypochlorite for 10 min, germinated in aerated dH2O for 48 h, and placed into 14-L
plastic hydroponic vessels containing aerated, modified Johnson’s rice solution (2 mM MgSO4,
0.3 mM NaH2PO4, 0.3 mM CaCl2, 0.1 mM FeEDTA, 20 µM H3BO3, 9 µM MnCl2, 1.5 µM
CuSO4, 1.5 µM ZnSO4, 0.5 µM Na2MoO4), pH 6.30–6.35 (adjusted with 1 M NaOH). Potassium
was supplied as K2SO4 at various concentrations (see text). Nitrogen was supplied either as
Ca(NO3)2 or (NH4)2SO4, at various concentrations (see text). Long-term salinity-stress treatments
involved supplementation of the growth medium with 50 mM NaCl (see text). To ensure plants
were maintained at a nutritional steady state, solutions were completely exchanged on days 9, 13,
16, 18, and 20 (post-sterilization), and were experimented with on day 21. Plants were cultured
in climate-controlled, walk-in growth chambers under fluorescent lights with an irradiation of
9
~400 µmol photons m-2 s-1 at plant height for 12 h d-1 (Sylvania Cool White, 96T12/CW/VHO;
Sylvania, Mississauga, ON, Canada). Daytime temperature was 30 °C, night-time temperature
was 20 °C, and relative humidity was approximately 70%.
Seeds of Arabidopsis (Arabidopsis thaliana) wild-type ecotypes Col-0 (N1092) and WS (N1601)
and t-DNA insertion lines atakt1-1 (CS3762; WS ecotype), athak5-1 (SALK_014177; Col-0
ecotype), and athak5 atakt1 (Col-0 ecotype; Rubio et al. 2010) were surface-sterilized for 5 min
with 70% ethanol, followed by 10 min with a 1% sodium hypochlorite-0.05% SDS mixture, and
allowed to stratify in a 0.1% agar solution in the dark for 3 d at 4°C, prior to germination on
acid-washed sand for 4 d. Seedlings were then placed in 14-L hydroponic vessels containing
aerated nutrient solution composed of 5 mM K2SO4, 1 mM Ca(NO3)2, 1 mM NaH2PO4, 0.5 mM
MgSO4, 0.25 mM CaSO4, 25 µM H3BO3, 20 µM FeEDTA, 2 µM ZnSO4, 0.5 µM MnCl2, 0.5
µM CuSO4, and 0.5 µM Na2MoO4 (pH 6.0, with 1 M NaOH). Solutions were completely
exchanged once per week for 3 weeks. During the final (5th) week of growth, [K+]ext was
typically changed (see text), and where N-source changes were made (see text), Ca(NO3)2 was
replaced with an equimolar amount of (NH4)2SO4. Nutrient solutions were completely exchanged
every second day during the final week of growth and experimented with on day 35. This growth
regime was particularly important for the proper growth of atakt1 and athak5 atakt1 mutants, as
germination and growth were severely hindered on low-K+, high-NH4+ media (data not shown;
Rubio et al. 2010). Plants were grown in a climate-controlled chamber under fluorescent lights,
with an irradiation of ~200 µmol photons m-2 s-1 at plant height, for 12 h d-1 (Philips
F96T8/TL841/HO/PLUS; Philips Electronics Ltd, Markham, ON, Canada). Daytime temperature
was 20 °C, nigh-time temperature was 15 °C, and relative humidity was approximately 70%.
Radiotracer Analyses
2.2.1 Radioisotopes
42K (half-life = 12.36 h), was received as 42K2CO3 from the McMaster University Nuclear
Reactor (Hamilton, ON, Canada). On the day of the experiment, ~0.2 g of 42K2CO3 (~40 mCi)
was weighed out and dissolved in 19.93 mL dH2O and 0.07 mL concentrated H2SO4, to drive the
following chemical reaction:
10
42K2CO3 (s) + H2SO4 (l) + H2O (l) 42K2SO4 (l) + CO2 (v) + 2H2O (l)
The resulting 42K2SO4 solution was then used to “spike” loading solutions of various [K+]ext.
13N (half-life = 9.97 min) was received as 13NH3/13NH4
+ solution (~5 mL) from the Centre for
Addiction and Mental Health (CAMH) cyclotron (University of Toronto, Toronto, ON, Canada).
The tracer is produced by the proton bombardment of the oxygen atom of water (typically
resulting in a radioactivity of 100-200 mCi; for production details, see Meeks 1993). Because the
molar quantity of 14NH3/14NH4
+ is extremely low in these solutions, the N concentration of the
tracer stock solution was negligible. Thus, on the day of the experiment, a small aliquot (no more
than ~0.5 mL) of stock solution was sufficient to “spike” loading solutions (Coskun et al. 2014a).
2.2.2 Direct Influx (DI)
One day before experimentation (day 6), barley seedlings were bundled together at the base of
the shoot, in groups of three to four using a plastic collar, 0.5 cm in height. Bundling of multiple
seedlings was done to ensure sufficient count retention during gamma counting (i.e. a high
signal:noise ratio). There was no need to bundle Arabidopsis.
Unidirectional K+ and NH3/NH4+ influx in roots of intact barley and Arabidopsis was measured
as described in detail elsewhere (Coskun et al., 2014a). In brief, roots were pre-equilibrated for 5
or 10 min (see text) in a solution either identical to the growth solution (control) or in growth
solution supplemented with a chemical treatment (see below). Roots were then immersed for
various times (see text) in a solution identical to the pre-equilibration solution but containing
42K+ or 13NH3/13NH4
+. From there, labeled plants were transferred to nonradioactive growth
solution for 5 s to reduce tracer carryover and then further desorbed of radioactivity from the
extracellular space for various amounts of time in fresh growth solution (see text). Immediately
following desorption, roots were detached from shoots and spun in a low-speed centrifuge for 30
s to remove surface solution prior to weighing. Radioactivity in plant tissues was counted and
corrected for isotopic decay using one of two γ counters (Perkin-Elmer Wallac 1480 Wizard 3’;
Perkin-Elmer, Waltham, MA, USA and Packard Instrument Quantum Cobra Series II, model
5003; Perkin-Elmer, Waltham, MA, USA). Throughout, influx is expressed in terms of µmol g-1
(root fresh weight) h-1.
11
2.2.3 Compartmental Analysis by Tracer Efflux (CATE)
42K+ efflux from roots of intact barley and rice, and 13NH3/13NH4
+ efflux from roots of barley,
were examined as described previously (Coskun et al., 2014a) and based on the method of
compartmental analysis (Lee and Clarkson 1986; Siddiqi et al. 1991; Kronzucker et al. 1995). In
brief, roots of replicate units of five to 10 bundled seedlings were labeled for 1 h in aerated
nutrient media identical to growth conditions but containing 42K or 13N (see above). Labeled
seedlings were then secured in glass efflux funnels, and roots were eluted of radioactivity with
successive 20-mL aliquots of aerated, nonradioactive growth solution. The timing of each
desorption series varied slightly among experiments (see text) but was typically as follows, from
first to final eluate: 15 s (four times), 20 s (three times), 30 s (two times), 40 s (once), 50 s
(once), 1 min (five times), 1.25 min (once), 1.5 min (once), 1.75 min (once), 2 min (13 times),
for a total of 40 min of elution. Typically, the first 19 eluates (14 min into the elution series)
were identical to the growth solution, while the final 13 eluates contained either growth solution
(control) or a chemical treatment (see text).
Immediately following elution, plant organs were harvested as described in the preceding
section, and radioactivity from eluates, roots, and shoots was counted and corrected for isotopic
decay, as described above. For comparison charts of tracer efflux, the specific activities of all
replicates were normalized to the arbitrary value of 2 x 10⁵ cpm µmol-1. Throughout, tracer
efflux was expressed in terms of cpm released g-1 (root fresh weight) min-1.
For the results of CATE (e.g. see Tables 1 and 7), tracer efflux and retention data were used to
estimate unidirectional and net fluxes, cytosolic half-times of exchange, and cytosolic pool sizes,
according to the methods of compartmental analysis (Kronzucker et al. 1995). In brief, linear
regression of the function,
ln Φco(t)* = ln Φco(i)* - kt
(where Φco(t)* is tracer efflux at elution time t, Φco(i)* is initial tracer efflux, and k is the rate
constant describing the exponential decline in radioactive tracer efflux, found from the slope of
the tracer release rate) was used to resolve the kinetics of the slowest exchanging (cytosolic)
phase in these experiments (Kronzucker et al. 1995). For 42K+, the cytosolic origin of the slowest
exchanging phase was confirmed for the low-K+ conditions (i.e. <1 mM [K+]ext; see Chapters 3
12
and 4), and ruled out for high-K+ conditions ([K+]ext ≥1 mM), by means of pharmacological
testing (Coskun et al. 2010); thus, compartmental analysis of cytosolic pools and fluxes could not
be performed at high K+. Based on literature precedents demonstrating the relatively long half-
times of vacuolar K+ exchange compared with that of the cytosol (hours versus minutes; Poole
1971; Walker and Pitman 1976; Behl and Jeschke 1982; Memon et al. 1985; Hajibagheri et al.
1988; Siddiqi et al. 1991; White et al. 1991), we could assume that the vast majority of
intracellular tracer released was from the cytosolic pool after only 1 h of loading, while vacuolar
release was negligible. Chemical efflux, Φco, was determined from initial tracer efflux, Φco(i)*,
divided by the specific activity of the cytosol (SAcyt) at the end of the labeling period. SAcyt was
estimated by using external specific activity (SAext), labeling time t, and the rate constant k,
which are mathematically related in the exponential rise function (Walker and Pitman 1976),
SAcyt = SAext (1 – e–kt)
Net flux, Φnet, was found using total plant (root and shoot) tracer retention after desorption, and
influx, Φoc, was calculated from the sum of Φco and Φnet. Note that shoot accumulation of
radiotracer is routinely dealt with in compartmental analysis of intact seedlings (Jeschke and
Jambor 1981; Siddiqi et al. 1991); thus, the parameters listed in CATE Tables (e.g. Tables 1 and
7), can be accurately estimated. [K+]cyt was determined using the flux turnover equation,
[K+]cyt = Ω Φoc k-1
where Ω is a proportionality constant correcting for cytosolic volume being approximately 5% of
total tissue (Lee and Clarkson 1986; Siddiqi et al. 1991; Britto and Kronzucker 2001).
2.2.4 Pharmacological Treatments
For K+ influx experiments, the following agents were used to test for the involvement of
different uptake mechanisms: 10 mM TEACl, 5 mM BaCl2, 10 mM CsCl, 10 mM Na3VO4, 1
mM NaCN + SHAM, 100 µM DNP (1% ethanol), 50 µM DES (1% ethanol), 10 µM CCCP (1%
ethanol), pH 9.2 (adjusted with 1 M NaOH), 5 mM CaSO4, 5 mM CaCl2 (1 mM in the case of
Arabidopsis; see 4.1), 5 mM Ca(NO3)2 (1 mM for Arabidopsis), 50 µM GdCl3, 50 µM LaCl3, 10
mM sodium Glu, and 100 µM DEPC. All treatments involved a 5-min pretreatment, except for
13
DNP, DES, CN- + SHAM, CCCP, and DEPC, which took 10 min. It should be noted that no
effect of 1% ethanol (a solvent vehicle for DNP, DES, and CCCP) on K+ influx was found (data
not shown). Inhibitors were added in the presence of a complete growth medium, unless stated
otherwise.
For K+ efflux experiments, eluates were supplemented with 10 mM CsCl, 10 mM TEACl, 5 mM
BaCl2, 10 mM LaCl3, 10 mM NaHCO3, 5 mM (NH4)2SO4, NaCl (at various concentrations, see
text), 5 mM Rb2SO4, 5 mM K2SO4, 5 mM Ca(NO3)2, 5 or 10 mM CaSO4 (see text), 10 mM
Na3VO4, pH 9.2 (adjusted with 1 M NaOH), 1 mM NaCN, 100 µM minoxidil sulphate (0.1%
DMSO), 100 µM pinacidil monohydrate (0.1% DMSO), 100 µM diazoxide (0.1% DMSO), and
100 µM 4-aminopyridine (0.1% DMSO). Other treatments involved the withdrawal of
(NH4)2SO4 from growth solutions. A small subset of experiments also involved loading and
elution solutions adjusted to a pH of 9.2 (with 1 M NaOH). The heavy-metal AQP inhibitors
used in this study were Ag+ (as AgNO3), Au3+ (as HAuCl4), and Hg2+ (as HgCl2), all provided at
5, 50, and 500 µM. A small subset of experiments also used 5 µM silver sulphadiazine (silver 4-
amino-N-2-pyrimidinylbenzenesulphonamide, 0.5% DMSO; Niemietz and Tyerman, 2002). The
organic AQP inhibitors acetazolamide and zonisamide (at 10 µM in 0.1% DMSO; Yool et al.
2010), and the AQP stimulator forskolin (at 10 µM in 0.1% DMSO; Maurel et al. 1995; Yool et
al. 1996) were also tested. Control experiments showed no effect of either 0.1% or 0.5% DMSO
on K+ fluxes (not shown). In addition, the heavy metals Cd2+ (as CdCl2), Ni2+ (as NiSO4), and
Pb2+ (as Pb(NO3)2), known to not generally inhibit AQPs (Niemietz and Tyerman 2002; see
Zelenina et al. 2003; Verdoucq et al. 2008) were tested (all at 500 µM).
For 13N experiments, treatments included concentration-dependent and pH-dependent isotherms,
whereby [NH3/NH4+]ext and pH were adjusted (with NaOH) as specified (see text), in preloading
and loading solutions. Other treatments included 10 mM CsCl, 5 mM K2SO4, 10 mM LaCl3, 10
mM ZnCl2, 500 µM HgCl2 and chilling (4 °C) in preloading (10 min) and loading solutions. A
subset of experiments involved a 2-h pretreatment at pH 5.25 with or without N2 bubbling
(anoxia treatment), 2 mM H2O2, or 20 mM propionic acid.
14
Electrophysiology
Measurements of membrane potential (ΔΨm) from epidermal and cortical root cells of barley and
Arabidopsis (aged 7–8 d and 35–37 d, respectively) were conducted as described previously
(Schulze et al. 2012). In brief, roots were immersed in a Plexiglas chamber filled with nutrient
solution and installed onto the stage of an inverted light microscope (Leica DME; Leica
Microsystems, Richmond Hill, ON, Canada). Microelectrodes (tip diameter <1 µm), made from
borosilicate glass (i.d. = 0.75 mm, o.d. = 1.00 mm; World Precision Instruments, Sarasota, FL,
USA) and produced using an electrode puller (P-30; Sutter Instrument, Novato, CA, USA), were
filled with 3 M KCl solution (pH 2). Both impaling and reference electrodes were prepared in
this manner. ΔΨm measurements were made in a region 2 to 3 cm from the root tip, with the use
of an electrometer (Duo 773; World Precision Instruments, Sarasota, FL, USA), and recorded on
an oscilloscope (TDS2002B; Tektronix, Markham, ON, Canada). Once steady readings were
obtained, treatment solution was perfused through Tygon tubing via a peristaltic pump at a rate
of approximately 7.5 mL min-1 (see text for details regarding treatments). For thermodynamic
(Nernstian) analyses, EK+ was estimated using the Nernst equation:
𝐸𝐾+ = 𝑅𝑇
𝑧𝐹𝑙𝑛
[𝐾+]𝑒𝑥𝑡
[𝐾+]𝑐𝑦𝑡
where R is the universal gas constant (8.314 J K-1 mol-1), T is ambient temperature (293.15 K), z
is the ionic charge of the species (+1 for K+), F is the Faraday constant (96,485 C mol-1), and
[K+]ext and [K+]cyt are as defined previously.
Tissue-Content Analyses
2.4.1 Flame Photometry
Tissue K+ and Na+ contents for barley and rice (aged 7 and 21 d, respectively) were determined
by methods described previously for steady-state and non-steady-state conditions (Britto et al.
2010; Coskun et al. 2012). In brief, replicate units of three to five seedlings had their roots
incubated for 5 min in 10 mM CaSO4 to release extracellular K+ and Na+ (steady state) or were
treated in growth solution with NH4+ removed at various time points spanning 24 h (non-steady
15
state; see 4.1) prior to CaSO4 desorption. From there, plant organs were harvested as above (see
2.2.2), oven dried for 3 d at 80-90 °C, and pulverized and digested in 30% HNO3 for an
additional 3 d. K+ and Na+ concentrations of tissue digests were measured using a dual-channel
flame photometer (model 2655-10; Cole-Parmer Instrument, Montreal, QC, Canada). Tissue ion
concentration was expressed in µmol g-1 (root fresh weight).
2.4.2 OPA Assay
Tissue NH4+ content was determined by the o-phthalaldehyde (OPA) method as previously
described (Szczerba et al. 2008b). Following desorption in 10 mM CaSO4 (see above), separation
of organs, and weighing, root and shoot tissue (~0.5 g) were pulverized under liquid N2 using a
mortar and pestle, and NH4+ was extracted by addition of 6 mL of formic acid (10 mM) (Husted
et al. 2000). Subsamples (1 mL) of the homogenate were centrifuged at 16,000 g at 2 °C for 10
min. Supernatants were transferred into 2 mL polypropylene tubes affixed with 0.45 µm nylon
filters (Costar; Corning Inc., Lowell, MA, USA) and centrifuged at 5,000 g at 2 °C for 5 min.
The resulting supernatant was analyzed using the OPA method to determine NH4+ content
(Goyal et al. 1988). OPA reagent was prepared 1 d before use and was composed of 100 mM
KH2PO4, 100 mM K2HPO4, 3.75 mM OPA, and 2 mM 2-mercaptoethanol. Prior to the addition
of 2-mercaptoethanol, the solution was adjusted to pH 7 with 1 M NaOH and filtered through
grade-2 Whatman filter paper. A 10-µL aliquot of tissue extract was added to 3 mL of OPA
reagent, and the colour was allowed to develop in the dark for 30 min at room temperature.
Sample absorbance was measured at 410 nm using a spectrophotometer (Hewlett Packard 8453;
Agilent Technologies Canada Inc., Mississauga, ON, Canada).
Root Respiration
Root respiration was determined by immersing roots of intact plants in a 3-mL cuvette
containing nutrient solution, in which oxygen depletion was monitored by use of a Clark-type O2
electrode system (Hansatech Instruments Ltd., King’s Lynn, Norfolk, UK). The decline in
dissolved O2 was recorded over 10 min, after which roots were dried and weighed, as described
above. The theoretical respiratory cost of active ion efflux was determined using the relationship,
16
ΦO2 = 0.2 Φco
where ΦO2 represents the oxygen consumption by roots, and Φco represents the efflux of
monovalent cations (K+ or Na+) from roots. This analysis is based on the electroneutral K+ (or
Na+)/H+ exchange mechanism (see Subchapter 4.3), a stoichiometry of 1 H+ pumped per ATP
hydrolysed (Britto and Kronzucker 2006), and a phosphorylation efficiency (P/O2 ratio) of 5
(Kurimoto et al. 2004; Britto and Kronzucker 2006).
Confocal Microscopy
Following a 15-min treatment with Ag+, Au3+, Hg2+, Pb2+, Cd2+, Ni2+, and Na+ (see text for
details), lateral root segments of intact seedlings were sectioned 0.5–1 cm from the apex and
incubated with 25 µg mL-1 propidium iodide with 0.1% Silwet to counterstain the cell wall and
nuclei of ruptured cells (Oh et al. 2010). Propidium iodide was excited at 488 nm and
fluorescence was detected at ≥585 nm (red channel) using a Zeiss LSM 510 META confocal
microscope (Carl Zeiss, Jena, Germany).
Membrane-Stability Assays
2.7.1 Electrical Conductivity
Electrolyte leakage, as a measure of membrane intactness, was assessed as described by Tuna et
al. (2007) but adapted here for excised roots. After a 15-min incubation in either normal growth
solution (control) or growth solution plus 500 µM AgNO3, roots (~150 mg) of intact seedlings
were excised and rinsed three times with deionized water to remove surface-adhering electrolytes
and damaged cells from the cut surface. Root segments were placed in 20 mL vials containing 10
mL of deionized water and incubated at 25 °C for 24 h in a rotary shaker. Subsequently,
electrical conductivity (EC) of the bathing medium was measured (CON510 Bench
Conductivity/TDS meter; Oakton Instruments, Vernon Hills, IL, USA). After samples were
autoclaved at 120 °C for 20 min, the final electrical conductivity of the bathing medium was
measured following equilibration at 25 °C. The relative leakage ratio was determined as the
quotient of the EC before and after autoclaving.
17
2.7.2 UV-Absorbance Spectrophotometry
Another gauge of membrane stability involved measuring the release of UV-absorbing
substances from excised roots (Redmann et al. 1986). Roots were treated as described above but
absorbance (at 280 nm, A280) of the bathing medium was measured spectrophotometrically (see
above). The relative leakage ratio was determined as the quotient of A280 before and after
autoclaving.
Ag+-Induced K+-Release Quantification
In efflux experiments, silver stimulated radiotracer release from roots over the course of its
application (see Chapter 5). To express this release in terms of moles of traced ions, it was
essential to estimate the specific activity (SA) of the tracer pool captured in efflux aliquots. This
was done by first determining cytosolic SA following the 1-h labelling period, using the
exponential rise function described above (see 2.2.3). Cytosolic SA, however, had to be
corrected for 42K+ lost during the first 15.5 min of efflux desorption (i.e. prior to silver
application), using the exponential decay function,
SAcyt’ = SAcyt e–kt’
or by substitution in the equation,
SAcyt’ = SAext (1 – e–kt) e–kt’
where t’ = 15.5 min. Thus, to quantify the K+ released (in µmol g-1 (root FW)) after silver
application, the radioactivity released (in cpm) during this time was summed, divided by SAcyt’,
and corrected for root FW. For comparison purposes, this protocol was conducted for each
individual treatment on efflux.
Root Water Potential, ΨR
Water potential (ΨR) of control roots or roots treated with either 500 µM AgNO3 or HAuCl4 was
measured by means of the pressure chamber (Model 1000 Pressure Chamber Instrument; PMS
18
Instrument Co., Albany, NY, USA) (Scholander et al. 1965). Following a 15-min incubation in
the chemical treatment of interest, seedlings were detopped at the hypocotyl region (~1– 2 cm
above the seed) and the root system was placed into the pressure chamber, allowing ~0.5 cm of
the stem to protrude from the chamber. Root water potential (in MPa) was determined by
applying N2 gas pressure to the root system until the meniscus reached the cut surface.
PTS Efflux
The fluorescent dye 8-hydroxy-1,3,6-pyrenetrisulphonic acid (PTS; Yeo et al. 1987) was used to
trace apoplastic fluxes in roots of intact barley seedlings grown in a full nutrient solution
supplemented with 0.1 mM K+ (see above). Roots of replicate units of 6–10 plants were
immersed in growth solution supplemented with 0.01% (w/v) PTS for 1 h. From there, plants
were transferred and secured into efflux funnels (see above), and eluted with successive 13-mL
aliquots of fresh, PTS-free, growth solution over the course of 30 min. The elution series was as
follows: 1 min (five times), 2 min (once), 3 min (once), 4 min (four times). From there, plants
were harvested as mentioned above, and PTS fluorescence in eluates, roots, and shoots was
measured by fluorimetry (excitation = 403 nm and emission = 510 nm; BioTek Synergy 4;
BioTek, Winooski, VT, USA).
19
Chapter 3 K+ Efflux in Roots of Higher Plants: Mechanisms and Connections
to Abiotic Stress
Regulation and Mechanism of Potassium Release from Barley Roots: An in planta 42K Analysis
Preface
A modified version of this subchapter was published as: Coskun D, Britto DT, Kronzucker HJ
(2010) Regulation and mechanism of potassium release from barley roots: an in planta 42K
analysis. New Phytologist 188, 1028–1038.
HJ Kronzucker designed the study, with input from DT Britto and D Coskun. D Coskun
performed the experiments and analyzed the data, with input from DT Britto and HJ Kronzucker.
DT Britto wrote the manuscript, with input and editing from D Coskun and HJ Kronzucker.
3.1.1 Abstract
Potassium (K+) flux into plant cells is a well-characterized ion transport phenomenon. By
contrast, little is known about the mechanisms and regulation of K+ flux from the cell. Here, we
present a radioisotopic analysis of K+ fluxes from roots of intact barley (Hordeum vulgare), in
the context of recent discoveries in the molecular biology and electrophysiology of this process.
Plants were labelled with 42K+, and kinetics of its release from roots were monitored at low (0.1
mM) or high (1.0 mM) external K+ concentration, [K+]ext, and with the application of channel
modulators and nutrient shifts. At 0.1 (but not 1.0) mM [K+]ext, where K+ efflux is thought to be
mediated by K+-outward-rectifying channels, 42K+ efflux was inhibited by the channel blockers
barium (Ba2+), cesium (Cs+), tetraethylammonium (TEA+), and lanthanum (La3+). Ammonium
and nitrate (10 mM) stimulated and inhibited 42K+ efflux, respectively, while 10 mM [K+]ext or
[Rb+]ext decreased it. No evidence for the involvement of ATP-binding cassettes, nonselective
cation channels, or active K+-efflux pumps was found. Our study provides new evidence for the
thermodynamic transition between high- and low-affinity transport, from the efflux perspective,
20
identifying the operation of channels at low [K+]ext, and the cessation of transmembrane efflux at
high [K+]ext.
3.1.2 Introduction
Potassium (K+), a major macronutrient, is the most abundant cation in plant cells, and is required
for a wide range of functions including osmotic balance, electrical regulation, and enzyme
activation. Its uptake by plant roots has been studied extensively for decades, and a robust two-
system model is widely used that describes the distinct kinetics of K+ acquisition at low external
K+ concentrations ([K+]ext; a ‘high-affinity’ system) and at higher external concentrations (a
‘low-affinity’ system), the demarcation between the two typically falling in the range of 0.5–1.0
mM [K+]ext (Britto and Kronzucker 2008). This model was initially developed on the basis of
uptake kinetics, as measured by radiotracers, particularly in the pioneering work of Epstein (e.g.
Epstein et al. 1963). The two systems differ from each other in a number of fundamental ways,
including their regulation, thermodynamics, saturation kinetics and response to nitrogen source
(for a review, see Britto and Kronzucker 2008).
More recently, specific transport proteins have been identified that catalyse K+ fluxes in both the
high- and low-affinity ranges. The saturable, high-affinity system has been linked to the
HAK/KUP/KT family of transporters, while the linear, low-affinity system is associated with the
activity of inwardly-rectifying K+-specific ion channels. The molecular physiology of these
transporters has been discussed in several recent reviews (including Véry and Sentenac 2003;
Gierth and Mäser 2007; Lebaudy et al. 2007; Dreyer and Blatt 2009; Szczerba et al. 2009). It
should be pointed out that there is some overlap in function between these two types of
transporters, for example with AtKUP1 from Arabidopsis catalysing some degree of transport in
the low-affinity range (Fu and Luan 1998; Kim et al. 1998), and the Arabidopsis AKT1 channel
conducting K+ fluxes in the high-affinity range (Hirsch et al. 1998). However, because channel-
mediated transport takes place passively, AKT1 can only facilitate K+ fluxes in the high-affinity
range when the electrical state of the plasma membrane is highly polarized.
In contrast to the influx of K+, little is known about the physiology and molecular biology of K+
efflux from plant roots. Physiological studies examining the efflux of K+ have largely been
21
restricted to two areas: compartmental analysis, in which efflux kinetics are used to determine
subcellular pool sizes as well as other fluxes such as influx into the cell, and fluxes to the
vacuole and shoot (Pitman and Saddler 1967; Macklon 1975; Memon et al. 1985; Kronzucker et
al. 2003); and the analysis of K+ loss from roots in response to salt or ionic stress (Nocito et al.
2002; Shabala et al. 2006; Britto et al. 2010). Similarly, the molecular biology of K+ release from
the root is poorly understood, although several channels involved in the release of K+ from root
cells have been identified. These include SKOR, which facilitates K+ release into the xylem from
neighbouring parenchyma cells (Gaymard et al. 1998), and GORK, which normally functions in
K+ release from guard cells in leaf tissue, but has also been localized in root hairs of Arabidopsis
(Ivashikina et al. 2001). In addition, assembly of AKT1 homotetramers in Arabidopsis mutants
lacking the accessory channel protein AtKC1 can result in the formation of functional channels
that conduct ‘leak’ fluxes from the cell (Geiger et al. 2009). However, SKOR and GORK are not
known to mediate K+ efflux from the root to the external environment, and AKT1 homotetramers
are the products of mutagenesis and do not occur naturally. Thus, the molecular identity of ion
channels mediating K+ loss from the plant root into the external environment, like their
physiological characteristics, remains largely unknown. Further complicating the issue is the
apparent diversity of outwardly directed channel activity among plant species and cell type
(Diatloff et al. 2004). In addition to leaving the cell via ion channels, K+ may also be driven
outwardly via cation/proton exchangers such as those of the CHX (cation-proton exchanger)
family (Pardo et al. 2006), although the direction of the flux catalysed by these exchangers has
been recently questioned (Zhao et al. 2008).
In the present study, we have sought to address the lack of knowledge about K+ efflux from plant
roots, by using radiotracer analysis to examine in detail its physiological properties in intact
barley seedlings. In particular, we have posed the following questions: What mechanisms
underlie and regulate K+ efflux from roots to the external environment? How does K+ efflux
respond to shifts in external [K+] from high- to low-affinity conditions? How do the principal
nitrogen sources for plants (ammonium and nitrate) differ in their effects upon K+ efflux?
Throughout, we have sought to answer these questions as a means of augmenting emerging
discoveries in the molecular biology and electrophysiology of K+ efflux.
22
3.1.3 Results
Unidirectional and net fluxes in control, steady-state plants grown at 0.1 or 1.0 mM [K+]ext were
determined using tracer efflux and retention data, and are shown in Table 1. Efflux, influx and
the ratio of the two were all lower in the high-K+ plants, while the net flux of K+ was nearly the
same under both conditions.
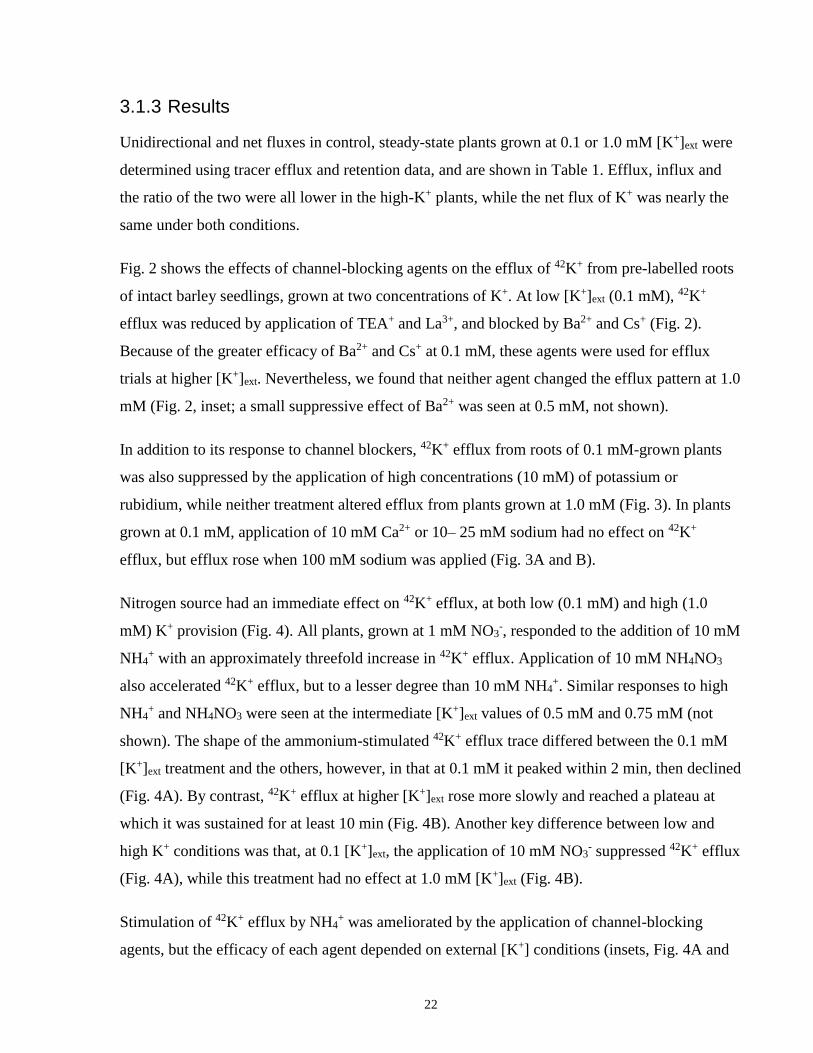
Fig. 2 shows the effects of channel-blocking agents on the efflux of 42K+ from pre-labelled roots
of intact barley seedlings, grown at two concentrations of K+. At low [K+]ext (0.1 mM), 42K+
efflux was reduced by application of TEA+ and La3+, and blocked by Ba2+ and Cs+ (Fig. 2).
Because of the greater efficacy of Ba2+ and Cs+ at 0.1 mM, these agents were used for efflux
trials at higher [K+]ext. Nevertheless, we found that neither agent changed the efflux pattern at 1.0
mM (Fig. 2, inset; a small suppressive effect of Ba2+ was seen at 0.5 mM, not shown).
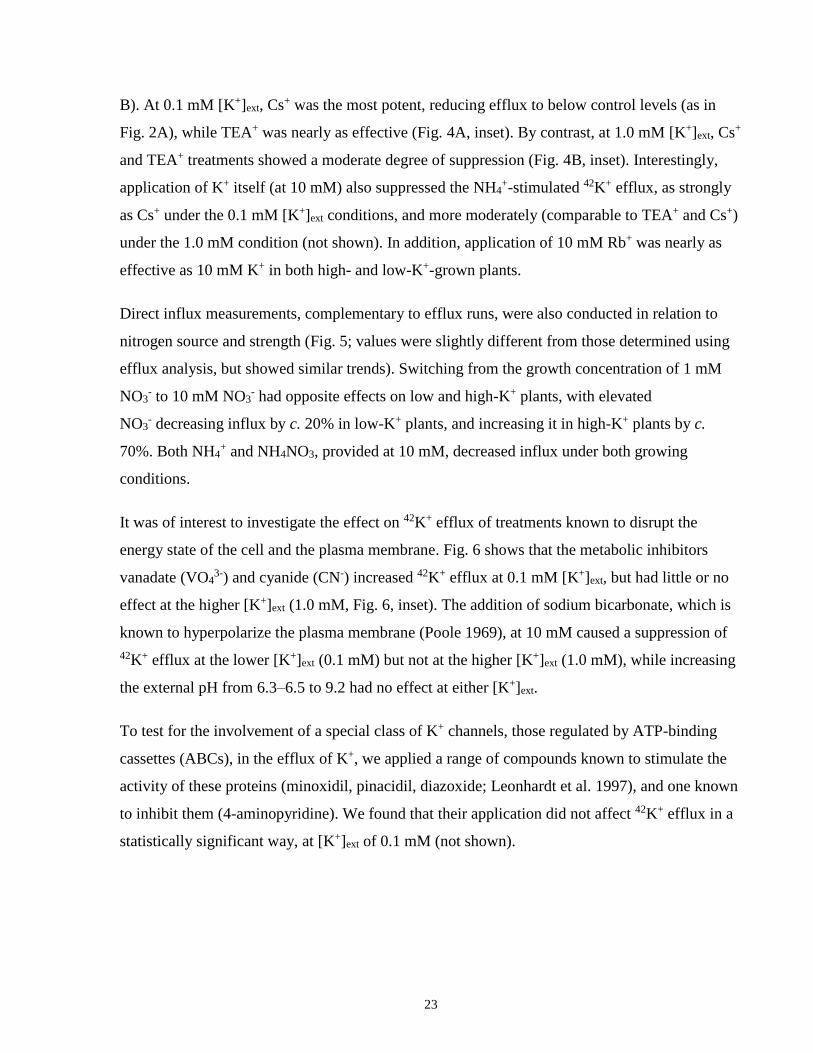
In addition to its response to channel blockers, 42K+ efflux from roots of 0.1 mM-grown plants
was also suppressed by the application of high concentrations (10 mM) of potassium or
rubidium, while neither treatment altered efflux from plants grown at 1.0 mM (Fig. 3). In plants
grown at 0.1 mM, application of 10 mM Ca2+ or 10– 25 mM sodium had no effect on 42K+
efflux, but efflux rose when 100 mM sodium was applied (Fig. 3A and B).
Nitrogen source had an immediate effect on 42K+ efflux, at both low (0.1 mM) and high (1.0
mM) K+ provision (Fig. 4). All plants, grown at 1 mM NO3-, responded to the addition of 10 mM
NH4+ with an approximately threefold increase in 42K+ efflux. Application of 10 mM NH4NO3
also accelerated 42K+ efflux, but to a lesser degree than 10 mM NH4+. Similar responses to high
NH4+ and NH4NO3 were seen at the intermediate [K+]ext values of 0.5 mM and 0.75 mM (not
shown). The shape of the ammonium-stimulated 42K+ efflux trace differed between the 0.1 mM
[K+]ext treatment and the others, however, in that at 0.1 mM it peaked within 2 min, then declined
(Fig. 4A). By contrast, 42K+ efflux at higher [K+]ext rose more slowly and reached a plateau at
which it was sustained for at least 10 min (Fig. 4B). Another key difference between low and
high K+ conditions was that, at 0.1 [K+]ext, the application of 10 mM NO3- suppressed 42K+ efflux
(Fig. 4A), while this treatment had no effect at 1.0 mM [K+]ext (Fig. 4B).
Stimulation of 42K+ efflux by NH4+ was ameliorated by the application of channel-blocking
agents, but the efficacy of each agent depended on external [K+] conditions (insets, Fig. 4A and
23
B). At 0.1 mM [K+]ext, Cs+ was the most potent, reducing efflux to below control levels (as in
Fig. 2A), while TEA+ was nearly as effective (Fig. 4A, inset). By contrast, at 1.0 mM [K+]ext, Cs+
and TEA+ treatments showed a moderate degree of suppression (Fig. 4B, inset). Interestingly,
application of K+ itself (at 10 mM) also suppressed the NH4+-stimulated 42K+ efflux, as strongly
as Cs+ under the 0.1 mM [K+]ext conditions, and more moderately (comparable to TEA+ and Cs+)
under the 1.0 mM condition (not shown). In addition, application of 10 mM Rb+ was nearly as
effective as 10 mM K+ in both high- and low-K+-grown plants.
Direct influx measurements, complementary to efflux runs, were also conducted in relation to
nitrogen source and strength (Fig. 5; values were slightly different from those determined using
efflux analysis, but showed similar trends). Switching from the growth concentration of 1 mM
NO3- to 10 mM NO3
- had opposite effects on low and high-K+ plants, with elevated
NO3- decreasing influx by c. 20% in low-K+ plants, and increasing it in high-K+ plants by c.
70%. Both NH4+ and NH4NO3, provided at 10 mM, decreased influx under both growing
conditions.
It was of interest to investigate the effect on 42K+ efflux of treatments known to disrupt the
energy state of the cell and the plasma membrane. Fig. 6 shows that the metabolic inhibitors
vanadate (VO43-) and cyanide (CN-) increased 42K+ efflux at 0.1 mM [K+]ext, but had little or no
effect at the higher [K+]ext (1.0 mM, Fig. 6, inset). The addition of sodium bicarbonate, which is
known to hyperpolarize the plasma membrane (Poole 1969), at 10 mM caused a suppression of
42K+ efflux at the lower [K+]ext (0.1 mM) but not at the higher [K+]ext (1.0 mM), while increasing
the external pH from 6.3–6.5 to 9.2 had no effect at either [K+]ext.
To test for the involvement of a special class of K+ channels, those regulated by ATP-binding
cassettes (ABCs), in the efflux of K+, we applied a range of compounds known to stimulate the
activity of these proteins (minoxidil, pinacidil, diazoxide; Leonhardt et al. 1997), and one known
to inhibit them (4-aminopyridine). We found that their application did not affect 42K+ efflux in a
statistically significant way, at [K+]ext of 0.1 mM (not shown).
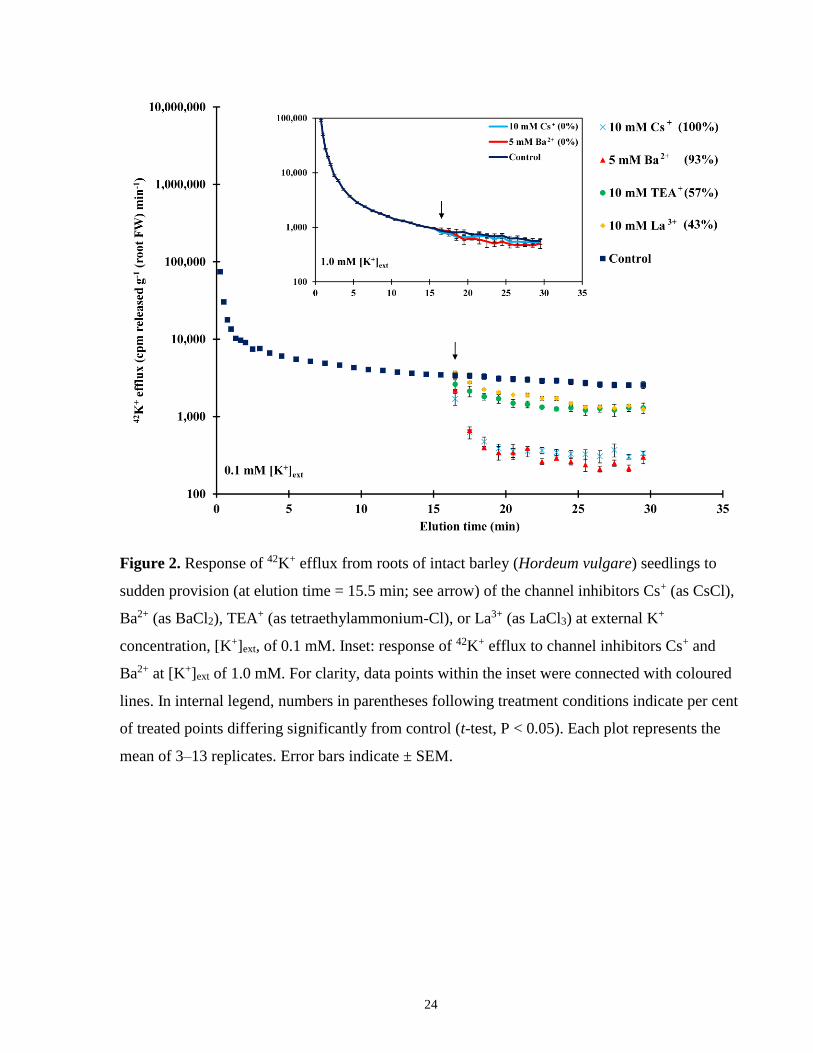
24
Figure 2. Response of 42K+ efflux from roots of intact barley (Hordeum vulgare) seedlings to
sudden provision (at elution time = 15.5 min; see arrow) of the channel inhibitors Cs+ (as CsCl),
Ba2+ (as BaCl2), TEA+ (as tetraethylammonium-Cl), or La3+ (as LaCl3) at external K+
concentration, [K+]ext, of 0.1 mM. Inset: response of 42K+ efflux to channel inhibitors Cs+ and
Ba2+ at [K+]ext of 1.0 mM. For clarity, data points within the inset were connected with coloured
lines. In internal legend, numbers in parentheses following treatment conditions indicate per cent
of treated points differing significantly from control (t-test, P < 0.05). Each plot represents the
mean of 3–13 replicates. Error bars indicate ± SEM.
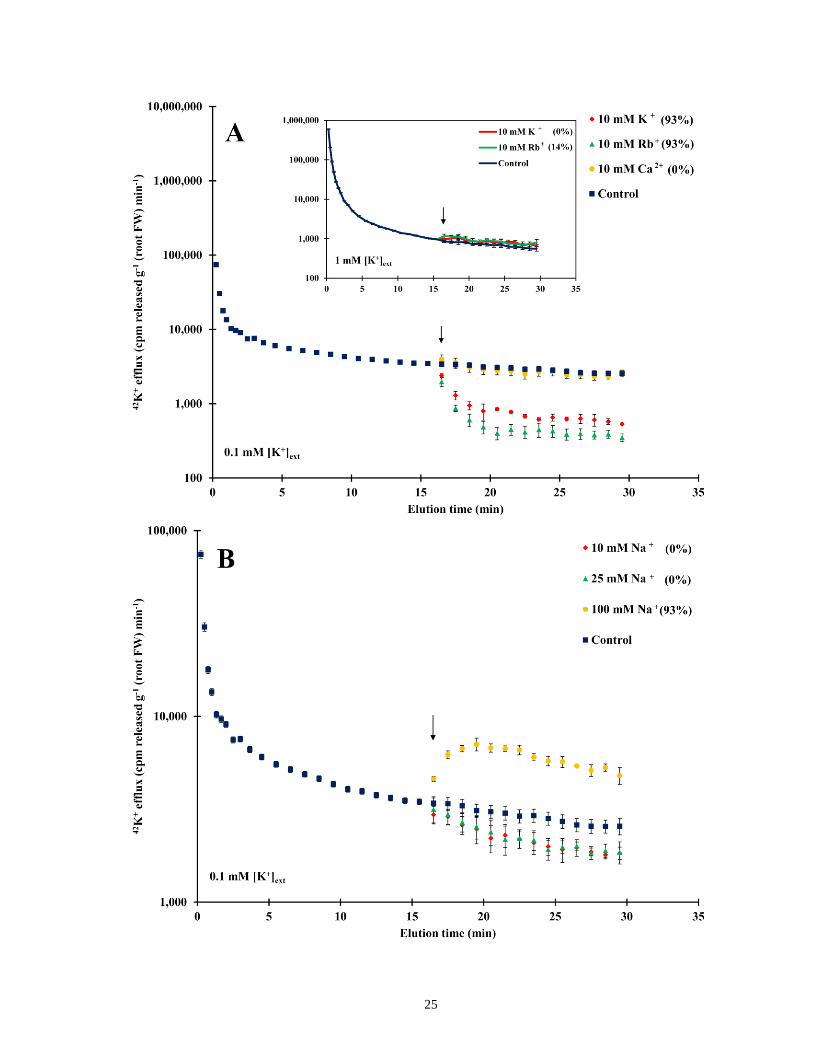
25
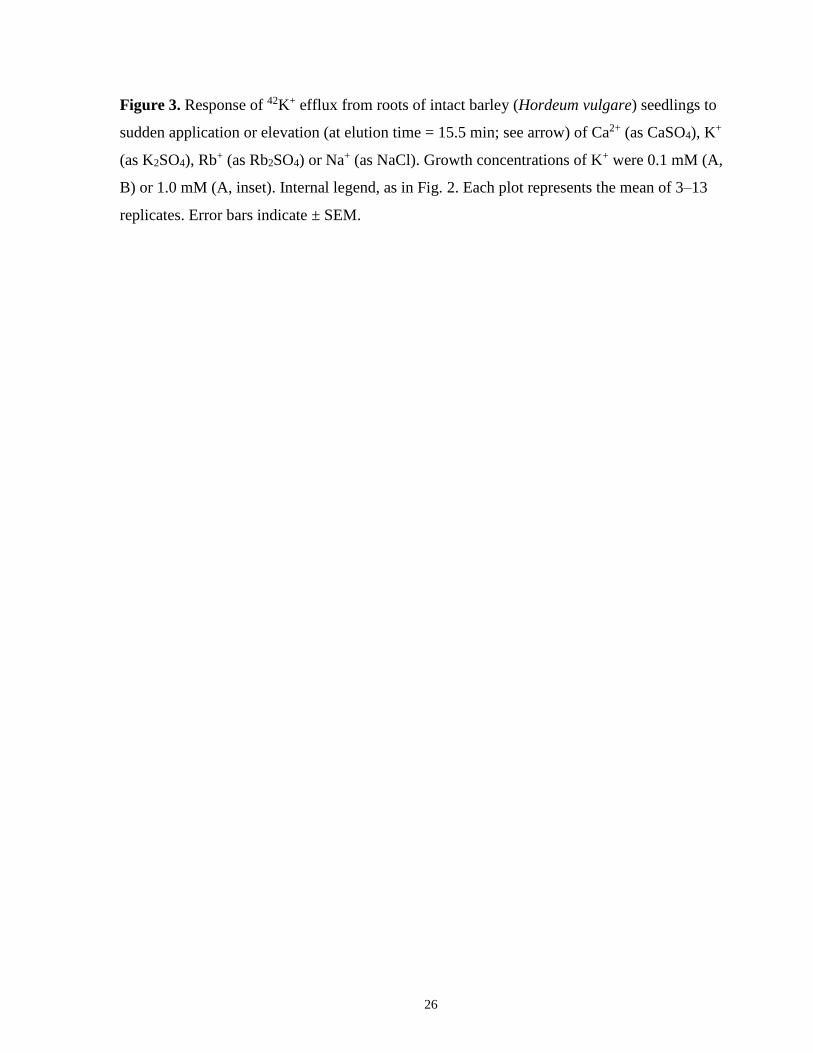
26
Figure 3. Response of 42K+ efflux from roots of intact barley (Hordeum vulgare) seedlings to
sudden application or elevation (at elution time = 15.5 min; see arrow) of Ca2+ (as CaSO4), K+
(as K2SO4), Rb+ (as Rb2SO4) or Na+ (as NaCl). Growth concentrations of K+ were 0.1 mM (A,
B) or 1.0 mM (A, inset). Internal legend, as in Fig. 2. Each plot represents the mean of 3–13
replicates. Error bars indicate ± SEM.
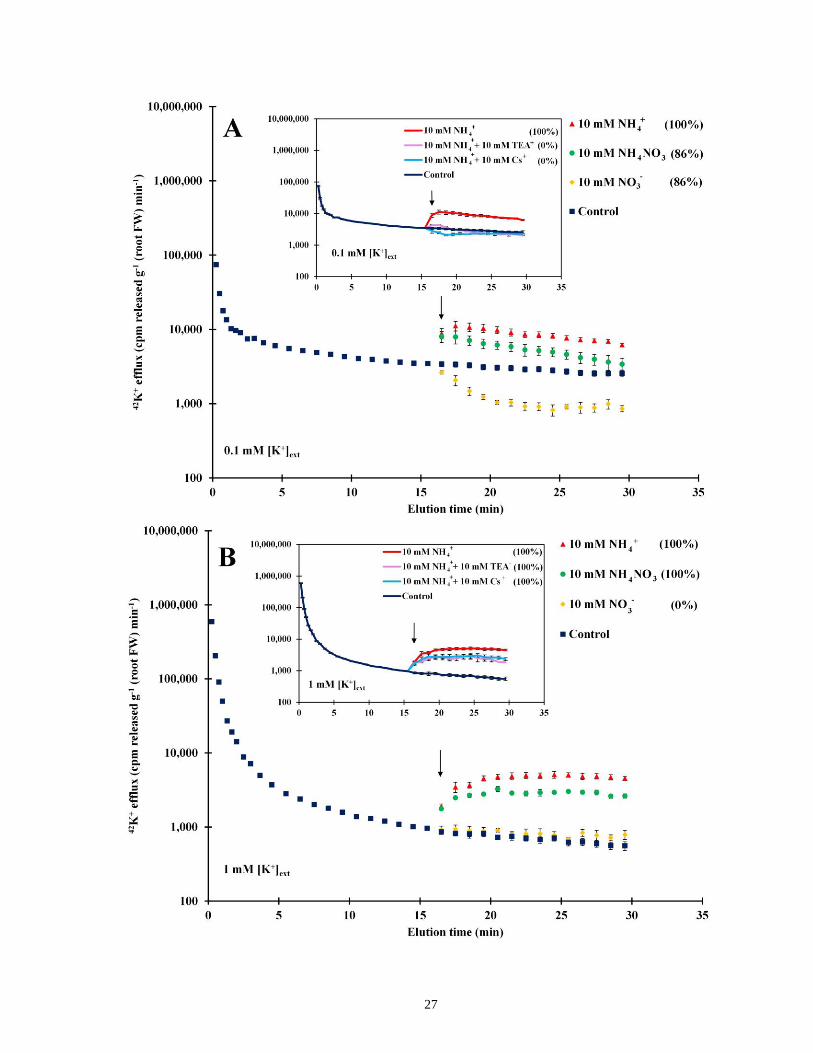
27
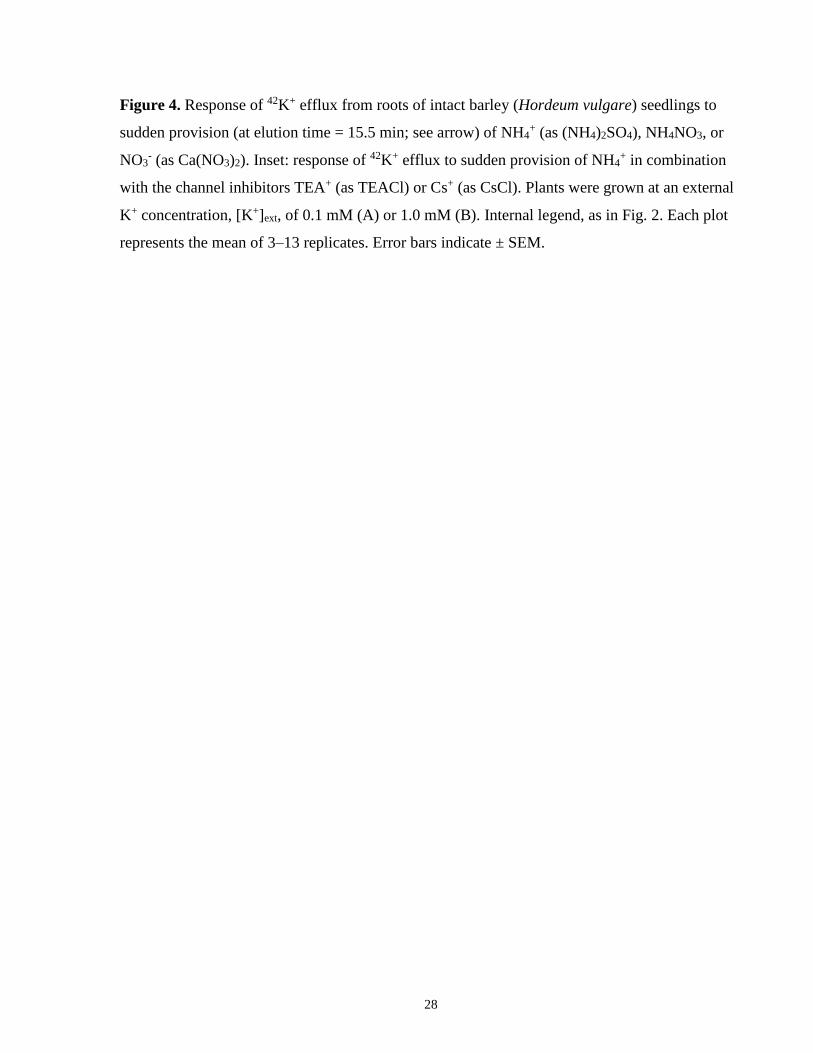
28
Figure 4. Response of 42K+ efflux from roots of intact barley (Hordeum vulgare) seedlings to
sudden provision (at elution time = 15.5 min; see arrow) of NH4+ (as (NH4)2SO4), NH4NO3, or
NO3- (as Ca(NO3)2). Inset: response of 42K+ efflux to sudden provision of NH4
+ in combination
with the channel inhibitors TEA+ (as TEACl) or Cs+ (as CsCl). Plants were grown at an external
K+ concentration, [K+]ext, of 0.1 mM (A) or 1.0 mM (B). Internal legend, as in Fig. 2. Each plot
represents the mean of 3–13 replicates. Error bars indicate ± SEM.
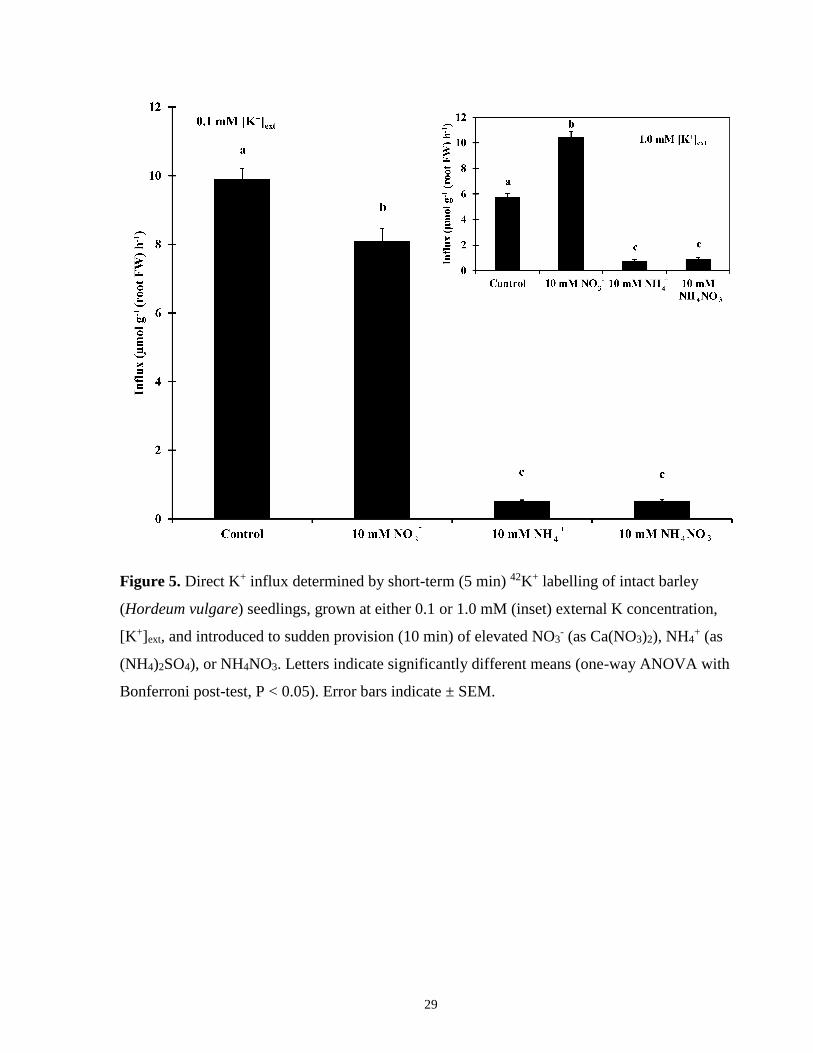
29
Figure 5. Direct K+ influx determined by short-term (5 min) 42K+ labelling of intact barley
(Hordeum vulgare) seedlings, grown at either 0.1 or 1.0 mM (inset) external K concentration,
[K+]ext, and introduced to sudden provision (10 min) of elevated NO3- (as Ca(NO3)2), NH4
+ (as
(NH4)2SO4), or NH4NO3. Letters indicate significantly different means (one-way ANOVA with
Bonferroni post-test, P < 0.05). Error bars indicate ± SEM.
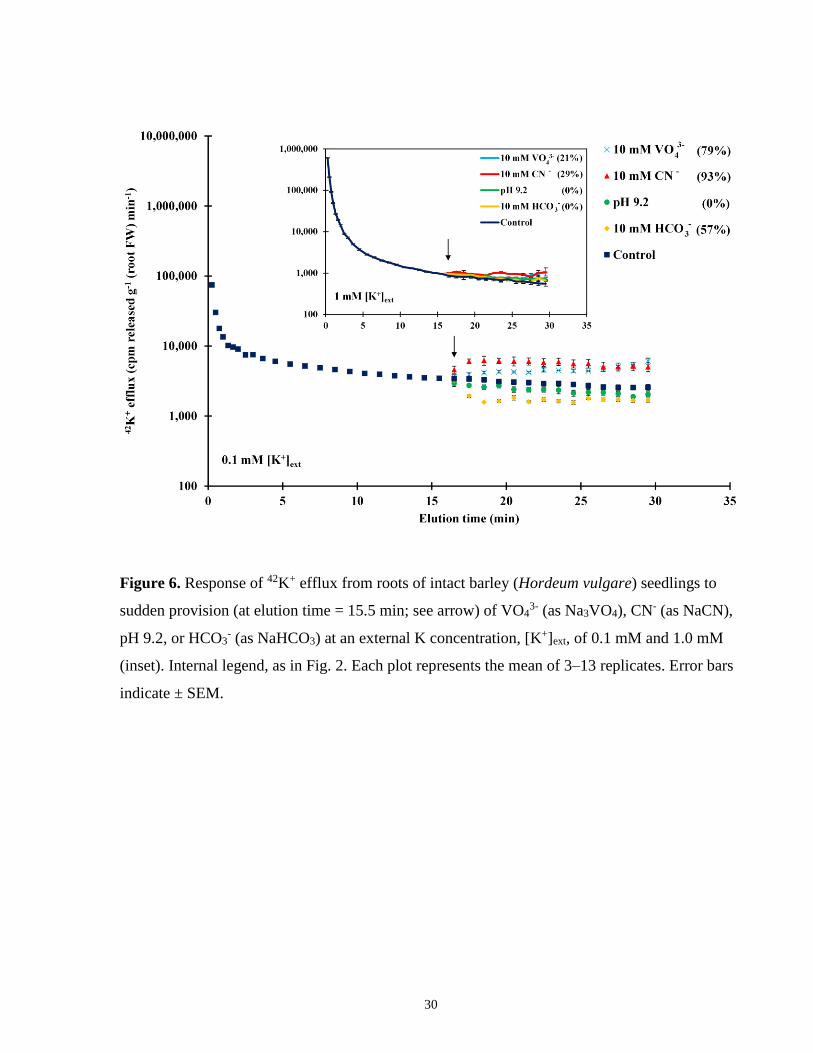
30
Figure 6. Response of 42K+ efflux from roots of intact barley (Hordeum vulgare) seedlings to
sudden provision (at elution time = 15.5 min; see arrow) of VO43- (as Na3VO4), CN- (as NaCN),
pH 9.2, or HCO3- (as NaHCO3) at an external K concentration, [K+]ext, of 0.1 mM and 1.0 mM
(inset). Internal legend, as in Fig. 2. Each plot represents the mean of 3–13 replicates. Error bars
indicate ± SEM.
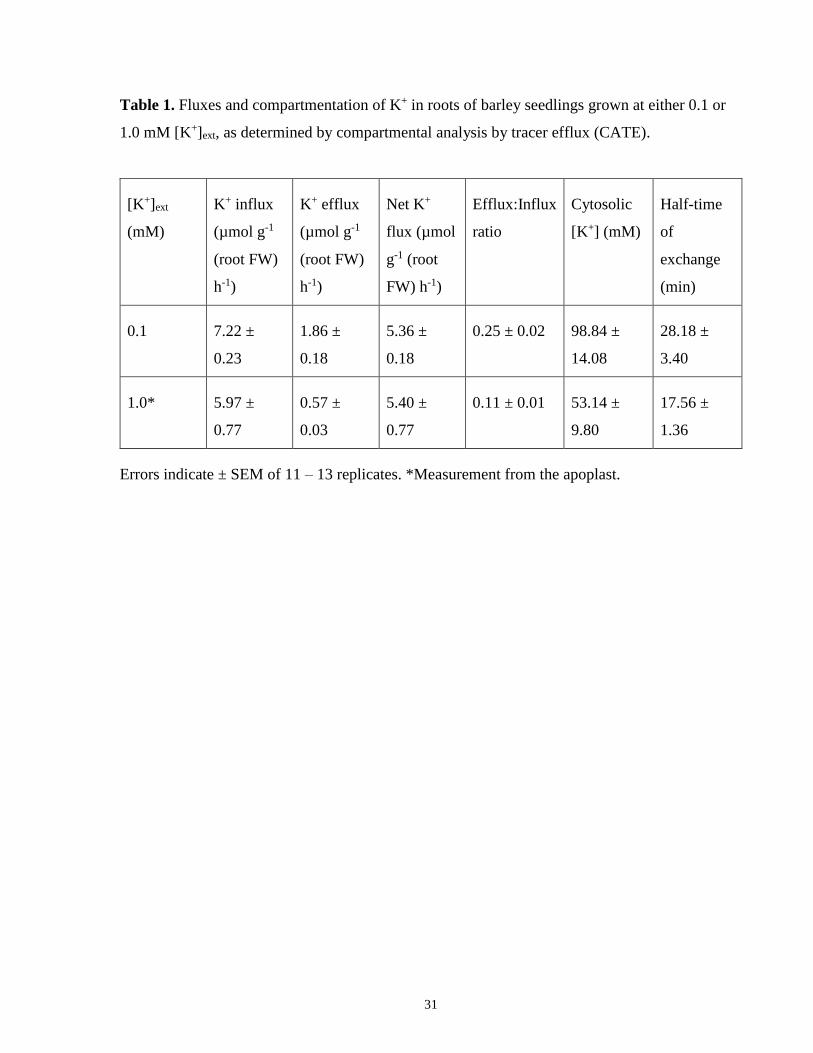
31
Table 1. Fluxes and compartmentation of K+ in roots of barley seedlings grown at either 0.1 or
1.0 mM [K+]ext, as determined by compartmental analysis by tracer efflux (CATE).
[K+]ext
(mM)
K+ influx
(µmol g-1
(root FW)
h-1)
K+ efflux
(µmol g-1
(root FW)
h-1)
Net K+
flux (µmol
g-1 (root
FW) h-1)
Efflux:Influx
ratio
Cytosolic
[K+] (mM)
Half-time
of
exchange
(min)
0.1 7.22 ±
0.23
1.86 ±
0.18
5.36 ±
0.18
0.25 ± 0.02 98.84 ±
14.08
28.18 ±
3.40
1.0* 5.97 ±
0.77
0.57 ±
0.03
5.40 ±
0.77
0.11 ± 0.01 53.14 ±
9.80
17.56 ±
1.36
Errors indicate ± SEM of 11 – 13 replicates. *Measurement from the apoplast.
32
3.1.4 Discussion
Although 42K+ efflux patterns (Fig. 2) and flux parameters (Table 1) were similar among all
control plants, regardless of growth condition, treatment of roots with a wide variety of
physiologically active agents belies these similarities. With rising K+ provision, the efficacy of
treatments inhibiting 42K+ efflux at the lowest [K+]ext of 0.1 mM was progressively reduced (not
shown), until there was very little effect at the highest [K+]ext of 1.0 mM. When comparing the
bracketing conditions of 0.1 and 1.0 mM [K+]ext (referred to subsequently as ‘low-K+’ and ‘high-
K+’, respectively), the difference is clear as the following six treatments had effects on 42K+
efflux under low K+-growth conditions, but none under high K+: Cs+, Ba2+ (Fig. 2), K+ (stepped
up to 10 mM), Rb+ (Fig. 3), NO3- (Fig. 4) and HCO3
- (Fig. 6). In addition, treatment with the
metabolic inhibitors cyanide and vanadate resulted in immediate stimulation of 42K+ efflux at
low K+, but only a weak stimulation at high K+ (Fig. 6).
It is reasonable to conclude from these results that, despite their superficial similarities, the efflux
traces under low-K+ and high-K+ growth conditions represent two distinct phenomena. This idea
is supported by substantial work indicating that the transition between high- and low-affinity K+
transport modes in plant roots typically lies between 0.1 and 1.0 mM [K+]ext (Epstein et al. 1963;
Glass and Dunlop 1978; Kochian and Lucas 1982; Maathuis and Sanders 1995; Kronzucker et al.
2003). Over this range, the thermodynamic conditions change owing to K-induced alterations in
the electrical potential difference across the plasma membrane (Etherton and Higinbotham 1960;
Cheeseman and Hanson 1979a, b; Kochian et al. 1989; Walker et al. 1996b; Szczerba et al.
2006), as well as to changes in the concentration (activity) ratio of K+ across this membrane. The
result is a shift in the mechanism of K+ influx into the cell, from an energetically active system to
one catalysing transport down an electrochemical potential gradient as [K+]ext increases. It is to
be expected, then, that the opposite thermodynamic conditions will apply to the transport of K+
in the efflux direction, from the cell to the external medium. Because many passive transport
functions in biological systems are mediated by ion channels, it is reasonable to suggest that the
42K+ efflux traces at 0.1 mM [K+]ext represent efflux of K+ from the cell down its electrochemical
potential gradient, via outwardly-rectifying, Shaker-type K+ (KOR) channels that have been
identified at a molecular level and have been localized to the plasma membrane (for a review,
see Szczerba et al. 2009). This idea is supported by the efficacy of ‘classic’ K+-channel-blocking
agents TEA+, La3+, Ba2+ and Cs+ (Krol and Trebacz 2000; White and Broadley 2000) in reducing
33
42K+ efflux at low [K+]ext, as depicted in Fig. 2. This inhibition profile parallels that of inward-
rectifying, Shaker-type K+ (KIR) channels (White and Broadley 2000), and agrees with the study
by Roberts and Tester (1995), who showed that TEA+ is not as effective as Cs+ or Ba2+ in
blocking outward, whole-cell, K+ currents in maize root protoplasts. Similarly, the observation
(Fig. 3A) that K+ and Rb+ (when either was provided at 10 mM) suppressed 42K+ efflux in plants
grown at 0.1 mM [K+]ext supports KOR channel involvement, as K+ efflux channels in plants,
rather uniquely, are known to be inhibited by elevated external K+ or Rb+, through cooperative
binding of these ions at regulatory sites distinct from the channel pore (Blatt 1999; Johansson et
al. 2006; Gajdanowicz et al. 2009). Importantly, the observation that Rb+ inhibited 42K+ efflux to
the same extent as elevated K+ indicates that it is not the transmembrane concentration gradient
of K+ that brings about this channel closure, but more likely the regulatory binding of K+, or its
analogue Rb+.
Interestingly, the application of high (10 mM) external Ca2+ had no effect at 0.1 [K+]ext (Fig. 3),
in agreement with the relative Ca2+-insensitivity of K+ channels seen in most
electrophysiological studies (White and Broadley 2000), but in contrast to one class of
nonselective, outward-rectifying channels (NORCs), a hallmark of which is inhibition by low to
intermediate concentrations of Ca2+ (Demidchik and Maathuis 2007). The lack of NORC
involvement in the present study is further supported by the insensitivity to Cs+ and TEA+ of all
classes of NORCs (White and Broadley 2000; Demidchik and Maathuis 2007).
The number of molecular candidates that could account for the observed flux patterns at 0.1 mM
[K+]ext is limited. While several outward-rectifying K+ channels have been identified at the
molecular level in plant roots, none matches the 42K+ efflux profiles reported here. The SKOR
protein, while having an inhibition and gating profile suggestive of the present observations
(Gaymard et al. 1998; Johansson et al. 2006), is an unlikely match because it is localized to
pericycle and xylem parenchyma cells, consistent with its proposed role as a xylem-loading
transporter. Owing to the immature Casparian strip in these young seedlings, however, it is
possible that at least some of the 42K+ is released from stelar cells and may diffuse to the external
medium via the apoplast. The guard-cell channel GORK, while predominantly expressed in
leaves, has also been detected in epidermal root hairs, but was found to be unaffected by 10 mM
Cs+ (Ivashikina et al. 2001), thus also disqualifying it as a major conductor of the observed flux
in the present study. Similarly, Diatloff et al. (2004) examined outward-rectifying channels in
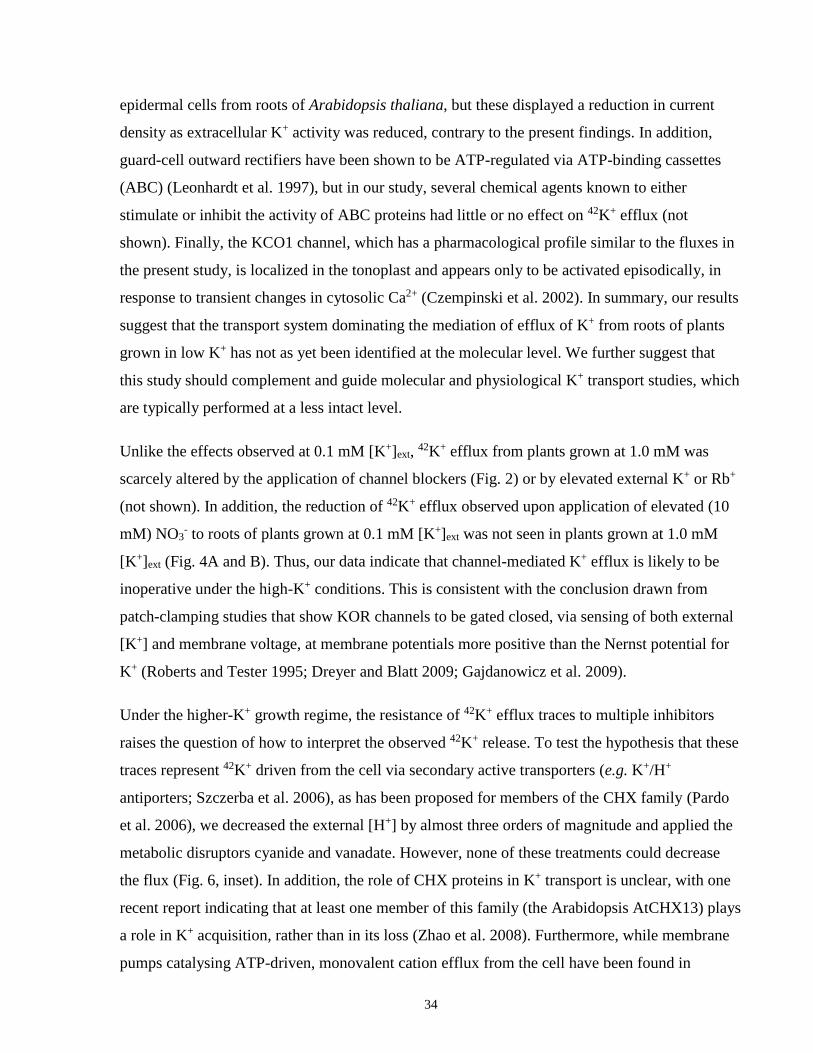
34
epidermal cells from roots of Arabidopsis thaliana, but these displayed a reduction in current
density as extracellular K+ activity was reduced, contrary to the present findings. In addition,
guard-cell outward rectifiers have been shown to be ATP-regulated via ATP-binding cassettes
(ABC) (Leonhardt et al. 1997), but in our study, several chemical agents known to either
stimulate or inhibit the activity of ABC proteins had little or no effect on 42K+ efflux (not
shown). Finally, the KCO1 channel, which has a pharmacological profile similar to the fluxes in
the present study, is localized in the tonoplast and appears only to be activated episodically, in
response to transient changes in cytosolic Ca2+ (Czempinski et al. 2002). In summary, our results
suggest that the transport system dominating the mediation of efflux of K+ from roots of plants
grown in low K+ has not as yet been identified at the molecular level. We further suggest that
this study should complement and guide molecular and physiological K+ transport studies, which
are typically performed at a less intact level.
Unlike the effects observed at 0.1 mM [K+]ext, 42K+ efflux from plants grown at 1.0 mM was
scarcely altered by the application of channel blockers (Fig. 2) or by elevated external K+ or Rb+
(not shown). In addition, the reduction of 42K+ efflux observed upon application of elevated (10
mM) NO3- to roots of plants grown at 0.1 mM [K+]ext was not seen in plants grown at 1.0 mM
[K+]ext (Fig. 4A and B). Thus, our data indicate that channel-mediated K+ efflux is likely to be
inoperative under the high-K+ conditions. This is consistent with the conclusion drawn from
patch-clamping studies that show KOR channels to be gated closed, via sensing of both external
[K+] and membrane voltage, at membrane potentials more positive than the Nernst potential for
K+ (Roberts and Tester 1995; Dreyer and Blatt 2009; Gajdanowicz et al. 2009).
Under the higher-K+ growth regime, the resistance of 42K+ efflux traces to multiple inhibitors
raises the question of how to interpret the observed 42K+ release. To test the hypothesis that these
traces represent 42K+ driven from the cell via secondary active transporters (e.g. K+/H+
antiporters; Szczerba et al. 2006), as has been proposed for members of the CHX family (Pardo
et al. 2006), we decreased the external [H+] by almost three orders of magnitude and applied the
metabolic disruptors cyanide and vanadate. However, none of these treatments could decrease
the flux (Fig. 6, inset). In addition, the role of CHX proteins in K+ transport is unclear, with one
recent report indicating that at least one member of this family (the Arabidopsis AtCHX13) plays
a role in K+ acquisition, rather than in its loss (Zhao et al. 2008). Furthermore, while membrane
pumps catalysing ATP-driven, monovalent cation efflux from the cell have been found in
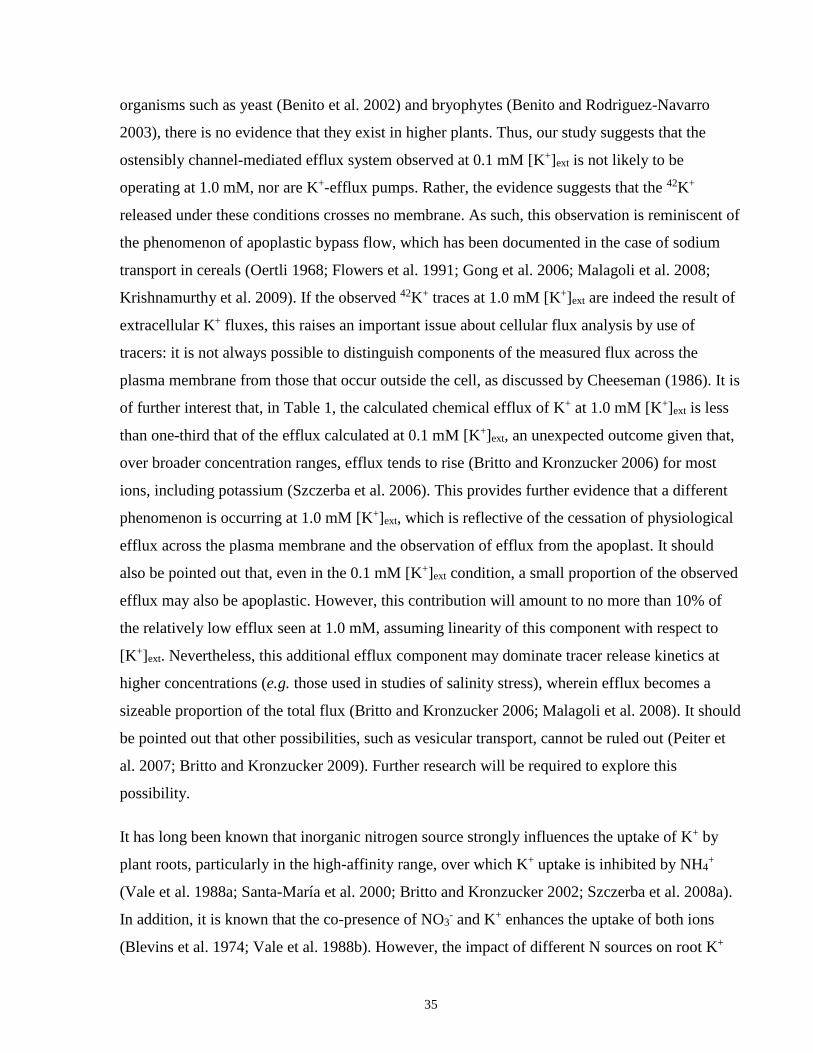
35
organisms such as yeast (Benito et al. 2002) and bryophytes (Benito and Rodriguez-Navarro
2003), there is no evidence that they exist in higher plants. Thus, our study suggests that the
ostensibly channel-mediated efflux system observed at 0.1 mM [K+]ext is not likely to be
operating at 1.0 mM, nor are K+-efflux pumps. Rather, the evidence suggests that the 42K+
released under these conditions crosses no membrane. As such, this observation is reminiscent of
the phenomenon of apoplastic bypass flow, which has been documented in the case of sodium
transport in cereals (Oertli 1968; Flowers et al. 1991; Gong et al. 2006; Malagoli et al. 2008;
Krishnamurthy et al. 2009). If the observed 42K+ traces at 1.0 mM [K+]ext are indeed the result of
extracellular K+ fluxes, this raises an important issue about cellular flux analysis by use of
tracers: it is not always possible to distinguish components of the measured flux across the
plasma membrane from those that occur outside the cell, as discussed by Cheeseman (1986). It is
of further interest that, in Table 1, the calculated chemical efflux of K+ at 1.0 mM [K+]ext is less
than one-third that of the efflux calculated at 0.1 mM [K+]ext, an unexpected outcome given that,
over broader concentration ranges, efflux tends to rise (Britto and Kronzucker 2006) for most
ions, including potassium (Szczerba et al. 2006). This provides further evidence that a different
phenomenon is occurring at 1.0 mM [K+]ext, which is reflective of the cessation of physiological
efflux across the plasma membrane and the observation of efflux from the apoplast. It should
also be pointed out that, even in the 0.1 mM [K+]ext condition, a small proportion of the observed
efflux may also be apoplastic. However, this contribution will amount to no more than 10% of
the relatively low efflux seen at 1.0 mM, assuming linearity of this component with respect to
[K+]ext. Nevertheless, this additional efflux component may dominate tracer release kinetics at
higher concentrations (e.g. those used in studies of salinity stress), wherein efflux becomes a
sizeable proportion of the total flux (Britto and Kronzucker 2006; Malagoli et al. 2008). It should
be pointed out that other possibilities, such as vesicular transport, cannot be ruled out (Peiter et
al. 2007; Britto and Kronzucker 2009). Further research will be required to explore this
possibility.
It has long been known that inorganic nitrogen source strongly influences the uptake of K+ by
plant roots, particularly in the high-affinity range, over which K+ uptake is inhibited by NH4+
(Vale et al. 1988a; Santa-María et al. 2000; Britto and Kronzucker 2002; Szczerba et al. 2008a).
In addition, it is known that the co-presence of NO3- and K+ enhances the uptake of both ions
(Blevins et al. 1974; Vale et al. 1988b). However, the impact of different N sources on root K+
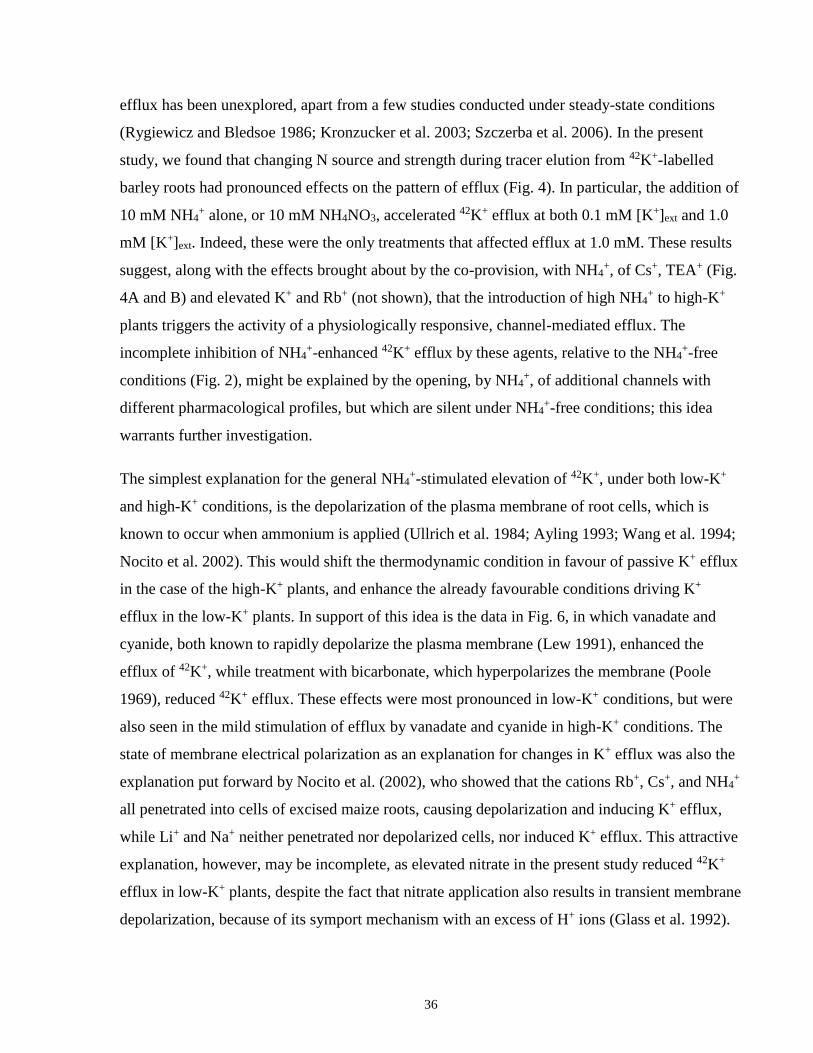
36
efflux has been unexplored, apart from a few studies conducted under steady-state conditions
(Rygiewicz and Bledsoe 1986; Kronzucker et al. 2003; Szczerba et al. 2006). In the present
study, we found that changing N source and strength during tracer elution from 42K+-labelled
barley roots had pronounced effects on the pattern of efflux (Fig. 4). In particular, the addition of
10 mM NH4+ alone, or 10 mM NH4NO3, accelerated 42K+ efflux at both 0.1 mM [K+]ext and 1.0
mM [K+]ext. Indeed, these were the only treatments that affected efflux at 1.0 mM. These results
suggest, along with the effects brought about by the co-provision, with NH4+, of Cs+, TEA+ (Fig.
4A and B) and elevated K+ and Rb+ (not shown), that the introduction of high NH4+ to high-K+
plants triggers the activity of a physiologically responsive, channel-mediated efflux. The
incomplete inhibition of NH4+-enhanced 42K+ efflux by these agents, relative to the NH4
+-free
conditions (Fig. 2), might be explained by the opening, by NH4+, of additional channels with
different pharmacological profiles, but which are silent under NH4+-free conditions; this idea
warrants further investigation.
The simplest explanation for the general NH4+-stimulated elevation of 42K+, under both low-K+
and high-K+ conditions, is the depolarization of the plasma membrane of root cells, which is
known to occur when ammonium is applied (Ullrich et al. 1984; Ayling 1993; Wang et al. 1994;
Nocito et al. 2002). This would shift the thermodynamic condition in favour of passive K+ efflux
in the case of the high-K+ plants, and enhance the already favourable conditions driving K+
efflux in the low-K+ plants. In support of this idea is the data in Fig. 6, in which vanadate and
cyanide, both known to rapidly depolarize the plasma membrane (Lew 1991), enhanced the
efflux of 42K+, while treatment with bicarbonate, which hyperpolarizes the membrane (Poole
1969), reduced 42K+ efflux. These effects were most pronounced in low-K+ conditions, but were
also seen in the mild stimulation of efflux by vanadate and cyanide in high-K+ conditions. The
state of membrane electrical polarization as an explanation for changes in K+ efflux was also the
explanation put forward by Nocito et al. (2002), who showed that the cations Rb+, Cs+, and NH4+
all penetrated into cells of excised maize roots, causing depolarization and inducing K+ efflux,
while Li+ and Na+ neither penetrated nor depolarized cells, nor induced K+ efflux. This attractive
explanation, however, may be incomplete, as elevated nitrate in the present study reduced 42K+
efflux in low-K+ plants, despite the fact that nitrate application also results in transient membrane
depolarization, because of its symport mechanism with an excess of H+ ions (Glass et al. 1992).
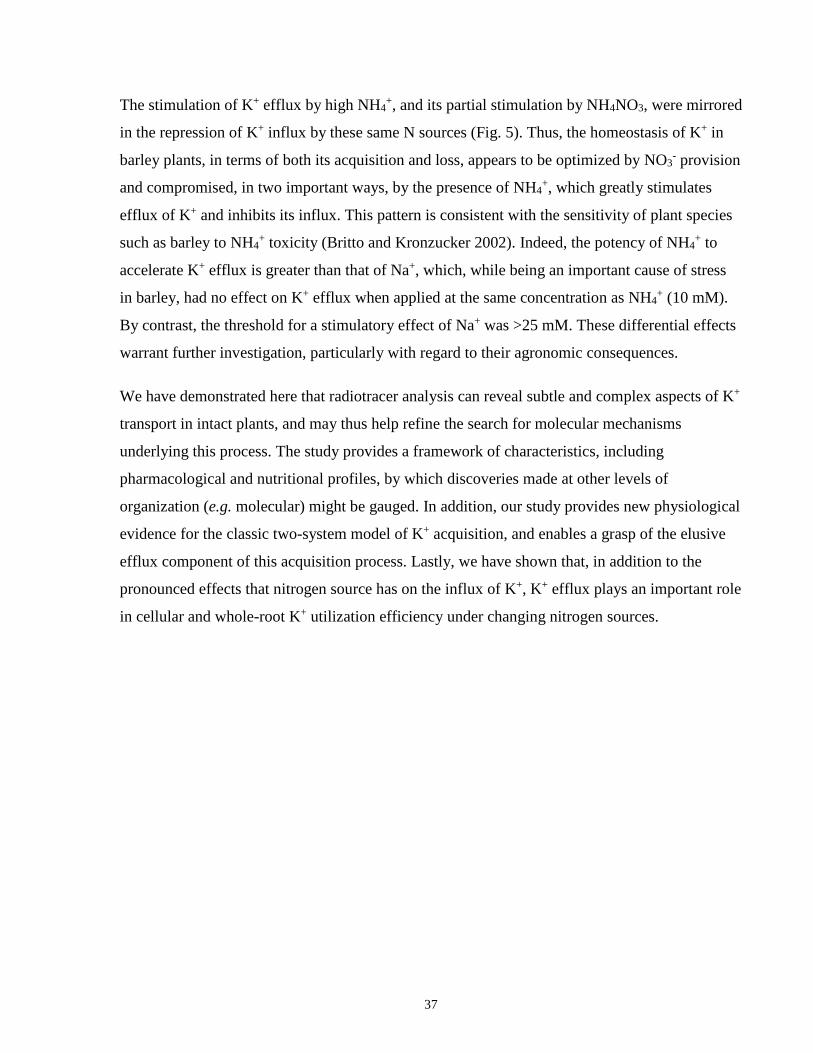
37
The stimulation of K+ efflux by high NH4+, and its partial stimulation by NH4NO3, were mirrored
in the repression of K+ influx by these same N sources (Fig. 5). Thus, the homeostasis of K+ in
barley plants, in terms of both its acquisition and loss, appears to be optimized by NO3- provision
and compromised, in two important ways, by the presence of NH4+, which greatly stimulates
efflux of K+ and inhibits its influx. This pattern is consistent with the sensitivity of plant species
such as barley to NH4+ toxicity (Britto and Kronzucker 2002). Indeed, the potency of NH4
+ to
accelerate K+ efflux is greater than that of Na+, which, while being an important cause of stress
in barley, had no effect on K+ efflux when applied at the same concentration as NH4+ (10 mM).
By contrast, the threshold for a stimulatory effect of Na+ was >25 mM. These differential effects
warrant further investigation, particularly with regard to their agronomic consequences.
We have demonstrated here that radiotracer analysis can reveal subtle and complex aspects of K+
transport in intact plants, and may thus help refine the search for molecular mechanisms
underlying this process. The study provides a framework of characteristics, including
pharmacological and nutritional profiles, by which discoveries made at other levels of
organization (e.g. molecular) might be gauged. In addition, our study provides new physiological
evidence for the classic two-system model of K+ acquisition, and enables a grasp of the elusive
efflux component of this acquisition process. Lastly, we have shown that, in addition to the
pronounced effects that nitrogen source has on the influx of K+, K+ efflux plays an important role
in cellular and whole-root K+ utilization efficiency under changing nitrogen sources.
38
K+ Efflux and Retention in Response to NaCl Stress do not Predict Salt Tolerance in Contrasting Genotypes of Rice (Oryza sativa L.)
Preface
A modified version of this subchapter was published as: Coskun D, Britto DT, Jean Y-K, Kabir
I, Tolay I, Torun AA, Kronzucker HJ (2013) K+ efflux and retention in response to NaCl stress
do not predict salt tolerance in contrasting genotypes of rice (Oryza sativa L.). PLOS ONE 8,
e57767. Supplemental material cited in this subchapter can be found online:
http://journals.plos.org/plosone/article?id=10.1371/journal.pone.0057767.
HJ Kronzucker designed the study, with input from DT Britto and D Coskun. D Coskun
performed the experiments, with input from Y-K Jean, I Kabir, I Tolay, and AA Torun. D
Coskun analyzed the data, with input from DT Britto and HJ Kronzucker. D Coskun wrote the
manuscript, with input and editing from DT Britto and HJ Kronzucker.
3.2.1 Abstract
Sudden elevations in external sodium chloride (NaCl) accelerate potassium (K+) efflux across the
plasma membrane of plant root cells. It has been proposed that the extent of this acceleration can
predict salt tolerance among contrasting cultivars. However, this proposal has not been
considered in the context of plant nutritional history, nor has it been explored in rice (Oryza
sativa L.), which stands among the world’s most important and salt-sensitive crop species. Using
efflux analysis with 42K, coupled with growth and tissue K+ analyses, we examined the short-
and long-term effects of NaCl exposure to plant performance within a nutritional matrix that
significantly altered tissue-K+ set points in three rice cultivars that differ in salt tolerance: IR29
(sensitive), IR72 (moderate), and Pokkali (tolerant). We show that total short-term K+ release
from roots in response to NaCl stress is small (no more than 26% over 45 min) in rice. Despite
strong varietal differences, the extent of efflux is shown to be a poor predictor of plant
performance on long-term NaCl stress. In fact, no measure of K+ status was found to correlate
with plant performance among cultivars either in the presence or absence of NaCl stress. By
contrast, shoot Na+ accumulation showed the strongest correlation (a negative one) with biomass,
39
under long-term salinity. Pharmacological evidence suggests that NaCl-induced K+ efflux is a
result of membrane disintegrity, possibly as result of osmotic shock, and not due to ion-channel
mediation. Taken together, we conclude that, in rice, K+ status (including efflux) is a poor
predictor of salt tolerance and overall plant performance and, instead, shoot Na+ accumulation is
the key factor in performance decline on NaCl stress.
3.2.2 Introduction
Soil salinity, predominantly in the form of NaCl, is a major agricultural issue, particularly in
irrigated areas (Flowers 1999; Zhu 2001), where as much as one third of the world’s food
production takes place and nearly half of the land is afflicted (Munns 2002; and references
therein). In plants, one of the major consequences of salinity stress is a disruption in cellular and
whole-plant K+ homeostasis (Rains and Epstein 1967; Maathuis and Amtmann 1999; Shabala
and Cuin 2008; Kronzucker and Britto 2011). Potassium is critical to the proper functioning of
plant cells for reasons that include charge balancing in the cytoplasm, enzyme activation, and the
maintenance of cell turgor (Britto and Kronzucker 2008; Szczerba et al. 2009). Importantly, Na+
has been shown to disturb the transport processes of K+ across the plasma membrane,
specifically in root epidermal and cortical cells where Na+ is first encountered, by inhibiting the
primary uptake of K+ as well as stimulating its cellular release (Epstein et al. 1963; Kochian et
al. 1985; Kronzucker et al. 2006; Shabala et al. 2006; Britto et al. 2010).
The phenomenon of NaCl-stimulated K+ efflux in roots has been of much recent interest, and
some controversy exists regarding its underlying mechanism. Some reports have described the
effect as predominantly a channel-mediated phenomenon, where it is postulated that membrane
depolarization due to Na+ entry (possibly via non-selective cation channels, NSCCs) results in
the opening of voltage-gated, outward-rectifying K+ channels (Shabala et al. 2006). An
alternative explanation is that high amounts of NaCl compromises the integrity of the plasma
membrane, due to ionic and osmotic effects, resulting in release of cellular contents, including
K+ (Nassery 1979; Cramer et al. 1985; Britto et al. 2010). Understanding this phenomenon
would provide important insight into uncovering the elusive nature of salt toxicity (Zhang et al.
2010; Kronzucker and Britto 2011), and would allow for critical assessment of the relevance of
stimulated K+ efflux to other aspects of salt stress, such as the inhibition of primary K+ uptake,
40
cytosolic K+:Na+ ratios, primary Na+ uptake, and shoot Na+ accumulation (Maathuis and
Amtmann 1999; Munns and Tester 2008; Britto et al. 2010; Kronzucker and Britto 2011;
Schulze et al. 2012).
The development of salt-tolerant genotypes to meet increasing global food demands relies on
effective and efficient screening methods for salt tolerance among crops (Yeo et al. 1990; Chen
et al. 2005; Cuin et al. 2008; Faiyue et al. 2012). Recently, it has been proposed that assaying
NaCl-stimulated K+ efflux in seedling roots can be one such method, as negative correlations in
barley and wheat were found between the magnitude of K+ efflux and physiological
measures/yield data in mature plants used to identify salt tolerance (Chen et al. 2005, 2007; Cuin
et al. 2008). This proposal, however, has not been explored in the chief crop species, rice (Oryza
sativa L.), which ranks among the most salt-sensitive crops (Yeo et al. 1990; Shannon et al.
1998; Lee et al. 2003; Ismail et al. 2007; Munns and Tester 2008). Furthermore, it has not been
considered in the context of the nutritional conditions under which the plants have been reared.
Studies on the effects of nitrogen (N) source (i.e., ammonium (NH4+) vs. nitrate (NO3
-)) have
reported greater sensitivity of crops to salinity when NH4+ was the sole nitrogen form supplied
(Lewis et al. 1989; Speer et al. 1994; Speer and Kaiser 1994; Frechilla et al. 2001). By contrast,
others have shown salinity effects to be independent of N source (Bourgeais-Chaillou et al.
1992), or have reported greater sensitivity when NO3- was the sole N source (Botella et al. 1997).
Moreover, it has been shown that K+ fluxes and cellular compartmentation can depend
significantly on external N source and strength (Kronzucker et al. 2003; Coskun et al. 2010).
Lastly, the application of exogenous K+ to alleviate plants from salinity stress is well
documented (Lopez and Satti 1996; Grattan and Grieve 1999; Achilea 2002; Cakmak 2005).
Thus, it is conceivable that the extent of NaCl-stimulated K+ efflux can differ significantly
depending on growth history, particularly with respect to K+ and N nutrition, and should be
critically considered before broader conclusions are drawn regarding the utility of such a
screening tool.
In the present study, we tested the hypothesis that the extent of K+ efflux upon short-term
exposure to NaCl can predict plant performance on long-term NaCl stress in three cultivars of
rice that differ in salt sensitivity: IR29 (sensitive), IR72 (moderate), and Pokkali (tolerant). Plants
were grown under eight nutritional regimes varying in N source (NH4+ vs. NO3
-), N strength (0.1
vs. 10 mM), and K+ strength (0.1 vs. 1.5 mM), to investigate the effects of these two key
41
macronutrients to K+ status and growth, in relation to performance on short- and long-term NaCl
stress. Responses to short-term NaCl stress that were considered include: (1) peak NaCl-
stimulated K+ efflux, (2) cytosolic K+ release, and (3) total root K+ loss. Measures of long-term
NaCl stress include: (1) survival, (2) biomass, (3) tissue K+ content, and (4) tissue Na+ content.
We show that, surprisingly, no measure of K+ fluxes or accumulation could predict plant
performance in the presence or absence of NaCl stress, and that instead, shoot Na+ content was
the best indicator of performance on high salinity, albeit after the fact.
3.2.3 Results
Fig. 7 shows the release kinetics of 42K+ from roots of intact, pre-labeled, rice seedlings, and
their response to sudden application of 160 mM NaCl (at t = 15.5 min, see arrow), in three
cultivars that differ in salt tolerance: IR29 (sensitive), IR72 (moderate), and Pokkali (tolerant).
Seedlings were grown and measured under eight nutritional conditions that varied in N source
(NH4+ or NO3
-), N strength (0.1 or 10 mM, referred to as ‘low’ and ‘high’, respectively), and K+
strength (0.1 or 1.5 mM, also referred to as ‘low’ and high’), which had considerable effects on
plant biomass and tissue K+ content (Tables 2, 3, 4, 5, also see below).
As was previously shown in barley (Britto et al. 2010), sudden exposure of roots to 160 mM
NaCl caused an immediate stimulation of 42K+ efflux in rice seedlings. This response was
observed in all cultivars, regardless of growth condition (Fig. 7). We should note, however, that
this response was not observed at lower [NaCl] (i.e. 25–75 mM; Fig. S1), although 50 mM NaCl
was effective at suppressing growth in all three cultivars (see below). Salt-tolerant Pokkali
displayed lower NaCl-stimulated K+ efflux, relative to the other cultivars, in terms of both peak
efflux and an integration of all 42K+ released during elution (Table 6), under all growth
conditions except for low K+, high NH4+ (Fig. 7D). By contrast, although IR72 displayed
intermediate salt sensitivity (as measured by survival, biomass decline, and shoot Na+ content;
Tables 2, 3, 4, 5), this was not generally reflected in the extent of NaCl-stimulated K+ efflux. In
fact, only under low nitrate conditions did efflux in IR72 fall between that of IR29 and Pokkali
(Fig. 7B and F).
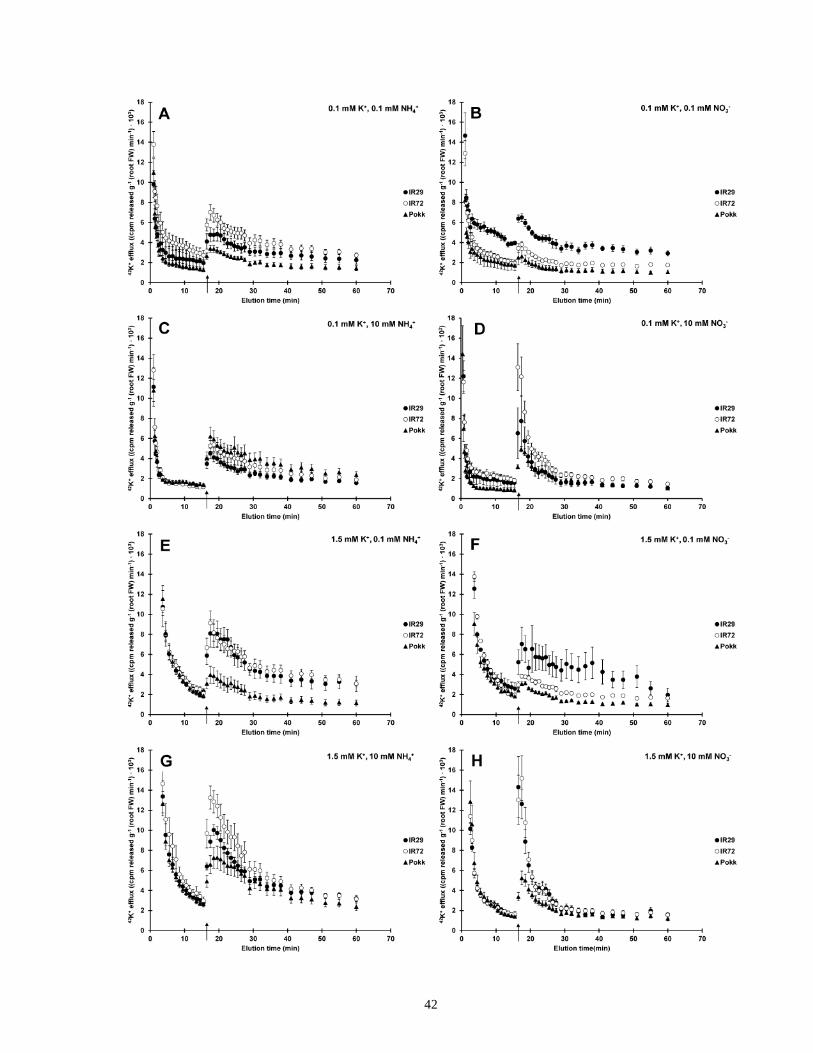
42
43
Figure 7. Nutritional and cultivar comparisons of NaCl-stimulated K+ efflux. Cultivar
differences in 42K+ efflux from roots of intact rice (Oryza sativa L. cvs. ‘IR29’, ‘IR72’, and
‘Pokkali’) in response to sudden provision (at t = 15.5 min, see arrow) of 160 mM NaCl.
Seedlings were grown and tested in a full-nutrient medium supplemented with either 0.1 (A – D)
or 1.5 mM K+ (E – H), and one of four N regimes: 0.1 mM NH4+ (A, E), 0.1 mM NO3
- (B, F), 10
mM NH4+ (C, G), and 10 mM NO3
- (D, H). Error bars indicate ± SEM.
44
Fig. 8 illustrates the sensitivity of NaCl-stimulated K+ efflux in IR72 to selected ion channel
inhibitors. Under the conditions tested, NaCl-stimulated K+ efflux showed no sensitivity to Cs+, a
potent inhibitor of K+ channels, including outward-rectifying K+ channels (Roberts and Tester
1995; Coskun et al. 2010; see also Subchapter 3.1). By contrast, NaCl-stimulated K+ efflux
displayed significant sensitivity to added Ca2+, which is known to both inhibit NSCCs (Roberts
and Tester 1997; Tyerman et al. 1997; Davenport and Tester 2000) and stabilize membranes
(Cramer et al. 1985; Rengel 1992; Kinraide 1999). This was particularly noticeable under low-
K+ conditions (Fig. 8A).
Total K+ content of roots before and after short-term NaCl stress (45-min exposure to 160 mM
NaCl) showed relatively little decline (Fig. 9). No more than 20 µmol K+ g-1 FW were lost (see
IR72 at high K+, high NO3-; Table 6), which amounted to a maximal decline of 26% compared to
control (~78 µmol g-1; Fig. 9, Table 5). These losses were considerably smaller than the
differences in root K+ content among cultivars in the absence of NaCl stress, where amounts
ranged between 24 µmol g-1 FW (at low K+, high NH4+) and 112 µmol g-1 FW (high K+, low
NH4+) (Fig. 9; Table 2 and Table 4, respectively). In the presence of long-term NaCl stress, root
K+ content ranged from 18 to 52 µmol g-1 FW, depending on growth history, amounting to a
maximal decline of 70% compared to control (see IR72 at low K+, low NH4+; Table 2).
No measure of K+ status could predict plant performance either in the presence or absence of
NaCl stress. When combining data from all cultivars and conditions, neither root nor shoot K+
content showed a correlation with FW in the absence (Fig. 10A) or presence (Fig. 10B) of long-
term NaCl stress. Moreover, no general relationship was found between plant performance under
long-term NaCl stress and the magnitudes of NaCl-stimulated peak K+ efflux, integrated K+
efflux or root K+ decline (Table S1). In fact, in only one scenario could a strong negative
correlation (R2 >0.94) be found between peak K+ efflux and tissue biomass under long-term
NaCl stress (Fig. 11B, inset: roots at high K+). No correlations were found under low K+
conditions for Pokkali (Fig. 11B), and surprisingly, significant positive correlations were found
for both shoot and root tissue for IR72 at both K+ levels (Fig. 11A).
In contrast to these findings with K+, shoot Na+ content showed a strong negative correlation (R2
= 0.77) with shoot biomass under long-term NaCl stress (Fig. 10C). This was not the case for
root tissue (Fig. 10C, inset).
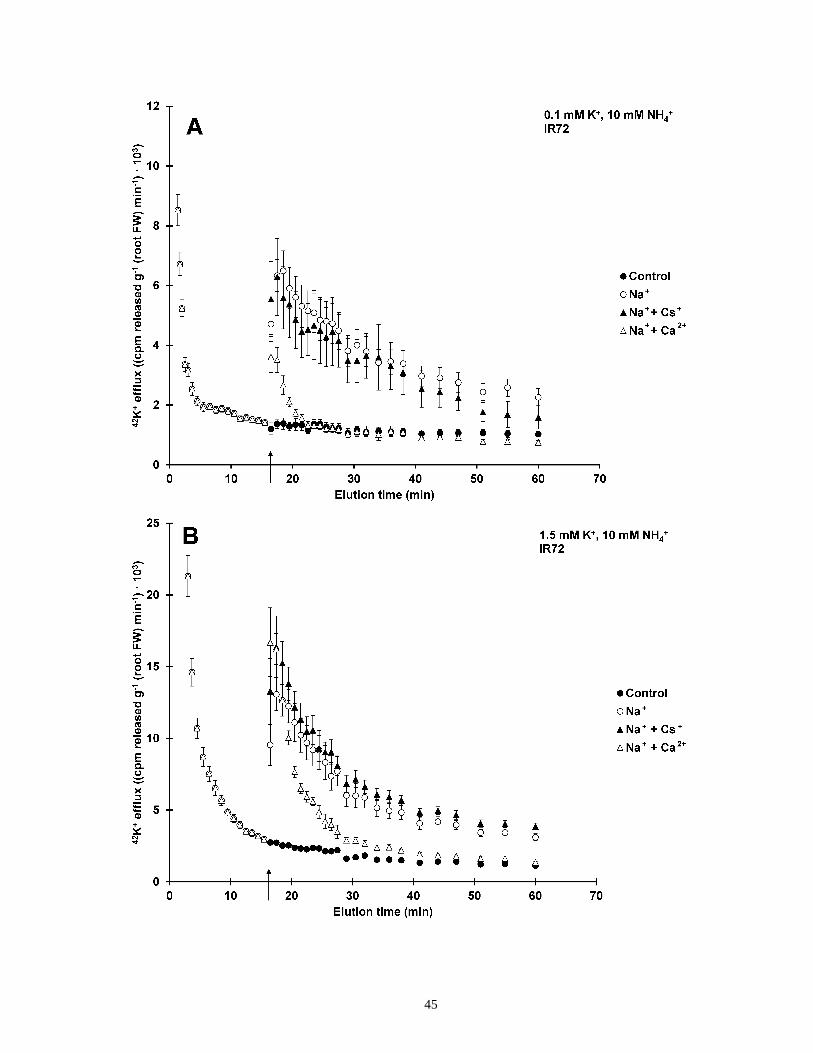
45

46
Figure 8. Inhibitor effects of NaCl-stimulated K+ efflux. The effect of co-application of 10 mM
CsCl or CaCl2 with sudden provision (at t = 15.5 min, see arrow) of 160 mM NaCl on the
response of 42K+ efflux from roots of intact rice (Oryza sativa L.) in the cultivar IR72. External
N source was supplied as 10 mM NH4+ and K+ at either 0.1 (A) or 1.5 mM (B). Error bars
indicate ± SEM.
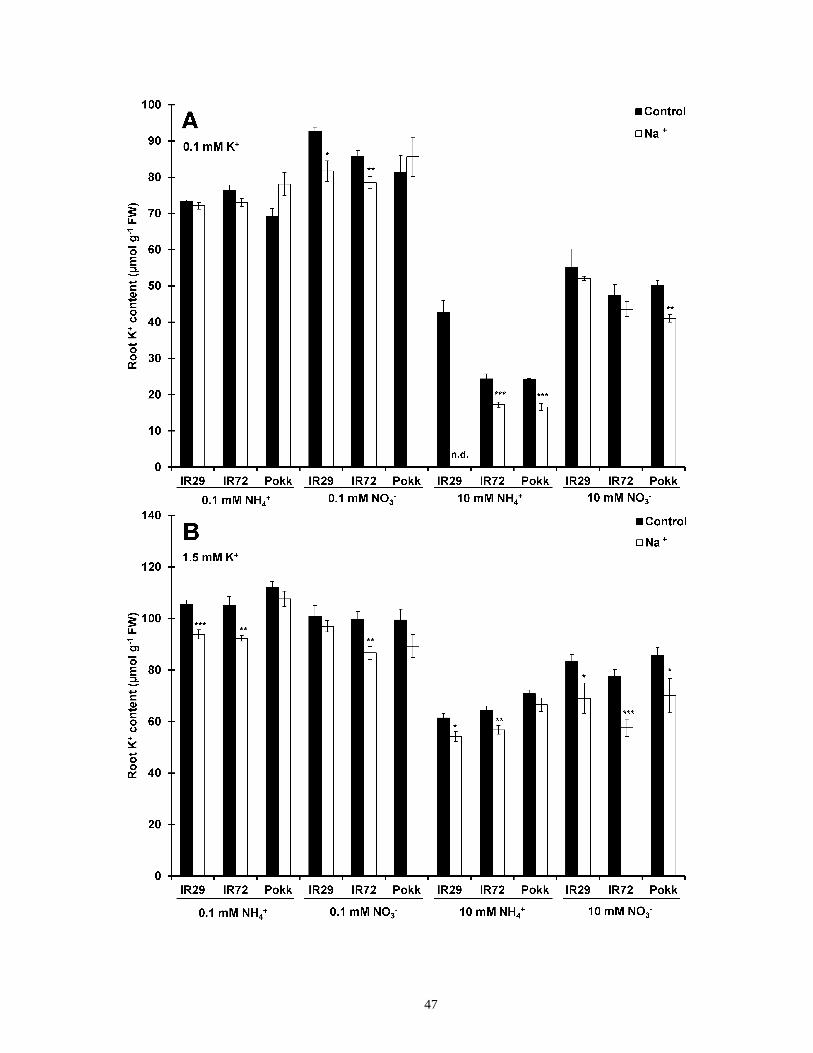
47
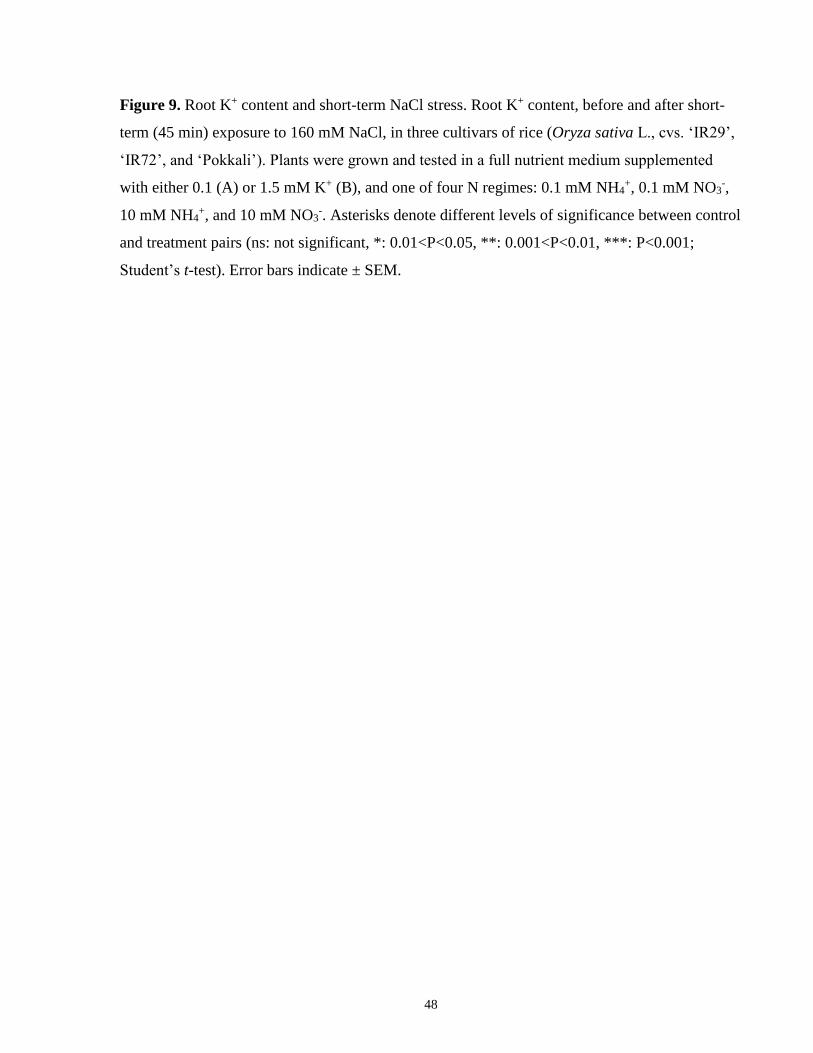
48
Figure 9. Root K+ content and short-term NaCl stress. Root K+ content, before and after short-
term (45 min) exposure to 160 mM NaCl, in three cultivars of rice (Oryza sativa L., cvs. ‘IR29’,
‘IR72’, and ‘Pokkali’). Plants were grown and tested in a full nutrient medium supplemented
with either 0.1 (A) or 1.5 mM K+ (B), and one of four N regimes: 0.1 mM NH4+, 0.1 mM NO3
-,
10 mM NH4+, and 10 mM NO3
-. Asterisks denote different levels of significance between control
and treatment pairs (ns: not significant, *: 0.01<P<0.05, **: 0.001<P<0.01, ***: P<0.001;
Student’s t-test). Error bars indicate ± SEM.
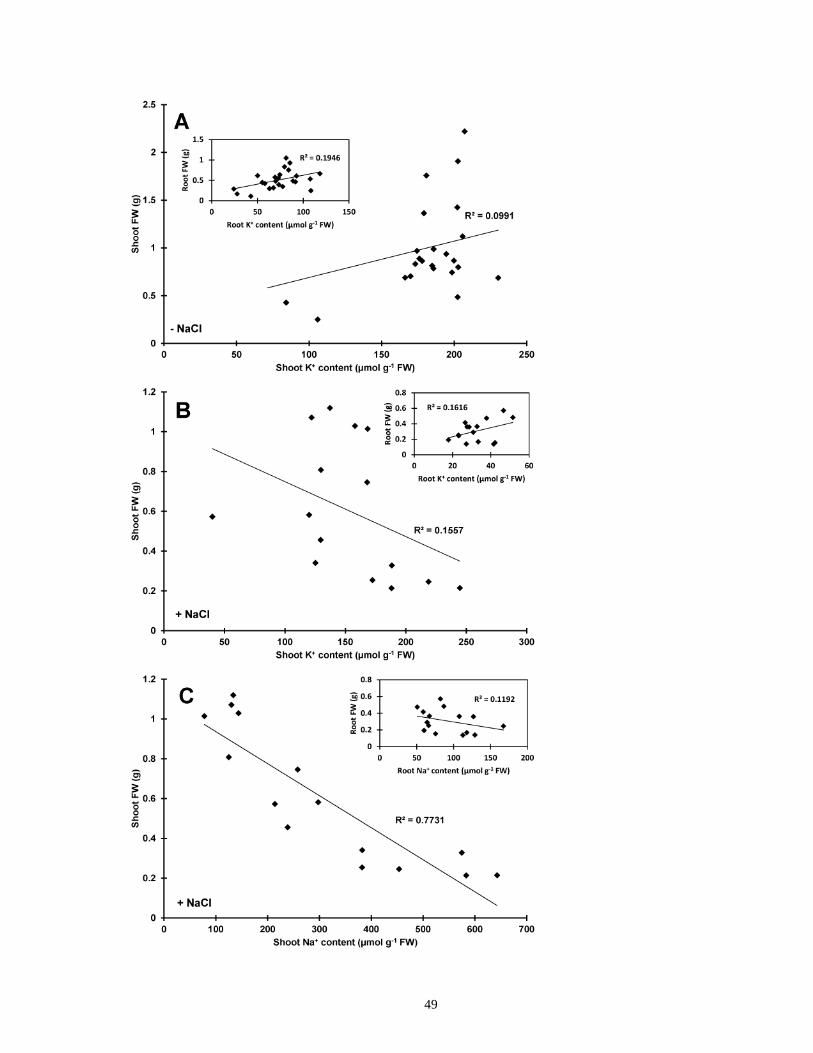
49

50
Figure 10. Tissue K+/Na+ content and biomass. Correlation analyses between shoot K+ content
and fresh weight, in the absence (A) or presence (B) of long-term NaCl stress, and shoot Na+
content and fresh weight in the presence of long-term NaCl stress (C). Data was accumulated
from three cultivars of rice (Oryza sativa L.) grown under varying nutritional conditions. Inset:
respective correlation analyses between ion content and fresh weight for root tissues.
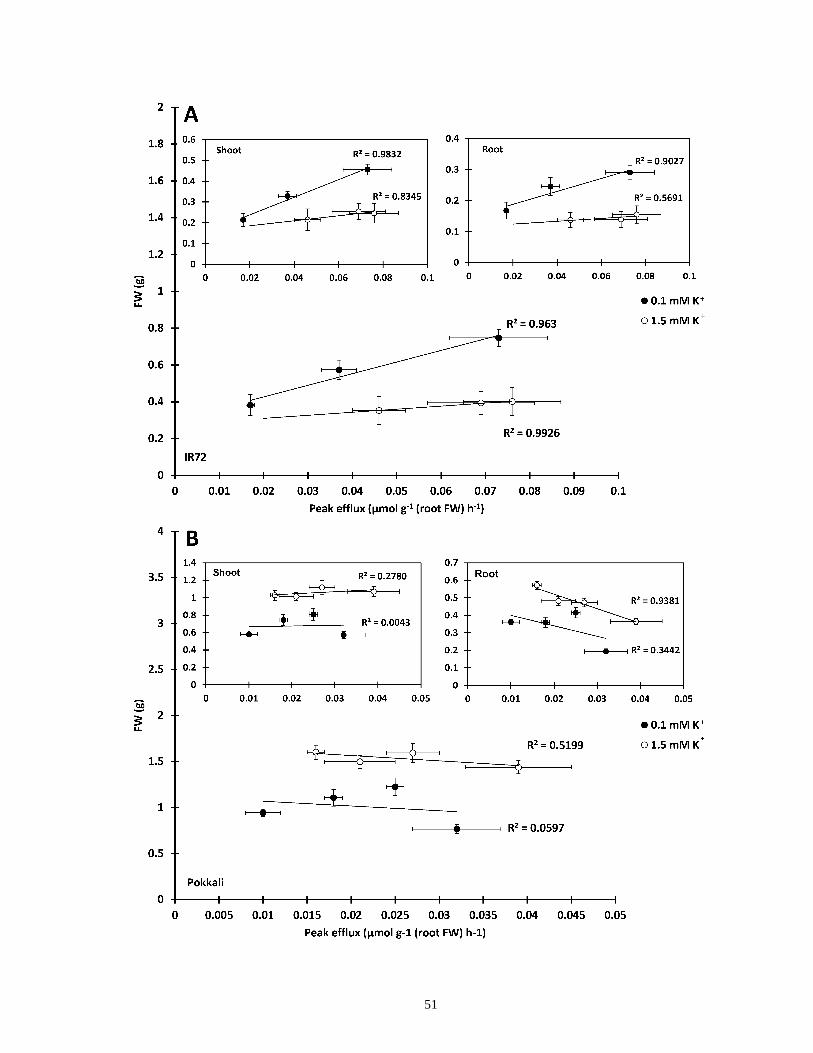
51

52
Figure 11. NaCl-stimulated K+ efflux and biomass. Correlation analyses between NaCl-
stimulated peak K+ efflux from roots and total biomass (or shoot and root biomass, separately;
insets) on long-term NaCl stress in (A) IR72 and (B) Pokkali under low and high K+ growth
conditions. Axes labels for insets as in main figure. Error bars indicate ± SEM.
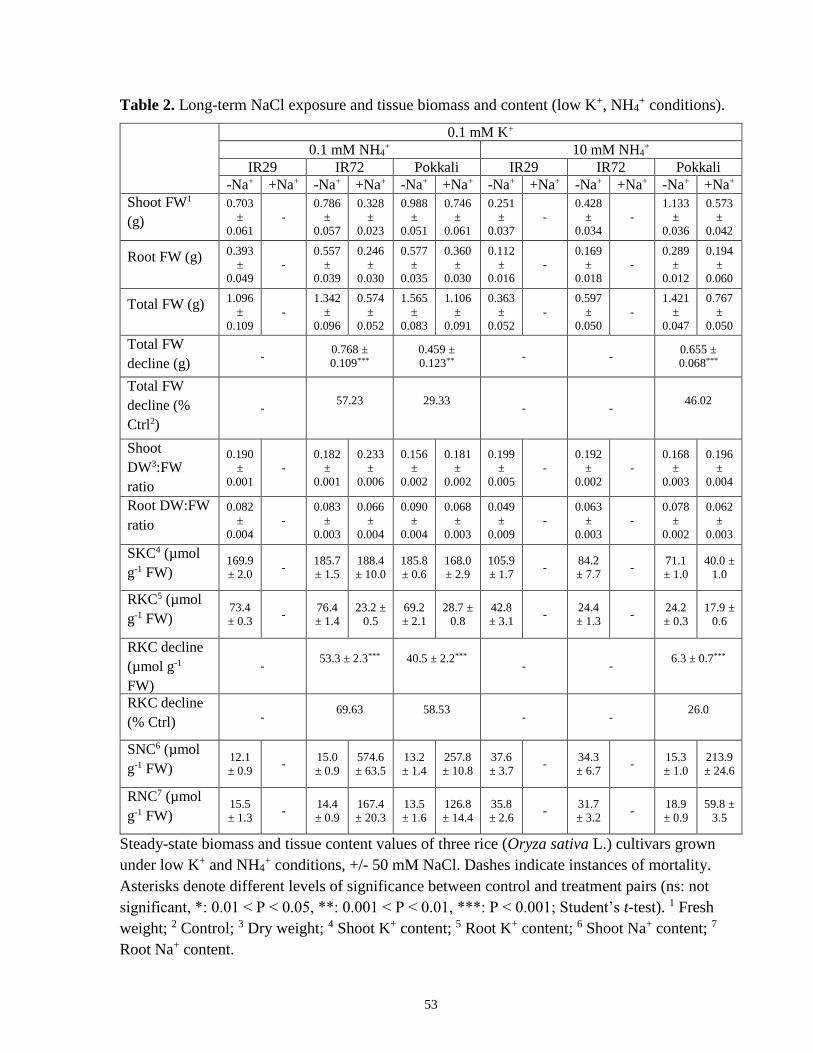
53
Table 2. Long-term NaCl exposure and tissue biomass and content (low K+, NH4+ conditions).
0.1 mM K+ 0.1 mM NH4
+ 10 mM NH4+
IR29 IR72 Pokkali IR29 IR72 Pokkali -Na+ +Na+ -Na+ +Na+ -Na+ +Na+ -Na+ +Na+ -Na+ +Na+ -Na+ +Na+
Shoot FW1
(g)
0.703
±
0.061
-
0.786
±
0.057
0.328
±
0.023
0.988
±
0.051
0.746
±
0.061
0.251
±
0.037
-
0.428
±
0.034
-
1.133
±
0.036
0.573
±
0.042
Root FW (g) 0.393
±
0.049
-
0.557
±
0.039
0.246
±
0.030
0.577
±
0.035
0.360
±
0.030
0.112
±
0.016
-
0.169
±
0.018
-
0.289
±
0.012
0.194
±
0.060
Total FW (g) 1.096
±
0.109
-
1.342
±
0.096
0.574
±
0.052
1.565
±
0.083
1.106
±
0.091
0.363
±
0.052
-
0.597
±
0.050
-
1.421
±
0.047
0.767
±
0.050
Total FW
decline (g) -
0.768 ±
0.109***
0.459 ±
0.123** - -
0.655 ±
0.068***
Total FW
decline (%
Ctrl2) -
57.23 29.33 - -
46.02
Shoot
DW3:FW
ratio
0.190
±
0.001
-
0.182
±
0.001
0.233
±
0.006
0.156
±
0.002
0.181
±
0.002
0.199
±
0.005
-
0.192
±
0.002
-
0.168
±
0.003
0.196
±
0.004
Root DW:FW
ratio
0.082
±
0.004
-
0.083
±
0.003
0.066
±
0.004
0.090
±
0.004
0.068
±
0.003
0.049
±
0.009
-
0.063
±
0.003
-
0.078
±
0.002
0.062
±
0.003
SKC4 (µmol
g-1 FW) 169.9
± 2.0 -
185.7
± 1.5
188.4
± 10.0
185.8
± 0.6
168.0
± 2.9
105.9
± 1.7 -
84.2
± 7.7 -
71.1
± 1.0
40.0 ±
1.0
RKC5 (µmol
g-1 FW) 73.4
± 0.3 -
76.4
± 1.4
23.2 ±
0.5
69.2
± 2.1
28.7 ±
0.8
42.8
± 3.1 -
24.4
± 1.3 -
24.2
± 0.3
17.9 ±
0.6
RKC decline
(µmol g-1
FW)
- 53.3 ± 2.3*** 40.5 ± 2.2***
- - 6.3 ± 0.7***
RKC decline
(% Ctrl) - 69.63 58.53
- - 26.0
SNC6 (µmol
g-1 FW) 12.1
± 0.9 -
15.0
± 0.9
574.6
± 63.5
13.2
± 1.4
257.8
± 10.8
37.6
± 3.7 -
34.3
± 6.7 -
15.3
± 1.0
213.9
± 24.6
RNC7 (µmol
g-1 FW) 15.5
± 1.3 -
14.4
± 0.9
167.4
± 20.3
13.5
± 1.6
126.8
± 14.4
35.8
± 2.6 -
31.7
± 3.2 -
18.9
± 0.9
59.8 ±
3.5
Steady-state biomass and tissue content values of three rice (Oryza sativa L.) cultivars grown
under low K+ and NH4+ conditions, +/- 50 mM NaCl. Dashes indicate instances of mortality.
Asterisks denote different levels of significance between control and treatment pairs (ns: not
significant, *: 0.01 < P < 0.05, **: 0.001 < P < 0.01, ***: P < 0.001; Student’s t-test). 1 Fresh
weight; 2 Control; 3 Dry weight; 4 Shoot K+ content; 5 Root K+ content; 6 Shoot Na+ content; 7
Root Na+ content.
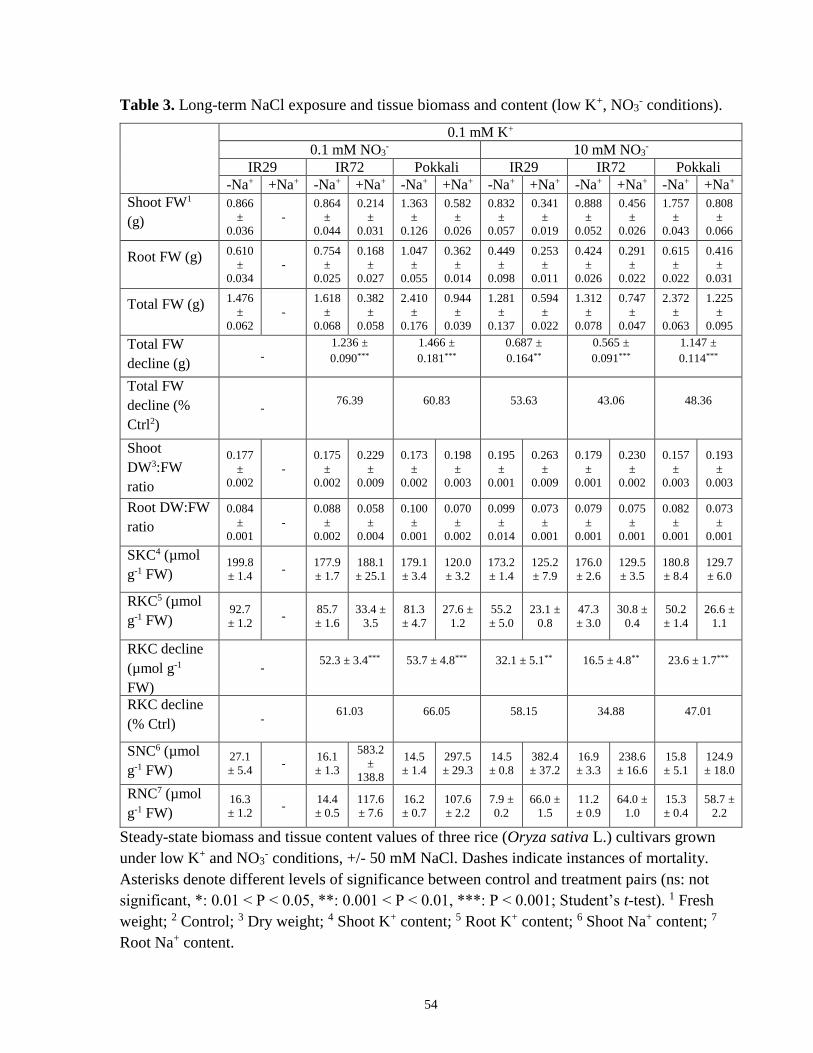
54
Table 3. Long-term NaCl exposure and tissue biomass and content (low K+, NO3- conditions).
0.1 mM K+ 0.1 mM NO3
- 10 mM NO3-
IR29 IR72 Pokkali IR29 IR72 Pokkali -Na+ +Na+ -Na+ +Na+ -Na+ +Na+ -Na+ +Na+ -Na+ +Na+ -Na+ +Na+
Shoot FW1
(g)
0.866
±
0.036
-
0.864
±
0.044
0.214
±
0.031
1.363
±
0.126
0.582
±
0.026
0.832
±
0.057
0.341
±
0.019
0.888
±
0.052
0.456
±
0.026
1.757
±
0.043
0.808
±
0.066
Root FW (g) 0.610
±
0.034
-
0.754
±
0.025
0.168
±
0.027
1.047
±
0.055
0.362
±
0.014
0.449
±
0.098
0.253
±
0.011
0.424
±
0.026
0.291
±
0.022
0.615
±
0.022
0.416
±
0.031
Total FW (g) 1.476
±
0.062
-
1.618
±
0.068
0.382
±
0.058
2.410
±
0.176
0.944
±
0.039
1.281
±
0.137
0.594
±
0.022
1.312
±
0.078
0.747
±
0.047
2.372
±
0.063
1.225
±
0.095
Total FW
decline (g) -
1.236 ±
0.090***
1.466 ±
0.181***
0.687 ±
0.164**
0.565 ±
0.091***
1.147 ±
0.114***
Total FW
decline (%
Ctrl2) -
76.39 60.83 53.63 43.06 48.36
Shoot
DW3:FW
ratio
0.177
±
0.002
-
0.175
±
0.002
0.229
±
0.009
0.173
±
0.002
0.198
±
0.003
0.195
±
0.001
0.263
±
0.009
0.179
±
0.001
0.230
±
0.002
0.157
±
0.003
0.193
±
0.003
Root DW:FW
ratio
0.084
±
0.001
-
0.088
±
0.002
0.058
±
0.004
0.100
±
0.001
0.070
±
0.002
0.099
±
0.014
0.073
±
0.001
0.079
±
0.001
0.075
±
0.001
0.082
±
0.001
0.073
±
0.001
SKC4 (µmol
g-1 FW) 199.8
± 1.4 -
177.9
± 1.7
188.1
± 25.1
179.1
± 3.4
120.0
± 3.2
173.2
± 1.4
125.2
± 7.9
176.0
± 2.6
129.5
± 3.5
180.8
± 8.4
129.7
± 6.0
RKC5 (µmol
g-1 FW) 92.7
± 1.2 -
85.7
± 1.6
33.4 ±
3.5
81.3
± 4.7
27.6 ±
1.2
55.2
± 5.0
23.1 ±
0.8
47.3
± 3.0
30.8 ±
0.4
50.2
± 1.4
26.6 ±
1.1
RKC decline
(µmol g-1
FW)
- 52.3 ± 3.4*** 53.7 ± 4.8*** 32.1 ± 5.1** 16.5 ± 4.8** 23.6 ± 1.7***
RKC decline
(% Ctrl) - 61.03 66.05 58.15 34.88 47.01
SNC6 (µmol
g-1 FW) 27.1
± 5.4 -
16.1
± 1.3
583.2
±
138.8
14.5
± 1.4
297.5
± 29.3
14.5
± 0.8
382.4
± 37.2
16.9
± 3.3
238.6
± 16.6
15.8
± 5.1
124.9
± 18.0
RNC7 (µmol
g-1 FW) 16.3
± 1.2 -
14.4
± 0.5
117.6
± 7.6
16.2
± 0.7
107.6
± 2.2
7.9 ±
0.2
66.0 ±
1.5
11.2
± 0.9
64.0 ±
1.0
15.3
± 0.4
58.7 ±
2.2
Steady-state biomass and tissue content values of three rice (Oryza sativa L.) cultivars grown
under low K+ and NO3- conditions, +/- 50 mM NaCl. Dashes indicate instances of mortality.
Asterisks denote different levels of significance between control and treatment pairs (ns: not
significant, *: 0.01 < P < 0.05, **: 0.001 < P < 0.01, ***: P < 0.001; Student’s t-test). 1 Fresh
weight; 2 Control; 3 Dry weight; 4 Shoot K+ content; 5 Root K+ content; 6 Shoot Na+ content; 7
Root Na+ content.
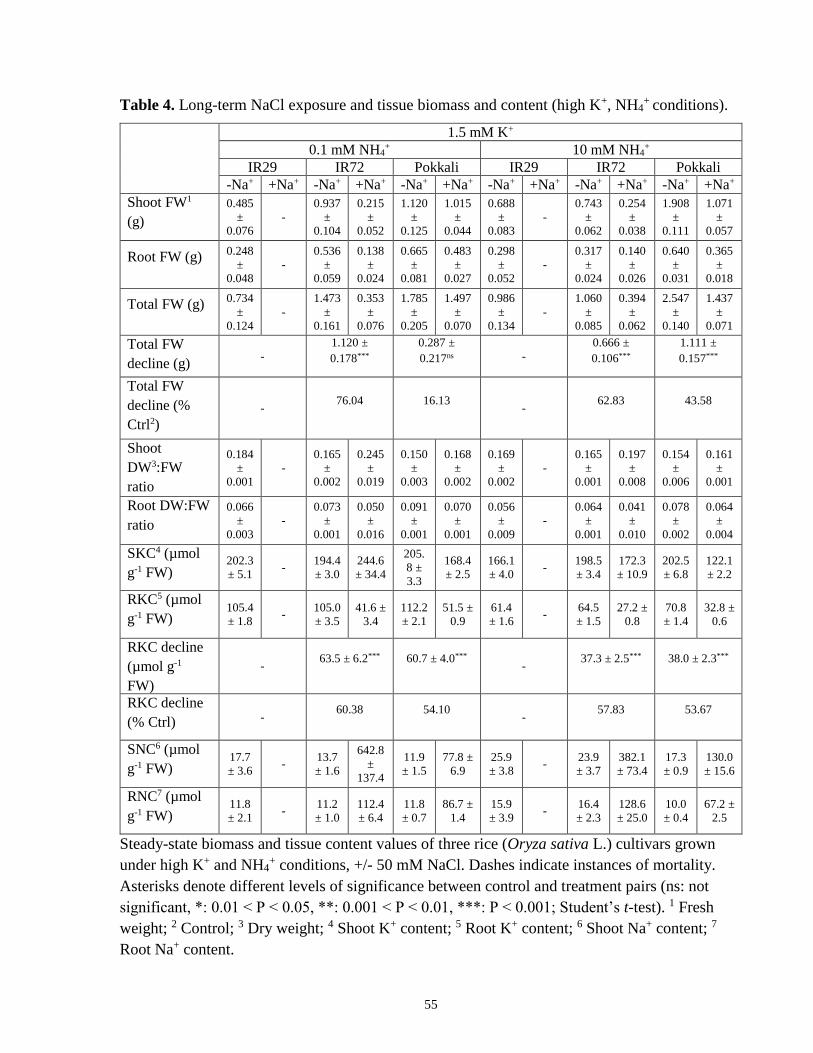
55
Table 4. Long-term NaCl exposure and tissue biomass and content (high K+, NH4+ conditions).
1.5 mM K+ 0.1 mM NH4
+ 10 mM NH4+
IR29 IR72 Pokkali IR29 IR72 Pokkali -Na+ +Na+ -Na+ +Na+ -Na+ +Na+ -Na+ +Na+ -Na+ +Na+ -Na+ +Na+
Shoot FW1
(g)
0.485
±
0.076
-
0.937
±
0.104
0.215
±
0.052
1.120
±
0.125
1.015
±
0.044
0.688
±
0.083
-
0.743
±
0.062
0.254
±
0.038
1.908
±
0.111
1.071
±
0.057
Root FW (g) 0.248
±
0.048
-
0.536
±
0.059
0.138
±
0.024
0.665
±
0.081
0.483
±
0.027
0.298
±
0.052
-
0.317
±
0.024
0.140
±
0.026
0.640
±
0.031
0.365
±
0.018
Total FW (g) 0.734
±
0.124
-
1.473
±
0.161
0.353
±
0.076
1.785
±
0.205
1.497
±
0.070
0.986
±
0.134
-
1.060
±
0.085
0.394
±
0.062
2.547
±
0.140
1.437
±
0.071
Total FW
decline (g) -
1.120 ±
0.178***
0.287 ±
0.217ns -
0.666 ±
0.106***
1.111 ±
0.157***
Total FW
decline (%
Ctrl2) -
76.04 16.13 -
62.83 43.58
Shoot
DW3:FW
ratio
0.184
±
0.001
-
0.165
±
0.002
0.245
±
0.019
0.150
±
0.003
0.168
±
0.002
0.169
±
0.002
-
0.165
±
0.001
0.197
±
0.008
0.154
±
0.006
0.161
±
0.001
Root DW:FW
ratio
0.066
±
0.003
-
0.073
±
0.001
0.050
±
0.016
0.091
±
0.001
0.070
±
0.001
0.056
±
0.009
-
0.064
±
0.001
0.041
±
0.010
0.078
±
0.002
0.064
±
0.004
SKC4 (µmol
g-1 FW) 202.3
± 5.1 -
194.4
± 3.0
244.6
± 34.4
205.
8 ±
3.3
168.4
± 2.5
166.1
± 4.0 -
198.5
± 3.4
172.3
± 10.9
202.5
± 6.8
122.1
± 2.2
RKC5 (µmol
g-1 FW) 105.4
± 1.8 -
105.0
± 3.5
41.6 ±
3.4
112.2
± 2.1
51.5 ±
0.9
61.4
± 1.6 -
64.5
± 1.5
27.2 ±
0.8
70.8
± 1.4
32.8 ±
0.6
RKC decline
(µmol g-1
FW)
- 63.5 ± 6.2*** 60.7 ± 4.0***
- 37.3 ± 2.5*** 38.0 ± 2.3***
RKC decline
(% Ctrl) - 60.38 54.10
- 57.83 53.67
SNC6 (µmol
g-1 FW) 17.7
± 3.6 -
13.7
± 1.6
642.8
±
137.4
11.9
± 1.5
77.8 ±
6.9
25.9
± 3.8 -
23.9
± 3.7
382.1
± 73.4
17.3
± 0.9
130.0
± 15.6
RNC7 (µmol
g-1 FW) 11.8
± 2.1 -
11.2
± 1.0
112.4
± 6.4
11.8
± 0.7
86.7 ±
1.4
15.9
± 3.9 -
16.4
± 2.3
128.6
± 25.0
10.0
± 0.4
67.2 ±
2.5
Steady-state biomass and tissue content values of three rice (Oryza sativa L.) cultivars grown
under high K+ and NH4+ conditions, +/- 50 mM NaCl. Dashes indicate instances of mortality.
Asterisks denote different levels of significance between control and treatment pairs (ns: not
significant, *: 0.01 < P < 0.05, **: 0.001 < P < 0.01, ***: P < 0.001; Student’s t-test). 1 Fresh
weight; 2 Control; 3 Dry weight; 4 Shoot K+ content; 5 Root K+ content; 6 Shoot Na+ content; 7
Root Na+ content.
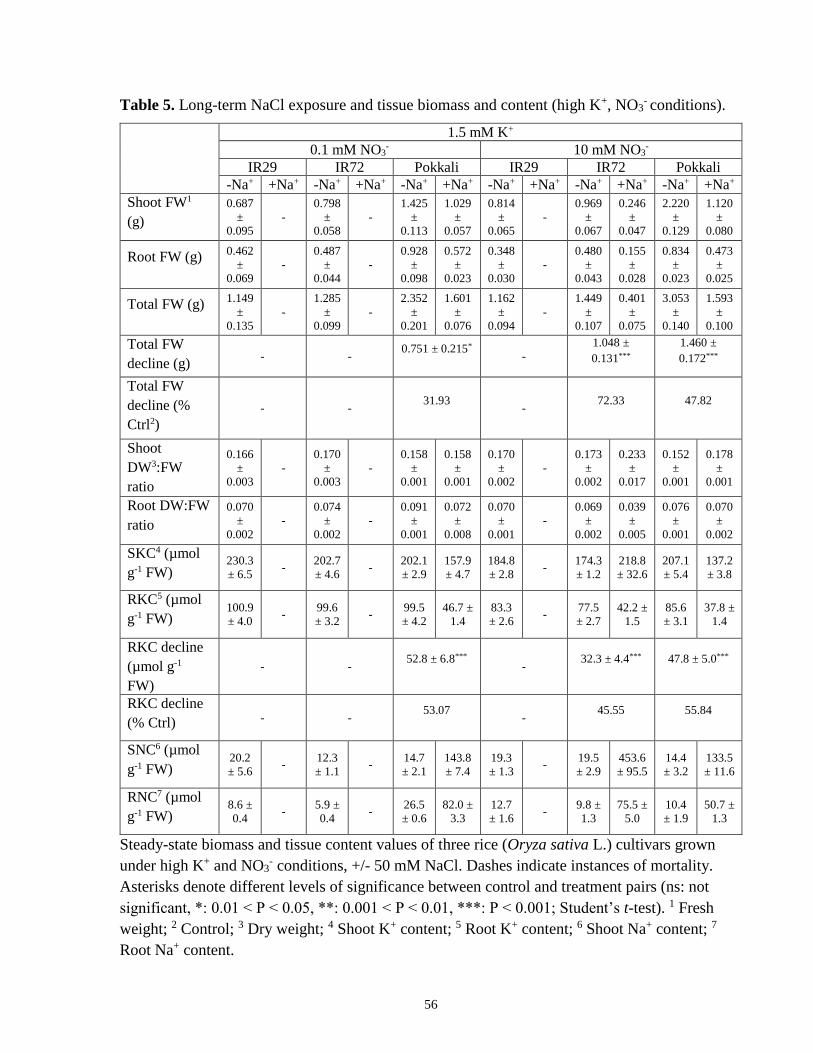
56
Table 5. Long-term NaCl exposure and tissue biomass and content (high K+, NO3- conditions).
1.5 mM K+ 0.1 mM NO3
- 10 mM NO3-
IR29 IR72 Pokkali IR29 IR72 Pokkali -Na+ +Na+ -Na+ +Na+ -Na+ +Na+ -Na+ +Na+ -Na+ +Na+ -Na+ +Na+
Shoot FW1
(g)
0.687
±
0.095
-
0.798
±
0.058
-
1.425
±
0.113
1.029
±
0.057
0.814
±
0.065
-
0.969
±
0.067
0.246
±
0.047
2.220
±
0.129
1.120
±
0.080
Root FW (g) 0.462
±
0.069
-
0.487
±
0.044
-
0.928
±
0.098
0.572
±
0.023
0.348
±
0.030
-
0.480
±
0.043
0.155
±
0.028
0.834
±
0.023
0.473
±
0.025
Total FW (g) 1.149
±
0.135
-
1.285
±
0.099
-
2.352
±
0.201
1.601
±
0.076
1.162
±
0.094
-
1.449
±
0.107
0.401
±
0.075
3.053
±
0.140
1.593
±
0.100
Total FW
decline (g) - -
0.751 ± 0.215* -
1.048 ±
0.131***
1.460 ±
0.172***
Total FW
decline (%
Ctrl2) - -
31.93 -
72.33 47.82
Shoot
DW3:FW
ratio
0.166
±
0.003
-
0.170
±
0.003
-
0.158
±
0.001
0.158
±
0.001
0.170
±
0.002
-
0.173
±
0.002
0.233
±
0.017
0.152
±
0.001
0.178
±
0.001
Root DW:FW
ratio
0.070
±
0.002
-
0.074
±
0.002
-
0.091
±
0.001
0.072
±
0.008
0.070
±
0.001
-
0.069
±
0.002
0.039
±
0.005
0.076
±
0.001
0.070
±
0.002
SKC4 (µmol
g-1 FW) 230.3
± 6.5 -
202.7
± 4.6 -
202.1
± 2.9
157.9
± 4.7
184.8
± 2.8 -
174.3
± 1.2
218.8
± 32.6
207.1
± 5.4
137.2
± 3.8
RKC5 (µmol
g-1 FW) 100.9
± 4.0 -
99.6
± 3.2 -
99.5
± 4.2
46.7 ±
1.4
83.3
± 2.6 -
77.5
± 2.7
42.2 ±
1.5
85.6
± 3.1
37.8 ±
1.4
RKC decline
(µmol g-1
FW)
- - 52.8 ± 6.8***
- 32.3 ± 4.4*** 47.8 ± 5.0***
RKC decline
(% Ctrl) - - 53.07
- 45.55 55.84
SNC6 (µmol
g-1 FW) 20.2
± 5.6 -
12.3
± 1.1 -
14.7
± 2.1
143.8
± 7.4
19.3
± 1.3 -
19.5
± 2.9
453.6
± 95.5
14.4
± 3.2
133.5
± 11.6
RNC7 (µmol
g-1 FW) 8.6 ±
0.4 -
5.9 ±
0.4 -
26.5
± 0.6
82.0 ±
3.3
12.7
± 1.6 -
9.8 ±
1.3
75.5 ±
5.0
10.4
± 1.9
50.7 ±
1.3
Steady-state biomass and tissue content values of three rice (Oryza sativa L.) cultivars grown
under high K+ and NO3- conditions, +/- 50 mM NaCl. Dashes indicate instances of mortality.
Asterisks denote different levels of significance between control and treatment pairs (ns: not
significant, *: 0.01 < P < 0.05, **: 0.001 < P < 0.01, ***: P < 0.001; Student’s t-test). 1 Fresh
weight; 2 Control; 3 Dry weight; 4 Shoot K+ content; 5 Root K+ content; 6 Shoot Na+ content; 7
Root Na+ content.
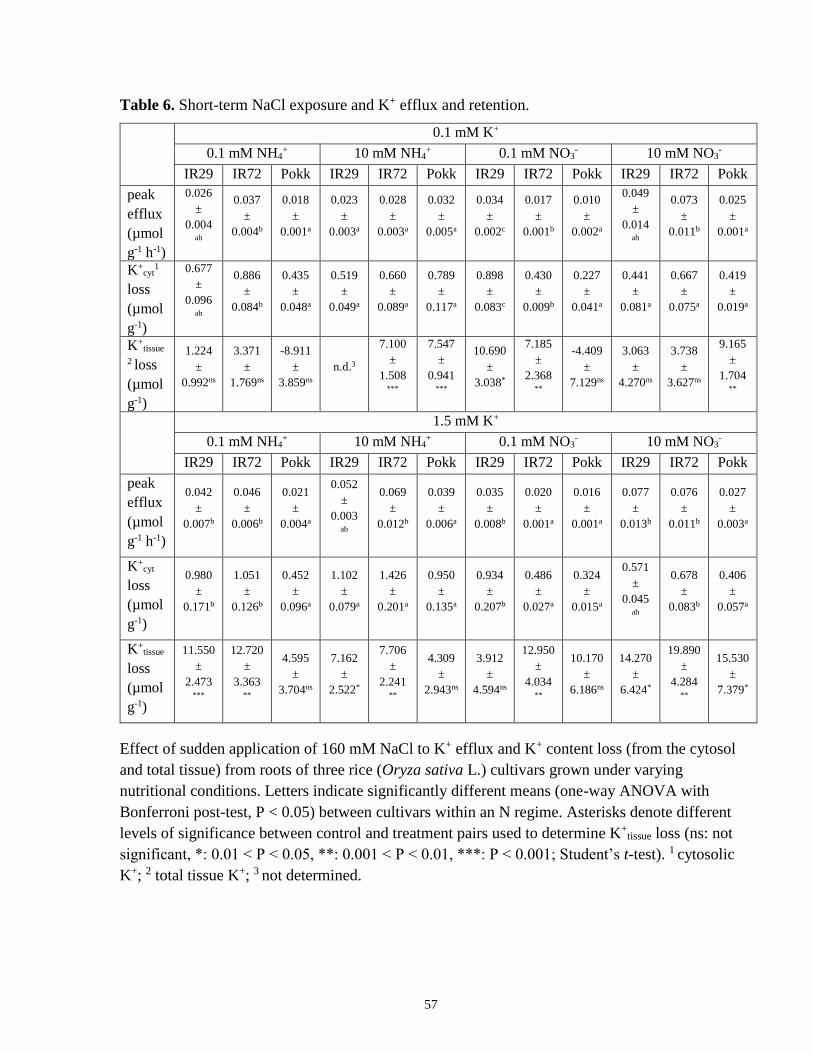
57
Table 6. Short-term NaCl exposure and K+ efflux and retention.
0.1 mM K+
0.1 mM NH4+ 10 mM NH4
+ 0.1 mM NO3- 10 mM NO3
-
IR29 IR72 Pokk IR29 IR72 Pokk IR29 IR72 Pokk IR29 IR72 Pokk
peak
efflux
(µmol
g-1 h-1)
0.026
±
0.004 ab
0.037
±
0.004b
0.018
±
0.001a
0.023
±
0.003a
0.028
±
0.003a
0.032
±
0.005a
0.034
±
0.002c
0.017
±
0.001b
0.010
±
0.002a
0.049
±
0.014 ab
0.073
±
0.011b
0.025
±
0.001a
K+cyt
1
loss
(µmol
g-1)
0.677
±
0.096 ab
0.886
±
0.084b
0.435
±
0.048a
0.519
±
0.049a
0.660
±
0.089a
0.789
±
0.117a
0.898
±
0.083c
0.430
±
0.009b
0.227
±
0.041a
0.441
±
0.081a
0.667
±
0.075a
0.419
±
0.019a
K+tissue
2 loss
(µmol
g-1)
1.224
±
0.992ns
3.371
±
1.769ns
-8.911
±
3.859ns
n.d.3
7.100
±
1.508 ***
7.547
±
0.941 ***
10.690
±
3.038*
7.185
±
2.368 **
-4.409
±
7.129ns
3.063
±
4.270ns
3.738
±
3.627ns
9.165
±
1.704 **
1.5 mM K+
0.1 mM NH4+ 10 mM NH4
+ 0.1 mM NO3- 10 mM NO3
-
IR29 IR72 Pokk IR29 IR72 Pokk IR29 IR72 Pokk IR29 IR72 Pokk
peak
efflux
(µmol
g-1 h-1)
0.042
±
0.007b
0.046
±
0.006b
0.021
±
0.004a
0.052
±
0.003 ab
0.069
±
0.012b
0.039
±
0.006a
0.035
±
0.008b
0.020
±
0.001a
0.016
±
0.001a
0.077
±
0.013b
0.076
±
0.011b
0.027
±
0.003a
K+cyt
loss
(µmol
g-1)
0.980
±
0.171b
1.051
±
0.126b
0.452
±
0.096a
1.102
±
0.079a
1.426
±
0.201a
0.950
±
0.135a
0.934
±
0.207b
0.486
±
0.027a
0.324
±
0.015a
0.571
±
0.045 ab
0.678
±
0.083b
0.406
±
0.057a
K+tissue
loss
(µmol
g-1)
11.550
±
2.473 ***
12.720
±
3.363 **
4.595
±
3.704ns
7.162
±
2.522*
7.706
±
2.241 **
4.309
±
2.943ns
3.912
±
4.594ns
12.950
±
4.034 **
10.170
±
6.186ns
14.270
±
6.424*
19.890
±
4.284 **
15.530
±
7.379*
Effect of sudden application of 160 mM NaCl to K+ efflux and K+ content loss (from the cytosol
and total tissue) from roots of three rice (Oryza sativa L.) cultivars grown under varying
nutritional conditions. Letters indicate significantly different means (one-way ANOVA with
Bonferroni post-test, P < 0.05) between cultivars within an N regime. Asterisks denote different
levels of significance between control and treatment pairs used to determine K+tissue loss (ns: not
significant, *: 0.01 < P < 0.05, **: 0.001 < P < 0.01, ***: P < 0.001; Student’s t-test). 1 cytosolic
K+; 2 total tissue K+; 3 not determined.
58
3.2.4 Discussion
The present study is the first to examine NaCl-stimulated K+ efflux in rice and to relate this
phenomenon to performance on long-term NaCl stress. Consistent with studies on other plant
species, e.g. barley (Chen et al. 2005; Britto et al. 2010), wheat (Cuin et al. 2008), bean (Nassery
1975), cotton (Cramer et al. 1985), Arabidopsis (Shabala et al. 2006), pea (Shabala et al. 2007),
alfalfa (Smethurst et al. 2008), and sunflower (our unpublished results), we show that sudden
exposure to high levels of NaCl produce a significant and sustained stimulation of K+ efflux in
three cultivars of rice that differ dramatically in salt tolerance. We also show that this effect
occurs regardless of nutritional history (Fig. 7), albeit to varying extents (Table 6). We should
stress that this effect only occurs if NaCl concentrations are sufficiently high (e.g. 160 mM), as it
was not observed in a lower range (25–75 mM; Fig. S1). By contrast, long-term exposure to 50
mM NaCl was sufficient to bring about toxicity in all cultivars, and in some cases even mortality
(Tables 2, 3, 4, 5). These findings question the universal relevance of NaCl-stimulated K+ efflux
to NaCl toxicity.
Recently, we investigated the mechanism underlying the efflux stimulation in barley roots, and
concluded that membrane disintegrity due to osmotic and ionic effects was the cause (Britto et al.
2010), a conclusion that agreed with earlier explanations (Nassery 1979; Cramer et al. 1985), but
opposed more recent explanations that attribute the effect to the gating of outwardly rectifying
K+ channels by Na+-induced membrane depolarization (Shabala et al. 2006). In the present study
in rice, we found that, as in barley, NaCl-stimulated K+ efflux showed no sensitivity to Cs+ (Fig.
8), an especially potent inhibitor of K+ fluxes (Krol and Trebacz 2000; White and Broadley
2000; Coskun et al. 2010), which discounts the involvement of outward-rectifying K+ channels.
Simultaneous application of 160 mM NaCl with 10 mM Ca2+ showed significant suppressions of
K+-efflux stimulation (Fig. 8). While Ca2+ is known to inhibit some ion channels (Roberts and
Tester 1997; Tyerman et al. 1997; Davenport and Tester 2000), it is also well documented that
calcium is critical to the stability of membranes including under NaCl stress (Garybobo 1970;
Rengel 1992; Hepler 2005), which may explain the suppression observed in the present study.
The agronomic importance of NaCl-stimulated K+ efflux has been suggested by the inverse
relationship between the extent of efflux and the salt tolerance of wheat and barley cultivars,
which thus may prove to be a valuable screening tool for some crops (Chen et al. 2005, 2008;
59
Cuin et al. 2008). In our study, the salt-tolerant cultivar, Pokkali, did show significantly lower
NaCl-stimulated K+ efflux compared to IR29 and IR72, under all conditions but one (Fig. 7).
However, the stimulation of K+ efflux in IR72 did not fall between that of IR29 and Pokkali
under most conditions (Fig. 7), even though IR72 clearly demonstrated intermediate sensitivity
to long-term NaCl stress, in terms of survival, biomass decline, and shoot Na+ content (Tables 2,
3, 4, 5).
Nor was there a strong negative relationship observed between peak NaCl-stimulated K+ efflux
and plant growth on NaCl, within the three cultivars of rice examined here, under varying
nutritional conditions (Fig. 11). Within cultivars, only when correlation analyses were limited to
a specific K+ level were any relationships observed. Even then, only one correlation was strongly
negative for Pokkali (roots at high K+; Fig. 11B inset), while all correlations were in fact strongly
positive for IR72 (Fig. 11A).
Long-term NaCl stress showed no correlation between peak (or integrated) efflux, and survival,
biomass decline (both absolute and relative), tissue K+ content and its decline (both absolute and
relative), and tissue Na+ content and its accumulation (both absolute and relative) (Table S1).
Thus, it appears that in rice, NaCl-stimulated K+ efflux from the root system provides no utility
in screening for performance under salinity stress.
Perhaps of greater surprise was the more fundamental observation that tissue K+ content showed
no relationship with plant biomass in even the absence of salinity stress (Fig. 10; Table S1). It
has long been known that ‘luxury consumption’ of K+ occurs when it is not nutritionally limiting
(Bartholomew and Janssen 1929; Hoagland and Martin 1933; Chapin 1980). Because plants can
homeostatically maintain cytosolic [K+] at 100 mM at the expense of vacuolar stores (Walker et
al. 1996a), they can maintain proper functioning against a background of widely varying tissue
K+ levels. As shown in Table 2, these levels can be extremely low, as in the case of Pokkali at
low K+, high NH4+, and 50 mM NaCl (18 and 40 µmol K+ g-1 FW in root and shoot,
respectively), but can nevertheless be compatible with biomass that exceeds what is seen in other
cultivars with much higher tissue K+ levels (e.g. IR29 and IR72 at low K+, high NH4+, and
without NaCl). Fig. 9 demonstrates that the loss of root K+ due to sudden NaCl exposure is
relatively minor compared to the vast fluctuations in root K+ levels achieved by alterations in
growth history in the absence of salt stress. Moreover, in some cases, it appears that increased K+
60
provision can in fact be detrimental to performance on long-term NaCl exposure. Except in
plants grown on high NH4+, where it is clear that enhanced K+ availability is beneficial due to the
alleviation of NH4+ toxicity (Balkos et al. 2010), biomass decline due to long-term NaCl
exposure was actually greater on high K+ in IR72 under low NH4+ and high NO3
- conditions.
Furthermore, IR72 and IR29 did not survive at high K+ on low and high NO3-, respectively
(Table 5). Thus, it becomes apparent that, at least in rice, focus on K+ status as a measure of
plant performance under saline and non-saline conditions, is perhaps misguided.
By contrast, shoot Na+ content was a good predictor of biomass on long-term NaCl stress (R2 =
0.77; Fig. 10C). This is in good agreement with previous reports on rice that demonstrate strong
negative correlations between shoot Na+ content and performance (Yeo and Flowers 1983,
1982). Moreover, this was the only measure that displayed clear cultivar differences in the
present work, based on salt tolerance, independent of growth history (i.e. IR29 > IR72 > Pokkali;
Tables 2, 3, 4, 5). It is believed that shoot Na+ accumulation in rice occurs preferentially via an
apoplastic bypass pathway (Yeo et al. 1987; Garcia et al. 1997), but is lower in salt-tolerant
cultivars such as Pokkali (Krishnamurthy et al. 2011). It is also believed that elevated Ca2+ levels
can reduce bypass flow of Na+ into the transpiration stream (Anil et al. 2005). Indeed, under low-
K+, high Ca2+ (high-NO3-) conditions, all cultivars showed the lowest shoot Na+ content when
grown on NaCl (Table 3). However, this was not observed at high K+, which may be related to
the poorer performance on salinity with high K+, as mentioned above. Thus, it appears that
monitoring K+ nutrition (including efflux and retention) in hopes of screening for salt tolerance
in rice is not a promising strategy, and that focus should remain on shoot Na+ accumulation and
the mechanisms by which it is brought about (Faiyue et al. 2012).
61
Chapter 4 K+ Influx in Roots of Higher Plants: Mechanisms and Connections
to Abiotic Stress
Capacity and Plasticity of K+ Channels and High-Affinity Transporters in Roots of Barley (Hordeum vulgare L.) and Arabidopsis thaliana L.
Preface
A modified version of this subchapter was published as: Coskun D, Britto DT, Li M, Oh S,
Kronzucker HJ (2013) Capacity and plasticity of K+ channels and high-affinity transporters in
roots of barley (Hordeum vulgare L.) and Arabidopsis thaliana L. Plant Physiology 162, 496-
511. Supplemental material cited in this subchapter can be found online:
http://www.plantphysiol.org/content/162/1/496.
HJ Kronzucker designed the study, with input from DT Britto and D Coskun. D Coskun
performed the experiments and analyzed the data, with input from M Ling and S Oh. D Coskun
wrote the manuscript, with input and editing from DT Britto and HJ Kronzucker.
4.1.1 Abstract
The role of potassium (K+) transporters in high- and low-affinity K+ uptake was examined in
roots of intact barley (Hordeum vulgare) and Arabidopsis (Arabidopsis thaliana) plants by use of
42K radiotracing, electrophysiology, pharmacology, and mutant analysis. Comparisons were
made between results from barley and five genotypes of Arabidopsis, including single and
double knockout mutants for the high-affinity transporter, AtHAK5, and the Shaker-type
channel, AtAKT1. In Arabidopsis, steady-state K+ influx at low external K+ concentration
([K+]ext = 22.5 µM) was predominantly mediated by AtAKT1 when high-affinity transport was
inhibited by ammonium, whereas in barley, by contrast, K+ channels could not operate below
100 µM. Withdrawal of ammonium resulted in an immediate and dramatic stimulation of K+
influx in barley, indicating a shift from active to passive K+ uptake at low [K+]ext and yielding
62
fluxes as high as 36 µmol g-1 (root fresh weight) h-1 at 5 mM [K+]ext, among the highest
transporter-mediated K+ fluxes hitherto reported. This ammonium-withdrawal effect was also
established in all Arabidopsis lines (the wild types, atakt1, athak5, and athak5 atakt1) at low
[K+]ext, revealing the concerted involvement of several transport systems. The ammonium-
withdrawal effect coincided with a suppression of K+ efflux and a significant hyperpolarization
of the plasma membrane in all genotypes except athak5 atakt1, could be sustained over 24 h, and
resulted in increased tissue K+ accumulation. We discuss key differences and similarities in K+
acquisition between two important model systems and reveal novel aspects of K+ transport in
planta.
4.1.2 Introduction
Potassium (K+), a major macronutrient in plants, is the most abundant intracellular cation
(constituting up to 10% of plant dry weight) and is critical to such cellular functions as osmotic
balance, enzyme activation, and electrical regulation (Leigh and Jones 1984; Maathuis and
Sanders 1996b; Britto and Kronzucker 2008). Understanding the mechanisms of K+ acquisition
in plants has long been of scientific and practical importance and is increasingly urgent in light
of major ecological and agricultural problems, such as soil K+ level decline (Ashley et al. 2006;
and references therein) and sodium (Na+) and ammonium (NH4+) toxicities (Britto and
Kronzucker 2002; Kronzucker et al. 2006; ten Hoopen et al. 2010).
Since the pioneering work of Epstein et al. (1963), which described the acquisition of K+ by
plants as the sum of activities of two transport systems with distinct substrate-binding affinities,
major advances in the molecular and thermodynamic characterization of each system have been
made (for review, see Maathuis and Sanders 1996; Véry and Sentenac 2003; Britto and
Kronzucker 2008; Szczerba et al. 2009). Generally, Epstein’s mechanism 1, or the high-affinity
transport system (HATS), has been described as a saturable system that catalyzes the
thermodynamically active uptake (i.e., ATP-dependent transport against an electrochemical
gradient) of K+ from external concentrations ([K+]ext) of less than 1 mM (Kochian and Lucas
1982; Maathuis and Sanders 1994). Mechanism 2, or the low-affinity transport system (LATS),
catalyzes a flux proportional to [K+]ext and is proposed to predominate above 1 mM [K+]ext
(Epstein et al. 1963; Kochian et al. 1985; Maathuis and Sanders 1996b). Although several
63
molecular candidates have been suggested to encode HATS and LATS proteins (Szczerba et al.
2009), it is believed that the majority of high-affinity transport is catalyzed by secondary active
transporters of the HAK/KUP/KT family (e.g. AtHAK5 from Arabidopsis [Arabidopsis thaliana]
and HvHAK1 from barley [Hordeum vulgare]), which operate via a proton (H+)/K+ symport
mechanism (Gierth and Mäser 2007). Low-affinity transport, by contrast, occurs via Shaker-like
K+ channels (e.g. AtAKT1 from Arabidopsis and HvAKT1 from barley), which facilitate passive
diffusion down the electrochemical gradient for K+ (Véry and Sentenac 2003; Cherel 2004).
Other key transporters implicated in K+ uptake include nonselective cation channels (NSCCs;
Demidchik et al. 2002) and HKT/TRK-type transporters (Rubio et al. 1995). An unidentified
system in Arabidopsis, independent of AtAKT1 and AtHAK5 and reportedly operating only at
high (millimolar) [K+]ext, has been the subject of considerable recent interest (Pyo et al. 2010;
Rubio et al. 2010; Caballero et al. 2012; see also Hirsch et al. 1998); however, little is known
about its molecular and physiological characterization.
The nutritional and molecular regulation of HAK/ KUP/KT transporters and Shaker-like K+
channels has been extensively investigated in the model system Arabidopsis and has led to some
blurring of distinctions between the traditional concepts of HATS and LATS (Spalding et al.
1999; Xu et al. 2006; Lee et al. 2007; Qi et al. 2008; Geiger et al. 2009; Honsbein et al. 2009;
Pyo et al. 2010; Rubio et al. 2010; for review, see Alemán et al. 2011). For instance, although
HAK/KUP/KT transporters appear to dominate the HATS (Gierth and Mäser 2007), some
members have been demonstrated to operate at [K+]ext as high as 20 mM, indicating a dual
affinity (Fu and Luan 1998; Kim et al. 1998). By contrast, although generally ascribed to the
LATS (Maathuis and Sanders, 1996), AtAKT1 can operate at [K+]ext as low as 10 µM, given
favorable thermodynamic conditions, and particularly if the HATS is suppressed by NH4+
(Hirsch et al. 1998; Spalding et al. 1999), which specifically inhibits HAK/KUP/KT transporters
(Qi et al. 2008). Further blurring the distinction between HATS and LATS is the response of K+
uptake mechanisms to K+ limitation (Hampton et al. 2004). For instance, HAK/KUP/KT
expression (Ahn et al. 2004; Gierth et al. 2005) and high-affinity K+ influx (Glass 1976; Kochian
and Lucas 1982; Siddiqi and Glass 1986) have both been shown to be upregulated by K+
starvation. On the other hand, while AtAKT1 expression appears to be independent of K+
availability (Lagarde et al. 1996; Gierth et al. 2005), the posttranslational regulation of AtAKT1
(including phosphorylation/dephosphorylation networks and channel heteromerization) has
64
shown that channel-mediated K+ uptake can increase in response to low-K+ conditions (Li et al.
2006; Xu et al. 2006; Lee et al. 2007; Geiger et al. 2009; Grefen et al. 2010; Jeanguenin et al.
2011).
While much recent work on K+ uptake has occurred in Arabidopsis, leading to the development
of a sophisticated model (Alemán et al. 2011), little attention has been given to the question of
how general this model might be, most importantly with respect to crop species. This is naturally
the result of the vast catalog of well-characterized Arabidopsis mutant lines (e.g. The
Arabidopsis Information Resource [http://www. arabidopsis.org] and the Arabidopsis Biological
Resource Center [http://abrc.osu.edu]), which have no equivalent in crop species such as rice
(Oryza sativa; Goff et al. 2002; Yu et al. 2002; see also Amrutha et al. 2007), barley (Mayer et
al. 2012), and wheat (Triticum aestivum; Brenchley et al. 2012). Examinations into the molecular
identity and contribution of K+ uptake systems in roots of barley have been limited to high-
affinity concentrations (0.1–1 mM), with particular focus on the AtHAK5 homolog, HvHAK1,
and its regulation (Santa-María et al. 2000; Vallejo et al. 2005; Fulgenzi et al. 2008). This work
indicates that, like Arabidopsis (Hirsch et al. 1998; Spalding et al. 1999), high-affinity K+ uptake
in roots of barley is dictated by NH4+-sensitive and -insensitive systems, linked to HvHAK1 and,
most likely, HvAKT1, respectively (Santa-María et al. 2000). However, it has not been explored
whether, under high-NH4+ conditions, K+ channels can operate in roots of barley at very low
[K+]ext (e.g. 10 µM), as they do in Arabidopsis (Hirsch et al., 1998); this information can help
address some longstanding speculation on the role of K+ channels under nutrient deficiency
(Kochian and Lucas 1993). Moreover, the relative apportionment of K+ channels and secondary-
active transporters with respect to high- and low-affinity uptake in roots of barley has not been
explored to the same extent as in Arabidopsis (Rubio et al. 2008, 2010). Lastly, although the
inhibition of high-affinity K+ influx by external NH4+ supply is well documented (Vale et al.
1987; Spalding et al. 1999; Santa-María et al. 2000; Qi et al. 2008), as are its effects on
membrane polarization (Ullrich et al. 1984; Wang et al. 1994; Britto et al. 2001b), little is known
about the recovery of K+ influx and the thermodynamic response following NH4+ removal under
high- and low-affinity systems. As one of the chief aspects of NH4+ toxicity in higher plants,
understanding the inhibitory role of this nitrogen source in K+ transport is of particular
importance (Britto and Kronzucker 2002).
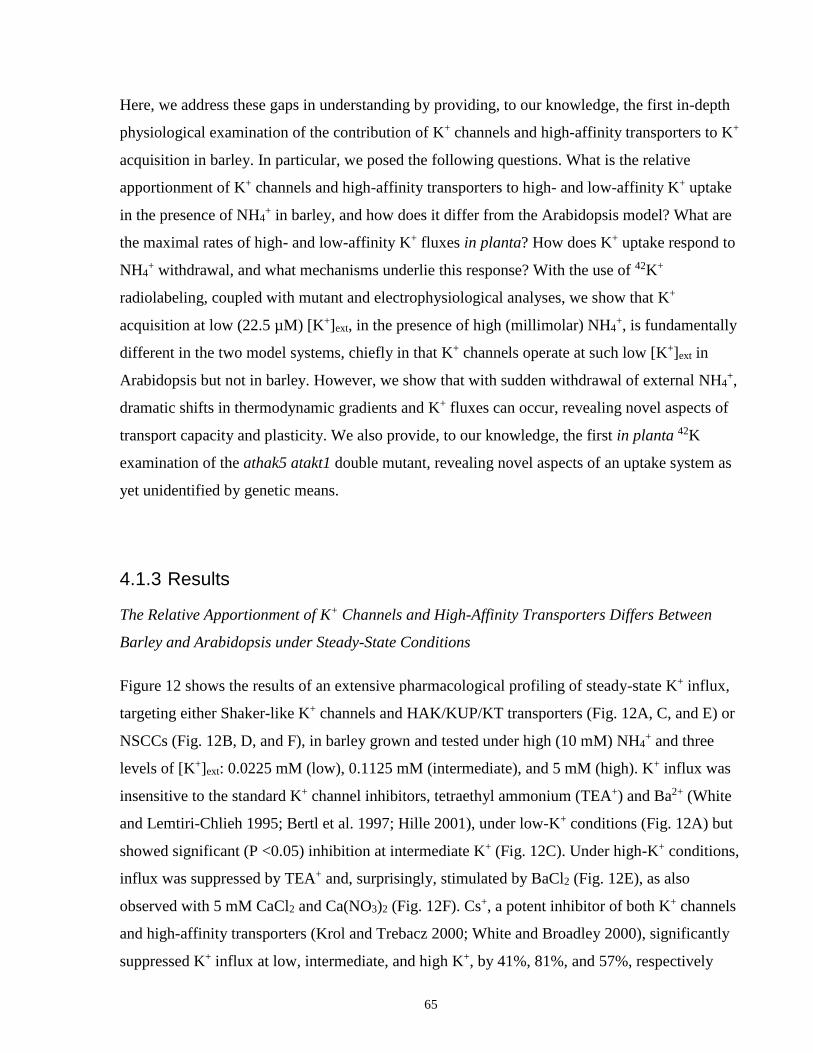
65
Here, we address these gaps in understanding by providing, to our knowledge, the first in-depth
physiological examination of the contribution of K+ channels and high-affinity transporters to K+
acquisition in barley. In particular, we posed the following questions. What is the relative
apportionment of K+ channels and high-affinity transporters to high- and low-affinity K+ uptake
in the presence of NH4+ in barley, and how does it differ from the Arabidopsis model? What are
the maximal rates of high- and low-affinity K+ fluxes in planta? How does K+ uptake respond to
NH4+ withdrawal, and what mechanisms underlie this response? With the use of 42K+
radiolabeling, coupled with mutant and electrophysiological analyses, we show that K+
acquisition at low (22.5 µM) [K+]ext, in the presence of high (millimolar) NH4+, is fundamentally
different in the two model systems, chiefly in that K+ channels operate at such low [K+]ext in
Arabidopsis but not in barley. However, we show that with sudden withdrawal of external NH4+,
dramatic shifts in thermodynamic gradients and K+ fluxes can occur, revealing novel aspects of
transport capacity and plasticity. We also provide, to our knowledge, the first in planta 42K
examination of the athak5 atakt1 double mutant, revealing novel aspects of an uptake system as
yet unidentified by genetic means.
4.1.3 Results
The Relative Apportionment of K+ Channels and High-Affinity Transporters Differs Between
Barley and Arabidopsis under Steady-State Conditions
Figure 12 shows the results of an extensive pharmacological profiling of steady-state K+ influx,
targeting either Shaker-like K+ channels and HAK/KUP/KT transporters (Fig. 12A, C, and E) or
NSCCs (Fig. 12B, D, and F), in barley grown and tested under high (10 mM) NH4+ and three
levels of [K+]ext: 0.0225 mM (low), 0.1125 mM (intermediate), and 5 mM (high). K+ influx was
insensitive to the standard K+ channel inhibitors, tetraethyl ammonium (TEA+) and Ba2+ (White
and Lemtiri-Chlieh 1995; Bertl et al. 1997; Hille 2001), under low-K+ conditions (Fig. 12A) but
showed significant (P <0.05) inhibition at intermediate K+ (Fig. 12C). Under high-K+ conditions,
influx was suppressed by TEA+ and, surprisingly, stimulated by BaCl2 (Fig. 12E), as also
observed with 5 mM CaCl2 and Ca(NO3)2 (Fig. 12F). Cs+, a potent inhibitor of both K+ channels
and high-affinity transporters (Krol and Trebacz 2000; White and Broadley 2000), significantly
suppressed K+ influx at low, intermediate, and high K+, by 41%, 81%, and 57%, respectively
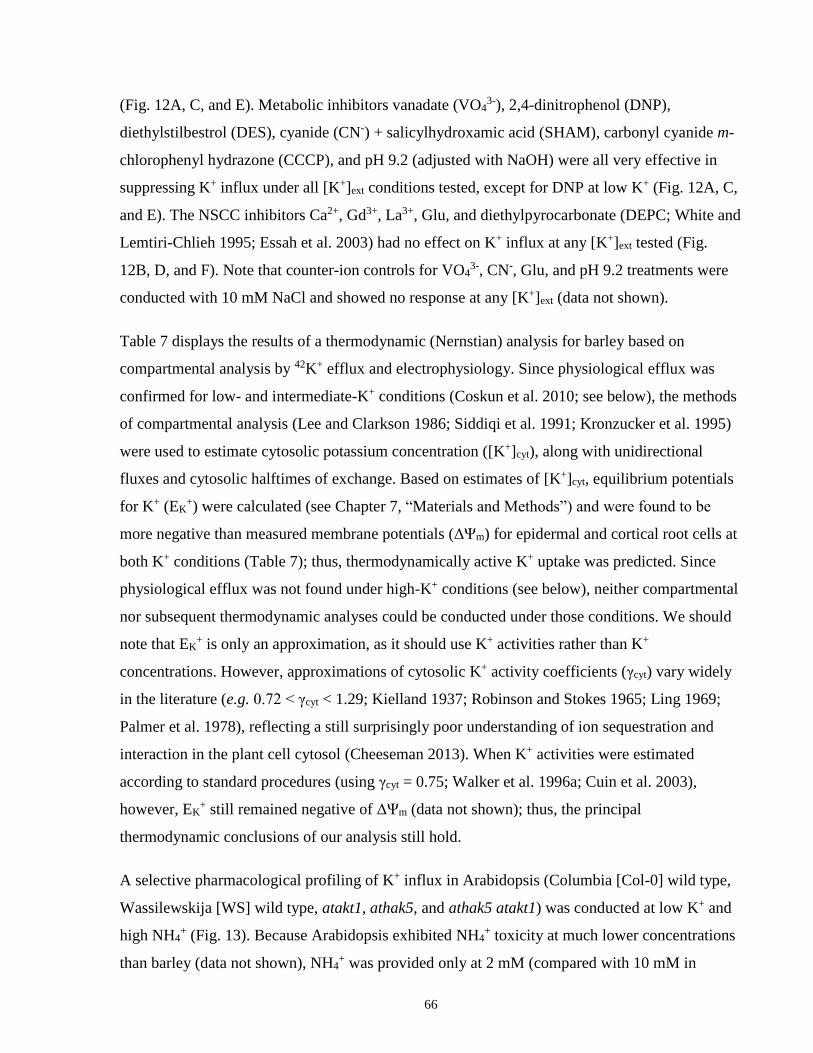
66
(Fig. 12A, C, and E). Metabolic inhibitors vanadate (VO43-), 2,4-dinitrophenol (DNP),
diethylstilbestrol (DES), cyanide (CN-) + salicylhydroxamic acid (SHAM), carbonyl cyanide m-
chlorophenyl hydrazone (CCCP), and pH 9.2 (adjusted with NaOH) were all very effective in
suppressing K+ influx under all [K+]ext conditions tested, except for DNP at low K+ (Fig. 12A, C,
and E). The NSCC inhibitors Ca2+, Gd3+, La3+, Glu, and diethylpyrocarbonate (DEPC; White and
Lemtiri-Chlieh 1995; Essah et al. 2003) had no effect on K+ influx at any [K+]ext tested (Fig.
12B, D, and F). Note that counter-ion controls for VO43-, CN-, Glu, and pH 9.2 treatments were
conducted with 10 mM NaCl and showed no response at any [K+]ext (data not shown).
Table 7 displays the results of a thermodynamic (Nernstian) analysis for barley based on
compartmental analysis by 42K+ efflux and electrophysiology. Since physiological efflux was
confirmed for low- and intermediate-K+ conditions (Coskun et al. 2010; see below), the methods
of compartmental analysis (Lee and Clarkson 1986; Siddiqi et al. 1991; Kronzucker et al. 1995)
were used to estimate cytosolic potassium concentration ([K+]cyt), along with unidirectional
fluxes and cytosolic halftimes of exchange. Based on estimates of [K+]cyt, equilibrium potentials
for K+ (EK+) were calculated (see Chapter 7, “Materials and Methods”) and were found to be
more negative than measured membrane potentials (ΔΨm) for epidermal and cortical root cells at
both K+ conditions (Table 7); thus, thermodynamically active K+ uptake was predicted. Since
physiological efflux was not found under high-K+ conditions (see below), neither compartmental
nor subsequent thermodynamic analyses could be conducted under those conditions. We should
note that EK+ is only an approximation, as it should use K+ activities rather than K+
concentrations. However, approximations of cytosolic K+ activity coefficients (γcyt) vary widely
in the literature (e.g. 0.72 < γcyt < 1.29; Kielland 1937; Robinson and Stokes 1965; Ling 1969;
Palmer et al. 1978), reflecting a still surprisingly poor understanding of ion sequestration and
interaction in the plant cell cytosol (Cheeseman 2013). When K+ activities were estimated
according to standard procedures (using γcyt = 0.75; Walker et al. 1996a; Cuin et al. 2003),
however, EK+ still remained negative of ΔΨm (data not shown); thus, the principal
thermodynamic conclusions of our analysis still hold.
A selective pharmacological profiling of K+ influx in Arabidopsis (Columbia [Col-0] wild type,
Wassilewskija [WS] wild type, atakt1, athak5, and athak5 atakt1) was conducted at low K+ and
high NH4+ (Fig. 13). Because Arabidopsis exhibited NH4
+ toxicity at much lower concentrations
than barley (data not shown), NH4+ was provided only at 2 mM (compared with 10 mM in
67
barley). Unlike barley, Arabidopsis wild-type lines generally displayed TEA+ and Ba2+
sensitivity under low-K+, high-NH4+ conditions (although it was not statistically significant in the
case of TEA+ for WS; Fig. 13B). Consistent with their pharmacological targeting (see above),
TEA+ and Ba2+ sensitivity was not found in the AtAKT1 knockout lines atakt1 and athak5 atakt1
(Fig. 13C and E). Further confirmation of the involvement of AtAKT1 was provided by the
dramatic decrease in steady-state influx in atakt1 and athak5 atakt1 lines compared with their
respective wild types (59% and 78%, respectively), while influx for athak5 was essentially equal
to the Col-0 wild type and displayed both TEA+ and Ba2+ sensitivity (albeit not statistically
significant in the case of TEA+; Fig. 13D). Cs+ significantly suppressed steady-state influx in all
lines, including athak5 atakt1 (Fig. 13A–D), while pH 9.2 was about as effective as Cs+ in all
cases except in athak5 atakt1 (Fig. 13A–D). Ca2+ was ineffective at suppressing steady-state
influx in all lines (Fig. 13A–D).
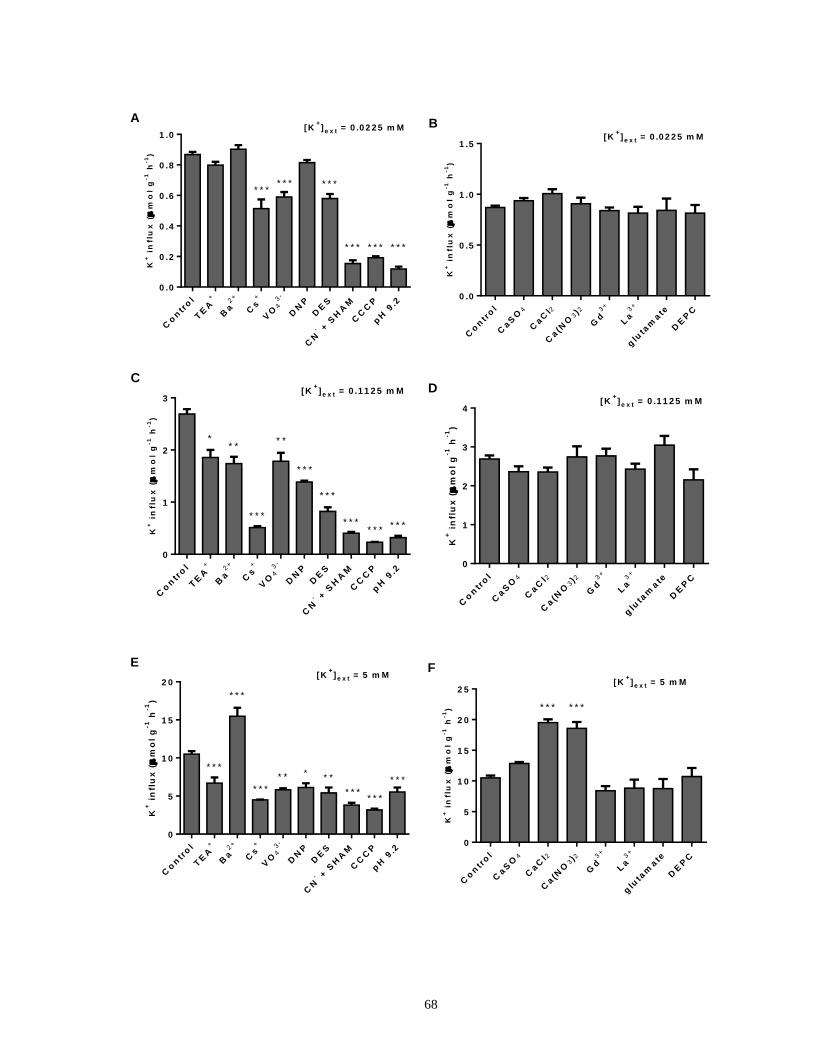
68
Co
ntr
ol
TE
A+
Ba2+
Cs+
VO
43-
DN
P
DE
S
CN- +
SH
AM
CC
CP
pH
9.2
0 .0
0 .2
0 .4
0 .6
0 .8
1 .0
* * ** * *
* * *
* * *
* * * * * *
A[K
+]e x t = 0 .0 2 2 5 m M
K+
in
flu
x (
mo
l g
-1 h
-1)
Co
ntr
ol
CaS
O4
CaC
l2
Ca(N
O3)2
Gd3+
La3+
glu
tam
ate
DE
PC
0 .0
0 .5
1 .0
1 .5
B[K
+]e x t = 0 .0 2 2 5 m M
K+
in
flu
x (
mo
l g
-1 h
-1)
Co
ntr
ol
TE
A+
Ba2+
Cs+
VO
43-
DN
P
DE
S
CN- +
SH
AM
CC
CP
pH
9.2
0
1
2
3
** *
* *
* * *
* * *
C
* * *
* * ** * *
* * *
[K+]e x t = 0 .1 1 2 5 m M
K+
in
flu
x (
mo
l g
-1 h
-1)
Co
ntr
ol
CaS
O4
CaC
l2
Ca(N
O3)2
Gd3+
La3+
glu
tam
ate
DE
PC
0
1
2
3
4
D[K
+]e x t = 0 .1 1 2 5 m M
K+ i
nfl
ux
(
mo
l g
-1 h
-1)
Co
ntr
ol
TE
A+
Ba2+
Cs+
VO
43-
DN
P
DE
S
CN- +
SH
AM
CC
CP
pH
9.2
0
5
1 0
1 5
2 0
* * *
* * *
* * *
* *
E
** *
* * ** * *
* * *
[K+]e x t = 5 m M
K+ i
nfl
ux
(
mo
l g
-1 h
-1)
Co
ntr
ol
CaS
O4
CaC
l2
Ca(N
O3)2
Gd3+
La3+
glu
tam
ate
DE
PC
0
5
1 0
1 5
2 0
2 5
* * * * * *
F[K
+]e x t = 5 m M
K+
in
flu
x (
mo
l g
-1 h
-1)
69
Figure 12. The effects of various pharmacological and nutritional treatments, targeting either
Shaker-like K+ channels and HAK/KUP/KT transporters (A, C, and E) or NSCCs (B, D, and F),
on steady-state K+ influx in intact roots of barley seedlings grown on a full-nutrient medium at
low (A and B), intermediate (C and D), and high (E and F) [K+]ext and 10 mM [NH4+]ext. Fluxes
are indicated on a root fresh weight basis. Asterisks denote different levels of significance
between control and treatment pairs (*0.01 < P < 0.05, **0.001 < P < 0.01, ***P < 0.001; one-
way ANOVA with Dunnett’s multiple comparison post-hoc test). Each treatment represents the
mean of four to 69 replicates. Error bars indicate SE.
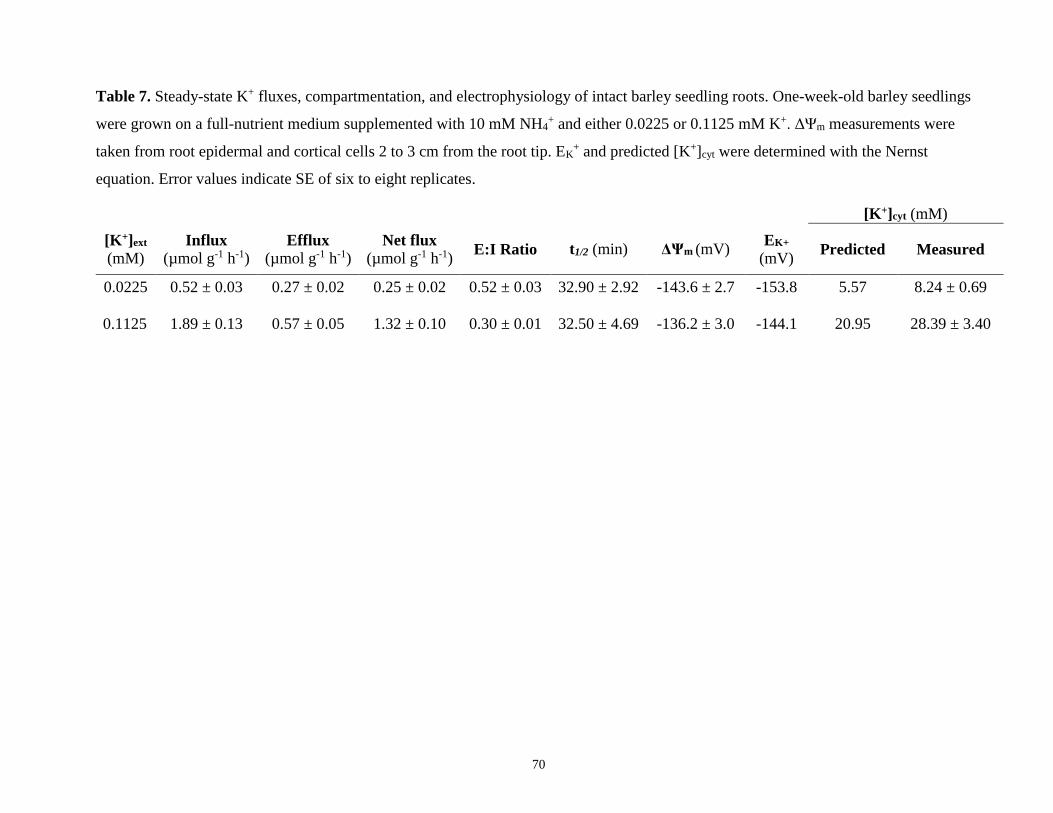
70
Table 7. Steady-state K+ fluxes, compartmentation, and electrophysiology of intact barley seedling roots. One-week-old barley seedlings
were grown on a full-nutrient medium supplemented with 10 mM NH4+ and either 0.0225 or 0.1125 mM K+. ΔΨm measurements were
taken from root epidermal and cortical cells 2 to 3 cm from the root tip. EK+ and predicted [K+]cyt were determined with the Nernst
equation. Error values indicate SE of six to eight replicates.
[K+]cyt (mM)
[K+]ext
(mM) Influx
(µmol g-1 h-1) Efflux
(µmol g-1 h-1) Net flux
(µmol g-1 h-1) E:I Ratio t1/2 (min) ΔΨm (mV)
EK+
(mV) Predicted Measured
0.0225 0.52 ± 0.03 0.27 ± 0.02 0.25 ± 0.02 0.52 ± 0.03 32.90 ± 2.92 -143.6 ± 2.7 -153.8 5.57 8.24 ± 0.69
0.1125 1.89 ± 0.13 0.57 ± 0.05 1.32 ± 0.10 0.30 ± 0.01 32.50 ± 4.69 -136.2 ± 3.0 -144.1 20.95 28.39 ± 3.40
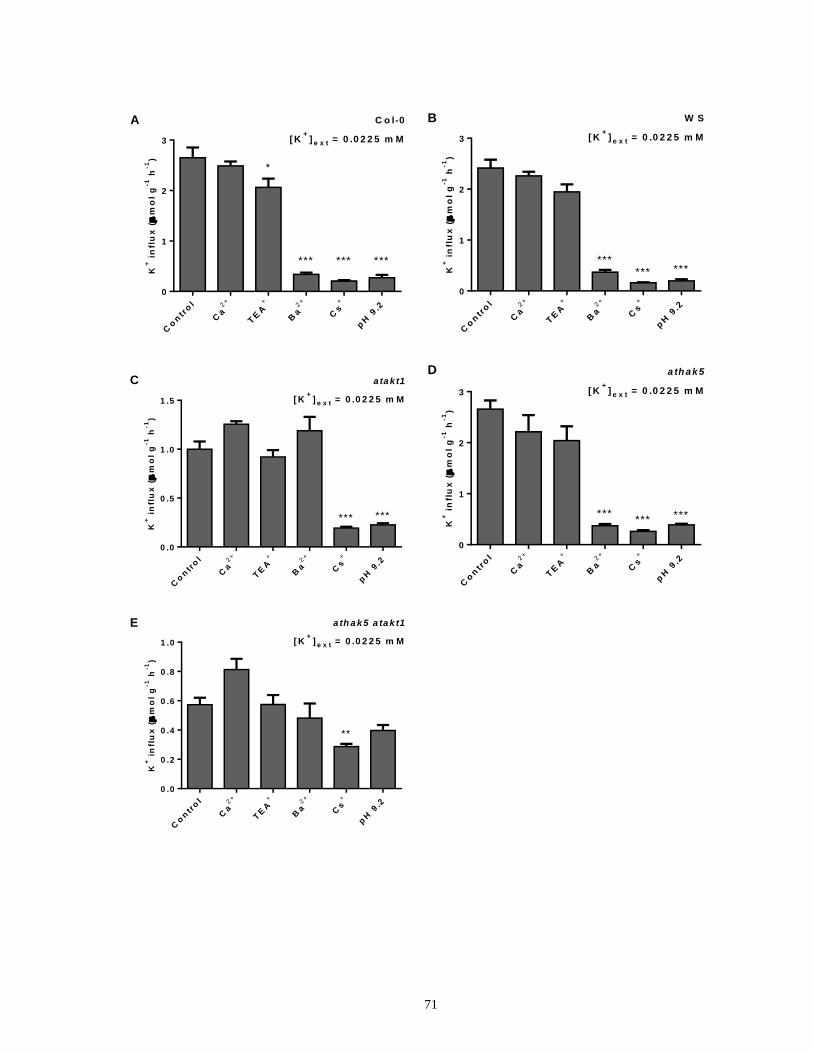
71
Co
ntr
ol
Ca2+
TE
A+
Ba2+
Cs+
pH
9.2
0
1
2
3
K+ i
nfl
ux
(
mo
l g
-1 h
-1)
A C o l-0
[ K+
] e x t = 0 .0 2 2 5 m M
***
*
*** ***
Co
ntr
ol
Ca2+
TE
A+
Ba2+
Cs+
pH
9.2
0
1
2
3
****** ***
B W S
[ K+
] e x t = 0 .0 2 2 5 m M
K+ i
nfl
ux
(
mo
l g
-1 h
-1)
Co
ntr
ol
Ca2+
TE
A+
Ba2+
Cs+
pH
9.2
0 .0
0 .5
1 .0
1 .5
*** ***
C a takt1
[ K+
] e x t = 0 .0 2 2 5 m M
K+ i
nfl
ux
(
mo
l g
-1 h
-1)
Co
ntr
ol
Ca2+
TE
A+
Ba2+
Cs+
pH
9.2
0
1
2
3
****** ***
D a th ak5
[ K+
] e x t = 0 .0 2 2 5 m M
K+ i
nfl
ux
(
mo
l g
-1 h
-1)
Co
ntr
ol
Ca2+
TE
A+
Ba2+
Cs+
pH
9.2
0 .0
0 .2
0 .4
0 .6
0 .8
1 .0
**
E a th a k5 a ta k t1
[ K+
] e x t = 0 .0 2 2 5 m M
K+ i
nfl
ux
(
mo
l g
-1 h
-1)
72
Figure 13. The effects of various pharmacological and nutritional treatments on steady-state K+
influx in intact roots of Arabidopsis Col-0 wild type (A), WS wild type (B), atakt1 (C), athak5
(D), and athak5 atakt1 (E) grown on a full-nutrient medium at low [K+]ext and 2 mM [NH4+]ext.
Fluxes are indicated on a root fresh weight basis. Asterisks denote different levels of significance
between control and treatment pairs (*0.01 < P < 0.05, **0.001 < P < 0.01, ***P < 0.001; one-
way ANOVA with Dunnett’s multiple comparison post-hoc test). Each treatment represents the
mean of three to 14 replicates. Error bars indicate SE.
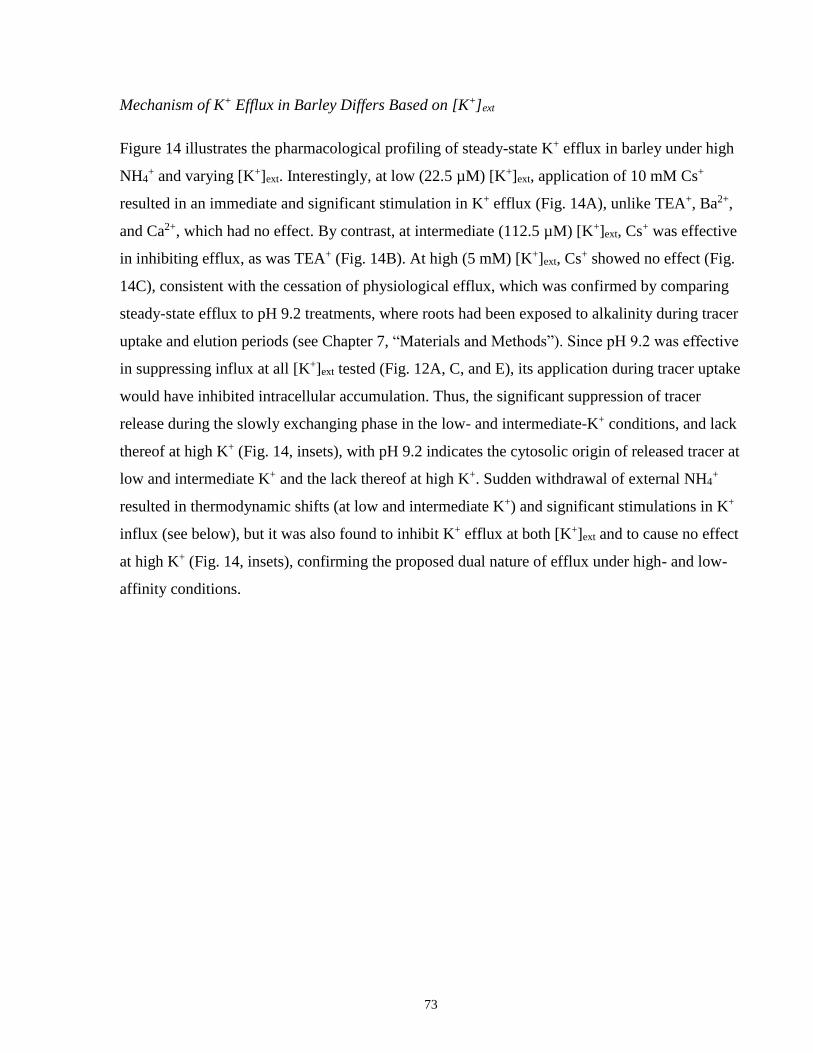
73
Mechanism of K+ Efflux in Barley Differs Based on [K+]ext
Figure 14 illustrates the pharmacological profiling of steady-state K+ efflux in barley under high
NH4+ and varying [K+]ext. Interestingly, at low (22.5 µM) [K+]ext, application of 10 mM Cs+
resulted in an immediate and significant stimulation in K+ efflux (Fig. 14A), unlike TEA+, Ba2+,
and Ca2+, which had no effect. By contrast, at intermediate (112.5 µM) [K+]ext, Cs+ was effective
in inhibiting efflux, as was TEA+ (Fig. 14B). At high (5 mM) [K+]ext, Cs+ showed no effect (Fig.
14C), consistent with the cessation of physiological efflux, which was confirmed by comparing
steady-state efflux to pH 9.2 treatments, where roots had been exposed to alkalinity during tracer
uptake and elution periods (see Chapter 7, “Materials and Methods”). Since pH 9.2 was effective
in suppressing influx at all [K+]ext tested (Fig. 12A, C, and E), its application during tracer uptake
would have inhibited intracellular accumulation. Thus, the significant suppression of tracer
release during the slowly exchanging phase in the low- and intermediate-K+ conditions, and lack
thereof at high K+ (Fig. 14, insets), with pH 9.2 indicates the cytosolic origin of released tracer at
low and intermediate K+ and the lack thereof at high K+. Sudden withdrawal of external NH4+
resulted in thermodynamic shifts (at low and intermediate K+) and significant stimulations in K+
influx (see below), but it was also found to inhibit K+ efflux at both [K+]ext and to cause no effect
at high K+ (Fig. 14, insets), confirming the proposed dual nature of efflux under high- and low-
affinity conditions.
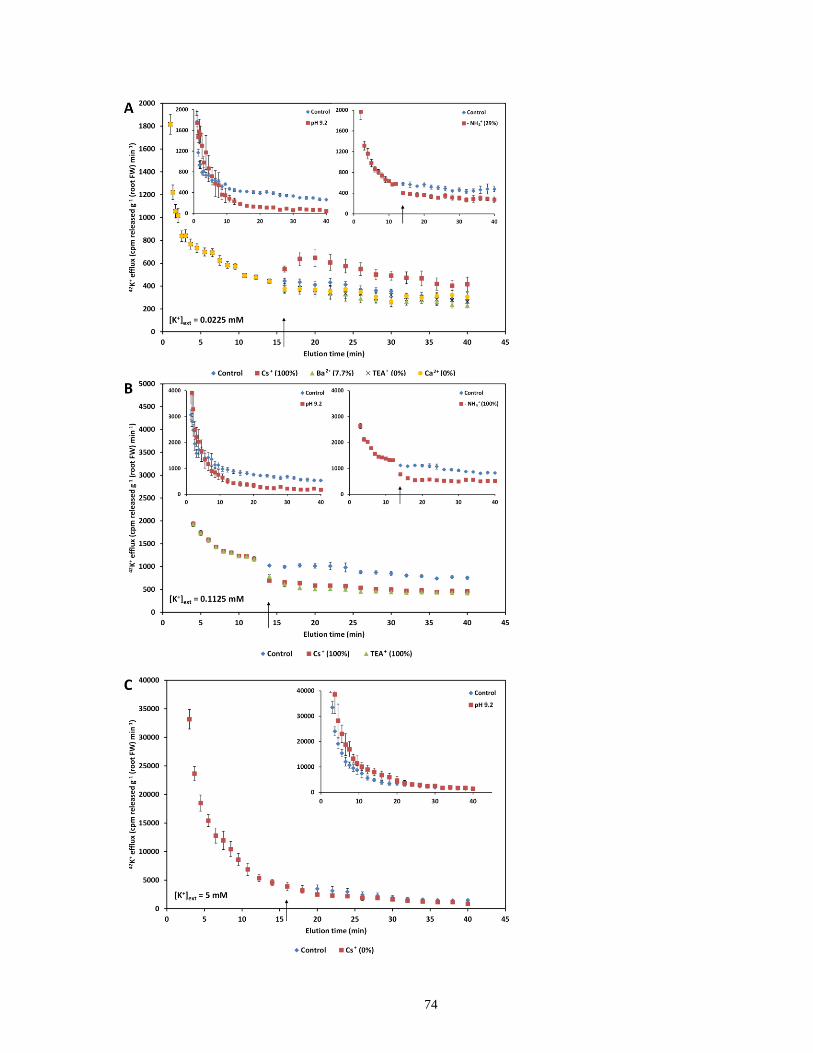
74
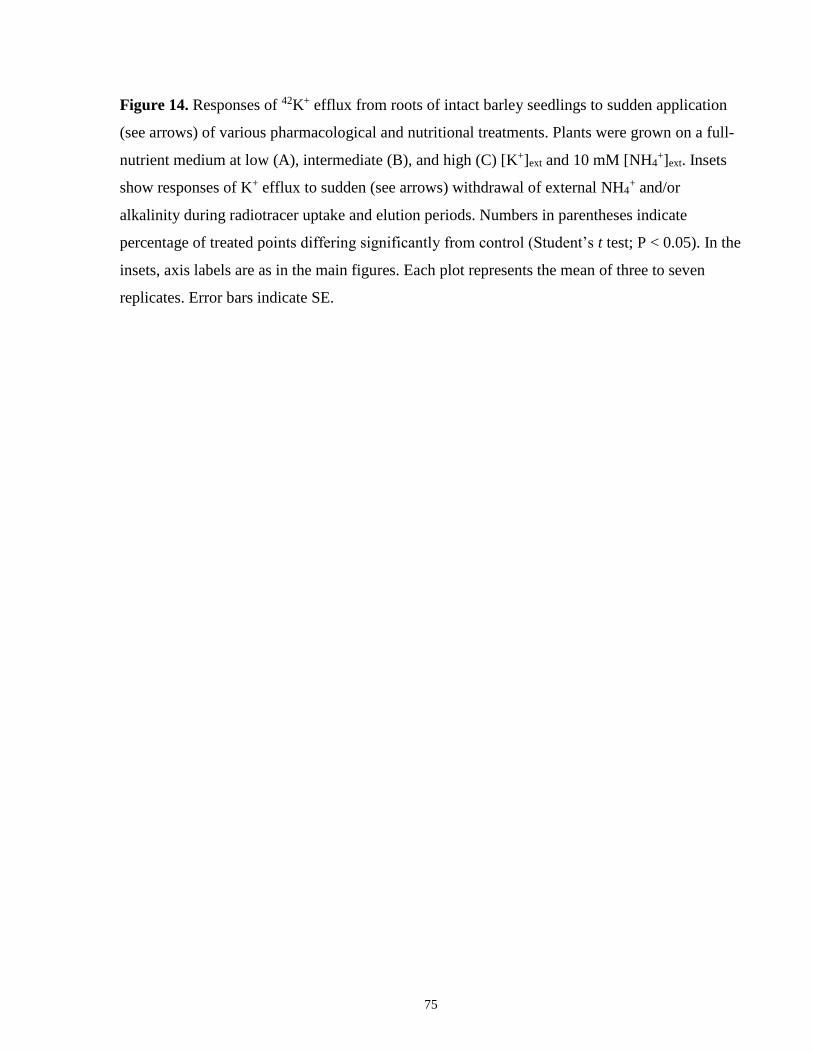
75
Figure 14. Responses of 42K+ efflux from roots of intact barley seedlings to sudden application
(see arrows) of various pharmacological and nutritional treatments. Plants were grown on a full-
nutrient medium at low (A), intermediate (B), and high (C) [K+]ext and 10 mM [NH4+]ext. Insets
show responses of K+ efflux to sudden (see arrows) withdrawal of external NH4+ and/or
alkalinity during radiotracer uptake and elution periods. Numbers in parentheses indicate
percentage of treated points differing significantly from control (Student’s t test; P < 0.05). In the
insets, axis labels are as in the main figures. Each plot represents the mean of three to seven
replicates. Error bars indicate SE.
76
NH4+ Withdrawal Results In Thermodynamic Shifts and Significant K+ Influx
K+ influx was stimulated by sudden withdrawal (5-min pretreatment) of NH4+, by 176%, 355%,
and 131% (corresponding to 2.4 ± 0.1, 12.0 ± 0.4, and 24.3 ± 0.7 µmol g-1 (root fresh weight) h-1,
respectively), at low-, intermediate-, and high-K+ conditions, respectively (Fig. 15). NH4+
withdrawal also led to immediate and significant hyperpolarization of root epidermal and cortical
ΔΨm (59.1 ± 13.2, 53.1 ± 8.3, and 31.4 ± 4.9 mV at low, intermediate, and high K+,
respectively), corresponding to ΔΨm much more negative than EK+ and, thus, thermodynamic
shifts (active to passive influx) at low and intermediate K+ (Table 8; compare with Table 7).
This ammonium withdrawal effect (AWE) in barley was also found in Arabidopsis wild-type
lines, resulting in 142% and 175% increases in K+ influx for Col-0 and WS, respectively (Fig.
16A and B). Interestingly, AWE was also consistently observed in the knockout lines atakt1
(513%), athak5 (167%), and athak5 atakt1 (32% [albeit not statistically significant]; Fig. 16C–
E). As in barley, NH4+ withdrawal also consistently resulted in hyperpolarization of the plasma
membrane of root epidermal and cortical cells in all lines except athak5 atakt1 (albeit not
statistically significant in the cases of WS and athak5; Table 8).
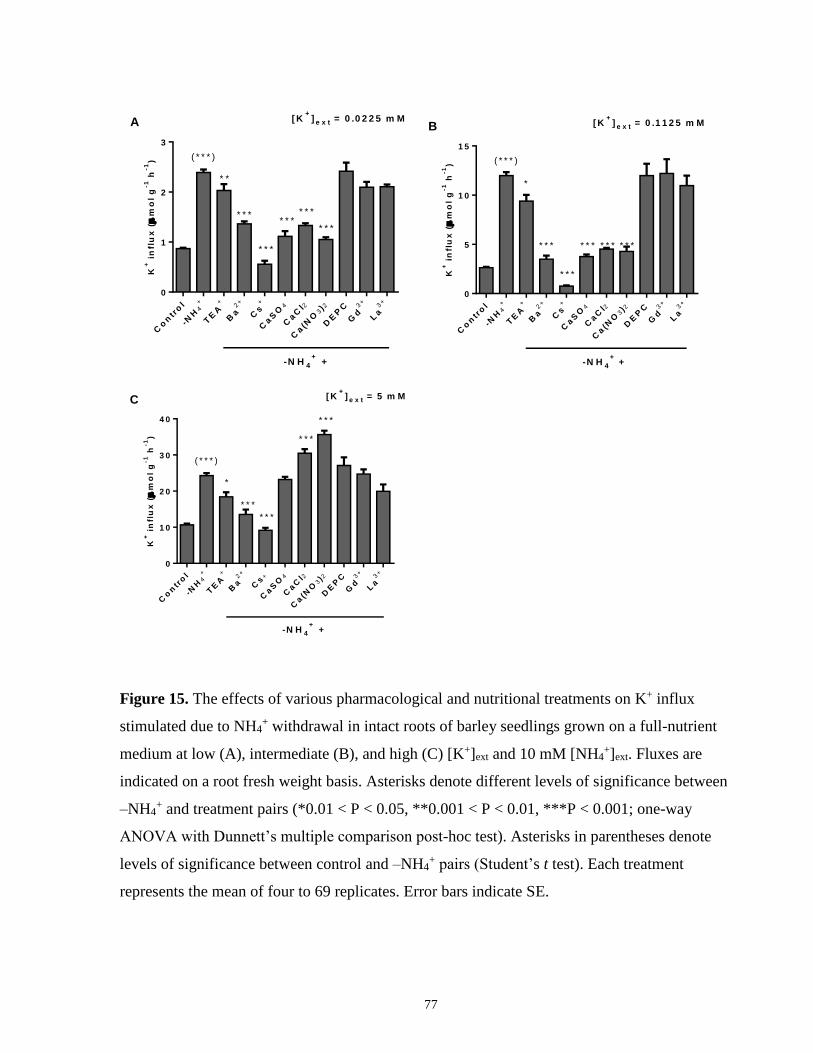
77
Figure 15. The effects of various pharmacological and nutritional treatments on K+ influx
stimulated due to NH4+ withdrawal in intact roots of barley seedlings grown on a full-nutrient
medium at low (A), intermediate (B), and high (C) [K+]ext and 10 mM [NH4+]ext. Fluxes are
indicated on a root fresh weight basis. Asterisks denote different levels of significance between
–NH4+ and treatment pairs (*0.01 < P < 0.05, **0.001 < P < 0.01, ***P < 0.001; one-way
ANOVA with Dunnett’s multiple comparison post-hoc test). Asterisks in parentheses denote
levels of significance between control and –NH4+ pairs (Student’s t test). Each treatment
represents the mean of four to 69 replicates. Error bars indicate SE.
Co
ntr
ol
-NH
4+
TE
A+
Ba2+
Cs+
CaS
O4
CaC
l2
Ca(N
O3)2
DE
PC
Gd3+
La3+
0
1
2
3
* * *
* * *
* * *
-N H 4
+ +
* *
* * ** * *
A [ K+
] e x t = 0 .0 2 2 5 m M
( * * * )K
+ i
nfl
ux
(
mo
l g
-1 h
-1)
Co
ntr
ol
-NH
4+
TE
A+
Ba2+
Cs+
CaS
O4
CaC
l2
Ca(N
O3)2
DE
PC
Gd3+
La3+
0
5
1 0
1 5
-N H 4
++
B
*
* * *
* * *
* * * * * * * * *
[ K+
] e x t = 0 .1 1 2 5 m M
( * * * )
K+ i
nfl
ux
(
mo
l g
-1 h
-1)
Co
ntr
ol
-NH
4+
TE
A+
Ba2+
Cs
+
CaS
O4
CaC
l2
Ca(N
O3)2
DE
PC
Gd3+
La3+
0
1 0
2 0
3 0
4 0
-N H 4
+ +
C
*
* * *
* * *
* * *
* * *
[ K+
] e x t = 5 m M
( * * * )
K+ i
nfl
ux
(
mo
l g
-1 h
-1)
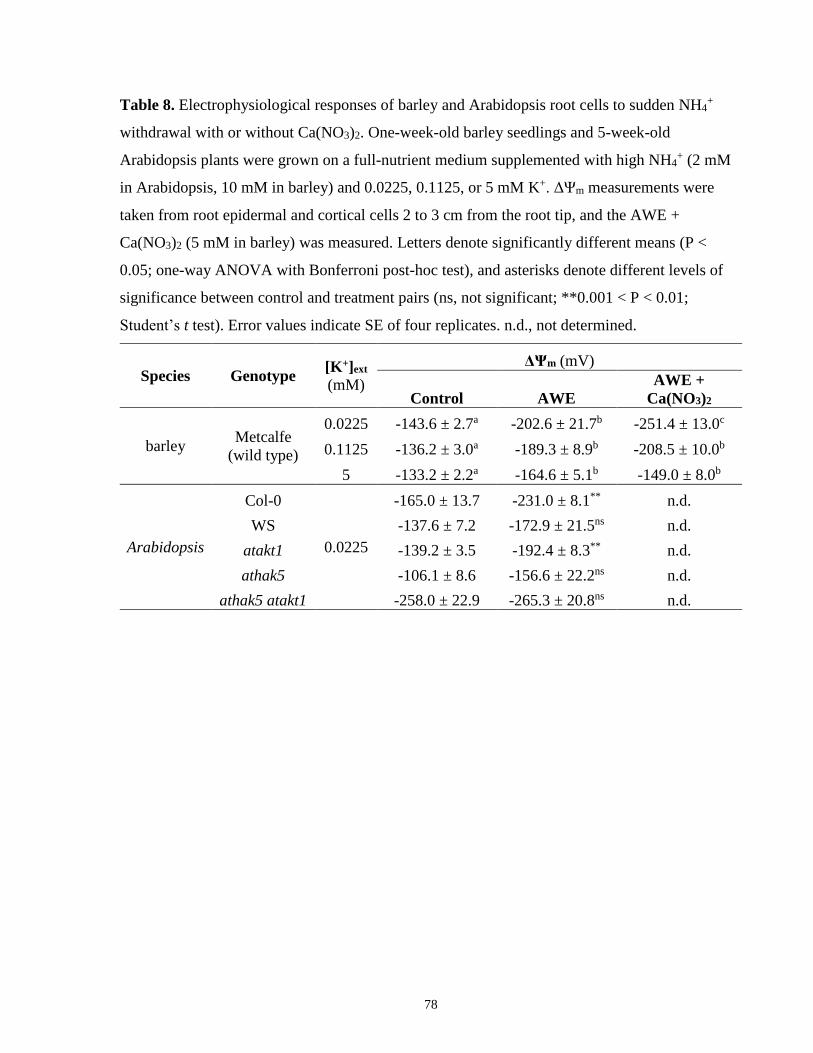
78
Table 8. Electrophysiological responses of barley and Arabidopsis root cells to sudden NH4+
withdrawal with or without Ca(NO3)2. One-week-old barley seedlings and 5-week-old
Arabidopsis plants were grown on a full-nutrient medium supplemented with high NH4+ (2 mM
in Arabidopsis, 10 mM in barley) and 0.0225, 0.1125, or 5 mM K+. ΔΨm measurements were
taken from root epidermal and cortical cells 2 to 3 cm from the root tip, and the AWE +
Ca(NO3)2 (5 mM in barley) was measured. Letters denote significantly different means (P <
0.05; one-way ANOVA with Bonferroni post-hoc test), and asterisks denote different levels of
significance between control and treatment pairs (ns, not significant; **0.001 < P < 0.01;
Student’s t test). Error values indicate SE of four replicates. n.d., not determined.
Species Genotype [K+]ext
(mM)
ΔΨm (mV)
Control AWE
AWE +
Ca(NO3)2
barley Metcalfe
(wild type)
0.0225 -143.6 ± 2.7a -202.6 ± 21.7b -251.4 ± 13.0c
0.1125 -136.2 ± 3.0a -189.3 ± 8.9b -208.5 ± 10.0b
5 -133.2 ± 2.2a -164.6 ± 5.1b -149.0 ± 8.0b
Arabidopsis
Col-0
0.0225
-165.0 ± 13.7 -231.0 ± 8.1** n.d.
WS -137.6 ± 7.2 -172.9 ± 21.5ns n.d.
atakt1 -139.2 ± 3.5 -192.4 ± 8.3** n.d.
athak5 -106.1 ± 8.6 -156.6 ± 22.2ns n.d.
athak5 atakt1 -258.0 ± 22.9 -265.3 ± 20.8ns n.d.
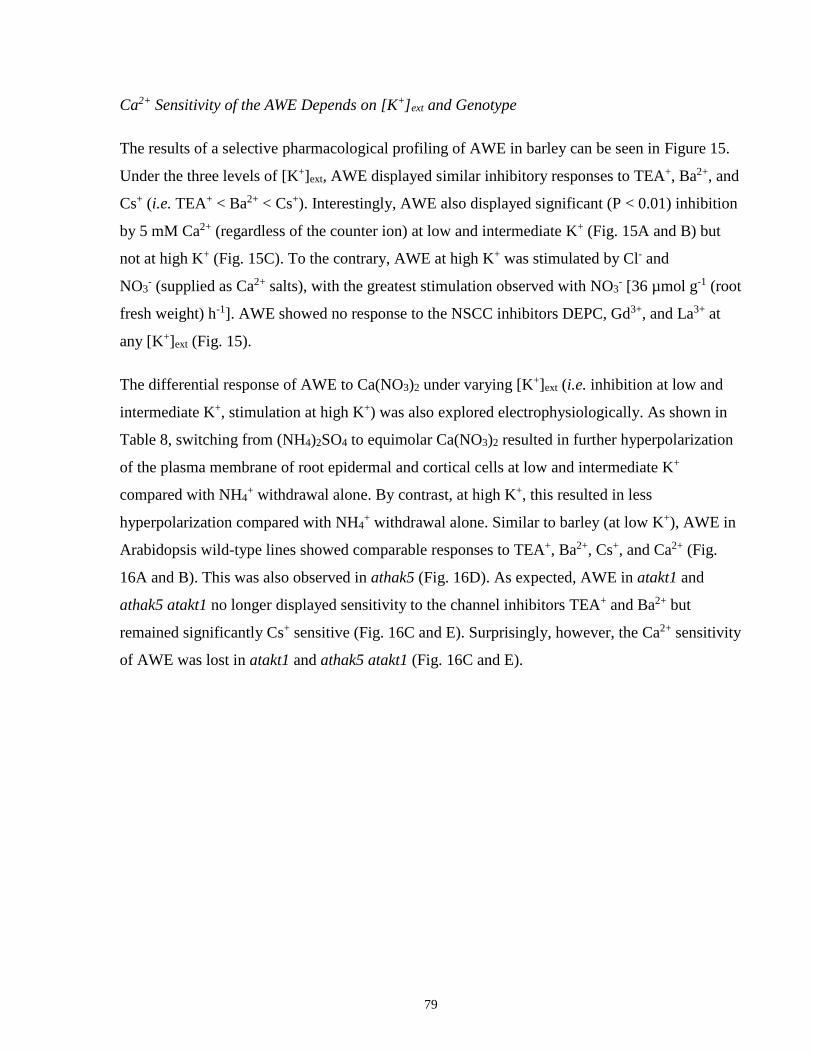
79
Ca2+ Sensitivity of the AWE Depends on [K+]ext and Genotype
The results of a selective pharmacological profiling of AWE in barley can be seen in Figure 15.
Under the three levels of [K+]ext, AWE displayed similar inhibitory responses to TEA+, Ba2+, and
Cs+ (i.e. TEA+ < Ba2+ < Cs+). Interestingly, AWE also displayed significant (P < 0.01) inhibition
by 5 mM Ca2+ (regardless of the counter ion) at low and intermediate K+ (Fig. 15A and B) but
not at high K+ (Fig. 15C). To the contrary, AWE at high K+ was stimulated by Cl- and
NO3- (supplied as Ca2+ salts), with the greatest stimulation observed with NO3
- [36 µmol g-1 (root
fresh weight) h-1]. AWE showed no response to the NSCC inhibitors DEPC, Gd3+, and La3+ at
any [K+]ext (Fig. 15).
The differential response of AWE to Ca(NO3)2 under varying [K+]ext (i.e. inhibition at low and
intermediate K+, stimulation at high K+) was also explored electrophysiologically. As shown in
Table 8, switching from (NH4)2SO4 to equimolar Ca(NO3)2 resulted in further hyperpolarization
of the plasma membrane of root epidermal and cortical cells at low and intermediate K+
compared with NH4+ withdrawal alone. By contrast, at high K+, this resulted in less
hyperpolarization compared with NH4+ withdrawal alone. Similar to barley (at low K+), AWE in
Arabidopsis wild-type lines showed comparable responses to TEA+, Ba2+, Cs+, and Ca2+ (Fig.
16A and B). This was also observed in athak5 (Fig. 16D). As expected, AWE in atakt1 and
athak5 atakt1 no longer displayed sensitivity to the channel inhibitors TEA+ and Ba2+ but
remained significantly Cs+ sensitive (Fig. 16C and E). Surprisingly, however, the Ca2+ sensitivity
of AWE was lost in atakt1 and athak5 atakt1 (Fig. 16C and E).
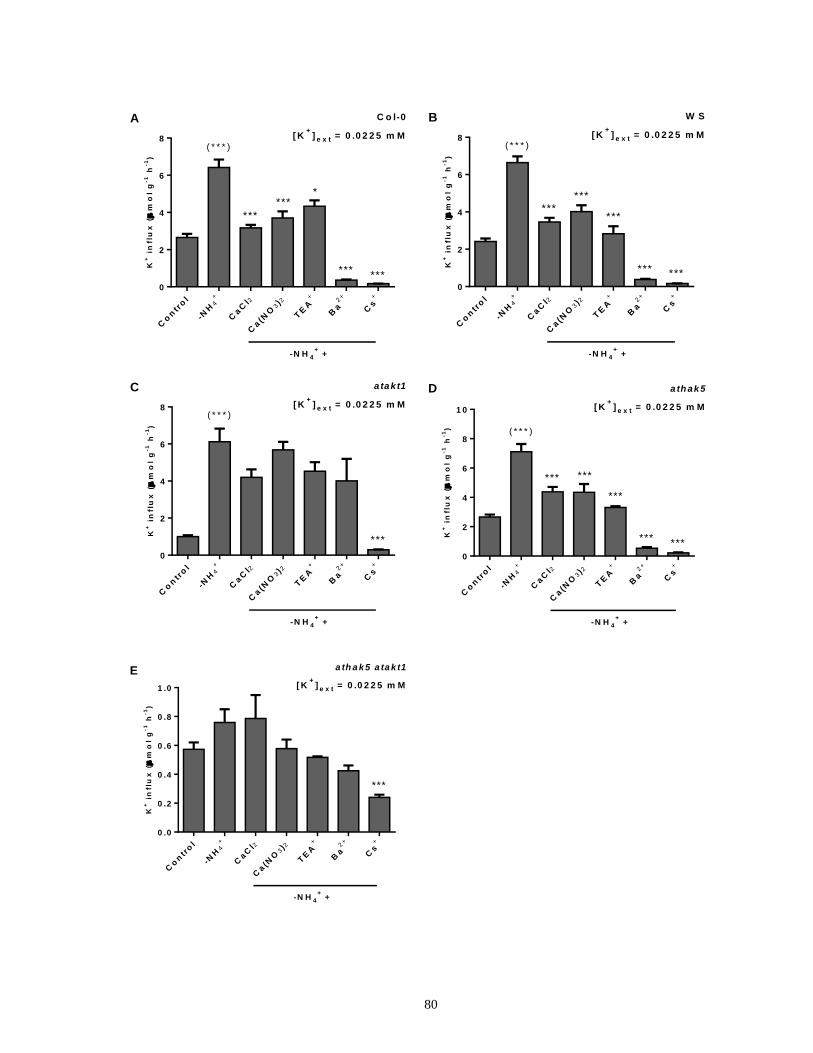
80
Co
ntr
ol
-NH
4+
CaC
l2
Ca(N
O3)2
TE
A+
Ba2+
Cs+
0
2
4
6
8
-N H 4
+ +
*
***
***
******
A C o l-0
[ K+
] e x t = 0 .0 2 2 5 m M
( * * * )K
+ i
nfl
ux
(
mo
l g
-1 h
-1)
Co
ntr
ol
-NH
4+
CaC
l2
Ca(N
O3)2
TE
A+
Ba2+
Cs+
0
2
4
6
8
-N H 4
+ +
******
***
*** ***
B W S
[ K+
] e x t = 0 .0 2 2 5 m M( * * * )
K+
in
flu
x (
mo
l g
-1 h
-1)
Co
ntr
ol
-NH
4+
CaC
l2
Ca(N
O3)2
TE
A+
Ba2+
Cs+
0
2
4
6
8
-N H 4
+ +
***
C a takt1
[ K+
] e x t = 0 .0 2 2 5 m M( * * * )
K+
in
flu
x (
mo
l g
-1 h
-1)
Co
ntr
ol
-NH
4+
CaC
l2
Ca(N
O3)2
TE
A+
Ba2+
Cs+
0
2
4
6
8
1 0
-N H 4
+ +
*** ***
***
******
D a th ak5
[ K+
] e x t = 0 .0 2 2 5 m M
( * * * )
K+
in
flu
x (
mo
l g
-1 h
-1)
Co
ntr
ol
-NH
4+
CaC
l2
Ca(N
O3)2
TE
A+
Ba2+
Cs+
0 .0
0 .2
0 .4
0 .6
0 .8
1 .0
-N H 4
+ +
***
E a th a k5 a ta k t1
[ K+
] e x t = 0 .0 2 2 5 m M
K+
in
flu
x (
mo
l g
-1 h
-1)
81
Figure 16. The effects of various pharmacological and nutritional treatments on K+ influx
stimulated due to NH4+ withdrawal in intact roots of Arabidopsis Col-0 wild type (A), WS wild
type (B), atakt1 (C), athak5 (D), and athak5 atakt1 (E) grown on a full-nutrient medium at low
[K+]ext and 2 mM [NH4+]ext. Fluxes are indicated on a root fresh weight basis. Asterisks denote
different levels of significance between –NH4+ and treatment pairs (*0.01 < P < 0.05, **0.001 <
P < 0.01, ***P < 0.001; one-way ANOVA with Dunnett’s multiple comparison post-hoc test).
Asterisks in parentheses denote levels of significance between control and –NH4+ pairs
(Student’s t test). Each treatment represents the mean of four to 14 replicates. Error bars indicate
SE.
82
AWE over 24 h Reveals Peaks in K+ Influx and Leads to Tissue K+ Accumulation
Figure 17 illustrates the sustainability of AWE (i.e. elevated K+ influx after ammonium
withdrawal) and its magnitude over 24 h at all three K+ levels in barley. At low K+, AWE was
not only sustained over 24 h but continued to rise, reaching 4.2 µmol g-1 (root fresh weight) h-1 (a
4.6-fold increase from control). At intermediate K+, AWE plateaued between 8 and 12 h,
reaching 10 µmol g-1 (root fresh weight) h-1 (a 6.8-fold increase from control), before dropping to
approximately 5 µmol g-1 (root fresh weight) h-1 by 24 h. At high K+, AWE peaked at 25 µmol
g-1 (root fresh weight) h-1 by 1 h before leveling off at approximately 10 µmol g-1 (root fresh
weight) h-1 by the end of the 24-h period. Despite variations in the sustainability of AWE (Fig.
17), NH4+ withdrawal consistently resulted in increased tissue (shoot, root, and total) K+
accumulation over 24 h at all K+ levels tested. By the end of 24 h, NH4+ withdrawal resulted in
136%, 150%, and 27% increases in total tissue K+ levels under low-, intermediate-, and high-K+
conditions, respectively (Fig. 18). Interestingly, NH4+ withdrawal over 24 h also resulted in
increased tissue accumulation of Na+ (Fig. S1).
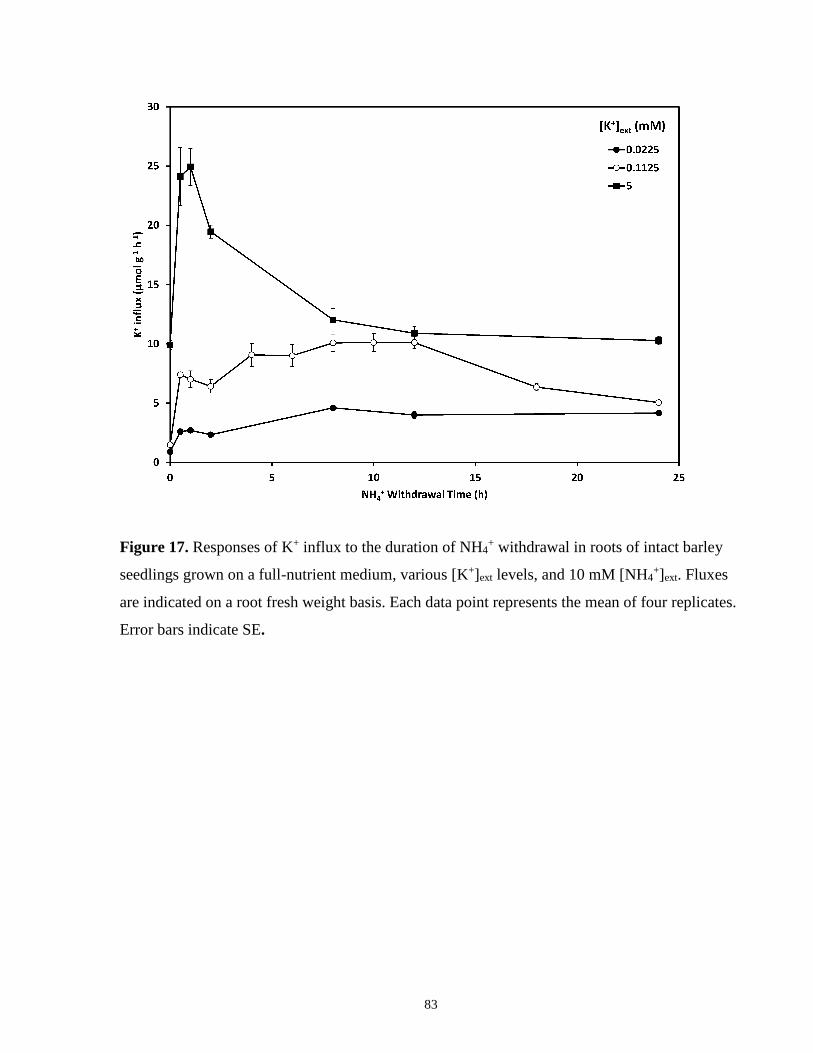
83
Figure 17. Responses of K+ influx to the duration of NH4+ withdrawal in roots of intact barley
seedlings grown on a full-nutrient medium, various [K+]ext levels, and 10 mM [NH4+]ext. Fluxes
are indicated on a root fresh weight basis. Each data point represents the mean of four replicates.
Error bars indicate SE.
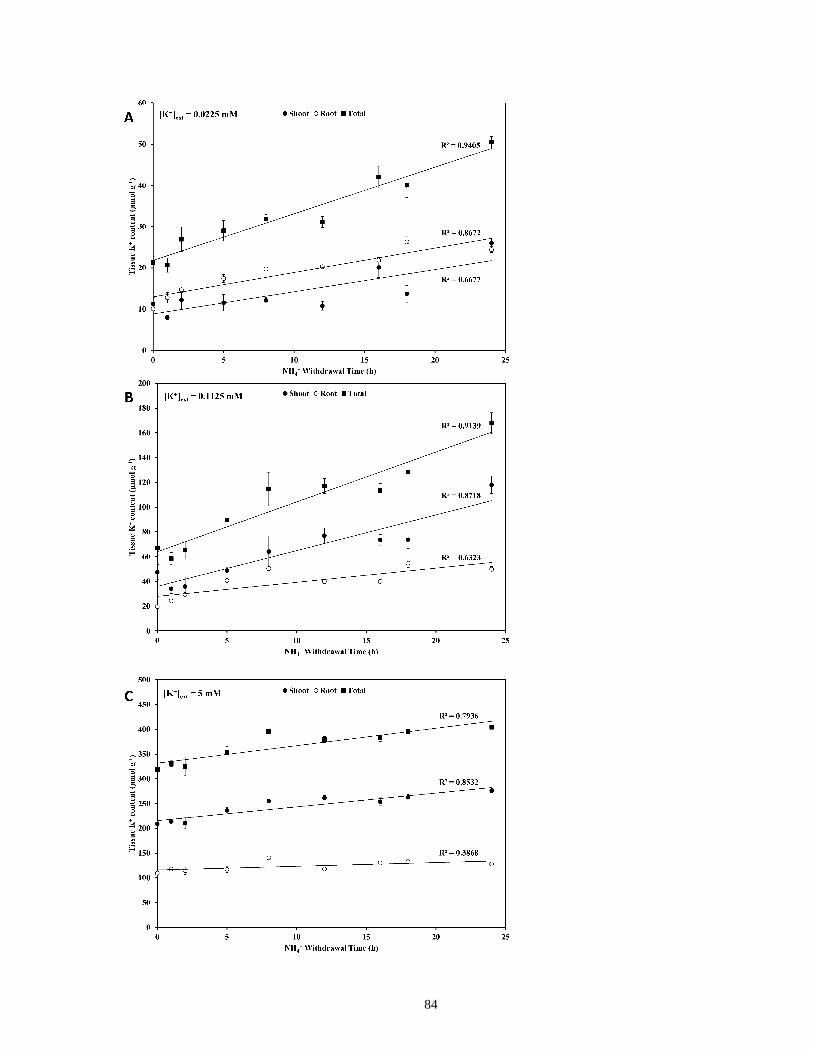
84

85
Figure 18. Responses of tissue-K+ content to the duration of NH4+ withdrawal in barley
seedlings grown on a full-nutrient medium at low (A), intermediate (B), and high (C) [K+]ext and
10 mM [NH4+]ext. Content measurements are indicated on a root fresh weight basis. Each data
point represents the mean of four replicates. Error bars indicate SE.
86
4.1.4 Discussion
Although the genetic identities of K+ channels and high-affinity transporters, and their
contributions to high- and low-affinity K+ uptake, have been examined extensively in
Arabidopsis, few studies have placed these fundamental discoveries into the context of
agriculturally important species such as barley. In this work, both barley and Arabidopsis were
grown at high external ammonium concentration ([NH4+]ext of 10 and 2 mM, respectively; the
difference a reflection of each species’ unique sensitivity to NH4+; Britto and Kronzucker 2002;
ten Hoopen et al. 2010) to inhibit high-affinity transporters and thereby isolate K+-channel
functioning (Hirsch et al. 1998; Spalding et al. 1999; Santa-María et al. 2000). We should also
note that each species was grown for different lengths of time in different media (see Chapter 7,
“Materials and Methods”), reflecting their different developmental programs and nutritional
preferences. Although differences in growth regime and developmental stage are important to
consider, both species displayed severely reduced high-affinity K+ uptake due to NH4+ (see
below), and this set the stage for critical evaluations and comparisons of K+-transporter
functioning. At the lowest [K+]ext tested (0.0225 mM), fundamental differences in the apparent
mechanisms of steady-state K+ uptake were observed between the two species (Fig. 19). In both
the wild type and athak5 mutants of Arabidopsis, K+ influx was blocked by the classic channel
inhibitors TEA+ and Ba2+ (Fig. 13A, B, and D), indicating the involvement of the Shaker-like K+
channel AtAKT1 at very low [K+]ext in this species (and confirming the results of Hirsch et al.
[1998] and Spalding et al. [1999]). Moreover, the AtAKT1 knockout lines atakt1 and athak5
atakt1 showed significantly lower (59% and 78%) influx than their respective wild types. By
contrast, in barley, neither TEA+ nor Ba2+ affected K+ influx at this [K+]ext (Fig. 12A), indicating
that it does not appear to involve (TEA+- or Ba2+-sensitive) channels; this is consistent with our
thermodynamic (Nernstian) analysis based on compartmental and electrophysiological data,
which predicted influx to be an active process (Table 7). Consistent with this analysis, influx in
barley was significantly suppressed by the K+-transporter inhibitor Cs+, the metabolic inhibitors
VO43-, DES, CN- + SHAM, and CCCP, and pH 9.2 (which collapses the electrochemical
potential difference for protons). Thus, it appears that steady-state potassium influx at low K+
and high NH4+, while reduced, is mediated by high-affinity transporters in this species, most
likely including HvHAK1 (Santa-María et al. 1997). We should note, however, that pH 9.2 also
inhibited steady-state influx in athak5 (Fig. 13D), indicating the possibility of alkalinity-induced
AtAKT1 inhibition (Fuchs et al. 2005).
87
Interestingly, the Cs+ sensitivity of K+ influx in athak5 atakt1 double mutants at low K+ suggests
that a genetically unidentified uptake system is operative, albeit at a relatively minor capacity.
This is in contrast to other reports suggesting that “unknown systems” only operate at high
[K+]ext (more than 0.5 mM; Pyo et al. 2010; Rubio et al. 2010). Thus, at least two distinct
unknown systems appear to operate in Arabidopsis; moreover, the pharmacological profile of
athak5 atakt1 in our study did not match that of others, particularly with respect to Ca2+ and Ba2+
sensitivity (Caballero et al. 2012). This raises the question of whether similar mechanisms are at
play in barley at low-K+, high-NH4+ conditions and provides avenues for future research.
At [K+]ext above 0.1 mM, by contrast, K+ channels do appear to participate in K+ uptake in
barley, since, at the intermediate [K+]ext tested (0.1125 mM), we observed significant inhibition
of K+ influx by TEA+ and Ba2+ (Fig. 12C). Although thermodynamic analyses suggested K+
uptake at intermediate K+ to be an active process (Table 7), this apparent contradiction most
likely reflects some methodological discrepancies. Pharmacological testing of K+ influx and
compartmental analysis of 42K+ efflux take the entire root into account and thus reflect an
average of different cell types along the root axis. On the other hand, electrophysiological
measurements of ΔΨm are, by nature, single-cell measurements and thus do not necessarily
represent the whole root. In fact, membrane polarization is known to follow the longitudinal axis
of the root, with the most polarized cells located near the root tip (Hirsch et al. 1998). As our
ΔΨm measurements were made 2 to 3 cm from the root tip (see Chapter 7, “Materials and
Methods”), it is likely that we measured from cells not polarized enough to conduct passive K+
uptake. Thus, at intermediate [K+]ext, what we observe may be a mixed population of cells: some
conducting channel-mediated K+ uptake, others engaging high-affinity transporters. At 5 mM
[K+]ext, where channel-mediated K+ uptake is proposed to dominate and high-affinity transporters
are assumed to be largely irrelevant (Maathuis and Sanders 1996b; Rubio et al. 2010), we did
indeed find TEA+ sensitivity; however, oddly, we also observed stimulations in steady-state K+
influx with BaCl2 application (Fig. 12E). Similarly, applications of CaCl2 and Ca(NO3)2 also
stimulated K+ influx (Fig. 12F), while they produced no effect at low and intermediate [K+]ext
(Fig. 12B and D, respectively). This may be the result of anion effects specific to the LATS, as
demonstrated in earlier reports (Epstein et al. 1963; Kochian et al. 1985). Kochian et al. (1985)
showed that Cl- stimulated low-affinity K+ uptake (possibly via coupled transport), unlike SO42-,
H2PO4-, and (in contrast to this study) NO3
-. The apparent contradiction with respect to
88
NO3- could be attributed to a variety of differences in experimental procedures, including
species, growth medium, and influx protocol. Surprisingly, further elucidation of the mechanism
underlying this effect has not occurred since then; however, this falls out of the scope of our
study. What is important to note is that three distinct uptake scenarios appear to occur in barley
roots grown under high NH4+ and varying [K+]ext: at low K+, an active process dominates,
attributable to residual HvHAK1 activity and/or unknown systems; at intermediate K+, a mixed
population of channel (HvAKT1)- and high-affinity transporter (HvHAK1)- mediated K+ uptake
occurs; and at high K+, channel (HvAKT1)-mediated K+ uptake appears to dominate, but with
unique Cl- and NO3--induced stimulations (Fig. 19).
Consistent across all [K+]ext tested in barley is the significant reduction of K+ influx by metabolic
inhibitors (Fig. 12A, C, and E). Typically, the HATS is reported to be more sensitive to
metabolic inhibitors compared with the LATS (Malhotra and Glass 1995); however, the vast
majority of metabolic inhibitors was most effective in suppressing influx at the intermediate K+
level and not at the lowest level. Interestingly, influx at intermediate K+ was most strongly
inhibited by Cs+ and was the most stimulated in response to NH4+ withdrawal. Perhaps this is
indicative of the mixed population of channels and high-affinity transporters operating under
these conditions and reflects a highly dynamic transport capacity. Also evident is the lack of
NSCC involvement at all [K+]ext tested, as Ca2+, Gd3+, La3+, Glu, and DEPC had no effect on K+
influx (Fig. 12B, D, and F; Essah et al. 2003). It is rather surprising that, if NSCCs catalyze high
rates of cation fluxes, as has been proposed (White and Davenport 2002; Essah et al. 2003;
Kronzucker and Britto 2011, and references therein), we were unable to observe their activity
physiologically. However, the presence of significant concentrations of Ca2+ (1–5 mM),
reflective of common soil conditions (Garciadeblas et al. 2003; Zhang et al. 2010), may have
reduced putative K+ currents through NSCCs considerably (White and Davenport 2002).
Similarly, Na+-K+ cotransport does not appear to be operative, as no effect of 10 mM NaCl on K+
influx was observed (data not shown), ruling out the involvement of HKT/TRK-type transporters
(Rubio et al. 1995). It is worth highlighting here that pharmacological profiling, like any
experimental method, is not without its caveats. Although a traditionally useful tool for gaining
insight into the structure and function of membrane transporters, particularly in planta, the lack
of specificity of several blockers/chemical treatments (White and Broadley 2000; Coskun et al.
2012), as well as the need to employ relatively high concentrations at times, can potentially have
89
secondary (“pleiotropic”) effects. This by no means invalidates the use of pharmacology but
simply speaks to the importance of a multipronged approach in such studies.
As with influx, efflux analysis in barley demonstrates that distinct mechanisms are at play at
each of the three [K+]ext tested (Fig. 19). At low K+, where influx was determined to be solely
active, we see the perplexing result of efflux stimulation upon Cs+ application (Fig. 14A).
Testing of the involvement of Cs+-induced depolarizations in this phenomenon (Nocito et al.
2002) yielded negative results (data not shown). We should note that instances of cellular K+/Cs+
exchange have been documented in the animal literature (Beauge et al. 1973; Guerin and Wallon
1979); however, to our knowledge, no precedence exists in the plant literature. Moreover, this
does not explain its isolated incidence at low [K+]ext; thus, the mechanism remains unknown. In
stark contrast with these observations, both Cs+ and TEA+ significantly inhibited K+ efflux at
intermediate K+ levels (Fig. 14B). This effect has also been observed at a similar [K+]ext (0.1
mM) under a NO3- background (Coskun et al. 2010) and is consistent with other reports of the
Cs+ and TEA+ sensitivities of channel-mediated ion fluxes (Krol and Trebacz 2000; White and
Broadley 2000). At the highest [K+]ext tested (5 mM), a third scenario emerged, one in which
physiological efflux was ruled out, as was previously shown under low-affinity conditions with
NO3--grown barley (Coskun et al. 2010). While an examination of the mechanisms of K+ efflux
was beyond the scope of this study, physiological efflux data at low and intermediate [K+]ext lend
themselves to compartmental analysis (Lee and Clarkson 1986; Siddiqi et al. 1991; Kronzucker
et al. 1995). In these cases, we have strong evidence that efflux at low and intermediate K+ is
occurring from the cytosol and across the plasma membrane, allowing us to confidently estimate
[K+]cyt (Table 7). The variability of these results also confirms some of the earlier work on barley
by Kronzucker et al. (2003), which investigated the heterostasis of [K+]cyt, in particular its
suppression on a high-NH4+ medium. The lack of physiological efflux at high K+ prevents us
from making such estimates. Future studies will examine the differences in K+ efflux between
NO3-- and NH4
+-grown plants and may help provide insight into the mechanisms of NH4+
toxicity.
Withdrawal of NH4+ resulted in immediate and dramatic stimulations of K+ influx, as high as
4.5-fold in barley and 6-fold in Arabidopsis. We should note that there have been a few reports
of K+ uptake stimulation upon NH4+ withdrawal in both barley (Santa-María et al. 2000) and
Arabidopsis (Rubio et al. 2010); however, little attention was directed to this phenomenon. In
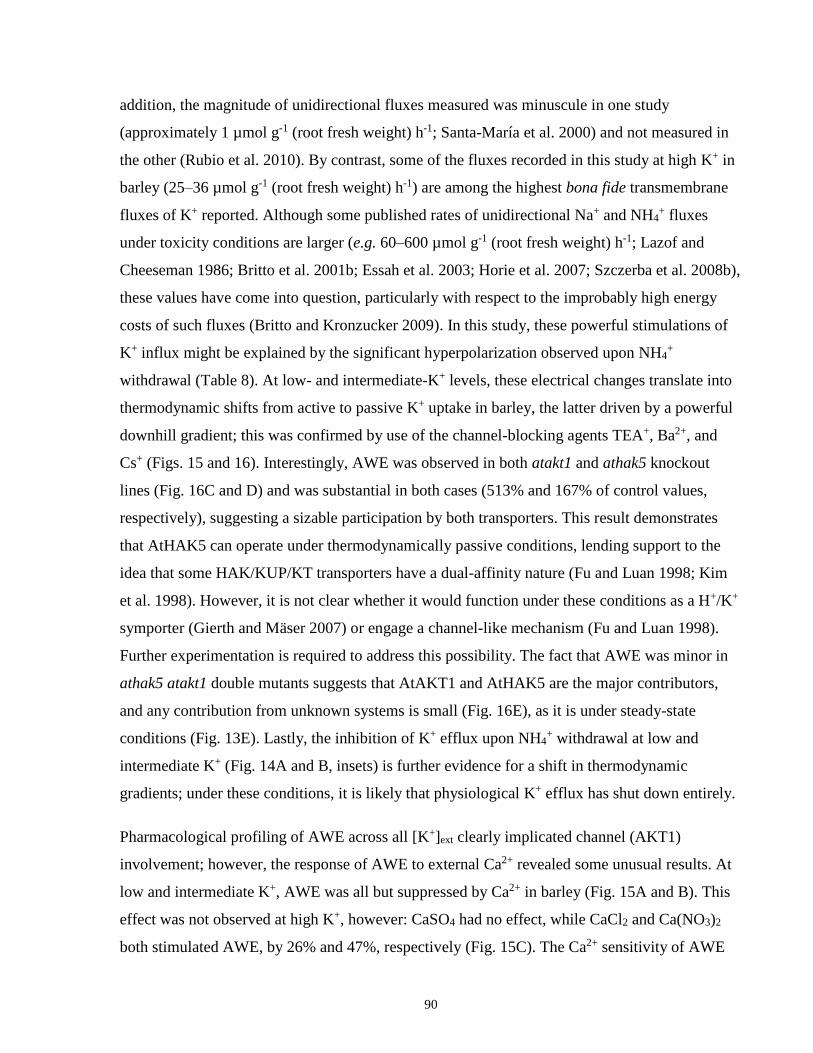
90
addition, the magnitude of unidirectional fluxes measured was minuscule in one study
(approximately 1 µmol g-1 (root fresh weight) h-1; Santa-María et al. 2000) and not measured in
the other (Rubio et al. 2010). By contrast, some of the fluxes recorded in this study at high K+ in
barley (25–36 µmol g-1 (root fresh weight) h-1) are among the highest bona fide transmembrane
fluxes of K+ reported. Although some published rates of unidirectional Na+ and NH4+ fluxes
under toxicity conditions are larger (e.g. 60–600 µmol g-1 (root fresh weight) h-1; Lazof and
Cheeseman 1986; Britto et al. 2001b; Essah et al. 2003; Horie et al. 2007; Szczerba et al. 2008b),
these values have come into question, particularly with respect to the improbably high energy
costs of such fluxes (Britto and Kronzucker 2009). In this study, these powerful stimulations of
K+ influx might be explained by the significant hyperpolarization observed upon NH4+
withdrawal (Table 8). At low- and intermediate-K+ levels, these electrical changes translate into
thermodynamic shifts from active to passive K+ uptake in barley, the latter driven by a powerful
downhill gradient; this was confirmed by use of the channel-blocking agents TEA+, Ba2+, and
Cs+ (Figs. 15 and 16). Interestingly, AWE was observed in both atakt1 and athak5 knockout
lines (Fig. 16C and D) and was substantial in both cases (513% and 167% of control values,
respectively), suggesting a sizable participation by both transporters. This result demonstrates
that AtHAK5 can operate under thermodynamically passive conditions, lending support to the
idea that some HAK/KUP/KT transporters have a dual-affinity nature (Fu and Luan 1998; Kim
et al. 1998). However, it is not clear whether it would function under these conditions as a H+/K+
symporter (Gierth and Mäser 2007) or engage a channel-like mechanism (Fu and Luan 1998).
Further experimentation is required to address this possibility. The fact that AWE was minor in
athak5 atakt1 double mutants suggests that AtAKT1 and AtHAK5 are the major contributors,
and any contribution from unknown systems is small (Fig. 16E), as it is under steady-state
conditions (Fig. 13E). Lastly, the inhibition of K+ efflux upon NH4+ withdrawal at low and
intermediate K+ (Fig. 14A and B, insets) is further evidence for a shift in thermodynamic
gradients; under these conditions, it is likely that physiological K+ efflux has shut down entirely.
Pharmacological profiling of AWE across all [K+]ext clearly implicated channel (AKT1)
involvement; however, the response of AWE to external Ca2+ revealed some unusual results. At
low and intermediate K+, AWE was all but suppressed by Ca2+ in barley (Fig. 15A and B). This
effect was not observed at high K+, however: CaSO4 had no effect, while CaCl2 and Ca(NO3)2
both stimulated AWE, by 26% and 47%, respectively (Fig. 15C). The Ca2+ sensitivity of AWE
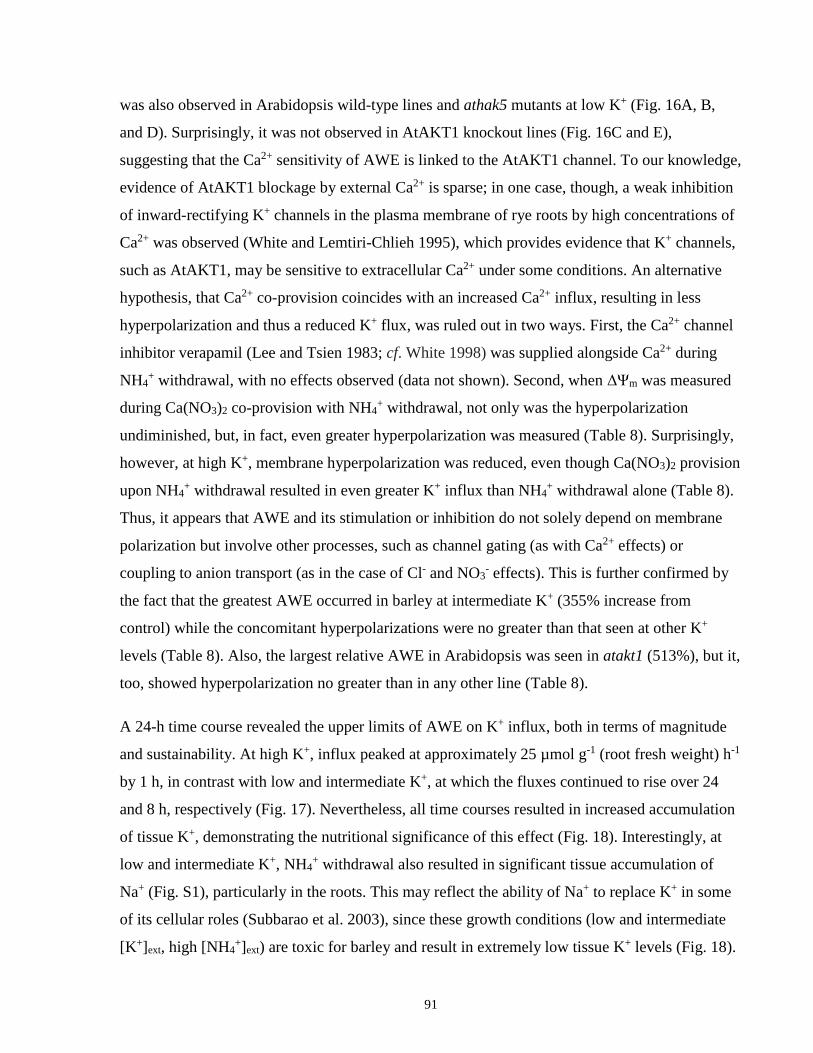
91
was also observed in Arabidopsis wild-type lines and athak5 mutants at low K+ (Fig. 16A, B,
and D). Surprisingly, it was not observed in AtAKT1 knockout lines (Fig. 16C and E),
suggesting that the Ca2+ sensitivity of AWE is linked to the AtAKT1 channel. To our knowledge,
evidence of AtAKT1 blockage by external Ca2+ is sparse; in one case, though, a weak inhibition
of inward-rectifying K+ channels in the plasma membrane of rye roots by high concentrations of
Ca2+ was observed (White and Lemtiri-Chlieh 1995), which provides evidence that K+ channels,
such as AtAKT1, may be sensitive to extracellular Ca2+ under some conditions. An alternative
hypothesis, that Ca2+ co-provision coincides with an increased Ca2+ influx, resulting in less
hyperpolarization and thus a reduced K+ flux, was ruled out in two ways. First, the Ca2+ channel
inhibitor verapamil (Lee and Tsien 1983; cf. White 1998) was supplied alongside Ca2+ during
NH4+ withdrawal, with no effects observed (data not shown). Second, when ΔΨm was measured
during Ca(NO3)2 co-provision with NH4+ withdrawal, not only was the hyperpolarization
undiminished, but, in fact, even greater hyperpolarization was measured (Table 8). Surprisingly,
however, at high K+, membrane hyperpolarization was reduced, even though Ca(NO3)2 provision
upon NH4+ withdrawal resulted in even greater K+ influx than NH4
+ withdrawal alone (Table 8).
Thus, it appears that AWE and its stimulation or inhibition do not solely depend on membrane
polarization but involve other processes, such as channel gating (as with Ca2+ effects) or
coupling to anion transport (as in the case of Cl- and NO3- effects). This is further confirmed by
the fact that the greatest AWE occurred in barley at intermediate K+ (355% increase from
control) while the concomitant hyperpolarizations were no greater than that seen at other K+
levels (Table 8). Also, the largest relative AWE in Arabidopsis was seen in atakt1 (513%), but it,
too, showed hyperpolarization no greater than in any other line (Table 8).
A 24-h time course revealed the upper limits of AWE on K+ influx, both in terms of magnitude
and sustainability. At high K+, influx peaked at approximately 25 µmol g-1 (root fresh weight) h-1
by 1 h, in contrast with low and intermediate K+, at which the fluxes continued to rise over 24
and 8 h, respectively (Fig. 17). Nevertheless, all time courses resulted in increased accumulation
of tissue K+, demonstrating the nutritional significance of this effect (Fig. 18). Interestingly, at
low and intermediate K+, NH4+ withdrawal also resulted in significant tissue accumulation of
Na+ (Fig. S1), particularly in the roots. This may reflect the ability of Na+ to replace K+ in some
of its cellular roles (Subbarao et al. 2003), since these growth conditions (low and intermediate
[K+]ext, high [NH4+]ext) are toxic for barley and result in extremely low tissue K+ levels (Fig. 18).
92
Some reports suggest that Na+ and K+ could share similar uptake mechanisms, such as K+
channels (for review, see Kronzucker and Britto 2011); thus, situations where stimulated channel
activity is induced could account for these findings. While out of the scope of this work, it would
be interesting to measure Na+ fluxes in such a scenario, especially in the toxic range, to better
understand the mechanisms of Na+ transport.
We have demonstrated here that the Arabidopsis model of K+ acquisition is not universally
applicable. Although K+ channels appear to be the sole means of K+ acquisition under low-K+,
high-NH4+ conditions in Arabidopsis, this is not the case for barley. Our study provides new
physiological evidence of three distinct modes of K+ influx and efflux in NH4+-grown barley,
operating at 0.0225, 0.1125, and 5 mM [K+]ext. Figure 19 illustrates these key findings.
Moreover, we demonstrate that NH4+ withdrawal can reveal a very high capacity and plasticity
among K+ transporters. This work provides a framework of characteristics, including nutritional
and pharmacological profiles, by which discoveries in molecular genetics, particularly in the
emerging field of cereal genomics, can be gauged.
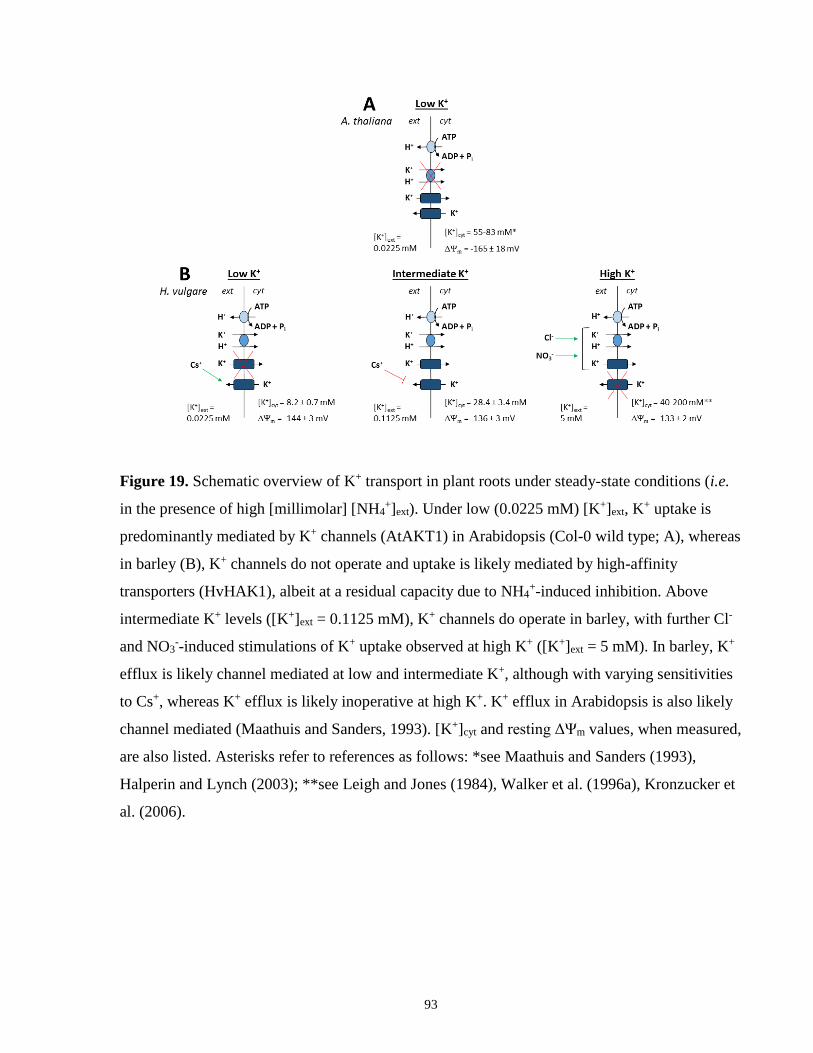
93
Figure 19. Schematic overview of K+ transport in plant roots under steady-state conditions (i.e.
in the presence of high [millimolar] [NH4+]ext). Under low (0.0225 mM) [K+]ext, K
+ uptake is
predominantly mediated by K+ channels (AtAKT1) in Arabidopsis (Col-0 wild type; A), whereas
in barley (B), K+ channels do not operate and uptake is likely mediated by high-affinity
transporters (HvHAK1), albeit at a residual capacity due to NH4+-induced inhibition. Above
intermediate K+ levels ([K+]ext = 0.1125 mM), K+ channels do operate in barley, with further Cl-
and NO3--induced stimulations of K+ uptake observed at high K+ ([K+]ext = 5 mM). In barley, K+
efflux is likely channel mediated at low and intermediate K+, although with varying sensitivities
to Cs+, whereas K+ efflux is likely inoperative at high K+. K+ efflux in Arabidopsis is also likely
channel mediated (Maathuis and Sanders, 1993). [K+]cyt and resting ΔΨm values, when measured,
are also listed. Asterisks refer to references as follows: *see Maathuis and Sanders (1993),
Halperin and Lynch (2003); **see Leigh and Jones (1984), Walker et al. (1996a), Kronzucker et
al. (2006).
94
Complexity of Potassium Acquisition: How Much Flows Through Channels?
Preface
A modified version of this subchapter was published as: Coskun D and Kronzucker HJ (2013)
Complexity of potassium acquisition: How much flows through channels? Plant Signaling &
Behavior 8, e24799; PMID: 23656868. This article served as an addendum to the manuscript
presented in Subchapter 4.1.
D Coskun wrote the manuscript, with input and editing from HJ Kronzucker.
4.2.1 Abstract
The involvement of potassium (K+)-selective, Shaker-type channels, particularly AKT1, in
primary K+ acquisition in roots of higher plants has long been of interest, particularly in the
context of low-affinity K+ uptake, at high K+ concentrations, as well as uptake from low-K+
media under ammonium (NH4+) stress. We recently demonstrated that K+ channels cannot
mediate K+ acquisition in roots of intact barley (Hordeum vulgare L.) seedlings at low (22.5 μM)
external K+ concentrations ([K+]ext) and in the presence of high (10 mM) external NH4+, while
the model species Arabidopsis thaliana L. utilizes channels under comparable conditions.
However, when external NH4+ was suddenly withdrawn, a thermodynamic shift to passive
(channel-mediated) K+ influx was observed in barley and both species demonstrated immediate
and dramatic stimulations in K+ influx, illustrating a hitherto unexplored magnitude and rapidity
of K+-uptake capacity and plasticity. Here, we expand on our previous work by offering further
characterization of channel-mediated K+ fluxes in intact barley, with particular focus on anion
effects, root respiration, and pharmacological sensitivity, and highlight key additions to the
current model of K+ acquisition.
95
4.2.2 Main text
The potassium (K+)-selective Shaker-type channel, AKT1, has been shown to mediate both high-
and low-affinity K+ acquisition in roots of higher plants (Hirsch et al. 1998; Cherel 2004; Gierth
et al. 2005) and a sophisticated model involving its molecular regulation and relative
contribution to K+ uptake has emerged, based largely on the work in the model system
Arabidopsis (Arabidopsis thaliana L.) (Dennison et al. 2001; Gierth and Mäser 2007; Alemán et
al. 2011; Dreyer and Uozumi 2011). According to this view, approximately 80% of high- and
low-affinity K+ uptake in Arabidopsis can be attributed to the sum of functions of AtHAK5 (a
member of the HAK/KUP/KT family of transporters; Mäser et al. 2001) and AtAKT1, while the
remaining ~20% is mediated by as yet unidentified components (Gierth and Mäser 2007). Of
special interest and the source of some controversy, has been the involvement of AtAKT1 in
mediating K+ uptake from low (micromolar) external K+ concentrations ([K+]ext) in the presence
of high (millimolar) external ammonium (NH4+) (Hirsch et al. 1998; Spalding et al. 1999). Under
such conditions, high-affinity K+ uptake is severely suppressed at the functional level, which, in
Arabidopsis, has been directly linked to AtHAK5 inhibition (Qi et al. 2008). It has been shown
that under such conditions, AtAKT1 can conduct the majority of K+ uptake from [K+]ext as low
as 10 μM (Hirsch et al. 1998). However, such findings have been difficult to reconcile with
thermodynamic considerations that suggest channel-mediated K+ acquisition at such low [K+]ext
is generally not feasible (Kochian and Lucas 1993; Maathuis and Sanders 1994). Our recent
study (Coskun et al. 2013c) showed that the Arabidopsis model of K+ acquisition is not a
universally applicable one, and that, in particular, it may not apply to cereals. Our work
demonstrated that in roots of intact barley (Hordeum vulgare L.) seedlings grown under high (10
mM) NH4+, K+ channels could not conduct K+ acquisition when [K+]ext was low (22.5 μM), but
at intermediate (112.5 μM) [K+]ext, channels operated jointly with high-affinity transporters. At
high (5 mM) [K+]ext, K+ channels dominated and stimulations of K+ influx by anions chloride
(Cl-) and nitrate (NO3-) were observed. K+ efflux was found to be channel-mediated at low and
intermediate [K+]ext, albeit with differing pharmacological profiles and no K+ efflux was found at
high [K+]ext. When external NH4+ was withdrawn, significant stimulations in K+ influx were
observed (176% increase compared with control), coincident with a thermodynamic shift from
active to passive conditions that permitted channel-mediated K+ influx even at low [K+]ext. This
ammonium-withdrawal effect, termed AWE, was also observed in wild-type and mutant lines of
Arabidopsis (athak5, atakt1 and athak5 atakt1). AWE was suppressed by high (1–5 mM) levels
96
of external calcium (Ca2+) at low and intermediate, but not at high, [K+]ext, which was attributed
to Ca2+-sensitivity of AKT1. The effect was additionally enhanced by the presence of Cl- and
NO3- at high [K+]ext, conditions under which we observed some of the highest trans-plasma-
membrane K+ fluxes ever reported [~36 μmol g-1 (root fresh weight) h-1]. Furthermore, AWE
was sustainable (and at times indeed increasing) over a 24-h period, at low and intermediate
[K+]ext and persisted for up to ~8 h at high [K+]ext. This resulted in significant total-tissue K+
accrual at all [K+]ext over 24 h. These results raise a suite of interesting questions about the nature
of channel-mediated K+ influx in intact plants. Although we showed that K+ channels cannot “do
it all,” as suggested by early thermodynamic considerations (Kochian and Lucas 1993), our work
sheds light on the wide-ranging and complex operation of K+ channels in planta.
Here, we expand on our previous work by further characterizing channel-mediated K+ uptake in
roots of barley. Figure 20 illustrates the varying sensitivity of AWE to Ca(NO3)2, which is
clearly a function of [K+]ext: Ca2+-induced suppressions are seen at low and intermediate [K+]ext
(Fig. 20A and B), while a NO3--induced stimulation is seen at high [K+]ext (Fig. 20C).
Interestingly, under all AWE + Ca(NO3)2 combinations, we observed effective suppression by
the K+-channel inhibitors tetraethylammonium (TEA+), barium (Ba2+), and cesium (Cs+) (Bertl et
al. 1997; Fig. 20A–C). Thus, although Ca2+ can block K+ channels (specifically AtAKT1;
Coskun et al. 2013c) under some AWE conditions, it appears that K+ channels continue to
operate under such suppressed conditions, resulting in a higher flux compared with control
(NH4+-background) conditions (Fig. 20A and B). This is consistent with previous
thermodynamic analyses (Coskun et al. 2013c) that showed AWE + Ca(NO3)2 hyperpolarizes
root plasma-membrane potentials away from the equilibrium potential for K+ (EK+) at low and
intermediate [K+]ext. At high [K+]ext, it is evident that NO3--induced stimulations in K+ influx are
also linked to K+ channels (Fig. 20C), illustrating their complexity of function and regulation
(also see below). Interestingly, these elevations in K+ influx compared with control (albeit minor
at low and intermediate [K+]ext) are sufficient to noticeably increase tissue-K+ content over 24 h
at all three [K+]ext (data not shown), similar to what AWE entails on its own (Coskun et al.
2013c).
Expanding on the anion effects observed at high [K+]ext, we also found that switching the
counter-ions for K+ and NH4+ from sulfate (SO4
2-) to Cl- (a 10-min treatment was used in SO42--
grown plants) approximately doubles K+ influx (from ~10 to 20 μmol g-1 h-1) and the reverse
97
scenario (switching from Cl- to SO42-, in Cl--grown plants), reduces influx by half (from ~20 to
10 μmol g-1 h-1, Fig. 20D). This suggests that anion effects related to K+-channel functioning are
highly effective in both the short (10 min) and long (steady-state) term. These findings are
consistent with early reports (Epstein et al. 1963; Kochian et al. 1985) demonstrating higher low-
affinity K+ influx in the presence of Cl- over SO42-, possibly as a result of a coupling of the more
rapidly absorbed anion (Cl-) with K+ influx. Surprisingly, there has been little, if any, advance in
understanding this phenomenon. It does, however, raise interesting questions about the
mechanism and regulation of channel-mediated K+ influx. For one, when one considers that the
fluxes of all anions tested (Cl-, SO42-, and NO3
-) are coupled to H+ influx and are electrogenic
(net positive; Sanders 1980; Ullrich and Novacky 1981; Lass and Ullrich-Eberius 1984), anion
fluxes (particularly those of NO3- and Cl-, which show high rates of uptake; Lee 1982) should
theoretically decrease the gradient for K+ uptake, i.e. working against what is observed for rates
of influx (Fig. 20C and D; Epstein et al. 1963; Kochian et al. 1985). Moreover, to our
knowledge, there are no demonstrations of possible allosteric modulations of Shaker-type K+
channels by anions in the plant literature (Gambale and Uozumi 2006; Dreyer and Uozumi
2011); by contrast, some evidence exists in the animal literature (Adams and Oxford 1983) that
such allosteric modulation may occur. This warrants further investigation. Lastly, the reasons
why Cl-/NO3--induced stimulations are only observed at high (low-affinity-range) [K+]ext remain
largely unknown. Reports on the allosteric modulation of Shaker-type K+ channels by [K+]ext
appear exclusive to outward rectifiers (Johansson et al. 2006), and studies on the post-
translational modification (e.g., phosphorylation/dephosphorylation networks) of inward
rectifiers are restricted to low-[K+]ext sensing (Li et al. 2006; Xu et al. 2006; Lee et al. 2007).
Thus, it is clear that as yet insufficiently understood mechanisms exist regarding the regulation
of K+ channels by anions, a phenomenon that can have profound effects on rates of K+
acquisition.
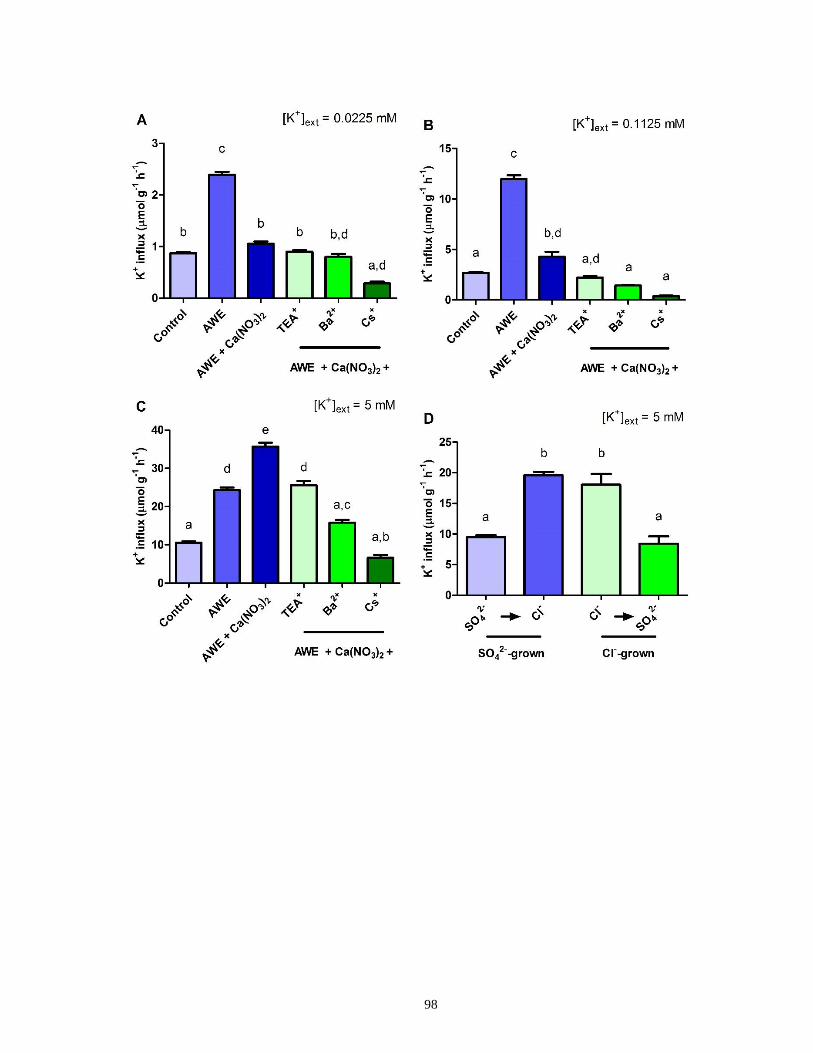
98
99
Figure 20. K+ influx into intact 7-d old barley (Hordeum vulgare L.) seedlings. (A–C) Steady-
state (control) flux in plants grown in a full nutrient medium (1/4-strength Johnson’s solution)
with 10 mM NH4+ and either 0.0225 (A), 0.1125 (B) or 5 mM (C) K+ (as sulfate salts) and the
effect of ammonium withdrawal (AWE) ± Ca(NO3)2 (5 mM) and AWE + Ca(NO3)2 ± TEA+ (10
mM), Ba2+ (5 mM), or Cs+ (10 mM) (as chloride salts). All treatments involved 5-min incubation
prior to 42K+ uptake (5-min protocol). (D) Influx into plants grown in a full-nutrient medium (as
above) with 5 mM K+ and 10 mM NH4+ (both as either SO4
2- or Cl- salts) and the effect of
switching (K+ and NH4+) counter-ions (10-min incubation prior to uptake, as above). Influx
measured on a per g (root fresh weight) basis. Error bars indicate ± SEM of minimum four
replicates. Letters in each panel denote significantly different means (P < 0.05, one-way
ANOVA with Tukey post-hoc test).
100
We also observed that NH4+ withdrawal (for 5 min) results in significant reductions in root
respiration at low [K+]ext (from ~30 to 20 μmol g-1 h-1, as measured by oxygen (O2) consumption;
Fig. 21). Based on earlier suggestions, this may be attributable to a reduction in futile NH4+
cycling at root-cell plasma membranes, an energetically demanding scenario linked to NH4+
toxicity in barley (Britto et al. 2001b), or other, more generic respiratory stress responses when
NH4+ levels are high. Since futile cycling of NH4
+ can be reduced by high [K+]ext (Szczerba et al.
2008b), as evident in the significantly lower steady-state root respiration at high [K+]ext (Fig. 21),
this may explain the lack of any further respiratory drop upon NH4+ withdrawal. Given the
substantial increases in K+ influx (from ~10 to 25 μmol g-1 h-1) (Fig. 20C), it is interesting that no
change in root respiration was observed, in keeping with the contention that the energy cost per
K+ transported is significantly lower for channels than for high-affinity transporters (Glass,
1989), i.e., plants already engaging channels may show no further significant energetic
requirement upon NH4+ withdrawal even when K+ influx is greatly enhanced. Thus, AWE carries
no major cost to the plant, while a significant benefit in terms of net K+ accumulation in tissue is
seen (see above). Indeed, at low [K+]ext, barley expends significantly less energy than prior to
NH4+ withdrawal, while accruing large quantities of K+. This highlights an important feature of
engaging channels episodically in the acquisition of potassium that may be of importance under
fluctuating nutrient conditions (Hodge 2004), especially in NH4+-dominated systems that
normally suppress K+ uptake (Sasakawa and Yamamoto 1978; Kronzucker et al. 1997; Kirk and
Kronzucker 2005), which, integrated over an extended time frame, may result in significant
growth benefits (Balkos et al. 2010).
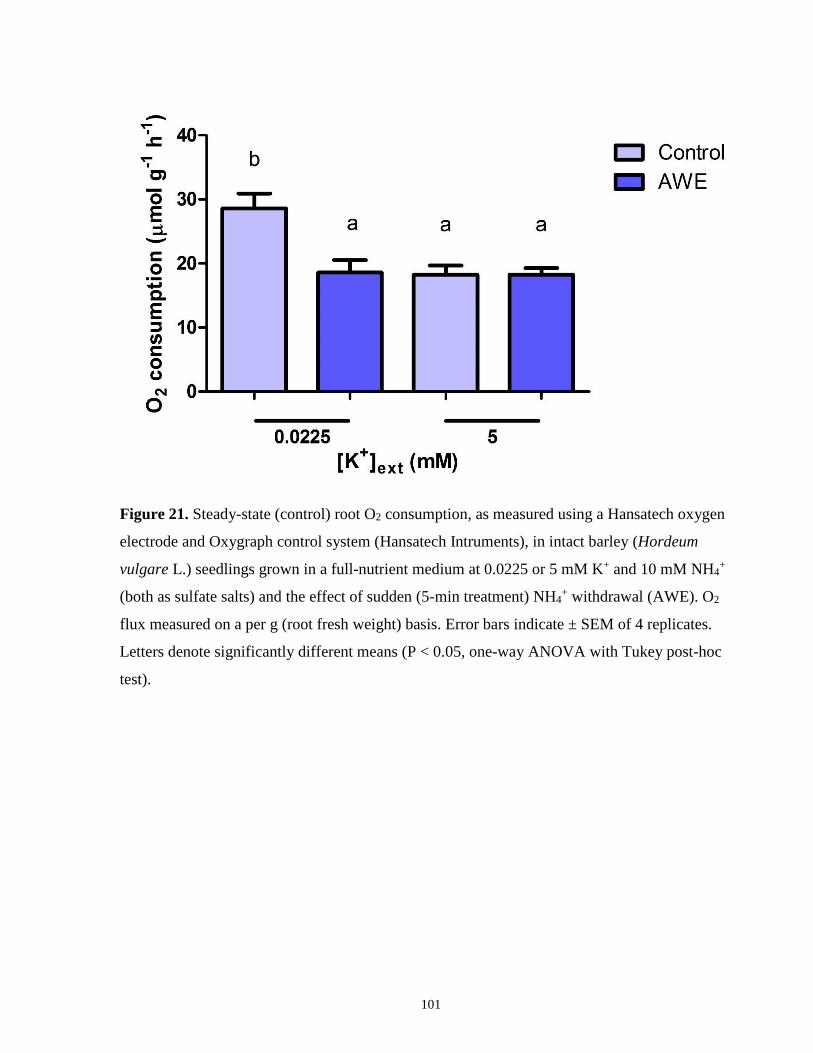
101
Figure 21. Steady-state (control) root O2 consumption, as measured using a Hansatech oxygen
electrode and Oxygraph control system (Hansatech Intruments), in intact barley (Hordeum
vulgare L.) seedlings grown in a full-nutrient medium at 0.0225 or 5 mM K+ and 10 mM NH4+
(both as sulfate salts) and the effect of sudden (5-min treatment) NH4+ withdrawal (AWE). O2
flux measured on a per g (root fresh weight) basis. Error bars indicate ± SEM of 4 replicates.
Letters denote significantly different means (P < 0.05, one-way ANOVA with Tukey post-hoc
test).
102
How High Do Ion Fluxes Go? A Re-Evaluation of the Two-Mechanism Model of K+ Transport in Plant Roots
Preface
A modified version of this subchapter was published as: Coskun D, Britto DT, Kochian LV,
Kronzucker HJ (2016) How high do ion fluxes go? A re-evaluation of the two-mechanism model
of K+ transport in plant roots. Plant Science 243, 96-104. Supplementary material cited in this
subchapter can be found online:
http://www.sciencedirect.com/science/article/pii/S0168945215301138.
HJ Kronzucker designed the study, with input from DT Britto and D Coskun. D Coskun
performed the experiments and analyzed the data, with input from DT Britto and HJ Kronzucker.
D Coskun wrote the manuscript, with input and editing from DT Britto, LV Kochian, and HJ
Kronzucker.
4.3.1 Abstract
Potassium (K+) acquisition in roots is generally described by a two-mechanism model, consisting
of a saturable, high-affinity transport system (HATS) operating via H+/K+ symport at low (<1
mM) [K+]ext, and a linear, low-affinity system (LATS) operating via ion channels at high (>1
mM) [K+]ext. Radiotracer measurements in the LATS range indicate that the linear rise in influx
continues well beyond nutritionally relevant concentrations (>10 mM), suggesting K+ transport
may be pushed to extraordinary, and seemingly limitless, capacity. Here, we assess this rise,
asking whether LATS measurements faithfully report transmembrane fluxes. Using 42K+-isotope
and electrophysiological methods in barley, we show that this flux is part of a K+-transport cycle
through the apoplast, and masks a genuine plasma-membrane influx that displays Michaelis–
Menten kinetics. Rapid apoplastic cycling of K+ is corroborated by an absence of transmembrane
42K+ efflux above 1 mM, and by the efflux kinetics of PTS, an apoplastic tracer. A linear
apoplastic influx, masking a saturating transmembrane influx, was also found in Arabidopsis
mutants lacking the K+ transporters AtHAK5 and AtAKT1. Our work significantly revises the
model of K+ transport by demonstrating a surprisingly modest upper limit for plasma-membrane
influx, and offers insight into sodium transport under salt stress.
103
4.3.2 Introduction
The two-mechanism model of potassium (K+) acquisition in roots of higher plants is a standard
of transport physiology and molecular biology (Epstein et al. 1963; Glass and Dunlop 1978;
Kochian and Lucas 1982; Gierth and Mäser 2007; Szczerba et al. 2009). In this model (Fig.
22A), the high-affinity transport system (HATS) predominately functions at external K+
concentrations ([K+]ext) below 1 mM, and is mediated by secondarily active K+/H+ symporters of
the HAK/KUP/KT family, including AtHAK5 in Arabidopsis (Arabidopsis thaliana; Gierth and
Mäser 2007) and HvHAK1 in barley (Hordeum vulgare; Santa-María et al. 1997). By contrast,
the low-affinity transport system (LATS), which functions at [K+]ext above 1 mM, is less well
understood, although it is widely accepted to be a thermodynamically passive process mediated
by K+-selective (Shaker-like) channels (e.g. AtAKT1 and HvAKT1 in Arabidopsis and barley,
respectively; Kochian and Lucas 1982; Gassmann and Schroeder 1994; Gierth and Mäser 2007;
Szczerba et al. 2009). Studies using heterologous expression systems and knock-out mutants in
Arabidopsis have furthermore shown that AtAKT1 can also operate under some high-affinity
conditions (Hirsch et al. 1998; Geiger et al. 2009; Honsbein et al. 2009; Coskun et al. 2014b).
Moreover, recent investigations in the Arabidopsis double-knock-out mutant, athak5 atakt1,
have shown that there is an additional back-up system (“BUS”) that can contribute to K+ uptake
in the LATS range (Pyo et al. 2010; Caballero et al. 2012; Coskun et al. 2013c). Although
genetically uncharacterized, it has been suggested that BUS operates via non-selective cation
channels (NSCCs), which may be gated by cyclic nucleotides (Caballero et al. 2012).
One commonly observed feature of the K+ LATS is its linearly rising kinetic response to
increasing [K+]ext, which contrasts sharply with the saturating pattern typical of the HATS
(Fisher et al. 1970; Robinson and Laties 1975; Polley and Hopkins 1979; Kochian et al. 1985;
Vallejo et al. 2005; see also Fig. 22). From the outset, it is worth noting that this model is based
solely on unidirectional fluxes measured using radiotracer methodology, and although many
aspects have been corroborated by other experimental methods, the linearity of the low-affinity
flux is one aspect that has not. Any attempt to investigate this important concept must therefore
also employ radiotracer techniques. Moreover, although many studies have reported on a linear
LATS, it is important to note that some studies have reported low-affinity K+ influxes that
saturate (Epstein et al. 1963; Maathuis and Sanders 1996a; Gierth et al. 2005). It is interesting to
note that such studies often employ longer absorption and desorption times (e.g. 10-30 min
104
each), compared to many studies that report linear fluxes, which may result in closer
approximations to net K+ fluxes, rather than unidirectional uptake (see below). Furthermore, a
linear LATS is not unique to K+, but has been observed with many ions, including sodium (Na+),
ammonium (NH4+), chloride (Cl-), and nitrate (NO3
-) (Ullrich et al. 1984; Kochian et al. 1985;
Glass et al. 1992; Wang et al. 1993b; Essah et al. 2003), as well as with organic solutes such as
amino acids and sugars (Blackman and McDaniel 1978; Fischer and Luttge 1980; Lichtner and
Spanswick 1981). Such fluxes are generally considered to be channel-mediated, and typically
show no signs of saturation at external substrate concentrations between 10 and 50 mM. Only a
few studies have examined fluxes beyond this range because such conditions are often
considered physiologically or ecologically irrelevant, and, moreover, potentially damaging to
cells. An important exception is that of Na+ fluxes in the context of salinity stress, where the
measurement of fluxes at very high substrate concentrations (e.g. >100 mM) is both appropriate
and routine. In this case, extraordinarily high fluxes are frequently reported, and although
believed to be mediated by NSCCs, their mechanistic underpinnings remain poorly defined
(Kronzucker and Britto 2011). By contrast, much more is known about K+ transport into roots
and within the plant (Szczerba et al. 2009; Ahmad and Maathuis 2014; Nieves-Cordones et al.
2014); thus, we are better equipped to investigate the nature of the K+ LATS, and use results
from this model system to gain insight into Na+ transport at high external concentrations.
Another critical aspect of low-affinity transport in general involves the efflux of ions, which
occurs simultaneously with influx, and appears to rise more steeply than influx does, as external
concentrations increase (Britto and Kronzucker 2006). Such patterns have been observed for all
major nutrient ions, including K+, Na+, Cl-, NO3-, NH4
+, and sulfate (SO42-), and efflux in the
low-affinity range frequently achieves rates approximating those of influx (i.e. efflux:influx
ratios become close to unity). This futile cycling of ions typically carries with it a potentially
substantial energetic burden on root systems, given that efflux or influx components of the cycle
may occur against significant thermodynamic gradients (Essah et al. 2003; Britto and
Kronzucker 2006; Kurimoto et al. 2004).
High rates of efflux make the accurate measurement of low-affinity unidirectional influx, by use
of tracer methods, a challenging prospect (Britto and Kronzucker 2001). In order to limit the
effect of efflux occurring during tracer-influx measurement protocols, many researchers
advocate the use of very short labeling times (e.g. 2–5 min; Essah et al. 2003; Malagoli et al.
105
2008; Wang et al. 2009). For the same reason, short desorption times (i.e. “washes” in non-
labeled solutions following uptake, to remove extracellular tracer; see Chapter 7) are often
prescribed. Although such protocols have become standard in the measurement of low-affinity
fluxes (e.g. see Kronzucker and Britto 2011), the assumptions that they minimize tracer efflux
across the plasma membrane, and clear the roots of extracellular tracer, are rarely tested, and
indeed may be untenable in some cases. For example, we recently showed that K+ efflux across
the plasma membrane in roots of intact barley seedlings ceases above a [K+]ext of 1 mM (i.e. in
the low-affinity range), and concluded that tracer release from pre-labeled roots was extracellular
(apoplastic) in origin (Coskun et al. 2010; see also Subchapter 3.1). The implications from this
study for low-affinity influx measurements require further exploration.
Here, we ask three fundamental questions regarding the nature of low-affinity K+ influx in roots
of higher plants: (1) Does influx have an upper limit and eventually saturate with rising [K+]ext,
or continue to rise indefinitely? (2) What mechanism(s) underlie its linear concentration
dependence? (3) Can a better understanding of low-affinity K+ transport help resolve the
mechanisms of Na+ fluxes under salt stress? We shall argue that transmembrane fluxes do not
rise indefinitely, but saturate at relatively modest rates (i.e. 7–15 µmol g-1 root fresh weight (FW)
h-1), well into the saline range (≤100 mM [K+]ext), while the linearly rising component of the
measured flux is dominated by the apoplastic movement of K+. We believe that our findings call
for a fundamental revision of flux models, and apply to low-affinity fluxes of other ions,
particularly those of Na+.
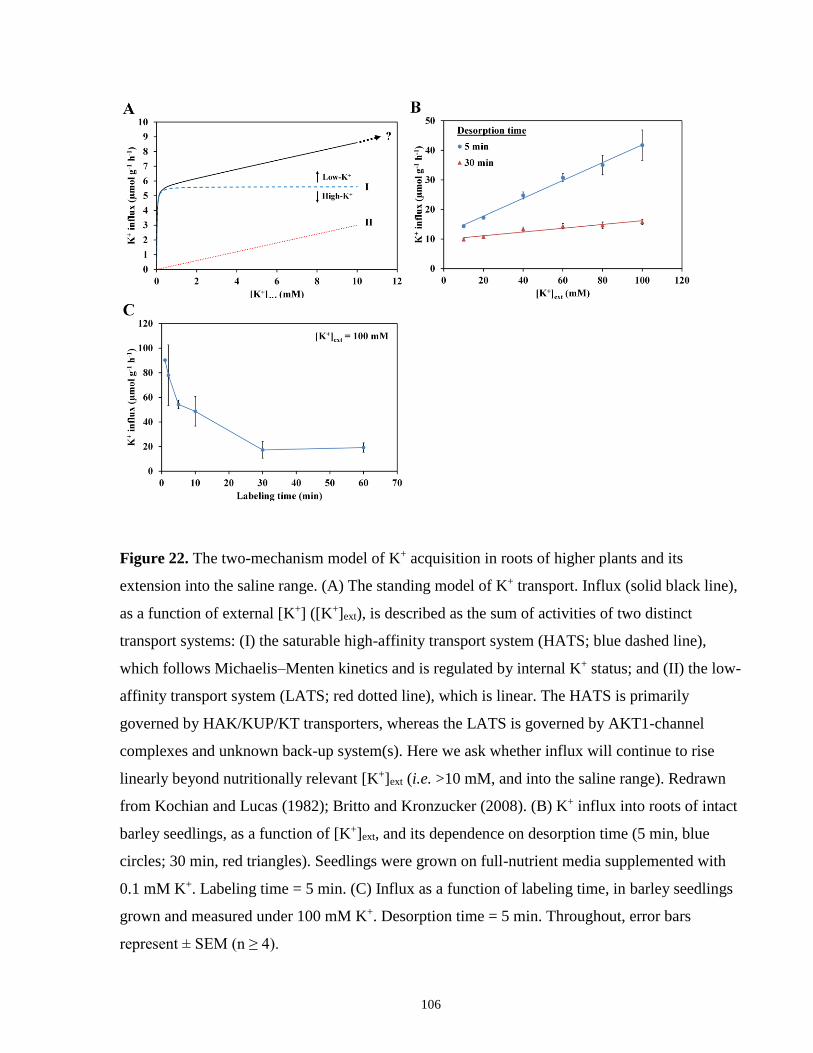
106
Figure 22. The two-mechanism model of K+ acquisition in roots of higher plants and its
extension into the saline range. (A) The standing model of K+ transport. Influx (solid black line),
as a function of external [K+] ([K+]ext), is described as the sum of activities of two distinct
transport systems: (I) the saturable high-affinity transport system (HATS; blue dashed line),
which follows Michaelis–Menten kinetics and is regulated by internal K+ status; and (II) the low-
affinity transport system (LATS; red dotted line), which is linear. The HATS is primarily
governed by HAK/KUP/KT transporters, whereas the LATS is governed by AKT1-channel
complexes and unknown back-up system(s). Here we ask whether influx will continue to rise
linearly beyond nutritionally relevant [K+]ext (i.e. >10 mM, and into the saline range). Redrawn
from Kochian and Lucas (1982); Britto and Kronzucker (2008). (B) K+ influx into roots of intact
barley seedlings, as a function of [K+]ext, and its dependence on desorption time (5 min, blue
circles; 30 min, red triangles). Seedlings were grown on full-nutrient media supplemented with
0.1 mM K+. Labeling time = 5 min. (C) Influx as a function of labeling time, in barley seedlings
grown and measured under 100 mM K+. Desorption time = 5 min. Throughout, error bars
represent ± SEM (n ≥ 4).
107
4.3.3 Results
Low-Affinity K+ Influx Values are Highly Dependent on Protocol and Show no Sign of
Saturation
To ascertain the upper limits of the K+ LATS, we used 42K+ to measure K+ influx in intact
seedlings of barley between 10 and 100 mM [K+]ext. We also explored the effect that timing
protocols (i.e. labeling and desorption times) had on influx estimation, to assess the
recommendations that have been put forth in the literature (see Section 4.3.2). Fig. 22B shows
the response of K+ influx with a fixed labeling time of 5 min and either a 5- or a 30-min
desorption protocol. We found that apparent influx was significantly (P < 0.001) higher with the
shorter desorption times throughout the range tested, as was the slope of the isotherms (Table
S1). Nevertheless, with both desorption times, we observed a strong (R2 = 0.90) linear response
of influx to [K+]ext, with no indication of saturation. In addition, using a 5-min labeling, 5-min
desorption protocol, we measured influx at extremely high concentrations of K+ (up to two
molar), but still observed a linear response (Fig. S1). In steady-state experiments conducted at
100 mM [K+]ext, we fixed the desorption time at 5 min, while varying the labeling time between
1 and 60 min. We observed a strong decline in the flux, from 90 to 45 µmol g-1 h-1, as labeling
time increased between 1 and 10 min. After 30–60 min of desorption, the flux value did not
change further, settling at about 20 µmol g-1 h-1 (Fig. 22C).
Cellular K+ Efflux Ceases in the Low-Affinity Range and Apoplastic Fluxes Dominate
Because declines in influx with increasing duration of labeling and desorption times are usually
attributed to simultaneous tracer efflux (Britto and Kronzucker 2001; Essah et al. 2003), the
efflux step in the LATS range was examined more closely. Fig. 23A illustrates the strong
malleability in response to various chemical treatments, of 42K+ efflux from roots of intact,
labeled barley seedlings grown and measured under high-affinity conditions (0.1 mM [K+]ext).
The K+-transport inhibitor cesium (Cs+) strongly and immediately suppressed 42K+ efflux, as did
elevated levels of externally supplied K+ (10 mM), whereas the metabolic inhibitor cyanide
(CN-) significantly stimulated efflux. By contrast, similar treatments had no effect on efflux
traces from roots of plants grown and measured under low-affinity conditions (1 and 40 mM
108
[K+]ext; Fig. 23B and C, respectively). In addition, an alkaline (pH 9.2) treatment, designed to
collapse the H+ gradient across the plasma membrane, and thus disable possible H+-K+
exchangers (Pardo et al. 2006), had no effect on efflux at 1 and 40 mM [K+]ext. To further test the
hypothesis that 42K+ efflux traces under LATS conditions could be apoplastic in origin, we
monitored the release kinetics of the apoplastic dye 8-hydroxy-1,3,6-pyrenetrisulphonic acid
(PTS; Yeo et al. 1987) from PTS-loaded roots, and observed release patterns that were very
similar to those of 42K+ (Fig. 23D). Importantly, the half-time for PTS release from the root
apoplast (t½ = 12.8 ± 1.4 min) fell precisely into the range of half-times for K+ release in the low-
affinity range (t½ = 10–18 min; Table 9).
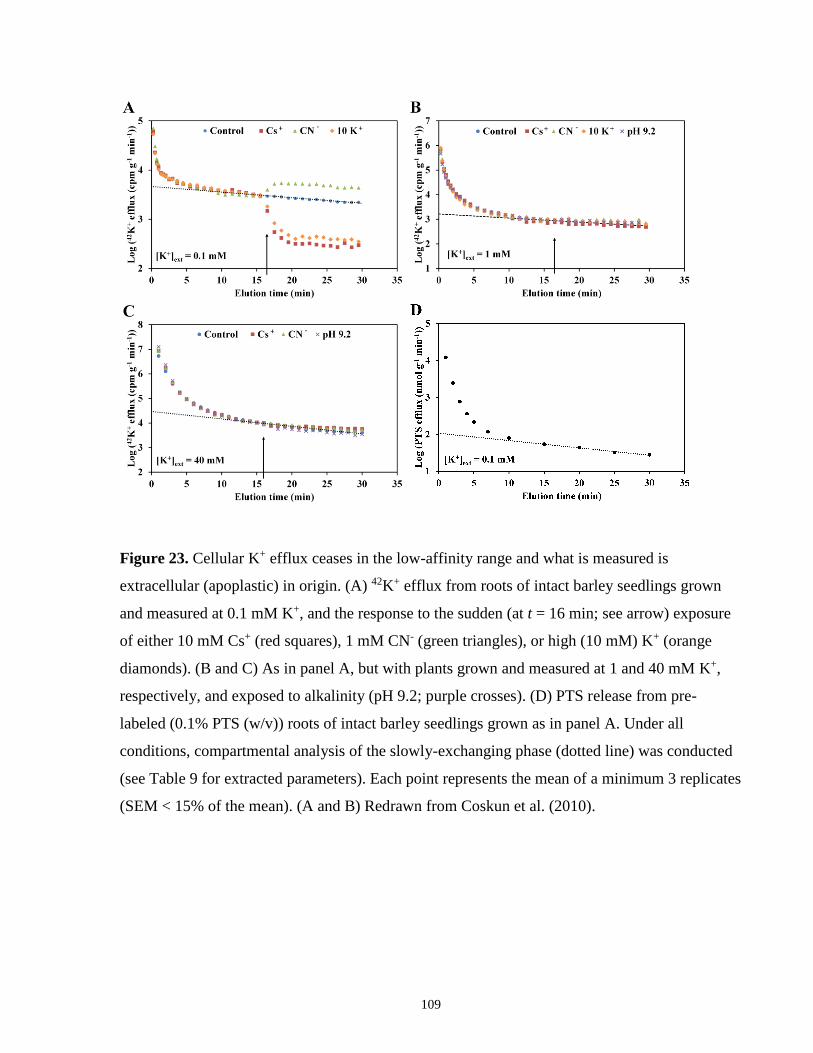
109
Figure 23. Cellular K+ efflux ceases in the low-affinity range and what is measured is
extracellular (apoplastic) in origin. (A) 42K+ efflux from roots of intact barley seedlings grown
and measured at 0.1 mM K+, and the response to the sudden (at t = 16 min; see arrow) exposure
of either 10 mM Cs+ (red squares), 1 mM CN- (green triangles), or high (10 mM) K+ (orange
diamonds). (B and C) As in panel A, but with plants grown and measured at 1 and 40 mM K+,
respectively, and exposed to alkalinity (pH 9.2; purple crosses). (D) PTS release from pre-
labeled (0.1% PTS (w/v)) roots of intact barley seedlings grown as in panel A. Under all
conditions, compartmental analysis of the slowly-exchanging phase (dotted line) was conducted
(see Table 9 for extracted parameters). Each point represents the mean of a minimum 3 replicates
(SEM < 15% of the mean). (A and B) Redrawn from Coskun et al. (2010).
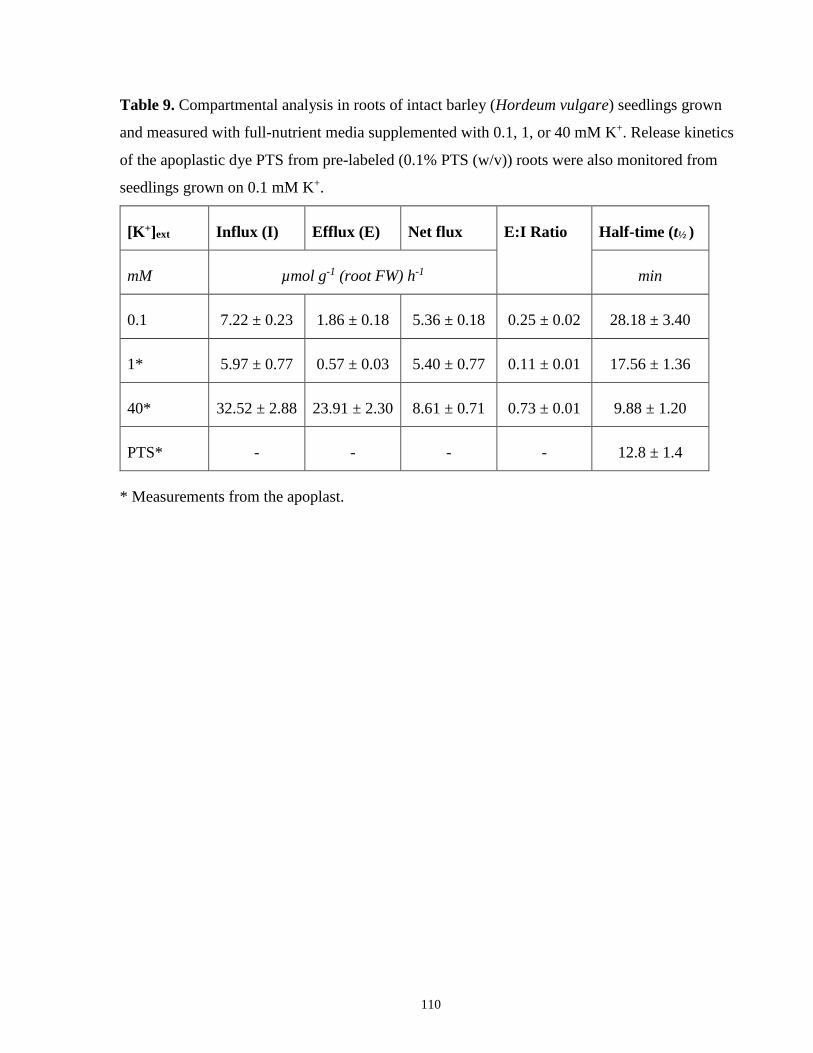
110
Table 9. Compartmental analysis in roots of intact barley (Hordeum vulgare) seedlings grown
and measured with full-nutrient media supplemented with 0.1, 1, or 40 mM K+. Release kinetics
of the apoplastic dye PTS from pre-labeled (0.1% PTS (w/v)) roots were also monitored from
seedlings grown on 0.1 mM K+.
[K+]ext Influx (I) Efflux (E) Net flux E:I Ratio Half-time (t½ )
mM µmol g-1 (root FW) h-1 min
0.1 7.22 ± 0.23 1.86 ± 0.18 5.36 ± 0.18 0.25 ± 0.02 28.18 ± 3.40
1* 5.97 ± 0.77 0.57 ± 0.03 5.40 ± 0.77 0.11 ± 0.01 17.56 ± 1.36
40* 32.52 ± 2.88 23.91 ± 2.30 8.61 ± 0.71 0.73 ± 0.01 9.88 ± 1.20
PTS* - - - - 12.8 ± 1.4
* Measurements from the apoplast.
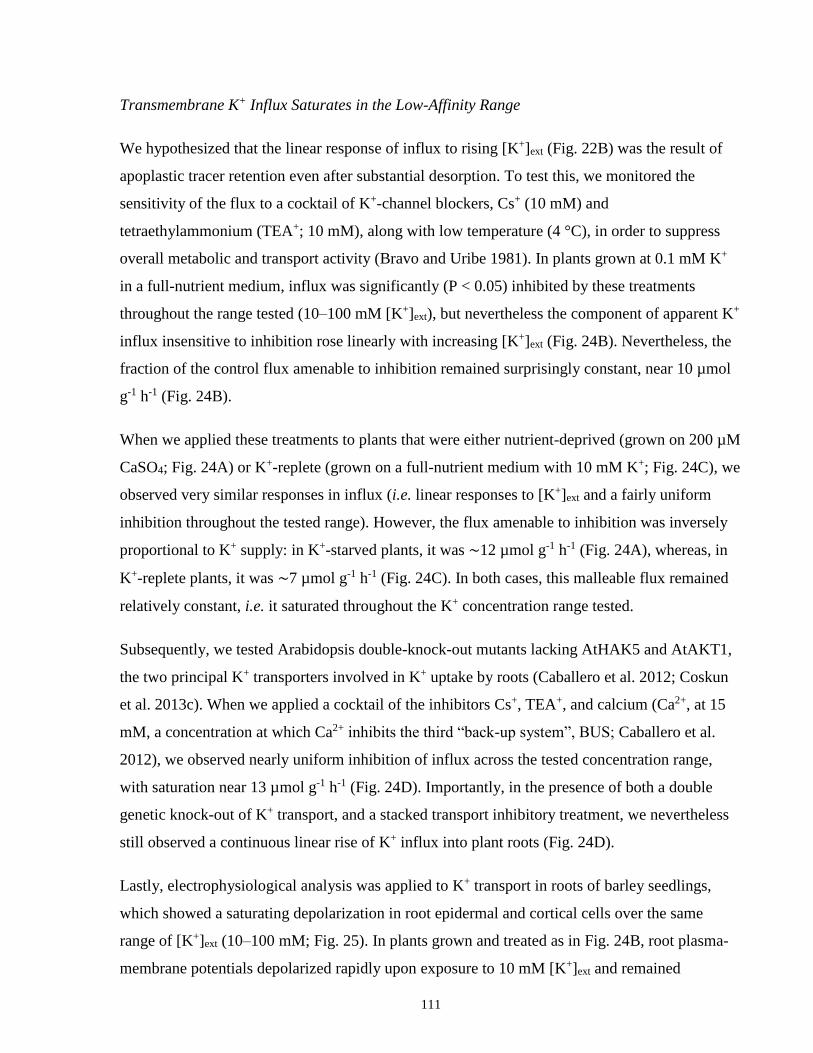
111
Transmembrane K+ Influx Saturates in the Low-Affinity Range
We hypothesized that the linear response of influx to rising [K+]ext (Fig. 22B) was the result of
apoplastic tracer retention even after substantial desorption. To test this, we monitored the
sensitivity of the flux to a cocktail of K+-channel blockers, Cs+ (10 mM) and
tetraethylammonium (TEA+; 10 mM), along with low temperature (4 °C), in order to suppress
overall metabolic and transport activity (Bravo and Uribe 1981). In plants grown at 0.1 mM K+
in a full-nutrient medium, influx was significantly (P < 0.05) inhibited by these treatments
throughout the range tested (10–100 mM [K+]ext), but nevertheless the component of apparent K+
influx insensitive to inhibition rose linearly with increasing [K+]ext (Fig. 24B). Nevertheless, the
fraction of the control flux amenable to inhibition remained surprisingly constant, near 10 µmol
g-1 h-1 (Fig. 24B).
When we applied these treatments to plants that were either nutrient-deprived (grown on 200 µM
CaSO4; Fig. 24A) or K+-replete (grown on a full-nutrient medium with 10 mM K+; Fig. 24C), we
observed very similar responses in influx (i.e. linear responses to [K+]ext and a fairly uniform
inhibition throughout the tested range). However, the flux amenable to inhibition was inversely
proportional to K+ supply: in K+-starved plants, it was ∼12 µmol g-1 h-1 (Fig. 24A), whereas, in
K+-replete plants, it was ∼7 µmol g-1 h-1 (Fig. 24C). In both cases, this malleable flux remained
relatively constant, i.e. it saturated throughout the K+ concentration range tested.
Subsequently, we tested Arabidopsis double-knock-out mutants lacking AtHAK5 and AtAKT1,
the two principal K+ transporters involved in K+ uptake by roots (Caballero et al. 2012; Coskun
et al. 2013c). When we applied a cocktail of the inhibitors Cs+, TEA+, and calcium (Ca2+, at 15
mM, a concentration at which Ca2+ inhibits the third “back-up system”, BUS; Caballero et al.
2012), we observed nearly uniform inhibition of influx across the tested concentration range,
with saturation near 13 µmol g-1 h-1 (Fig. 24D). Importantly, in the presence of both a double
genetic knock-out of K+ transport, and a stacked transport inhibitory treatment, we nevertheless
still observed a continuous linear rise of K+ influx into plant roots (Fig. 24D).
Lastly, electrophysiological analysis was applied to K+ transport in roots of barley seedlings,
which showed a saturating depolarization in root epidermal and cortical cells over the same
range of [K+]ext (10–100 mM; Fig. 25). In plants grown and treated as in Fig. 24B, root plasma-
membrane potentials depolarized rapidly upon exposure to 10 mM [K+]ext and remained

112
relatively constant, i.e. saturated, up to 100 mM. Michaelis–Menten analysis of the electrical
response indicated a half-saturation constant (KM) of 2.5 mM.
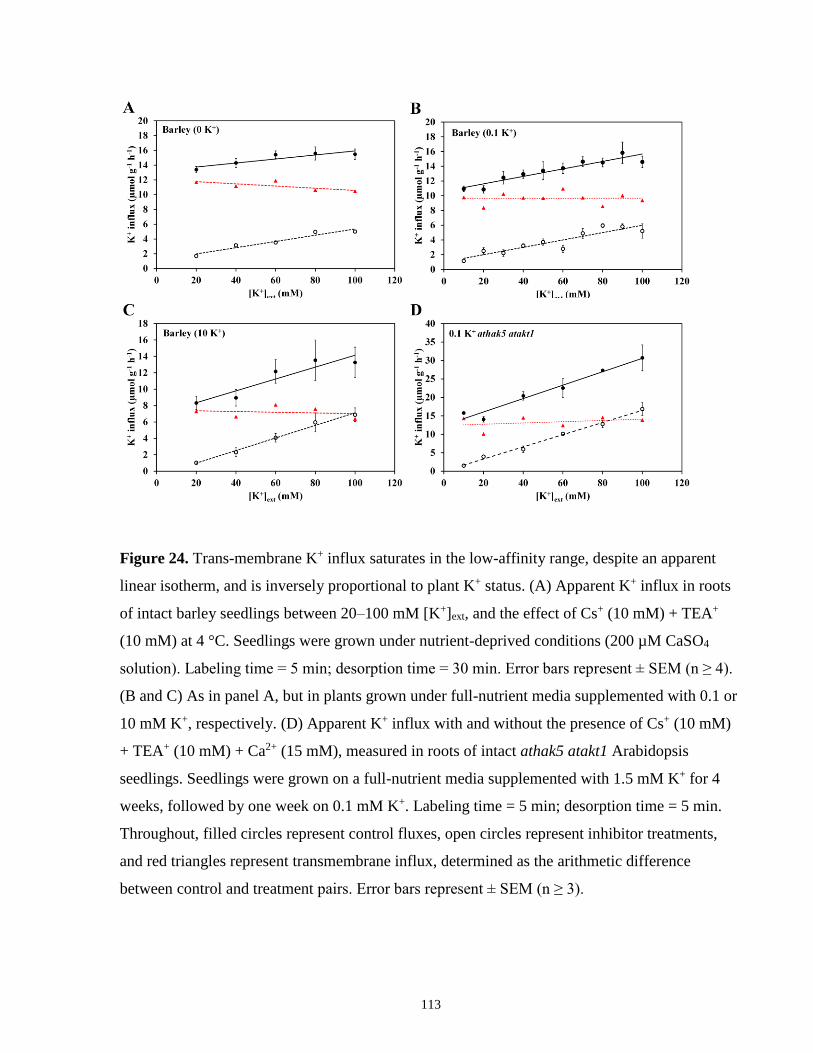
113
Figure 24. Trans-membrane K+ influx saturates in the low-affinity range, despite an apparent
linear isotherm, and is inversely proportional to plant K+ status. (A) Apparent K+ influx in roots
of intact barley seedlings between 20–100 mM [K+]ext, and the effect of Cs+ (10 mM) + TEA+
(10 mM) at 4 °C. Seedlings were grown under nutrient-deprived conditions (200 µM CaSO4
solution). Labeling time = 5 min; desorption time = 30 min. Error bars represent ± SEM (n ≥ 4).
(B and C) As in panel A, but in plants grown under full-nutrient media supplemented with 0.1 or
10 mM K+, respectively. (D) Apparent K+ influx with and without the presence of Cs+ (10 mM)
+ TEA+ (10 mM) + Ca2+ (15 mM), measured in roots of intact athak5 atakt1 Arabidopsis
seedlings. Seedlings were grown on a full-nutrient media supplemented with 1.5 mM K+ for 4
weeks, followed by one week on 0.1 mM K+. Labeling time = 5 min; desorption time = 5 min.
Throughout, filled circles represent control fluxes, open circles represent inhibitor treatments,
and red triangles represent transmembrane influx, determined as the arithmetic difference
between control and treatment pairs. Error bars represent ± SEM (n ≥ 3).
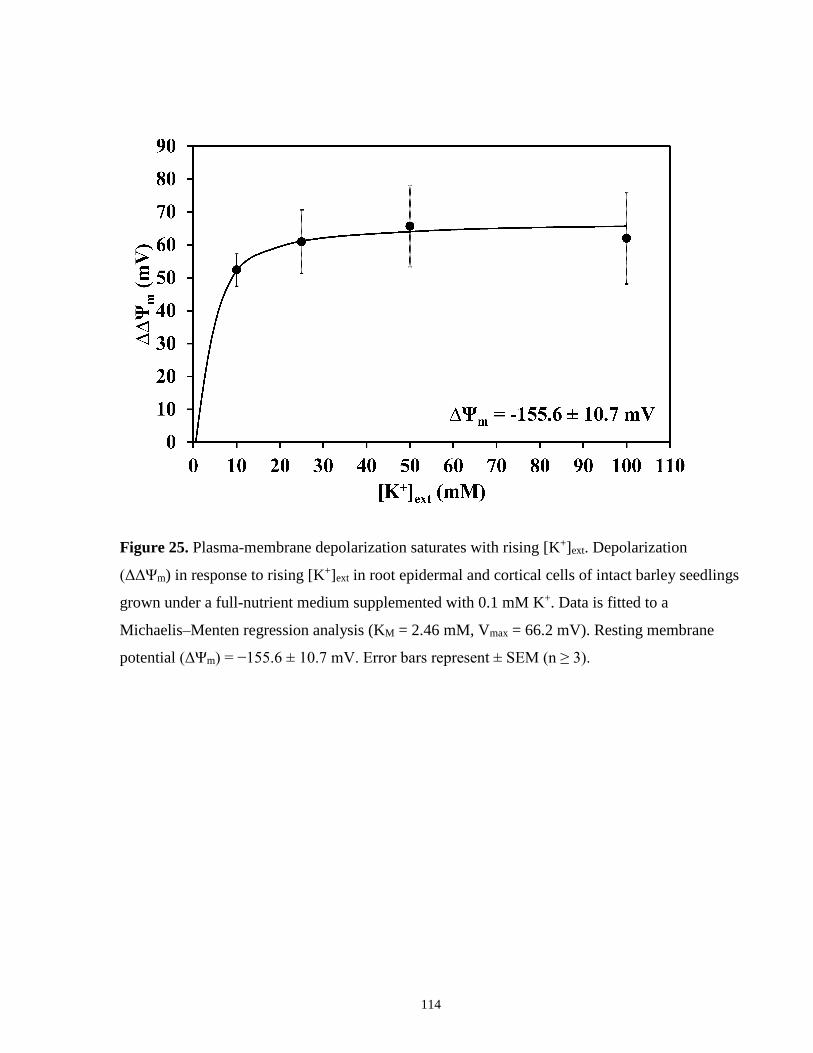
114
Figure 25. Plasma-membrane depolarization saturates with rising [K+]ext. Depolarization
(ΔΔΨm) in response to rising [K+]ext in root epidermal and cortical cells of intact barley seedlings
grown under a full-nutrient medium supplemented with 0.1 mM K+. Data is fitted to a
Michaelis–Menten regression analysis (KM = 2.46 mM, Vmax = 66.2 mV). Resting membrane
potential (ΔΨm) = −155.6 ± 10.7 mV. Error bars represent ± SEM (n ≥ 3).
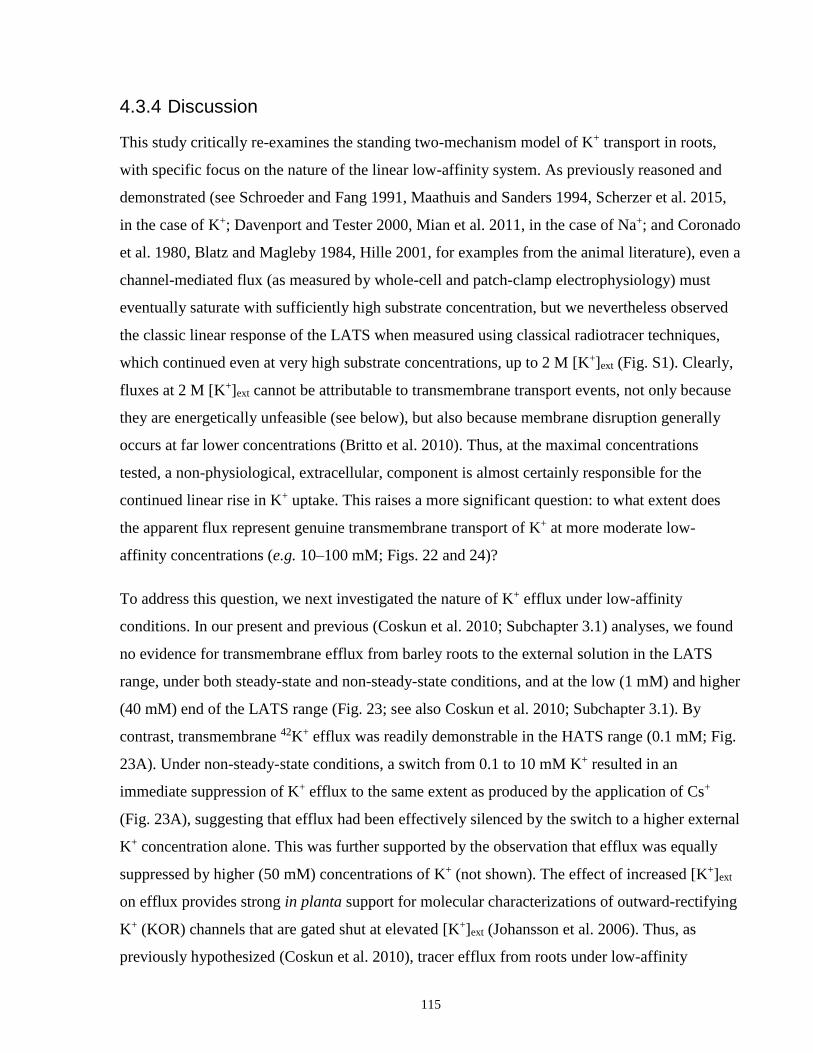
115
4.3.4 Discussion
This study critically re-examines the standing two-mechanism model of K+ transport in roots,
with specific focus on the nature of the linear low-affinity system. As previously reasoned and
demonstrated (see Schroeder and Fang 1991, Maathuis and Sanders 1994, Scherzer et al. 2015,
in the case of K+; Davenport and Tester 2000, Mian et al. 2011, in the case of Na+; and Coronado
et al. 1980, Blatz and Magleby 1984, Hille 2001, for examples from the animal literature), even a
channel-mediated flux (as measured by whole-cell and patch-clamp electrophysiology) must
eventually saturate with sufficiently high substrate concentration, but we nevertheless observed
the classic linear response of the LATS when measured using classical radiotracer techniques,
which continued even at very high substrate concentrations, up to 2 M [K+]ext (Fig. S1). Clearly,
fluxes at 2 M [K+]ext cannot be attributable to transmembrane transport events, not only because
they are energetically unfeasible (see below), but also because membrane disruption generally
occurs at far lower concentrations (Britto et al. 2010). Thus, at the maximal concentrations
tested, a non-physiological, extracellular, component is almost certainly responsible for the
continued linear rise in K+ uptake. This raises a more significant question: to what extent does
the apparent flux represent genuine transmembrane transport of K+ at more moderate low-
affinity concentrations (e.g. 10–100 mM; Figs. 22 and 24)?
To address this question, we next investigated the nature of K+ efflux under low-affinity
conditions. In our present and previous (Coskun et al. 2010; Subchapter 3.1) analyses, we found
no evidence for transmembrane efflux from barley roots to the external solution in the LATS
range, under both steady-state and non-steady-state conditions, and at the low (1 mM) and higher
(40 mM) end of the LATS range (Fig. 23; see also Coskun et al. 2010; Subchapter 3.1). By
contrast, transmembrane 42K+ efflux was readily demonstrable in the HATS range (0.1 mM; Fig.
23A). Under non-steady-state conditions, a switch from 0.1 to 10 mM K+ resulted in an
immediate suppression of K+ efflux to the same extent as produced by the application of Cs+
(Fig. 23A), suggesting that efflux had been effectively silenced by the switch to a higher external
K+ concentration alone. This was further supported by the observation that efflux was equally
suppressed by higher (50 mM) concentrations of K+ (not shown). The effect of increased [K+]ext
on efflux provides strong in planta support for molecular characterizations of outward-rectifying
K+ (KOR) channels that are gated shut at elevated [K+]ext (Johansson et al. 2006). Thus, as
previously hypothesized (Coskun et al. 2010), tracer efflux from roots under low-affinity
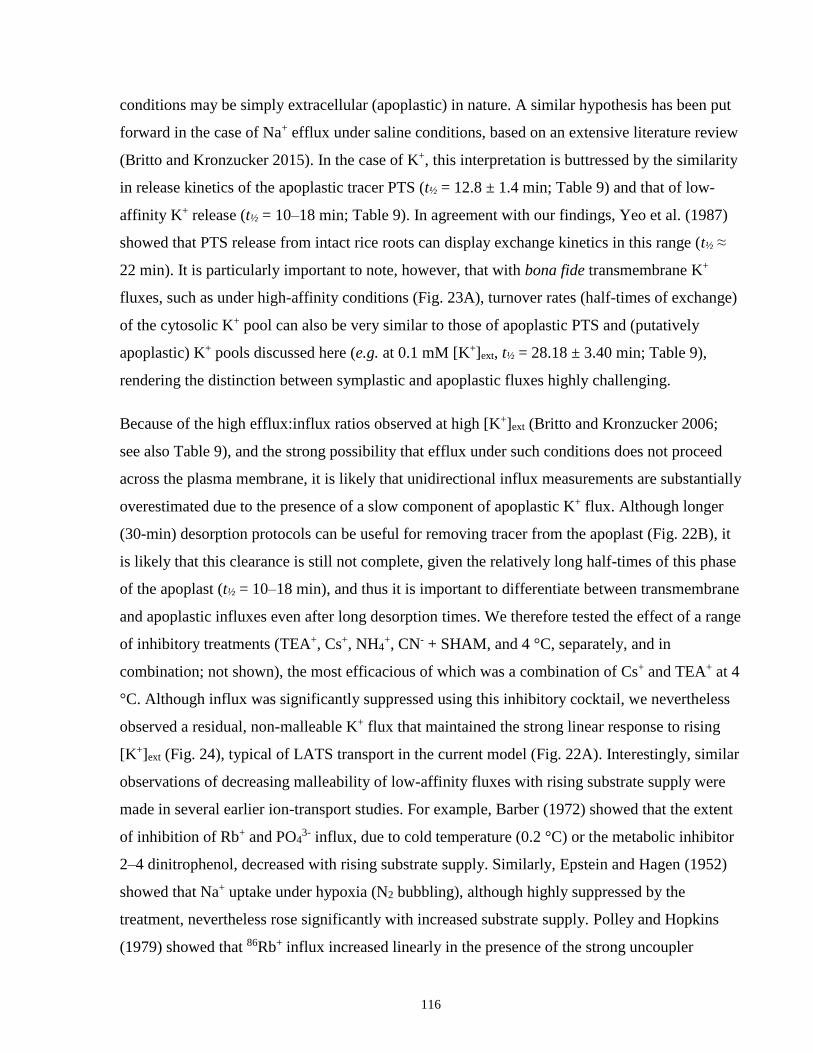
116
conditions may be simply extracellular (apoplastic) in nature. A similar hypothesis has been put
forward in the case of Na+ efflux under saline conditions, based on an extensive literature review
(Britto and Kronzucker 2015). In the case of K+, this interpretation is buttressed by the similarity
in release kinetics of the apoplastic tracer PTS (t½ = 12.8 ± 1.4 min; Table 9) and that of low-
affinity K+ release (t½ = 10–18 min; Table 9). In agreement with our findings, Yeo et al. (1987)
showed that PTS release from intact rice roots can display exchange kinetics in this range (t½ ≈
22 min). It is particularly important to note, however, that with bona fide transmembrane K+
fluxes, such as under high-affinity conditions (Fig. 23A), turnover rates (half-times of exchange)
of the cytosolic K+ pool can also be very similar to those of apoplastic PTS and (putatively
apoplastic) K+ pools discussed here (e.g. at 0.1 mM [K+]ext, t½ = 28.18 ± 3.40 min; Table 9),
rendering the distinction between symplastic and apoplastic fluxes highly challenging.
Because of the high efflux:influx ratios observed at high [K+]ext (Britto and Kronzucker 2006;
see also Table 9), and the strong possibility that efflux under such conditions does not proceed
across the plasma membrane, it is likely that unidirectional influx measurements are substantially
overestimated due to the presence of a slow component of apoplastic K+ flux. Although longer
(30-min) desorption protocols can be useful for removing tracer from the apoplast (Fig. 22B), it
is likely that this clearance is still not complete, given the relatively long half-times of this phase
of the apoplast (t½ = 10–18 min), and thus it is important to differentiate between transmembrane
and apoplastic influxes even after long desorption times. We therefore tested the effect of a range
of inhibitory treatments (TEA+, Cs+, NH4+, CN- + SHAM, and 4 °C, separately, and in
combination; not shown), the most efficacious of which was a combination of Cs+ and TEA+ at 4
°C. Although influx was significantly suppressed using this inhibitory cocktail, we nevertheless
observed a residual, non-malleable K+ flux that maintained the strong linear response to rising
[K+]ext (Fig. 24), typical of LATS transport in the current model (Fig. 22A). Interestingly, similar
observations of decreasing malleability of low-affinity fluxes with rising substrate supply were
made in several earlier ion-transport studies. For example, Barber (1972) showed that the extent
of inhibition of Rb+ and PO43- influx, due to cold temperature (0.2 °C) or the metabolic inhibitor
2–4 dinitrophenol, decreased with rising substrate supply. Similarly, Epstein and Hagen (1952)
showed that Na+ uptake under hypoxia (N2 bubbling), although highly suppressed by the
treatment, nevertheless rose significantly with increased substrate supply. Polley and Hopkins
(1979) showed that 86Rb+ influx increased linearly in the presence of the strong uncoupler
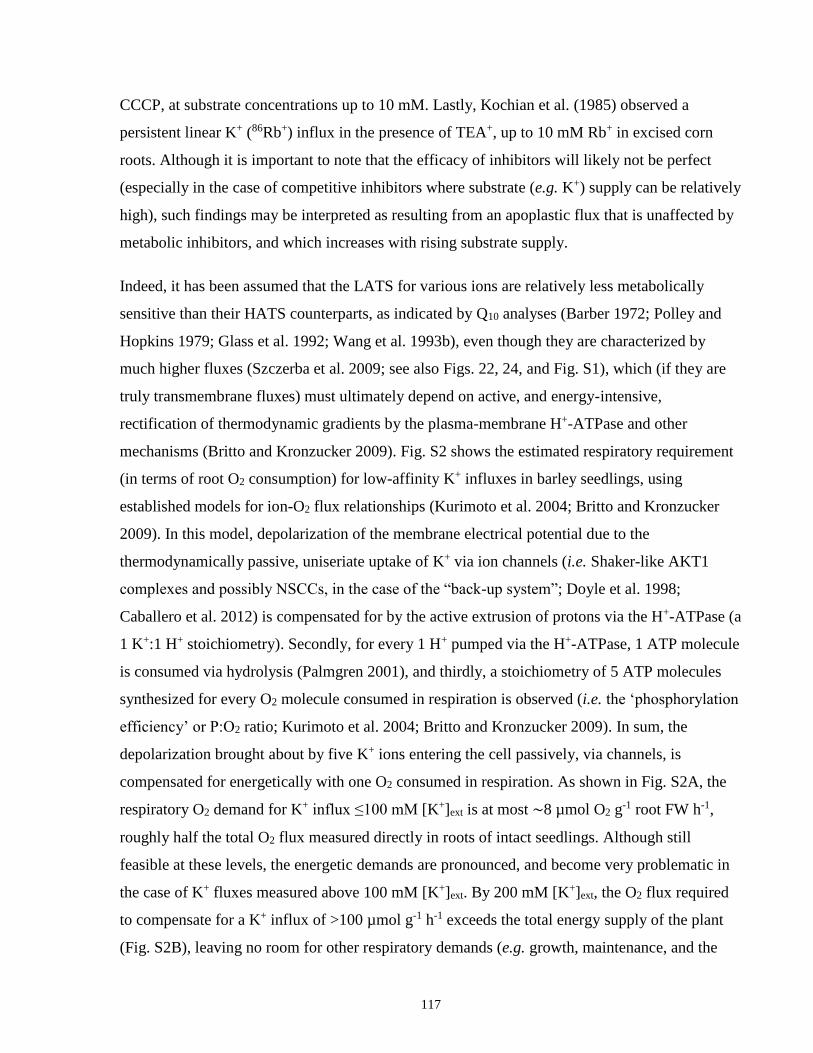
117
CCCP, at substrate concentrations up to 10 mM. Lastly, Kochian et al. (1985) observed a
persistent linear K+ (86Rb+) influx in the presence of TEA+, up to 10 mM Rb+ in excised corn
roots. Although it is important to note that the efficacy of inhibitors will likely not be perfect
(especially in the case of competitive inhibitors where substrate (e.g. K+) supply can be relatively
high), such findings may be interpreted as resulting from an apoplastic flux that is unaffected by
metabolic inhibitors, and which increases with rising substrate supply.
Indeed, it has been assumed that the LATS for various ions are relatively less metabolically
sensitive than their HATS counterparts, as indicated by Q10 analyses (Barber 1972; Polley and
Hopkins 1979; Glass et al. 1992; Wang et al. 1993b), even though they are characterized by
much higher fluxes (Szczerba et al. 2009; see also Figs. 22, 24, and Fig. S1), which (if they are
truly transmembrane fluxes) must ultimately depend on active, and energy-intensive,
rectification of thermodynamic gradients by the plasma-membrane H+-ATPase and other
mechanisms (Britto and Kronzucker 2009). Fig. S2 shows the estimated respiratory requirement
(in terms of root O2 consumption) for low-affinity K+ influxes in barley seedlings, using
established models for ion-O2 flux relationships (Kurimoto et al. 2004; Britto and Kronzucker
2009). In this model, depolarization of the membrane electrical potential due to the
thermodynamically passive, uniseriate uptake of K+ via ion channels (i.e. Shaker-like AKT1
complexes and possibly NSCCs, in the case of the “back-up system”; Doyle et al. 1998;
Caballero et al. 2012) is compensated for by the active extrusion of protons via the H+-ATPase (a
1 K+:1 H+ stoichiometry). Secondly, for every 1 H+ pumped via the H+-ATPase, 1 ATP molecule
is consumed via hydrolysis (Palmgren 2001), and thirdly, a stoichiometry of 5 ATP molecules
synthesized for every O2 molecule consumed in respiration is observed (i.e. the ‘phosphorylation
efficiency’ or P:O2 ratio; Kurimoto et al. 2004; Britto and Kronzucker 2009). In sum, the
depolarization brought about by five K+ ions entering the cell passively, via channels, is
compensated for energetically with one O2 consumed in respiration. As shown in Fig. S2A, the
respiratory O2 demand for K+ influx ≤100 mM [K+]ext is at most ∼8 µmol O2 g-1 root FW h-1,
roughly half the total O2 flux measured directly in roots of intact seedlings. Although still
feasible at these levels, the energetic demands are pronounced, and become very problematic in
the case of K+ fluxes measured above 100 mM [K+]ext. By 200 mM [K+]ext, the O2 flux required
to compensate for a K+ influx of >100 µmol g-1 h-1 exceeds the total energy supply of the plant
(Fig. S2B), leaving no room for other respiratory demands (e.g. growth, maintenance, and the
118
fluxes of other substrates). Such energetic inconsistencies were initially discovered in the case of
Na+ fluxes under salt stress, and call into question the plausibility of extremely high
transmembrane ion fluxes, as have been seen with sodium (Britto and Kronzucker 2009), and
here in the case of K+. The energy demands would become even greater were one to postulate a
concomitantly operating active-efflux mechanism, such as a K+/H+ antiporter (e.g. via CHX
proteins; Pardo et al. 2006), at the plasma membrane (Fig. S2; Table S2; however, see above).
Taken together, our findings strongly suggest that K+-influx traces, as obtained by established
protocols, are unlikely to accurately represent genuine transmembrane K+ fluxes. However, a
genuine membrane flux may still be estimated by subtracting the non-malleable fluxes
(representing apoplastic fluxes; Fig. 24) from the uninhibited control fluxes. Interestingly, this
subtraction exercise reveals a possible ‘transmembrane’ flux that follows Michaelis–Menten
kinetics, and is saturated between 10 and 100 mM [K+]ext. This flux is therefore not compatible
with the paradigm of an indefinitely linearly rising transmembrane influx, but exhibits a
concentration-dependence pattern remarkably similar to those found in enzyme kinetics and
high-affinity transport systems. Corroborating evidence for a saturable transmembrane influx is
provided by electrophysiological experiments showing a saturable depolarization response in
root epidermal and cortical cells in intact barley seedlings exposed to 10–100 mM [K+]ext (Fig.
25). Michaelis-Menten analysis of the electrical response yields an apparent KM of 2.5 mM, in
good agreement with reported kinetic values for channel-mediated fluxes (Epstein et al. 1963;
Schroeder and Fang 1991; Gassmann and Schroeder 1994; Maathuis and Sanders 1995; 1996a;
Gierth et al. 2005). KM values from tracer-uptake experiments were not obtained since
transmembrane K+ influx had already appeared to reach its maximal rate (Vmax) by 10 mM
[K+]ext (Fig. 24); this apparent Vmax ranged from 7 to 12 µmol g-1 h-1 and showed a strong
dependence on the level of K+ provision during growth (Fig. 24A–C). Thus, the intensity of
transmembrane K+ transport appears to depend on plant K+ status in the low-affinity range, a
property previously thought to be exclusive to the high-affinity range (Glass and Dunlop 1978;
Kochian and Lucas 1982; Gierth et al. 2005). However, this variability in Vmax probably does not
reflect changes in transporter-gene expression (as is known to occur in the high-affinity range;
Gierth et al. 2005) but rather may be the result of the well-documented effects of plant K+ status
on the membrane electrical polarization that drives the thermodynamically passive, channel-
mediated flux (Szczerba et al. 2009). In Arabidopsis athak5 atakt1 double-knock-out mutants,
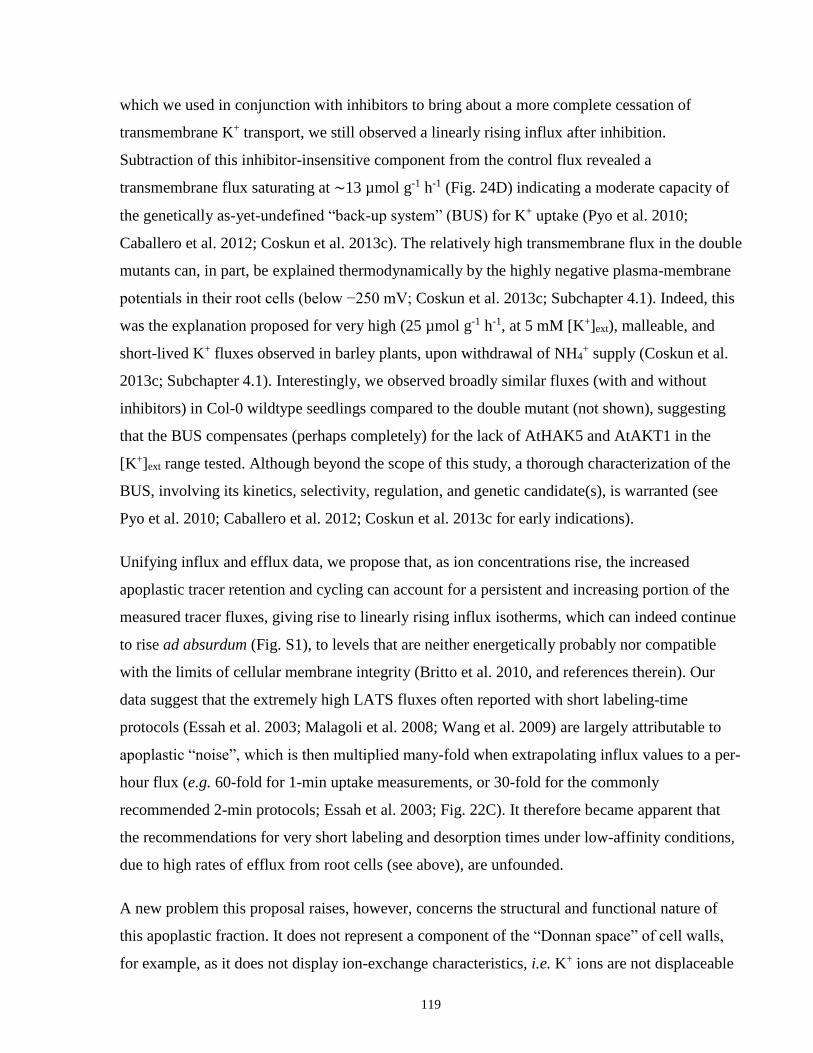
119
which we used in conjunction with inhibitors to bring about a more complete cessation of
transmembrane K+ transport, we still observed a linearly rising influx after inhibition.
Subtraction of this inhibitor-insensitive component from the control flux revealed a
transmembrane flux saturating at ∼13 µmol g-1 h-1 (Fig. 24D) indicating a moderate capacity of
the genetically as-yet-undefined “back-up system” (BUS) for K+ uptake (Pyo et al. 2010;
Caballero et al. 2012; Coskun et al. 2013c). The relatively high transmembrane flux in the double
mutants can, in part, be explained thermodynamically by the highly negative plasma-membrane
potentials in their root cells (below −250 mV; Coskun et al. 2013c; Subchapter 4.1). Indeed, this
was the explanation proposed for very high (25 µmol g-1 h-1, at 5 mM [K+]ext), malleable, and
short-lived K+ fluxes observed in barley plants, upon withdrawal of NH4+ supply (Coskun et al.
2013c; Subchapter 4.1). Interestingly, we observed broadly similar fluxes (with and without
inhibitors) in Col-0 wildtype seedlings compared to the double mutant (not shown), suggesting
that the BUS compensates (perhaps completely) for the lack of AtHAK5 and AtAKT1 in the
[K+]ext range tested. Although beyond the scope of this study, a thorough characterization of the
BUS, involving its kinetics, selectivity, regulation, and genetic candidate(s), is warranted (see
Pyo et al. 2010; Caballero et al. 2012; Coskun et al. 2013c for early indications).
Unifying influx and efflux data, we propose that, as ion concentrations rise, the increased
apoplastic tracer retention and cycling can account for a persistent and increasing portion of the
measured tracer fluxes, giving rise to linearly rising influx isotherms, which can indeed continue
to rise ad absurdum (Fig. S1), to levels that are neither energetically probably nor compatible
with the limits of cellular membrane integrity (Britto et al. 2010, and references therein). Our
data suggest that the extremely high LATS fluxes often reported with short labeling-time
protocols (Essah et al. 2003; Malagoli et al. 2008; Wang et al. 2009) are largely attributable to
apoplastic “noise”, which is then multiplied many-fold when extrapolating influx values to a per-
hour flux (e.g. 60-fold for 1-min uptake measurements, or 30-fold for the commonly
recommended 2-min protocols; Essah et al. 2003; Fig. 22C). It therefore became apparent that
the recommendations for very short labeling and desorption times under low-affinity conditions,
due to high rates of efflux from root cells (see above), are unfounded.
A new problem this proposal raises, however, concerns the structural and functional nature of
this apoplastic fraction. It does not represent a component of the “Donnan space” of cell walls,
for example, as it does not display ion-exchange characteristics, i.e. K+ ions are not displaceable
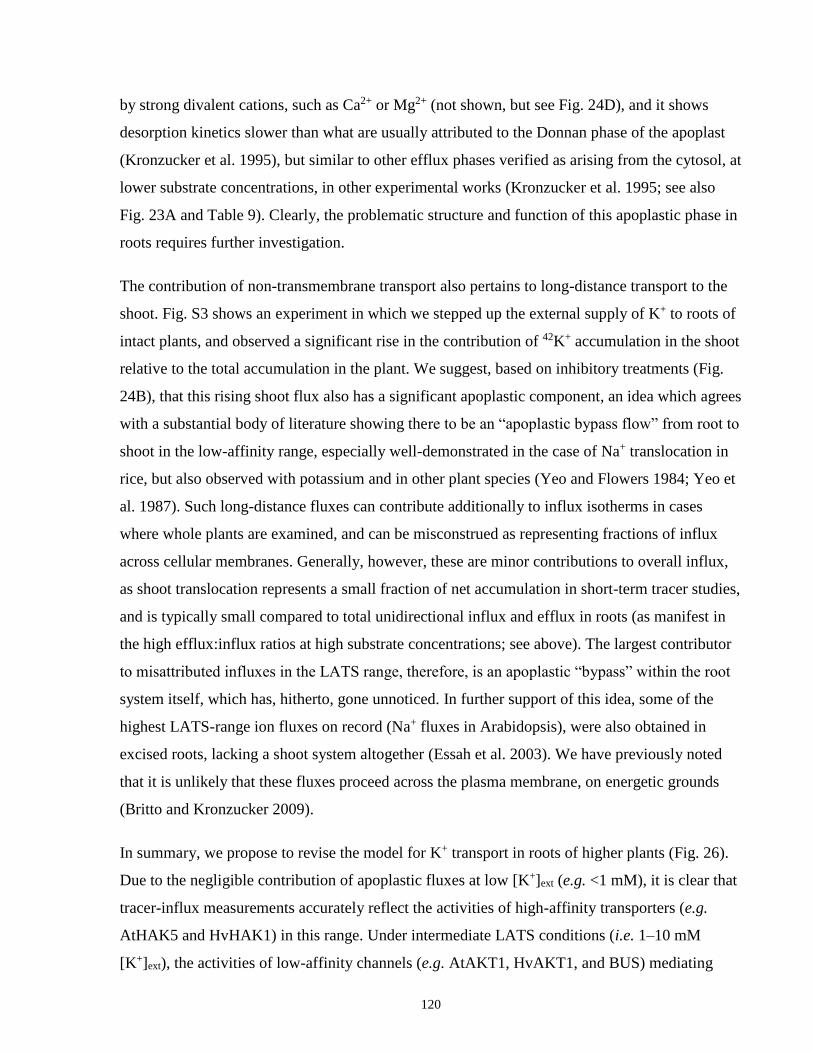
120
by strong divalent cations, such as Ca2+ or Mg2+ (not shown, but see Fig. 24D), and it shows
desorption kinetics slower than what are usually attributed to the Donnan phase of the apoplast
(Kronzucker et al. 1995), but similar to other efflux phases verified as arising from the cytosol, at
lower substrate concentrations, in other experimental works (Kronzucker et al. 1995; see also
Fig. 23A and Table 9). Clearly, the problematic structure and function of this apoplastic phase in
roots requires further investigation.
The contribution of non-transmembrane transport also pertains to long-distance transport to the
shoot. Fig. S3 shows an experiment in which we stepped up the external supply of K+ to roots of
intact plants, and observed a significant rise in the contribution of 42K+ accumulation in the shoot
relative to the total accumulation in the plant. We suggest, based on inhibitory treatments (Fig.
24B), that this rising shoot flux also has a significant apoplastic component, an idea which agrees
with a substantial body of literature showing there to be an “apoplastic bypass flow” from root to
shoot in the low-affinity range, especially well-demonstrated in the case of Na+ translocation in
rice, but also observed with potassium and in other plant species (Yeo and Flowers 1984; Yeo et
al. 1987). Such long-distance fluxes can contribute additionally to influx isotherms in cases
where whole plants are examined, and can be misconstrued as representing fractions of influx
across cellular membranes. Generally, however, these are minor contributions to overall influx,
as shoot translocation represents a small fraction of net accumulation in short-term tracer studies,
and is typically small compared to total unidirectional influx and efflux in roots (as manifest in
the high efflux:influx ratios at high substrate concentrations; see above). The largest contributor
to misattributed influxes in the LATS range, therefore, is an apoplastic “bypass” within the root
system itself, which has, hitherto, gone unnoticed. In further support of this idea, some of the
highest LATS-range ion fluxes on record (Na+ fluxes in Arabidopsis), were also obtained in
excised roots, lacking a shoot system altogether (Essah et al. 2003). We have previously noted
that it is unlikely that these fluxes proceed across the plasma membrane, on energetic grounds
(Britto and Kronzucker 2009).
In summary, we propose to revise the model for K+ transport in roots of higher plants (Fig. 26).
Due to the negligible contribution of apoplastic fluxes at low [K+]ext (e.g. <1 mM), it is clear that
tracer-influx measurements accurately reflect the activities of high-affinity transporters (e.g.
AtHAK5 and HvHAK1) in this range. Under intermediate LATS conditions (i.e. 1–10 mM
[K+]ext), the activities of low-affinity channels (e.g. AtAKT1, HvAKT1, and BUS) mediating
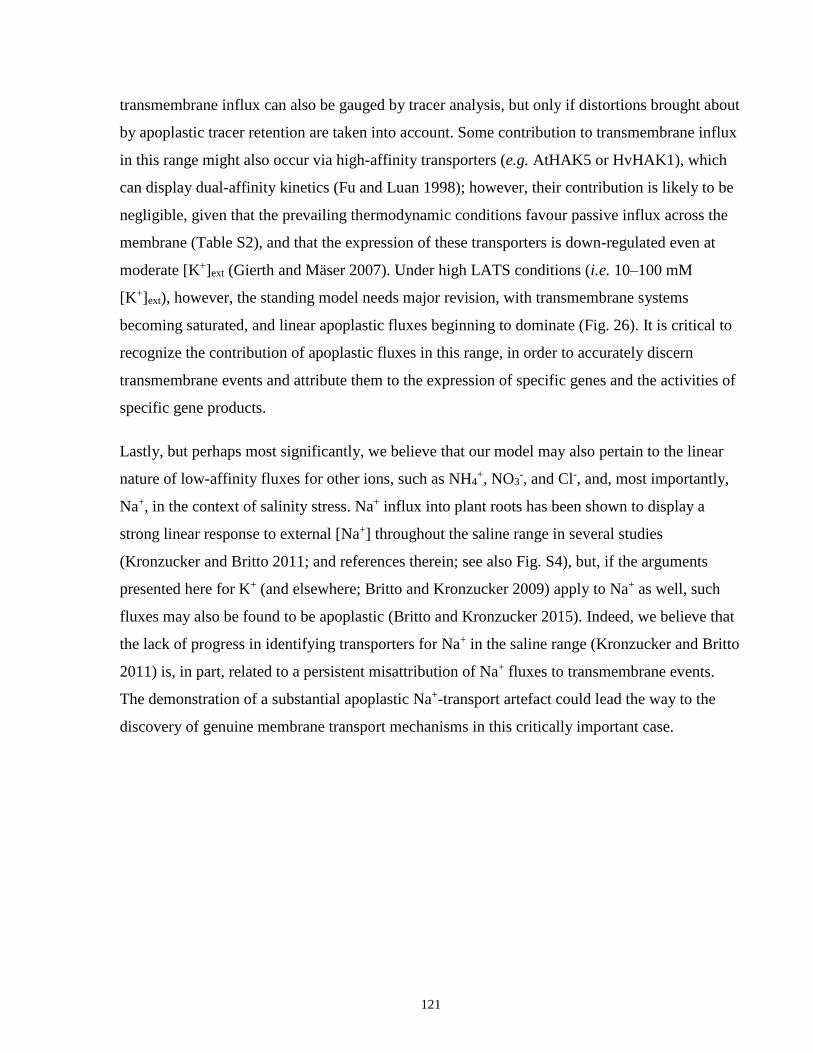
121
transmembrane influx can also be gauged by tracer analysis, but only if distortions brought about
by apoplastic tracer retention are taken into account. Some contribution to transmembrane influx
in this range might also occur via high-affinity transporters (e.g. AtHAK5 or HvHAK1), which
can display dual-affinity kinetics (Fu and Luan 1998); however, their contribution is likely to be
negligible, given that the prevailing thermodynamic conditions favour passive influx across the
membrane (Table S2), and that the expression of these transporters is down-regulated even at
moderate [K+]ext (Gierth and Mäser 2007). Under high LATS conditions (i.e. 10–100 mM
[K+]ext), however, the standing model needs major revision, with transmembrane systems
becoming saturated, and linear apoplastic fluxes beginning to dominate (Fig. 26). It is critical to
recognize the contribution of apoplastic fluxes in this range, in order to accurately discern
transmembrane events and attribute them to the expression of specific genes and the activities of
specific gene products.
Lastly, but perhaps most significantly, we believe that our model may also pertain to the linear
nature of low-affinity fluxes for other ions, such as NH4+, NO3
-, and Cl-, and, most importantly,
Na+, in the context of salinity stress. Na+ influx into plant roots has been shown to display a
strong linear response to external [Na+] throughout the saline range in several studies
(Kronzucker and Britto 2011; and references therein; see also Fig. S4), but, if the arguments
presented here for K+ (and elsewhere; Britto and Kronzucker 2009) apply to Na+ as well, such
fluxes may also be found to be apoplastic (Britto and Kronzucker 2015). Indeed, we believe that
the lack of progress in identifying transporters for Na+ in the saline range (Kronzucker and Britto
2011) is, in part, related to a persistent misattribution of Na+ fluxes to transmembrane events.
The demonstration of a substantial apoplastic Na+-transport artefact could lead the way to the
discovery of genuine membrane transport mechanisms in this critically important case.
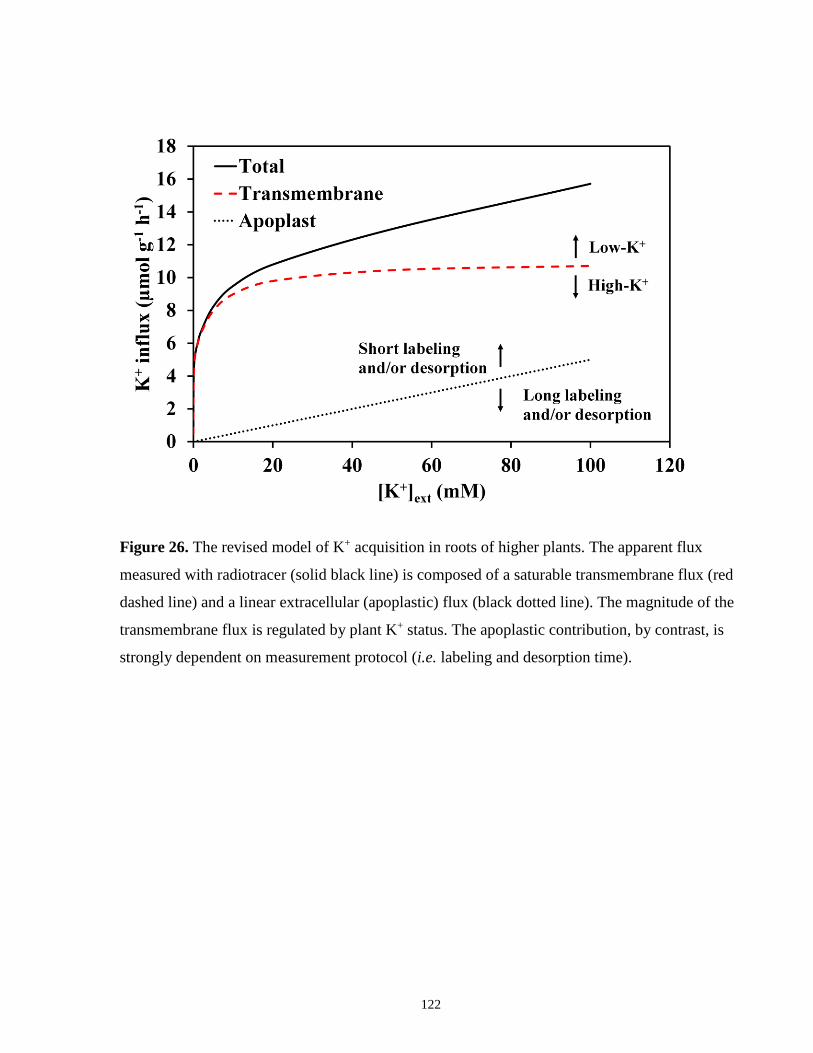
122
Figure 26. The revised model of K+ acquisition in roots of higher plants. The apparent flux
measured with radiotracer (solid black line) is composed of a saturable transmembrane flux (red
dashed line) and a linear extracellular (apoplastic) flux (black dotted line). The magnitude of the
transmembrane flux is regulated by plant K+ status. The apoplastic contribution, by contrast, is
strongly dependent on measurement protocol (i.e. labeling and desorption time).
123
Chapter 5 A Cautionary Tale Regarding the Use of Pharmacological Agents
Silver Ions Disrupt K+ Homeostasis and Cellular Integrity in Barley (Hordeum vulgare L.) Roots
Preface
A modified version of this chapter was published as: Coskun D, Britto DT, Jean Y-K, Schulze L,
Becker A, Kronzucker HJ (2012) Silver ions disrupt K+ homeostasis and cellular integrity in
barley (Hordeum vulgare L.) roots. Journal of Experimental Botany 63, 151-162. Supplementary
material cited in this chapter can be found online:
http://jxb.oxfordjournals.org/content/63/1/151/suppl/DC1.
HJ Kronzucker designed the study, with input from DT Britto, D Coskun, and A Becker. D
Coskun, Y-K Jean, L Schulze, and A Becker performed the experiments and analyzed the data,
with input from DT Britto and HJ Kronzucker. DT Britto and D Coskun wrote the manuscript,
with input and editing from HJ Kronzucker.
5.1.1 Abstract
The heavy metals silver, gold, and mercury can strongly inhibit aquaporin-mediated water flow
across plant cell membranes, but critical examinations of their side effects are rare. Here, the
short-lived radiotracer 42K is used to demonstrate that these metals, especially silver, profoundly
change potassium homeostasis in roots of intact barley (Hordeum vulgare L.) plants, by altering
unidirectional K+ fluxes. Doses as low as 5 µM AgNO3 rapidly reduced K+ influx to 5% that of
controls, and brought about pronounced and immediate increases in K+ efflux, while higher
doses of Au3+ and Hg2+ were required to produce similar responses. Reduced influx and
enhanced efflux of K+ resulted in a net loss of >40% of root tissue K+ during a 15-min
application of 500 µM AgNO3, comprising the entire cytosolic potassium pool and about a third
of the vacuolar pool. Silver also brought about major losses of UV-absorbing compounds, total
electrolytes, and NH4+. Co-application, with silver, of the channel blockers Cs+, TEA+, or Ca2+,
124
did not affect the enhanced efflux, ruling out the involvement of outwardly-rectifying ion
channels. Taken together with an examination of propidium-iodide staining under confocal
microscopy, the results indicate that heavy-metal aquaporin inhibitors affect K+ homeostasis by
directly inhibiting K+ influx at lower concentrations, and indirectly inhibiting K+ influx and
enhancing K+ efflux, via membrane destruction, at higher concentrations. Ni2+, Cd2+, and Pb2+,
three heavy metals not generally known to affect aquaporins, did not enhance K+ efflux or cause
propidium-iodide incorporation. The study reveals strong and previously unknown effects of
major aquaporin inhibitors and recommends caution in their application.
5.1.2 Introduction
Aquaporins (AQPs) comprise a diverse, recently discovered group of membrane-bound proteins
that facilitate the movement of water, and of small, usually uncharged molecules such as urea,
glycerol, carbon dioxide, and ammonia, across the membranes of living cells (Maurel et al. 2008;
Hove and Bhave 2011). In plants and other organisms, AQP function has been studied
extensively by use of mercury (Hg2+)-containing compounds, which inhibit water flux at both the
tissue and cellular level (Preston et al. 1992; Maurel et al. 1993). More recently, it has been
shown that silver (Ag+) and gold (Au3+) ions can block the flow of water through AQPs even
more effectively than mercury, albeit by a different mechanism (Niemietz and Tyerman 2002;
see also Table S1). Silver is also used widely as an inhibitor in the study of ethylene biosynthesis
(Beyer 1976; see also Table S1). As with the use of any inhibitory treatment, it is crucial to
determine the specificity of the inhibition. The toxic nature of mercury is legendary (Patra and
Sharma 2000; Eisler 2006), and Santoni et al. (2000) cautioned that its disruption of cellular
metabolism and solute homeostasis could cause confounding side effects such as the
downregulation of AQP activity, or the collapse of water potential gradients across cell
membranes. These authors concluded that mercury could, nevertheless, be reasonably applied in
water transport studies, provided that low concentrations (<100 µM) are used, and that control
experiments are conducted to indicate that perturbations to cellular functions, such as ion
transport, are minimal (see also Meharg and Jardine 2003). Similarly, Zhang and Tyerman
(1999) suggested that high concentrations of mercury (300 µM) could have non-specific,
125
detrimental effects on cell membranes, and that lower concentrations should therefore be
employed in AQP studies.
In practice, however, such control experiments can be difficult, and are rarely conducted. In
addition, as can be seen in Table S1, which shows the result of a literature survey on the use of
mercury, silver, and gold as AQP inhibitors (and, in the case of silver, also as an inhibitor of
ethylene biosynthesis), applied concentrations of several hundred micromolar, or even several
millimolar, are frequently used, well in excess of the (somewhat arbitrary, as we shall see) limit
suggested by Santoni et al. (2000).
In the present authors’ own laboratory, AQP function has recently been investigated due to a
long-standing interest in the mechanisms of N uptake in plant cells in the context of the
hypothesis that low-affinity NH3/NH4+ transport into root cells is mediated by AQPs. While there
is growing evidence for such mediation in heterologous expression systems (Jahn et al. 2004;
Holm et al. 2005; Loqué et al. 2005; Hove and Bhave 2011), a convincing in planta
demonstration is still lacking. The initial hypothesis was supported by the strong reduction, by
mercury and silver, of 13N-labelled NH3/NH4+ influx into barley roots, but, surprisingly, was then
contradicted by a potent silver-induced stimulation of 13N efflux.
These somewhat paradoxical findings led to a new hypothesis, that the effects of silver, and
possibly other heavy-metal inhibitors, on tracer fluxes extend beyond a simple inhibition of AQP
activity. In the present study, this hypothesis was tested by examination of the effects of Hg2+,
Ag+, and Au3+ on unidirectional fluxes (root influx and efflux) of K+, an ion not transported to a
significant extent by AQPs (Agre et al. 1997). As will be shown, the results led to a new research
question: is membrane integrity disrupted in roots treated with AQP inhibitors? This possibility,
similar to one previously put forward to explain sodium-stimulated K+ efflux (Britto et al. 2010),
was investigated here using a wide variety of methods, including measurements of tracer fluxes,
release of UV-absorbing compounds and electrolytes, tissue ion content, and confocal
microscopy.
126
5.1.3 Results
Figure 27 shows measurements of unidirectional 13N-radiolabelled NH3/NH4+ influx into intact
barley seedlings, with and without a 10-min treatment of 500 µM AgNO3. Silver application
reduced 13N influx to less than half that of control, while, in the opposite direction of transport, it
brought about an immediate and substantial stimulation of 13N efflux from pre-labelled roots
(Fig. 27, inset). Similar, if even more pronounced, effects of AgNO3 were observed when tracing
unidirectional potassium influx using 42K+, with concentrations as low as 5 µM reducing influx
by 95% (Fig. 28). A small subset of experiments involving 5 µM silver sulphadiazine also
showed a dramatic suppression of K+ influx (Fig. S1). In addition, treatment with Au3+ and Hg2+,
two other heavy metals known to inhibit AQPs (Niemietz and Tyerman 2002), essentially
abolished K+ influx at 500 µM, while lower concentrations also showed significant reductions in
influx, particularly with mercury (Fig. 28). In contrast, Cd2+ and Pb2+, heavy metals described as
non-AQP inhibitors (Niemietz and Tyerman 2002), brought about only a slight inhibition of K+
influx, far less than Ag+ , Au3+, and Hg2+ (Fig. 28). However, Ni2+, though also not identified as
an AQP inhibitor (Niemietz and Tyerman 2002), did significantly reduce K+ influx to a similar
extent as Ag+, Au3+, and Hg2+ (Fig. 28). As with 13N, stimulation of 42K+ efflux was also
observed. Application of 500 µM Ag+ was the most powerful stimulatory treatment, followed by
50 µM Ag+, while 500 µM Au3+ and Hg2+ stimulated K+ release to an extent similar to 5 µM Ag+
(Fig. 29A). 42K+ efflux also showed an immediate and substantial acceleration due to 5 µM silver
sulphadiazine, an identical response to that of equimolar AgNO3 (Fig. S1, inset). The dose
dependence of AgNO3 revealed a ~2-fold increase in tracer released with a 10-fold increase in
applied silver concentration (Fig. 29A, internal legend). Interestingly, K+ efflux stimulation by
160 mM Na+, a well-studied phenomenon (Nassery 1979; Shabala et al. 2006; Britto et al. 2010),
was modest compared with these treatments, with tracer release falling below that seen with 5
µM silver. Applications of Au3+ and Hg2+, at lower concentrations (5 µM or 50 µM), did not
result in 42K+ efflux stimulation, nor did the application of the organic AQP modulators
acetazolamide, zonisamide, or forskolin (all at 10 µM) (Fig. 29B). Applications of 500 µM Pb2+,
Cd2+, and Ni2+ produced little change to the efflux of K+ compared with control (Fig. 29C).
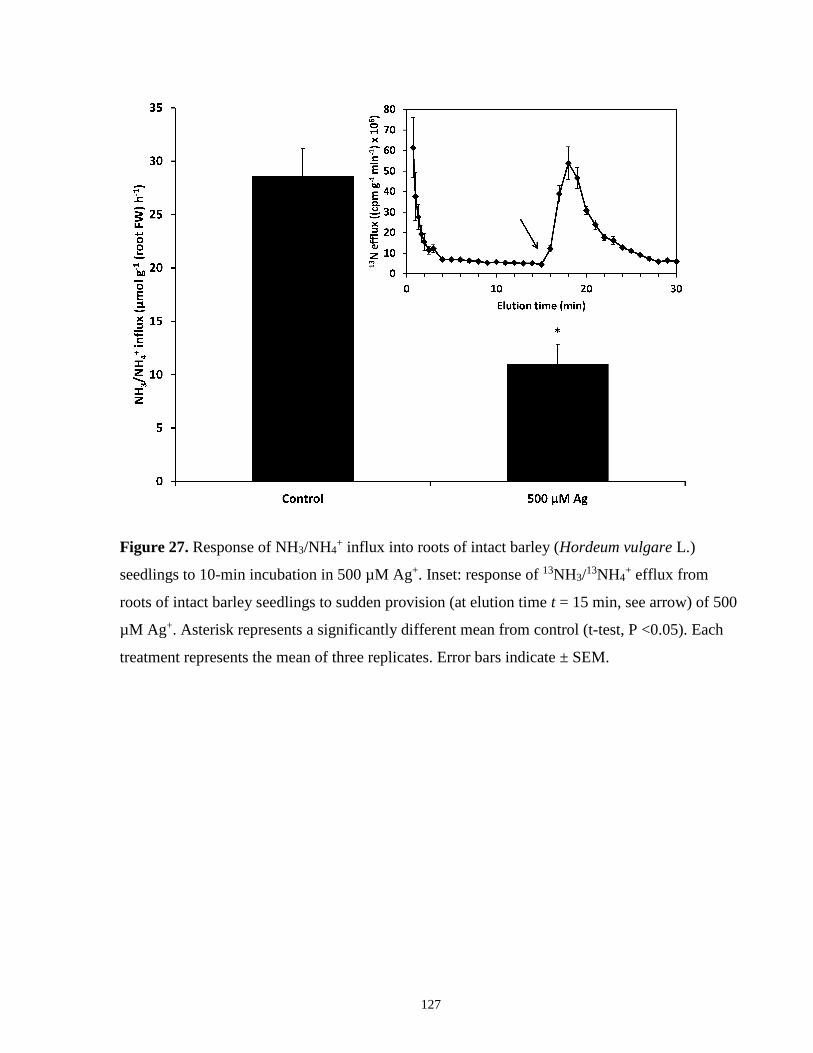
127
Figure 27. Response of NH3/NH4+ influx into roots of intact barley (Hordeum vulgare L.)
seedlings to 10-min incubation in 500 µM Ag+. Inset: response of 13NH3/13NH4
+ efflux from
roots of intact barley seedlings to sudden provision (at elution time t = 15 min, see arrow) of 500
µM Ag+. Asterisk represents a significantly different mean from control (t-test, P <0.05). Each
treatment represents the mean of three replicates. Error bars indicate ± SEM.
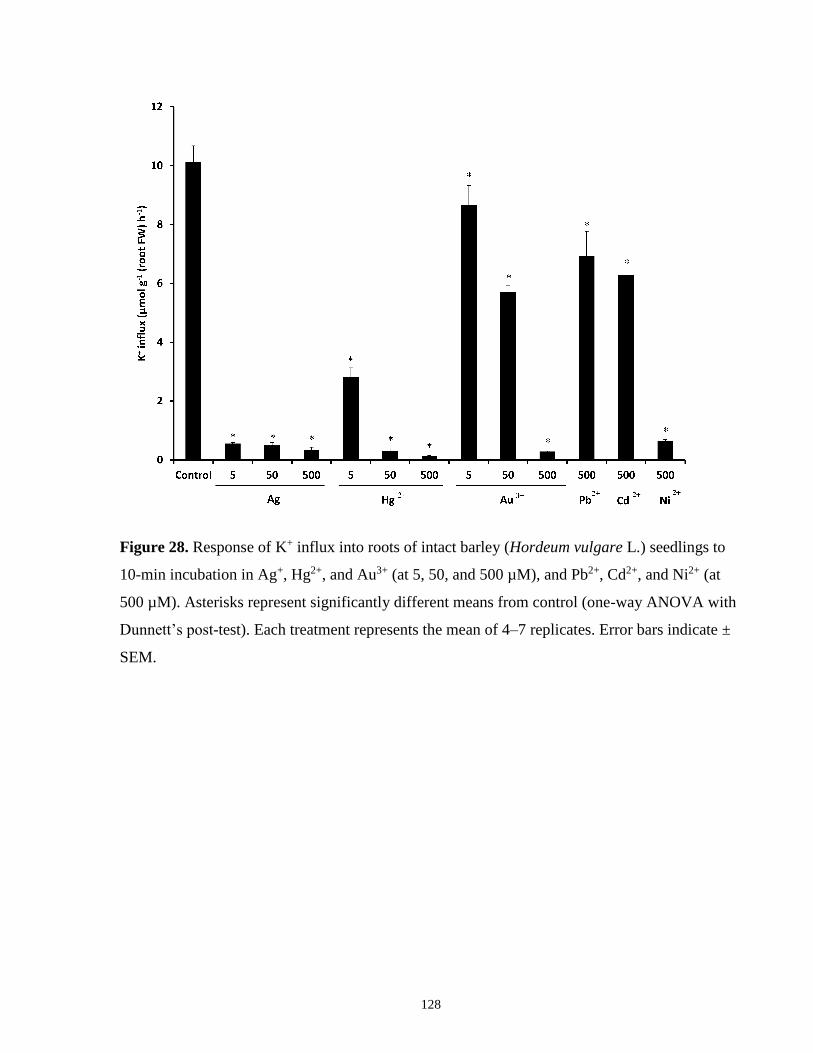
128
Figure 28. Response of K+ influx into roots of intact barley (Hordeum vulgare L.) seedlings to
10-min incubation in Ag+, Hg2+, and Au3+ (at 5, 50, and 500 µM), and Pb2+, Cd2+, and Ni2+ (at
500 µM). Asterisks represent significantly different means from control (one-way ANOVA with
Dunnett’s post-test). Each treatment represents the mean of 4–7 replicates. Error bars indicate ±
SEM.
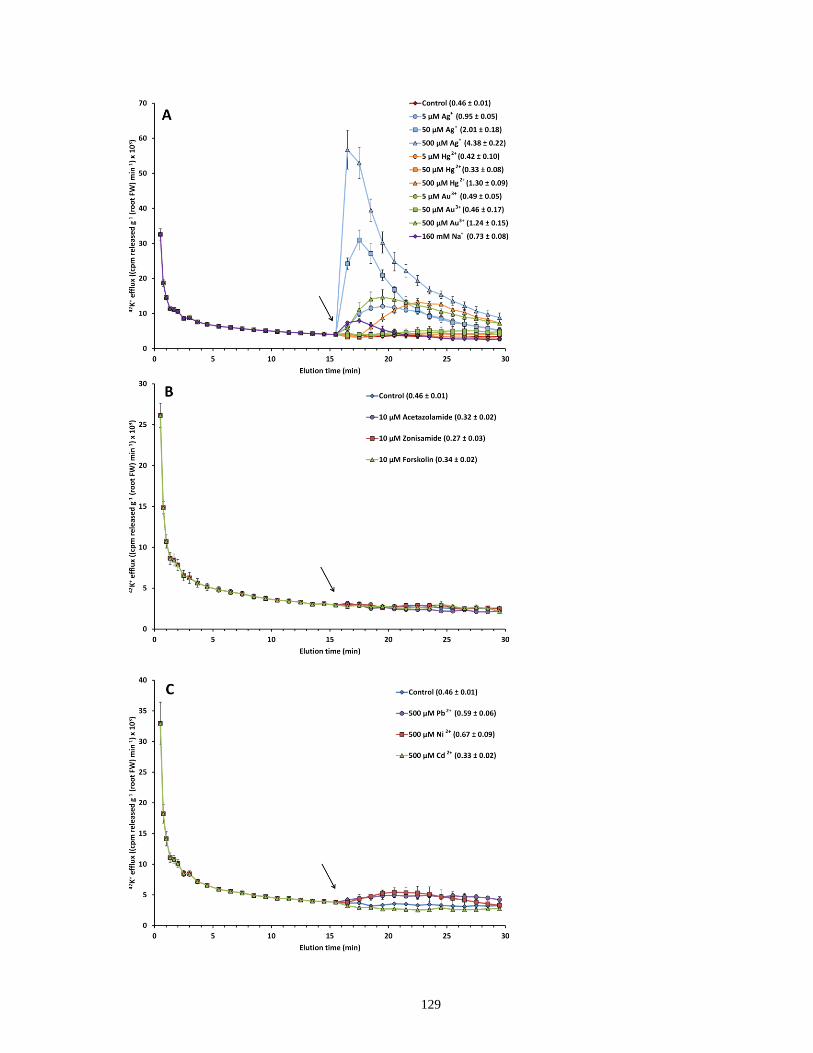
129
130
Figure 29. Response of 42K+ efflux from roots of intact barley (Hordeum vulgare L.) seedlings
to sudden provision (see arrow) of (A) Ag+, Hg2+, and Au3+ (at 5, 50, and 500 µM), and 160 mM
Na+; (B) 10 µM acetazolamide, zonisamide, and forskolin; (C) 500 µM Pb2+, Cd2+, and Ni2+. In
the internal legend, the numbers in parentheses indicate the amount of K+ released during a
specific treatment (t = 16.5–29.5 min), in µmol g-1 (root FW). Each plot represents the mean of
3–8 replicates. Error bars indicate ± SEM.
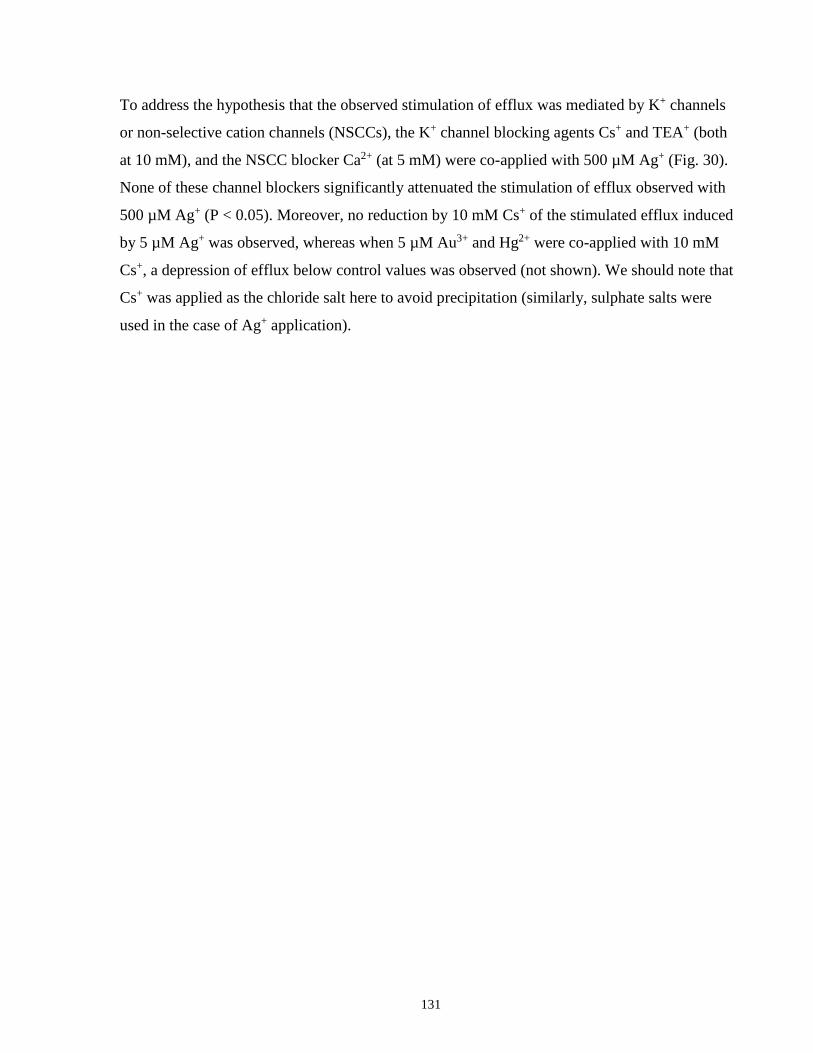
131
To address the hypothesis that the observed stimulation of efflux was mediated by K+ channels
or non-selective cation channels (NSCCs), the K+ channel blocking agents Cs+ and TEA+ (both
at 10 mM), and the NSCC blocker Ca2+ (at 5 mM) were co-applied with 500 µM Ag+ (Fig. 30).
None of these channel blockers significantly attenuated the stimulation of efflux observed with
500 µM Ag+ (P < 0.05). Moreover, no reduction by 10 mM Cs+ of the stimulated efflux induced
by 5 µM Ag+ was observed, whereas when 5 µM Au3+ and Hg2+ were co-applied with 10 mM
Cs+, a depression of efflux below control values was observed (not shown). We should note that
Cs+ was applied as the chloride salt here to avoid precipitation (similarly, sulphate salts were
used in the case of Ag+ application).
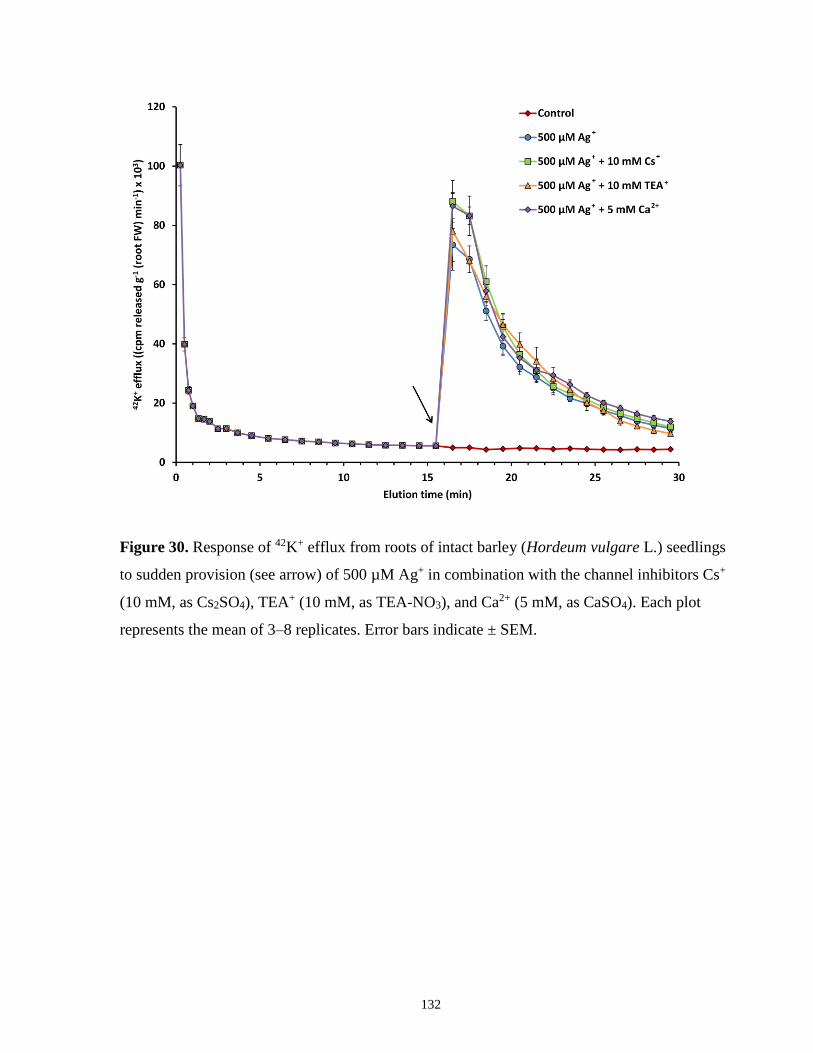
132
Figure 30. Response of 42K+ efflux from roots of intact barley (Hordeum vulgare L.) seedlings
to sudden provision (see arrow) of 500 µM Ag+ in combination with the channel inhibitors Cs+
(10 mM, as Cs2SO4), TEA+ (10 mM, as TEA-NO3), and Ca2+ (5 mM, as CaSO4). Each plot
represents the mean of 3–8 replicates. Error bars indicate ± SEM.
133
To test the alternative hypothesis that the effects of silver, gold, and mercury on ion fluxes are
related to membrane integrity, two independent assays of membrane leakiness were conducted.
Table 10 shows the relative leakage ratio of control and silver-treated roots, as determined by
measuring either electrical conductivity or UV absorbance of the bathing medium, before and
after autoclaving the roots. Both assays showed that a 15-min incubation of intact roots in 500
µM Ag+ significantly increased the relative leakiness of cellular membranes, suggesting that this
treatment caused membrane damage. It should be noted that the measurements were taken after
silver treatment was terminated; that is, after substantial loss of cellular materials had already
occurred. Therefore, these standard protocols underestimated the difference between treatment
and control (Table 10).
Changes in ionic content of roots following silver application were also measured, by
photometric analyses of tissues (Table 10). Root-K+ content decreased by 43% and NH4+ content
decreased by 69% after a 15-min application of 500 µM Ag+, further suggesting that extensive
membrane damage had taken place. When plants exposed to 500 µM Ag+ for 15 min were
returned to normal growth solution for 1 week, root growth cessation and shoot growth
suppression was observed over the following 6 d (not shown), showing that silver brought about
irreversible damage.
For comparison with total K+ loss from tissue, the tracer released following 500 µM Ag+
treatment in 42K+ efflux experiments was summed and expressed in terms of micromoles.
Analysis showed that treated roots lost a minimum of 4.38 µmol K+ g-1 over a 15-min period
(Fig. 31; note that these curves were truncated slightly prematurely; a small set of experiments
was conducted wherein elution was extended for an additional 30 min, resulting in an additional
25% of tracer loss).
Figure 32 directly illustrates the membrane damage brought about by 5 µM and 500 µM Ag+
(Fig. 32B and C, respectively), 500 µM Hg2+ (Fig. 32D), and 500 µM Au3+ (Fig. 32E), by means
of propidium-iodide staining visualized with confocal microscopy. Compared with control (Fig.
32A), where only cell walls were stained, all regions of the root tip showed nuclear staining (and,
by inference, membrane disruption) when intact seedlings were incubated for 15 min with the
AQP inhibitors. In contrast, roots treated for 15 min with the heavy metals Cd2+, Ni2+, and Pb2+
(all at 500 µM) (Fig. 32F–H, respectively) lacked nuclear staining, indicating lack of membrane

134
damage. Root tips treated with 160 mM NaCl for the same duration also showed no nuclear
staining (Fig. 32I).
Pressure chamber measurements were conducted to test the effect of Ag+ and Au3+ on the water
potential of intact seedling roots. Fig. S2 shows that a 15-min treatment with 500 µM Ag+ or
Au3+ significantly impeded water flow in roots of experimental plants.
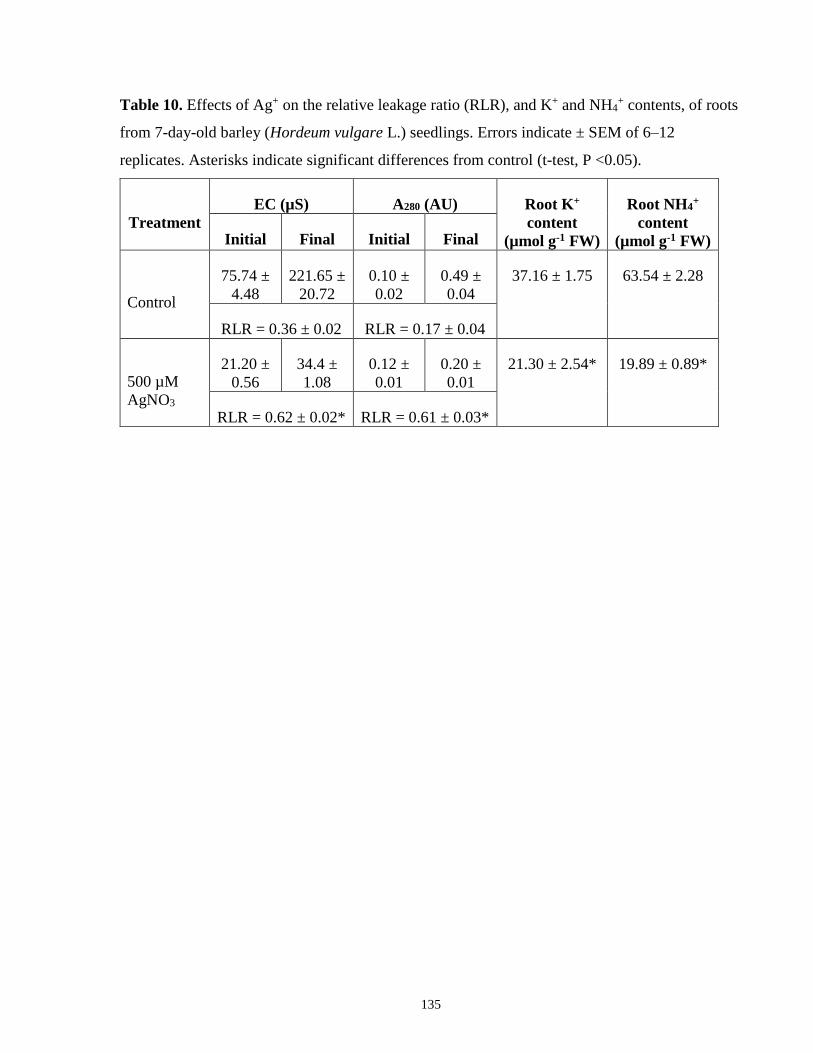
135
Table 10. Effects of Ag+ on the relative leakage ratio (RLR), and K+ and NH4+ contents, of roots
from 7-day-old barley (Hordeum vulgare L.) seedlings. Errors indicate ± SEM of 6–12
replicates. Asterisks indicate significant differences from control (t-test, P <0.05).
Treatment
EC (µS) A280 (AU) Root K+
content
(µmol g-1 FW)
Root NH4+
content
(µmol g-1 FW) Initial Final Initial Final
Control
75.74 ±
4.48
221.65 ±
20.72
0.10 ±
0.02
0.49 ±
0.04
37.16 ± 1.75 63.54 ± 2.28
RLR = 0.36 ± 0.02 RLR = 0.17 ± 0.04
500 µM
AgNO3
21.20 ±
0.56
34.4 ±
1.08
0.12 ±
0.01
0.20 ±
0.01
21.30 ± 2.54* 19.89 ± 0.89*
RLR = 0.62 ± 0.02* RLR = 0.61 ± 0.03*
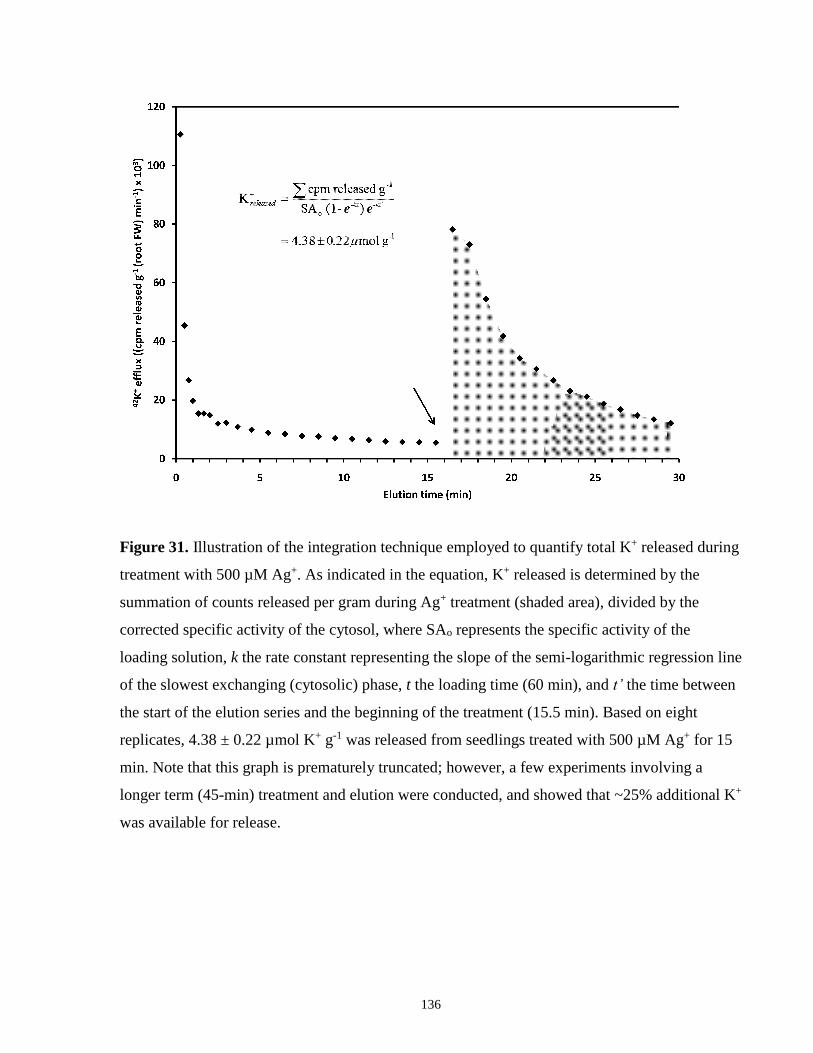
136
Figure 31. Illustration of the integration technique employed to quantify total K+ released during
treatment with 500 µM Ag+. As indicated in the equation, K+ released is determined by the
summation of counts released per gram during Ag+ treatment (shaded area), divided by the
corrected specific activity of the cytosol, where SAo represents the specific activity of the
loading solution, k the rate constant representing the slope of the semi-logarithmic regression line
of the slowest exchanging (cytosolic) phase, t the loading time (60 min), and t’ the time between
the start of the elution series and the beginning of the treatment (15.5 min). Based on eight
replicates, 4.38 ± 0.22 µmol K+ g-1 was released from seedlings treated with 500 µM Ag+ for 15
min. Note that this graph is prematurely truncated; however, a few experiments involving a
longer term (45-min) treatment and elution were conducted, and showed that ~25% additional K+
was available for release.
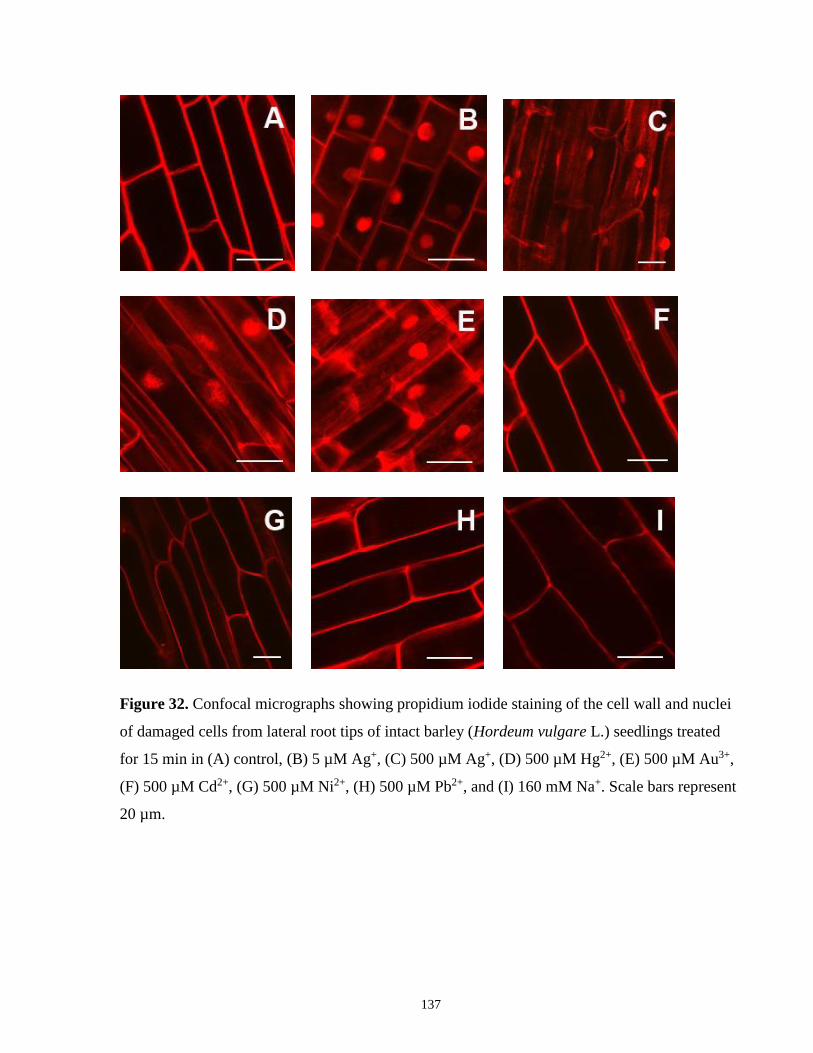
137
Figure 32. Confocal micrographs showing propidium iodide staining of the cell wall and nuclei
of damaged cells from lateral root tips of intact barley (Hordeum vulgare L.) seedlings treated
for 15 min in (A) control, (B) 5 µM Ag+, (C) 500 µM Ag+, (D) 500 µM Hg2+, (E) 500 µM Au3+,
(F) 500 µM Cd2+, (G) 500 µM Ni2+, (H) 500 µM Pb2+, and (I) 160 mM Na+. Scale bars represent
20 µm.
138
5.1.4 Discussion
In 2002, Niemietz and Tyerman demonstrated that silver, gold, and mercury ions reduced
osmotically induced shrinking of human erythrocytes and of vesicles composed of root plasma
membrane of beet or peribacteroid membrane from soybean. Silver was particularly effective in
this regard, followed by gold and then mercury. Because the osmotic shrinking response of cells
and vesicles is directly linked to water permeability, the authors concluded that silver is a potent
AQP inhibitor, much more so than mercury, which has been, and continues to be, widely used as
a blocker in AQP studies (see Table S1). This discovery may help explain why silver is effective
as an antimicrobial agent (Kim et al. 2008) and in the preservation of cut flowers (Beyer 1976;
Lue et al. 2010).
In the present study, it was shown that when Ag+, Au3+, and Hg2+ are applied to roots of intact
barley plants, pronounced effects on transmembrane ion fluxes and membrane integrity occur in
addition to the reduction in water flux. Initially, it was observed that Ag+ stimulated the efflux of
13N-labelled NH3/NH4+ from roots (Fig. 27, inset), but follow-up experiments indicated that the
effect is more general, with Ag+ also increasing efflux of labelled potassium, even at
concentrations as low as 5 µM Ag+ (Fig. 29A). In addition, 500 µM Au3+ and Hg2+ also
stimulated K+ release, but the same metals applied at lower concentrations (5 µM and 50 µM)
showed no effect, in contrast to Ag+ (Fig. 29A). Because the K+ channel blockers TEA+ and Cs+,
and the NSCC blocker Ca2+, failed to reduce the stimulation of K+ efflux by 500 µM Ag+ (Fig.
30), and similar results were seen with 5 µM Ag+ plus Cs+ (not shown), the possibility was ruled
out that this effect is due to increased activity of ion channels in root cell membranes, an
explanation put forward for the NaCl-stimulated efflux of potassium in the work of Shabala et al.
(2006) (see also Iwabuchi et al. 2008; cf. Britto et al. 2010). On the other hand, when 10 mM Cs+
was co-applied with 5 µM Au3+ or Hg2+, an inhibition of efflux was observed (not shown),
similar to what was seen in a previous study, in which 10 mM Cs+ suppressed steady-state K+
efflux in the same cultivar of barley and at the same external [K+] (Coskun et al. 2010). These
observations suggest that membranes are intact, and outward rectifying channels are functional
under these conditions, unlike at high (500 µM) concentrations of Au3+ and Hg2+ and all tested
concentrations of Ag+.
139
In contrast to the present finding, MacRobbie (2006) suggested that one component of stimulated
K+ release from vacuoles of guard cells, as measured by 86Rb+ efflux, is stimulated by the AQP
inhibitors mercury and silver, and mediated by ion channels. However, membrane intactness was
not determined in that study, and the present results may offer an alternative explanation for the
stimulation. It should also be noted that thresholds and degrees of sensitivity to inhibitors do vary
among experimental systems. This is apparent from Table S1, which shows that Ag+, Au3+, and
Hg2+ do not inhibit water flow in all cases. In addition, some studies using the cell pressure probe
have indicated that cellular turgor is maintained in the presence of these metals, which would not
be possible were significant membrane damage to have occurred (Zhang and Tyerman 1999;
Tazawa et al. 2001; Hukin et al. 2002; Bramley et al. 2009).
Based on additional experimentation showing silver-induced losses of electrolytes and UV-
absorbing compounds from barley roots (Table 10), as well as confocal microscopy analysis
showing membrane damage resulting from 500 µM Au3+ and Hg2+, and all tested Ag+
concentrations (Fig. 32B–E), the present study strongly suggests that the stimulation of ion
efflux due to these treatments is a direct result of membrane destruction. The suppression of ion
influx (Figs. 27 and 28) can also be partly explained in this way; cells with a compromised
membrane barrier and high efflux cannot be expected to retain tracer to the same extent as cells
with intact membranes. It is interesting to note that the potency of the 500 µM Ag+ treatment was
so great that co-application of 5 mM Ca2+ failed to protect membranes, as is sometimes observed
with more benign treatments such as NaCl (Cramer et al. 1985; Britto et al. 2010). In contrast,
the inhibition of influx observed under low (5 µM and 50 µM) Au3+ and Hg2+ (Fig. 28) cannot be
explained by accelerated efflux or membrane damage, since no efflux stimulation was seen (Fig.
29A). These observations point toward a direct inhibition of K+ influx pathways brought about
by these lower concentrations of Au3+ and Hg2+, possibly via effects on cellular energetics (e.g.
Martínez-Ballesta et al. 2003). In contrast to the heavy-metal AQP inhibitors, the organic AQP
inhibitors acetazolamide and zonisamide, and the stimulator forskolin, showed no effect on K+
efflux in barley roots (Fig. 29B), suggesting that the stimulatory effects observed are specific to
heavy-metal inhibitors. Further experimentation will need to be conducted to explore these novel
findings. Moreover, the heavy metals used here that did not modify water relations in Niemietz
and Tyerman (2002), namely nickel, cadmium, and lead, also had minimal effects on ion efflux
in barley roots (Fig. 29C), and did not appear to cause membrane damage as determined by
140
confocal microscopy (Fig. 32F–H). Curiously, however, K+ influx was moderately inhibited by
Cd2+ and Pb2+ and strongly inhibited by Ni2+ (Fig. 28); reasons for this are presently unclear, but
may also be related to cellular energetics. The data demonstrate the clear distinction between
heavy metals that block AQPs and those that do not, strongly corroborating the findings of
Niemietz and Tyerman (2002). The data also provide an alternative interpretation of the recent
(and unexplained) observation that silver nitrate (≤10 µM) stimulates the release of indole-3-
acetic acid from roots of Arabidopsis thaliana, independently of its effect on ethylene signalling
(Strader et al. 2009).
As in the study of Niemietz and Tyerman (2002), the effect of Ag+ was the most potent, followed
distantly by Au3+ and Hg+ (Fig. 29A). Indeed, when the dose dependence of Ag+ was
investigated, it was found that a 5-µM application had an effect approximately equal to that seen
at 500 µM Hg2+ and Au3+. This Ag+ concentration was as effective whether applied as AgNO3 or
silver sulphadiazine, a result in contrast to the finding of Niemietz and Tyerman (2002), who
showed a greater effect of silver sulphadiazine on water flow (Fig. S1). Interestingly, the
stimulation of K+ efflux by high provision of NaCl, an effect that has been extensively
investigated by numerous groups (e.g. Nassery 1979; Shabala et al. 2006; Britto et al. 2010), was
less pronounced, and less protracted, than that of any of the heavy-metal AQP inhibitors
examined here. It had previously been proposed (Britto et al. 2010) that NaCl-induced K+ efflux
was also a result of membrane disintegrity, but, in the present study, confocal micrographs of
roots stained with propidium iodide did not reveal such damage (Fig. 32I). This may indicate that
the destructive effect of NaCl on membranes is below the threshold for entry of this large
fluorescent molecule into the cell, a suggestion consistent with the relatively small stimulation of
K+ efflux by NaCl, compared with the heavy-metal AQP inhibitors, despite an orders-of-
magnitude greater applied concentration. Another possibility is that membrane disintegrity when
NaCl is applied may be rapidly reversible through re-annealing of the lipid bilayer, as suggested
by the observation of rapid recovery from an initial wilting response to NaCl (not shown). This
could conceivably occur through the regulated response of AQPs to osmotic shock, a response
not possible in the presence of AQP inhibitors.
It was of further interest to quantify the ionic release from roots treated with silver. Analysis
showed that 500 µM Ag+ application brought about the release of ~5 µmol of K+ per gram of
root (Fig. 29A, internal legend; and Fig. 31). If all the 42K+ released were to have originated in
141
the cytosol of root cells, and if all the cytosolic K+ were released after silver application, this
value would correspond to an approximate cytosolic [K+] of 100 mM, considering that cytosolic
volume is ~5% of tissue volume (Lee and Clarkson 1986), and 1 g of root has a volume of ~1 ml.
This amount is remarkably close to cytosolic [K+] values measured in a large number of studies
(for a review, see Britto and Kronzucker 2008) using techniques as diverse as non-aqueous
fractionation (Speer and Kaiser 1991), longitudinal ion profiling (Jeschke and Stelter 1976), X-
ray microanalysis (Flowers and Hajibagheri 2001), fluorescing dyes (Halperin and Lynch 2003),
ion-selective intracellular microelectrode analysis (Walker et al. 1996a), and compartmental
analysis by tracer efflux (Pitman and Saddler 1967; Kronzucker et al. 2003). Considering that
labelling times in the present study were restricted to 60 min, and that vacuolar half-times of
exchange for K+ are in the order of 12–20 h (Memon et al. 1985), contributions from the vacuole
to the tracer-release spikes should be negligible (Britto and Kronzucker 2001). Nevertheless,
substantial loss from the vacuole is also sustained during a 15-min application of 500 µM silver,
as demonstrated by tissue analysis using flame photometry, which showed that ~40% of total
root K+ is lost (Table 10). Because of these considerations of labelling kinetics and tissue
accumulation, therefore, the loss of cytosolic K+ appears to be essentially complete, while the
majority of vacuolar K+ is retained. Given the importance of K+ as a major plant nutrient, such a
massive loss may be sufficient to explain the cessation of growth in roots treated for 15 min (see
above), and the eventual death of the plant when treated for 1 week (not shown). However, the
concomitant loss of other intracellular components and the major membrane damage incurred by
silver application are additional effects that probably contribute to the lethality of silver ions.
An important fundamental question remains. What causes the observed phenomena? Are the
deleterious effects of heavy-metal AQP inhibitors on potassium homeostasis and root cell
membranes of intact barley plants related purely to their blockage of water flux, or are there
other, unrelated, physiological effects caused by these agents? Certainly, the observed inhibition
of K+ influx by low concentrations of Hg2+ and Au3+ and the concomitant lack of effect on efflux
suggest the latter. Moreover, the lack of effect by the organic AQP modulators acetazolamide,
zonisamide, and forskolin point towards a phenomenon more specific to heavy-metal blockers,
rather than AQP modulators in general. It is interesting to note that the osmotic shrinking assays
conducted by Niemietz and Tyerman (2002) did not appear to involve membrane damage in
vesicles or erythrocytes, nor did Schreurs and Rosenberg (1982) find evidence that silver induces
142
cell damage or reduces cell viability in Escherichia coli cells, even though they observed
stimulated efflux of accumulated phosphate, proline, glutamine, mannitol, and succinate.
Similarly, Asharani et al. (2010) demonstrated that, while silver nanoparticles caused lysis and
deterioration of human erythrocytes, silver ions alone showed no such effect. Moreover, it is well
known that silver nitrate stimulates callus proliferation, shoot regeneration, and somatic
embryogenesis in tissue cultures of many plant species, via its inhibition of ethylene action (Al-
Khayri and Al-Bahrany 2001, and references therein). An open question is whether the elevated
efflux and membrane destruction demonstrated here is linked to the scale and complex
multicellular nature of the intact, transpiring barley plant, as compared with embryonic, single-
celled or subcellular systems, such as callus cultures, E. coli, erythrocytes, or membrane vesicles,
in which transpiration is limited or absent. Certainly, further experimentation is required to
address these issues.
Finally, a note of caution is warranted regarding the use of heavy-metal AQP inhibitors, greatly
extending the caveats of Santoni et al. (2000); see also Strader et al. (2009). The present
investigation into the stimulated efflux observed upon application of heavy-metal AQP inhibitors
stemmed from the examination of an entirely different problem: that of NH3 penetration into
cells via AQPs. Only after the focus was shifted to questions related to membrane transport and
integrity, as well as K+ homeostasis, did the severe side effects become apparent. These include
membrane destruction brought about by high (500 µM) concentrations of Au3+ and Hg2+, and a
wide range (5, 50, and 500 µM) of Ag+ concentrations, rendering the cell incapable of retaining
critical cellular constituents. Moreover, it was demonstrated that low (5 µM and 50 µM)
concentrations of Au3+ and Hg2+ directly inhibit K+ influx, without compromising cellular
integrity. However, inhibition of K+ uptake will have wide-ranging effects on numerous aspects
of plant function (Britto and Kronzucker 2008), and, because K+ is the most abundant cellular
osmoticum, blockage of its uptake may in itself change water gradients in the longer term,
confounding the use of heavy-metal AQP inhibitors in the study of plant water relations. The
present study points to the need for a more discriminating use of inhibitors as a tool for
physiological examination, particularly with heavy-metal AQP inhibitors in planta.
143
Chapter 6 NH3/NH4
+ Transport and Toxicity: Mechanisms and Updates on the Futile-Cycling Hypothesis
Rapid Ammonia Gas Transport Accounts for Futile Transmembrane Cycling Under NH3/NH4
+ Toxicity in Plant Roots
Preface
A modified version of this chapter was published as: Coskun D, Britto DT, Li M, Becker A,
Kronzucker HJ (2013) Rapid ammonia gas transport accounts for futile transmembrane cycling
under NH3/NH4+ toxicity in plant roots. Plant Physiology 163, 1859-1867. Supplementary
material cited in this chapter can be found online:
http://www.plantphysiol.org/content/163/4/1859.
HJ Kronzucker designed the study, with input from DT Britto and D Coskun. D Coskun, M Li,
and A Becker performed the experiments and analyzed the data, with input from DT Britto and
HJ Kronzucker. D Coskun wrote the manuscript, with input and editing from DT Britto and HJ
Kronzucker.
6.1.1 Abstract
Futile transmembrane NH3/NH4+ cycling in plant root cells, characterized by extremely rapid
fluxes and high efflux to influx ratios, has been successfully linked to NH3/NH4+ toxicity.
Surprisingly, the fundamental question of which species of the conjugate pair (NH3 or NH4+)
participates in such fluxes is unresolved. Using flux analyses with the short-lived radioisotope
13N and electrophysiological, respiratory, and histochemical measurements, we show that futile
cycling in roots of barley (Hordeum vulgare) seedlings is predominately of the gaseous NH3
species, rather than the NH4+ ion. Influx of 13NH3/
13NH4+, which exceeded 200 µmol g-1 h-1, was
not commensurate with membrane depolarization or increases in root respiration, suggesting
electroneutral NH3 transport. Influx followed Michaelis-Menten kinetics for NH3 (but not NH4+),
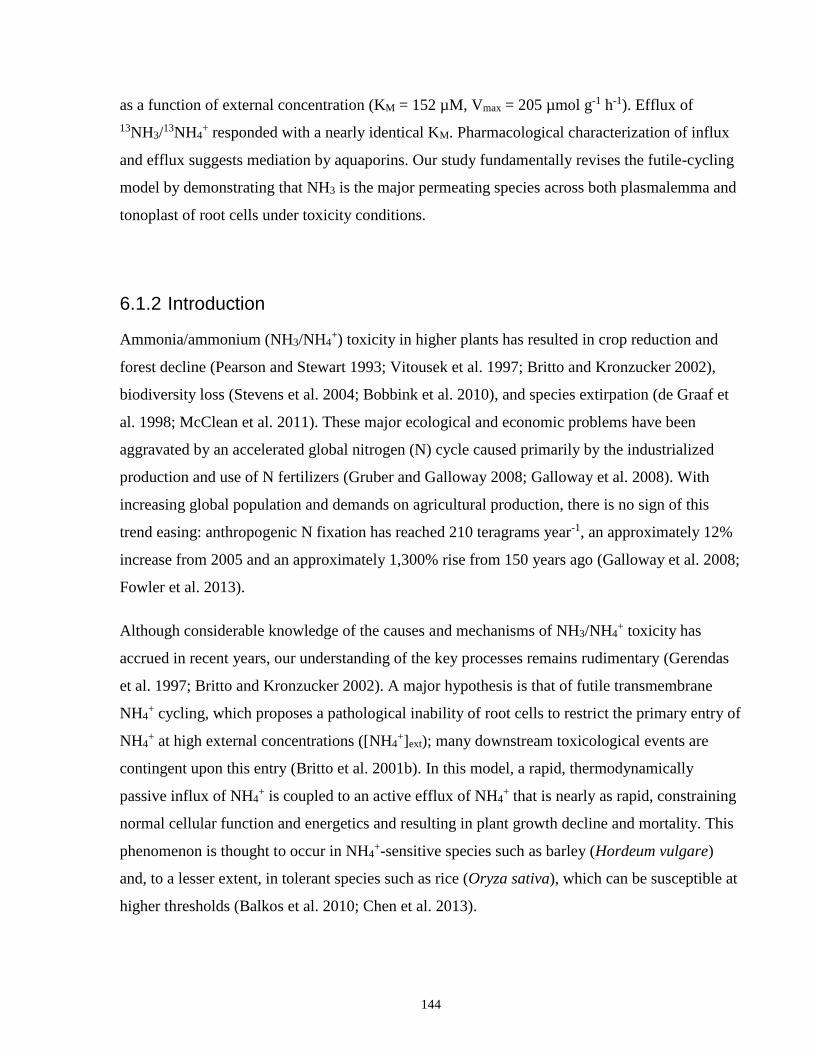
144
as a function of external concentration (KM = 152 µM, Vmax = 205 µmol g-1 h-1). Efflux of
13NH3/13NH4
+ responded with a nearly identical KM. Pharmacological characterization of influx
and efflux suggests mediation by aquaporins. Our study fundamentally revises the futile-cycling
model by demonstrating that NH3 is the major permeating species across both plasmalemma and
tonoplast of root cells under toxicity conditions.
6.1.2 Introduction
Ammonia/ammonium (NH3/NH4+) toxicity in higher plants has resulted in crop reduction and
forest decline (Pearson and Stewart 1993; Vitousek et al. 1997; Britto and Kronzucker 2002),
biodiversity loss (Stevens et al. 2004; Bobbink et al. 2010), and species extirpation (de Graaf et
al. 1998; McClean et al. 2011). These major ecological and economic problems have been
aggravated by an accelerated global nitrogen (N) cycle caused primarily by the industrialized
production and use of N fertilizers (Gruber and Galloway 2008; Galloway et al. 2008). With
increasing global population and demands on agricultural production, there is no sign of this
trend easing: anthropogenic N fixation has reached 210 teragrams year-1, an approximately 12%
increase from 2005 and an approximately 1,300% rise from 150 years ago (Galloway et al. 2008;
Fowler et al. 2013).
Although considerable knowledge of the causes and mechanisms of NH3/NH4+ toxicity has
accrued in recent years, our understanding of the key processes remains rudimentary (Gerendas
et al. 1997; Britto and Kronzucker 2002). A major hypothesis is that of futile transmembrane
NH4+ cycling, which proposes a pathological inability of root cells to restrict the primary entry of
NH4+ at high external concentrations ([NH4
+]ext); many downstream toxicological events are
contingent upon this entry (Britto et al. 2001b). In this model, a rapid, thermodynamically
passive influx of NH4+ is coupled to an active efflux of NH4
+ that is nearly as rapid, constraining
normal cellular function and energetics and resulting in plant growth decline and mortality. This
phenomenon is thought to occur in NH4+-sensitive species such as barley (Hordeum vulgare)
and, to a lesser extent, in tolerant species such as rice (Oryza sativa), which can be susceptible at
higher thresholds (Balkos et al. 2010; Chen et al. 2013).
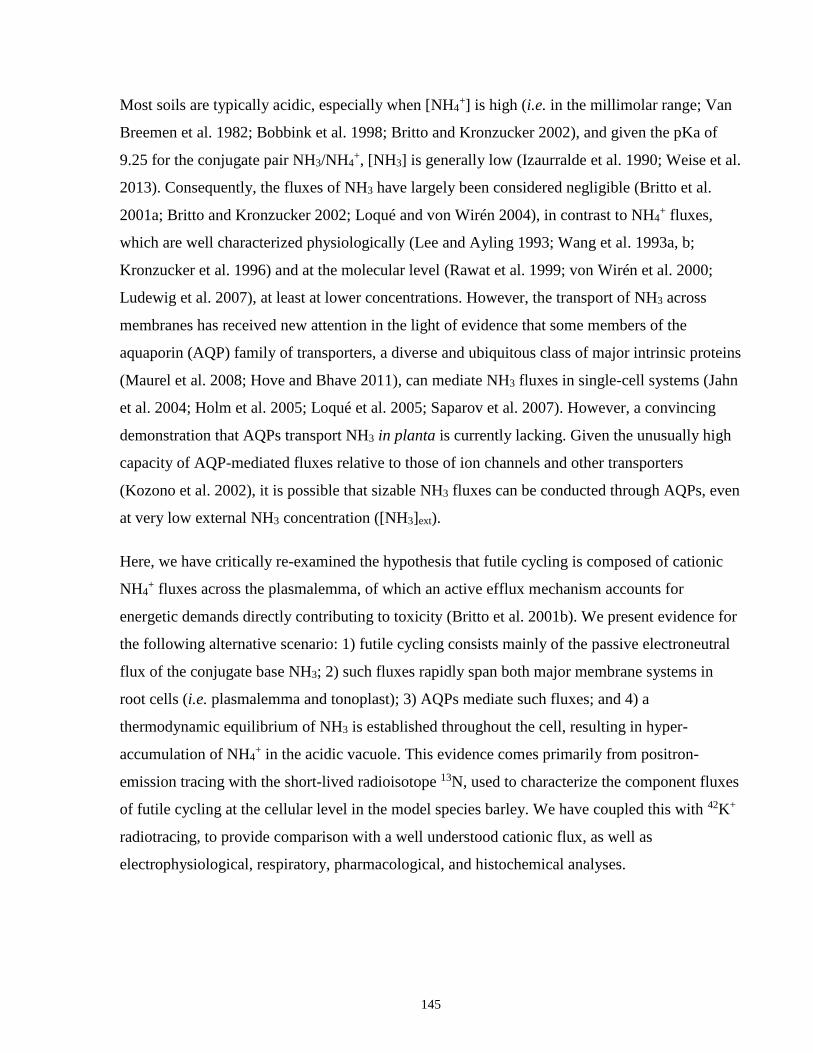
145
Most soils are typically acidic, especially when [NH4+] is high (i.e. in the millimolar range; Van
Breemen et al. 1982; Bobbink et al. 1998; Britto and Kronzucker 2002), and given the pKa of
9.25 for the conjugate pair NH3/NH4+, [NH3] is generally low (Izaurralde et al. 1990; Weise et al.
2013). Consequently, the fluxes of NH3 have largely been considered negligible (Britto et al.
2001a; Britto and Kronzucker 2002; Loqué and von Wirén 2004), in contrast to NH4+ fluxes,
which are well characterized physiologically (Lee and Ayling 1993; Wang et al. 1993a, b;
Kronzucker et al. 1996) and at the molecular level (Rawat et al. 1999; von Wirén et al. 2000;
Ludewig et al. 2007), at least at lower concentrations. However, the transport of NH3 across
membranes has received new attention in the light of evidence that some members of the
aquaporin (AQP) family of transporters, a diverse and ubiquitous class of major intrinsic proteins
(Maurel et al. 2008; Hove and Bhave 2011), can mediate NH3 fluxes in single-cell systems (Jahn
et al. 2004; Holm et al. 2005; Loqué et al. 2005; Saparov et al. 2007). However, a convincing
demonstration that AQPs transport NH3 in planta is currently lacking. Given the unusually high
capacity of AQP-mediated fluxes relative to those of ion channels and other transporters
(Kozono et al. 2002), it is possible that sizable NH3 fluxes can be conducted through AQPs, even
at very low external NH3 concentration ([NH3]ext).
Here, we have critically re-examined the hypothesis that futile cycling is composed of cationic
NH4+ fluxes across the plasmalemma, of which an active efflux mechanism accounts for
energetic demands directly contributing to toxicity (Britto et al. 2001b). We present evidence for
the following alternative scenario: 1) futile cycling consists mainly of the passive electroneutral
flux of the conjugate base NH3; 2) such fluxes rapidly span both major membrane systems in
root cells (i.e. plasmalemma and tonoplast); 3) AQPs mediate such fluxes; and 4) a
thermodynamic equilibrium of NH3 is established throughout the cell, resulting in hyper-
accumulation of NH4+ in the acidic vacuole. This evidence comes primarily from positron-
emission tracing with the short-lived radioisotope 13N, used to characterize the component fluxes
of futile cycling at the cellular level in the model species barley. We have coupled this with 42K+
radiotracing, to provide comparison with a well understood cationic flux, as well as
electrophysiological, respiratory, pharmacological, and histochemical analyses.
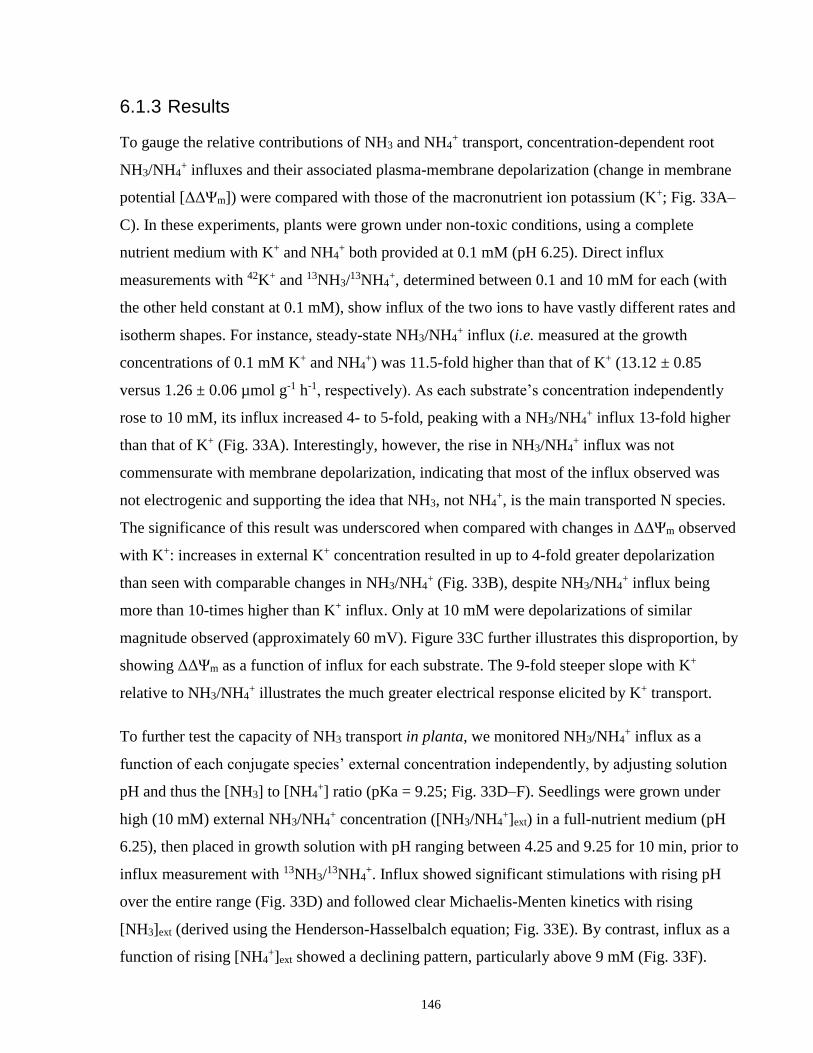
146
6.1.3 Results
To gauge the relative contributions of NH3 and NH4+ transport, concentration-dependent root
NH3/NH4+ influxes and their associated plasma-membrane depolarization (change in membrane
potential [ΔΔΨm]) were compared with those of the macronutrient ion potassium (K+; Fig. 33A–
C). In these experiments, plants were grown under non-toxic conditions, using a complete
nutrient medium with K+ and NH4+ both provided at 0.1 mM (pH 6.25). Direct influx
measurements with 42K+ and 13NH3/13NH4
+, determined between 0.1 and 10 mM for each (with
the other held constant at 0.1 mM), show influx of the two ions to have vastly different rates and
isotherm shapes. For instance, steady-state NH3/NH4+ influx (i.e. measured at the growth
concentrations of 0.1 mM K+ and NH4+) was 11.5-fold higher than that of K+ (13.12 ± 0.85
versus 1.26 ± 0.06 µmol g-1 h-1, respectively). As each substrate’s concentration independently
rose to 10 mM, its influx increased 4- to 5-fold, peaking with a NH3/NH4+ influx 13-fold higher
than that of K+ (Fig. 33A). Interestingly, however, the rise in NH3/NH4+ influx was not
commensurate with membrane depolarization, indicating that most of the influx observed was
not electrogenic and supporting the idea that NH3, not NH4+, is the main transported N species.
The significance of this result was underscored when compared with changes in ΔΔΨm observed
with K+: increases in external K+ concentration resulted in up to 4-fold greater depolarization
than seen with comparable changes in NH3/NH4+ (Fig. 33B), despite NH3/NH4
+ influx being
more than 10-times higher than K+ influx. Only at 10 mM were depolarizations of similar
magnitude observed (approximately 60 mV). Figure 33C further illustrates this disproportion, by
showing ΔΔΨm as a function of influx for each substrate. The 9-fold steeper slope with K+
relative to NH3/NH4+ illustrates the much greater electrical response elicited by K+ transport.
To further test the capacity of NH3 transport in planta, we monitored NH3/NH4+ influx as a
function of each conjugate species’ external concentration independently, by adjusting solution
pH and thus the [NH3] to [NH4+] ratio (pKa = 9.25; Fig. 33D–F). Seedlings were grown under
high (10 mM) external NH3/NH4+ concentration ([NH3/NH4
+]ext) in a full-nutrient medium (pH
6.25), then placed in growth solution with pH ranging between 4.25 and 9.25 for 10 min, prior to
influx measurement with 13NH3/13NH4
+. Influx showed significant stimulations with rising pH
over the entire range (Fig. 33D) and followed clear Michaelis-Menten kinetics with rising
[NH3]ext (derived using the Henderson-Hasselbalch equation; Fig. 33E). By contrast, influx as a
function of rising [NH4+]ext showed a declining pattern, particularly above 9 mM (Fig. 33F).
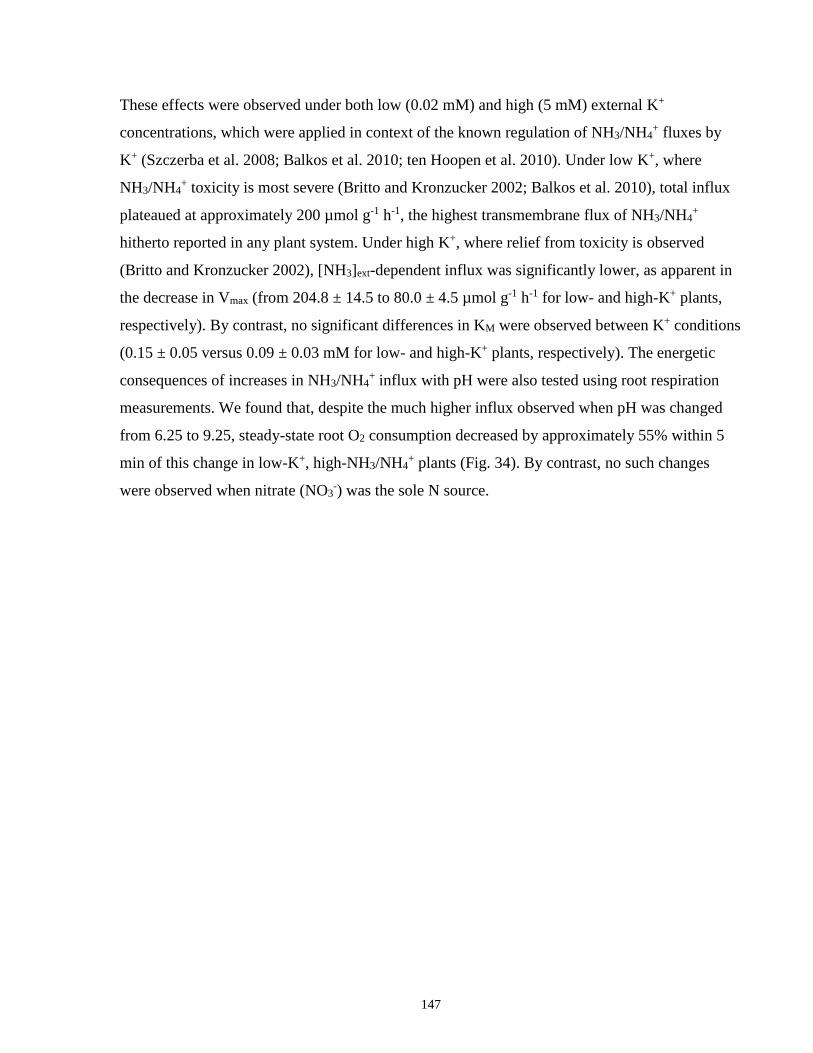
147
These effects were observed under both low (0.02 mM) and high (5 mM) external K+
concentrations, which were applied in context of the known regulation of NH3/NH4+ fluxes by
K+ (Szczerba et al. 2008; Balkos et al. 2010; ten Hoopen et al. 2010). Under low K+, where
NH3/NH4+ toxicity is most severe (Britto and Kronzucker 2002; Balkos et al. 2010), total influx
plateaued at approximately 200 µmol g-1 h-1, the highest transmembrane flux of NH3/NH4+
hitherto reported in any plant system. Under high K+, where relief from toxicity is observed
(Britto and Kronzucker 2002), [NH3]ext-dependent influx was significantly lower, as apparent in
the decrease in Vmax (from 204.8 ± 14.5 to 80.0 ± 4.5 µmol g-1 h-1 for low- and high-K+ plants,
respectively). By contrast, no significant differences in KM were observed between K+ conditions
(0.15 ± 0.05 versus 0.09 ± 0.03 mM for low- and high-K+ plants, respectively). The energetic
consequences of increases in NH3/NH4+ influx with pH were also tested using root respiration
measurements. We found that, despite the much higher influx observed when pH was changed
from 6.25 to 9.25, steady-state root O2 consumption decreased by approximately 55% within 5
min of this change in low-K+, high-NH3/NH4+ plants (Fig. 34). By contrast, no such changes
were observed when nitrate (NO3-) was the sole N source.
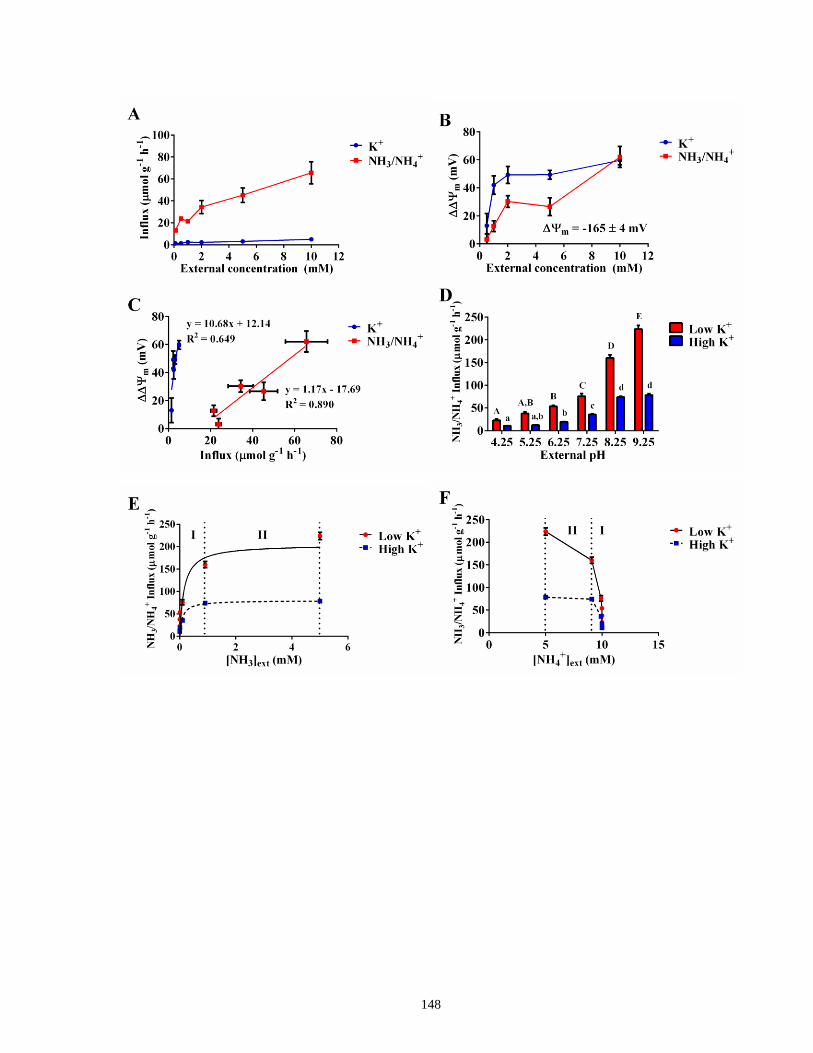
148
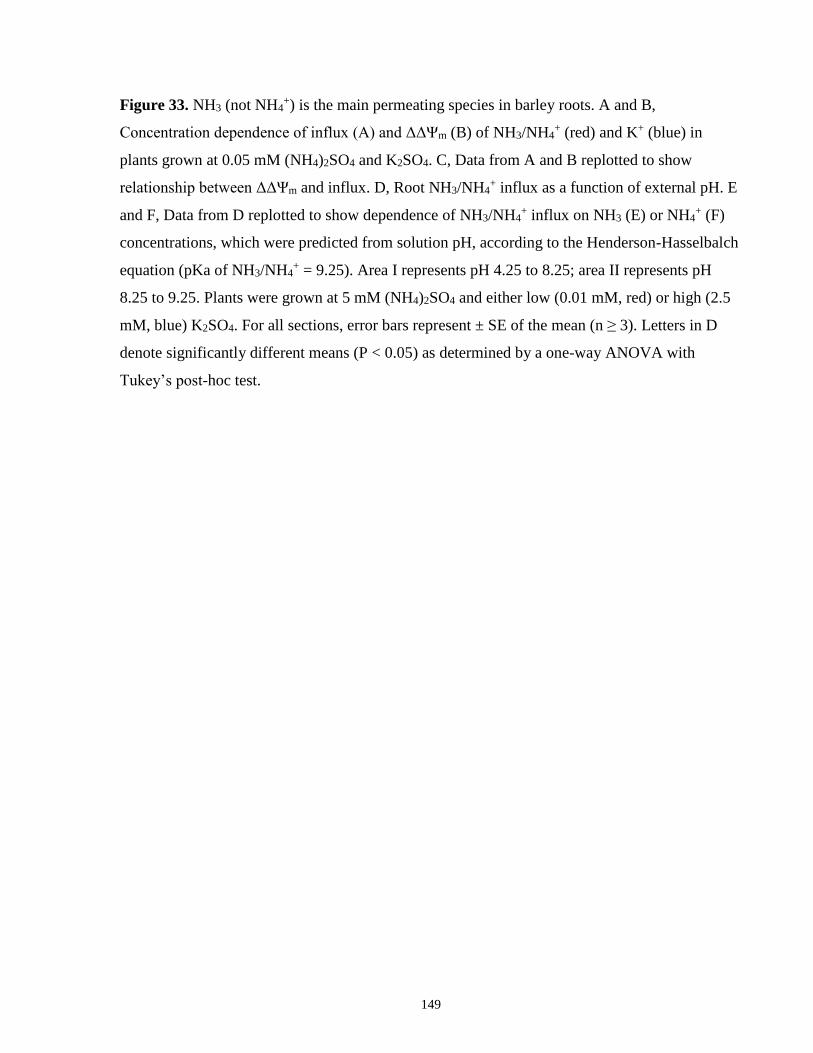
149
Figure 33. NH3 (not NH4+) is the main permeating species in barley roots. A and B,
Concentration dependence of influx (A) and ΔΔΨm (B) of NH3/NH4+ (red) and K+ (blue) in
plants grown at 0.05 mM (NH4)2SO4 and K2SO4. C, Data from A and B replotted to show
relationship between ΔΔΨm and influx. D, Root NH3/NH4+ influx as a function of external pH. E
and F, Data from D replotted to show dependence of NH3/NH4+ influx on NH3 (E) or NH4
+ (F)
concentrations, which were predicted from solution pH, according to the Henderson-Hasselbalch
equation (pKa of NH3/NH4+ = 9.25). Area I represents pH 4.25 to 8.25; area II represents pH
8.25 to 9.25. Plants were grown at 5 mM (NH4)2SO4 and either low (0.01 mM, red) or high (2.5
mM, blue) K2SO4. For all sections, error bars represent ± SE of the mean (n ≥ 3). Letters in D
denote significantly different means (P < 0.05) as determined by a one-way ANOVA with
Tukey’s post-hoc test.
150
Figure 34. Effect of 5-min exposure to elevated pH (pH 9.25) on root respiration in barley plants
grown with 0.01 mM K2SO4 and 5 mM of either (NH4)2SO4 or Ca(NO3)2. Red bar represents O2
consumption, predicted if NH3/NH4+ influx at pH 9.25 is comprised entirely of cationic NH4
+
fluxes (see Fig. 33F). Letters denote significantly different means (P < 0.05) as determined by
one-way ANOVA with Tukey’s post-hoc test.
151
As with influx, efflux of 13NH3/13NH4
+ from pre-labeled roots was strongly stimulated by
alkaline solution pH (and thus, higher external [NH3] to [NH4+] ratios; Fig. S1A). In plants
grown on high NH3/NH4+ and low K+, sudden (at 8 min; Fig. S1A, see arrow) upward shifts in
external pH immediately and significantly stimulated 13NH3/13NH4
+ efflux, with greater
stimulations observed at higher pH values. When tracer release was plotted as a function of the
concomitant NH3/NH4+ influx (measured at the identical pH shift), we observed a strong linear
relationship between efflux and influx (Fig. S1B). Moreover, tracer release as a function of
[NH3]ext (which we suggest may be equivalent to cytosolic [NH3]; see below) resulted in
Michaelis-Menten kinetics similar to those seen with influx, having KM values ranging from 0.10
to 0.36 mM [NH3] (Fig. S1B, inset).
We sought to further characterize 13NH3/13NH4
+ efflux in intact roots under toxicity conditions
(low K+, high NH3/NH4+) to identify the compartmental origin of tracer release (Britto and
Kronzucker 2003; Coskun et al. 2010). In roots pre-labeled with tracer, 13NH3/13NH4
+ efflux was
immediately suppressed by sudden (at 8 min; Fig. 35A, see arrow) exposure to 4 °C or upon
withdrawal of external NH3/NH4+, while an external pH shift to 9.25 (from 6.25) resulted in an
immediate and sizable efflux stimulation. Importantly, these findings demonstrate that efflux
analysis under toxic conditions captures physiological (i.e. transmembrane) events, not artifacts
of apoplastic exchange (Coskun et al. 2010, 2013). Thus, compartmental analysis by tracer efflux
could be applied (Lee and Clarkson 1986; Kronzucker et al. 1997; Britto and Kronzucker 2003),
revealing efflux to influx ratios of approximately 80% and extremely rapid rates of both
unidirectional fluxes characteristic of futile cycling (Britto et al. 2001b).
Further evidence for the intracellular origin of effluxed tracer was seen in a silver (Ag+)-induced
stimulation of 13NH3/13NH4
+ release (Fig. 35B). We have previously shown that sudden exposure
to Ag+ causes extensive damage to both major membrane systems (plasmalemma and tonoplast)
in barley roots (Coskun et al. 2012). By contrast, we observed no effect of mercury (Hg2+)
application on tracer release (Fig. 35C), suggesting a lack of membrane disintegrity occurring.
Importantly, this qualifies the use of Hg2+ as a potential inhibitor of AQPs (see below). With
respect to the Ag+-induced stimulation in tracer efflux, this effect allowed for quantification of
released substrate (in terms of µmol g-1 root fresh weight) via integration of the 13N loss and
estimated intracellular specific activity, as shown previously (Coskun et al. 2012; see Chapter 5).
The chemical quantity of NH3/NH4+ released during Ag+ application (64 ± 3 µmol g-1) was very
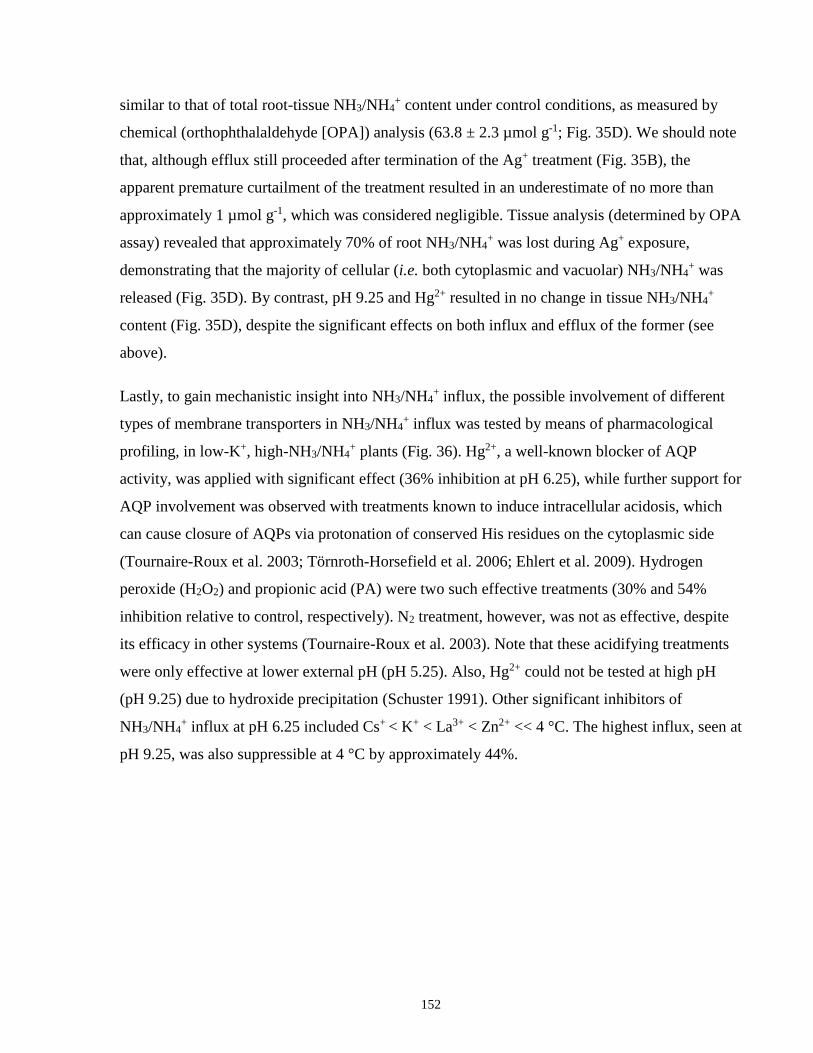
152
similar to that of total root-tissue NH3/NH4+ content under control conditions, as measured by
chemical (orthophthalaldehyde [OPA]) analysis (63.8 ± 2.3 µmol g-1; Fig. 35D). We should note
that, although efflux still proceeded after termination of the Ag+ treatment (Fig. 35B), the
apparent premature curtailment of the treatment resulted in an underestimate of no more than
approximately 1 µmol g-1, which was considered negligible. Tissue analysis (determined by OPA
assay) revealed that approximately 70% of root NH3/NH4+ was lost during Ag+ exposure,
demonstrating that the majority of cellular (i.e. both cytoplasmic and vacuolar) NH3/NH4+ was
released (Fig. 35D). By contrast, pH 9.25 and Hg2+ resulted in no change in tissue NH3/NH4+
content (Fig. 35D), despite the significant effects on both influx and efflux of the former (see
above).
Lastly, to gain mechanistic insight into NH3/NH4+ influx, the possible involvement of different
types of membrane transporters in NH3/NH4+ influx was tested by means of pharmacological
profiling, in low-K+, high-NH3/NH4+ plants (Fig. 36). Hg2+, a well-known blocker of AQP
activity, was applied with significant effect (36% inhibition at pH 6.25), while further support for
AQP involvement was observed with treatments known to induce intracellular acidosis, which
can cause closure of AQPs via protonation of conserved His residues on the cytoplasmic side
(Tournaire-Roux et al. 2003; Törnroth-Horsefield et al. 2006; Ehlert et al. 2009). Hydrogen
peroxide (H2O2) and propionic acid (PA) were two such effective treatments (30% and 54%
inhibition relative to control, respectively). N2 treatment, however, was not as effective, despite
its efficacy in other systems (Tournaire-Roux et al. 2003). Note that these acidifying treatments
were only effective at lower external pH (pH 5.25). Also, Hg2+ could not be tested at high pH
(pH 9.25) due to hydroxide precipitation (Schuster 1991). Other significant inhibitors of
NH3/NH4+ influx at pH 6.25 included Cs+ < K+ < La3+ < Zn2+ << 4 °C. The highest influx, seen at
pH 9.25, was also suppressible at 4 °C by approximately 44%.
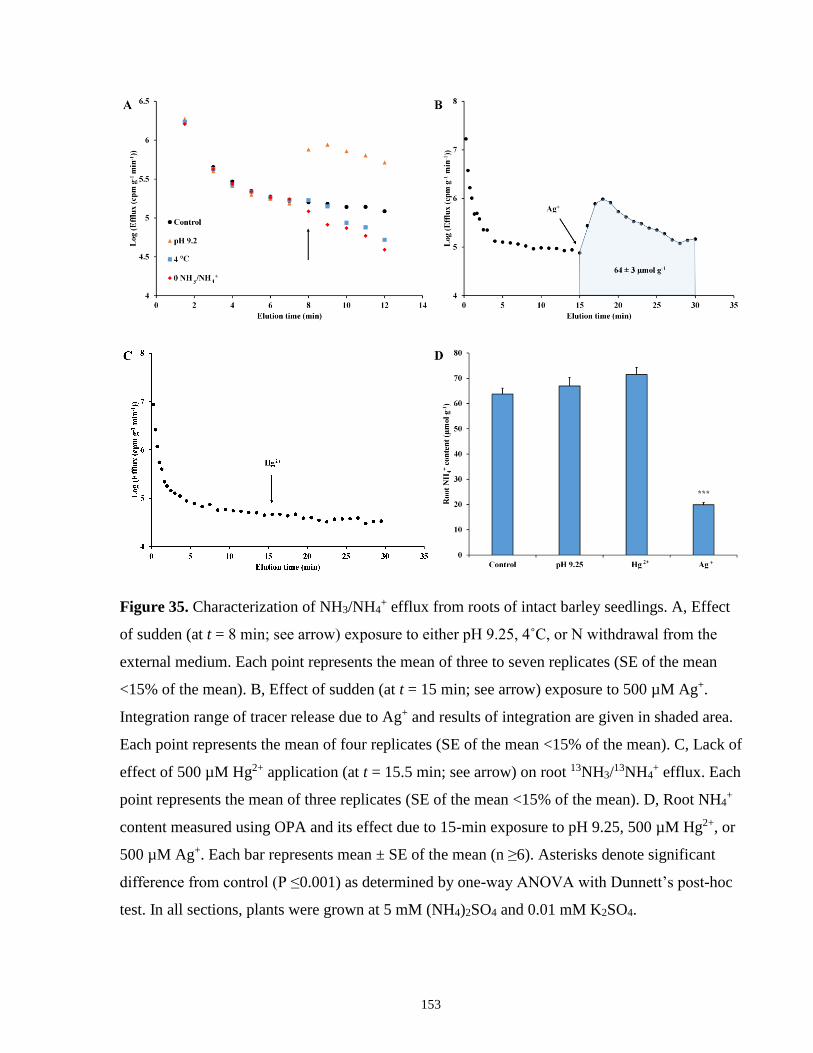
153
Figure 35. Characterization of NH3/NH4+ efflux from roots of intact barley seedlings. A, Effect
of sudden (at t = 8 min; see arrow) exposure to either pH 9.25, 4˚C, or N withdrawal from the
external medium. Each point represents the mean of three to seven replicates (SE of the mean
<15% of the mean). B, Effect of sudden (at t = 15 min; see arrow) exposure to 500 µM Ag+.
Integration range of tracer release due to Ag+ and results of integration are given in shaded area.
Each point represents the mean of four replicates (SE of the mean <15% of the mean). C, Lack of
effect of 500 µM Hg2+ application (at t = 15.5 min; see arrow) on root 13NH3/13NH4
+ efflux. Each
point represents the mean of three replicates (SE of the mean <15% of the mean). D, Root NH4+
content measured using OPA and its effect due to 15-min exposure to pH 9.25, 500 µM Hg2+, or
500 µM Ag+. Each bar represents mean ± SE of the mean (n ≥6). Asterisks denote significant
difference from control (P ≤0.001) as determined by one-way ANOVA with Dunnett’s post-hoc
test. In all sections, plants were grown at 5 mM (NH4)2SO4 and 0.01 mM K2SO4.
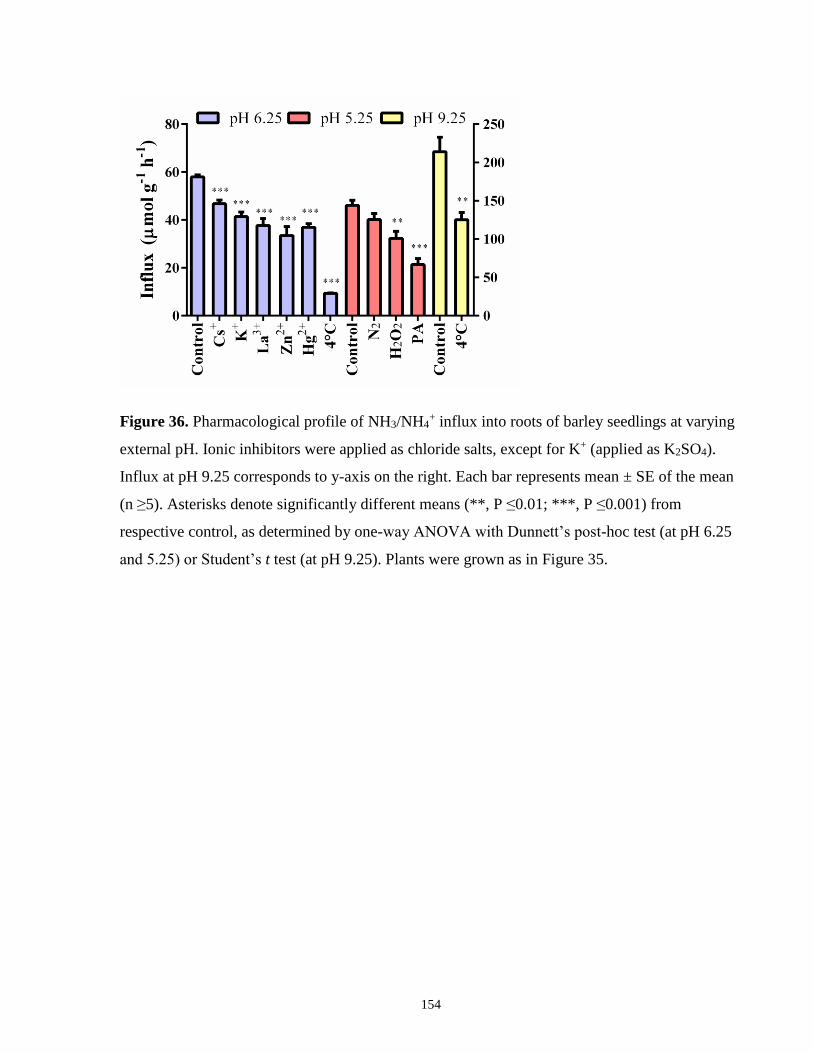
154
Figure 36. Pharmacological profile of NH3/NH4+ influx into roots of barley seedlings at varying
external pH. Ionic inhibitors were applied as chloride salts, except for K+ (applied as K2SO4).
Influx at pH 9.25 corresponds to y-axis on the right. Each bar represents mean ± SE of the mean
(n ≥5). Asterisks denote significantly different means (**, P ≤0.01; ***, P ≤0.001) from
respective control, as determined by one-way ANOVA with Dunnett’s post-hoc test (at pH 6.25
and 5.25) or Student’s t test (at pH 9.25). Plants were grown as in Figure 35.
155
6.1.4 Discussion
This study critically reexamines the nature of futile transmembrane NH3/NH4+ cycling in barley
roots, a phenomenon with ties to NH4+ toxicity in a wide range of higher plants (Feng et al. 1994;
Britto et al. 2001b; Britto and Kronzucker 2002; Chen et al. 2013). We have addressed the
fundamental question of which species of the conjugate pair (NH3 or NH4+) is transported in the
futile cycle to thus enable insight into mechanisms of transport, compartmentation, and toxicity
of NH3/NH4+.
The lack of agreement between ΔΔΨm and changes in NH3/NH4+ influx, in contrast to K+,
suggests that, above a small baseline cationic NH4+ flux no higher than that of K+ (<5 µmol g-1
h-1; Fig. 33A), electroneutral NH3 transport accounts for the observed rapid rates of 13N transport
in intact barley roots (Fig. 33A–C). While previous tracer studies have also demonstrated that
NH3/NH4+ fluxes exceed those of K+ at equimolar concentrations (Scherer et al. 1984; Vale et al.
1988b; Wang et al. 1996), none have provided parallel membrane potential measurements. A
comparison between fluxes and ΔΔΨm, however, is of great utility in gauging the relative
apportionment of NH3 and NH4+ fluxes, as we show here.
Because such rapid NH3 fluxes in planta are simply without precedent, additional investigation
was called for. Further evidence in support of NH3 uptake was seen in the Michaelis-Menten
character of the [NH3]ext-dependent influx isotherms (Fig. 33E). By contrast, NH4+ influx was
seen to decline with rising [NH4+]ext (Fig. 33F), ruling out a sizeable contribution from that N
species. We should note, however, that because these isotherms were obtained using changes in
external pH, there may be pH-specific and/or NH4+-specific effects on transport. Such effects
require examination, although they are inherently difficult to ascertain because pH and [NH3] to
[NH4+] ratios are inextricably linked. It should also be noted that in a study on rice, Wang et al.
(1993b) observed a decline in 13NH3/13NH4
+ influx with rising pH at 10 mM [NH3/NH4+]ext.
However, the fluxes in their study were much lower than in this study and also were determined
in an NH4+-tolerant species. Further investigation is necessary to determine whether this is a part
of the strategy by which a plant may achieve tolerance to this N source.
We also provide evidence for NH3 (but not NH4+) efflux under toxic (low-K+, high-NH3/NH4
+)
conditions. Firstly, the trans-inhibition and -stimulation of efflux in response to changes in NH3
provision (by substrate withdrawal and pH 9.2, respectively; Fig. 35A) suggests that NH3 efflux
156
is highly dependent on NH3 influx (see also the linear dependence of the fluxes; Fig. S1B),
which is consistent with observations that efflux to influx ratios increase with rising influx
(Wang et al. 1993a; Britto et al. 2002; Britto and Kronzucker 2006). Such trans-inhibition and
-stimulation of efflux have previously been shown in barley (Britto and Kronzucker 2003) and in
the mammalian literature, specifically for amino acids (White and Christensen 1982; Sweiry et
al. 1991). In the latter case, trans-stimulation of efflux has been attributed to a large counterflow
through a single transporter mediating bidirectional fluxes and, as such, could in large part
explain the futile NH3 cycling in this paper. Further evidence that the 13N efflux trace represents
13NH3 and not 13NH4+ is found in its saturating response to [NH3]ext (Fig. S1B, inset), which
resembles that of influx (Fig. 33E). KM values for efflux, which were comparable to those for
influx (ranging between 0.10– 0.36 mM NH3), suggests a similar, if not identical, mechanism of
NH3 transport for the two fluxes. It is not clear why the efflux step should respond so readily to
changes in external NH3, when substrate binding to an efflux transporter must take place
intracellularly. Intriguingly, it may be that NH3 transport responds to [NH3]ext in a manner that
leads to a rapid equalization between NH3 pools on either side of the plasma membrane, and thus
NH3 efflux kinetics are in fact directly responding to cytosolic [NH3] and only indirectly to
[NH3]ext. NH3 may shuttle rapidly among multiple cellular compartments, establishing similar
equilibrium concentrations in each, where membrane permeabilities permit (see below).
The Michaelis-Menten analyses under low-K+, high-NH3/NH4+ conditions (see above; Fig. 33E)
revealed a Vmax of about 200 µmol g-1 h-1 for NH3 influx, the highest bona-fide transmembrane
flux hitherto reported in any plant system. Such rapid fluxes are orders-of-magnitude higher than
typical fluxes of mineral (ionic) nutrients (Britto and Kronzucker 2006). Although fluxes of
sodium (Na+) under toxic (saline) conditions have been reported to reach or exceed such values
(Lazof and Cheeseman 1986; Essah et al. 2003; Malagoli et al. 2008), the validity of these fluxes
have recently come into question, particularly with respect to their unrealistic energetic
requirements (Britto and Kronzucker 2009; Kronzucker and Britto 2011); moreover, such fluxes
are generally reported at much higher external substrate concentrations (typically, 100 mM or
higher). On the other hand, such energetic limitations do not apply to the passive electroneutral
fluxes of NH3. In fact, root O2 consumption was found to decline under such conditions (i.e. pH
9.25; Fig. 34), a result that further discounts NH4+-specific futile cycling, which is predicted to
involve a thermodynamically active efflux (Britto et al. 2001b). Figure 34 highlights, in red, the
157
theoretical increase in O2 consumption necessary to power an active efflux mechanism of NH4+
when fluxes are as high as 200 µmol g-1 h-1 based on current models of ion transport and O2
consumption (Poorter et al. 1991; Kurimoto et al. 2004; Britto and Kronzucker 2009). This large
energy deficit is consistent with the idea that futile cycling is primarily of the conjugate base,
NH3. However, unlike with the previously proposed NH4+ cycling, the term futile here does not
refer to an energy-dissipating process (e.g. Amthor 2000), but more generally to the lack of
apparent functional utility in the NH3 cycle. The fact that the pH shift did not affect root O2
consumption in NO3--grown plants shows an N-source specificity of this effect that will require
further investigation to explain.
These results have important consequences for the compartmentation and toxicity of NH3/NH4+.
Compartmental analyses with 13NH3/13NH4
+ in roots and shoots of plants grown under toxic
(high-NH3/NH4+) conditions generally yield extremely high “pool sizes” of many hundred
millimolar (Britto et al. 2001b, 2002), leading to the speculation that the entire cell, not simply
the cytosol, acts as a single compartment of tracer origin (Britto and Kronzucker 2003; Balkos et
al. 2010). This study provides the first evidence in support of this “whole-cell” hypothesis.
Because a high-capacity, thermodynamically passive NH3 transport can account for futile
cycling, it is feasible that NH3 rapidly equilibrates across intracellular membranes and among
cellular compartments, particularly the vacuole and cytosol (Fig. 37). How such rapid
unidirectional fluxes can persist given the apparent lack of an NH3 concentration gradient across
cellular compartments is an interesting question and can be most simply explained by passive
diffusion through high-capacity membrane channels such as AQPs (see below). The NH3
equilibration across cellular compartments can explain why tracer accumulation (measured as
counts retained in tissue or released with Ag+ application; Fig. 35B) closely agreed with that of
chemical (OPA) analyses measuring tissue NH3/NH4+ content (Fig. 35D). Thus, the NH4
+
content within each compartment may be ultimately determined by NH3 permeation and
compartmental pH, as illustrated in Figure 37. In this revised model of futile cellular N cycling,
the 0.5 to 1.5 mM range of cytosolic [NH4+] agrees well with measured values from studies using
methods such as ion-selective microelectrodes and NMR (Lee and Ratcliffe 1991; Wells and
Miller 2000). Importantly, the model reveals that a hyperaccumulation of NH4+ in the vacuole
would ultimately exist (Fig. 37), due to vacuolar acid trapping, and could explain the frequently
observed suppressions in cationic nutrients, notably K+ (but also Ca2+ and Mg2+; Barker et al.
158
1967; Van Beusichem et al. 1988; Lang and Kaiser 1994; Kronzucker et al. 2003), which may
ultimately be the major cause of NH3/NH4+ toxicity in higher plants.
It is likely that the rapid NH3 cycling reported here is mediated by AQPs (Fig. 36), which have
high transport capacity and are known to conduct NH3 fluxes (Jahn et al. 2004; Holm et al. 2005;
Loqué et al. 2005; Saparov et al. 2007; Hove and Bhave 2011). Kozono et al. (2002) estimated
the rate of water transport through AQP1 to be 3 x 10⁹ molecules per subunit per second, roughly
30-fold higher than K+ transport via the potassium crystallographically-sited activation (KcsA)
channel, which is among the fastest ion channels (Morais-Cabral et al. 2001). AQP involvement
is suggested by the pharmacological profiling of NH3 influx in our study, particularly in the
effect of Hg2+, a classic AQP inhibitor (Fig. 36). Importantly, unlike with Ag+ (Fig. 35B), Hg2+
showed no sign of causing membrane damage in our system (as manifest in lack of efflux
stimulation or tissue content losses; Fig. 35C and D; compare with Coskun et al. 2012; Chapter
5). The strong suppressions of influx by H2O2 and PA also support AQP involvement (Fig. 36;
Tournaire-Roux et al. 2003; Törnroth-Horsefield et al. 2006; Ehlert et al. 2009). It is worth
highlighting here, however, that pharmacological profiling, like any method, is not without its
caveats. The lack of specificity of several blockers/chemical treatments (Coskun et al. 2013c), as
well as the need to employ relatively high concentrations at times, can potentially have
secondary effects. This by no means invalidates the use of pharmacology, but highlights the
importance of a diversity of experimental approaches. Future experiments with AQP antisense/
knockout lines (Martre et al. 2002; Javot et al. 2003), particularly for AQPs already shown to
mediate NH3 fluxes (Jahn et al. 2004; Holm et al. 2005; Loqué et al. 2005), could help further
elucidate their involvement in futile NH3 cycling. In addition, such mutant analyses could
provide a critical test of the “whole-cell distribution” hypothesis for NH3 presented above (Fig.
37).
We end by highlighting the suppression of Vmax for NH3 influx by high-plant K+ status, while KM
remains unaffected (Fig. 33E). It appears that K+ status has no effect on the substrate affinity of
NH3 transporters but regulates NH3 influx by other means. One such mechanism might involve
the modulation of AQP activity, which may well be expected, because, in plants, K+ acquisition
is the chief means of establishing osmotic balance and cell turgor (Britto and Kronzucker 2008;
Grzebisz et al. 2013). The effects of K+ in the short-term suppression of NH3/NH4+ influx and
efflux (Szczerba et al. 2008; Balkos et al. 2010; see also Fig. 36) also suggest a posttranslational
159
regulation of NH3 transporters by K+. Such a mechanism may explain the agriculturally
important alleviation of NH3/NH4+ toxicity in higher plants by K+ (Barker et al. 1967; Szczerba
et al. 2008; Balkos et al. 2010) and thus pave the way for future studies.
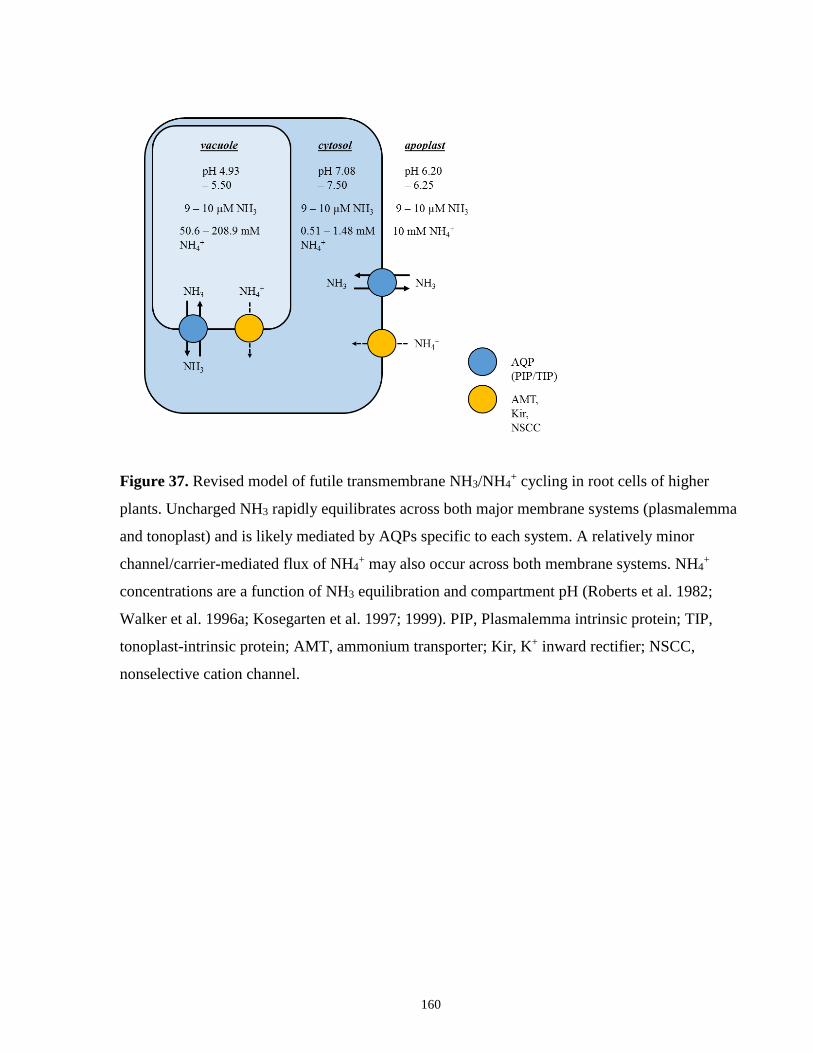
160
Figure 37. Revised model of futile transmembrane NH3/NH4+ cycling in root cells of higher
plants. Uncharged NH3 rapidly equilibrates across both major membrane systems (plasmalemma
and tonoplast) and is likely mediated by AQPs specific to each system. A relatively minor
channel/carrier-mediated flux of NH4+ may also occur across both membrane systems. NH4
+
concentrations are a function of NH3 equilibration and compartment pH (Roberts et al. 1982;
Walker et al. 1996a; Kosegarten et al. 1997; 1999). PIP, Plasmalemma intrinsic protein; TIP,
tonoplast-intrinsic protein; AMT, ammonium transporter; Kir, K+ inward rectifier; NSCC,
nonselective cation channel.
161
Chapter 7 Conclusions and Future Directions
This work highlights the physiological involvement of several important membrane channels to
plant mineral nutrition (i.e. K+ influx and efflux) and ion toxicity (i.e. K+ influx and efflux under
Na+ and NH4+ toxicity, as well as NH3/NH4
+ transport under ammonium toxicity).
Subchapter 3.1 demonstrated the physiological mechanisms and regulations of K+ release in
roots of intact barley seedlings under typical, non-stressed conditions, as well as in response to
sudden nutritional and stress-induced shifts. We showed that bona fide transmembrane efflux of
K+ across the plasma membrane is only observed at low [K+]ext (i.e. <1 mM), and is indeed
channel-mediated (likely via an unidentified outward-rectifying Shaker-like channel). Above this
concentration (i.e. ≥1 mM [K+]ext), a thermodynamic shift in K+ transport is observed (i.e. from
active to passive K+ influx; Britto and Kronzucker 2008). Interestingly, however, efflux under
these conditions does not show a shift in mechanism (i.e. from passive to active transport) per se,
but rather, transmembrane K+ efflux ceases altogether (i.e. there is no evidence for
thermodynamically active, metabolically dependent, K+ efflux), and what is observed is simply
release of 42K+ from the extracellular matrix (apoplast). Moreover, important insights were
gained in the response of K+ efflux to shifts in N-source provision, i.e. significant stimulations
with elevated [NH4+]ext (under both low and high [K+]ext, likely the response of depolarization-
activated outward-rectifying K+ channels), and inhibitions by elevated external [NO3-] (only at
low [K+]ext). In contrast, elevated external [Na+] does not seem to affect K+ efflux, until such
point that osmotically challenging concentrations (i.e. ≥100 mM) compromise membrane
stability and thus bring about the release of cellular contents (including K+; see also Britto et al.
2010). Importantly, this work reveals the limitations of Compartmental Analysis by Tracer
Efflux (CATE), used to quantify cellular pool sizes (e.g. [K+]cyt) and half-times of exchange (t½)
by analyzing efflux kinetics (Lee and Clarkson 1986; Siddiqi et al. 1991; Kronzucker et al.
1995). By demonstrating that K+ efflux ceases altogether ≥1 mM [K+]ext, we show that CATE,
while a powerful tool under some conditions, cannot be utilized at high [K+]ext. Thus, many
earlier investigations quantifying [K+]cyt and K+-exchange kinetics under low-affinity conditions
162
must be re-examined in this light (e.g. Szczerba et al. 2006), as well as many Na+ CATE
experiments under similar conditions (Britto and Kronzucker 2015).
This work also explored the involvement of outward-rectifying K+ channels under short-term
Na+ stress (Subchapter 3.2) and concluded that channels are not involved under these conditions
in rice, contrary to standing models (Shabala et al. 2006), but in agreement with earlier analyses
in barley from our laboratory (Britto et al. 2010; Coskun et al. 2010; Subchapter 3.1).
Importantly, Na+-induced K+ efflux was found not to correlate with cultivar performance under
long-term Na+ stress, also in contradiction to standing models (Chen et al. 2005; 2008; Cuin et
al. 2008). It was concluded that the best measure for salt tolerance, at least for rice, remains the
ability to limit the accumulation of Na+ in shoots (Yeo and Flowers 1982; 1983).
Chapter 4 highlighted the complexity of K+ uptake in roots of higher plants and the roles that K+
channels play (and don’t play) under various nutritional conditions. Subchapter 4.1 demonstrated
the limits of the Arabidopsis model of K+ acquisition in terms of its extrapolation to cereals:
unlike in Arabidopsis, K+ channels (e.g. HvAKT1) cannot operate under low (0.02 mM)-K+,
high (10 mM)-NH4+ conditions in barley; rather, influx is thermodynamically active and
although highly suppressed by NH4+, likely mediated by residual HvHAK1 activity. Moreover,
no evidence was found for a discernable contribution of NSCCs to K+ uptake in planta under a
wide range of conditions (high- and low-affinity, stressed and non-stressed), which has important
implications for currently accepted Na+-toxicity models, as it indicates that NSCCs may not be
significantly involved in Na+ transport either (Kronzucker and Britto 2011; cf. Davenport and
Tester 2000; Demidchik et al. 2002; Demidchik and Maathuis 2007). Furthermore, some of the
highest bona fide channel-mediated ion fluxes in plant roots were measured (up to 36 µmol K+
g-1 h-1) by investigating the effects of NH4+ withdrawal in NH4
+-grown plants and the stimulatory
effects of counterions, such as Cl- and NO3-, under high [K+]ext (see also Subchapter 4.2).
By contrast, Subchapter 4.3 demonstrated that channel-mediated K+ influxes in the low-affinity
(saline) range were quite modest (i.e. no higher than 15 µmol g-1 h-1), despite the observation of
apparent influxes that can be extremely high (2-3 orders of magnitude higher). These apparent
fluxes, as measured by radiotracer and which showed linear dependences on [K+]ext, were
demonstrated to originate from the root apoplast, despite attempts to clear the extracellular
matrix of radiotracer. This hitherto overlooked, yet significant, contribution of apoplastic fluxes
163
to ion-flux determinations has far-reaching implications, especially for Na+ fluxes under salinity
stress. According to currently accepted models, root Na+ influx shows linear dependences with
external Na+ supply, can be extremely rapid (e.g. up to 600 µmol g-1 h-1; Lazof and Cheeseman
1986; Essah et al. 2003; Horie et al. 2007; Kronzucker and Britto 2011), and is channel (NSCC)-
mediated (Demidchik et al. 2002; Essah et al. 2003; Munns and Tester 2008). Given that
standing models of Na+ transport in salt-stressed roots may be afflicted by an apoplastic artefact,
much more work is needed to adequately appraise the role of the apoplast in flux measurements
in the saline range. One such step is to take advantage of the available means to alter the
composition of the apoplast, and monitor the effects on ion fluxes. For example, Ranathunge et
al. (2016) have shown that elevated NH4+ supply in rice seedlings can increase the suberin and
lignin composition of roots, thereby increasing apoplastic barriers to solute permeability
(Schreiber et al. 1999). How this might affect low-affinity fluxes of ions like Na+ and K+ would
be worth exploring, although one must keep in mind the potential compounding stresses of Na+
and NH4+ (Speer and Kaiser 1994; Speer et al. 1994). Another nutritional modification of the
apoplast involves the application of silicon (Si). Si has been shown to increase Casparian band
formation, as well as provide a mechanical barrier to apoplastic transport via biosilicification (i.e.
amorphous silica deposition; Fleck et al. 2011; Exley 2015; Guerriero et al. 2016). Early
investigations in our laboratory have shown that Si supply does not affect the unidirectional
fluxes of Na+ in roots of salt-stressed rice (but significantly suppresses root-to-shoot
translocation); however, more investigation is required here. Another way to alter the apoplast
involves stagnant deoxygenation of roots (e.g. growth in 0.1% agar solution, which has been
shown to mimic waterlogging conditions) which enhances root suberization and lignification in
rice (Ranathunge et al. 2011). Mutants also exist that express apoplastic modifications, such as
Arabidopsis genotypes with lower suberin content (e.g. cyp86 a1 and cyp86 b1; Hoefer et al.
2008; Compagnon et al. 2009; Molina et al. 2009; Franke et al. 2012) and those with enhanced
suberin content (e.g. kcs1; Todd et al. 1999; Franke et al. 2009). Recent investigations in our
laboratory with these mutants have shown that, indeed, Na+ fluxes can be negatively correlated
with suberin production; Schulze 2014). Moreover, a clade of ATP-binding cassette (ABC)
transporters, AtABCG2, AtABCG6, and AtABCG10 in Arabidopsis (Yadav et al. 2014), and
OsABCG5 in rice (Shiono et al. 2014), have been shown to be required for effective suberin
synthesis in roots. Thus, using radiotracers for ions of interest (24Na+ and 42K+), as well as tracers
specific for the apoplast (e.g. PTS, periodic acid, and berberine; Peterson et al. 1981; Yeo et al.
164
1987; Shiono et al. 2014), we can measure apoplastic transport under these various growth
conditions and genotypes to better understand this complex tissue and its role in ion transport
under salinity stress.
The role of the BUS (i.e. the K+-uptake “back-up system” revealed in athak5 atakt1 double-
knock-out mutants), particularly in low-affinity K+ transport (but perhaps also in low-affinity
Na+ transport), will also require much more investigation. Early indications from the laboratory
of F. Rubio suggest that this system may be a NSCC, possibly of the cyclic-nucleotide gated
(CNGC) variety (Caballero et al. 2012). However, in contrast to the findings of Caballero et al.
(2012), our experiments with athak5 atakt1 mutants showed no sensitivity of K+ influx to Ca2+ or
Ba2+ (Subchapter 4.1), although further testing of the inhibitors they used, including Mg2+, La3+,
and the cyclic nucleotide N6,2’-O-dibutyryladenosine 3’-5’-cyclic monophosphate, should be
conducted. Also, the nature of the “anion effect” (i.e. Cl-- and NO3--induced stimulation) in low-
affinity K+ transport should be investigated more thoroughly (Chapter 4; Kochian et al. 1985).
Cation-chloride cotransporters (CCCs), symporters that simultaneously, and electroneutrally,
transport K+ (and/or Na+) along with Cl- (Colmenero-Flores et al. 2007), are another obvious
target of investigation. Pharmacological testing of CCCs, such as with bumetanide, could be
conducted to test for CCC contribution. Moreover, mutants in Arabidopsis AtCCC1 (Colmenero-
Flores et al. 2007) and rice OsCCC1 (Kong et al. 2011; Chen et al. 2016) could be investigated
for anion-sensitive low-affinity K+ (and Na+) fluxes. However, the fact that NO3- is also capable
of stimulating low-affinity K+ transport suggests that another mechanism may be at play. The
coupling of K+ and anion transport has typically been postulated as a potential mechanism
(Kochian et al. 1985); however, a mechanism for this coupling has yet to be resolved. Recently, a
study showed that S-type anion channels SLAH3 and SLAC1 (which are both permeable to
nitrate and chloride) in Arabidopsis guard cells physically interact and regulate K+ channels,
albeit negatively (Zhang et al. 2016). Although this study showed that anion channels inhibit K+
channels in guard cells, the study raises the question whether cation-anion channel interactions
may occur at the level of the root, and perhaps in a positive way.
Chapter 5 highlighted the importance of rigorous testing of pharmacological agents, such as the
commonly used heavy-metal AQP inhibitors Hg2+, Ag+, and Au3+, which were found to have
significant side effects on K+ transport and cellular membrane stability, including membrane
destruction brought about by high (500 µM) concentrations of Au3+ and Hg2+, and a wide range
165
(5-500 µM) of Ag+ concentrations, rendering cells incapable of retaining critical constituents.
Moreover, significant inhibition of K+ influx at lower (5 and 50 µM) concentrations of Au3+ and
Hg2+ were observed, without noticeable effects on membrane stability. Interestingly, these side
effects, particularly with Ag+, have been instrumental in the determination of cytosolic pool
sizes, especially under conditions where traditional methods such as CATE cannot be used (see
above). Taking advantage of this “Ag+-bullet” technique, detailed measurements of Na+ and K+
concentrations in the cytosol under Na+-stress conditions are currently underway in our
laboratory. Interestingly, contrary to previous estimates based on kinetic flux and
compartmentation analyses (Kronzucker et al. 2013), cytosolic Na+ estimates based on the “Ag+-
bullet” technique suggest rather modest concentrations, no higher than 30 mM, in good
agreement with ion-selective microelectrode recordings (Carden et al. 2003). By comparison,
early indications suggest that the cytosolic K+ pool sizes under Na+ stress significantly decline
from the well documented homeostatic levels of ~100 mM (Walker et al. 1996a; Britto and
Kronzucker 2008), perhaps revealing an important mechanistic link to Na+ toxicity.
Chapter 6 demonstrated that low-affinity NH3/NH4+ fluxes in roots of barley seedlings under
ammonium toxicity were predominately of the gaseous species NH3, rather than ionic NH4+
(fluxes of the latter were no higher than K+ fluxes under comparable conditions, i.e. <5 µmol g-1
h-1). Compared to some of the more rapid K+ fluxes observed (e.g. see Chapter 3), NH3 fluxes
were found to be ~5.5-fold higher (i.e. exceeding 200 µmol g-1 h-1), and were indeed some of the
highest bona fide transmembrane fluxes ever reported in planta. Keeping the lessons from
Chapter 5 in mind, early pharmacological evidence from this study suggested that AQPs may
mediate these NH3 fluxes; however, more investigation is required. Future experiments should
investigate NH3 fluxes in planta for knock-out mutants of AQPs previously demonstrated to
mediate NH3 fluxes in heterologous expression systems (e.g. AtTIP2;1 and AtTIP2;3 in
Arabidopsis; Loqué et al. 2005). Interestingly, a recent study on the novel crystal structure of
AtTIP2;1 speculates that a flexible histidine residue in a water-filled side pore of the channel
might be involved in the deprotonation of NH4+, thereby possibly increasing the permeation of
NH3 (Kirscht et al. 2016). Taken together, we proposed a revised model (Fig. 37) of NH3/NH4+
transport and compartmentation under ammonium toxicity in root cells, whereby AQP-mediated
NH3 fluxes across both major membrane systems (i.e. plasmalemma and tonoplast) result in the
rapid equilibration of NH3 across the cytosol and vacuole. NH3 equilibration and compartment
166
pH thus result in the ‘acid trapping’ and toxic accumulation of NH4+ in the vacuole, which may
underlie the toxicity syndrome.
A promising route of future study based on the work from Chapter 6 involves the regulation of
NH3 fluxes by K+. Elevated K+ supply, both in the short and long term, can significantly inhibit
NH3/NH4+ fluxes under ammonium toxicity, as well as relieve the symptoms of ammonium
stress (Britto and Kronzucker 2002; Szczerba et al. 2008b; Balkos et al. 2010; Coskun et al.
2013b). Thus, future studies will test the hypothesis that K+ can directly regulate AQP-mediated
fluxes. In the Michaelis-Menten analyses of Chapter 6 (see Fig. 33E), elevated K+ suppressed the
Vmax of NH3 influx, but did not alter the KM, suggesting that K+ may not have an effect on the
substrate binding affinity of AQPs, but may regulate their activity by other means (perhaps via
changes in conformation). Long-term (3-mo) studies in rice plants demonstrated a 127% increase
in agronomic water-use efficiency (WUEa) in high (1.5 mM)-K+ relative to low (0.1 mM)-K+
plants (Britto et al. 2014), suggesting a regulatory role for K+ in water transport. Also,
preliminary evidence from our laboratory suggests that water transport (transpiration measured
gravimetrically, and root hydraulic conductance measured via the pressure chamber technique;
Scholander et al. 1965; Tournaire-Roux et al. 2003) is indeed lower in high-K+ relative to low-K+
plants (data not shown), further suggesting AQP-mediated fluxes may be regulated by K+ status.
Future studies will also investigate the role of K+ in regulating AQP-mediated water transport by
measuring hydraulic conductance of root (cortical) cells by the cell pressure probe technique
(Tomos and Leigh 1999; Javot et al. 2003) as well as osmotic water permeability (Pf) in
heterologous expression systems (e.g. Xenopus oocytes) employing osmotic swelling assays
(Maurel et al. 1995). Such studies will be vital not only to address the issue of ammonium
toxicity by potentially regulating the toxic cellular accumulation of NH3/NH4+, but also to
improve plant WUE, especially in the context of agriculture, which currently consumers 80-90%
of the fresh water available for human consumption worldwide (Hamdy et al. 2003; Hoekstra
and Chapagain 2007).
167
References
Achilea O (2002) Alleviation of salinity-induced stress in cash crops by multi-K (potassium
nitrate), five cases typifying the underlying pattern. Proceedings of the International
Symposium on Techniques to Control Salination for Horticultural Productivity 573, 43-
48.
Adams DJ, Oxford GS (1983) Interaction of internal anions with potassium channels of the squid
giant axon. Journal of General Physiology 82, 429-448.
Agre P, Lee MD, Devidas S, Guggino WB (1997) Aquaporins and ion conductance. Science 275,
1490-1490.
Ahmad I, Maathuis FJM (2014) Cellular and tissue distribution of potassium: Physiological
relevance, mechanisms and regulation. Journal of Plant Physiology 171, 708-714.
Ahn SJ, Shin R, Schachtman DP (2004) Expression of KT/KUP genes in Arabidopsis and the
role of root hairs in K+ uptake. Plant Physiology 134, 1135-1145.
Al-Khayri JM, Al-Bahrany AM (2001) Silver nitrate and 2-isopentyladenine promote somatic
embryogenesis in date palm (Phoenix dactylifera L.). Scientia Horticulturae 89, 291-298.
Alemán F, Nieves-Cordones M, Martínez V, Rubio F (2011) Root K+ acquisition in plants: The
Arabidopsis thaliana model. Plant and Cell Physiology 52, 1603-1612.
Amrutha RN, Sekhar PN, Varshney RK, Kishor PBK (2007) Genome-wide analysis and
identification of genes related to potassium transporter families in rice (Oryza sativa L.).
Plant Science 172, 708-721.
Amthor JS (2000) The McCree-de Wit-Penning de Vries-Thornley respiration paradigms: 30
years later. Annals of Botany 86, 1-20.
Anderson JA, Huprikar SS, Kochian LV, Lucas WJ, Gaber RF (1992) Functional expression of a
probable Arabidopsis thaliana potassium channel in Saccharomyces cerevisiae.
Proceedings of the National Academy of Sciences of the United States of America 89,
3736-3740.
Anil VS, Krishnamurthy P, Kuruvilla S, Sucharitha K, Thomas G, Mathew MK (2005)
Regulation of the uptake and distribution of Na+ in shoots of rice (Oryza sativa) variety
Pokkali: role of Ca2+ in salt tolerance response. Physiologia Plantarum 124, 451-464.
Asharani PV, Sethu S, Vadukumpully S, Zhong S, Lim CT, Hande MP, Valiyaveettil S (2010)
Investigations on the structural damage in human erythrocytes exposed to silver, gold,
and platinum nanoparticles. Advanced Functional Materials 20, 1233-1242.
Ashley MK, Grant M, Grabov A (2006) Plant responses to potassium deficiencies: A role for
potassium transport proteins. Journal of Experimental Botany 57, 425-436.
168
Ayling SM (1993) The effect of ammonium ions on membrane potential and anion flux in roots
of barley and tomato. Plant Cell and Environment 16, 297-303.
Balkos KD, Britto DT, Kronzucker HJ (2010) Optimization of ammonium acquisition and
metabolism by potassium in rice (Oryza sativa L. cv. IR-72). Plant Cell and Environment
33, 23-34.
Barber DA (1972) Dual isotherms for absorption of ions by plant tissues. New Phytologist 71,
255-262.
Barker AV, Maynard DN, Lachman WH (1967) Induction of tomato stem and leaf lesions and
potassium deficiency by excessive ammonium nutrition. Soil Science 103, 319-327.
Bartholomew RP, Janssen G (1929) The relation between concentrations of potassium in culture
solutions and optimum plant growth. Soil Science 27, 189-203.
Beauge LA, Medici A, Sjodin RA (1973) Influence of external cesium ions on potassium efflux
in frog skeletal muscle. Journal of Physiology-London 228, 1-11.
Behl R, Jeschke WD (1982) Potassium fluxes in excised barley roots. Journal of Experimental
Botany 33, 584-600.
Benito B, Garciadeblás B, Rodríguez-Navarro A (2002) Potassium- or sodium-efflux ATPase, a
key enzyme in the evolution of fungi. Microbiology 148, 933-941.
Benito B, Rodríguez-Navarro A (2003) Molecular cloning and characterization of a sodium-
pump ATPase of the moss Physcomitrella patens. Plant Journal 36, 382-389.
Bertl A, Reid JD, Sentenac H, Slayman CL (1997) Functional comparison of plant inward-
rectifier channels expressed in yeast. Journal of Experimental Botany 48, 405-413.
Beyer EM (1976) Potent inhibitor of ethylene action in plants. Plant Physiology 58, 268-271.
Blackman MS, McDaniel CN (1978) Amino acid transport in suspension cultured plant cells. 1.
Methods and kinetics of L-leucine uptake. Plant Science Letters 13, 27-34.
Blatt MR (1999) Reassessing roles for Ca2+ in guard cell signalling. Journal of Experimental
Botany 50, 989-999.
Blatz AL, Magleby KL (1984) Ion conductance and selectivity of single calcium-activated
potassium channels in cultured rat muscle. Journal of General Physiology 84, 1-23.
Blevins DG, Hiatt AJ, Lowe RH (1974) Influence of nitrate and chloride uptake on expressed
sap organic-acid synthesis, and potassium accumulation in higher plants. Plant
Physiology 54, 82-87.
Bobbink R, Hicks K, Galloway J, Spranger T, Alkemade R, Ashmore M, Bustamante M,
Cinderby S, Davidson E, Dentener F, Emmett B, Erisman JW, Fenn M, Gilliam F,
Nordin A, Pardo L, De Vries W (2010) Global assessment of nitrogen deposition effects
on terrestrial plant diversity: A synthesis. Ecological Applications 20, 30-59.
169
Bobbink R, Hornung M, Roelofs JGM (1998) The effects of air-borne nitrogen pollutants on
species diversity in natural and semi-natural European vegetation. Journal of Ecology 86,
717-738.
Botella MA, Martínez V, Nieves M, Cerda A (1997) Effect of salinity on the growth and
nitrogen uptake by wheat seedlings. Journal of Plant Nutrition 20, 793-804.
Bourgeais-Chaillou P, Perez-Alfocea F, Guerrier G (1992) Comparative effects of N-sources on
growth and physiological responses of soyabean exposed to NaCl-stress. Journal of
Experimental Botany 43, 1225-1233.
Bramley H, Turner NC, Turner DW, Tyerman SD (2009) Roles of morphology, anatomy, and
aquaporins in determining contrasting hydraulic behavior of roots. Plant Physiology 150,
348-364.
Bravo P, Uribe EG (1981) Temperature dependence of the concentration kinetics of absorption
of phosphate and potassium in corn roots. Plant Physiology 67, 815-819.
Brenchley R, Spannagl M, Pfeifer M, Barker GLA, D'Amore R, Allen AM, McKenzie N,
Kramer M, Kerhornou A, Bolser D, Kay S, Waite D, Trick M, Bancroft I, Gu Y, Huo N,
Luo M-C, Sehgal S, Gill B, Kianian S, Anderson O, Kersey P, Dvorak J, McCombie WR,
Hall A, Mayer KFX, Edwards KJ, Bevan MW, Hall N (2012) Analysis of the breadwheat
genome using whole-genome shotgun sequencing. Nature 491, 705-710.
Britto DT, Kronzucker HJ (2001) Can unidirectional influx be measured in higher plants? A
mathematical approach using parameters from efflux analysis. New Phytologist 150, 37-
47.
Britto DT, Glass ADM, Kronzucker HJ, Siddiqi MY (2001a) Cytosolic concentrations and
transmembrane fluxes of NH4+/NH3: An evaluation of recent proposals. Plant Physiology
125, 523-526.
Britto DT, Siddiqi MY, Glass ADM, Kronzucker HJ (2001b) Futile transmembrane NH4+
cycling: A cellular hypothesis to explain ammonium toxicity in plants. Proceedings of the
National Academy of Sciences of the United States of America 98, 4255-4258.
Britto DT, Kronzucker HJ (2002) NH4+ toxicity in higher plants: A critical review. Journal of
Plant Physiology 159, 567-584.
Britto DT, Kronzucker HJ (2006) Futile cycling at the plasma membrane: A hallmark of low-
affinity nutrient transport. Trends in Plant Science 11, 529-534.
Britto DT, Kronzucker HJ (2008) Cellular mechanisms of potassium transport in plants.
Physiologia Plantarum 133, 637-650.
Britto DT, Kronzucker HJ (2009) Ussing's conundrum and the search for transport mechanisms
in plants. New Phytologist 183, 243-246.
170
Britto DT, Ebrahimi-Ardebili S, Hamam AM, Coskun D, Kronzucker HJ (2010) 42K analysis of
sodium-induced potassium efflux in barley: Mechanism and relevance to salt tolerance.
New Phytologist 186, 373-384.
Britto DT, Balkos KD, Becker A, Coskun D, Huynh WQ, Kronzucker HJ (2014) Potassium and
nitrogen poising: Physiological changes and biomass gains in rice and barley. Canadian
Journal of Plant Science 94, 1085-1089.
Britto DT, Kronzucker HJ (2015) Sodium efflux in plant roots: What do we really know?
Journal of Plant Physiology 186, 1-12.
Burdon-Sanderson J (1873) Note on the electrical phenomena which accompany irritation of the
leaf of Dionaea muscipula (Venus flytrap). Proceedings of the Royal Society of London
21, 1873.
Caballero F, Botella MA, Rubio L, Fernandez JA, Martínez V, Rubio F (2012) A Ca2+-sensitive
system mediates low-affinity K+ uptake in the absence of AKT1 in Arabidopsis plants.
Plant and Cell Physiology 53, 2047-2059.
Cakmak I (2005) The role of potassium in alleviating detrimental effects of abiotic stresses in
plants. Journal of Plant Nutrition and Soil Science 168, 521-530.
Carden DE, Walker DJ, Flowers TJ, Miller AJ (2003) Single-cell measurements of the
contributions of cytosolic Na+ and K+ to salt tolerance. Plant Physiology 131, 676-683.
Chapin FS (1980) The mineral nutrition of wild plants. Annual Review of Ecology and
Systematics 11, 233-260.
Cheeseman JM (1986) Compartmental efflux analysis - An evaluation of the technique and its
limitations. Plant Physiology 80, 1006-1011.
Cheeseman JM (2013) The integration of activity in saline environments: Problems and
perspectives. Functional Plant Biology 40, 759-774.
Cheeseman JM, Hanson JB (1979a) Energy linked potassium influx as related to cell potential in
corn roots. Plant Physiology 64, 842-845.
Cheeseman JM, Hanson JB (1979b) Mathematical analysis of the dependence of cell potential on
external potassium in corn roots. Plant Physiology 63, 1-4.
Chen G, Guo S, Kronzucker HJ, Shi W (2013) Nitrogen use efficiency (NUE) in rice links to
NH4+ toxicity and futile NH4
+ cycling in roots. Plant and Soil 369, 351-363.
Chen Z, Newman I, Zhou M, Mendham N, Zhang G, Shabala S (2005) Screening plants for salt
tolerance by measuring K+ flux: A case study for barley. Plant Cell and Environment 28,
1230-1246.
Chen Z, Shabala S, Mendham N, Newman I, Zhang G, Zhou M (2008) Combining ability of
salinity tolerance on the basis of NaCl-induced K+ flux from roots of barley. Crop
Science 48, 1382-1388.
171
Chen Z, Zhou M, Newman IA, Mendham NJ, Zhang G, Shabala S (2007) Potassium and sodium
relations in salinised barley tissues as a basis of differential salt tolerance. Functional
Plant Biology 34, 150-162.
Chen ZC, Yamaji N, Fujii-Kashino M, Ma JF (2016) A cation-chloride cotransporter gene is
required for cell elongation and osmoregulation in rice. Plant Physiology 171, 494-507.
Cherel I (2004) Regulation of K+ channel activities in plants: From physiological to molecular
aspects. Journal of Experimental Botany 55, 337-351.
Colmenero-Flores JM, Martínez G, Gamba G, Vazquez N, Iglesias DJ, Brumos J, Talon M
(2007) Identification and functional characterization of cation-chloride cotransporters in
plants. Plant Journal 50, 278-292.
Compagnon V, Diehl P, Benveniste I, Meyer D, Schaller H, Schreiber L, Franke R, Pinot F
(2009) CYP86B1 is required for very long chain omega-hydroxyacid and alpha,omega-
dicarboxylic acid synthesis in root and seed suberin polyester. Plant Physiology 150,
1831-1843.
Coronado R, Rosenberg RL, Miller C (1980) Ionic selectivity, saturation, and block in a K+-
selective channel from sarcoplasmic reticulum. Journal of General Physiology 76, 425-
446.
Coskun D, Britto DT, Kronzucker HJ (2010) Regulation and mechanism of potassium release
from barley roots: An in planta 42K+ analysis. New Phytologist 188, 1028-1038.
Coskun D, Britto DT, Jean YK, Schulze LM, Becker A, Kronzucker HJ (2012) Silver ions
disrupt K+ homeostasis and cellular integrity in intact barley (Hordeum vulgare L.) roots.
Journal of Experimental Botany 63, 151-162.
Coskun D, Britto DT, Jean Y-K, Kabir I, Tolay I, Torun AA, Kronzucker HJ (2013a) K+ efflux
and retention in response to NaCl stress do not predict salt tolerance in contrasting
genotypes of rice (Oryza sativa L.). PLOS ONE 8, e57767.
Coskun D, Britto DT, Li M, Becker A, Kronzucker HJ (2013b) Rapid ammonia gas transport
accounts for futile transmembrane cycling under NH3/NH4+ toxicity in plant roots. Plant
Physiology 163, 1859-1867.
Coskun D, Britto DT, Li M, Oh S, Kronzucker HJ (2013c) Capacity and plasticity of potassium
channels and high-affinity transporters in roots of barley and Arabidopsis. Plant
Physiology 162, 496-511.
Coskun D, Britto DT, Hamam AM, Kronzucker HJ (2014a) Measuring fluxes of mineral
nutrients and toxicants in plants with radioactive tracers. Journal of Visualized
Experiments 90, doi: 10.3791/51877.
Coskun D, Britto DT, Kronzucker HJ (2014b) The physiology of channel-mediated K+
acquisition in roots of higher plants. Physiologia Plantarum 151, 305-312.
172
Cramer GR, Lauchli A, Polito VS (1985) Displacement of Ca2+ by Na+ from the plasmalemma of
root cells - A primary response to salt stress. Plant Physiology 79, 207-211.
Cuin TA, Miller AJ, Laurie SA, Leigh RA (2003) Potassium activities in cell compartments of
salt-grown barley leaves. Journal of Experimental Botany 54, 657-661.
Cuin TA, Betts SA, Chalmandrier R, Shabala S (2008) A root's ability to retain K+ correlates
with salt tolerance in wheat. Journal of Experimental Botany 59, 2697-2706.
Czempinski K, Frachisse JM, Maurel C, Barbier-Brygoo H, Mueller-Roeber B (2002) Vacuolar
membrane localization of the Arabidopsis 'two-pore' K+ channel KCO1. Plant Journal
29, 809-820.
Dainty J (1962) Ion transport and electrical potentials in plant cells. Annual Review of Plant
Physiology and Plant Molecular Biology 13, 379-402.
Darwin CR (1875) Insectivorous Plants. Appleton, New York.
Davenport RJ, Tester M (2000) A weakly voltage-dependent, nonselective cation channel
mediates toxic sodium influx in wheat. Plant Physiology 122, 823-834.
de Graaf MCC, Bobbink R, Roelofs JGM, Verbeek PJM (1998) Differential effects of
ammonium and nitrate on three heathland species. Plant Ecology 135, 185-196.
Demidchik V, Davenport RJ, Tester M (2002) Nonselective cation channels in plants. Annual
Review of Plant Biology 53, 67-107.
Demidchik V, Maathuis FJM (2007) Physiological roles of nonselective cation channels in
plants: From salt stress to signalling and development. New Phytologist 175, 387-404.
Dennison KL, Robertson WR, Lewis BD, Hirsch RE, Sussman MR, Spalding EP (2001)
Functions of AKT1 and AKT2 potassium channels determined by studies of single and
double mutants of Arabidopsis. Plant Physiology 127, 1012-1019.
Diatloff E, Geiger D, Shang L, Hedrich R, Roberts SK (2004) Differential regulation of K+
channels in Arabidopsis epidermal and stelar root cells. Plant Cell and Environment 27,
980-990.
Doyle DA, Cabral JM, Pfuetzner RA, Kuo AL, Gulbis JM, Cohen SL, Chait BT, MacKinnon R
(1998) The structure of the potassium channel: Molecular basis of K+ conduction and
selectivity. Science 280, 69-77.
Dreyer I, Blatt MR (2009) What makes a gate? The ins and outs of Kv-like K+ channels in
plants. Trends in Plant Science 14, 383-390.
Dreyer I, Uozumi N (2011) Potassium channels in plant cells. FEBS Journal 278, 4293-4303.
Ehlert C, Maurel C, Tardieu F, Simonneau T (2009) Aquaporin-mediated reduction in maize root
hydraulic conductivity impacts cell turgor and leaf elongation even without changing
transpiration. Plant Physiology 150, 1093-1104.
173
Epstein E, Elzam OE, Rains DW (1963) Resolution of dual mechanisms of potassium absorption
by barley roots. Proceedings of the National Academy of Sciences of the United States of
America 49, 684-692.
Epstein E, Hagen CE (1952) A kinetic study of the absorption of alkali cations by barley roots.
Plant Physiology 27, 457-474.
Essah PA, Davenport R, Tester M (2003) Sodium influx and accumulation in Arabidopsis. Plant
Physiology 133, 307-318.
Esteban R, Ariz I, Cruz C, Moran JF (2016) Review: Mechanisms of ammonium toxicity and the
quest for tolerance. Plant Science 248, 92-101.
Etherton B, Higinbotham N (1960) Transmembrane potential measurements of cells of higher
plants as related to salt uptake. Science 131, 409-410.
Exley C (2015) A possible mechanism of biological silicification in plants. Frontiers in Plant
Science 6, doi:10.3389/fpls.2015.00853.
Faiyue B, Al-Azzawi MJ, Flowers TJ (2012) A new screening technique for salinity resistance in
rice (Oryza sativa L.) seedlings using bypass flow. Plant Cell and Environment 35, 1099-
1108.
Feng JN, Volk RJ, Jackson WA (1994) Inward and outward transport of ammonium in roots of
maize and sorghum - Contrasting effects of methionine sulfoximine. Journal of
Experimental Botany 45, 429-439.
Fischer E, Luttge U (1980) Membrane potential changes related to active transport of glycine in
Lemna gibba G1. Plant Physiology 65, 1004-1008.
Fisher JD, Hansen D, Hodges TK (1970) Correlation between ion fluxes and ion-stimulated
adenosine triphosphatase activity of plant roots. Plant Physiology 46, 812-814.
Fleck AT, Nye T, Repenning C, Stahl F, Zahn M, Schenk MK (2011) Silicon enhances
suberization and lignification in roots of rice (Oryza sativa). Journal of Experimental
Botany 62, 2001-2011.
Flowers TJ (1999) Salinisation and horticultural production. Scientia Horticulturae 78, 1-4.
Flowers TJ, Hajibagheri MA (2001) Salinity tolerance in Hordeum vulgare: ion concentrations
in root cells of cultivars differing in salt tolerance. Plant and Soil 231, 1-9.
Flowers TJ, Hajibagheri MA, Yeo AR (1991) Ion accumulation in the cell walls of rice plants
growing under saline conditions - Evidence for the Oertli hypothesis. Plant Cell and
Environment 14, 319-325.
Fowler D, Coyle M, Skiba U, Sutton MA, Cape JN, Reis S, Sheppard LJ, Jenkins A, Grizzetti B,
Galloway JN, Vitousek P, Leach A, Bouwman AF, Butterbach-Bahl K, Dentener F,
Stevenson D, Amann M, Voss M (2013) The global nitrogen cycle in the twenty-first
174
century. Philosophical Transactions of the Royal Society B-Biological Sciences 368,
20130164.
Fowler D, Steadman CE, Stevenson D, Coyle M, Rees RM, Skiba UM, Sutton MA, Cape JN,
Dore AJ, Vieno M, Simpson D, Zaehle S, Stocker BD, Rinaldi M, Facchini MC, Flechard
CR, Nemitz E, Twigg M, Erisman JW, Butterbach-Bahl K, Galloway JN (2015) Effects
of global change during the 21st century on the nitrogen cycle. Atmospheric Chemistry
and Physics 15, 13849-13893.
Franke R, Hoefer R, Briesen I, Emsermann M, Efremova N, Yephremov A, Schreiber L (2009)
The DAISY gene from Arabidopsis encodes a fatty acid elongase condensing enzyme
involved in the biosynthesis of aliphatic suberin in roots and the chalaza-micropyle
region of seeds. Plant Journal 57, 80-95.
Franke RB, Dombrink I, Schreiber L (2012) Suberin goes genomics: Use of a short living plant
to investigate a long lasting polymer. Frontiers in Plant Science 3,
doi:10.3389/fpls.2012.00004.
Frechilla S, Lasa B, Ibarretxe L, Lamsfus C, Aparicio-Tejo P (2001) Pea responses to saline
stress is affected by the source of nitrogen nutrition (ammonium or nitrate). Plant Growth
Regulation 35, 171-179.
Fromm J, Lautner S (2007) Electrical signals and their physiological significance in plants. Plant
Cell and Environment 30, 249-257.
Fu HH, Luan S (1998) AtKUP1: A dual-affinity K+ transporter from Arabidopsis. Plant Cell 10,
63-73.
Fuchs I, Stolzle S, Ivashikina N, Hedrich R (2005) Rice K+ uptake channel OsAKT1 is sensitive
to salt stress. Planta 221, 212-221.
Fulgenzi FR, Peralta ML, Mangano S, Danna CH, Vallejo AJ, Puigdomenech P, Santa-María GE
(2008) The ionic environment controls the contribution of the barley HvHAK1
transporter to potassium acquisition. Plant Physiology 147, 252-262.
Gajdanowicz P, Garcia-Mata C, Gonzalez W, Elias Morales-Navarro S, Sharma T, Danilo
Gonzalez-Nilo F, Gutowicz J, Mueller-Roeber B, Blatt MR, Dreyer I (2009) Distinct
roles of the last transmembrane domain in controlling Arabidopsis K+ channel activity.
New Phytologist 182, 380-391.
Galloway JN, Townsend AR, Erisman JW, Bekunda M, Cai Z, Freney JR, Martinelli LA,
Seitzinger SP, Sutton MA (2008) Transformation of the nitrogen cycle: Recent trends,
questions, and potential solutions. Science 320, 889-892.
Gambale F, Uozumi N (2006) Properties of Shaker-type potassium channels in higher plants.
Journal of Membrane Biology 210, 1-19.
Garcia A, Rizzo CA, UdDin J, Bartos SL, Senadhira D, Flowers TJ, Yeo AR (1997) Sodium and
potassium transport to the xylem are inherited independently in rice, and the mechanism
175
of sodium: Potassium selectivity differs between rice and wheat. Plant Cell and
Environment 20, 1167-1174.
Garciadeblas B, Senn ME, Banuelos MA, Rodriguez-Navarro A (2003) Sodium transport and
HKT transporters: the rice model. Plant Journal 34, 788-801.
Gary-Bobo CM (1970) Effect of Ca2+ on water and non-electrolyte permeability of phospholipid
membranes. Nature 228, 1101-1102.
Gassmann W, Schroeder JI (1994) Inward rectifying K+ channels in root hairs of wheat - A
mechanism for aluminum-sensitive low-affinity K+ uptake and membrane potential
control. Plant Physiology 105, 1399-1408.
Gaymard F, Pilot G, Lacombe B, Bouchez D, Bruneau D, Boucherez J, Michaux-Ferriere N,
Thibaud JB, Sentenac H (1998) Identification and disruption of a plant Shaker-like
outward channel involved in K+ release into the xylem sap. Cell 94, 647-655.
Geiger D, Becker D, Vosloh D, Gambale F, Palme K, Rehers M, Anschuetz U, Dreyer I, Kudla
J, Hedrich R (2009) Heteromeric AtKC1·AKT1 channels in Arabidopsis roots facilitate
growth under K+-limiting conditions. Journal of Biological Chemistry 284, 21288-21295.
Gerendas J, Zhu ZJ, Bendixen R, Ratcliffe RG, Sattelmacher B (1997) Physiological and
biochemical processes related to ammonium toxicity in higher plants. Zeitschrift Fur
Pflanzenernahrung Und Bodenkunde 160, 239-251.
Gierth M, Mäser P (2007) Potassium transporters in plants - Involvement in K+ acquisition,
redistribution and homeostasis. FEBS Letters 581, 2348-2356.
Gierth M, Mäser P, Schroeder JI (2005) The potassium transporter AtHAK5 functions in K+
deprivation-induced high-affinity K+ uptake and AKT1 K+ channel contribution to K+
uptake kinetics in Arabidopsis roots. Plant Physiology 137, 1105-1114.
Glass ADM (1976) Regulation of potassium absorption in barley roots - Allosteric model. Plant
Physiology 58, 33-37.
Glass ADM, Dunlop J (1978) Influence of potassium content on kinetics of potassium influx into
excised ryegrass and barley roots. Planta 141, 117-119.
Glass ADM, Shaff JE, Kochian LV (1992) Studies of the uptake of nitrate in barley. 4.
Electrophysiology. Plant Physiology 99, 456-463.
Goff SA, Ricke D, Lan TH, Presting G, Wang RL, Dunn M, Glazebrook J, Sessions A, Oeller P,
Varma H, Hadley D, Hutchinson D, Martin C, Katagiri F, Lange BM, Moughamer T, Xia
Y, Budworth P, Zhong JP, Miguel T, Paszkowski U, Zhang SP, Colbert M, Sun WL,
Chen LL, Cooper B, Park S, Wood TC, Mao L, Quail P, Wing R, Dean R, Yu YS,
Zharkikh A, Shen R, Sahasrabudhe S, Thomas A, Cannings R, Gutin A, Pruss D, Reid J,
Tavtigian S, Mitchell J, Eldredge G, Scholl T, Miller RM, Bhatnagar S, Adey N, Rubano
T, Tusneem N, Robinson R, Feldhaus J, Macalma T, Oliphant A, Briggs S (2002) A draft
sequence of the rice genome (Oryza sativa L. ssp japonica). Science 296, 92-100.
176
Gong HJ, Randall DP, Flowers TJ (2006) Silicon deposition in the root reduces sodium uptake in
rice (Oryza sativa L.) seedlings by reducing bypass flow. Plant Cell and Environment 29,
1970-1979.
Goyal SS, Rains DW, Huffaker RC (1988) Determination of ammonium ion by fluorometry or
spectrophotometry after online derivatization with ortho-phthalaldehyde. Analytical
Chemistry 60, 175-179.
Grattan SR, Grieve CM (1999) Salinity mineral nutrient relations in horticultural crops. Scientia
Horticulturae 78, 127-157.
Grefen C, Blatt MR (2008) SNAREs - Molecular governors in signalling and development.
Current Opinion in Plant Biology 11, 600-609.
Grefen C, Blatt MR (2012) Do calcineurin B-like proteins interact independently of the serine
threonine kinase CIPK23 with the K+ channel AKT1? Lessons learned from a menage a
trois. Plant Physiology 159, 915-919.
Grefen C, Chen Z, Honsbein A, Donald N, Hills A, Blatt MR (2010) A novel motif essential for
SNARE interaction with the K+ channel KC1 and channel gating in Arabidopsis. Plant
Cell 22, 3076-3092.
Gruber N, Galloway JN (2008) An Earth-system perspective of the global nitrogen cycle. Nature
451, 293-296.
Grzebisz W, Gransee A, Szczepaniak W, Diatta J (2013) The effects of potassium fertilization on
water-use efficiency in crop plants. Journal of Plant Nutrition and Soil Science 176, 355-
374.
Guerin M, Wallon G (1979) Reversible replacement of niternal potassium by cesium in isolated
turtle heart. Journal of Physiology-London 293, 525-537.
Guerriero G, Hausman J-F, Legay S (2016) Silicon and the plant extracellular matrix. Frontiers
in Plant Science 7, doi: 10.3389/fpls.2016.00463.
Hajibagheri MA, Flowers TJ, Collins JC, Yeo AR (1988) A comparison of the methods of X-ray
microanalysis, compartmental analysis and longitudinal ion profiles to estimate
cytoplasmic ion concentrations in 2 maize varieties. Journal of Experimental Botany 39,
279-290.
Halperin SJ, Lynch JP (2003) Effects of salinity on cytosolic Na+ and K+ in root hairs of
Arabidopsis thaliana: In vivo measurements using the fluorescent dyes SBFI and PBFI.
Journal of Experimental Botany 54, 2035-2043.
Hamdy A, Ragab R, Scarascia-Mugnozza E (2003) Coping with water scarcity: Water saving
and increasing water productivity. Irrigation and Drainage 52, 3-20.
Hampton CR, Bowen HC, Broadley MR, Hammond JP, Mead A, Payne KA, Pritchard J, White
PJ (2004) Cesium toxicity in Arabidopsis. Plant Physiology 136, 3824-3837.
177
Hedrich R (2012) Ion channels in plants. Physiological Reviews 92, 1777-1811.
Hepler PK (2005) Calcium: A central regulator of plant growth and development. Plant Cell 17,
2142-2155.
Hille B (2001) Ion Channels of Excitable Membranes, Ed 3. Sinauer Associates, Sunderland,
MA.
Hirsch RE, Lewis BD, Spalding EP, Sussman MR (1998) A role for the AKT1 potassium
channel in plant nutrition. Science 280, 918-921.
Hoagland DR, Martin JC (1933) Absorption of potassium by plants in relation to replaceable,
non-replaceable, and soil solution potassium. Soil Science 36, 1-33.
Hodge A (2004) The plastic plant: Rroot responses to heterogeneous supplies of nutrients. New
Phytologist 162, 9-24.
Hoefer R, Briesen I, Beck M, Pinot F, Schreiber L, Franke R (2008) The Arabidopsis
cytochrome P450 CYP86A1 encodes a fatty acid omega-hydroxylase involved in suberin
monomer biosynthesis. Journal of Experimental Botany 59, 2347-2360.
Hoekstra AY, Chapagain AK (2007) Water footprints of nations: Water use by people as a
function of their consumption pattern. Water Resources Management 21, 35-48.
Holm LM, Jahn TP, Moller ALB, Schjoerring JK, Ferri D, Klaerke DA, Zeuthen T (2005) NH3
and NH4+ permeability in aquaporin-expressing Xenopus oocytes. Pflugers Archiv-
European Journal of Physiology 450, 415-428.
Honsbein A, Sokolovski S, Grefen C, Campanoni P, Pratelli R, Paneque M, Chen Z, Johansson I,
Blatt MR (2009) A tripartite SNARE-K+ channel complex mediates in channel-dependent
K+ nutrition in Arabidopsis. Plant Cell 21, 2859-2877.
Horie T, Costa A, Kim TH, Han MJ, Horie R, Leung H-Y, Miyao A, Hirochika H, An G,
Schroeder JI (2007) Rice OsHKT2;1 transporter mediates large Na+ influx component
into K+-starved roots for growth. EMBO Journal 26, 3003-3014.
Hove RM, Bhave M (2011) Plant aquaporins with non-aqua functions: Deciphering the signature
sequences. Plant Molecular Biology 75, 413-430.
Hukin D, Doering-Saad C, Thomas CR, Pritchard J (2002) Sensitivity of cell hydraulic
conductivity to mercury is coincident with symplasmic isolation and expression of
plasmalemma aquaporin genes in growing maize roots. Planta 215, 1047-1056.
Husted S, Hebbern CA, Mattsson M, Schjoerring JK (2000) A critical experimental evaluation of
methods for determination of NH4+ in plant tissue, xylem sap and apoplastic fluid.
Physiologia Plantarum 109, 167-179.
Ismail AM, Heuer S, Thomson MJ, Wissuwa M (2007) Genetic and genomic approaches to
develop rice germplasm for problem soils. Plant Molecular Biology 65, 547-570.
178
Ivashikina N, Becker D, Ache P, Meyerhoff O, Felle HH, Hedrich R (2001) K+ channel profile
and electrical properties of Arabidopsis root hairs. FEBS Letters 508, 463-469.
Iwabuchi K, Kaneko T, Kikuyama M (2008) Mechanosensitive ion channels in Chara: Influence
of water channel inhibitors, HgCl2 and ZnCl2, on generation of receptor potential.
Journal of Membrane Biology 221, 27-37.
Izaurralde RC, Kissel DE, Cabrera ML (1990) Simulation model of banded ammonia in soils.
Soil Science Society of America Journal 54, 917-922.
Jahn TP, Møller ALB, Zeuthen T, Holm LM, Klærke DA, Mohsin B, Kuhlbrandt W, Schjoerring
JK (2004) Aquaporin homologues in plants and mammals transport ammonia. FEBS
Letters 574, 31-36.
Javot H, Lauvergeat V, Santoni V, Martin-Laurent F, Guclu J, Vinh J, Heyes J, Franck KI,
Schaffner AR, Bouchez D, Maurel C (2003) Role of a single aquaporin isoform in root
water uptake. Plant Cell 15, 509-522.
Jeanguenin L, Alcon C, Duby G, Boeglin M, Cherel I, Gaillard I, Zimmermann S, Sentenac H,
Véry A-A (2011) AtKC1 is a general modulator of Arabidopsis inward Shaker channel
activity. Plant Journal 67, 570-582.
Jeschke WD, Jambor W (1981) Determination of unidirectional sodium fluxes in roots of intact
sunflower seedlings. Journal of Experimental Botany 32, 1257-1272.
Jeschke WD, Stelter W (1976) Measurement of longitudinal ion profiles in single roots of
Hordeum and Atriplex by use of flameless atomic absorption spectroscopy. Planta 128,
107-112.
Johansson I, Wulfetange K, Poree F, Michard E, Gajdanowicz P, Lacombe B, Sentenac H,
Thibaud JB, Mueller-Roeber B, Blatt MR, Dreyer I (2006) External K+ modulates the
activity of the Arabidopsis potassium channel SKOR via an unusual mechanism. Plant
Journal 46, 269-281.
Kielland J (1937) Individual activity coefficients of ions in aqueous solutions. Journal of the
American Chemical Society 59, 1675-1678.
Kim EJ, Kwak JM, Uozumi N, Schroeder JI (1998) AtKUP1: An Arabidopsis gene encoding
high-affinity potassium transport activity. Plant Cell 10, 51-62.
Kim JY, Lee C, Cho M, Yoon J (2008) Enhanced inactivation of E. coli and MS-2 phage by
silver ions combined with UV-A and visible light irradiation. Water Research 42, 356-
362.
Kinraide TB (1999) Interactions among Ca2+, Na+ and K+ in salinity toxicity: Quantitative
resolution of multiple toxic and ameliorative effects. Journal of Experimental Botany 50,
1495-1505.
179
Kirk GJD, Kronzucker HJ (2005) The potential for nitrification and nitrate uptake in the
rhizosphere of wetland plants: A modelling study. Annals of Botany 96, 639-646.
Kirscht A, Kaptan SS, Bienert GP, Chaumont F, Nissen P, de Groot BL, Kjellbom P, Gourdon P,
Johanson U (2016) Crystal structure of an ammonia-permeable aquaporin. PLOS Biology
14, doi: 10.1371/journal.pbio.1002411.
Kochian LV, Jiao XZ, Lucas WJ (1985) Potassium transport in corn roots. 4. Characterization of
the linear component. Plant Physiology 79, 771-776.
Kochian LV, Lucas WJ (1982) Potassium transport in corn roots. 1. Resolution of kinetics into a
saturable and linear component. Plant Physiology 70, 1723-1731.
Kochian LV, Lucas WJ (1993) Can K+ channels do it all? Plant Cell 5, 720-721.
Kochian LV, Shaff JE, Lucas WJ (1989) High-affinity K+ uptake in maize roots - A lack of
coupling with H+ efflux. Plant Physiology 91, 1202-1211.
Kong X-Q, Gao X-H, Sun W, An J, Zhao Y-X, Zhang H (2011) Cloning and functional
characterization of a cation-chloride cotransporter gene OsCCC1. Plant Molecular
Biology 75, 567-578.
Kosegarten H, Grolig F, Wieneke J, Wilson G, Hoffmann B (1997) Differential ammonia-
elicited changes of cytosolic pH in root hair cells of rice and maize as monitored by 2', 7'-
bis-(2-carboxyethyl)-5 (and -6)-carboxyfluorescein-fluorescence ratio. Plant Physiology
113, 451-461.
Kosegarten H, Grolig F, Esch A, Glüsenkamp KH, Mengel K (1999) Effects of NH4+, NO3
- and
HCO3- on apoplast pH in the outer cortex of root zones of maize, as measured by the
fluorescence ratio of fluorescein boronic acid. Planta 209, 444-452.
Kozono D, Yasui M, King LS, Agre P (2002) Aquaporin water channels: Atomic structure and
molecular dynamics meet clinical medicine. Journal of Clinical Investigation 109, 1395-
1399.
Krishnamurthy P, Ranathunge K, Franke R, Prakash HS, Schreiber L, Mathew MK (2009) The
role of root apoplastic transport barriers in salt tolerance of rice (Oryza sativa L.). Planta
230, 119-134.
Krishnamurthy P, Ranathunge K, Nayak S, Schreiber L, Mathew MK (2011) Root apoplastic
barriers block Na+ transport to shoots in rice (Oryza sativa L.). Journal of Experimental
Botany 62, 4215-4228.
Krol E, Trebacz K (2000) Ways of ion channel gating in plant cells. Annals of Botany 86, 449-
469.
Kronzucker HJ, Britto DT (2011) Sodium transport in plants: A critical review. New Phytologist
189, 54-81.
180
Kronzucker HJ, Siddiqi MY, Glass ADM (1995) Analysis of 13NH4+ efflux in spruce roots - A
test case for phase identification in compartmental analysis. Plant Physiology 109, 481-
490.
Kronzucker HJ, Siddiqi MY, Glass ADM (1996) Kinetics of NH4+ influx in spruce. Plant
Physiology 110, 773-779.
Kronzucker HJ, Siddiqi MY, Glass ADM (1997) Conifer root discrimination against soil nitrate
and the ecology of forest succession. Nature 385, 59-61.
Kronzucker HJ, Szczerba MW, Britto DT (2003) Cytosolic potassium homeostasis revisited: 42K-tracer analysis in Hordeum vulgare L. reveals set-point variations in [K+]. Planta
217, 540-546.
Kronzucker HJ, Szczerba MW, Moazami-Goudarzi M, Britto DT (2006) The cytosolic Na+:K+
ratio does not explain salinity-induced growth impairment in barley: A dual-tracer study
using 42K+ and 24Na+. Plant Cell and Environment 29, 2228-2237.
Kronzucker HJ, Coskun D, Schulze LM, Wong JR, Britto DT (2013) Sodium as nutrient and
toxicant. Plant and Soil 369, 1-23.
Kurimoto K, Day DA, Lambers H, Noguchi K (2004) Effect of respiratory homeostasis on plant
growth in cultivars of wheat and rice. Plant Cell and Environment 27, 853-862.
Lagarde D, Basset M, Lepetit M, Conejero G, Gaymard F, Astruc S, Grignon C (1996) Tissue-
specific expression of arabidopsis AKT1 gene is consistent with a role in K+ nutrition.
Plant Journal 9, 195-203.
Lan W-Z, Lee S-C, Che Y-F, Jiang Y-Q, Luan S (2011) Mechanistic analysis of AKT1
regulation by the CBL-CIPK-PP2CA interactions. Molecular Plant 4, 527-536.
Lang B, Kaiser WM (1994) Solute content and energy status of roots of barley plants cultivated
at different pH on nitrate-nitrogen or ammonium-nitrogen. New Phytologist 128, 451-
459.
Lass B, Ullrich-Eberius CI (1984) Evidence for proton/sulfate cotransport and its kinetics in
Lemna gibba G1. Planta 161, 53-60.
Laties GG (1969) Dual mechanisms of salt uptake in relation to compartmentation and long-
distance transport. Annual Review of Plant Physiology 20, 89-116.
Lazof D, Cheeseman JM (1986) Sodium transport and compartmentation in Spergularia marina
- Partial characterization of a functional symplasm. Plant Physiology 81, 742-747.
Lebaudy A, Véry A-A, Sentenac H (2007) K+ channel activity in plants: Genes, regulations and
functions. FEBS Letters 581, 2357-2366.
Lee KS, Choi WY, Ko JC, Kim TS, Gregorio GB (2003) Salinity tolerance of japonica and
indica rice (Oryza sativa L.) at the seedling stage. Planta 216, 1043-1046.
181
Lee KS, Tsien RW (1983) Mechanism of calcium channel blockade by verapamil, D600,
diltiazem and nitrendipine in single dialyzed heart cells. Nature 302, 790-794.
Lee RB (1982) Selectivity and kinetics of ion uptake by barley plants following nutrient
deficiency. Annals of Botany 50, 429-449.
Lee RB, Ayling SM (1993) The effect of methionine sulfoximine on the absorption of
ammonium by maize and barley roots over short periods. Journal of Experimental Botany
44, 53-63.
Lee RB, Clarkson DT (1986) Nitrogen-13 studies of nitrate fluxes in barley roots. 1.
Compartmental analysis from measurements of 13N efflux. Journal of Experimental
Botany 37, 1753-1767.
Lee RB, Ratcliffe RG (1991) Observations of the subcellular distribution of the ammonium ion
in maize root tissue using in-vivo 14N-nuclear magnetic resonance spectroscopy. Planta
183, 359-367.
Lee SC, Lan W-Z, Kim B-G, Li L, Cheong YH, Pandey GK, Lu G, Buchanan BB, Luan S
(2007) A protein phosphorylation/dephosphorylation network regulates a plant potassium
channel. Proceedings of the National Academy of Sciences of the United States of
America 104, 15959-15964.
Leigh RA, Jones RGW (1984) A hypothesis relating critical potassium concentrations for growth
to the distribution and functions of this ion in the plant cell. New Phytologist 97, 1-13.
Leonhardt N, Marin E, Vavasseur A, Forestier C (1997) Evidence for the existence of a
sulfonylurea-receptor-like protein in plants: Modulation of stomatal movements and
guard cell potassium channels by sulfonylureas and potassium channel openers.
Proceedings of the National Academy of Sciences of the United States of America 94,
14156-14161.
Lew RR (1991) Electrogenic transport properties of growing Arabidopsis root hairs - The
plasma-membrane proton pump and potassium channels. Plant Physiology 97, 1527-
1534.
Lewis OAM, Leidi EO, Lips SH (1989) Effect of nitrogen source on growth response to salinity
stress in maize and wheat. New Phytologist 111, 155-160.
Li L, Kim B-G, Cheong YH, Pandey GK, Luan S (2006) A Ca2+ signaling pathway regulates a
K+ channel for low-K response in Arabidopsis. Proceedings of the National Academy of
Sciences of the United States of America 103, 12625-12630.
Lichtner FT, Spanswick RM (1981) Sucrose uptake by developing soybean cotyledons. Plant
Physiology 68, 693-698.
Ling GN (1969) Measurements of potassium ion activity in cytoplasm of living cells. Nature
221, 386-387.
182
Lopez MV, Satti SME (1996) Calcium and potassium-enhanced growth and yield of tomato
under sodium chloride stress. Plant Science 114, 19-27.
Loqué D, von Wirén N (2004) Regulatory levels for the transport of ammonium in plant roots.
Journal of Experimental Botany 55, 1293-1305.
Loqué D, Ludewig U, Yuan LX, von Wirén N (2005) Tonoplast intrinsic proteins AtTIP2;1 and
AtTIP2;3 facilitate NH3 transport into the vacuole. Plant Physiology 137, 671-680.
Ludewig U, Neuhäuser B, Dynowski M (2007) Molecular mechanisms of ammonium transport
and accumulation in plants. FEBS Letters 581, 2301-2308.
Lue P, Cao J, He S, Liu J, Li H, Cheng G, Ding Y, Joyce DC (2010) Nano-silver pulse
treatments improve water relations of cut rose cv. Movie Star flowers. Postharvest
Biology and Technology 57, 196-202.
Maathuis FJM, Amtmann A (1999) K+ nutrition and Na+ toxicity: The basis of cellular K+/Na+
ratios. Annals of Botany 84, 123-133.
Maathuis FJM, Sanders D (1993) Energization of potassium uptake in Arabidopsis thaliana.
Planta 191, 302-307.
Maathuis FJM, Sanders D (1994) Mechanism of high-affinity potassium uptake in roots of
Arabidopsis thaliana. Proceedings of the National Academy of Sciences of the United
States of America 91, 9272-9276.
Maathuis FJM, Sanders D (1995) Contrasting roles in ion transport of 2 K+ channel types in root
cells of Arabidopsis thaliana. Planta 197, 456-464.
Maathuis FJM, Sanders D (1996a) Characterization of csi52, a Cs+ resistant mutant of
Arabidopsis thaliana altered in K+ transport. Plant Journal 10, 579-589.
Maathuis FJM, Sanders D (1996b) Mechanisms of potassium absorption by higher plant roots.
Physiologia Plantarum 96, 158-168.
Macklon AES (1975) Cortical cell fluxes and transport to stele in excised root segments of
Allium cepa L. 1. Potassium, sodium and chloride. Planta 122, 109-130.
MacRobbie EAC (2006) Control of volume and turgor in stomatal guard cells. Journal of
Membrane Biology 210, 131-142.
Malagoli P, Britto DT, Schulze LM, Kronzucker HJ (2008) Futile Na+ cycling at the root plasma
membrane in rice (Oryza sativa L.): Kinetics, energetics, and relationship to salinity
tolerance. Journal of Experimental Botany 59, 4109-4117.
Malhotra B, Glass ADM (1995) Potassium fluxes in Chlamydomonas reinhardtii. 1. Kinetics and
electrical potentials. Plant Physiology 108, 1527-1536.
183
Martínez-Ballesta MC, Diaz R, Martínez V, Carvajal M (2003) Different blocking effects of
HgCl2 and NaCl on aquaporins of pepper plants. Journal of Plant Physiology 160, 1487-
1492.
Martre P, Morillon R, Barrieu F, North GB, Nobel PS, Chrispeels MJ (2002) Plasma membrane
aquaporins play a significant role during recovery from water deficit. Plant Physiology
130, 2101-2110.
Mäser P, Thomine S, Schroeder JI, Ward JM, Hirschi K, Sze H, Talke IN, Amtmann A,
Maathuis FJM, Sanders D, Harper JF, Tchieu J, Gribskov M, Persans MW, Salt DE, Kim
SA, Guerinot ML (2001) Phylogenetic relationships within cation transporter families of
Arabidopsis. Plant Physiology 126, 1646-1667.
Maurel C, Kado RT, Guern J, Chrispeels MJ (1995) Phosphorylation regulates the water channel
activity of the seed-specific aquaporin alpha-TIP. EMBO Journal 14, 3028-3035.
Maurel C, Reizer J, Schroeder JI, Chrispeels MJ (1993) The vacuolar membrane protein gamma-
TIP creates water specific channels in Xenopus oocytes. EMBO Journal 12, 2241-2247.
Maurel C, Verdoucq L, Luu D-T, Santoni V (2008) Plant aquaporins: Membrane channels with
multiple integrated functions. Annual Review of Plant Biology 59, 595-624.
Mayer KFX, Waugh R, Langridge P, Close TJ, Wise RP, Graner A, Matsumoto T, Sato K,
Schulman A, Muehlbauer GJ, Stein N, Ariyadasa R, Schulte D, Poursarebani N, Zhou R,
Steuernagel B, Mascher M, Scholz U, Shi B, Madishetty K, Svensson JT, Bhat P,
Moscou M, Resnik J, Hedley P, Liu H, Morris J, Frenkel Z, Korol A, Berges H, Taudien
S, Groth M, Felder M, Platzer M, Brown JWS, Fincher GB, Sampath D, Swarbreck D,
Scalabrin S, Zuccolo A, Vendramin V, Morgante M, Int Barley Genome Sequencing C
(2012) A physical, genetic and functional sequence assembly of the barley genome.
Nature 491, 711-716.
McClean CJ, van den Berg LJL, Ashmore MR, Preston CD (2011) Atmospheric nitrogen
deposition explains patterns of plant species loss. Global Change Biology 17, 2882-2892.
Meeks JC (1993) 13N techniques. In: Nitrogen isotope techniques (eds. Knowles R, Blackburn
TH). Academic Press, Cambridge USA. pp. 273-303.
Meharg AA, Jardine L (2003) Arsenite transport into paddy rice (Oryza sativa) roots. New
Phytologist 157, 39-44.
Memon AR, Saccomani M, Glass ADM (1985) Efficiency of potassium utilization by barley
varieties - The role of subcellular compartmentation. Journal of Experimental Botany 36,
1860-1876.
Mian A, Oomen RJFJ, Isayenkov S, Sentenac H, Maathuis FJM, Véry A-A (2011) Over-
expression of an Na+- and K+-permeable HKT transporter in barley improves salt
tolerance. Plant Journal 68, 468-479.
184
Molina I, Li-Beisson Y, Beisson F, Ohlrogge JB, Pollard M (2009) Identification of an
Arabidopsis feruloyl-coenzyme A transferase required for suberin synthesis. Plant
Physiology 151, 1317-1328.
Morais-Cabral JH, Zhou YF, MacKinnon R (2001) Energetic optimization of ion conduction rate
by the K+ selectivity filter. Nature 414, 37-42.
Moran N, Ehrenstein G, Iwasa K, Bare C, Mischke C (1984) Ion channels in plasmalemma of
wheat protoplasts. Science 226, 835-838.
Munns R (2002) Comparative physiology of salt and water stress. Plant Cell and Environment
25, 239-250.
Munns R, Tester M (2008) Mechanisms of salinity tolerance. Annual Review of Plant Biology
59, 651-681.
Nassery H (1975) Effect of salt and osmotic stress on retention of potassium by excised barley
and bean roots. New Phytologist 75, 63-67.
Nassery H (1979) Salt-induced loss of potassium from plant roots. New Phytologist 83, 23-27.
Niemietz CM, Tyerman SD (2002) New potent inhibitors of aquaporins: Silver and gold
compounds inhibit aquaporins of plant and human origin. FEBS Letters 531, 443-447.
Nieves-Cordones M, Alemán F, Martínez V, Rubio F (2014) K+ uptake in plant roots - The
systems involved, their regulation and parallels in other organisms. Journal of Plant
Physiology 171, 688-695.
Nocito FF, Sacchi GA, Cocucci M (2002) Membrane depolarization induces K+ efflux from
subapical maize root segments. New Phytologist 154, 45-51.
Oertli JJ (1967) Salt absorption isotherm. Physiologia Plantarum 20, 1014-1026.
Oertli JJ (1968) Extracellular salt accumulation - A possible mechanism of salt injury in plants.
Agrochimica 12, 461.
Oh D-H, Lee SY, Bressan RA, Yun D-J, Bohnert HJ (2010) Intracellular consequences of SOS1
deficiency during salt stress. Journal of Experimental Botany 61, 1205-1213.
Palmer LG, Century TJ, Civan MM (1978) Activity coefficients of intracellular Na+ and K+
during development of frog oocytes. Journal of Membrane Biology 40, 25-38.
Palmgren MG (2001) Plant plasma membrane H+-ATPases: Powerhouses for nutrient uptake.
Annual Review of Plant Physiology and Plant Molecular Biology 52, 817-845.
Pardo JM, Cubero B, Leidi EO, Quintero FJ (2006) Alkali cation exchangers: Roles in cellular
homeostasis and stress tolerance. Journal of Experimental Botany 57, 1181-1199.
Patra M, Sharma A (2000) Mercury toxicity in plants. Botanical Review 66, 379-422.
185
Pearson J, Stewart GR (1993) The deposition of atmospheric ammonia and its effects on plants.
New Phytologist 125, 283-305.
Peiter E, Montanini B, Gobert A, Pedas P, Husted S, Maathuis FJM, Blaudez D, Chalot M,
Sanders D (2007) A secretory pathway-localized cation diffusion facilitator confers plant
manganese tolerance. Proceedings of the National Academy of Sciences of the United
States of America 104, 8532-8537.
Peterson CA, Emanuel ME, Humphreys GB (1981) Pathway of movement of apoplastic
fluorescent dye tracers through the endodermis at the site of secondary root formation in
corn (Zea mays) and broan bean (Vicia faba). Canadian Journal of Botany 59, 618-625.
Pickard BG (1973) Action potentials in higher plants. Botanical Review 39, 172-201.
Pitman MG, Saddler HDW (1967) Active sodium and potassium transport in cells of barley
roots. Proceedings of the National Academy of Sciences of the United States of America
57, 44-49.
Polley DL, Hopkins JW (1979) Rubidium (potassium) uptake by Arabidopsis - A comparison of
uptake by cells in suspension culture and by roots of intact seedlings. Plant Physiology
64, 374-378.
Poole RJ (1969) Carrier-mediated potassium efflux across the cell membrane of red beet. Plant
Physiology 44, 485-490.
Poole RJ (1971) Effect of sodium on potassium fluxes at the cell membrane and vacuole
membrane of red beet. Plant Physiology 47, 731-734.
Poorter H, Vanderwerf A, Atkin OK, Lambers H (1991) Respiratory energy requirements of
roots vary with the potential growth rate of a plant species. Physiologia Plantarum 83,
469-475.
Preston GM, Carroll TP, Guggino WB, Agre P (1992) Appearance of water channels in Xenopus
oocytes expressing red cell CHIP28 protein. Science 256, 385-387.
Pyo YJ, Gierth M, Schroeder JI, Cho MH (2010) High-affinity K+ transport in Arabidopsis:
AtHAK5 and AKT1 are vital for seedling establishment and postgermination growth
under low-potassium conditions. Plant Physiology 153, 863-875.
Qi Z, Hampton CR, Shin R, Barkla BJ, White PJ, Schachtman DP (2008) The high-affinity K+
transporter AtHAK5 plays a physiological role in planta at very low K+ concentrations
and provides a caesium uptake pathway in Arabidopsis. Journal of Experimental Botany
59, 595-607.
Rains DW, Epstein E (1967) Sodium absorption by barley roots - Its mediation by mechanism 2
of alkali cation transport. Plant Physiology 42, 319-323.
186
Ranathunge K, Lin J, Steudle E, Schreiber L (2011) Stagnant deoxygenated growth enhances
root suberization and lignifications, but differentially affects water and NaCl
permeabilities in rice (Oryza sativa L.) roots. Plant Cell and Environment 34, 1223-1240.
Ranathunge K, Schreiber L, Bi Y-M, Rothstein SJ (2016) Ammonium-induced architectural and
anatomical changes with altered suberin and lignin levels significantly change water and
solute permeabilities of rice (Oryza sativa L.) roots. Planta 243, 231-249.
Rawat SR, Silim SN, Kronzucker HJ, Siddiqi MY, Glass ADM (1999) AtAMT1 gene expression
and NH4+ uptake in roots of Arabidopsis thaliana: Evidence for regulation by root
glutamine levels. Plant Journal 19, 143-152.
Redmann RE, Haraldson J, Gusta LV (1986) Leakage of UV-absorbing substances as a measure
of salt injury in leaf tissue of woody species. Physiologia Plantarum 67, 87-91.
Rengel Z (1992) The role of calcium in salt toxicity. Plant Cell and Environment 15, 625-632.
Roberts JK, Wemmer D, Ray PM, Jardetzky O (1982) Regulation of cytoplasmic and vacuolar
pH in maize root tips under different experimental conditions. Plant Physiology 69, 1344-
1347.
Roberts SK, Tester M (1995) Inward and outward K+-selective currents in the plasma membrane
of protoplasts from maize root cortex and stele. Plant Journal 8, 811-825.
Roberts SK, Tester M (1997) A patch clamp study of Na+ transport in maize roots. Journal of
Experimental Botany 48, 431-440.
Robinson JB, Laties GG (1975) Plasmalemma and tonoplast influxes of potassium in barley
roots and interpretation of the absorption isotherm at high concentrations. Australian
Journal of Plant Physiology 2, 177-184.
Rubio F, Alemán F, Nieves-Cordones M, Martínez V (2010) Studies on Arabidopsis athak5,
atakt1 double mutants disclose the range of concentrations at which AtHAK5, AtAKT1
and unknown systems mediate K+ uptake. Physiologia Plantarum 139, 220-228.
Rubio F, Gassmann W, Schroeder JI (1995) Sodium-driven potassium uptake by the plant
potassium transporter HKT1 and mutations conferring salt tolerance. Science 270, 1660-
1663.
Rubio F, Nieves-Cordones M, Alemán F, Martínez V (2008) Relative contribution of AtHAK5
and AtAKT1 to K+ uptake in the high-affinity range of concentrations. Physiologia
Plantarum 134, 598-608.
Rygiewicz PT, Bledsoe CS (1986) Effects of pretreatment conditions on ammonium and nitrate
uptake by Douglas-fir seedlings. Tree Physiology 1, 145-150.
Sanders D (1980) The mechanism of Cl- transport at the plasma membrane of Chara corallina.
1. Cotransport with H+. Journal of Membrane Biology 53, 129-141.
187
Santa-María GE, Danna CH, Czibener C (2000) High-affinity potassium transport in barley roots
- Ammonium-sensitive and -insensitive pathways. Plant Physiology 123, 297-306.
Santa-María GE, Rubio F, Dubcovsky J, Rodriguez-Navarro A (1997) The HAK1 gene of barley
is a member of a large gene family and encodes a high-affinity potassium transporter.
Plant Cell 9, 2281-2289.
Santoni V, Gerbeau P, Javot H, Maurel C (2000) The high diversity of aquaporins reveals novel
facets of plant membrane functions. Current Opinion in Plant Biology 3, 476-481.
Saparov SM, Liu K, Agre P, Pohl P (2007) Fast and selective ammonia transport by aquaporin-8.
Journal of Biological Chemistry 282, 5296-5301.
Sasakawa H, Yamamoto Y (1978) Comparison of uptake of nitrate and ammonium by rice
seedlings - Influences of light, temperature, oxygen concentration, exogenous sucrose,
and metabolic inhibitors. Plant Physiology 62, 665-669.
Scherer HW, Mackown CT, Leggett JE (1984) Potassium-ammonium uptake interactions in
tobacco seedlings. Journal of Experimental Botany 35, 1060-1070.
Scherzer S, Boehm J, Krol E, Shabala L, Kreuzer I, Larisch C, Bemm F, Al-Rasheid KAS,
Shabala S, Rennenberg H, Neher E, Hedrich R (2015) Calcium sensor kinase activates
potassium uptake systems in gland cells of Venus flytraps. Proceedings of the National
Academy of Sciences of the United States of America 112, 7309-7314.
Scholander, Hammel HT, Bradstre.Ed, Hemmings.Ea (1965) Sap pressure in vascular plants -
Negative hydrostatic pressure can be measured in plants. Science 148, 339-346.
Schreiber L, Hartmann K, Skrabs M, Zeier J (1999) Apoplastic barriers in roots: Chemical
composition of endodermal and hypodermal cell walls. Journal of Experimental Botany
50, 1267-1280.
Schreurs WJA, Rosenberg H (1982) Effect of silver ions on transport and retention of phosphate
by Escherichia coli. Journal of Bacteriology 152, 7-13.
Schroeder JI, Fang HH (1991) Inward-rectifying K+ channels in guard cells provide a mechanism
for low-affinity K+ uptake. Proceedings of the National Academy of Sciences of the
United States of America 88, 11583-11587.
Schroeder JI, Hedrich R, Fernandez JM (1984) Potassium-selective single channels in guard-cell
protoplasts of Vicia faba. Nature 312, 361-362.
Schulze LM (2014) Na+ transport and toxicity in plants (Doctoral dissertation).
Schulze LM, Britto DT, Li M, Kronzucker HJ (2012) A pharmacological analysis of high-
affinity sodium transport in barley (Hordeum vulgare L.): A 24Na+/42K+ study. Journal of
Experimental Botany 63, 2479-2489.
188
Schuster E (1991) The behavior of mercury in the soil with special emphasis on complexation
and adsorption processes - A review of the literature. Water Air and Soil Pollution 56,
667-680.
Sentenac H, Bonneaud N, Minet M, Lacroute F, Salmon JM, Gaymard F, Grignon C (1992)
Cloning and expression in yeast of a plant potassium ion transport system. Science 256,
663-665.
Shabala S, Cuin TA (2008) Potassium transport and plant salt tolerance. Physiologia Plantarum
133, 651-669.
Shabala S, Cuin TA, Pottosin I (2007) Polyamines prevent NaCl-induced K+ efflux from pea
mesophyll by blocking non-selective cation channels. FEBS Letters 581, 1993-1999.
Shabala S, Demidchik V, Shabala L, Cuin TA, Smith SJ, Miller AJ, Davies JM, Newman IA
(2006) Extracellular Ca2+ ameliorates NaCl-induced K+ loss from Arabidopsis root and
leaf cells by controlling plasma membrane K+-permeable channels. Plant Physiology 141,
1653-1665.
Shannon MC, Rhoades JD, Draper JH, Scardaci SC, Spyres MD (1998) Assessment of salt
tolerance in rice cultivars in response to salinity problems in California. Crop Science 38,
394-398.
Shiono K, Ando M, Nishiuchi S, Takahashi H, Watanabe K, Nakamura M, Matsuo Y, Yasuno N,
Yamanouchi U, Fujimoto M, Takanashi H, Ranathunge K, Franke RB, Shitan N,
Nishizawa NK, Takamure I, Yano M, Tsutsumi N, Schreiber L, Yazaki K, Nakazono M,
Kato K (2014) RCN1/OsABCG5, an ATP-binding cassette (ABC) transporter, is required
for hypodermal suberization of roots in rice (Oryza sativa). Plant Journal 80, 40-51.
Siddiqi MY, Glass ADM (1986) A model for the regulation of K+ influx and tissue potassium
concentrations by negative feedback effects upon plasmalemma influx. Plant Physiology
81, 1-7.
Siddiqi MY, Glass ADM, Ruth TJ (1991) Studies of the uptake of nitrate in barley. 3.
Compartmentation of NO3-. Journal of Experimental Botany 42, 1455-1463.
Smethurst CF, Rix K, Garnett T, Auricht G, Bayart A, Lane P, Wilson SJ, Shabala S (2008)
Multiple traits associated with salt tolerance in lucerne: Revealing the underlying cellular
mechanisms. Functional Plant Biology 35, 640-650.
Spalding EP, Hirsch RE, Lewis DR, Qi Z, Sussman MR, Lewis BD (1999) Potassium uptake
supporting plant growth in the absence of AKT1 channel activity - Inhibition by
ammonium and stimulation by sodium. Journal of General Physiology 113, 909-918.
Speer M, Brune A, Kaiser WM (1994) Replacement of nitrate by ammonium as the nitrogen
source increases the salt sensitivity of pea plants. 1. Ion concentrations in roots and
leaves. Plant Cell and Environment 17, 1215-1221.
189
Speer M, Kaiser WM (1991) Ion relations of symplastic and apoplastic space in leaves from
Spinacia oleracea L. and Pisum sativum L. under salinity. Plant Physiology 97, 990-997.
Speer M, Kaiser WM (1994) Replacement of nitrate by ammonium as the nitrogen source
increases the salt sensitivity of pea plants. 2. Intercellular and intracellular solute
compartmentation in leaflets. Plant Cell and Environment 17, 1223-1231.
Stevens CJ, Dise NB, Mountford JO, Gowing DJ (2004) Impact of nitrogen deposition on the
species richness of grasslands. Science 303, 1876-1879.
Strader LC, Beisner ER, Bartel B (2009) Silver ions increase auxin efflux independently of
effects on ethylene response. Plant Cell 21, 3585-3590.
Subbarao GV, Ito O, Berry WL, Wheeler RM (2003) Sodium - A functional plant nutrient.
Critical Reviews in Plant Sciences 22, 391-416.
Sweiry JH, Munoz M, Mann GE (1991) Cis-inhibitions and trans-stimulation of cationic amino-
acid transport in the perfused rat pancreas. American Journal of Physiology 261, C506-
C514.
Szczerba MW, Britto DT, Ali SA, Balkos KD, Kronzucker HJ (2008a) NH4+-stimulated and -
inhibited components of K+ transport in rice (Oryza sativa L.). Journal of Experimental
Botany 59, 3415-3423.
Szczerba MW, Britto DT, Balkos KD, Kronzucker HJ (2008b) Alleviation of rapid, futile
ammonium cycling at the plasma membrane by potassium reveals K+-sensitive and -
insensitive components of NH4+ transport. Journal of Experimental Botany 59, 303-313.
Szczerba MW, Britto DT, Kronzucker HJ (2006) Rapid, futile K+ cycling and pool-size
dynamics define low-affinity potassium transport in barley. Plant Physiology 141, 1494-
1507.
Szczerba MW, Britto DT, Kronzucker HJ (2009) K+ transport in plants: Physiology and
molecular biology. Journal of Plant Physiology 166, 447-466.
Tazawa M, Sutou E, Shibasaka M (2001) Onion root water transport sensitive to water channel
and K+ channel inhibitors. Plant and Cell Physiology 42, 28-36.
ten Hoopen F, Cuin TA, Pedas P, Hegelund JN, Shabala S, Schjoerring JK, Jahn TP (2010)
Competition between uptake of ammonium and potassium in barley and Arabidopsis
roots: Molecular mechanisms and physiological consequences. Journal of Experimental
Botany 61, 2303-2315.
Todd J, Post-Beittenmiller D, Jaworski JG (1999) KCS1 encodes a fatty acid elongase 3-
ketoacyl-CoA synthase affecting wax biosynthesis in Arabidopsis thaliana. Plant Journal
17, 119-130.
Tomos AD, Leigh RA (1999) The pressure probe: A versatile tool in plant cell physiology.
Annual Review of Plant Physiology and Plant Molecular Biology 50, 447-472.
190
Törnroth-Horsefield S, Wang Y, Hedfalk K, Johanson U, Karlsson M, Tajkhorshid E, Neutze R,
Kjellbom P (2006) Structural mechanism of plant aquaporin gating. Nature 439, 688-694.
Tournaire-Roux C, Sutka M, Javot H, Gout E, Gerbeau P, Luu DT, Bligny R, Maurel C (2003)
Cytosolic pH regulates root water transport during anoxic stress through gating of
aquaporins. Nature 425, 393-397.
Tuna AL, Kaya C, Ashraf M, Altunlu H, Yokas I, Yagmur B (2007) The effects of calcium
sulphate on growth, membrane stability and nutrient uptake of tomato plants grown under
salt stress. Environmental and Experimental Botany 59, 173-178.
Tyerman SD, Skerrett M, Garrill A, Findlay GP, Leigh RA (1997) Pathways for the permeation
of Na+ and Cl- into protoplasts derived from the cortex of wheat roots. Journal of
Experimental Botany 48, 459-480.
Ullrich WR, Larsson M, Larsson CM, Lesch S, Novacky A (1984) Ammonium uptake in Lemna
gibba G1, related membrane potential changes, and inhibition of anion uptake.
Physiologia Plantarum 61, 369-376.
Ullrich WR, Novacky A (1981) Nitrate-dependent membrane potential changes and their
induction in Lemna gibba G1. Plant Science Letters 22, 211-217.
Vale FR, Jackson WA, Volk RJ (1987) Potassium influx into maize root systems - Influence of
root potassium concentration and ambient ammonium. Plant Physiology 84, 1416-1420.
Vale FR, Jackson WA, Volk RJ (1988a) Nitrogen-stimulated potassium influx into maize roots -
Differential response of components resistant and sensitive to ambient ammonium. Plant
Cell and Environment 11, 493-500.
Vale FR, Volk RJ, Jackson WA (1988b) Simultaneous influx of ammonium and potassium into
maize roots - Kinetics and interactions. Planta 173, 424-431.
Vallejo AJ, Peralta ML, Santa-María GE (2005) Expression of potassium-transporter coding
genes, and kinetics of rubidium uptake, along a longitudinal root axis. Plant Cell and
Environment 28, 850-862.
Van Breemen N, Burrough PA, Velthorst EJ, Van Dobben HF, De Wit T, Ridder TB, Reijnders
HFR (1982) Soil acidification from atmospheric ammonium sulfate in forest canopy
throughfall. Nature 299, 548-550.
Van Beusichem ML, Kirkby EA, Baas R (1988) Influence of nitrate and ammonium nutrition on
the uptake, assimilation, and distribution of nutrients in Ricinus communis. Plant
Physiology 86, 914-921.
Verdoucq L, Grondin A, Maurel C (2008) Structure-function analysis of plant aquaporin
AtPIP2;1 gating by divalent cations and protons. Biochemical Journal 415, 409-416.
Véry AA, Sentenac H (2003) Molecular mechanisms and regulation of K+ transport in higher
plants. Annual Review of Plant Biology 54, 575-603.
191
Vitousek PM, Aber JD, Howarth RW, Likens GE, Matson PA, Schindler DW, Schlesinger WH,
Tilman D (1997) Human alteration of the global nitrogen cycle: Sources and
consequences. Ecological Applications 7, 737-750.
von Wirén N, Gazzarrini S, Gojon A, Frommer WB (2000) The molecular physiology of
ammonium uptake and retrieval. Current Opinion in Plant Biology 3, 254-261.
Walker DJ, Leigh RA, Miller AJ (1996a) Potassium homeostasis in vacuolate plant cells.
Proceedings of the National Academy of Sciences of the United States of America 93,
10510-10514.
Walker NA, Pitman MG (1976) Measurement of fluxes across membranes. In: Encyclopedia of
Plant Physiology, Vol. 2 (eds. Luetgge U, Pitman MG). Springer-Verlag, Berlin, pp. 93-
126.
Walker NA, Sanders D, Maathuis FJM (1996b) High-affinity potassium uptake in plants. Science
273, 977-978.
Wang C-M, Zhang J-L, Liu X-S, Li Z, Wu G-Q, Cai J-Y, Flowers TJ, Wang S-M (2009)
Puccinellia tenuiflora maintains a low Na+ level under salinity by limiting unidirectional
Na+ influx resulting in a high selectivity for K+ over Na+. Plant Cell and Environment 32,
486-496.
Wang MY, Glass ADM, Shaff JE, Kochian LV (1994) Ammonium uptake by rice roots. 3.
Electrophysiology. Plant Physiology 104, 899-906.
Wang MY, Siddiqi MY, Glass ADM (1996) Interactions between K+ and NH4+: Effects on ion
uptake by rice roots. Plant Cell and Environment 19, 1037-1046.
Wang MY, Siddiqi MY, Ruth TJ, Glass ADM (1993a) Ammonium uptake by rice roots. 1.
Fluxes and subcellular distribution of 13NH4+. Plant Physiology 103, 1249-1258.
Wang MY, Siddiqi MY, Ruth TJ, Glass ADM (1993b) Ammonium uptake by rice roots. 2.
Kinetics of 13NH4+ influx across the plasmalemma. Plant Physiology 103, 1259-1267.
Weise T, Kai M, Piechulla B (2013) Bacterial ammonia causes significant plant growth
inhibition. PLOS ONE 8, doi: 10.1371/journal.pone.0063538.
Wells DM, Miller AJ (2000) Intracellular measurement of ammonium in Chara corallina using
ion-selective microelectrodes. Plant and Soil 221, 103-106.
White MF, Christensen HN (1982) The 2-way flux of cationic amino acids across the plasma
membrane of mammalian cells is largely explained by a single transport system. Journal
of Biological Chemistry 257, 69-80.
White PJ (1998) Calcium channels in the plasma membrane of root cells. Annals of Botany 81,
173-183.
White PJ, Broadley MR (2000) Mechanisms of caesium uptake by plants. New Phytologist 147,
241-256.
192
White PJ, Davenport RJ (2002) The voltage-independent cation channel in the plasma membrane
of wheat roots is permeable to divalent cations and may be involved in cytosolic Ca2+
homeostasis. Plant Physiology 130, 1386-1395.
White PJ, Earnshaw MJ, Clarkson DT (1991) Effects of growth and assay temperatures on
unidirectional K+ fluxes in roots of rye (Secale cereale). Journal of Experimental Botany
42, 1031-1041.
White PJ, Lemtirichlieh F (1995) Potassium currents across the plasma membrane of protoplasts
derived from rye roots - A patch-clamp study. Journal of Experimental Botany 46, 497-
511.
White PJ, Tester MA (1992) Potassium channels from the plasma membrane of rye roots
characterized following incorporation into planar lipid bilayers. Planta 186, 188-202.
Xu J, Li H-D, Chen L-Q, Wang Y, Liu L-L, He L, Wu W-H (2006) A protein kinase, interacting
with two calcineurin B-like proteins, regulates K+ transporter AKT1 in Arabidopsis. Cell
125, 1347-1360.
Yadav V, Molina I, Ranathunge K, Castillo IQ, Rothstein SJ, Reed JW (2014) ABCG
transporters are required for suberin and pollen wall extracellular barriers in Arabidopsis.
Plant Cell 26, 3569-3588.
Yeo AR, Flowers TJ (1982) Accumulation and localization of sodium ions within the shoots of
rice (Oryza sativa) varieties differing in salinity resistance. Physiologia Plantarum 56,
343-348.
Yeo AR, Flowers TJ (1983) Varietal differences in the toxicity of sodium ions in rice leaves.
Physiologia Plantarum 59, 189-195.
Yeo AR, Flowers TJ (1984) Nonosmotic effects of polyethylene glycols upon sodium transport
and sodium-potassium selectivity by rice roots. Plant Physiology 75, 298-303.
Yeo AR, Yeo ME, Flowers SA, Flowers TJ (1990) Screening of rice (Oryza sativa L.) genotypes
for physiological characters contributing to salinity resistance, and their relationship to
overall performance. Theoretical and Applied Genetics 79, 377-384.
Yeo AR, Yeo ME, Flowers TJ (1987) The contribution of an apoplastic pathway to sodium
uptake by rice roots in saline conditions. Journal of Experimental Botany 38, 1141-1153.
Yool AJ, Brown EA, Flynn GA (2010) Roles for novel pharmacological blockers of aquaporins
in the treatment of brain oedema and cancer. Clinical and Experimental Pharmacology
and Physiology 37, 403-409.
Yool AJ, Stamer WD, Regan JW (1996) Forskolin stimulation of water and cation permeability
in aquaporin1 water channels. Science 273, 1216-1218.
Yu J, Hu SN, Wang J, Wong GKS, Li SG, Liu B, Deng YJ, Dai L, Zhou Y, Zhang XQ, Cao ML,
Liu J, Sun JD, Tang JB, Chen YJ, Huang XB, Lin W, Ye C, Tong W, Cong LJ, Geng JN,
193
Han YJ, Li L, Li W, Hu GQ, Huang XG, Li WJ, Li J, Liu ZW, Liu JP, Qi QH, Liu JS, Li
T, Wang XG, Lu H, Wu TT, Zhu M, Ni PX, Han H, Dong W, Ren XY, Feng XL, Cui P,
Li XR, Wang H, Xu X, Zhai WX, Xu Z, Zhang JS, He SJ, Zhang JG, Xu JC, Zhang KL,
Zheng XW, Dong JH, Zeng WY, Tao L, Ye J, Tan J, Ren XD, Chen XW, He J, Liu DF,
Tian W, Tian CG, Xia HG, Bao QY, Li G, Gao H, Cao T, Zhao WM, Li P, Chen W,
Wang XD, Zhang Y, Hu JF, Liu S, Yang J, Zhang GY, Xiong YQ, Li ZJ, Mao L, Zhou
CS, Zhu Z, Chen RS, Hao BL, Zheng WM, Chen SY, Guo W, Li GJ, Liu SQ, Tao M,
Zhu LH, Yuan LP, Yang HM (2002) A draft sequence of the rice genome (Oryza sativa
L. ssp indica). Science 296, 79-92.
Zelenina M, Bondar AA, Zelenin S, Aperia A (2003) Nickel and extracellular acidification
inhibit the water permeability of human aquaporin-3 in lung epithelial cells. Journal of
Biological Chemistry 278, 30037-30043.
Zhang A, Ren H-M, Tan Y-Q, Qi G-N, Yao F-Y, Wu G-L, Yang L-W, Hussain J, Sun S-J, Wang
Y-F (2016) S-type anion channels SLAC1 and SLAH3 function as essential negative
regulators of inward K+ channels and stomatal opening in Arabidopsis. Plant Cell 28,
949-965.
Zhang J-L, Flowers TJ, Wang S-M (2010) Mechanisms of sodium uptake by roots of higher
plants. Plant and Soil 326, 45-60.
Zhang WH, Tyerman SD (1999) Inhibition of water channels by HgCl2 in intact wheat root cells.
Plant Physiology 120, 849-857.
Zhao J, Cheng N-H, Motes CM, Blancaflor EB, Moore M, Gonzales N, Padmanaban S, Sze H,
Ward JM, Hirschi KD (2008) AtCHX13 is a plasma membrane K+ transporter. Plant
Physiology 148, 796-807.
Zhu JK (2001) Plant salt tolerance. Trends in Plant Science 6, 66-71.
194
Appendix I: Other Published Material
The following is a list of review and methods articles, along with their abstracts, of which I was
the primary author, and which have been published in peer-reviewed journals over the course of
my thesis project.
1. Coskun D, Britto DT, Hamam A, Kronzucker HJ (2014) Measuring fluxes of mineral
nutrients and toxicants in plants with radioactive tracers. Journal of Visualized
Experiments 90, e51877. doi: 10.3791/51877.
Abstract: Unidirectional influx and efflux of nutrients and toxicants, and their resultant
net fluxes, are central to the nutrition and toxicology of plants. Radioisotope tracing is a
major technique used to measure such fluxes, both within plants, and between plants and
their environments. Flux data obtained with radiotracer protocols can help elucidate the
capacity, mechanism, regulation, and energetics of transport systems for specific mineral
nutrients or toxicants, and can provide insight into compartmentation and turnover rates
of subcellular mineral and metabolite pools. Here, we describe two major radioisotope
protocols used in plant biology: direct influx (DI) and compartmental analysis by tracer
efflux (CATE). We focus on flux measurement of potassium (K+) as a nutrient, and
ammonia/ammonium (NH3/NH4+) as a toxicant, in intact seedlings of the model species
barley (Hordeum vulgare L.). These protocols can be readily adapted to other
experimental systems (e.g. different species, excised plant material, and other mineral
nutrients/toxicants). Advantages and limitations of these protocols are discussed.
2. Coskun D, Britto DT, Kronzucker HJ (2014) The physiology of channel-mediated K+
acquisition in roots of higher plants. Physiologia Plantarum 151, 305-312.
Abstract: K+ channels are among the best-characterized classes of membrane protein in
plants. Nevertheless, in-planta demonstrations of traits emerging from molecular
characterizations have often been insufficient or lacking altogether. Such linkages are,
however, critical to our basic understanding of plant nutrition and to addressing ‘real-
world’ issues that are faced in environmental and agricultural settings. Here, we cover
some of the recent advances in K+ acquisition with particular focus on voltage-gated K+
195
channel functioning and regulation in roots, and highlight where linkages to in-planta
behaviour have been successfully made and, conversely, where such linkages are yet to
be made.
3. Coskun D, Britto DT, Kronzucker HJ (2016) The nitrogen-potassium intersection:
Membranes, metabolism, and mechanism. Plant, Cell & Environment, in press. doi:
10.1111/pce.12671.
Abstract: Nitrogen (N) and potassium (K) are the two most abundantly acquired mineral
elements by plants, and their acquisition pathways interact in complex ways. Here, we
review pivotal interactions with respect to root acquisition, storage, translocation and
metabolism, between the K+ ion and the two major N sources, ammonium (NH4+) and
nitrate (NO3-). The intersections between N and K physiology are explored at a number
of organizational levels, from molecular-genetic processes, to compartmentation, to
whole plant physiology, and discussed in the context of both N-K cooperation and
antagonism. Nutritional regulation and optimization of plant growth, yield, metabolism
and water-use efficiency are also discussed.
4. Coskun D, Britto DT, Kronzucker HJ (2016). Nutrient constraints on terrestrial carbon
fixation: The role of nitrogen. Journal of Plant Physiology, in press. doi:
10.1016/j.jplph.2016.05.016.
Abstract: Carbon dioxide (CO2) concentrations in the earth’s atmosphere are projected to
rise from current levels near 400 ppm to over 700 ppm by the end of the 21st century.
Projections over this time frame must take into account the increases in total net primary
production (NPP) expected from terrestrial plants, which result from elevated CO2
(eCO2) and have the potential to mitigate the impact of anthropogenic CO2 emissions.
However, a growing body of evidence indicates that limitations in soil nutrients,
particularly nitrogen (N), the soil nutrient most limiting to plant growth, may greatly
constrain future carbon fixation. Here, we review recent studies about the relationships
between soil N supply, plant N nutrition, and carbon fixation in higher plants under
eCO2, highlighting key discoveries made in the field, particularly from free-air CO2
196
enrichment (FACE) technology, and relate these findings to physiological and ecological
mechanisms.
5. Coskun D, Britto DT, Huynh WQ, Kronzucker HJ (2016). The role of silicon in higher
plants under salinity and drought stress. Frontiers in Plant Science, 7: 1072. doi:
10.3389/fpls.2016.01072.
Abstract: Although deemed a “non-essential” mineral nutrient, silicon (Si) is clearly
beneficial to plant growth and development, particularly under stress conditions,
including salinity and drought. Here, we review recent research on the physiological,
biochemical, and molecular mechanisms underlying Si-induced alleviation of osmotic
and ionic stresses associated with salinity and drought. We distinguish between changes
observed in the apoplast (i.e. suberization, lignification, and silicification of the
extracellular matrix; transpirational bypass flow of solutes and water), and those of the
symplast (i.e. transmembrane transport of solutes and water; gene expression; oxidative
stress; metabolism), and discuss these features in the context of Si biogeochemistry and
bioavailability in agricultural soils, evaluating the prospect of using Si fertilization to
increase crop yield and stress tolerance under salinity and drought conditions.