Embed Size (px)
Citation preview
OECD: MONITORING CHINA’S
AGRICULTURAL POLICIES
Andrzej Kwieciński Development Division, Trade and Agriculture Directorate Outlook Conference, Beijing, 6-7 June 2013
2013WAOC
2013WAOC
2013WAOC
2013WAOC
2013WAOC
2013WAOC
2013WAOC
2013WAOC
2013WAOC
2013WAOC
2013WAOC
2013WAOC
2013WAOC
2013WAOC
2013WAOC
2013WAOC
2013WAOC
2013WAOC
2013WAOC
2013WAOC
2013WAOC
2013WAOC
2013WAOC
2013WAOC
2013WAOC
2013WAOC
2013WAOC
2013WAOC
2013WAOC
2013WAOC
2013WAOC
2013WAOC
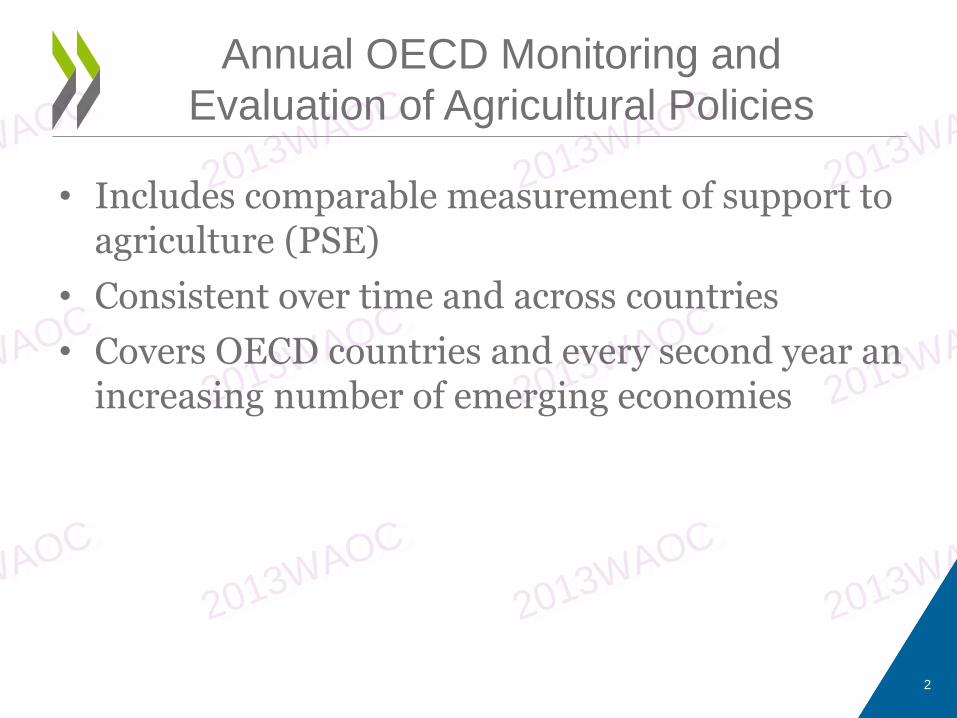
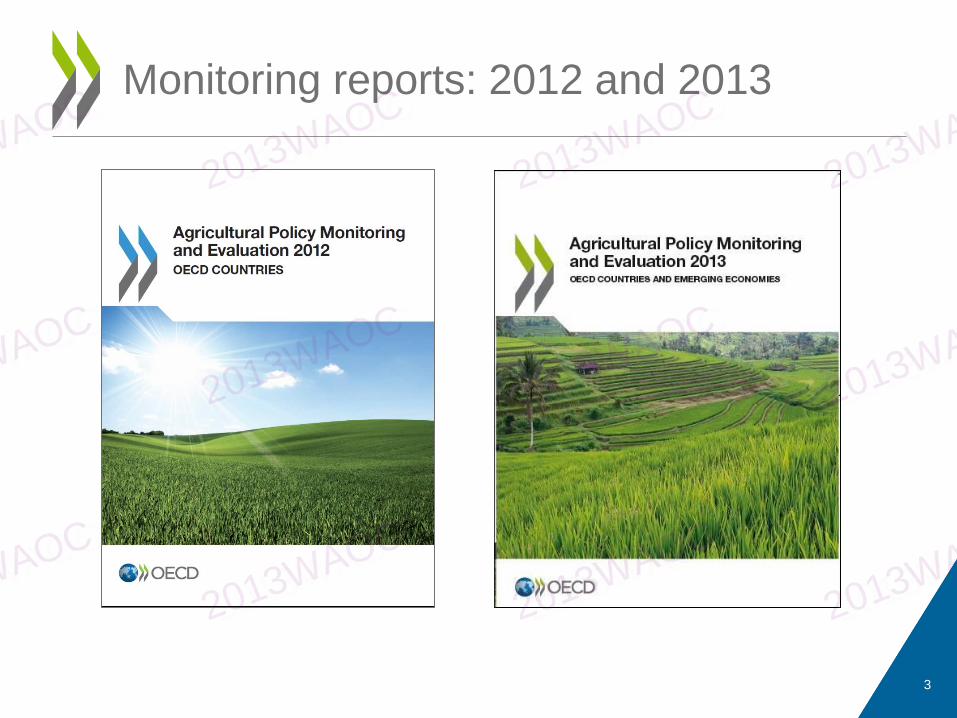
Annual OECD Monitoring and
Evaluation of Agricultural Policies
• Includes comparable measurement of support to agriculture (PSE)
• Consistent over time and across countries
• Covers OECD countries and every second year an increasing number of emerging economies
2
2013WAOC
2013WAOC
2013WAOC
2013WAOC
2013WAOC
2013WAOC
2013WAOC
2013WAOC
2013WAOC
2013WAOC
2013WAOC
2013WAOC
2013WAOC
2013WAOC
2013WAOC
2013WAOC
2013WAOC
2013WAOC
2013WAOC
2013WAOC
2013WAOC
2013WAOC
2013WAOC
2013WAOC
2013WAOC
2013WAOC
2013WAOC
2013WAOC
2013WAOC
2013WAOC
2013WAOC
2013WAOC
3
Monitoring reports: 2012 and 2013
2013WAOC
2013WAOC
2013WAOC
2013WAOC
2013WAOC
2013WAOC
2013WAOC
2013WAOC
2013WAOC
2013WAOC
2013WAOC
2013WAOC
2013WAOC
2013WAOC
2013WAOC
2013WAOC
2013WAOC
2013WAOC
2013WAOC
2013WAOC
2013WAOC
2013WAOC
2013WAOC
2013WAOC
2013WAOC
2013WAOC
2013WAOC
2013WAOC
2013WAOC
2013WAOC
2013WAOC
2013WAOC
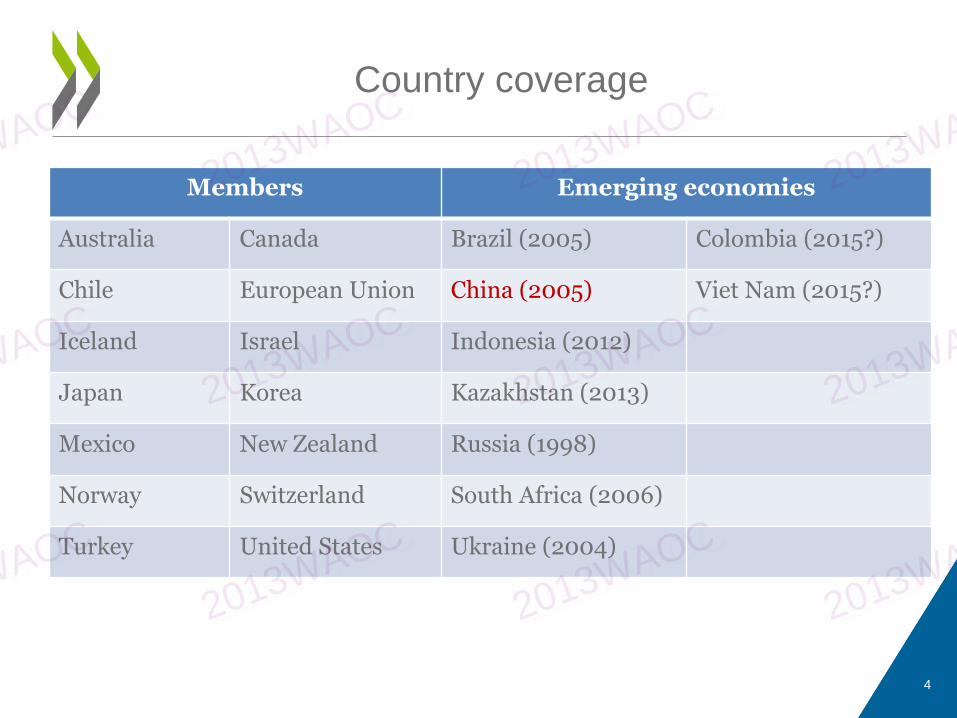
Country coverage
Members Emerging economies
Australia Canada Brazil (2005) Colombia (2015?)
Chile European Union China (2005) Viet Nam (2015?)
Iceland Israel Indonesia (2012)
Japan Korea Kazakhstan (2013)
Mexico New Zealand Russia (1998)
Norway Switzerland South Africa (2006)
Turkey United States Ukraine (2004)
4
2013WAOC
2013WAOC
2013WAOC
2013WAOC
2013WAOC
2013WAOC
2013WAOC
2013WAOC
2013WAOC
2013WAOC
2013WAOC
2013WAOC
2013WAOC
2013WAOC
2013WAOC
2013WAOC
2013WAOC
2013WAOC
2013WAOC
2013WAOC
2013WAOC
2013WAOC
2013WAOC
2013WAOC
2013WAOC
2013WAOC
2013WAOC
2013WAOC
2013WAOC
2013WAOC
2013WAOC
2013WAOC
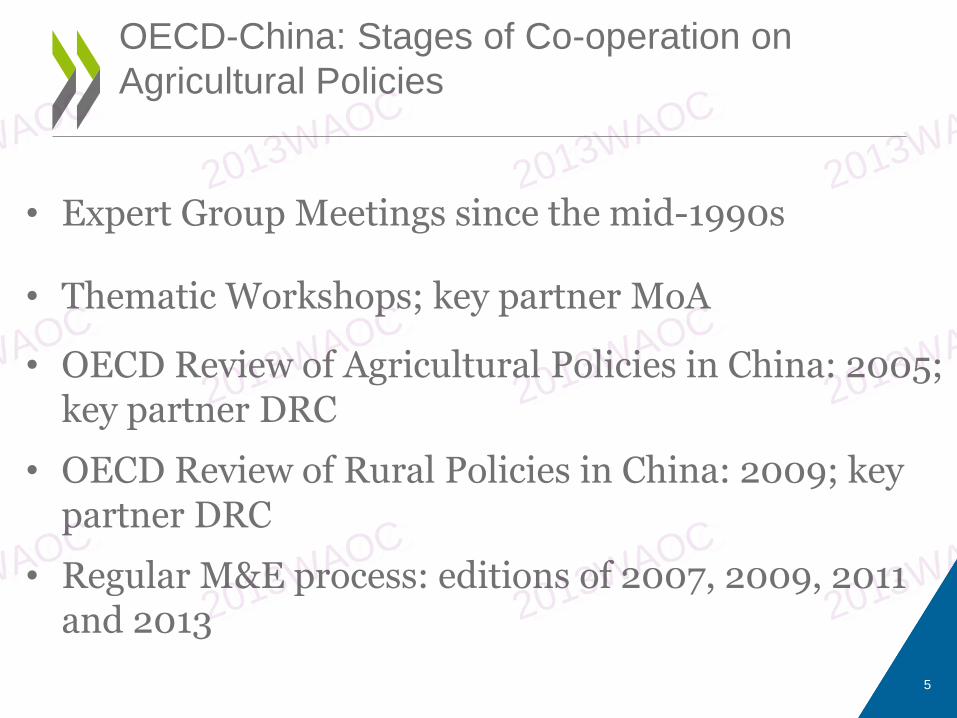
OECD-China: Stages of Co-operation on
Agricultural Policies
• Expert Group Meetings since the mid-1990s
• Thematic Workshops; key partner MoA
• OECD Review of Agricultural Policies in China: 2005; key partner DRC
• OECD Review of Rural Policies in China: 2009; key partner DRC
• Regular M&E process: editions of 2007, 2009, 2011 and 2013
5
2013WAOC
2013WAOC
2013WAOC
2013WAOC
2013WAOC
2013WAOC
2013WAOC
2013WAOC
2013WAOC
2013WAOC
2013WAOC
2013WAOC
2013WAOC
2013WAOC
2013WAOC
2013WAOC
2013WAOC
2013WAOC
2013WAOC
2013WAOC
2013WAOC
2013WAOC
2013WAOC
2013WAOC
2013WAOC
2013WAOC
2013WAOC
2013WAOC
2013WAOC
2013WAOC
2013WAOC
2013WAOC
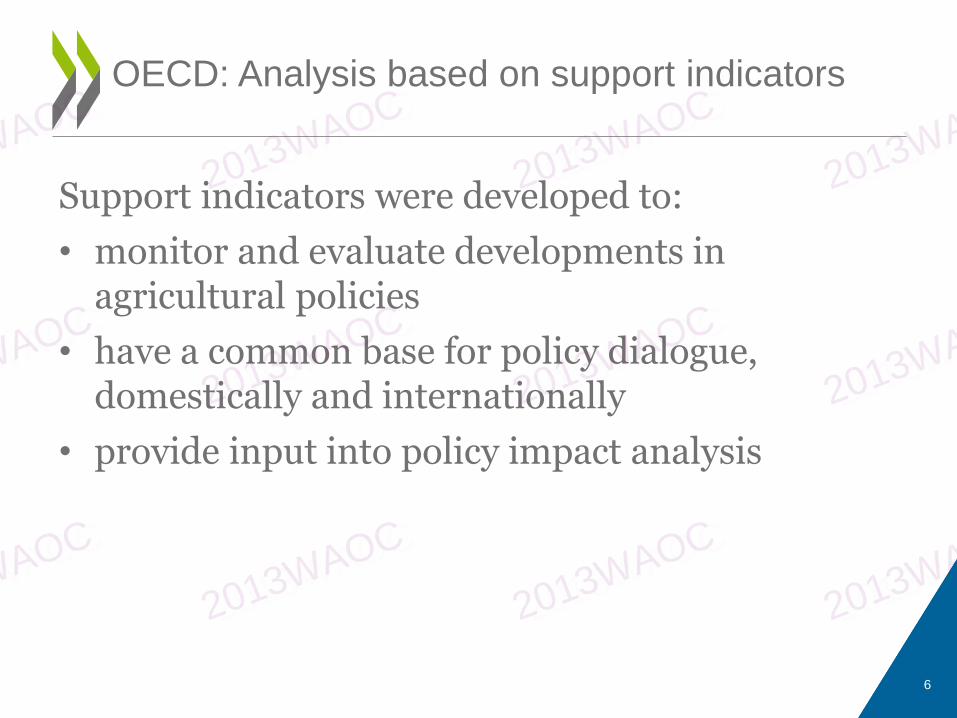
Support indicators were developed to:
• monitor and evaluate developments in agricultural policies
• have a common base for policy dialogue, domestically and internationally
• provide input into policy impact analysis
OECD: Analysis based on support indicators
6
2013WAOC
2013WAOC
2013WAOC
2013WAOC
2013WAOC
2013WAOC
2013WAOC
2013WAOC
2013WAOC
2013WAOC
2013WAOC
2013WAOC
2013WAOC
2013WAOC
2013WAOC
2013WAOC
2013WAOC
2013WAOC
2013WAOC
2013WAOC
2013WAOC
2013WAOC
2013WAOC
2013WAOC
2013WAOC
2013WAOC
2013WAOC
2013WAOC
2013WAOC
2013WAOC
2013WAOC
2013WAOC
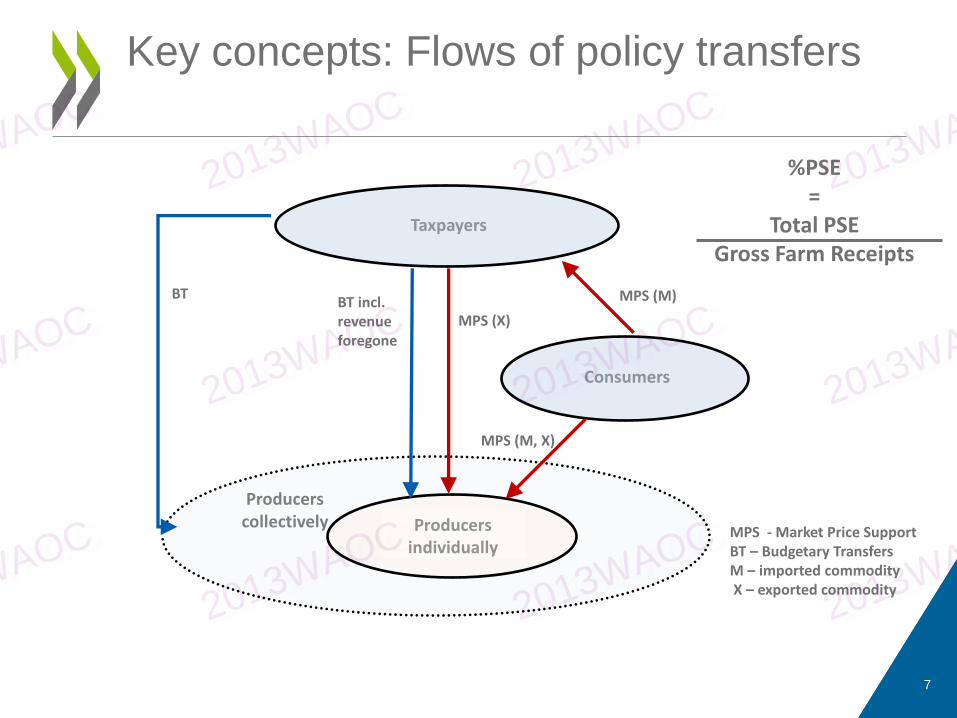
Producers collectively Producers
individually
Consumers
Taxpayers
Key concepts: Flows of policy transfers
BT incl. revenue foregone
MPS (M) BT
MPS (X)
MPS (M, X)
MPS - Market Price Support BT – Budgetary Transfers M – imported commodity X – exported commodity
%PSE =
Total PSE Gross Farm Receipts
7
2013WAOC
2013WAOC
2013WAOC
2013WAOC
2013WAOC
2013WAOC
2013WAOC
2013WAOC
2013WAOC
2013WAOC
2013WAOC
2013WAOC
2013WAOC
2013WAOC
2013WAOC
2013WAOC
2013WAOC
2013WAOC
2013WAOC
2013WAOC
2013WAOC
2013WAOC
2013WAOC
2013WAOC
2013WAOC
2013WAOC
2013WAOC
2013WAOC
2013WAOC
2013WAOC
2013WAOC
2013WAOC
Key support indicators: Relative indicators
• %PSE: PSE as a share of Gross Farm Receipts
• %GSSE: as a share of Total Support Estimate
• %CSE: as a share of consumption expenditure
• %TSE: as a share of GDP
• NPC (Nominal Protection Coefficient): gap between domestic and border price as a ratio of the border price
8
2013WAOC
2013WAOC
2013WAOC
2013WAOC
2013WAOC
2013WAOC
2013WAOC
2013WAOC
2013WAOC
2013WAOC
2013WAOC
2013WAOC
2013WAOC
2013WAOC
2013WAOC
2013WAOC
2013WAOC
2013WAOC
2013WAOC
2013WAOC
2013WAOC
2013WAOC
2013WAOC
2013WAOC
2013WAOC
2013WAOC
2013WAOC
2013WAOC
2013WAOC
2013WAOC
2013WAOC
2013WAOC
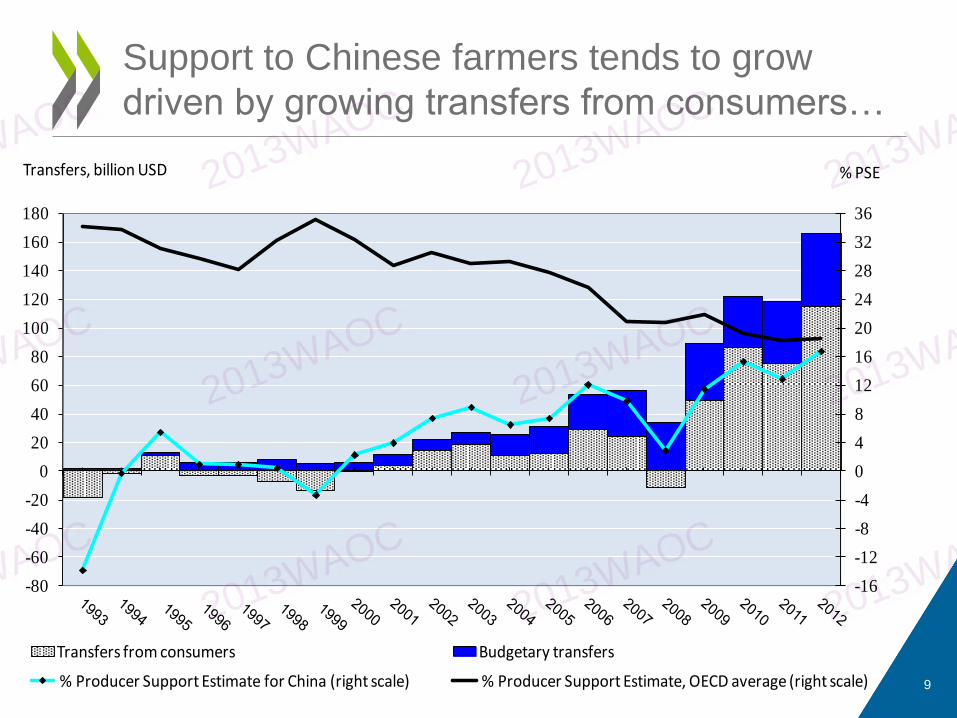
Support to Chinese farmers tends to grow
driven by growing transfers from consumers…
9
-16
-12
-8
-4
0
4
8
12
16
20
24
28
32
36
-80
-60
-40
-20
0
20
40
60
80
100
120
140
160
180
Transfers, billion USD
Transfers from consumers Budgetary transfers
% Producer Support Estimate for China (right scale) % Producer Support Estimate, OECD average (right scale)
% PSE
2013WAOC
2013WAOC
2013WAOC
2013WAOC
2013WAOC
2013WAOC
2013WAOC
2013WAOC
2013WAOC
2013WAOC
2013WAOC
2013WAOC
2013WAOC
2013WAOC
2013WAOC
2013WAOC
2013WAOC
2013WAOC
2013WAOC
2013WAOC
2013WAOC
2013WAOC
2013WAOC
2013WAOC
2013WAOC
2013WAOC
2013WAOC
2013WAOC
2013WAOC
2013WAOC
2013WAOC
2013WAOC
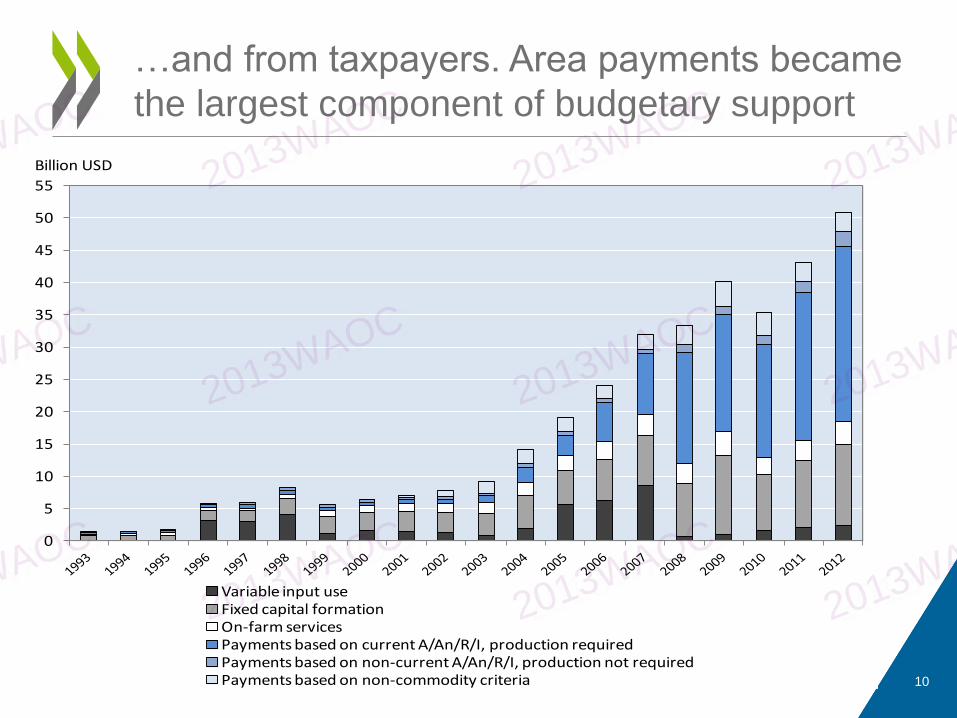
…and from taxpayers. Area payments became
the largest component of budgetary support
10
0
5
10
15
20
25
30
35
40
45
50
55
Variable input useFixed capital formationOn-farm servicesPayments based on current A/An/R/I, production requiredPayments based on non-current A/An/R/I, production not requiredPayments based on non-commodity criteria
Billion USD
2013WAOC
2013WAOC
2013WAOC
2013WAOC
2013WAOC
2013WAOC
2013WAOC
2013WAOC
2013WAOC
2013WAOC
2013WAOC
2013WAOC
2013WAOC
2013WAOC
2013WAOC
2013WAOC
2013WAOC
2013WAOC
2013WAOC
2013WAOC
2013WAOC
2013WAOC
2013WAOC
2013WAOC
2013WAOC
2013WAOC
2013WAOC
2013WAOC
2013WAOC
2013WAOC
2013WAOC
2013WAOC
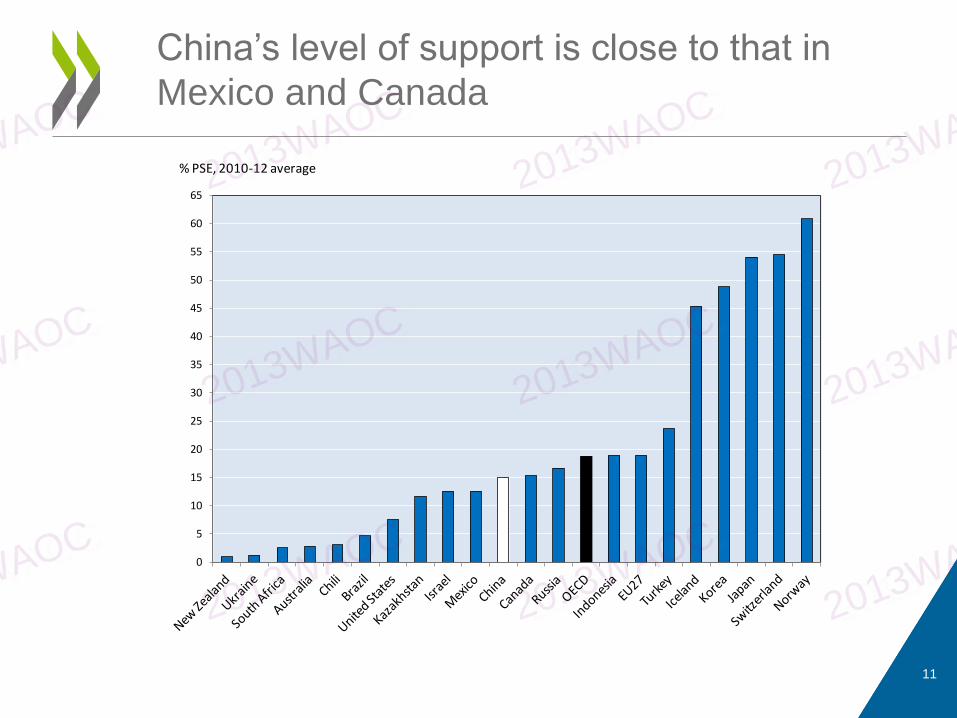
China’s level of support is close to that in
Mexico and Canada
11
0
5
10
15
20
25
30
35
40
45
50
55
60
65
% PSE, 2010-12 average
2013WAOC
2013WAOC
2013WAOC
2013WAOC
2013WAOC
2013WAOC
2013WAOC
2013WAOC
2013WAOC
2013WAOC
2013WAOC
2013WAOC
2013WAOC
2013WAOC
2013WAOC
2013WAOC
2013WAOC
2013WAOC
2013WAOC
2013WAOC
2013WAOC
2013WAOC
2013WAOC
2013WAOC
2013WAOC
2013WAOC
2013WAOC
2013WAOC
2013WAOC
2013WAOC
2013WAOC
2013WAOC
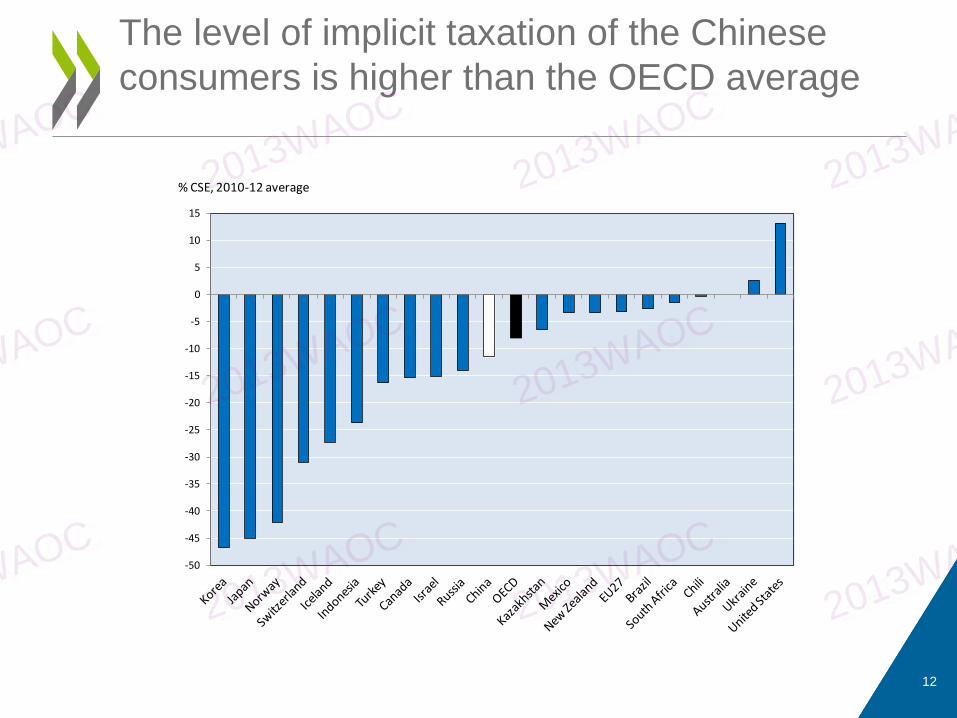
The level of implicit taxation of the Chinese
consumers is higher than the OECD average
12
-50
-45
-40
-35
-30
-25
-20
-15
-10
-5
0
5
10
15
% CSE, 2010-12 average
2013WAOC
2013WAOC
2013WAOC
2013WAOC
2013WAOC
2013WAOC
2013WAOC
2013WAOC
2013WAOC
2013WAOC
2013WAOC
2013WAOC
2013WAOC
2013WAOC
2013WAOC
2013WAOC
2013WAOC
2013WAOC
2013WAOC
2013WAOC
2013WAOC
2013WAOC
2013WAOC
2013WAOC
2013WAOC
2013WAOC
2013WAOC
2013WAOC
2013WAOC
2013WAOC
2013WAOC
2013WAOC
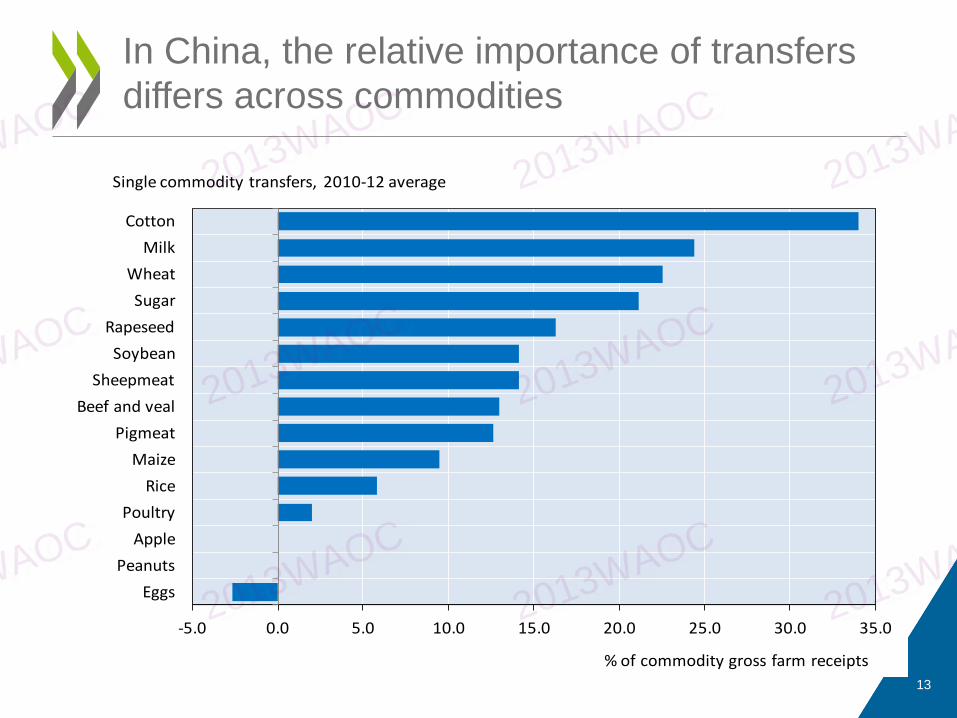
In China, the relative importance of transfers
differs across commodities
13
-5.0 0.0 5.0 10.0 15.0 20.0 25.0 30.0 35.0
Eggs
Peanuts
Apple
Poultry
Rice
Maize
Pigmeat
Beef and veal
Sheepmeat
Soybean
Rapeseed
Sugar
Wheat
Milk
Cotton
% of commodity gross farm receipts
Single commodity transfers, 2010-12 average
2013WAOC
2013WAOC
2013WAOC
2013WAOC
2013WAOC
2013WAOC
2013WAOC
2013WAOC
2013WAOC
2013WAOC
2013WAOC
2013WAOC
2013WAOC
2013WAOC
2013WAOC
2013WAOC
2013WAOC
2013WAOC
2013WAOC
2013WAOC
2013WAOC
2013WAOC
2013WAOC
2013WAOC
2013WAOC
2013WAOC
2013WAOC
2013WAOC
2013WAOC
2013WAOC
2013WAOC
2013WAOC
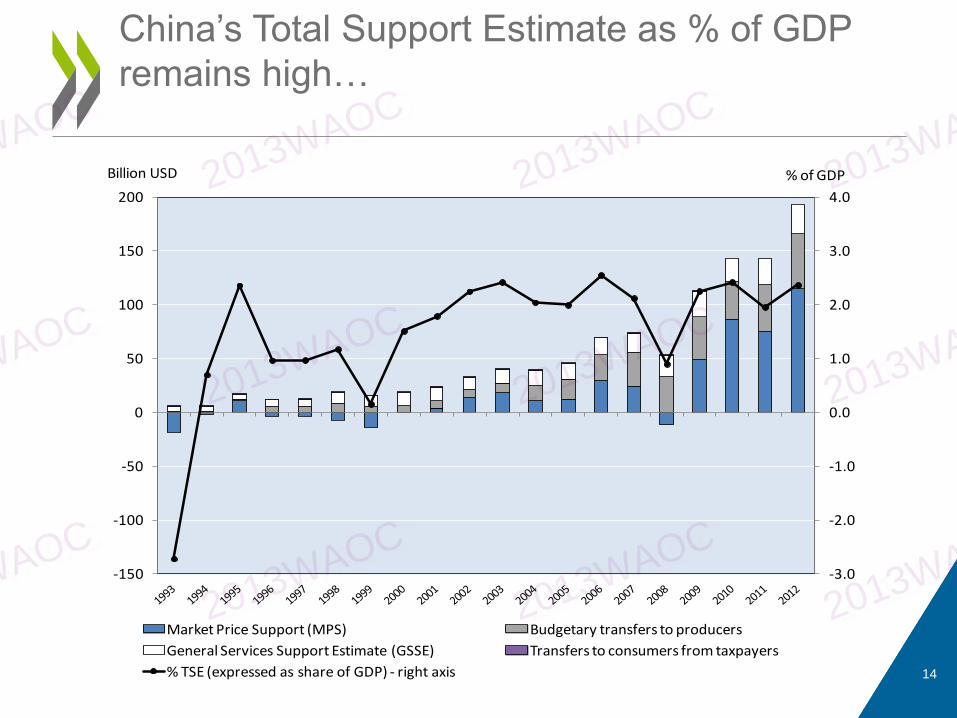
China’s Total Support Estimate as % of GDP
remains high…
14
-3.0
-2.0
-1.0
0.0
1.0
2.0
3.0
4.0
-150
-100
-50
0
50
100
150
200
Market Price Support (MPS) Budgetary transfers to producers
General Services Support Estimate (GSSE) Transfers to consumers from taxpayers
% TSE (expressed as share of GDP) - right axis
Billion USD % of GDP
2013WAOC
2013WAOC
2013WAOC
2013WAOC
2013WAOC
2013WAOC
2013WAOC
2013WAOC
2013WAOC
2013WAOC
2013WAOC
2013WAOC
2013WAOC
2013WAOC
2013WAOC
2013WAOC
2013WAOC
2013WAOC
2013WAOC
2013WAOC
2013WAOC
2013WAOC
2013WAOC
2013WAOC
2013WAOC
2013WAOC
2013WAOC
2013WAOC
2013WAOC
2013WAOC
2013WAOC
2013WAOC
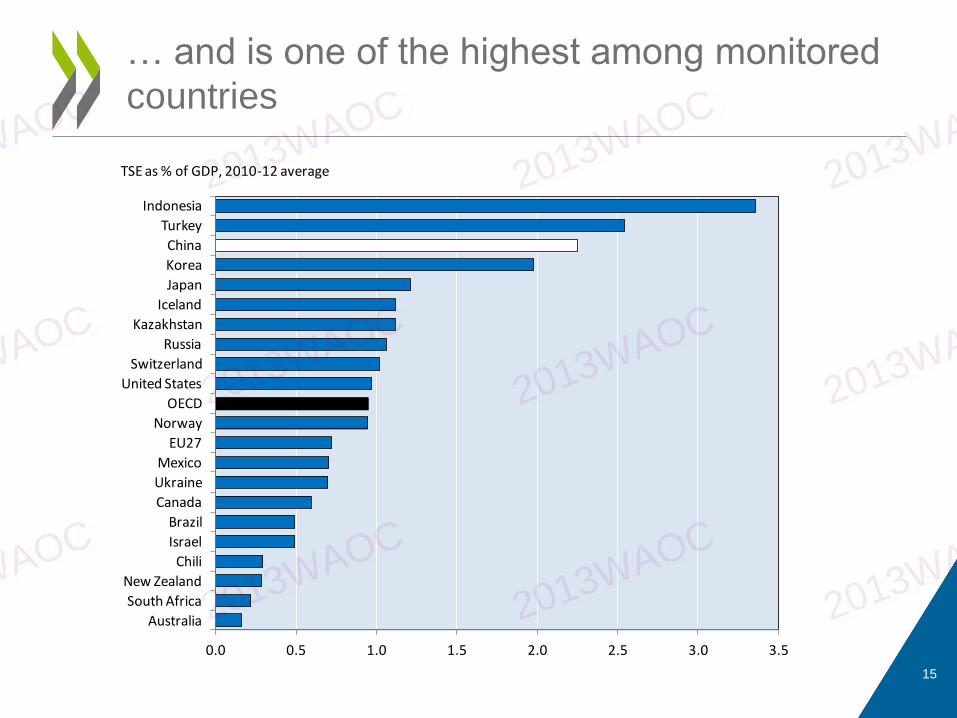
… and is one of the highest among monitored
countries
15
0.0 0.5 1.0 1.5 2.0 2.5 3.0 3.5
Australia
South Africa
New Zealand
Chili
Israel
Brazil
Canada
Ukraine
Mexico
EU27
Norway
OECD
United States
Switzerland
Russia
Kazakhstan
Iceland
Japan
Korea
China
Turkey
Indonesia
TSE as % of GDP, 2010-12 average
2013WAOC
2013WAOC
2013WAOC
2013WAOC
2013WAOC
2013WAOC
2013WAOC
2013WAOC
2013WAOC
2013WAOC
2013WAOC
2013WAOC
2013WAOC
2013WAOC
2013WAOC
2013WAOC
2013WAOC
2013WAOC
2013WAOC
2013WAOC
2013WAOC
2013WAOC
2013WAOC
2013WAOC
2013WAOC
2013WAOC
2013WAOC
2013WAOC
2013WAOC
2013WAOC
2013WAOC
2013WAOC
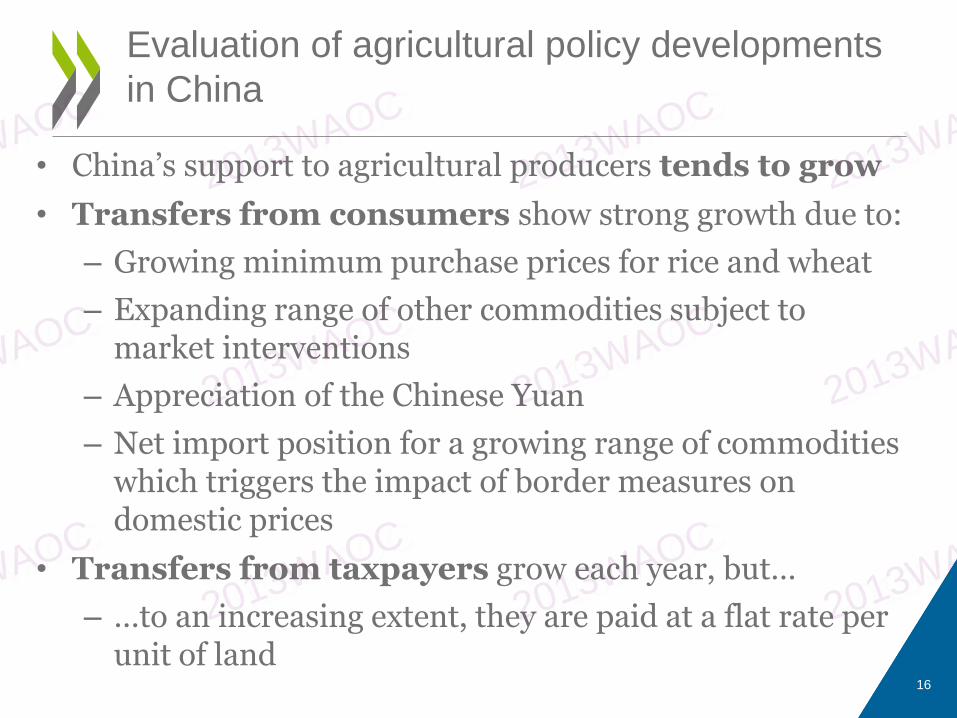
Evaluation of agricultural policy developments
in China
• China’s support to agricultural producers tends to grow
• Transfers from consumers show strong growth due to:
– Growing minimum purchase prices for rice and wheat
– Expanding range of other commodities subject to market interventions
– Appreciation of the Chinese Yuan
– Net import position for a growing range of commodities which triggers the impact of border measures on domestic prices
• Transfers from taxpayers grow each year, but…
– …to an increasing extent, they are paid at a flat rate per unit of land
16
2013WAOC
2013WAOC
2013WAOC
2013WAOC
2013WAOC
2013WAOC
2013WAOC
2013WAOC
2013WAOC
2013WAOC
2013WAOC
2013WAOC
2013WAOC
2013WAOC
2013WAOC
2013WAOC
2013WAOC
2013WAOC
2013WAOC
2013WAOC
2013WAOC
2013WAOC
2013WAOC
2013WAOC
2013WAOC
2013WAOC
2013WAOC
2013WAOC
2013WAOC
2013WAOC
2013WAOC
2013WAOC
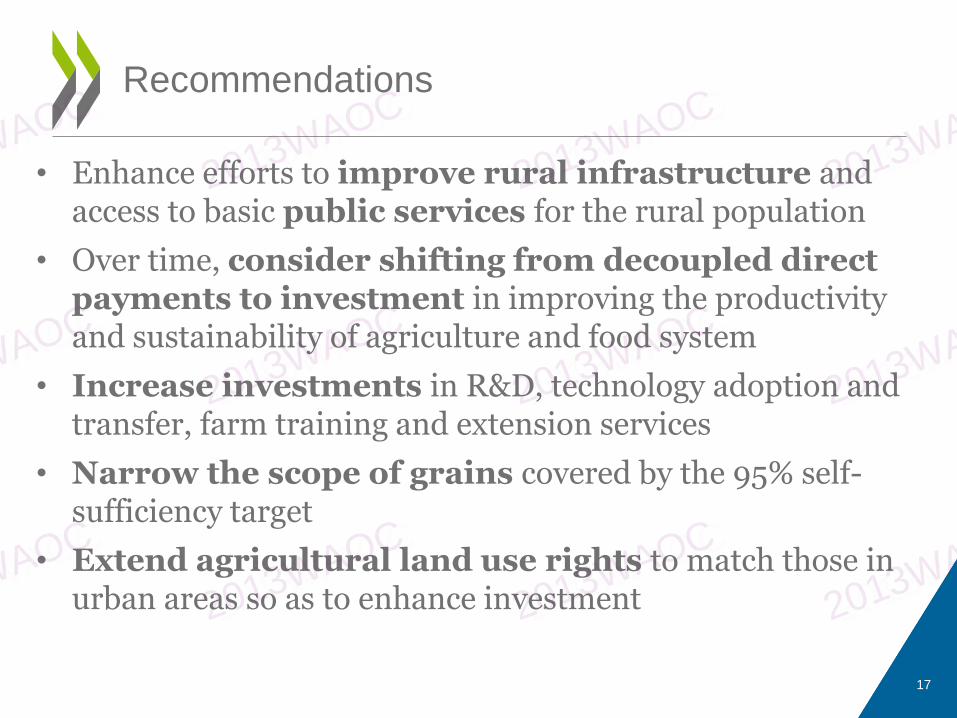
Recommendations
• Enhance efforts to improve rural infrastructure and access to basic public services for the rural population
• Over time, consider shifting from decoupled direct payments to investment in improving the productivity and sustainability of agriculture and food system
• Increase investments in R&D, technology adoption and transfer, farm training and extension services
• Narrow the scope of grains covered by the 95% self-sufficiency target
• Extend agricultural land use rights to match those in urban areas so as to enhance investment
17
2013WAOC
2013WAOC
2013WAOC
2013WAOC
2013WAOC
2013WAOC
2013WAOC
2013WAOC
2013WAOC
2013WAOC
2013WAOC
2013WAOC
2013WAOC
2013WAOC
2013WAOC
2013WAOC
2013WAOC
2013WAOC
2013WAOC
2013WAOC
2013WAOC
2013WAOC
2013WAOC
2013WAOC
2013WAOC
2013WAOC
2013WAOC
2013WAOC
2013WAOC
2013WAOC
2013WAOC
2013WAOC
For more information
• Visit our website: www.oecd.org/agriculture www.agri-outlook.org
www.oecd.org/agriculture/PSE
• Contact us: [email protected]
• Follow us on Twitter: @OECDagriculture
18
Trade and Agriculture Directorate
2013WAOC
2013WAOC
2013WAOC
2013WAOC
2013WAOC
2013WAOC
2013WAOC
2013WAOC
2013WAOC
2013WAOC
2013WAOC
2013WAOC
2013WAOC
2013WAOC
2013WAOC
2013WAOC
2013WAOC
2013WAOC
2013WAOC
2013WAOC
2013WAOC
2013WAOC
2013WAOC
2013WAOC
2013WAOC
2013WAOC
2013WAOC
2013WAOC
2013WAOC
2013WAOC
2013WAOC
2013WAOC