Embed Size (px)
Citation preview
�����������������������
Agricultural Policies in OECD CountriesMONITORING AND EVALUATION 2007Support to farmers in OECD countries accounted for 27% of farm receipts in 2006, a drop of 2 percentage points from 2005. However, for the OECD as a whole, there has been little change in the level of producer support since the late 1990s. In the most recent period, there was progress in the way support is provided to producers, via a noticeable shift away from measures linked to the production of specific commodities. But despite a sizeable reduction, production-linked measures still dominate producer support in most countries. In addition, there has been only limited progress towards policies that target clearly defined objectives and beneficiaries. Better targeting of policies would increase their effectiveness in meeting domestic objectives, enhance efficiency, and improve transparency.
This book is a unique source of up-to-date estimates of support to agriculture. Separate chapters describe and evaluate agricultural policies in each OECD country, including such important developments as the introduction of the single-payment scheme in the EU. This edition also includes a special chapter describing the revised method of estimating support to agriculture used for the first time in this report.
Agricultural Policies in OECD Countries: Monitoring and Evaluation is published every other year, alternating with Agricultural Policies in OECD Countries: At a Glance.
2007
A
gricultural P
olicies in O
EC
D C
ountries M
ON
ITO
RIN
G A
ND
EVA
LUA
TIO
N
ISBN 978-92-64-02746-6 51 2007 05 1 P -:HSTCQE=UW\Y[[:
The full text of this book is available on line via this link: www.sourceoecd.org/agriculture/9789264027466
Those with access to all OECD books on line should use this link: www.sourceoecd.org/9789264027466
SourceOECD is the OECD’s online library of books, periodicals and statistical databases. For more information about this award-winning service and free trials ask your librarian, or write to us at [email protected].
Agricultural Policies in OECD CountriesMONITORING AND EVALUATION 2007

Agricultural Policies in OECD Countries
MONITORING AND EVALUATION 2007
ORGANISATION FOR ECONOMIC CO-OPERATION AND DEVELOPMENT
The OECD is a unique forum where the governments of 30 democracies work together to
address the economic, social and environmental challenges of globalisation. The OECD is also at
the forefront of efforts to understand and to help governments respond to new developments and
concerns, such as corporate governance, the information economy and the challenges of an
ageing population. The Organisation provides a setting where governments can compare policy
experiences, seek answers to common problems, identify good practice and work to co-ordinate
domestic and international policies.
The OECD member countries are: Australia, Austria, Belgium, Canada, the Czech Republic,
Denmark, Finland, France, Germany, Greece, Hungary, Iceland, Ireland, Italy, Japan, Korea,
Luxembourg, Mexico, the Netherlands, New Zealand, Norway, Poland, Portugal, the Slovak Republic,
Spain, Sweden, Switzerland, Turkey, the United Kingdom and the United States. The Commission of
the European Communities takes part in the work of the OECD.
OECD Publishing disseminates widely the results of the Organisation’s statistics gathering and
research on economic, social and environmental issues, as well as the conventions, guidelines and
standards agreed by its members.
Also available in French under the title:
Les politiques agricoles des pays de l’OCDE
SUIVI ET ÉVALUATION 2007
Corrigenda to OECD publications may be found on line at: www.oecd.org/publishing/corrigenda.
© OECD 2007
No reproduction, copy, transmission or translation of this publication may be made without written permission. Applications should be sent to
OECD Publishing [email protected] or by fax 33 1 45 24 99 30. Permission to photocopy a portion of this work should be addressed to the Centre français
d’exploitation du droit de copie (CFC), 20, rue des Grands-Augustins, 75006 Paris, France, fax 33 1 46 34 67 19, [email protected] or (for US only) to
Copyright Clearance Center (CCC), 222 Rosewood Drive, Danvers, MA 01923, USA, fax 1 978 646 8600, [email protected].
This work is published on the responsibility of the Secretary-General of the OECD. Theopinions expressed and arguments employed herein do not necessarily reflect the officialviews of the Organisation or of the governments of its member countries.
This document has been produced with the financial assistance of the European Union.The views expressed herein can in no way be taken to reflect the official opinion of the
European Union.
FOREWORD
Foreword
This is the 18th annual report in a series examining agricultural policies in OECD countries. In
alternate years this information is published in the shorter Agricultural Policies in OECD
Countries: At a Glance. These two publications respond to the request by OECD ministers to
annually monitor and evaluate the implementation of the principles for agricultural policy reform.
The Secretariat uses a comprehensive system for measuring and classifying support to agriculture in
order to provide insight into the increasingly complex nature of agricultural policy.
Ongoing changes in agricultural policies require that the methods used to calculate and present
the Producer and Consumer Support Estimates (PSEs and CSEs) and related indicators be reviewed
periodically. In 2006, OECD member countries agreed to a new classification of policy measures
within the PSE and to a new calculation of commodity specific support. It should be noted that the
classification of policies continues to be according to how they are implemented. The details of the
new classification and calculation of commodity specific support are given in Chapter 3 of this report.
The 2007 edition of the report Agricultural Policies in OECD Countries: Monitoring and
Evaluation is the first time that the new classification of policy measures in the PSE and the new
calculations of commodity specific PSEs are presented. More categories and subcategories (labels) are
in the new classification than previously, and in order to accurately classify policy measures it is
necessary to have more detailed information as to the design and implementation characteristics of
policy measures and the associated levels of support. This required close co-operation with member
countries and a consistent approach to classifying policy measures across OECD countries. For some
policy measures in some countries there are information and data gaps concerning the
implementation of policies that made the classification task difficult. In future editions of the report,
in the light of better information and data, and refinements in applying the classification system, the
necessary adjustments will be made, in co-operation with member countries.
This edition has three parts. Part I provides an overall description of policy developments and
assessment of agricultural support in member countries. It also includes a special chapter on the new
PSE method applied in the report. Part II contains country chapters that describe, summarise and
evaluate policy developments in individual member countries and six countries which are now part
of the EU but not members of the OECD. Part III contains additional statistics on support and related
indicators.
AGRICULTURAL POLICIES IN OECD COUNTRIES: MONITORING AND EVALUATION 2007 – ISBN 978-92-64-02746-6 – © OECD 2007 3
Acknowledgements
This edition was prepared by the Trade and Agriculture Directorate of the OECDwith the active participation of member countries. The following people from theOECD Secretariat contributed to drafting this report: Václav Vojtech (co-ordinator),Ken Ash, Morvarid Bagherzadeh, Carmel Cahill, Andrea Cattaneo, DimitrisDiakosavvas, Hsin Huang, Il Jeong Jeong, Joanna Paulina Komorowska, OsamuKubota, Jussi Lankoski, Wilfrid Legg, Roger Martini, Alexandra de Matos Nunes,Olga Melyukhina, Catherine Moreddu, Kevin Parris, Véronique de Saint-Martin,Peter Talks, Stefan Tangermann, Frank van Tongeren and Monika Tothová.Alexandra de Matos Nunes co-ordinated the preparation of the main tables andgraphs. Statistical assistance was provided by Joanna Paulina Komorowska,Laetitia Reille, Véronique de Saint-Martin and Noura Takrouri-Jolly. Secretarialservices were provided by Françoise Bénicourt, Marina Giacalone and MichèlePatterson. Technical assistance and programming in the preparation of the newPSE/CSE database was provided by Eric Espinasse and Frano Ilicic. Many othercolleagues in the OECD Secretariat made useful comments in drafting the report.
This book has...
StatLinks2A service that delivers Excel® files
from the printed page!
Look for the StatLinks at the bottom right-hand corner of the tables or graphs in this book. To download the matching Excel® spreadsheet, just type the link into your Internet browser, starting with the http://dx.doi.org prefix. If you’re reading the PDF e-book edition, and your PC is connected to the Internet, simply click on the link. You’ll find StatLinks appearing in more OECD books.
TABLE OF CONTENTS
Table of Contents
Executive Summary . . . . . . . . . . . . . . . . . . . . . . . . . . . . . . . . . . . . . . . . . . . . . . . . . . . . . . . . . 11
Part I
Main Policy Developments and Evaluation
Chapter 1. Main Policy Developments in 2005 and 2006. . . . . . . . . . . . . . . . . . . . . . . . . 17
1.1. Developments in domestic policies. . . . . . . . . . . . . . . . . . . . . . . . . . . . . . . . . . . . . 18
1.2. Developments in trade policy . . . . . . . . . . . . . . . . . . . . . . . . . . . . . . . . . . . . . . . . . 29
Chapter 2. Evaluation of Support Policy Developments. . . . . . . . . . . . . . . . . . . . . . . . . . 35
Annex 2.A1. Policy Principles . . . . . . . . . . . . . . . . . . . . . . . . . . . . . . . . . . . . . . . . . . . . . . 60
Annex 2.A2. Operational Criteria . . . . . . . . . . . . . . . . . . . . . . . . . . . . . . . . . . . . . . . . . . . 61
Chapter 3. The New PSE Classification . . . . . . . . . . . . . . . . . . . . . . . . . . . . . . . . . . . . . . . . 63
3.1. Introduction . . . . . . . . . . . . . . . . . . . . . . . . . . . . . . . . . . . . . . . . . . . . . . . . . . . . . . . . 64
3.2. Measuring agricultural support . . . . . . . . . . . . . . . . . . . . . . . . . . . . . . . . . . . . . . . . 64
3.3. Changes in the PSE methodology applied in this report . . . . . . . . . . . . . . . . . . . 65
3.4. Indicators used in policy analysis . . . . . . . . . . . . . . . . . . . . . . . . . . . . . . . . . . . . . . 70
3.5. The use of the new classification and related indicators in policy analysis. . . 71
Annex 3.A1. Definitions of the OECD Indicators of Support . . . . . . . . . . . . . . . . . . . . . 73
Annex 3.A2. Commodity Groups Applied in Member Countries . . . . . . . . . . . . . . . . . 75
Part II
Country Chapters
Chapter 4. Australia . . . . . . . . . . . . . . . . . . . . . . . . . . . . . . . . . . . . . . . . . . . . . . . . . . . . . . . . . 82
Chapter 5. Canada . . . . . . . . . . . . . . . . . . . . . . . . . . . . . . . . . . . . . . . . . . . . . . . . . . . . . . . . . . 92
Chapter 6. European Union . . . . . . . . . . . . . . . . . . . . . . . . . . . . . . . . . . . . . . . . . . . . . . . . . . 99
Chapter 7. Iceland. . . . . . . . . . . . . . . . . . . . . . . . . . . . . . . . . . . . . . . . . . . . . . . . . . . . . . . . . . . 167
Chapter 8. Japan . . . . . . . . . . . . . . . . . . . . . . . . . . . . . . . . . . . . . . . . . . . . . . . . . . . . . . . . . . . . 173
Chapter 9. Korea . . . . . . . . . . . . . . . . . . . . . . . . . . . . . . . . . . . . . . . . . . . . . . . . . . . . . . . . . . . . 181
Chapter 10. Mexico . . . . . . . . . . . . . . . . . . . . . . . . . . . . . . . . . . . . . . . . . . . . . . . . . . . . . . . . . . . . . . . 189
Chapter 11. New Zealand . . . . . . . . . . . . . . . . . . . . . . . . . . . . . . . . . . . . . . . . . . . . . . . . . . . . . 195
Chapter 12. Norway . . . . . . . . . . . . . . . . . . . . . . . . . . . . . . . . . . . . . . . . . . . . . . . . . . . . . . . . . . 203
Chapter 13. Switzerland . . . . . . . . . . . . . . . . . . . . . . . . . . . . . . . . . . . . . . . . . . . . . . . . . . . . . . 213
Chapter 14. Turkey. . . . . . . . . . . . . . . . . . . . . . . . . . . . . . . . . . . . . . . . . . . . . . . . . . . . . . . . . . . 222
Chapter 15. United States . . . . . . . . . . . . . . . . . . . . . . . . . . . . . . . . . . . . . . . . . . . . . . . . . . . . . 231
AGRICULTURAL POLICIES IN OECD COUNTRIES: MONITORING AND EVALUATION 2007 – ISBN 978-92-64-02746-6 – © OECD 2007 5
TABLE OF CONTENTS
Part III
Summary Tables of Estimates of Support for OECD countries
• • •
List of Boxes
2.1. How are support policy developments evaluated? . . . . . . . . . . . . . . . . . . . . . . . . 36
2.2. How are the %PSE and NAC measured?. . . . . . . . . . . . . . . . . . . . . . . . . . . . . . . . . . 44
2.3. What has OECD analysis concluded about the impacts of producer support? . 56
3.1. Previous classification of PSE and related support indicators . . . . . . . . . . . . . . . 66
3.2. New PSE classification . . . . . . . . . . . . . . . . . . . . . . . . . . . . . . . . . . . . . . . . . . . . . . . . 67
3.3. Definitions of categories in the new PSE classification . . . . . . . . . . . . . . . . . . . . . 68
4.1. Australia: Commodity-Specificity of Support . . . . . . . . . . . . . . . . . . . . . . . . . . . . . 84
4.2. Australia: Proposed National Plan for Water Security. . . . . . . . . . . . . . . . . . . . . . 88
5.1. Canada: Commodity-Specificity of Support . . . . . . . . . . . . . . . . . . . . . . . . . . . . . . 95
6.1. European Union: Commodity-Specificity of Support. . . . . . . . . . . . . . . . . . . . . . . 101
6.2. European Union: The 2006 sugar reform . . . . . . . . . . . . . . . . . . . . . . . . . . . . . . . . . 107
6.3. European Commission: Commission proposals for fruit and vegetable reform 110
7.1. Iceland: Commodity-Specificity of Support . . . . . . . . . . . . . . . . . . . . . . . . . . . . . . 170
8.1. Japan: Commodity-Specificity of Support . . . . . . . . . . . . . . . . . . . . . . . . . . . . . . . . 176
9.1. Korea: Commodity-Specificity of Support . . . . . . . . . . . . . . . . . . . . . . . . . . . . . . . . 184
10.1. Mexico: Commodity-Specificity of Support. . . . . . . . . . . . . . . . . . . . . . . . . . . . . . . 192
11.1. New Zealand: Commodity-Specificity of Support . . . . . . . . . . . . . . . . . . . . . . . . . 198
12.1. Norway: Commodity-Specificity of Support . . . . . . . . . . . . . . . . . . . . . . . . . . . . . . 206
13.1. Switzerland: Commodity-Specificity of Support . . . . . . . . . . . . . . . . . . . . . . . . . . 216
13.2. Switzerland: Agricultural Policy 2011. . . . . . . . . . . . . . . . . . . . . . . . . . . . . . . . . . . . 218
14.1. Turkey: Commodity-specificity of support . . . . . . . . . . . . . . . . . . . . . . . . . . . . . . . 225
15.1. United States: Commodity-specificity of support . . . . . . . . . . . . . . . . . . . . . . . . . 234
15.2. The 2007 US Farm Bill: Highlights of the Administration’s Proposal
of 31 January 2007 . . . . . . . . . . . . . . . . . . . . . . . . . . . . . . . . . . . . . . . . . . . . . . . . . . . . 236
15.3. United States: Conservation Reserve Program (CRP) general sign-up
and re-enrolments . . . . . . . . . . . . . . . . . . . . . . . . . . . . . . . . . . . . . . . . . . . . . . . . . . . 238
List of Tables
2.1. OECD: Estimates of support to agriculture . . . . . . . . . . . . . . . . . . . . . . . . . . . . . . . 38
2.2. OECD: Estimates of support to agriculture . . . . . . . . . . . . . . . . . . . . . . . . . . . . . . . 39
2.3. Contribution to change in Producer Support Estimate by country, 2005 to 2006 . . 40
2.4a. Contribution to change in Market Price Support by country, 2005 to 2006. . . . . . . . 41
2.4b. Contribution to change in Border Price by country, 2005 to 2006 . . . . . . . . . . . . 42
2.5. Composition of General Support Services Estimate by country . . . . . . . . . . . . . . . . . 52
4.1. Australia: Estimates of support to agriculture . . . . . . . . . . . . . . . . . . . . . . . . . . . . 85
5.1. Canada: Estimates of support to agriculture. . . . . . . . . . . . . . . . . . . . . . . . . . . . . . 94
6.1. European Union: Estimates of support to agriculture (EU25 from 2004). . . . . . . 103
6.2. European Union: Estimates of support to agriculture (EU15) . . . . . . . . . . . . . . . . 104
6.3. European Union: Selected institutional prices . . . . . . . . . . . . . . . . . . . . . . . . . . . . 107
6.A2.1. European Union: Overview of the implementation of direct payments
under the CAP in member states . . . . . . . . . . . . . . . . . . . . . . . . . . . . . . . . . . . . . . . 161
AGRICULTURAL POLICIES IN OECD COUNTRIES: MONITORING AND EVALUATION 2007 – ISBN 978-92-64-02746-6 – © OECD 20076
TABLE OF CONTENTS
7.1. Iceland: Estimates of support to agriculture . . . . . . . . . . . . . . . . . . . . . . . . . . . . . . 169
7.2. Iceland: Administered prices for milk . . . . . . . . . . . . . . . . . . . . . . . . . . . . . . . . . . . 171
8.1. Japan: Estimates of support to agriculture . . . . . . . . . . . . . . . . . . . . . . . . . . . . . . . 175
8.2. Japan: Administered prices . . . . . . . . . . . . . . . . . . . . . . . . . . . . . . . . . . . . . . . . . . . . 179
8.3. Japan: Guaranteed prices for calves per head. . . . . . . . . . . . . . . . . . . . . . . . . . . . . 179
9.1. Korea: Estimates of support to agriculture . . . . . . . . . . . . . . . . . . . . . . . . . . . . . . . 183
9.2. Korea: Government purchase prices and quantities of major cereals . . . . . . . . 186
10.1. Mexico: Estimates of support to agriculture . . . . . . . . . . . . . . . . . . . . . . . . . . . . . . 191
11.1. New Zealand: Estimates of support to agriculture. . . . . . . . . . . . . . . . . . . . . . . . . 197
12.1. Norway: Estimates of support to agriculture . . . . . . . . . . . . . . . . . . . . . . . . . . . . . 205
12.2. Norway: Administered prices . . . . . . . . . . . . . . . . . . . . . . . . . . . . . . . . . . . . . . . . . . 209
12.3. Norway: Average marketing fees 2005, and per cent change in 2006 and 2007 209
12.4. Norway: Headage payments . . . . . . . . . . . . . . . . . . . . . . . . . . . . . . . . . . . . . . . . . . . 212
13.1. Switzerland: Estimates of support to agriculture . . . . . . . . . . . . . . . . . . . . . . . . . . 215
13.2. Switzerland: Outlays for direct payments . . . . . . . . . . . . . . . . . . . . . . . . . . . . . . . . 220
14.1. Turkey: Estimates of support to agriculture . . . . . . . . . . . . . . . . . . . . . . . . . . . . . . 224
14.2. Turkey: Purchasing prices for cereals, sugar and tobacco . . . . . . . . . . . . . . . . . . 227
14.3. Turkey: Export subsidy rates, 2006 . . . . . . . . . . . . . . . . . . . . . . . . . . . . . . . . . . . . . . 230
15.1. United States: Estimates of support to agriculture . . . . . . . . . . . . . . . . . . . . . . . . 233
15.2. United States: Payment rates for crops and milk for 2005-06 . . . . . . . . . . . . . . . 237
III.1. OECD: Producer Support Estimate by country . . . . . . . . . . . . . . . . . . . . . . . . . . . . 242
III.2. OECD: Breakdown of PSE by degree of commodity specificity . . . . . . . . . . . . . . 244
III.3. OECD: Consumer Support Estimate by country . . . . . . . . . . . . . . . . . . . . . . . . . . . 246
III.4. OECD: General Services Support Estimate by country. . . . . . . . . . . . . . . . . . . . . . 248
III.5. OECD: Total Support Estimate by country. . . . . . . . . . . . . . . . . . . . . . . . . . . . . . . . 249
III.6. OECD: Composition of Producer Support Estimate by country . . . . . . . . . . . . . . 250
III.7. OECD: Characteristics of policy support by country . . . . . . . . . . . . . . . . . . . . . . . 253
III.8. Australia: Breakdown of PSE by degree of commodity specificity . . . . . . . . . . . 255
III.9. Canada: Breakdown of PSE by degree of commodity specificity . . . . . . . . . . . . . 257
III.10a. European Union: Breakdown of PSE by degree of commodity specificity
(EU25 from 2004) . . . . . . . . . . . . . . . . . . . . . . . . . . . . . . . . . . . . . . . . . . . . . . . . . . . . . 259
III.10b. European Union: Breakdown of PSE by degree of commodity specificity (EU15) 261
III.11. Iceland: Breakdown of PSE by degree of commodity specificity . . . . . . . . . . . . . 263
III.12. Japan: Breakdown of PSE by degree of commodity specificity . . . . . . . . . . . . . . 264
III.13. Korea: Breakdown of PSE by degree of commodity specificity. . . . . . . . . . . . . . . 266
III.14. Mexico: Breakdown of PSE by degree of commodity specificity . . . . . . . . . . . . . 267
III.15. New Zealand: Breakdown of PSE by degree of commodity specificity . . . . . . . . . . 269
III.16. Norway: Breakdown of PSE by degree of commodity specificity . . . . . . . . . . . . 271
III.17. Switzerland: Breakdown of PSE by degree of commodity specificity . . . . . . . . . 273
III.18. Turkey: Breakdown of PSE by degree of commodity specificity . . . . . . . . . . . . . 275
III.19. United States: Breakdown of PSE by degree of commodity specificity . . . . . . . 277
III.20. Australia: Payments made on the basis of area, animal numbers,
receipts or income. . . . . . . . . . . . . . . . . . . . . . . . . . . . . . . . . . . . . . . . . . . . . . . . . . . . 279
III.21. Canada: Payments made on the basis of area, animal numbers,
receipts or income. . . . . . . . . . . . . . . . . . . . . . . . . . . . . . . . . . . . . . . . . . . . . . . . . . . . 279
III.22. European Union: Payments made on the basis of area, animal numbers,
receipts or income. . . . . . . . . . . . . . . . . . . . . . . . . . . . . . . . . . . . . . . . . . . . . . . . . . . . 280
AGRICULTURAL POLICIES IN OECD COUNTRIES: MONITORING AND EVALUATION 2007 – ISBN 978-92-64-02746-6 – © OECD 2007 7
TABLE OF CONTENTS
III.23. Iceland: Payments made on the basis of area, animal numbers,
receipts or income. . . . . . . . . . . . . . . . . . . . . . . . . . . . . . . . . . . . . . . . . . . . . . . . . . . . 280
III.24. Japan: Payments made on the basis of area, animal numbers,
receipts or income. . . . . . . . . . . . . . . . . . . . . . . . . . . . . . . . . . . . . . . . . . . . . . . . . . . . 281
III.25. Korea: Payments made on the basis of area, animal numbers,
receipts or income. . . . . . . . . . . . . . . . . . . . . . . . . . . . . . . . . . . . . . . . . . . . . . . . . . . . 281
III.26. Mexico: Payments made on the basis of area, animal numbers,
receipts or income. . . . . . . . . . . . . . . . . . . . . . . . . . . . . . . . . . . . . . . . . . . . . . . . . . . . 282
III.27. New Zealand: Payments made on the basis of area, animal numbers,
receipts or income. . . . . . . . . . . . . . . . . . . . . . . . . . . . . . . . . . . . . . . . . . . . . . . . . . . . 282
III.28. Norway: Payments made on the basis of area, animal numbers,
receipts or income. . . . . . . . . . . . . . . . . . . . . . . . . . . . . . . . . . . . . . . . . . . . . . . . . . . . 283
III.29. Switzerland: Payments made on the basis of area, animal numbers,
receipts or income. . . . . . . . . . . . . . . . . . . . . . . . . . . . . . . . . . . . . . . . . . . . . . . . . . . . 283
III.30. Turkey: Payments made on the basis of area, animal numbers,
receipts or income. . . . . . . . . . . . . . . . . . . . . . . . . . . . . . . . . . . . . . . . . . . . . . . . . . . . 284
III.31. United States: Payments made on the basis of area, animal numbers,
receipts or income. . . . . . . . . . . . . . . . . . . . . . . . . . . . . . . . . . . . . . . . . . . . . . . . . . . . 284
List of Figures
2.1. Evolution of OECD Producer Support Estimate (%PSE), Producer Nominal
Protection Coefficient (NPCp) and Producer Nominal Assistance
Coefficient (NACp) . . . . . . . . . . . . . . . . . . . . . . . . . . . . . . . . . . . . . . . . . . . . . . . 37
2.2. Producer Support Estimate by Country . . . . . . . . . . . . . . . . . . . . . . . . . . . . . . . . . . 43
2.3. Producer Nominal Assistance Coefficient by country . . . . . . . . . . . . . . . . . . . . . . 45
2.4. OECD: Composition of Producer Support Estimate . . . . . . . . . . . . . . . . . . . . . . . . 45
2.5. Composition of Producer Support Estimate by Country, 1986-88 and 2004-06 . 46
2.6. Producer Nominal Protection Coefficient by country . . . . . . . . . . . . . . . . . . . . . . 47
2.7. Consumer Support Estimate by country . . . . . . . . . . . . . . . . . . . . . . . . . . . . . . . . . 48
2.8. OECD: Single Commodity Transfers, 1986-88 and 2004-06 . . . . . . . . . . . . . . . . . . 49
2.9. OECD: Producer Nominal Protection Coefficient by commodity . . . . . . . . . . . . . 50
2.10. OECD: Composition of producer support degree of commodity flexibility. . . . . 50
2.11. Use of payments not requiring production, by country . . . . . . . . . . . . . . . . . . . . 51
2.12. Total Support Estimate by country. . . . . . . . . . . . . . . . . . . . . . . . . . . . . . . . . . . . . . 54
2.13. OECD: Changes in the level and composition producer support . . . . . . . . . . . . . 55
4.1. Australia: Producer Support Estimate by country, 2004-06. . . . . . . . . . . . . . . . . . 82
4.2. Australia: PSE level and composition by support categories, 1986-2006. . . . . . . 83
4.3. Australia: Producer SCT by commodity, 2004-06 . . . . . . . . . . . . . . . . . . . . . . . . . . 83
4.4. Australia: PSE level and commodity specificity, 1986-2006 . . . . . . . . . . . . . . . . . 84
5.1. Canada: Producer Support Estimate by country, 2004-06 . . . . . . . . . . . . . . . . . . . 92
5.2. Canada: PSE level and composition by support categories, 1986-2006 . . . . . . . . 93
5.3. Canada: Producer SCT by commodity, 2004-06 . . . . . . . . . . . . . . . . . . . . . . . . . . . 93
5.4. Canada: PSE level and commodity specificity, 1986-2006 . . . . . . . . . . . . . . . . . . . 95
6.1. European Union: Producer Support Estimate by country, 2004-06 . . . . . . . . . . . 99
6.2. European Union: PSE level and composition by support categories, 1986-2006 100
6.3. European Union: Producer SCT by commodity, 2004-06. . . . . . . . . . . . . . . . . . . . . . 100
6.4. European Union: PSE level and commodity specificity . . . . . . . . . . . . . . . . . . . . . 101
6.5. European Union: Components of GCT . . . . . . . . . . . . . . . . . . . . . . . . . . . . . . . . . . . 101
AGRICULTURAL POLICIES IN OECD COUNTRIES: MONITORING AND EVALUATION 2007 – ISBN 978-92-64-02746-6 – © OECD 20078
TABLE OF CONTENTS
7.1. Iceland: Producer Support Estimate by country, 2004-06 . . . . . . . . . . . . . . . . . . . 167
7.2. Iceland: PSE level and composition by support categories, 1986-2006 . . . . . . . . . . . 168
7.3. Iceland: Producer SCT by commodity, 2004-06. . . . . . . . . . . . . . . . . . . . . . . . . . . . . . . . 168
7.4. Iceland: PSE level and commodity specificity, 1986-2006 . . . . . . . . . . . . . . . . . . . 170
8.1. Japan: Producer Support Estimate by country, 2004-06. . . . . . . . . . . . . . . . . . . . . 173
8.2. Japan: PSE level and composition by support categories, 1986-2006 . . . . . . . . . . . . . 174
8.3. Japan: Producer SCT by commodity, 2004-06 . . . . . . . . . . . . . . . . . . . . . . . . . . . . . . . . . 174
8.4. Japan: PSE level and commodity specificity, 1986-2006. . . . . . . . . . . . . . . . . . . . . 176
9.1. Korea: Producer Support Estimate by country, 2004-06 . . . . . . . . . . . . . . . . . . . . 181
9.2. Korea: PSE level and composition by support categories, 1986-2006 . . . . . . . . . . . . . 182
9.3. Korea: Producer SCT by commodity, 2004-06 . . . . . . . . . . . . . . . . . . . . . . . . . . . . . . . . . 182
9.4. Korea: PSE level and commodity specificity, 1986-2006 . . . . . . . . . . . . . . . . . . . . 184
10.1. Mexico: Producer Support Estimate by country, 2004-06 . . . . . . . . . . . . . . . . . . . 189
10.2. Mexico: PSE level and composition by support categories, 1986-2006. . . . . . . . . . . . 190
10.3. Mexico: Producer SCT by commodity, 2004-06. . . . . . . . . . . . . . . . . . . . . . . . . . . . . . . . 190
10.4. Mexico: PSE level and commodity specificity, 1986-2006 . . . . . . . . . . . . . . . . . . . 192
11.1. New Zealand: Producer Support Estimate by country, 2004-06 . . . . . . . . . . . . . . 195
11.2. New Zealand: PSE level and composition by support categories, 1986-2006 . . . . . . 196
11.3. New Zealand: Producer SCT by commodity, 2004-06 . . . . . . . . . . . . . . . . . . . . . . . . . . 196
11.4. New Zealand: PSE level and commodity specificity, 1986-2006 . . . . . . . . . . . . . . 198
12.1. Norway: Producer Support Estimate by country, 2004-06 . . . . . . . . . . . . . . . . . . . 203
12.2. Norway: PSE level and composition by support categories, 1986-2006. . . . . . . . 204
12.3. Norway: Producer SCT by commodity, 2004-06 . . . . . . . . . . . . . . . . . . . . . . . . . . . 204
12.4. Norway: PSE level and commodity specificity, 1986-2006. . . . . . . . . . . . . . . . . . . 206
12.5. Norway: Components of GCT . . . . . . . . . . . . . . . . . . . . . . . . . . . . . . . . . . . . . . . . . . 206
13.1. Switzerland: Producer Support Estimate by country, 2004-06 . . . . . . . . . . . . . . . 213
13.2. Switzerland: PSE level and composition by support categories, 1986-2006 . . . . 214
13.3. Switzerland: Producer SCT by commodity, 2004-06. . . . . . . . . . . . . . . . . . . . . . . . 214
13.4. Switzerland: PSE level and commodity specificity, 1986-2006 . . . . . . . . . . . . . . . 216
13.5. Switzerland: Components of GCT. . . . . . . . . . . . . . . . . . . . . . . . . . . . . . . . . . . . . . . 216
14.1. Turkey: Producer Support Estimate by country, 2004-06 . . . . . . . . . . . . . . . . . . . 222
14.2. Turkey: PSE level and composition by support categories, 1986-2006. . . . . . . . . . . . 223
14.3. Turkey: Producer SCT by commodity, 2004-06. . . . . . . . . . . . . . . . . . . . . . . . . . . . . . . . 223
14.4. Turkey: PSE level and commodity specificity, 1986-2006 . . . . . . . . . . . . . . . . . . . 225
15.1. United States: Producer Support Estimate by country, 2002-06 . . . . . . . . . . . . . . 231
15.2. United States: PSE level and composition by support categories, 1986-2006 . . . . . . 232
15.3. United States: Producer SCT by commodity, 2004-06 . . . . . . . . . . . . . . . . . . . . . . . . . . 232
15.4. United States: PSE level and commodity specificity, 1986-2006. . . . . . . . . . . . . . 234
AGRICULTURAL POLICIES IN OECD COUNTRIES: MONITORING AND EVALUATION 2007 – ISBN 978-92-64-02746-6 – © OECD 2007 9

ISBN 978-92-64-02746-6
Agricultural Policies in OECD Countries
Monitoring and Evaluation 2007
© OECD 2007
Executive Summary
Agricultural policies in 2006 were implemented in the context of generally stronger
world prices for agricultural commodities and continued US dollar weakness. On the
domestic front, reform involved some further decoupling of support in the European Union
through the Single Payment Scheme. Korea and Japan have both recently agreed on policy
reform measures, while the United States is in the process of proposing new farm
legislation to replace the current Farm Bill. Many countries are developing policies to
stimulate biofuel production. Ongoing negotiations towards a Doha Development Agenda
so far failed to reach agreement despite extensive talks, and the multilateral trade policy
situation remained largely unchanged as a result.
As a share of gross farm receipts, the estimated level of support in the OECD area
(%PSE) declined from an average 38% of receipts in 1986-88 to 29% in 2004-06. In 2006, the
%PSE was 27%, a fall of two percentage points from 2005. However, there has been little
change in the level of producer support since the late 1990s for the OECD as a whole. In the
most recent period there was progress in the way that support is delivered to producers –
through a noticeable shift away from measures linked to the production of specific
commodities. But despite a sizeable reduction, production-linked measures still dominate
producer support in most countries. As well, there has been only limited progress towards
policies targeted to clearly defined objectives and beneficiaries. Better targeting of policies
would increase their effectiveness in meeting domestic objectives, enhance efficiency, and
improve transparency.
Despite some reduction, OECD agriculture continues to be characterised by high support
In 2006, support to producers in the OECD area was estimated at USD 268 billion or
EUR 214 billion and accounted for 27% of farm receipts. There has been a reduction of
support as a share of farm receipts in the period 2004-06, relative to 1986-88. Together with
support for general services to agriculture such as research, infrastructure, inspection,
marketing and promotion, total support to the agricultural sector (%TSE) was equivalent to
1.1% of OECD GDP in 2004-06, this is less than half of the 1986-88 average of 2.5%.
Large differences in the level of support persist between countries
While support has declined compared with 1986-88, wide differences remain in the level of
support among countries. Support to producers in 2004-06 was around 1% of farm receipts
in New Zealand and 5% in Australia. It was 14% in the United States and Mexico, 22% in
11
EXECUTIVE SUMMARY
Canada, and 24% in Turkey. At 34%, the level of support in the European Union was
5 percentage points above the OECD average. Support was 55% of farm receipts in Japan
and over 60% in Iceland, Norway, Korea and Switzerland.
Progress in reducing the level of support remains uneven across countries
Since 1986-88, producer support as a percentage of farm receipts has fallen most in
Canada, Mexico (since 1991-93) and New Zealand. Among the high support countries, the
greatest reductions have occurred in Iceland, Switzerland and Japan. Total support to
agriculture expressed as a share of GDP has also fallen in all OECD countries, while the high
share of total support in Turkey reflects the large agricultural sector and relatively low GDP.
Greater progress has been made in changing the way in which support is provided to producers
The share of the most production and trade distorting forms of support – those linked to
outputs or variable inputs – declined from 86% of producer support in 1986-88 to 64% in
2004-06 in the OECD area. A decrease in production-linked support (including market price
support, reflecting mainly border protection measures) is also shown by a significant
reduction in the gap between domestic producer and border prices (as measured by the
producer nominal protection coefficient, NPC). In 1986-88, average OECD producer prices
were 51% higher than border prices; by 2004-06 the gap had halved to 25%. The largest
reductions in the gap have occurred in Switzerland, Norway and Iceland, but producer
prices are still more than twice border prices in these countries, as is also the case in Japan
and Korea. Reductions in the most distorting forms of support have been accompanied by
increases in payments based on current or non-current area, animal numbers, revenues or
incomes. In the most recent years the payments not requiring any production grew in
importance. Cross-compliance conditions, especially environmental, are increasingly
being attached to payments.
Most support is still for specific commodities, but policies allowing more flexibility to producers are growing in importance.
Single commodity transfers (SCT) remain the most important component of the PSE,
although their share in total producer support declined from 88% in 1986-88 to 64% in 2004-06.
The reduction of transfers targeted to a single commodity has been uneven across
commodities. While the SCT share in producer receipts for milk, eggs, grains and oilseeds
fell by more than half, other traditionally highly protected sectors such as rice and sugar
have experienced only a small decline (they remain the commodities with the highest
percentage SCT and NPC). Support over the years has evolved towards budgetary payments
less tied to producing a specific commodity (and therefore not in the SCT), either by
allowing a group of commodities (or all commodities) to be eligible for a payment, or by
having no production requirement to receive payment.
AGRICULTURAL POLICIES IN OECD COUNTRIES: MONITORING AND EVALUATION 2007 – ISBN 978-92-64-02746-6 – © OECD 200712
EXECUTIVE SUMMARY
A number of important policy changes were implemented during 2005 and 2006…
The implementation of the 2003 Common Agricultural Policy reform continued in the
European Union with the introduction of the Single Payment Scheme starting in 2005, and
extension of the reform to the sugar sector in 2006. A new Rural Development Regulation
was adopted for the 2007-13 period, with EU countries developing their implementation
programmes. Iceland is gradually replacing milk payments based on output by headage
payments (2005-12). A new basic plan for Food, Agriculture and Rural Areas was
established in Japan. One of its features was the introduction, from 2007, of new direct
payments giving more flexibility in production decisions to producers. Korea began
implementing revisions to its rice policy that include the abolition of government
purchasing and the introduction of direct payments. Switzerland is gradually phasing out
the milk quota production system.
… and some new changes are under consideration
The United States is in the final year of the 2002-07 Farm Bill and proposals for the new
Farm Bill are under way. Switzerland’s New Agricultural Policy proposals for 2007-11 (AP 2011)
imply further moving away from measures supporting commodity prices.
Multilateral agricultural trade negotiations resumed, but a successful outcome remains elusive
The Doha Development Agenda (DDA) round of trade negotiations continued under the
auspices of the WTO, but no conclusion was reached, and negotiations on bilateral and
regional trade agreements increased. Progress in the multilateral trade negotiations would
provide an added incentive for further agricultural policy reform.
AGRICULTURAL POLICIES IN OECD COUNTRIES: MONITORING AND EVALUATION 2007 – ISBN 978-92-64-02746-6 – © OECD 2007 13

PART I
Main Policy Developmentsand Evaluation
AGRICULTURAL POLICIES IN OECD COUNTRIES: MONITORING AND EVALUATION 2007 – ISBN 978-92-64-02746-6 – © OECD 2007

ISBN 978-92-64-02746-6
Agricultural Policies in OECD Countries
Monitoring and Evaluation 2007
© OECD 2007
PART I
Chapter 1
Main Policy Developmentsin 2005 and 2006
This chapter highlights the major changes and new initiatives in agricultural policyin OECD countries in 2005 and 2006. These changes are described in detail in thecountry chapters of Part II. Agricultural policy developments in 2005-06 weredominated by the implementation of policy reforms decided in earlier years mainlyin European Union, Japan and Korea. There was a general move towards allowingfarmers more flexibility as to what they are required to produce to be eligible forsupport, or not to produce at all. Constraints on farming practices are becomingmore frequent through more regulation and compliance conditions. Governmentinvolvement in promoting renewable energy sources from agriculture also grew.
17
I.1. MAIN POLICY DEVELOPMENTS IN 2005 AND 2006
Agricultural policy developments in 2005-06 were dominated by the implementation of
policy reforms decided in earlier years mainly in the EU, Japan and Korea. There was a
general move towards allowing farmers more flexibility as to what they are required to
produce to be eligible for support, or not to produce at all. Constraints on farming practices
are becoming more frequent through more regulation and compliance conditions.
Government involvement in promoting renewable energy sources from agriculture also
grew.
Many countries were involved in preparing for new farm legislation. They share the
goals of a competitive farm sector in the global economy, while protecting the environment
and rural areas and meeting the broader concerns of society. In the international arena, no
conclusion was reached in the multilateral negotiations in the Doha Development Agenda,
but there was a proliferation of negotiations on bilateral and regional trade agreements.
The increases in many commodity prices on world markets resulted in a fall in market
price support. In recent years there has been a tendency towards some convergence of
policies across OECD countries – a greater role for market signals to guide production
decisions, increased attention to policies to address a wider set of objectives and
reflections on the appropriate roles of agricultural and other policies. Nevertheless, the
experiences of OECD countries have varied in the depth, breadth and pace of reform.
1.1. Developments in domestic policies
Objectives are wide ranging and instruments and implementation mechanisms are adjusting
The objectives of agricultural policy are extensive ranging from farm income
maintenance, farm and agri-food business competitiveness, environmental sustainability,
resource management and pollution control, to food security and food safety, food quality,
alleviation of climate change risk, animal welfare, rural viability and preservation of
culturally valuable landscapes.
Within the broad suite of policy instruments, countries are gradually steering away
from the least targeted and most distorting forms of support to less distorting ones. Price
support measures, such as administered prices, import tariffs and export subsidies, are
being progressively reduced. Budgetary payments are increasingly subject to
environmental and other cross compliance requirements although they are also income
supporting. Governments continue to take the decoupling route while also trying to
increase the competitiveness of the agri-food sectors. Yet, in the absence of trade reform,
abolition of the most distorting measures might not trigger all the adjustments needed.
Decentralisation, delegation of responsibilities and co-financing to subnational and
regional authorities continued across OECD countries. In some countries, rural
development strategies are progressively moving away from a largely agricultural focus in
less-favoured areas, to broader, more territorially based policies.
AGRICULTURAL POLICIES IN OECD COUNTRIES: MONITORING AND EVALUATION 2007 – ISBN 978-92-64-02746-6 – © OECD 200718
I.1. MAIN POLICY DEVELOPMENTS IN 2005 AND 2006
The PSE reflects exogenous market and other developments as well as changes in
policies across countries. For example the presence of border measures may prevent the
transmission of lower world prices into domestic markets, thus increasing market price
support even though there are no other policy changes.
New policies were implemented in the EU
The introduction of Single Payment Schemes in the European Union (EU) further
increased the flexibility afforded to farmers in their production decisions, but some
commodity-linked area and headage payments remained in some EU countries.
Depending on the country, the single payment was implemented over the two years 2005
and 2006, with a gradual inclusion of dairy payments between 2005 and 2007. As a result,
payments not based on current commodity parameters and not requiring production
(category E) now represent 28% of the EU PSE. Efforts were made to simplify the
implementation of the CAP and budgetary discipline was reinforced.
Specific transitional schemes apply in new EU member states. Most apply the Single
Area Payment Scheme (SAPS), under which each hectare receives the same payment rate,
until 2010. New member states received 30% of the EU15 direct payment rate in 2005, 35%
in 2006 and 40% in 2007. Most EU member states, though, complemented EU funds with
Complementary National Direct payments (CNDP or top-up payments) from national funds
granted as commodity-specific area or headage payments. In some countries they were co-
financed from Rural Development Regulation funds. Bulgaria and Romania joined the EUin January 2007 and from that date have begun to apply the CAP.
A significant reform of the sugar support regime in the EU came into force in July 2006.
The reform includes a reduction of guaranteed prices over four years, the abolition of
intervention and establishment of a private storage system in case the market price falls
below the reference price, a single quota, the introduction of a charge on farmers
producing beyond quota, partial compensation payments to be included in the single
payment and a voluntary restructuring scheme, as well as concomitant modifications to
preferential import systems.
With respect to market price support measures, the decrease of intervention prices for
butter and skimmed milk powder continued in the EU, while the sugar reform led to a
decrease in the minimum sugar beet price as well as in the safety net price for sugar. Other
support prices remained unchanged in 2005 and 2006. EU sugar quotas were cut, quotas for
starch potatoes rose and milk quotas in the EU15 increased.
Policies in other OECD countries remained largely unchanged, market price support and output payments varied with world prices
2005 and 2006 were marked by generally high commodity prices and several natural
calamities. High commodity prices resulted in lower deficiency payments and market price
support; natural calamities and outbreaks of animal disease prompted a variety of policy
responses resulting in budgetary outlays.
Price support reflecting differences between domestic and world commodity prices
saw the largest decrease. In Korea, the gap between domestic and border prices fell
significantly for rice, milk and poultry and no payments were made from the calf breeding
stabilisation scheme. In the United States, counter-cyclical payments based on current
prices and past production increased by 11% in 2005, but fell by two-thirds in 2006.
AGRICULTURAL POLICIES IN OECD COUNTRIES: MONITORING AND EVALUATION 2007 – ISBN 978-92-64-02746-6 – © OECD 2007 19
I.1. MAIN POLICY DEVELOPMENTS IN 2005 AND 2006
Prices administered by governments were not subject to much change. In Japanpurchasing prices for wheat and barley declined, while selling prices for their products as
well as for calves and the floor level of the pigmeat price stabilisation band remained
unchanged. Korean purchase prices of barley and maize have been held constant since
2001. In Norway deficiency payment rates for wool and sheepmeat remained constant.
Loan rates, direct payment rates, and target prices in the United States were pre-determined
for the period 2002-07.
The dismantling of administered prices for milk at the wholesale level in Iceland had
been scheduled but was then postponed indefinitely. In Norway target prices for beef
increased in 2005 and for sheepmeat in 2006, as did the deficiency payment rates for goat
milk. Purchasing prices in Turkey decreased in 2005 for all commodities except tobacco
and sugar, but increased for most types of wheat, rye, oats and tobacco in 2006. As
scheduled, target prices for cereals in the United States increased in 2004, but remained
constant in 2005 and 2006.
Production quota developments were not uniform across countries. In Norway the
maximum milk quota for individual farms was increased, while the total milk quota did
not change significantly. The production quota for sugar beet in Turkey remained
unchanged at its 2002 level. Switzerland gradually phased out the milk quota system. By
2006, 63% of producers accounting for 75% of production had already left the quota
production system. After the rice policy reform in Japan, farmers and farmers’
organizations, rather than the government, will decide on production adjustment policies.
Budgetary payments continue to embrace increased flexibility
While most of the EU payments that are integrated into the single payment do not
require production, some commodity specific payments remain in some countries (such as
payments per hectare of cereals, oilseeds, protein crops, rice, dried fodder and energy
crops) and livestock payments. Those payments were maintained at their 2004-05 levels
adjusted by the coupling rate where relevant. The dairy premium, that will be incorporated
into the single payment, was increased in 2005 and 2006 following the cut in support
prices. In Norway headage payments decreased or remained unchanged for all animals
except sheep and suckler goats. New payments were introduced for lamb carcasses and for
year-round outdoor grazing of sheep. In Turkey, there was an increase in the rate of income
support payments granted on a per hectare basis to all registered farmers.
Iceland reduced output based milk payments and introduced a payment based on the
number of bovine animals, a payment for animal breeding programmes and a payment for
land improvement. Following a sharp fall in rice prices after the abolition of government
purchases, Korea implemented a two-tier area-based payment system, and these policy
changes resulted in a decline of production and cultivated area. The fixed payment
element based on historical production increased between 2005 and 2006, while the
variable payment element, based on the difference between the target and the current
post-harvest price and given only to farmers currently producing rice, decreased. Japandecided to introduce three new payments: one based on historical area in a defined and
fixed base period to correct geographical handicaps; a second to encourage quality
improvement, and a third to mitigate income instabilities due to price and yield
fluctuations. Wheat, barley, soybeans, sugar beet and starch potatoes are eligible for all
three payments, rice only for the latter. Environmental compliance and other conditions
apply.
AGRICULTURAL POLICIES IN OECD COUNTRIES: MONITORING AND EVALUATION 2007 – ISBN 978-92-64-02746-6 – © OECD 200720
I.1. MAIN POLICY DEVELOPMENTS IN 2005 AND 2006
Most transition programmes in 2005-06 concerned tobacco. Australia assists former
tobacco growers in re-establishing themselves in alternative economic activities, including
off-farm. An adjustment assistance programme in Canada also aims to retire base and
production quotas for tobacco. The US tobacco programme was terminated and tobacco
producers and quota holders will receive transition “buy-out” payments, funded by a levy
on tobacco manufacturers and importers. Following the 2004 reform of the EU tobacco
regime, an increasing share of the payment will be gradually included in the single payment
up to 2010.
Greater emphasis on environmental sustainability and addressing long-term climate change
Environmental sustainability is usually expressed as emphasis on water
protection, limits to air pollution, reduction of pollution from fertilisers and chemicals,
protection from soil erosion, and conservation of biodiversity and cultural landscapes.
New Zealand is developing a sustainable development framework to address the
factors helping or hindering the implementation of economically and environmentally
sound sustainable development, leading to the development of national frameworks for
land and water quality and allocation. In the United States the Administration’s proposal
for the 2007 Farm Bill increases conservation funding, simplifies and consolidates
conservation programmes.
Supplementary payments were paid to producers who apply stricter farmer practices
than those required by regulations. Switzerland, Korea, Norway and EU are providing
payments for environmentally friendly farming, environmentally friendly livestock
practices and improvement of animal welfare. “Improving the environment and the
countryside” is a priority of the new EU rural development policy to be implemented from
2007 onwards.
Countries are channelling greater research efforts into studying the effects of climate
change on agriculture. The National Agriculture and Climate Change Action Plan in
Australia identifies four key areas to manage multiple climate change risks to agriculture:
adaptation, mitigation, research and development, and awareness and communication.
The Action Plan 2000 in Canada finances programmes to address agricultural sources of
emissions of greenhouse gases. New Zealand is developing technologies and systems for
improving the economic and environmental performance of agriculture via a research
consortium.
Exceptional weather events triggered disaster payments and some new policies
Responding to severe droughts, in 2005 and 2006 the European Commissionauthorised affected farmers to use set-aside land to feed animals and allowed member
states to grant advance payments earlier than usual. Additional measures were taken by
EU member states in the form of temporary tax concessions (social security, value added
tax, and personal income tax), opening credit lines to compensate for feed and pasture
shortage or to assist with irrigation. Portugal approved, in 2005, strategic orientations to re-
cover areas that had been burned in 2003 and 2004. These orientations will also apply to
the area devastated by fires in 2005.
The United States provided assistance to agricultural producers who suffered losses
from natural disasters as well as additional emergency assistance to producers who
suffered losses due to hurricane disasters in 2005. Compensation payments were aimed at
AGRICULTURAL POLICIES IN OECD COUNTRIES: MONITORING AND EVALUATION 2007 – ISBN 978-92-64-02746-6 – © OECD 2007 21
I.1. MAIN POLICY DEVELOPMENTS IN 2005 AND 2006
livestock, dairy, cottonseed, specialty and nursery crop producers and processors (first
handlers in case of cotton) as the loss of electricity, shortage of fuel, and infrastructure
damage temporarily interrupted the flow of products to markets. In 2006, Canada provided
a payment to producers affected by floods to assist in improving and protecting flood-
damaged soil until a commercial crop can be planted
With the ongoing drought in Australia, nearly half of the drought relief under the
Exceptional Circumstances Relief Payment Scheme was provided to farmers as income
support in the form of social security payments, small business assistance, business
interest subsidies, personal counselling and other support programmes. The government
is currently working towards reforming drought policy through negotiations with state
governments.
Water shortages and droughts necessitate reflection on new policies
While some countries have started reconsidering their water policies and
implementing reform policies, further efforts could include enforcement and trading of
water property rights, determination of pricing schemes and allocations, the reform of
subsidisation of different uses of water and delegation of competencies to local authorities.
Major initiatives were taken in Australia. The implementation of the 2004 water policy
reform programme continued in 2005 and 2006, including improvements to water resource
accounting, trading, measuring and metering of water. Additional resources were
committed from 2005 to 2009 for projects to support installation of water pipelines to
agricultural areas, wastewater recycling and improved water management. Australian
landholders can claim accelerated depreciation for investments relating to land and water
conservation, aimed at improving natural resource management.
The Sustainable Water Programme of Action in New Zealand, established in 2003,
aims to address the issues of maintaining water quality and the increasing demand for
water, including for irrigation. Spain reviewed its National Irrigation Plan, which was
applied in 2006 and 2007 to assess efficiency gains in the consumption of water through
infrastructure improvements. In Mexico two projects, Baluarte Presidio and El Tigre have,
since 2005, improved irrigation infrastructure on 22 500 hectares. Turkey implemented a
number of regulations to control water and soil pollution, and protect wetlands. The
government plays a major role in providing infrastructure investment for irrigation.
Outbreaks of animal disease continued to preoccupy policymakers and test preparedness
Animal disease prevention campaigns include vaccinations, regulations to avoid
transmission of a virus, or administrative measures facilitating crisis management.
Portugal vaccinated sheep against bluetongue disease. Many EU member states, Norwayand Switzerland banned keeping poultry in the open air to limit the risk of spread of avian
influenza. The United Kingdom replaced a system of BSE testing for cattle that could no
longer enter the food or feed chain by a measure providing for the disposal of and
compensation for cattle born before 1 August 1996. The United Kingdom also introduced a
scheme to help farmers meet their legal responsibilities for disposing of fallen animals.
Estonia, in 2005, opened the first processing factory for animal waste materials. The
United States designed a National Poultry Improvement Program to prevent the spread of
poultry diseases in commercial poultry operations. The United Kingdom started a poultry
register to collect essential information about certain bird species to help reduce the
impact of disease outbreaks, with more than 250 million birds now included.
AGRICULTURAL POLICIES IN OECD COUNTRIES: MONITORING AND EVALUATION 2007 – ISBN 978-92-64-02746-6 – © OECD 200722
I.1. MAIN POLICY DEVELOPMENTS IN 2005 AND 2006
Responding to an outbreak of bluetongue disease at the end of 2004, Portugal limited
animal traffic within the national territory and granted advance premium payments.
Measures taken in France in response to disease outbreaks in 2006 included, particularly
for livestock producers experiencing the most difficulty, reductions or delays for social
security contributions, partial interest concessions, payments for keeping animals on
farms that would otherwise have been killed and various payments to compensate for
income losses due to market disturbances. As well, costs of tests, laboratory analyses, and
veterinary visits were partially reimbursed.
In spring 2006, the European Commission agreed to fund 50% of the cost of measures
taken to support the poultry market affected by avian influenza, such as the destruction of
hatching eggs and chicks, the early slaughter of the breeding flock, other voluntary
reductions in output and the compensation of income losses, even if the farm itself is not
affected by the outbreak. Additional compensation was available in some member states
compensating for income losses, loan guarantees, interest concessions and reductions in
social security contributions. Switzerland continued to pay premiums for keeping animals
outdoors even for those periods when producers were banned from keeping their flocks in
the open air, and the appropriate marketing labels could be used (provided it was
completed by a notice on the temporary ban).
In 2006, Turkey implemented an insurance support scheme open to all producers and
covering hailstorm and frost for aquaculture, greenhouse and livestock products, including
poultry. The government reimburses 50% of the premium costs. Agricultural insurance
schemes were extended to include insurance for animal disease, such as in Spain where
the Combined Agricultural Insurance System includes cattle insurance for foot and mouth
disease, and poultry insurance. The product coverage of Korea’s livestock insurance
scheme protecting farmers’ income from outbreaks of animal disease and natural disasters
more than doubled from 2002 to 2006 and now includes cattle, pork, chicken, horses, deer,
duck, pheasant, quail and turkey. France introduced a crop insurance scheme to help
farmers insure either individual crops, or the whole farm with the government subsidizing
35% of premiums (40% for young farmers).
Although many countries have disaster response plans in place incorporating
comprehensive risk management and cost benefit analysis, many policies also involve
ad hoc measures. Further reforms could be aimed at planning, prevention, minimising
consequences, and strengthening mechanisms to stabilise and protect household income
in exceptional circumstances. Traceability schemes and registers, where they have not
already been introduced, would help reduce the impact of a disease outbreak.
Organics continue to attract interest of consumers and governments
Organic production is growing in response to consumer demand including demands
for more traditional production systems and perceived higher quality food (commanding a
price premium), and governments are establishing policies to promote organic products.
Organic production can improve environmental performance of agriculture by using fewer
chemicals in less-intensive systems. However, organic production is often lower yielding
and therefore uses more land than conventional systems. The farm management practices
adopted are key factors in determining the overall environmental impact. Environmental
sustainability initiatives and related framework laws in many countries (Austria, Norway,Turkey, Belgian region of Flanders, Germany, France, Greece and Spain) were updated to
promote organic farming practices as ecologically sound. Some of the rural development
AGRICULTURAL POLICIES IN OECD COUNTRIES: MONITORING AND EVALUATION 2007 – ISBN 978-92-64-02746-6 – © OECD 2007 23
I.1. MAIN POLICY DEVELOPMENTS IN 2005 AND 2006
schemes, for example in the EU (discussed later in the chapter), also promote organic
agriculture. Plans on organic farming in general include three steps: development of
organic farms, increasing and promoting consumption, and institutional coordination
such as certification and labelling.
Subsidies, tax concessions, special quotas and credit schemes are used to encourage
adoption. From 2006 onwards, the Belgian region of Flanders simplified the per hectare
premium system in order to make it more accessible to farmers who want to convert to organic
farming. In the United Kingdom (Northern Ireland), the Organic Farming (Conversion of
Animal Housing) Scheme, facilitating the development of organic livestock production, was
closed to new applicants from September 2005. Germany continued payments to producers
for the introduction and maintenance of organic production. France offered a tax rebate to
farmers who earn 40% of their income from organic farming. Farmers are also able to
discount their conversion years when calculating historic reference amounts for the Single
Payment Scheme. Turkey in 2005 provided a new credit scheme at an interest rate of 25%-60%,
among others, to producers for organic farming, aromatic and medicinal crops, and good
farming practices. Norway in 2006 earmarked 10% of the milk quota bought by the state for
producers of organic milk.
The European Commission allowed the producers of organic food to choose whether
or not to use the EU organic logo. Imports of organic products are allowed but cannot be
marketed as organic unless they comply with EU standards or come with equivalent
guarantees from the country of origin. The German Federal Organic Farming Scheme
includes a variety of measures at all levels of the food chain, such as training, information,
advisory activities, supporting research and development projects, and technology transfers.
Estonia adopted the Organic Farming Law in 2006 which specifies the requirements for
organic farming in the areas not covered by EU regulations.
The Belgian region of Flanders approved a subsidy for a three-year organic food
promotion campaign to boost consumption of organic products in the region and promote
the expansion of organic farming. A commissioned survey in Spain revealed that domestic
consumption could be enhanced by providing consumers with more information on
organic products. A two-year promotional campaign commenced in 2006.
Bioenergy: targets and taxes to stimulate consumption, subsidies and premiums to increase production
Increased interest in bioenergy and biomaterials produced from agricultural biomass
has been driven by concerns over the environment and climate change (greenhouse gases),
energy security, diversification of energy sources, and market development for agricultural
products. Production of energy from agriculture is becoming an additional source of
income for agriculture and forestry. Increased biofuel production from agricultural sources
(sugar cane and beet, rapeseed and other oil crops, and maize) can have significant effects
on food and feed commodity prices through the competition for scarce land. In the long
run farmers and markets are likely to adjust to higher commodity prices. However, while
there is concern as to the economic and wider environmental effects (not only greenhouse
gases, but also water, soil erosion and biodiversity), the evidence is not yet clear.
Although high energy prices played a role in increasing interest in bioenergy, OECD
governments are increasingly active in supporting the production and use of bioenergy.
Policies pursued in many countries include stimulating demand for biofuels, developing
AGRICULTURAL POLICIES IN OECD COUNTRIES: MONITORING AND EVALUATION 2007 – ISBN 978-92-64-02746-6 – © OECD 200724
I.1. MAIN POLICY DEVELOPMENTS IN 2005 AND 2006
distribution networks, and supporting research and development. Taxes (or tax
concessions) are often used to encourage use of biofuels, while subsidies encourage the
steady supply of feedstocks and investment in processing capacity. Countries are seeking
new methods such as the chemical processing of waste food oil, or the use of methane gas
fermented from livestock waste.
Many countries, including the EU and EU member states, US and Japan, established
targets for biofuels in overall transport fuel strategies. Germany, where biofuels had earlier
benefited from tax concessions, passed a law in October 2006 obliging firms in the mineral
oil economy to use a minimum quota of biofuels from January 2007 onward. To reach the
national targets, France implemented an incentive tax system based on a fuel tax rebate
granted to eligible production of bio-ethanol and bio-diesel and an additional tax as a
penalty for fuel suppliers who do not incorporate enough biofuels into road fuels. Austriaalso followed a horizontal approach by introducing an obligation for the oil industry to
substitute a specific percentage of fuels based on mineral oil by biofuels. The Irishincentive scheme for biofuels resulted in eight projects being awarded excise relief for a
two year period. Italy provided that a share of production will be used for the production of
biofuels, as dealt with in special planting contracts or supply chain agreements, for
inclusion in the experimental “bio-ethanol” programme. The six-year programme
beginning in 2005 called for exemption of excise duty on bio-diesel within an annual limit.
In Sweden, biofuels are exempt from carbon dioxide and energy taxes from 2004 to 2008.
Norway also exempts biofuels from the carbon dioxide tax. In Australia, biofuels benefit
from reduced taxes compared to fossil fuels.
The EU member states are allowed to grant national aid of up to 50% of the costs of
establishing multi-annual crops on areas eligible for the energy crop aid. The energy crop
payments were extended to the ten new member states from 2007. The Belgian region ofFlanders granted premiums for the production of fuel crops. Lithuania doubled its support
to bio-diesel production between 2006 and 2005. As from 2005, energy crops in Turkeyenjoyed growing interest and the government supported production of canola through a
deficiency payment.
The Administration’s proposal for the 2007 US Farm Bill includes provisions for a bio-
energy and bio-based product research initiative and new funding for renewable energy
research and development and production, targeted to cellulosic ethanol. For the UnitedKingdom (England) the government proposed key measures to unlock the potential for
renewable energy in biomass, including: a capital grant scheme for biomass boilers; the
establishment of a new expert centre to provide information and advice; grant support for
biomass supply chains; and a commitment to consider using biomass heating in
government buildings. Among the priorities for the next three years are bioenergy, plant
based pharmaceuticals, and renewable construction materials and chemicals. Canadaintroduced an initiative to help agricultural producers develop sound business proposals
and undertake feasibility studies to support the creation and expansion of the biofuels
production capacity. Measures are in place in Germany to promote research, development
and demonstration projects as well as marketing.
Australia provides ethanol production grants and one-off capital grants for projects
that develop new or expanded biofuels production. Greece supports 40% of the capital
costs for bio-diesel plants and tax exemptions when biofuels are produced on the basis of
contracts between farmers and production units. The United States supports ethanol
AGRICULTURAL POLICIES IN OECD COUNTRIES: MONITORING AND EVALUATION 2007 – ISBN 978-92-64-02746-6 – © OECD 2007 25
I.1. MAIN POLICY DEVELOPMENTS IN 2005 AND 2006
production through a tax credit for domestic production and a tariff on imported ethanol.
Canada offers a line of credit to increase ethanol production capacity.
Sweden appointed a biofuels committee to evaluate its capacity to produce biofuels
from field crops and forestry, and mandated the committee to examine the ethical aspects
of producing biofuels because of trade-offs between using crops for food and for fuel,
particularly in the context where large parts of the world’s population cannot afford to buy
sufficient food.
Responding to consumer concerns about production processes with new regulations
In 2006, Denmark initiated a new food policy focussing on availability of healthy foods,
transparency through sufficient labelling, and food and veterinary research to promote
consumer health by securing safe and nutritious food. In January 2007, the Australiangovernment launched a review to examine outstanding issues on the consistent
application of food laws; levels of enforcement across jurisdictions; and the role of the
Australian government in the food regulatory system.
Food safety remains of crucial interest. The US issued compliance guidelines outlining
best management practices for each step in the broiler slaughter process and targeting
small poultry plants to help them better comply with regulatory requirements regarding
salmonella control. The EU banned the use of the last four antibiotics still allowed as feed
additives and tightened dioxin legislation. Korea widely applied the HACCP (Hazard
Analysis Critical Control Point) system to the livestock industry and launched a traceability
scheme for agricultural and livestock products. The Commonwealth of Australia and state
governments agreed in 2003 to a risk-based national system for livestock identification and
tracing. The system became a mandatory requirement for all cattle produced in June 2005,
and for all sheep and goats born after 1 January 2006.
In 2004, Norway established a Food Safety Authority, responsible for all matters
relating to health, quality and other consumer interests in feed and food production and
marketing, bringing together into one organisation responsibilities previously held by
several agencies. The Agricultural Authority of Iceland also combined multiple authorities
to monitor and gives guidance in areas concerning health and safety of livestock rearing
and production.
As a response to growing problems with dietary habits among the Japanese and
increasing occurrence of life-style diseases, the government is promoting Shokuiku.
Shokuiku increases food and nutrition awareness in order to help people to make healthy
food choices and thereby improve general well-being. The basic law on Shokuiku came into
effect in July 2005.
Animal welfare initiatives are not limited to actual welfare of farm animals, but
embrace tracking and traceability initiatives. In the United Kingdom, the Animal Welfare
Act came into effect in April 2007 simplifying animal welfare legislation, applying to
farmed and non-farmed animals. In Switzerland, about 40% of total ecological payments
are accorded to improve animal welfare. Temporary assistance was available in new EUmember states to help farmers meet costs related to compliance with EU environmental,
hygiene, welfare, food safety and occupational safety standards. New Zealand developed a
new code of welfare for deer in 2005.
AGRICULTURAL POLICIES IN OECD COUNTRIES: MONITORING AND EVALUATION 2007 – ISBN 978-92-64-02746-6 – © OECD 200726
I.1. MAIN POLICY DEVELOPMENTS IN 2005 AND 2006
Agriculture is still a focus of rural development, although diversification efforts are noticeable
As governments seek to enhance the quality of life of rural communities, agriculture
remains the main focus of rural development strategies for many of them. However, efforts
to increase funds for broader economic development and diversification of activities are
becoming noticeable.
In the Netherlands, the government, in a major policy document, has asserted that
farmers in naturally handicapped areas can expect compensation for their conservation
and protection efforts. To secure its rural development objectives, the government provides
funding for nature, agriculture, recreation, landscape, soil, water, reconstruction of sandy
soil areas and socio-economic vitality.
Japan introduced a new rural development programme in 2007 to encourage
community initiatives aimed at conserving the quality of rural resources and improve the
environment with a view to sustainable rural development. Direct payments to farmers in
hilly and mountainous areas aim to prevent the abandonment of agricultural land and to
maintain the multifunctional character of agriculture. Korea introduced a pilot project of
direct payments for landscape conservation in 2005 to farmers to preserve traditional
landscape in selected villages. A direct payment for less-favoured areas, introduced on a
pilot basis in 2004, became a national programme in 2006.
In Turkey the Participatory Rural Development Programme includes land
consolidation, institutional reinforcement of farmers’ organisations; and a village-based
participatory investment programme supporting community-based activities in small-
scale agricultural processing and marketing, as well as the rehabilitation of public
infrastructure related to the provision of public services in remote rural areas.
As part of a rural development scheme, Korea lowered health insurance premiums for
farmers by 50% (the other 50% is paid by the government), expanded government support
of pension payments, and implemented a support programme to improve living conditions
(e.g. education, medical services, and infrastructure). In particularly, disadvantaged
mountain areas in Italy social security relief is raised to 75% of employers’ share (as
opposed to 70% previously), whereas in disadvantaged agricultural areas and territory in
certain municipalities, relief is raised to 68% (compared to 40% previously).
The Korean government encouraged the diversification of off-farm income sources
through agro-tourism. Lithuania also supported alternative entrepreneurial activities in
rural areas in 2006, along with investment in water management systems and rural tourism.
The second pillar or Rural Development Regulation of Agenda 2000 includes various
measures co-financed by EU member states, drawn from a list of available measures that
can be tailored to the specific conditions facing rural areas. The measures that tend to
dominate the second pillar are payments to LFAs, agri-environmental measures, support to
young farmers, investment and infrastructure support, extension services, and assistance
for forestry, promotion and diversification of agriculture.
In EU member states, much of the direct budgetary support is provided in form of
Less-Favoured Area (LFA) payments per hectare of agricultural land. LFAs are defined as
mountain areas, areas in danger of abandonment or where conservation of the countryside
is necessary, and other areas affected by specific handicaps. In France in 2005 close to 30%
of national expenditures were allocated to LFA payments. Greece allocated about 46% of
AGRICULTURAL POLICIES IN OECD COUNTRIES: MONITORING AND EVALUATION 2007 – ISBN 978-92-64-02746-6 – © OECD 2007 27
I.1. MAIN POLICY DEVELOPMENTS IN 2005 AND 2006
the payments financed by the national budget to LFA. In new member states the share of
LFA payments often exceeds 60%.
Belgium implemented measures favouring young and woman farmers and supporting
investments. Investment assistance and setting up of young farmers in France made up
around 15% of national expenditures under the rural development programme (RDP).
Sweden supported agri-environmental payments to farmers for public good provision such
as biodiversity, farm investment, set-up aid for young farmers, and business training and
investments to improve processing and marketing. Denmark encourages environmentally
sustainable farming, organic farming and planting of shelter belts. In Portugal, most
expenditure was for investments in farm holdings and development and structural
adjustment of rural areas. Estonia offered a vocational educational support conditional
upon undertaking to work and live in the country once the studies are completed. The
amount of the support depends on academic achievement.
The rural development programme in the EU for the new implementation period 2007-13
was agreed in June 2005. Measures are grouped under four thematic axes: 1) improvement
of sector competitiveness by using measures to improve human and physical capital
(e.g. training, setting-up of young farmers, farm modernisation) and product quality;
2) land management which includes LFAs, agri-environmental schemes, animal welfare,
afforestation and non-productive investments; 3) diversification of the rural economy and
quality of life in rural areas encompassing measures for micro businesses, tourism, renovation
of villages, rural services and the conservation of rural heritage; and 4) Leader: bottom-up
strategies for local development, including multi-sectoral, as well as public-private
partnerships. The current definition of LFAs will be maintained until 2010.
EU member states are supporting rural development tailored to local needs through
decentralisation (addressed later) and regionalisation. Germany is promoting bottom-up
participation in formulating and implementing the development strategy with subregional
approaches that are expected to be better suited to subregional needs and promote rural
public-private partnerships.
The EU rural development programme for the new implementation period continues
to focus mostly on the agricultural sector. However, setting minimum shares of
expenditures for new priorities based on the different axes should further reinforce
sustainable land management and rural diversification efforts and promote cooperative,
multisectoral and integrated approaches to rural development.
Making progress towards decentralisation, sharing the cost of delivering policies and improving oversight
Decentralisation concerns many policy areas – environmental measures, disaster
management, rural development – where regional and local authorities are assumed to
have deeper knowledge about issues and how to solve them. Decentralisation also requires
co-ordination between national governments, regional and local authorities, and allows for
better targeting of the programmes. However, strong public administration, and regional
and local autonomy are prerequisites of successful decentralisation.
The Netherlands concluded a large decentralisation operation in 2006 with the signing
of management agreements between the national government and each of the
12 provinces. In these agreements, covering a period of seven years, measurable
AGRICULTURAL POLICIES IN OECD COUNTRIES: MONITORING AND EVALUATION 2007 – ISBN 978-92-64-02746-6 – © OECD 200728
I.1. MAIN POLICY DEVELOPMENTS IN 2005 AND 2006
performance targets are set for each national objective and the government will make
financial resources available to help achieve the targets.
Reform of public administration and integration of various levels of governance in Italyis one of the policy objectives. The underlying premise is that continuing decentralization of
subsidy provision reinforces the principle of assigning competence to the territorial
government nearest to where citizens live. The main reasons for the decentralization of
responsibilities under the National Environmental Programme in Norway are to raise local
public awareness of agri-environmental issues, to better target local needs and to improve
the efficiency of delivery. In Sweden, an important element of the rural development
programme is the increased role of local and regional authorities in planning, decision
making, implementation and follow-up of the various measures. The aim is a more efficient
use of funds. In Mexico, Alianza programmes are designed to decentralise decision making
and implementation through the participation and funding of federal and local governments
as well as producers. In Canada, major agricultural policies are delivered through a policy
framework agreed with the provinces, who share in the cost of programme delivery.
In Denmark from 1 January 2007 a major reform of the municipal structure has taken
effect. The new larger municipalities assume a number of responsibilities from the former
counties including administration of regulations on nature protection, environment and
physical planning. Approval in respect of Environmental Impact Assessments, nature and
water protection, and odour was combined into a single administration in the new
municipalities.
In New Zealand most of the responsibilities, such as soil conservation cost-share
programmes, flood control and drainage works, and pest plant and animal control
programmes, under the Resource Management Act are assigned to regional and district
councils. Japanese prefecture and local governments provide infrastructure and extension
services. Korea implemented the Regional Agriculture Cluster Programme establishing
regional networks among the academic community, research institutes, the industrial
sector, and local governments to provide technical or marketing assistance to farmers.
1.2. Developments in trade policyNegotiations on the Doha Development Agenda did not advance significantly in 2005-06.
Some areas, such as trade facilitation discussions, have been progressing. Talks paused
and then resumed, but agreement has not yet been reached in many areas. Agriculture
remains an area of particular difficulty with significant issues still outstanding on all three
pillars of the negotiations.
Multilateral minimum access commitments
Fill rates of tariff-rate-quotas (TRQs) varied. Japan’s TRQs continued to be underfilled
in 2006 for some products, including skimmed milk powder due to invocation of a special
safeguard measure. Korea’s fill rate was around 67% in 2006. 40% of the EU’s individual
TRQs were fully filled in 2001/02. In November 2005, Korea extended special treatment for
rice until 2014 and increased minimum market access amounts.
Disciplines on export competition
Helped by high commodity prices and World Trade Organisation (WTO) commitments,
the use of export subsidies is on the decline, and so is their product coverage. Switzerland
AGRICULTURAL POLICIES IN OECD COUNTRIES: MONITORING AND EVALUATION 2007 – ISBN 978-92-64-02746-6 – © OECD 2007 29
I.1. MAIN POLICY DEVELOPMENTS IN 2005 AND 2006
applied export subsidies mainly to dairy products (around 85% of the total in 2005 and
2006), live animal exports, fruits and potatoes. Norway used export subsidies to promote
branded cheese, processed agricultural products and surplus meat, eggs and dairy
products. Norway used the full volume and value of its URAA commitment on cheese in
most years. The EU remained well below its WTO ceiling for export subsidies in the
marketing year 2002/03, except in cheese, rice, fresh fruits and vegetables, and wine where
over 90% of the allowance was used, in volume. In 2006, Turkey provided export subsidies
in the form of deductions in taxes, social insurance premium costs, telecommunication
costs or energy costs on 16 commodity groups (e.g. processed fruit and vegetables, fruit
juices, olive oil, potatoes, apples, poultrymeat and eggs) out of the 44 eligible groups.
Canada used the full volume and value of permitted export subsidies on dairy products. In
the United States, the total value of products covered by export credit guarantees under
the Export Credit Guarantee Program decreased by 26% in 2005 and again by 37% in 2006 to
USD 1.4 billion.
A small number of state trading enterprises continues to operate
The Canadian Wheat Board markets all wheat and barley grown in designated areas of
western Canada, pools sales revenue and returns proceeds to producers through a series of
payments, and negotiates rail car supply and allocation. During a plebiscite held in
February and March 2007, the majority (62%) of producers voted in favour of the marketing
choice option under which they would be able to market barley outside of the CWB.
Those who wish to export kiwi fruit from New Zealand (except to Australia) must
obtain a permit from the New Zealand Kiwifruit Board to market collaboratively with
Zespri, the main exporter of kiwifruit. In Australia there are some statutory and regulatory
arrangements (mainly at state level) that allow for export control of a few commodities,
including wheat, barley, rice, lupins and canola in certain states. In December 2006, the
government implemented temporary changes to the bulk wheat export marketing
arrangements, effective until 30 June 2007, although this does not remove the export
single-desk arrangements. These changes provide time for the government to review its
long-term export market arrangements, following the Cole Inquiry.
Sanitary and phytosanitary measures in reaction to animal diseases to protect human and animal health
The EU banned poultry imports from various countries affected by avian influenza over
the period 2005-06. A ban on live birds from all countries was imposed in October 2005 and
was maintained until the end of January 2006. To prevent the spread of Newcastle disease,
regional bans on poultry imports from Bulgaria and Romania were imposed in spring 2006.
Following cases of foot and mouth disease in Brazil and parts of Argentina, the EUtemporarily banned beef imports from the regions in 2005 and 2006.
The ban on British beef exports to other EU countries introduced in 1996 at the height
of the BSE crisis was lifted in spring 2006. After a case of BSE was confirmed in Canada in
May 2003 and in the United States in December 2003, Japan suspended imports of
Canadian and US beef and related products. Imports resumed in 2005 conditional on the
compliance with the agreed Export Program. After detecting specified risk materials in US
beef in January 2006, imports from the United States were suspended until measures to
prevent any recurrences were taken. Imports were resumed in July 2006.
AGRICULTURAL POLICIES IN OECD COUNTRIES: MONITORING AND EVALUATION 2007 – ISBN 978-92-64-02746-6 – © OECD 200730
I.1. MAIN POLICY DEVELOPMENTS IN 2005 AND 2006
More transparency in regulations to avoid barriers to trade
Japan established a positive list of maximum pesticide residues in May 2006, responding
to concerns that the negative list was not providing adequate protection. Australia is
helping in the development of international animal welfare guidelines, following efforts to
improve animal welfare for live animal exports at home. In 2005, Switzerland simplified
the administration of imports, custom declarations and TRQs.
The European Commission proposed new rules on geographical name protection in
January 2006. Non-EU producers wanting to register a product as a Protected Geographical
Indication, a protected Designation of Origin or a Traditional Specialties Guaranteed will be
able to apply directly to the EU and no longer have to have their governments apply on their
behalf. In addition, their governments will not have to satisfy the EU that they give similar
protection to corresponding European goods in their own market, allowing coffee and
other products not grown in the EU to obtain such denominations.
Australia introduced a country of origin labelling standard for packaged food and
unpackaged fresh and processed fruit, vegetables, nuts, seafood and pork.
A number of dispute settlement procedures were ongoing
In October 2006, a WTO panel requested by the United States in 2003 ruled that the EUmoratorium on the authorisation of new genetically modified crops between 2001 and 2004
hampered trade because of the long approval process for sales and that national bans were
inconsistent with the EU Communities’ WTO obligations.
In July 2005, the United States announced measures to comply with a WTO ruling on
the dispute with Brazil regarding certain US agricultural programmes primarily benefiting
cotton. Risk-based fees were introduced to cover long-term operating costs and losses and
the upland cotton user marketing certificate was ended as of July 2006.
In response to a WTO ruling in March 2006, Mexico eliminated the 20% tax on beverages
containing high fructose corn syrup (HFCS) and sweeteners other than sugar. Also
responding to a WTO ruling from February 2006, the EU created a new tariff line and
adjusted its tariffs on frozen boneless chicken cuts.
Ecuador requested formal WTO consultations concerning EU import arrangements for
bananas in November 2006, followed by a panel request in March 2007. The EU applies a
tariff quota for African, Caribbean and Pacific countries.
In January 2005, the EU asked the WTO to establish a new panel on the beef hormone
issue stating that Canada and the United States failed to lift their sanctions against the EU
despite the fact that the EU had adopted new legislation in 2003. The EU maintains that this
new legislation had been based on a comprehensive risk assessment following the
conclusion of the first panel. Canada and the United States do not believe that the revised
legislation can be considered an implementation of the WTO recommendations and rulings
related to beef hormones. A WTO Panel is expected to issue a report on this topic before the
end of 2007.
In December 2006, the EU requested a dispute settlement panel to investigate extra
duties imposed on European olive oil exports by Mexico.
In January 2007, Canada requested consultations with the United States on subsidies
provided to U.S. corn growers and on the total level of U.S. trade-distorting agricultural
support, arguing that these policies are inconsistent with the United States’ WTO obligations.
AGRICULTURAL POLICIES IN OECD COUNTRIES: MONITORING AND EVALUATION 2007 – ISBN 978-92-64-02746-6 – © OECD 2007 31
I.1. MAIN POLICY DEVELOPMENTS IN 2005 AND 2006
Other trade issues
Exports of dairy products from New Zealand are regulated where importing countries
have country specific tariff quotas for New Zealand products. The New Zealand Dairy
Board, a wholly owned subsidiary of Fonterra, holds exclusive access to these markets for
fixed periods. This legislation is currently under review.
Following a European Court of Justice ruling, the EU introduced new import
arrangements for its WTO bound tariff rate quota for butter from New Zealand, applicable
from 2007. Licences for quota butter imports from New Zealand into the EU will no longer
be awarded exclusively to the single European importer that the New Zealand exporter
historically chose to trade with. From 2007 onwards, any importer on the European
approved list may apply for an import licence. Forty-five per cent of import licences will be
allocated to “new” importers.
The EU reached a new rice import deal with Thailand in March 2006 after similar
arrangements with the United States, India and Pakistan. In March 2006, the EU and the
United States signed a bilateral wine trade agreement that includes a partial mutual
recognition of names of origin, technical oenological practices and simplified certification
rules. Russia and the EU agreed to apply trade bans at the regional rather than national
level in the event of animal disease outbreaks, to improve co-operation between veterinary
and customs authorities and to work towards creating a standard procedure for reporting
frauds. The EU and China agreed to reduce the imports of illegal food products into Europe
by improving exchange of information and speed of communication. To provide
compensatory adjustment for EU enlargement, the EU offered new TRQs. Some of them are
erga omnes and some allocated to specific countries such as Australia, Canada, China, NewZealand, Brazil, Thailand and the United States. These TRQs compensate countries for the
increase in new member states’ tariffs.
Turkey and Australia signed a Memorandum of Understanding in December 2005
proposing exchanges of scientific and technical information, research reports and experts,
agricultural trade and investment related activities, and other joint activities. In June 2006,
a Breeder Cattle Protocol was agreed to facilitate the export of cattle from Australia to
Turkey. In 2006, Australia agreed on Agricultural Technical Cooperation programme with
China to share expertise in agricultural development, management of supply chains,
quarantine, rural adjustment and the environment. Australia also signed an MoU with
Malaysia in March 2006 establishing broad agricultural co-operation between the two
countries.
The number of free trade agreements was increasing
OECD members are continuing to negotiate bilateral and regional free trade
agreements (FTAs) and conducting studies to determine the feasibility of new ones. Many
FTAs contain agricultural provisions, although many omit them. Developing countries, in
particular smaller, more disadvantaged countries, are often awarded special concessions
on their exports.
The EU and Switzerland signed a bilateral agreement in February 2005 complementing
the earlier free trade agreement. In 2006, The European Free Trade Association (Iceland,
Liechtenstein, Norway and Switzerland) signed agreements with the South African
Customs Union and with Egypt, and implemented previously signed agreements with
Korea. In 2005 and 2006, Japan signed FTAs with several countries mainly in South-East
AGRICULTURAL POLICIES IN OECD COUNTRIES: MONITORING AND EVALUATION 2007 – ISBN 978-92-64-02746-6 – © OECD 200732
I.1. MAIN POLICY DEVELOPMENTS IN 2005 AND 2006
Asia requiring Japan to eliminate or reduce tariffs, or to introduce preferential tariff-quotas
for several sensitive agricultural products such as poultrymeat and several fruits. In 2005,
New Zealand finalised a closer economic partnership agreement with Thailand, and a
strategic economic partnership agreement with Singapore, Brunei and Chile.
The United States implemented legislation for the United States-Central America-
Dominican Republic FTA covering Costa Rica, the Dominican Republic, El Salvador,
Guatemala, Honduras and Nicaragua. All but Costa Rica have ratified the agreement. The
Agreement makes the existing Caribbean Basin Initiative permanent and the Generalized
System of Preferences duty-free benefits and phases out the remaining tariffs. The United
States-Oman FTA, eliminating duties and commercial barriers to most bilateral trade in
goods and services between the two countries, and providing immediate duty-free access
on all current agricultural products from Oman was implemented in 2006.
An FTA between Mexico and Japan entered into force in 2005. In 2006, Korea implemented
FTAs with Singapore and the European Free Trade Association. In the FTA with ASEAN,
71 sensitive agricultural products for Korea are exempt from tariff reductions. Many other
countries were also actively pursuing free trade agreements, preparing to launch new
negotiations or exploring feasibility of additional bilateral trade and investment
agreements.
AGRICULTURAL POLICIES IN OECD COUNTRIES: MONITORING AND EVALUATION 2007 – ISBN 978-92-64-02746-6 – © OECD 2007 33

ISBN 978-92-64-02746-6
Agricultural Policies in OECD Countries
Monitoring and Evaluation 2007
© OECD 2007
PART I
Chapter 2
Evaluation of Support Policy Developments
This chapter evaluates changes in agricultural support in OECD countries, both inthe short term (2006 compared with 2005) and over the longer term (the 2004-06average compared with the 1986-88 base period). It first discusses the level ofsupport provided to producers at the OECD total level and how this varies betweenOECD countries. Changes in the composition of support are then considered. This isimportant because the effects of support on production, trade, income and theenvironment are related to the way in and conditions under which it is delivered toproducers. Finally, the chapter investigates the commodity specificity of how supportis provided – to specific commodities, groups of commodities, or any (or no)commodity. Estimates are also provided on the level and composition of support toconsumers and to general agricultural services and the total value of support thatresults from agricultural policies. Finally, some conclusions are drawn aboutagricultural policy reform progress being made in OECD countries in terms oflowering the level of support, shifting to less production-linked policy measures andincreasing the flexibility in commodity production choices available to producersthrough reducing the commodity-specificity of programmes.
35
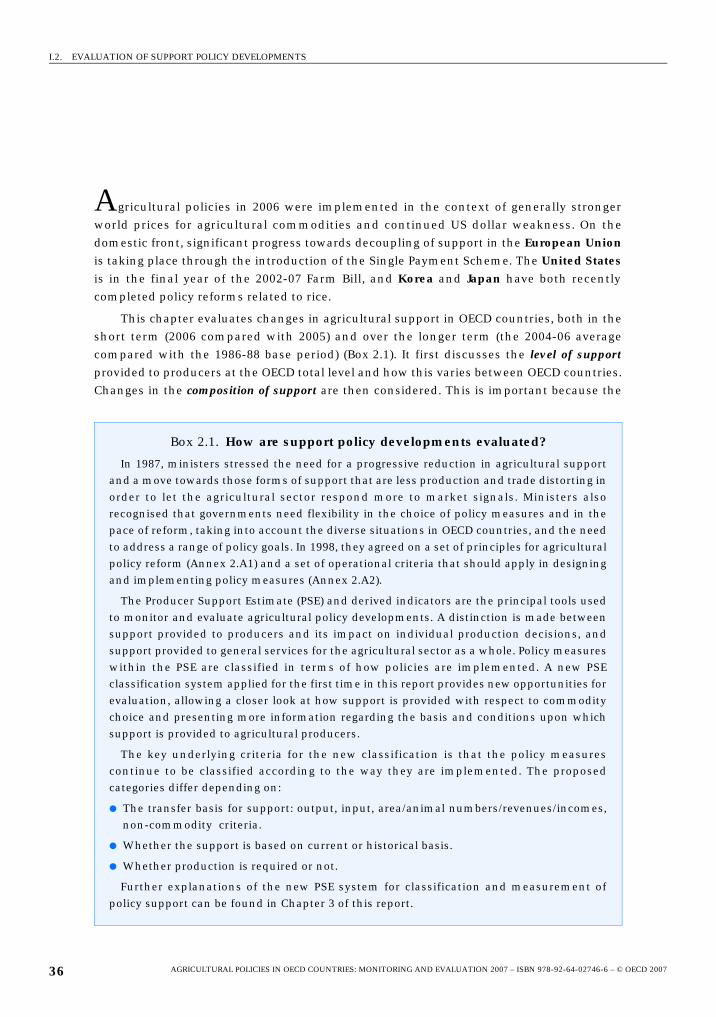
I.2. EVALUATION OF SUPPORT POLICY DEVELOPMENTS
Agricultural policies in 2006 were implemented in the context of generally stronger
world prices for agricultural commodities and continued US dollar weakness. On the
domestic front, significant progress towards decoupling of support in the European Unionis taking place through the introduction of the Single Payment Scheme. The United Statesis in the final year of the 2002-07 Farm Bill, and Korea and Japan have both recently
completed policy reforms related to rice.
This chapter evaluates changes in agricultural support in OECD countries, both in the
short term (2006 compared with 2005) and over the longer term (the 2004-06 average
compared with the 1986-88 base period) (Box 2.1). It first discusses the level of supportprovided to producers at the OECD total level and how this varies between OECD countries.
Changes in the composition of support are then considered. This is important because the
Box 2.1. How are support policy developments evaluated?
In 1987, ministers stressed the need for a progressive reduction in agricultural supportand a move towards those forms of support that are less production and trade distorting inorder to let the agricultural sector respond more to market signals. Ministers alsorecognised that governments need flexibility in the choice of policy measures and in thepace of reform, taking into account the diverse situations in OECD countries, and the needto address a range of policy goals. In 1998, they agreed on a set of principles for agriculturalpolicy reform (Annex 2.A1) and a set of operational criteria that should apply in designingand implementing policy measures (Annex 2.A2).
The Producer Support Estimate (PSE) and derived indicators are the principal tools usedto monitor and evaluate agricultural policy developments. A distinction is made betweensupport provided to producers and its impact on individual production decisions, andsupport provided to general services for the agricultural sector as a whole. Policy measureswithin the PSE are classified in terms of how policies are implemented. A new PSEclassification system applied for the first time in this report provides new opportunities forevaluation, allowing a closer look at how support is provided with respect to commoditychoice and presenting more information regarding the basis and conditions upon whichsupport is provided to agricultural producers.
The key underlying criteria for the new classification is that the policy measurescontinue to be classified according to the way they are implemented. The proposedcategories differ depending on:
● The transfer basis for support: output, input, area/animal numbers/revenues/incomes,non-commodity criteria.
● Whether the support is based on current or historical basis.
● Whether production is required or not.
Further explanations of the new PSE system for classification and measurement ofpolicy support can be found in Chapter 3 of this report.
AGRICULTURAL POLICIES IN OECD COUNTRIES: MONITORING AND EVALUATION 2007 – ISBN 978-92-64-02746-6 – © OECD 200736
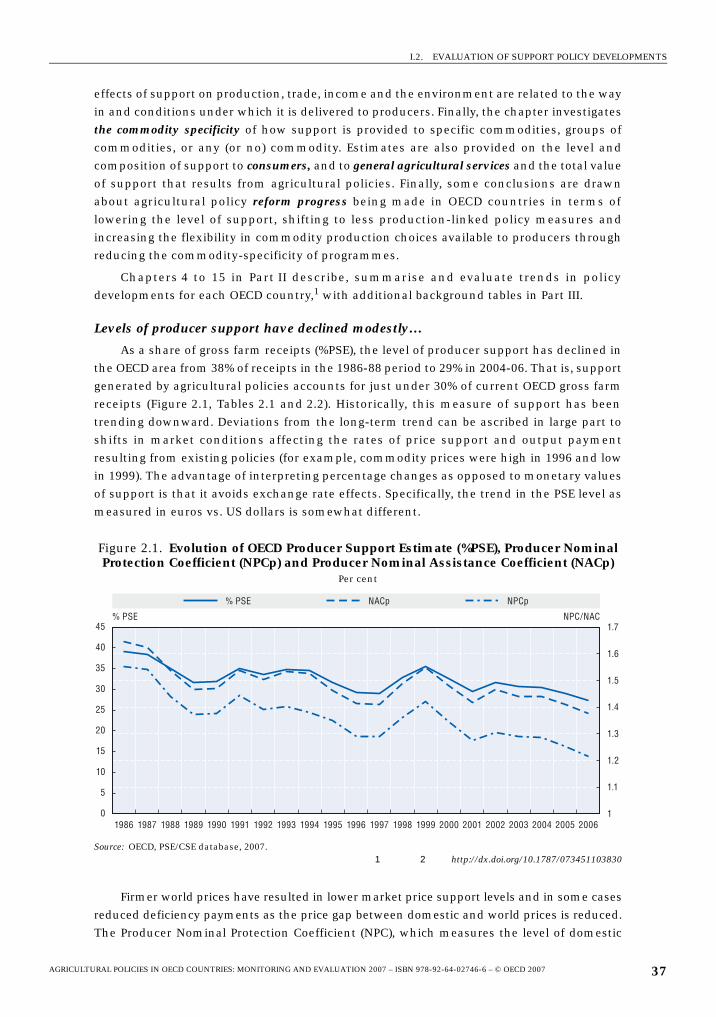
I.2. EVALUATION OF SUPPORT POLICY DEVELOPMENTS
effects of support on production, trade, income and the environment are related to the way
in and conditions under which it is delivered to producers. Finally, the chapter investigates
the commodity specificity of how support is provided to specific commodities, groups of
commodities, or any (or no) commodity. Estimates are also provided on the level and
composition of support to consumers, and to general agricultural services and the total value
of support that results from agricultural policies. Finally, some conclusions are drawn
about agricultural policy reform progress being made in OECD countries in terms of
lowering the level of support, shifting to less production-linked policy measures and
increasing the flexibility in commodity production choices available to producers through
reducing the commodity-specificity of programmes.
Chapters 4 to 15 in Part II describe, summarise and evaluate trends in policy
developments for each OECD country,1 with additional background tables in Part III.
Levels of producer support have declined modestly…
As a share of gross farm receipts (%PSE), the level of producer support has declined in
the OECD area from 38% of receipts in the 1986-88 period to 29% in 2004-06. That is, support
generated by agricultural policies accounts for just under 30% of current OECD gross farm
receipts (Figure 2.1, Tables 2.1 and 2.2). Historically, this measure of support has been
trending downward. Deviations from the long-term trend can be ascribed in large part to
shifts in market conditions affecting the rates of price support and output payment
resulting from existing policies (for example, commodity prices were high in 1996 and low
in 1999). The advantage of interpreting percentage changes as opposed to monetary values
of support is that it avoids exchange rate effects. Specifically, the trend in the PSE level as
measured in euros vs. US dollars is somewhat different.
Firmer world prices have resulted in lower market price support levels and in some cases
reduced deficiency payments as the price gap between domestic and world prices is reduced.
The Producer Nominal Protection Coefficient (NPC), which measures the level of domestic
Figure 2.1. Evolution of OECD Producer Support Estimate (%PSE), Producer Nominal Protection Coefficient (NPCp) and Producer Nominal Assistance Coefficient (NACp)
Per cent
Source: OECD, PSE/CSE database, 2007.1 2 http://dx.doi.org/10.1787/073451103830
% PSE NACp NPCp
% PSE NPC/NAC
0
5
10
15
20
25
30
35
40
45
1.1
1.2
1.3
1.4
1.5
1.6
1.7
11986 1987 1988 1989 1990 1991 1992 1993 1994 1995 1996 1997 1998 1999 2000 2001 2002 2003 2004 2005 2006
AGRICULTURAL POLICIES IN OECD COUNTRIES: MONITORING AND EVALUATION 2007 – ISBN 978-92-64-02746-6 – © OECD 2007 37
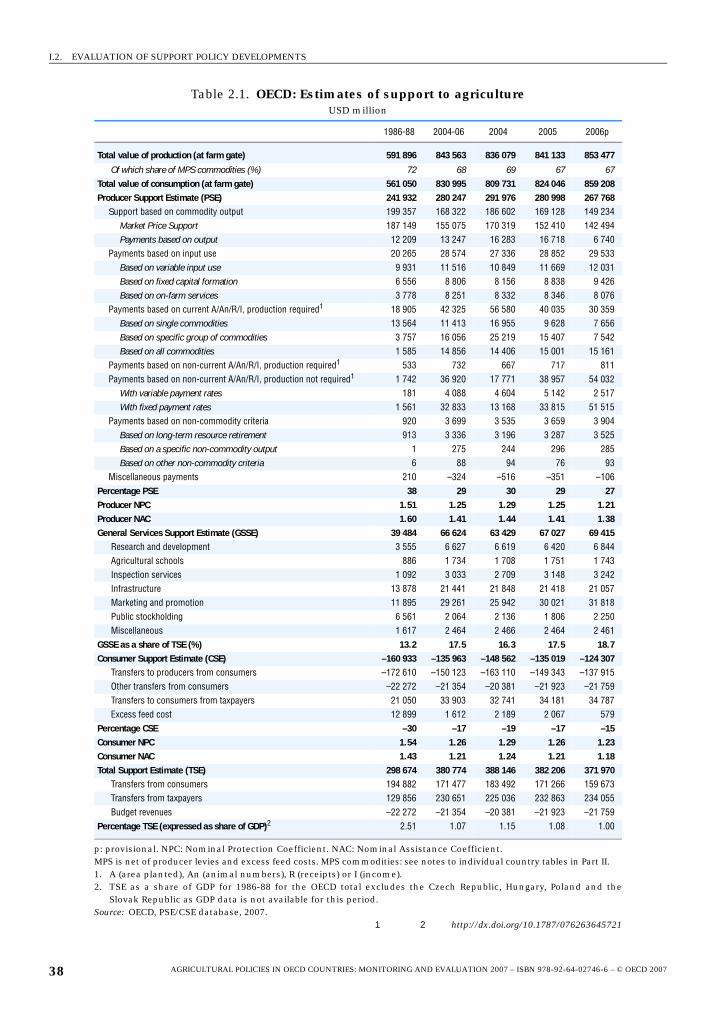
I.2. EVALUATION OF SUPPORT POLICY DEVELOPMENTS
Table 2.1. OECD: Estimates of support to agricultureUSD million
1986-88 2004-06 2004 2005 2006p
Total value of production (at farm gate) 591 896 843 563 836 079 841 133 853 477
Of which share of MPS commodities (%) 72 68 69 67 67Total value of consumption (at farm gate) 561 050 830 995 809 731 824 046 859 208Producer Support Estimate (PSE) 241 932 280 247 291 976 280 998 267 768
Support based on commodity output 199 357 168 322 186 602 169 128 149 234Market Price Support 187 149 155 075 170 319 152 410 142 494Payments based on output 12 209 13 247 16 283 16 718 6 740
Payments based on input use 20 265 28 574 27 336 28 852 29 533Based on variable input use 9 931 11 516 10 849 11 669 12 031Based on fixed capital formation 6 556 8 806 8 156 8 838 9 426Based on on-farm services 3 778 8 251 8 332 8 346 8 076
Payments based on current A/An/R/I, production required1 18 905 42 325 56 580 40 035 30 359Based on single commodities 13 564 11 413 16 955 9 628 7 656Based on specific group of commodities 3 757 16 056 25 219 15 407 7 542Based on all commodities 1 585 14 856 14 406 15 001 15 161
Payments based on non-current A/An/R/I, production required1 533 732 667 717 811Payments based on non-current A/An/R/I, production not required1 1 742 36 920 17 771 38 957 54 032
With variable payment rates 181 4 088 4 604 5 142 2 517With fixed payment rates 1 561 32 833 13 168 33 815 51 515
Payments based on non-commodity criteria 920 3 699 3 535 3 659 3 904Based on long-term resource retirement 913 3 336 3 196 3 287 3 525Based on a specific non-commodity output 1 275 244 296 285Based on other non-commodity criteria 6 88 94 76 93
Miscellaneous payments 210 –324 –516 –351 –106Percentage PSE 38 29 30 29 27Producer NPC 1.51 1.25 1.29 1.25 1.21Producer NAC 1.60 1.41 1.44 1.41 1.38General Services Support Estimate (GSSE) 39 484 66 624 63 429 67 027 69 415
Research and development 3 555 6 627 6 619 6 420 6 844 Agricultural schools 886 1 734 1 708 1 751 1 743 Inspection services 1 092 3 033 2 709 3 148 3 242 Infrastructure 13 878 21 441 21 848 21 418 21 057 Marketing and promotion 11 895 29 261 25 942 30 021 31 818 Public stockholding 6 561 2 064 2 136 1 806 2 250 Miscellaneous 1 617 2 464 2 466 2 464 2 461
GSSE as a share of TSE (%) 13.2 17.5 16.3 17.5 18.7Consumer Support Estimate (CSE) –160 933 –135 963 –148 562 –135 019 –124 307
Transfers to producers from consumers –172 610 –150 123 –163 110 –149 343 –137 915 Other transfers from consumers –22 272 –21 354 –20 381 –21 923 –21 759 Transfers to consumers from taxpayers 21 050 33 903 32 741 34 181 34 787 Excess feed cost 12 899 1 612 2 189 2 067 579
Percentage CSE –30 –17 –19 –17 –15Consumer NPC 1.54 1.26 1.29 1.26 1.23Consumer NAC 1.43 1.21 1.24 1.21 1.18Total Support Estimate (TSE) 298 674 380 774 388 146 382 206 371 970
Transfers from consumers 194 882 171 477 183 492 171 266 159 673 Transfers from taxpayers 129 856 230 651 225 036 232 863 234 055 Budget revenues –22 272 –21 354 –20 381 –21 923 –21 759
Percentage TSE (expressed as share of GDP)2 2.51 1.07 1.15 1.08 1.00
p: provisional. NPC: Nominal Protection Coefficient. NAC: Nominal Assistance Coefficient.MPS is net of producer levies and excess feed costs. MPS commodities: see notes to individual country tables in Part II.1. A (area planted), An (animal numbers), R (receipts) or I (income).2. TSE as a share of GDP for 1986-88 for the OECD total excludes the Czech Republic, Hungary, Poland and the
Slovak Republic as GDP data is not available for this period.Source: OECD, PSE/CSE database, 2007.
1 2 http://dx.doi.org/10.1787/076263645721
AGRICULTURAL POLICIES IN OECD COUNTRIES: MONITORING AND EVALUATION 2007 – ISBN 978-92-64-02746-6 – © OECD 200738
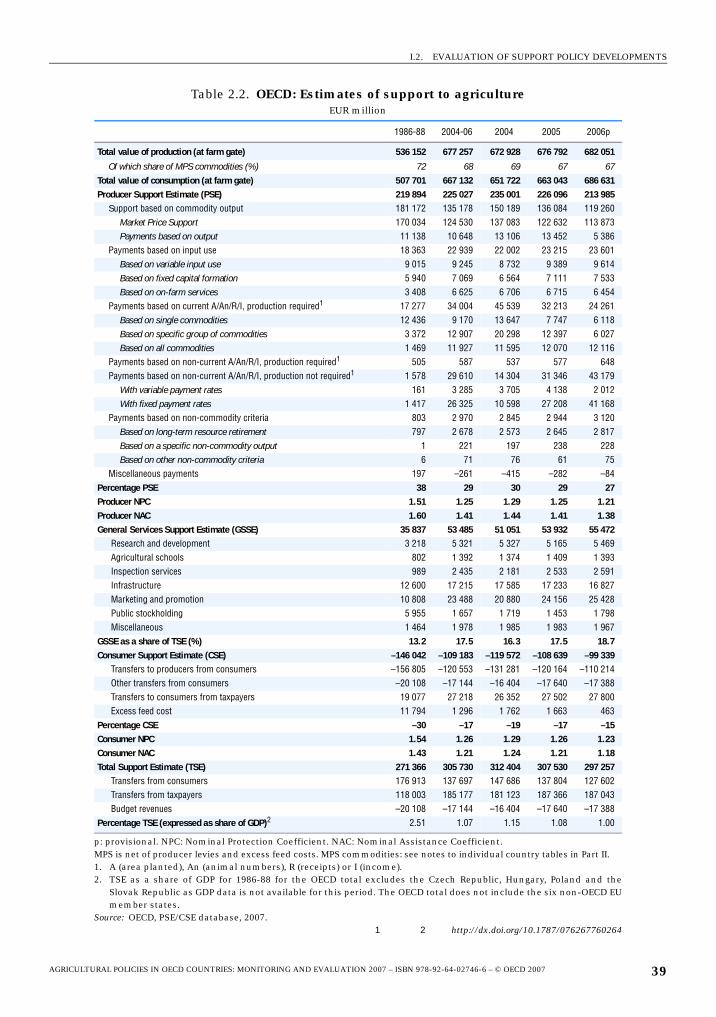
I.2. EVALUATION OF SUPPORT POLICY DEVELOPMENTS
Table 2.2. OECD: Estimates of support to agricultureEUR million
1986-88 2004-06 2004 2005 2006p
Total value of production (at farm gate) 536 152 677 257 672 928 676 792 682 051
Of which share of MPS commodities (%) 72 68 69 67 67Total value of consumption (at farm gate) 507 701 667 132 651 722 663 043 686 631Producer Support Estimate (PSE) 219 894 225 027 235 001 226 096 213 985
Support based on commodity output 181 172 135 178 150 189 136 084 119 260Market Price Support 170 034 124 530 137 083 122 632 113 873Payments based on output 11 138 10 648 13 106 13 452 5 386
Payments based on input use 18 363 22 939 22 002 23 215 23 601Based on variable input use 9 015 9 245 8 732 9 389 9 614Based on fixed capital formation 5 940 7 069 6 564 7 111 7 533Based on on-farm services 3 408 6 625 6 706 6 715 6 454
Payments based on current A/An/R/I, production required1 17 277 34 004 45 539 32 213 24 261Based on single commodities 12 436 9 170 13 647 7 747 6 118Based on specific group of commodities 3 372 12 907 20 298 12 397 6 027Based on all commodities 1 469 11 927 11 595 12 070 12 116
Payments based on non-current A/An/R/I, production required1 505 587 537 577 648Payments based on non-current A/An/R/I, production not required1 1 578 29 610 14 304 31 346 43 179
With variable payment rates 161 3 285 3 705 4 138 2 012With fixed payment rates 1 417 26 325 10 598 27 208 41 168
Payments based on non-commodity criteria 803 2 970 2 845 2 944 3 120Based on long-term resource retirement 797 2 678 2 573 2 645 2 817Based on a specific non-commodity output 1 221 197 238 228Based on other non-commodity criteria 6 71 76 61 75
Miscellaneous payments 197 –261 –415 –282 –84Percentage PSE 38 29 30 29 27Producer NPC 1.51 1.25 1.29 1.25 1.21Producer NAC 1.60 1.41 1.44 1.41 1.38General Services Support Estimate (GSSE) 35 837 53 485 51 051 53 932 55 472
Research and development 3 218 5 321 5 327 5 165 5 469 Agricultural schools 802 1 392 1 374 1 409 1 393 Inspection services 989 2 435 2 181 2 533 2 591 Infrastructure 12 600 17 215 17 585 17 233 16 827 Marketing and promotion 10 808 23 488 20 880 24 156 25 428 Public stockholding 5 955 1 657 1 719 1 453 1 798 Miscellaneous 1 464 1 978 1 985 1 983 1 967
GSSE as a share of TSE (%) 13.2 17.5 16.3 17.5 18.7Consumer Support Estimate (CSE) –146 042 –109 183 –119 572 –108 639 –99 339
Transfers to producers from consumers –156 805 –120 553 –131 281 –120 164 –110 214 Other transfers from consumers –20 108 –17 144 –16 404 –17 640 –17 388 Transfers to consumers from taxpayers 19 077 27 218 26 352 27 502 27 800 Excess feed cost 11 794 1 296 1 762 1 663 463
Percentage CSE –30 –17 –19 –17 –15Consumer NPC 1.54 1.26 1.29 1.26 1.23Consumer NAC 1.43 1.21 1.24 1.21 1.18Total Support Estimate (TSE) 271 366 305 730 312 404 307 530 297 257
Transfers from consumers 176 913 137 697 147 686 137 804 127 602 Transfers from taxpayers 118 003 185 177 181 123 187 366 187 043 Budget revenues –20 108 –17 144 –16 404 –17 640 –17 388
Percentage TSE (expressed as share of GDP)2 2.51 1.07 1.15 1.08 1.00
p: provisional. NPC: Nominal Protection Coefficient. NAC: Nominal Assistance Coefficient.MPS is net of producer levies and excess feed costs. MPS commodities: see notes to individual country tables in Part II.1. A (area planted), An (animal numbers), R (receipts) or I (income).2. TSE as a share of GDP for 1986-88 for the OECD total excludes the Czech Republic, Hungary, Poland and the
Slovak Republic as GDP data is not available for this period. The OECD total does not include the six non-OECD EUmember states.
Source: OECD, PSE/CSE database, 2007.1 2 http://dx.doi.org/10.1787/076267760264
AGRICULTURAL POLICIES IN OECD COUNTRIES: MONITORING AND EVALUATION 2007 – ISBN 978-92-64-02746-6 – © OECD 2007 39
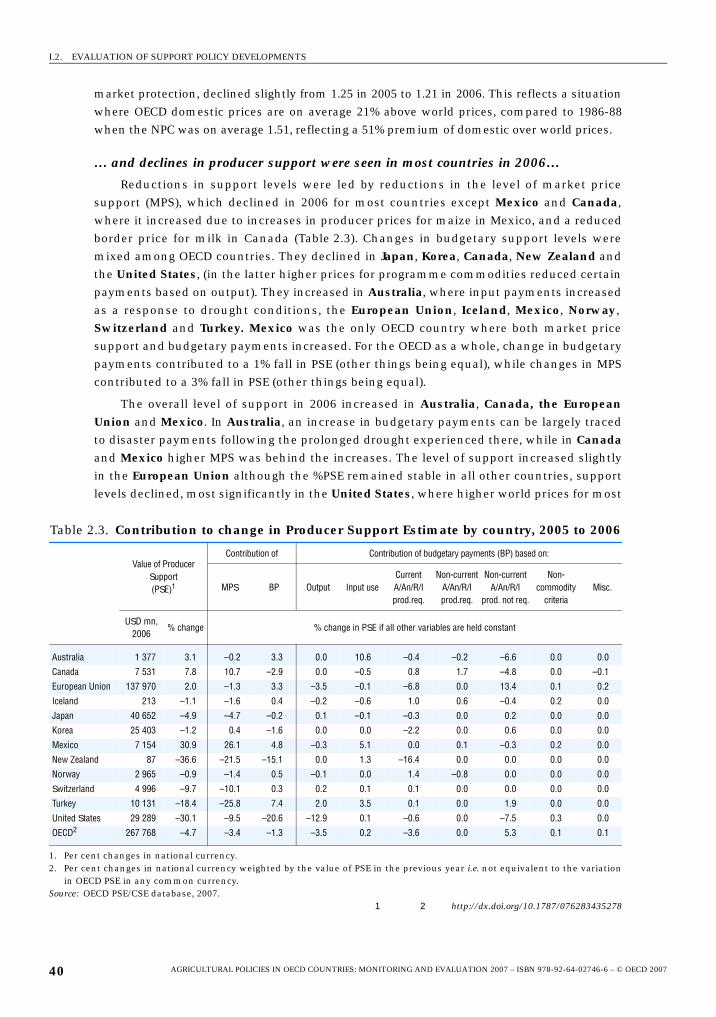
I.2. EVALUATION OF SUPPORT POLICY DEVELOPMENTS
market protection, declined slightly from 1.25 in 2005 to 1.21 in 2006. This reflects a situation
where OECD domestic prices are on average 21% above world prices, compared to 1986-88
when the NPC was on average 1.51, reflecting a 51% premium of domestic over world prices.
… and declines in producer support were seen in most countries in 2006…
Reductions in support levels were led by reductions in the level of market price
support (MPS), which declined in 2006 for most countries except Mexico and Canada,
where it increased due to increases in producer prices for maize in Mexico, and a reduced
border price for milk in Canada (Table 2.3). Changes in budgetary support levels were
mixed among OECD countries. They declined in Japan, Korea, Canada, New Zealand and
the United States, (in the latter higher prices for programme commodities reduced certain
payments based on output). They increased in Australia, where input payments increased
as a response to drought conditions, the European Union, Iceland, Mexico, Norway,
Switzerland and Turkey. Mexico was the only OECD country where both market price
support and budgetary payments increased. For the OECD as a whole, change in budgetary
payments contributed to a 1% fall in PSE (other things being equal), while changes in MPS
contributed to a 3% fall in PSE (other things being equal).
The overall level of support in 2006 increased in Australia, Canada, the EuropeanUnion and Mexico. In Australia, an increase in budgetary payments can be largely traced
to disaster payments following the prolonged drought experienced there, while in Canadaand Mexico higher MPS was behind the increases. The level of support increased slightly
in the European Union although the %PSE remained stable in all other countries, support
levels declined, most significantly in the United States, where higher world prices for most
Table 2.3. Contribution to change in Producer Support Estimate by country, 2005 to 2006
Value of ProducerSupport(PSE)1
Contribution of Contribution of budgetary payments (BP) based on:
MPS BP Output Input useCurrent A/An/R/Iprod.req.
Non-current A/An/R/Iprod.req.
Non-current A/An/R/I
prod. not req.
Non-commodity
criteriaMisc.
USD mn, 2006
% change % change in PSE if all other variables are held constant
Australia 1 377 3.1 –0.2 3.3 0.0 10.6 –0.4 –0.2 –6.6 0.0 0.0
Canada 7 531 7.8 10.7 –2.9 0.0 –0.5 0.8 1.7 –4.8 0.0 –0.1
European Union 137 970 2.0 –1.3 3.3 –3.5 –0.1 –6.8 0.0 13.4 0.1 0.2
Iceland 213 –1.1 –1.6 0.4 –0.2 –0.6 1.0 0.6 –0.4 0.2 0.0
Japan 40 652 –4.9 –4.7 –0.2 0.1 –0.1 –0.3 0.0 0.2 0.0 0.0
Korea 25 403 –1.2 0.4 –1.6 0.0 0.0 –2.2 0.0 0.6 0.0 0.0
Mexico 7 154 30.9 26.1 4.8 –0.3 5.1 0.0 0.1 –0.3 0.2 0.0
New Zealand 87 –36.6 –21.5 –15.1 0.0 1.3 –16.4 0.0 0.0 0.0 0.0
Norway 2 965 –0.9 –1.4 0.5 –0.1 0.0 1.4 –0.8 0.0 0.0 0.0
Switzerland 4 996 –9.7 –10.1 0.3 0.2 0.1 0.1 0.0 0.0 0.0 0.0
Turkey 10 131 –18.4 –25.8 7.4 2.0 3.5 0.1 0.0 1.9 0.0 0.0
United States 29 289 –30.1 –9.5 –20.6 –12.9 0.1 –0.6 0.0 –7.5 0.3 0.0
OECD2 267 768 –4.7 –3.4 –1.3 –3.5 0.2 –3.6 0.0 5.3 0.1 0.1
1. Per cent changes in national currency.2. Per cent changes in national currency weighted by the value of PSE in the previous year i.e. not equivalent to the variation
in OECD PSE in any common currency.Source: OECD PSE/CSE database, 2007.
1 2 http://dx.doi.org/10.1787/076283435278
AGRICULTURAL POLICIES IN OECD COUNTRIES: MONITORING AND EVALUATION 2007 – ISBN 978-92-64-02746-6 – © OECD 200740
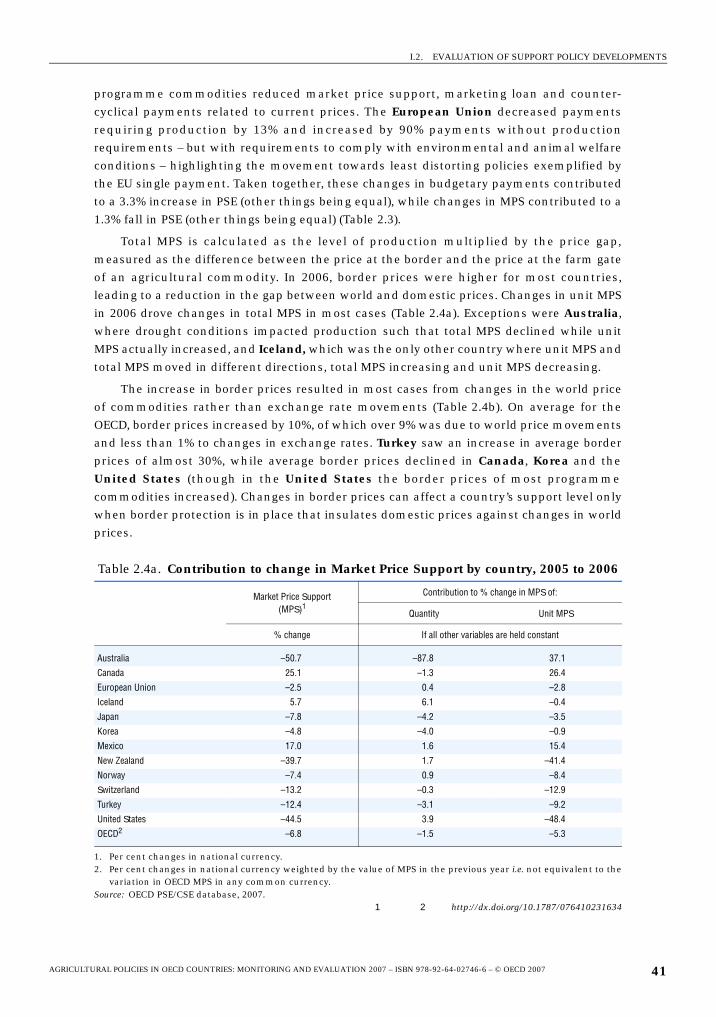
I.2. EVALUATION OF SUPPORT POLICY DEVELOPMENTS
programme commodities reduced market price support, marketing loan and counter-
cyclical payments related to current prices. The European Union decreased payments
requiring production by 13% and increased by 90% payments without production
requirements – but with requirements to comply with environmental and animal welfare
conditions – highlighting the movement towards least distorting policies exemplified by
the EU single payment. Taken together, these changes in budgetary payments contributed
to a 3.3% increase in PSE (other things being equal), while changes in MPS contributed to a
1.3% fall in PSE (other things being equal) (Table 2.3).
Total MPS is calculated as the level of production multiplied by the price gap,
measured as the difference between the price at the border and the price at the farm gate
of an agricultural commodity. In 2006, border prices were higher for most countries,
leading to a reduction in the gap between world and domestic prices. Changes in unit MPS
in 2006 drove changes in total MPS in most cases (Table 2.4a). Exceptions were Australia,
where drought conditions impacted production such that total MPS declined while unit
MPS actually increased, and Iceland, which was the only other country where unit MPS and
total MPS moved in different directions, total MPS increasing and unit MPS decreasing.
The increase in border prices resulted in most cases from changes in the world price
of commodities rather than exchange rate movements (Table 2.4b). On average for the
OECD, border prices increased by 10%, of which over 9% was due to world price movements
and less than 1% to changes in exchange rates. Turkey saw an increase in average border
prices of almost 30%, while average border prices declined in Canada, Korea and the
United States (though in the United States the border prices of most programme
commodities increased). Changes in border prices can affect a country’s support level only
when border protection is in place that insulates domestic prices against changes in world
prices.
Table 2.4a. Contribution to change in Market Price Support by country, 2005 to 2006
Market Price Support(MPS)1
Contribution to % change in MPS of:
Quantity Unit MPS
% change If all other variables are held constant
Australia –50.7 –87.8 37.1
Canada 25.1 –1.3 26.4
European Union –2.5 0.4 –2.8
Iceland 5.7 6.1 –0.4
Japan –7.8 –4.2 –3.5
Korea –4.8 –4.0 –0.9
Mexico 17.0 1.6 15.4
New Zealand –39.7 1.7 –41.4
Norway –7.4 0.9 –8.4
Switzerland –13.2 –0.3 –12.9
Turkey –12.4 –3.1 –9.2
United States –44.5 3.9 –48.4
OECD2 –6.8 –1.5 –5.3
1. Per cent changes in national currency.2. Per cent changes in national currency weighted by the value of MPS in the previous year i.e. not equivalent to the
variation in OECD MPS in any common currency.Source: OECD PSE/CSE database, 2007.
1 2 http://dx.doi.org/10.1787/076410231634
AGRICULTURAL POLICIES IN OECD COUNTRIES: MONITORING AND EVALUATION 2007 – ISBN 978-92-64-02746-6 – © OECD 2007 41
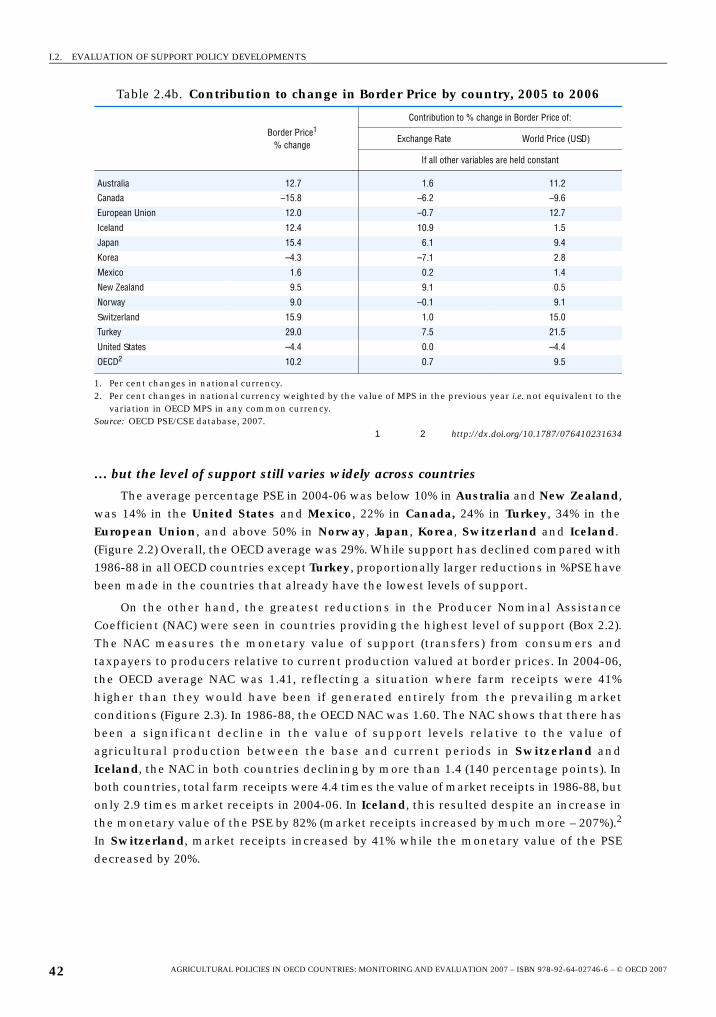
I.2. EVALUATION OF SUPPORT POLICY DEVELOPMENTS
… but the level of support still varies widely across countries
The average percentage PSE in 2004-06 was below 10% in Australia and New Zealand,
was 14% in the United States and Mexico, 22% in Canada, 24% in Turkey, 34% in the
European Union, and above 50% in Norway, Japan, Korea, Switzerland and Iceland.
(Figure 2.2) Overall, the OECD average was 29%. While support has declined compared with
1986-88 in all OECD countries except Turkey, proportionally larger reductions in %PSE have
been made in the countries that already have the lowest levels of support.
On the other hand, the greatest reductions in the Producer Nominal Assistance
Coefficient (NAC) were seen in countries providing the highest level of support (Box 2.2).
The NAC measures the monetary value of support (transfers) from consumers and
taxpayers to producers relative to current production valued at border prices. In 2004-06,
the OECD average NAC was 1.41, reflecting a situation where farm receipts were 41%
higher than they would have been if generated entirely from the prevailing market
conditions (Figure 2.3). In 1986-88, the OECD NAC was 1.60. The NAC shows that there has
been a significant decline in the value of support levels relative to the value of
agricultural production between the base and current periods in Switzerland and
Iceland, the NAC in both countries declining by more than 1.4 (140 percentage points). In
both countries, total farm receipts were 4.4 times the value of market receipts in 1986-88, but
only 2.9 times market receipts in 2004-06. In Iceland, this resulted despite an increase in
the monetary value of the PSE by 82% (market receipts increased by much more – 207%).2
In Switzerland, market receipts increased by 41% while the monetary value of the PSE
decreased by 20%.
Table 2.4b. Contribution to change in Border Price by country, 2005 to 2006
Border Price1
% change
Contribution to % change in Border Price of:
Exchange Rate World Price (USD)
If all other variables are held constant
Australia 12.7 1.6 11.2
Canada –15.8 –6.2 –9.6
European Union 12.0 –0.7 12.7
Iceland 12.4 10.9 1.5
Japan 15.4 6.1 9.4
Korea –4.3 –7.1 2.8
Mexico 1.6 0.2 1.4
New Zealand 9.5 9.1 0.5
Norway 9.0 –0.1 9.1
Switzerland 15.9 1.0 15.0
Turkey 29.0 7.5 21.5
United States –4.4 0.0 –4.4
OECD2 10.2 0.7 9.5
1. Per cent changes in national currency.2. Per cent changes in national currency weighted by the value of MPS in the previous year i.e. not equivalent to the
variation in OECD MPS in any common currency.Source: OECD PSE/CSE database, 2007.
1 2 http://dx.doi.org/10.1787/076410231634
AGRICULTURAL POLICIES IN OECD COUNTRIES: MONITORING AND EVALUATION 2007 – ISBN 978-92-64-02746-6 – © OECD 200742
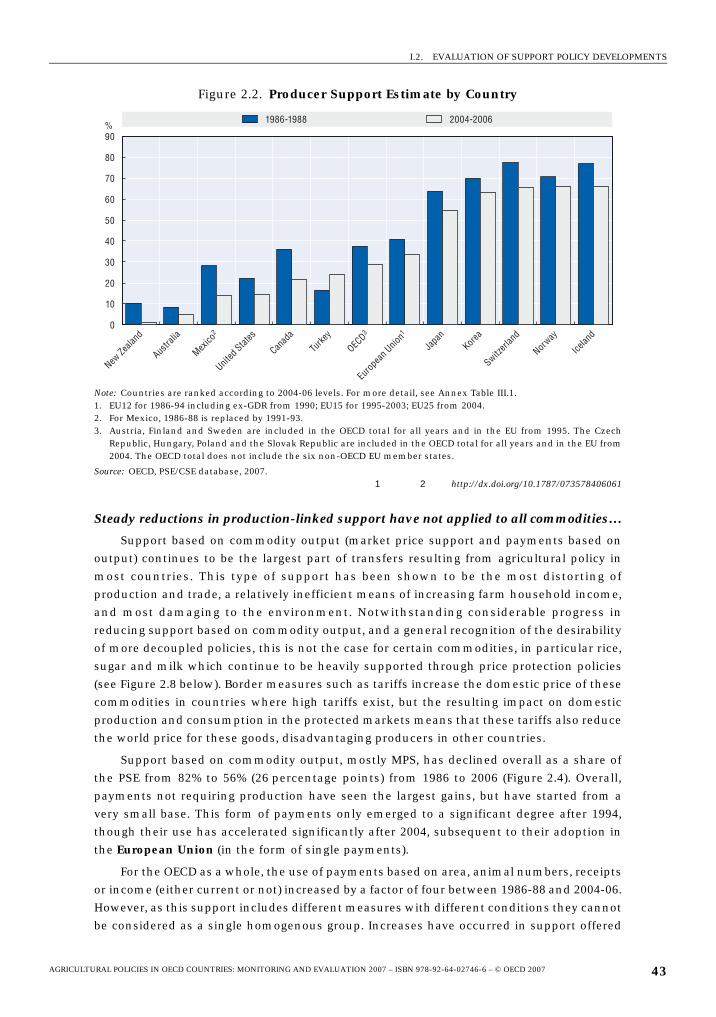
I.2. EVALUATION OF SUPPORT POLICY DEVELOPMENTS
Steady reductions in production-linked support have not applied to all commodities…
Support based on commodity output (market price support and payments based on
output) continues to be the largest part of transfers resulting from agricultural policy in
most countries. This type of support has been shown to be the most distorting of
production and trade, a relatively inefficient means of increasing farm household income,
and most damaging to the environment. Notwithstanding considerable progress in
reducing support based on commodity output, and a general recognition of the desirability
of more decoupled policies, this is not the case for certain commodities, in particular rice,
sugar and milk which continue to be heavily supported through price protection policies
(see Figure 2.8 below). Border measures such as tariffs increase the domestic price of these
commodities in countries where high tariffs exist, but the resulting impact on domestic
production and consumption in the protected markets means that these tariffs also reduce
the world price for these goods, disadvantaging producers in other countries.
Support based on commodity output, mostly MPS, has declined overall as a share of
the PSE from 82% to 56% (26 percentage points) from 1986 to 2006 (Figure 2.4). Overall,
payments not requiring production have seen the largest gains, but have started from a
very small base. This form of payments only emerged to a significant degree after 1994,
though their use has accelerated significantly after 2004, subsequent to their adoption in
the European Union (in the form of single payments).
For the OECD as a whole, the use of payments based on area, animal numbers, receipts
or income (either current or not) increased by a factor of four between 1986-88 and 2004-06.
However, as this support includes different measures with different conditions they cannot
be considered as a single homogenous group. Increases have occurred in support offered
Figure 2.2. Producer Support Estimate by Country
Note: Countries are ranked according to 2004-06 levels. For more detail, see Annex Table III.1.1. EU12 for 1986-94 including ex-GDR from 1990; EU15 for 1995-2003; EU25 from 2004.2. For Mexico, 1986-88 is replaced by 1991-93.3. Austria, Finland and Sweden are included in the OECD total for all years and in the EU from 1995. The Czech
Republic, Hungary, Poland and the Slovak Republic are included in the OECD total for all years and in the EU from2004. The OECD total does not include the six non-OECD EU member states.
Source: OECD, PSE/CSE database, 2007.1 2 http://dx.doi.org/10.1787/073578406061
1986-1988 2004-2006%
New Ze
aland
Austra
lia
Mexico
2
United
States
Canad
a
Turke
y
OECD3
Euro
pean
Unio
n1
Japa
nKor
ea
Switzerl
and
Norway
Icelan
d0
10
20
30
40
50
60
70
80
90
AGRICULTURAL POLICIES IN OECD COUNTRIES: MONITORING AND EVALUATION 2007 – ISBN 978-92-64-02746-6 – © OECD 2007 43
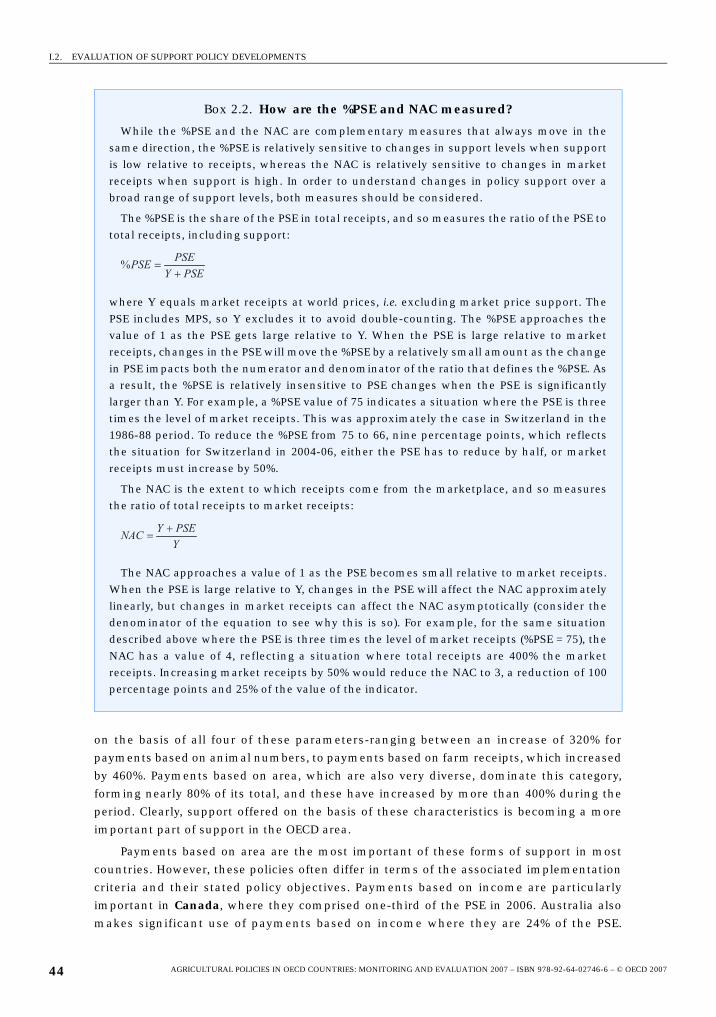
I.2. EVALUATION OF SUPPORT POLICY DEVELOPMENTS
on the basis of all four of these parameters-ranging between an increase of 320% for
payments based on animal numbers, to payments based on farm receipts, which increased
by 460%. Payments based on area, which are also very diverse, dominate this category,
forming nearly 80% of its total, and these have increased by more than 400% during the
period. Clearly, support offered on the basis of these characteristics is becoming a more
important part of support in the OECD area.
Payments based on area are the most important of these forms of support in most
countries. However, these policies often differ in terms of the associated implementation
criteria and their stated policy objectives. Payments based on income are particularly
important in Canada, where they comprised one-third of the PSE in 2006. Australia also
makes significant use of payments based on income where they are 24% of the PSE.
Box 2.2. How are the %PSE and NAC measured?
While the %PSE and the NAC are complementary measures that always move in thesame direction, the %PSE is relatively sensitive to changes in support levels when supportis low relative to receipts, whereas the NAC is relatively sensitive to changes in marketreceipts when support is high. In order to understand changes in policy support over abroad range of support levels, both measures should be considered.
The %PSE is the share of the PSE in total receipts, and so measures the ratio of the PSE tototal receipts, including support:
where Y equals market receipts at world prices, i.e. excluding market price support. ThePSE includes MPS, so Y excludes it to avoid double-counting. The %PSE approaches thevalue of 1 as the PSE gets large relative to Y. When the PSE is large relative to marketreceipts, changes in the PSE will move the %PSE by a relatively small amount as the changein PSE impacts both the numerator and denominator of the ratio that defines the %PSE. Asa result, the %PSE is relatively insensitive to PSE changes when the PSE is significantlylarger than Y. For example, a %PSE value of 75 indicates a situation where the PSE is threetimes the level of market receipts. This was approximately the case in Switzerland in the1986-88 period. To reduce the %PSE from 75 to 66, nine percentage points, which reflectsthe situation for Switzerland in 2004-06, either the PSE has to reduce by half, or marketreceipts must increase by 50%.
The NAC is the extent to which receipts come from the marketplace, and so measuresthe ratio of total receipts to market receipts:
The NAC approaches a value of 1 as the PSE becomes small relative to market receipts.When the PSE is large relative to Y, changes in the PSE will affect the NAC approximatelylinearly, but changes in market receipts can affect the NAC asymptotically (consider thedenominator of the equation to see why this is so). For example, for the same situationdescribed above where the PSE is three times the level of market receipts (%PSE = 75), theNAC has a value of 4, reflecting a situation where total receipts are 400% the marketreceipts. Increasing market receipts by 50% would reduce the NAC to 3, a reduction of 100percentage points and 25% of the value of the indicator.
PSEYPSEPSE+
=%
YPSEYNAC +
=
AGRICULTURAL POLICIES IN OECD COUNTRIES: MONITORING AND EVALUATION 2007 – ISBN 978-92-64-02746-6 – © OECD 200744
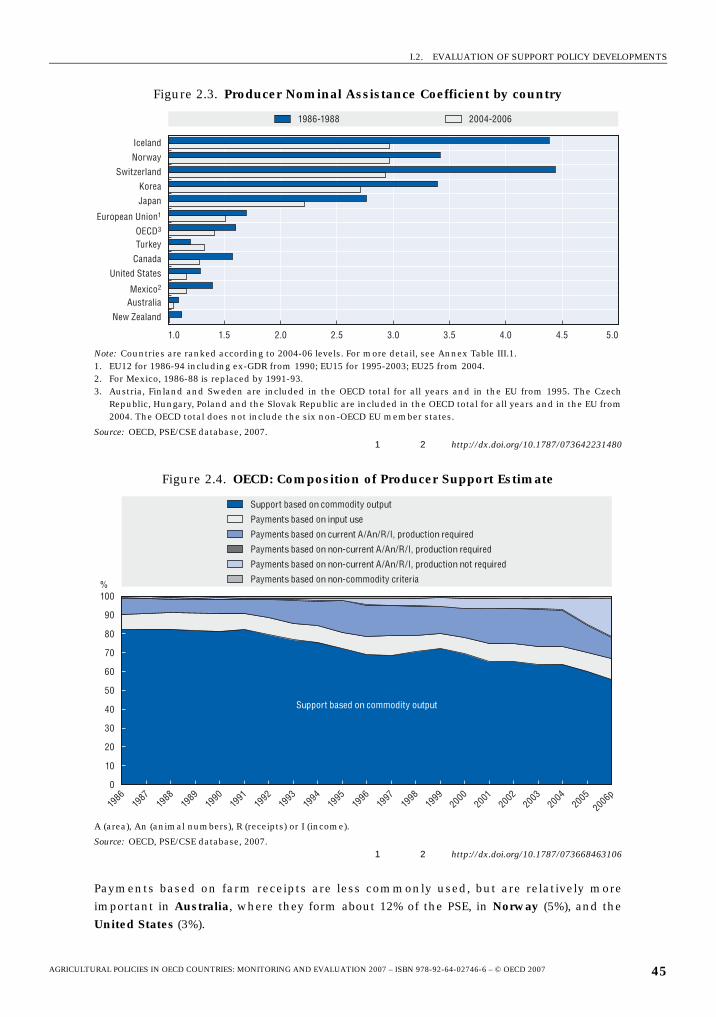
I.2. EVALUATION OF SUPPORT POLICY DEVELOPMENTS
Payments based on farm receipts are less commonly used, but are relatively more
important in Australia, where they form about 12% of the PSE, in Norway (5%), and the
United States (3%).
Figure 2.3. Producer Nominal Assistance Coefficient by country
Note: Countries are ranked according to 2004-06 levels. For more detail, see Annex Table III.1.1. EU12 for 1986-94 including ex-GDR from 1990; EU15 for 1995-2003; EU25 from 2004.2. For Mexico, 1986-88 is replaced by 1991-93.3. Austria, Finland and Sweden are included in the OECD total for all years and in the EU from 1995. The Czech
Republic, Hungary, Poland and the Slovak Republic are included in the OECD total for all years and in the EU from2004. The OECD total does not include the six non-OECD EU member states.
Source: OECD, PSE/CSE database, 2007.1 2 http://dx.doi.org/10.1787/073642231480
Figure 2.4. OECD: Composition of Producer Support Estimate
A (area), An (animal numbers), R (receipts) or I (income).
Source: OECD, PSE/CSE database, 2007.1 2 http://dx.doi.org/10.1787/073668463106
1986-1988 2004-2006
New Zealand
AustraliaMexico2
United States
Canada
TurkeyOECD3
European Union1
Japan
Korea
Switzerland
Norway
Iceland
1.0 1.5 2.0 2.5 3.0 3.5 4.0 4.5 5.0
Payments based on non-commodity criteria
Payments based on non-current A/An/R/I, production not required
Payments based on non-current A/An/R/I, production required
Payments based on current A/An/R/I, production required
Payments based on input use
Support based on commodity output
%
1986
1987
1988
1989
1990
1991
1992
1993
1994
1995
1996
1997
1998
1999
2000
2001
2002
2003
2004
2005
2006p
0
10
20
30
40
50
60
70
80
90
100
Support based on commodity output
AGRICULTURAL POLICIES IN OECD COUNTRIES: MONITORING AND EVALUATION 2007 – ISBN 978-92-64-02746-6 – © OECD 2007 45
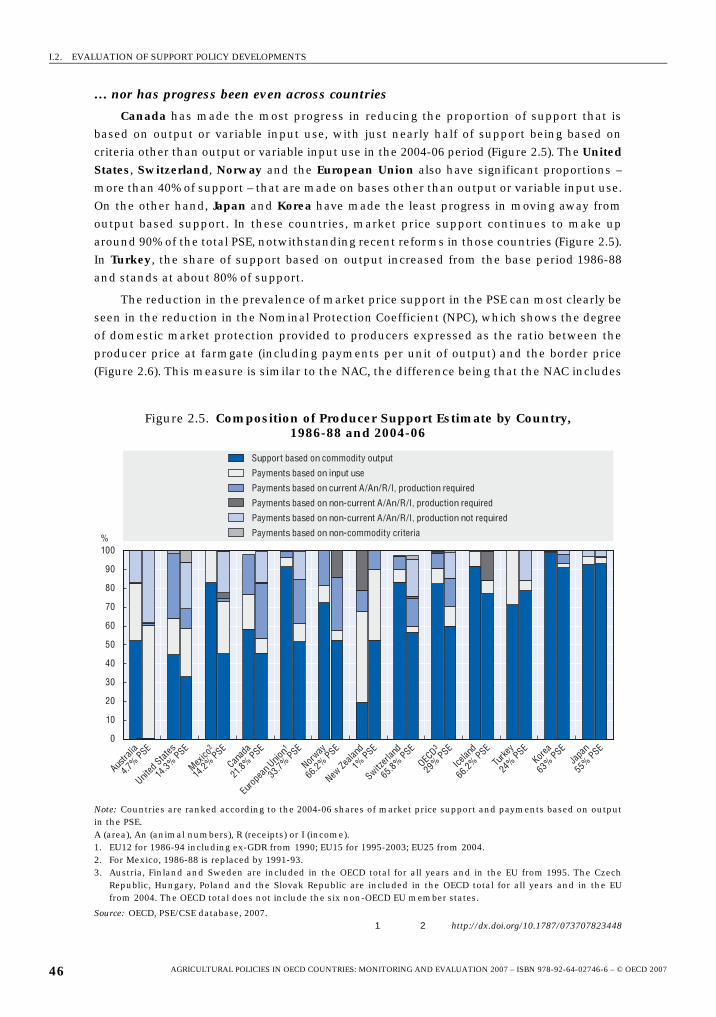
I.2. EVALUATION OF SUPPORT POLICY DEVELOPMENTS
… nor has progress been even across countries
Canada has made the most progress in reducing the proportion of support that is
based on output or variable input use, with just nearly half of support being based on
criteria other than output or variable input use in the 2004-06 period (Figure 2.5). The UnitedStates, Switzerland, Norway and the European Union also have significant proportions –
more than 40% of support – that are made on bases other than output or variable input use.
On the other hand, Japan and Korea have made the least progress in moving away from
output based support. In these countries, market price support continues to make up
around 90% of the total PSE, notwithstanding recent reforms in those countries (Figure 2.5).
In Turkey, the share of support based on output increased from the base period 1986-88
and stands at about 80% of support.
The reduction in the prevalence of market price support in the PSE can most clearly be
seen in the reduction in the Nominal Protection Coefficient (NPC), which shows the degree
of domestic market protection provided to producers expressed as the ratio between the
producer price at farmgate (including payments per unit of output) and the border price
(Figure 2.6). This measure is similar to the NAC, the difference being that the NAC includes
Figure 2.5. Composition of Producer Support Estimate by Country, 1986-88 and 2004-06
Note: Countries are ranked according to the 2004-06 shares of market price support and payments based on outputin the PSE.A (area), An (animal numbers), R (receipts) or I (income).1. EU12 for 1986-94 including ex-GDR from 1990; EU15 for 1995-2003; EU25 from 2004.2. For Mexico, 1986-88 is replaced by 1991-93.3. Austria, Finland and Sweden are included in the OECD total for all years and in the EU from 1995. The Czech
Republic, Hungary, Poland and the Slovak Republic are included in the OECD total for all years and in the EUfrom 2004. The OECD total does not include the six non-OECD EU member states.
Source: OECD, PSE/CSE database, 2007.1 2 http://dx.doi.org/10.1787/073707823448
Payments based on non-commodity criteria
Payments based on non-current A/An/R/I, production not required
Payments based on non-current A/An/R/I, production required
Payments based on current A/An/R/I, production required
Payments based on input use
Support based on commodity output
0
10
20
30
40
50
60
70
80
90
100
Austra
lia
4.7% PSE
United
States
14.3% PSE
Mexico
2
14.2% PSE
Canad
a
21.8% PSE
Euro
pean
Unio
n1
33.7% PSE
Norway
66.2% PSE
New Ze
aland
1% PSE
Switzerl
and
65.8% PSE
OECD3
29% PSE
Icelan
d
66.2% PSE
Turke
y
24% PSE
Korea
63% PSE
55% PSE
Japa
n
%
AGRICULTURAL POLICIES IN OECD COUNTRIES: MONITORING AND EVALUATION 2007 – ISBN 978-92-64-02746-6 – © OECD 200746
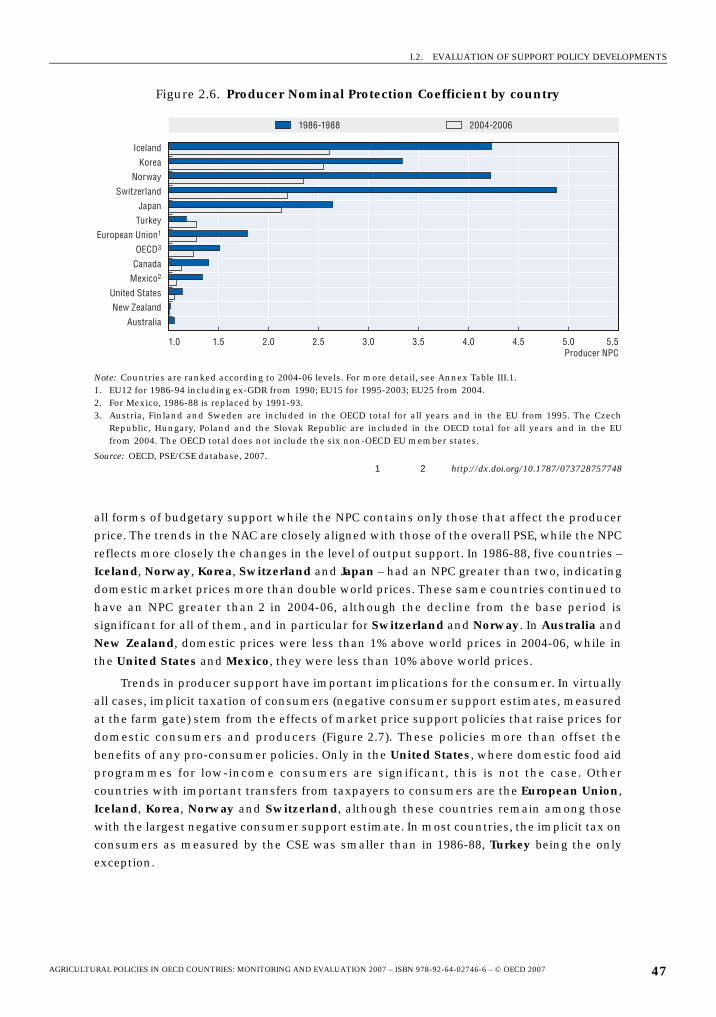
I.2. EVALUATION OF SUPPORT POLICY DEVELOPMENTS
all forms of budgetary support while the NPC contains only those that affect the producer
price. The trends in the NAC are closely aligned with those of the overall PSE, while the NPC
reflects more closely the changes in the level of output support. In 1986-88, five countries –
Iceland, Norway, Korea, Switzerland and Japan – had an NPC greater than two, indicating
domestic market prices more than double world prices. These same countries continued to
have an NPC greater than 2 in 2004-06, although the decline from the base period is
significant for all of them, and in particular for Switzerland and Norway. In Australia and
New Zealand, domestic prices were less than 1% above world prices in 2004-06, while in
the United States and Mexico, they were less than 10% above world prices.
Trends in producer support have important implications for the consumer. In virtually
all cases, implicit taxation of consumers (negative consumer support estimates, measured
at the farm gate) stem from the effects of market price support policies that raise prices for
domestic consumers and producers (Figure 2.7). These policies more than offset the
benefits of any pro-consumer policies. Only in the United States, where domestic food aid
programmes for low-income consumers are significant, this is not the case. Other
countries with important transfers from taxpayers to consumers are the European Union,
Iceland, Korea, Norway and Switzerland, although these countries remain among those
with the largest negative consumer support estimate. In most countries, the implicit tax on
consumers as measured by the CSE was smaller than in 1986-88, Turkey being the only
exception.
Figure 2.6. Producer Nominal Protection Coefficient by country
Note: Countries are ranked according to 2004-06 levels. For more detail, see Annex Table III.1.1. EU12 for 1986-94 including ex-GDR from 1990; EU15 for 1995-2003; EU25 from 2004.2. For Mexico, 1986-88 is replaced by 1991-93.3. Austria, Finland and Sweden are included in the OECD total for all years and in the EU from 1995. The Czech
Republic, Hungary, Poland and the Slovak Republic are included in the OECD total for all years and in the EUfrom 2004. The OECD total does not include the six non-OECD EU member states.
Source: OECD, PSE/CSE database, 2007.1 2 http://dx.doi.org/10.1787/073728757748
1986-1988 2004-2006
1.0 1.5 2.0 2.5 3.0 3.5 4.0 4.5 5.0 5.5Producer NPC
Australia
New ZealandUnited States
Mexico2
Canada
OECD3
European Union1
Turkey
JapanSwitzerland
NorwayKorea
Iceland
AGRICULTURAL POLICIES IN OECD COUNTRIES: MONITORING AND EVALUATION 2007 – ISBN 978-92-64-02746-6 – © OECD 2007 47
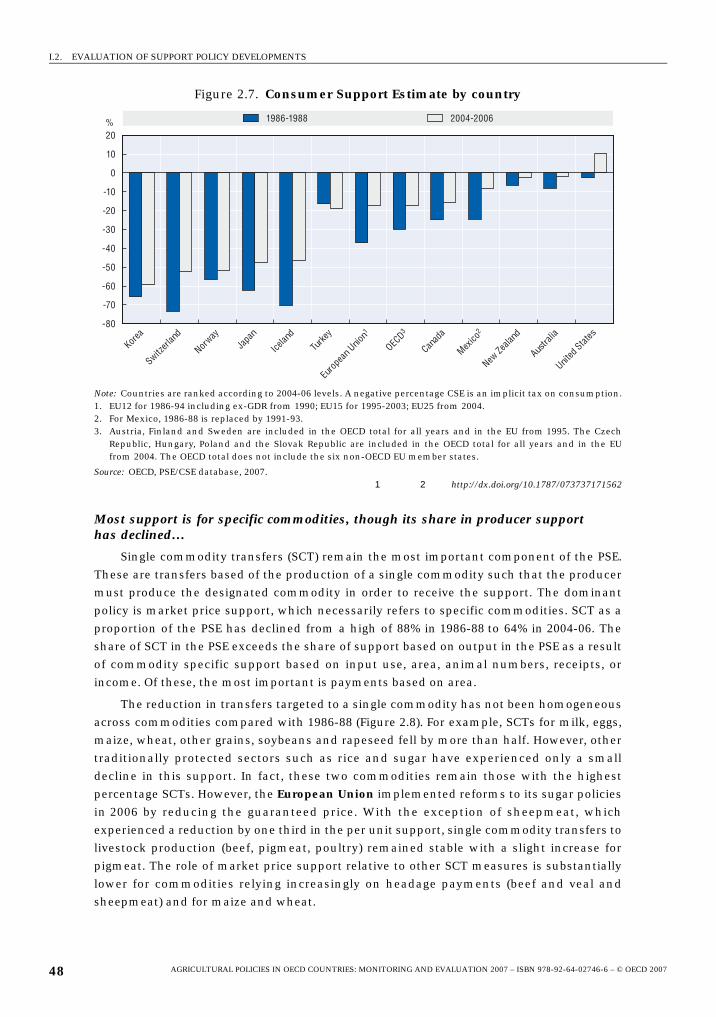
I.2. EVALUATION OF SUPPORT POLICY DEVELOPMENTS
Most support is for specific commodities, though its share in producer support has declined…
Single commodity transfers (SCT) remain the most important component of the PSE.
These are transfers based of the production of a single commodity such that the producer
must produce the designated commodity in order to receive the support. The dominant
policy is market price support, which necessarily refers to specific commodities. SCT as a
proportion of the PSE has declined from a high of 88% in 1986-88 to 64% in 2004-06. The
share of SCT in the PSE exceeds the share of support based on output in the PSE as a result
of commodity specific support based on input use, area, animal numbers, receipts, or
income. Of these, the most important is payments based on area.
The reduction in transfers targeted to a single commodity has not been homogeneous
across commodities compared with 1986-88 (Figure 2.8). For example, SCTs for milk, eggs,
maize, wheat, other grains, soybeans and rapeseed fell by more than half. However, other
traditionally protected sectors such as rice and sugar have experienced only a small
decline in this support. In fact, these two commodities remain those with the highest
percentage SCTs. However, the European Union implemented reforms to its sugar policies
in 2006 by reducing the guaranteed price. With the exception of sheepmeat, which
experienced a reduction by one third in the per unit support, single commodity transfers to
livestock production (beef, pigmeat, poultry) remained stable with a slight increase for
pigmeat. The role of market price support relative to other SCT measures is substantially
lower for commodities relying increasingly on headage payments (beef and veal and
sheepmeat) and for maize and wheat.
Figure 2.7. Consumer Support Estimate by country
Note: Countries are ranked according to 2004-06 levels. A negative percentage CSE is an implicit tax on consumption.1. EU12 for 1986-94 including ex-GDR from 1990; EU15 for 1995-2003; EU25 from 2004.2. For Mexico, 1986-88 is replaced by 1991-93.3. Austria, Finland and Sweden are included in the OECD total for all years and in the EU from 1995. The Czech
Republic, Hungary, Poland and the Slovak Republic are included in the OECD total for all years and in the EUfrom 2004. The OECD total does not include the six non-OECD EU member states.
Source: OECD, PSE/CSE database, 2007.1 2 http://dx.doi.org/10.1787/073737171562
1986-1988 2004-2006
-80
-70
-60
-50
-40
-30
-20
-10
0
10
20%
Korea
Switzerl
and
Norway
Japa
n
Icelan
d
Turke
y
Euro
pean
Unio
n1
OECD3
Canad
a
Mexico
2
New Ze
aland
Austra
lia
United
States
AGRICULTURAL POLICIES IN OECD COUNTRIES: MONITORING AND EVALUATION 2007 – ISBN 978-92-64-02746-6 – © OECD 200748
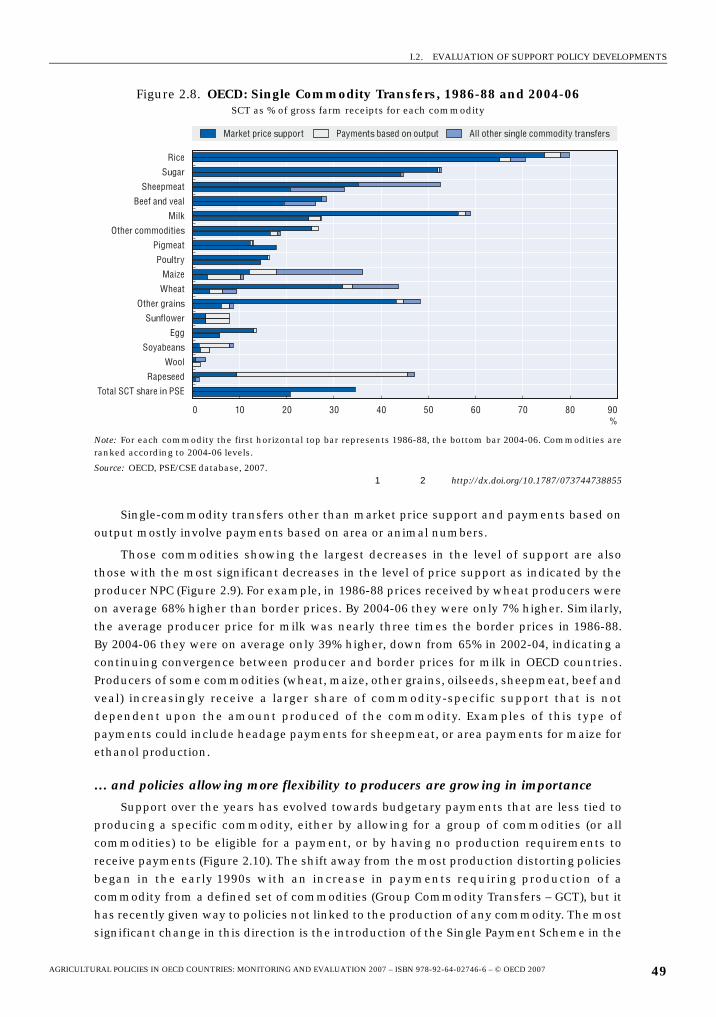
I.2. EVALUATION OF SUPPORT POLICY DEVELOPMENTS
Single-commodity transfers other than market price support and payments based on
output mostly involve payments based on area or animal numbers.
Those commodities showing the largest decreases in the level of support are also
those with the most significant decreases in the level of price support as indicated by the
producer NPC (Figure 2.9). For example, in 1986-88 prices received by wheat producers were
on average 68% higher than border prices. By 2004-06 they were only 7% higher. Similarly,
the average producer price for milk was nearly three times the border prices in 1986-88.
By 2004-06 they were on average only 39% higher, down from 65% in 2002-04, indicating a
continuing convergence between producer and border prices for milk in OECD countries.
Producers of some commodities (wheat, maize, other grains, oilseeds, sheepmeat, beef and
veal) increasingly receive a larger share of commodity-specific support that is not
dependent upon the amount produced of the commodity. Examples of this type of
payments could include headage payments for sheepmeat, or area payments for maize for
ethanol production.
… and policies allowing more flexibility to producers are growing in importance
Support over the years has evolved towards budgetary payments that are less tied to
producing a specific commodity, either by allowing for a group of commodities (or all
commodities) to be eligible for a payment, or by having no production requirements to
receive payments (Figure 2.10). The shift away from the most production distorting policies
began in the early 1990s with an increase in payments requiring production of a
commodity from a defined set of commodities (Group Commodity Transfers – GCT), but it
has recently given way to policies not linked to the production of any commodity. The most
significant change in this direction is the introduction of the Single Payment Scheme in the
Figure 2.8. OECD: Single Commodity Transfers, 1986-88 and 2004-06SCT as % of gross farm receipts for each commodity
Note: For each commodity the first horizontal top bar represents 1986-88, the bottom bar 2004-06. Commodities areranked according to 2004-06 levels.
Source: OECD, PSE/CSE database, 2007.1 2 http://dx.doi.org/10.1787/073744738855
Market price support Payments based on output All other single commodity transfers
0 10 20 30 40 50 60 70 80 90%
Total SCT share in PSE
Rapeseed
Wool
Soyabeans
Egg
Sunflower
Other grains
Wheat
Maize
Poultry
Pigmeat
Other commodities
Milk
Beef and veal
Sheepmeat
Sugar
Rice
AGRICULTURAL POLICIES IN OECD COUNTRIES: MONITORING AND EVALUATION 2007 – ISBN 978-92-64-02746-6 – © OECD 2007 49
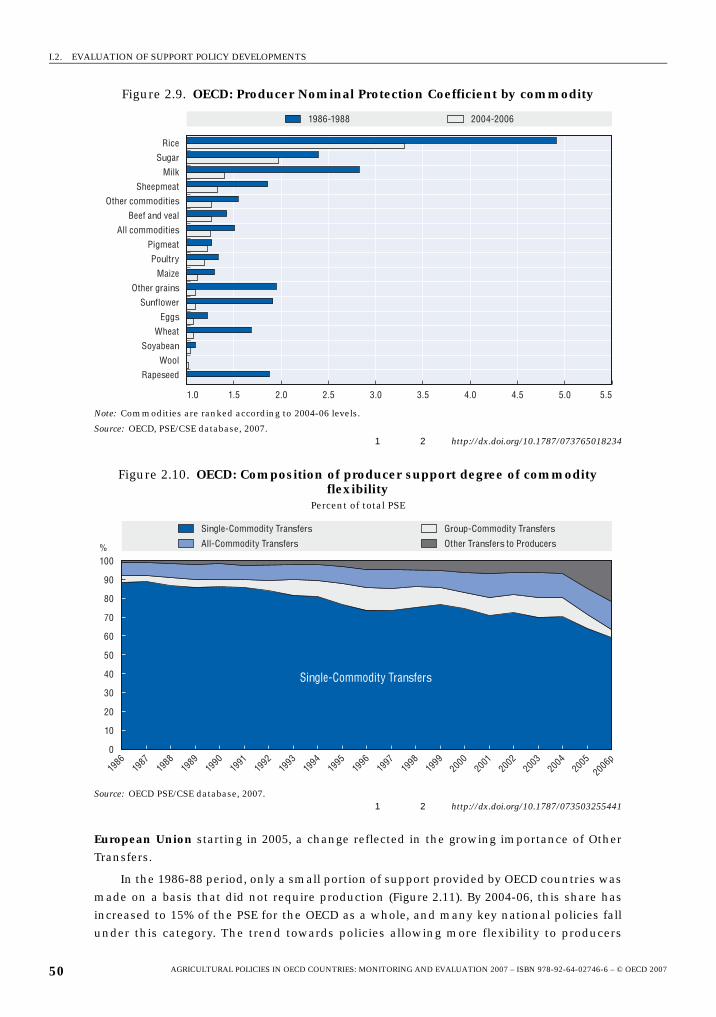
I.2. EVALUATION OF SUPPORT POLICY DEVELOPMENTS
European Union starting in 2005, a change reflected in the growing importance of Other
Transfers.
In the 1986-88 period, only a small portion of support provided by OECD countries was
made on a basis that did not require production (Figure 2.11). By 2004-06, this share has
increased to 15% of the PSE for the OECD as a whole, and many key national policies fall
under this category. The trend towards policies allowing more flexibility to producers
Figure 2.9. OECD: Producer Nominal Protection Coefficient by commodity
Note: Commodities are ranked according to 2004-06 levels.
Source: OECD, PSE/CSE database, 2007.1 2 http://dx.doi.org/10.1787/073765018234
Figure 2.10. OECD: Composition of producer support degree of commodity flexibility
Percent of total PSE
Source: OECD PSE/CSE database, 2007.1 2 http://dx.doi.org/10.1787/073503255441
1986-1988 2004-2006
1.0 1.5 2.0 2.5 3.0 3.5 4.0 4.5 5.0 5.5
Rapeseed
Wool
Soyabean
Wheat
Eggs
Sunflower
Other grains
Maize
Poultry
Pigmeat
All commodities
Beef and veal
Other commodities
Sheepmeat
Milk
Sugar
Rice
All-Commodity Transfers Other Transfers to Producers
Single-Commodity Transfers Group-Commodity Transfers
1986
1987
1988
1989
1990
1991
1992
1993
1994
1995
1996
1997
1998
1999
2000
2001
2002
2003
2004
2005
2006p
0
10
20
30
40
50
60
70
80
90
100%
Single-Commodity Transfers
AGRICULTURAL POLICIES IN OECD COUNTRIES: MONITORING AND EVALUATION 2007 – ISBN 978-92-64-02746-6 – © OECD 200750
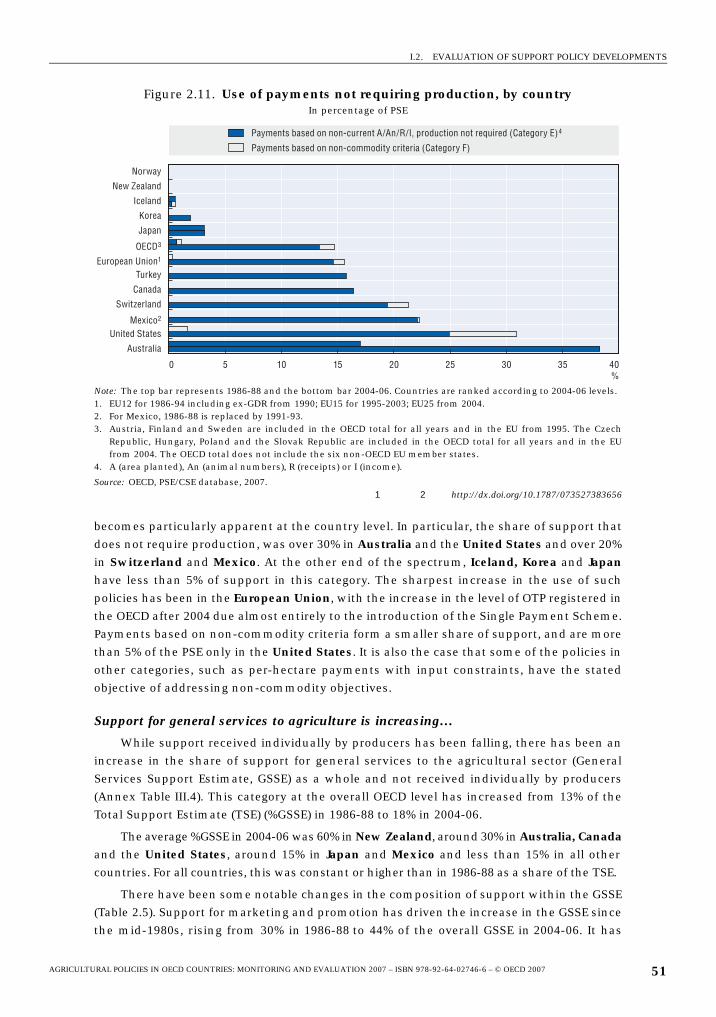
I.2. EVALUATION OF SUPPORT POLICY DEVELOPMENTS
becomes particularly apparent at the country level. In particular, the share of support that
does not require production, was over 30% in Australia and the United States and over 20%
in Switzerland and Mexico. At the other end of the spectrum, Iceland, Korea and Japanhave less than 5% of support in this category. The sharpest increase in the use of such
policies has been in the European Union, with the increase in the level of OTP registered in
the OECD after 2004 due almost entirely to the introduction of the Single Payment Scheme.
Payments based on non-commodity criteria form a smaller share of support, and are more
than 5% of the PSE only in the United States. It is also the case that some of the policies in
other categories, such as per-hectare payments with input constraints, have the stated
objective of addressing non-commodity objectives.
Support for general services to agriculture is increasing…
While support received individually by producers has been falling, there has been an
increase in the share of support for general services to the agricultural sector (General
Services Support Estimate, GSSE) as a whole and not received individually by producers
(Annex Table III.4). This category at the overall OECD level has increased from 13% of the
Total Support Estimate (TSE) (%GSSE) in 1986-88 to 18% in 2004-06.
The average %GSSE in 2004-06 was 60% in New Zealand, around 30% in Australia, Canadaand the United States, around 15% in Japan and Mexico and less than 15% in all other
countries. For all countries, this was constant or higher than in 1986-88 as a share of the TSE.
There have been some notable changes in the composition of support within the GSSE
(Table 2.5). Support for marketing and promotion has driven the increase in the GSSE since
the mid-1980s, rising from 30% in 1986-88 to 44% of the overall GSSE in 2004-06. It has
Figure 2.11. Use of payments not requiring production, by countryIn percentage of PSE
Note: The top bar represents 1986-88 and the bottom bar 2004-06. Countries are ranked according to 2004-06 levels.1. EU12 for 1986-94 including ex-GDR from 1990; EU15 for 1995-2003; EU25 from 2004.2. For Mexico, 1986-88 is replaced by 1991-93.3. Austria, Finland and Sweden are included in the OECD total for all years and in the EU from 1995. The Czech
Republic, Hungary, Poland and the Slovak Republic are included in the OECD total for all years and in the EUfrom 2004. The OECD total does not include the six non-OECD EU member states.
4. A (area planted), An (animal numbers), R (receipts) or I (income).
Source: OECD, PSE/CSE database, 2007.1 2 http://dx.doi.org/10.1787/073527383656
Payments based on non-current A/An/R/I, production not required (Category E)4
Payments based on non-commodity criteria (Category F)
0 5 10 15 20 25 30 35 40%
Australia
United StatesMexico2
Switzerland
Canada
TurkeyEuropean Union1
OECD3
Japan
Korea
Iceland
New Zealand
Norway
AGRICULTURAL POLICIES IN OECD COUNTRIES: MONITORING AND EVALUATION 2007 – ISBN 978-92-64-02746-6 – © OECD 2007 51
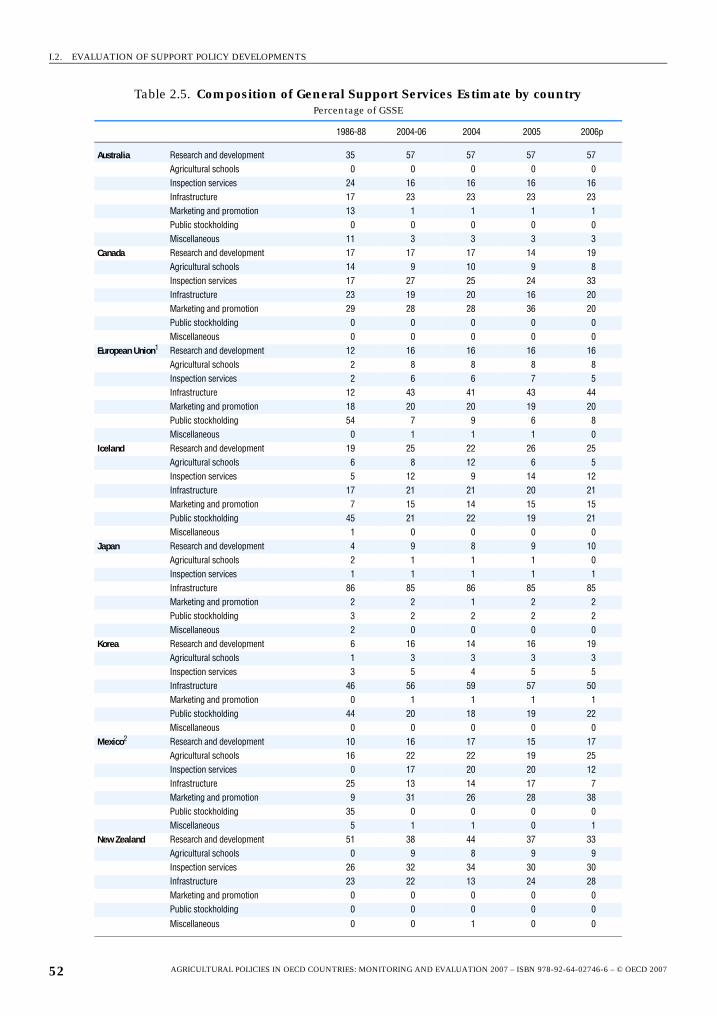
I.2. EVALUATION OF SUPPORT POLICY DEVELOPMENTS
Table 2.5. Composition of General Support Services Estimate by countryPercentage of GSSE
1986-88 2004-06 2004 2005 2006p
Australia Research and development 35 57 57 57 57Agricultural schools 0 0 0 0 0Inspection services 24 16 16 16 16Infrastructure 17 23 23 23 23Marketing and promotion 13 1 1 1 1Public stockholding 0 0 0 0 0Miscellaneous 11 3 3 3 3
Canada Research and development 17 17 17 14 19Agricultural schools 14 9 10 9 8Inspection services 17 27 25 24 33Infrastructure 23 19 20 16 20Marketing and promotion 29 28 28 36 20Public stockholding 0 0 0 0 0Miscellaneous 0 0 0 0 0
European Union1 Research and development 12 16 16 16 16Agricultural schools 2 8 8 8 8Inspection services 2 6 6 7 5Infrastructure 12 43 41 43 44Marketing and promotion 18 20 20 19 20Public stockholding 54 7 9 6 8Miscellaneous 0 1 1 1 0
Iceland Research and development 19 25 22 26 25Agricultural schools 6 8 12 6 5Inspection services 5 12 9 14 12Infrastructure 17 21 21 20 21Marketing and promotion 7 15 14 15 15Public stockholding 45 21 22 19 21Miscellaneous 1 0 0 0 0
Japan Research and development 4 9 8 9 10Agricultural schools 2 1 1 1 0Inspection services 1 1 1 1 1Infrastructure 86 85 86 85 85Marketing and promotion 2 2 1 2 2Public stockholding 3 2 2 2 2Miscellaneous 2 0 0 0 0
Korea Research and development 6 16 14 16 19Agricultural schools 1 3 3 3 3Inspection services 3 5 4 5 5Infrastructure 46 56 59 57 50Marketing and promotion 0 1 1 1 1Public stockholding 44 20 18 19 22Miscellaneous 0 0 0 0 0
Mexico2 Research and development 10 16 17 15 17Agricultural schools 16 22 22 19 25Inspection services 0 17 20 20 12Infrastructure 25 13 14 17 7Marketing and promotion 9 31 26 28 38Public stockholding 35 0 0 0 0Miscellaneous 5 1 1 0 1
New Zealand Research and development 51 38 44 37 33Agricultural schools 0 9 8 9 9Inspection services 26 32 34 30 30Infrastructure 23 22 13 24 28Marketing and promotion 0 0 0 0 0Public stockholding 0 0 0 0 0
Miscellaneous 0 0 1 0 0
AGRICULTURAL POLICIES IN OECD COUNTRIES: MONITORING AND EVALUATION 2007 – ISBN 978-92-64-02746-6 – © OECD 200752
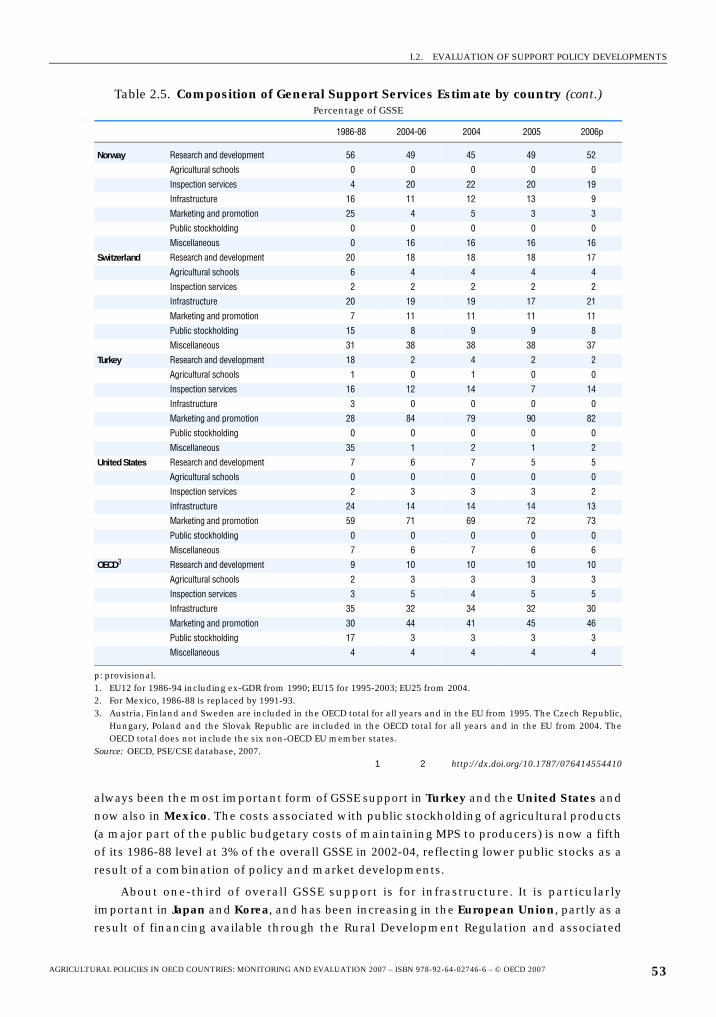
I.2. EVALUATION OF SUPPORT POLICY DEVELOPMENTS
always been the most important form of GSSE support in Turkey and the United States and
now also in Mexico. The costs associated with public stockholding of agricultural products
(a major part of the public budgetary costs of maintaining MPS to producers) is now a fifth
of its 1986-88 level at 3% of the overall GSSE in 2002-04, reflecting lower public stocks as a
result of a combination of policy and market developments.
About one-third of overall GSSE support is for infrastructure. It is particularly
important in Japan and Korea, and has been increasing in the European Union, partly as a
result of financing available through the Rural Development Regulation and associated
Norway Research and development 56 49 45 49 52
Agricultural schools 0 0 0 0 0
Inspection services 4 20 22 20 19
Infrastructure 16 11 12 13 9
Marketing and promotion 25 4 5 3 3
Public stockholding 0 0 0 0 0
Miscellaneous 0 16 16 16 16
Switzerland Research and development 20 18 18 18 17
Agricultural schools 6 4 4 4 4
Inspection services 2 2 2 2 2
Infrastructure 20 19 19 17 21
Marketing and promotion 7 11 11 11 11
Public stockholding 15 8 9 9 8
Miscellaneous 31 38 38 38 37
Turkey Research and development 18 2 4 2 2
Agricultural schools 1 0 1 0 0
Inspection services 16 12 14 7 14
Infrastructure 3 0 0 0 0
Marketing and promotion 28 84 79 90 82
Public stockholding 0 0 0 0 0
Miscellaneous 35 1 2 1 2
United States Research and development 7 6 7 5 5
Agricultural schools 0 0 0 0 0
Inspection services 2 3 3 3 2
Infrastructure 24 14 14 14 13
Marketing and promotion 59 71 69 72 73
Public stockholding 0 0 0 0 0
Miscellaneous 7 6 7 6 6
OECD3 Research and development 9 10 10 10 10
Agricultural schools 2 3 3 3 3
Inspection services 3 5 4 5 5
Infrastructure 35 32 34 32 30
Marketing and promotion 30 44 41 45 46
Public stockholding 17 3 3 3 3
Miscellaneous 4 4 4 4 4
p: provisional.1. EU12 for 1986-94 including ex-GDR from 1990; EU15 for 1995-2003; EU25 from 2004.2. For Mexico, 1986-88 is replaced by 1991-93.3. Austria, Finland and Sweden are included in the OECD total for all years and in the EU from 1995. The Czech Republic,
Hungary, Poland and the Slovak Republic are included in the OECD total for all years and in the EU from 2004. TheOECD total does not include the six non-OECD EU member states.
Source: OECD, PSE/CSE database, 2007.1 2 http://dx.doi.org/10.1787/076414554410
Table 2.5. Composition of General Support Services Estimate by country (cont.)Percentage of GSSE
1986-88 2004-06 2004 2005 2006p
AGRICULTURAL POLICIES IN OECD COUNTRIES: MONITORING AND EVALUATION 2007 – ISBN 978-92-64-02746-6 – © OECD 2007 53
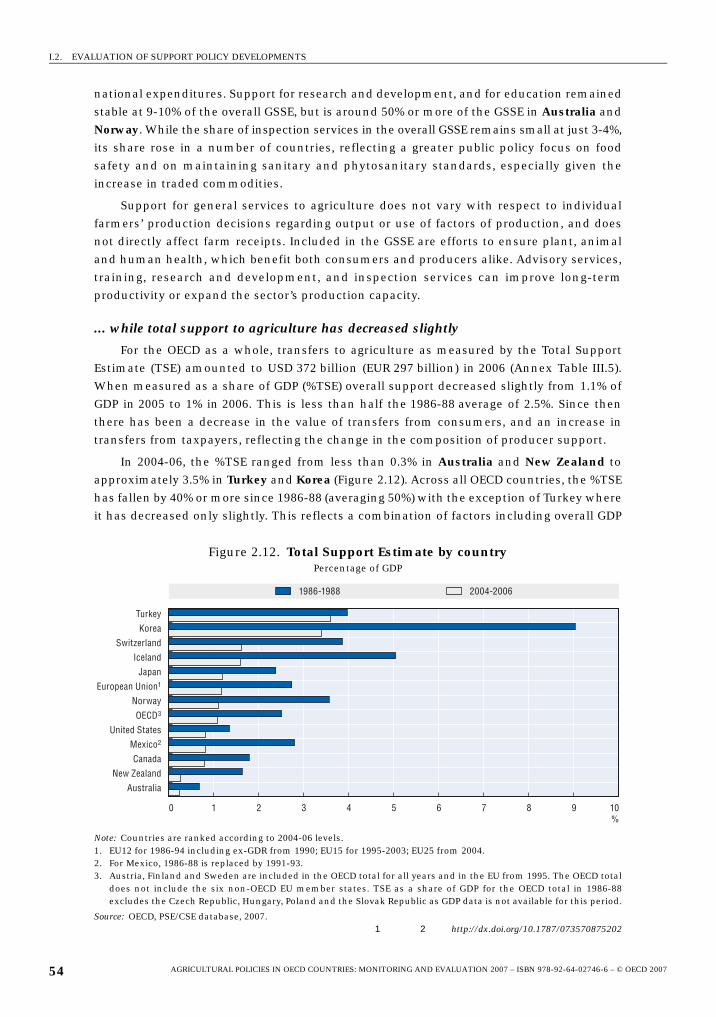
I.2. EVALUATION OF SUPPORT POLICY DEVELOPMENTS
national expenditures. Support for research and development, and for education remained
stable at 9-10% of the overall GSSE, but is around 50% or more of the GSSE in Australia and
Norway. While the share of inspection services in the overall GSSE remains small at just 3-4%,
its share rose in a number of countries, reflecting a greater public policy focus on food
safety and on maintaining sanitary and phytosanitary standards, especially given the
increase in traded commodities.
Support for general services to agriculture does not vary with respect to individual
farmers’ production decisions regarding output or use of factors of production, and does
not directly affect farm receipts. Included in the GSSE are efforts to ensure plant, animal
and human health, which benefit both consumers and producers alike. Advisory services,
training, research and development, and inspection services can improve long-term
productivity or expand the sector’s production capacity.
... while total support to agriculture has decreased slightly
For the OECD as a whole, transfers to agriculture as measured by the Total Support
Estimate (TSE) amounted to USD 372 billion (EUR 297 billion) in 2006 (Annex Table III.5).
When measured as a share of GDP (%TSE) overall support decreased slightly from 1.1% of
GDP in 2005 to 1% in 2006. This is less than half the 1986-88 average of 2.5%. Since then
there has been a decrease in the value of transfers from consumers, and an increase in
transfers from taxpayers, reflecting the change in the composition of producer support.
In 2004-06, the %TSE ranged from less than 0.3% in Australia and New Zealand to
approximately 3.5% in Turkey and Korea (Figure 2.12). Across all OECD countries, the %TSE
has fallen by 40% or more since 1986-88 (averaging 50%) with the exception of Turkey where
it has decreased only slightly. This reflects a combination of factors including overall GDP
Figure 2.12. Total Support Estimate by countryPercentage of GDP
Note: Countries are ranked according to 2004-06 levels.1. EU12 for 1986-94 including ex-GDR from 1990; EU15 for 1995-2003; EU25 from 2004.2. For Mexico, 1986-88 is replaced by 1991-93.3. Austria, Finland and Sweden are included in the OECD total for all years and in the EU from 1995. The OECD total
does not include the six non-OECD EU member states. TSE as a share of GDP for the OECD total in 1986-88excludes the Czech Republic, Hungary, Poland and the Slovak Republic as GDP data is not available for this period.
Source: OECD, PSE/CSE database, 2007.1 2 http://dx.doi.org/10.1787/073570875202
0 1 2 3 4 5 6 7 8 9 10%
Australia
New Zealand
Canada
Mexico2
United States
OECD3
Norway
European Union1
Japan
Iceland
Switzerland
Korea
Turkey
1986-1988 2004-2006
AGRICULTURAL POLICIES IN OECD COUNTRIES: MONITORING AND EVALUATION 2007 – ISBN 978-92-64-02746-6 – © OECD 200754
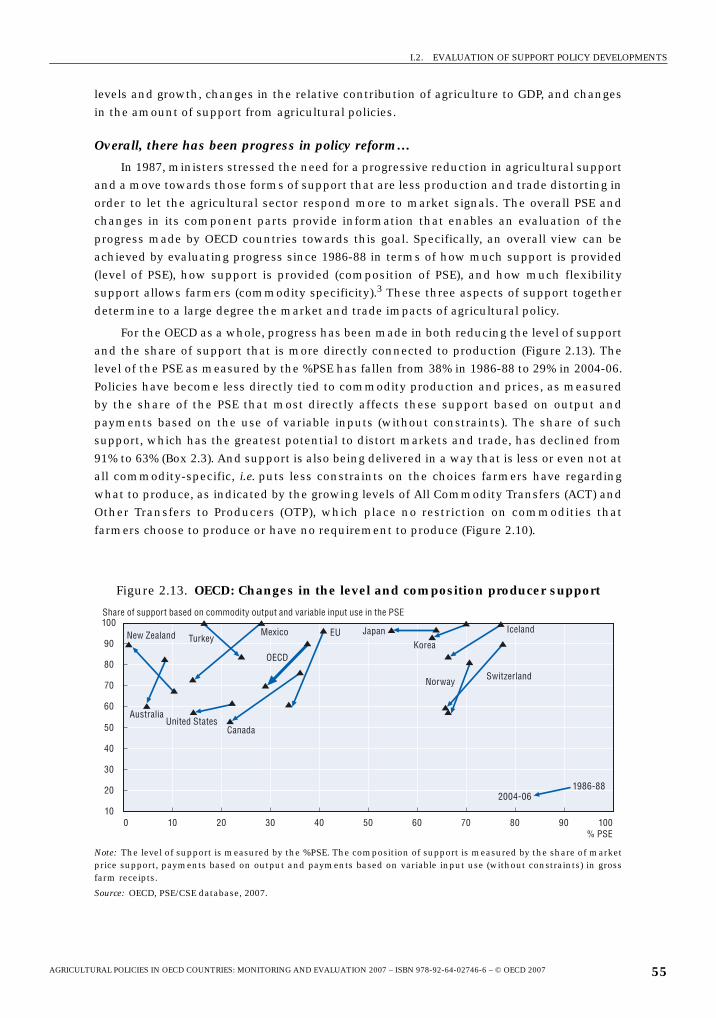
I.2. EVALUATION OF SUPPORT POLICY DEVELOPMENTS
Chapter1 Page 55 Friday, September 28, 2007 9:28 AM
levels and growth, changes in the relative contribution of agriculture to GDP, and changes
in the amount of support from agricultural policies.
Overall, there has been progress in policy reform…
In 1987, ministers stressed the need for a progressive reduction in agricultural supportand a move towards those forms of support that are less production and trade distorting in
order to let the agricultural sector respond more to market signals. The overall PSE andchanges in its component parts provide information that enables an evaluation of the
progress made by OECD countries towards this goal. Specifically, an overall view can beachieved by evaluating progress since 1986-88 in terms of how much support is provided
(level of PSE), how support is provided (composition of PSE), and how much flexibilitysupport allows farmers (commodity specificity).3 These three aspects of support together
determine to a large degree the market and trade impacts of agricultural policy.
For the OECD as a whole, progress has been made in both reducing the level of support
and the share of support that is more directly connected to production (Figure 2.13). Thelevel of the PSE as measured by the %PSE has fallen from 38% in 1986-88 to 29% in 2004-06.
Policies have become less directly tied to commodity production and prices, as measuredby the share of the PSE that most directly affects these support based on output and
payments based on the use of variable inputs (without constraints). The share of suchsupport, which has the greatest potential to distort markets and trade, has declined from
91% to 63% (Box 2.3). And support is also being delivered in a way that is less or even not atall commodity-specific, i.e. puts less constraints on the choices farmers have regarding
what to produce, as indicated by the growing levels of All Commodity Transfers (ACT) andOther Transfers to Producers (OTP), which place no restriction on commodities that
farmers choose to produce or have no requirement to produce (Figure 2.10).
Figure 2.13. OECD: Changes in the level and composition producer support
Note: The level of support is measured by the %PSE. The composition of support is measured by the share of marketprice support, payments based on output and payments based on variable input use (without constraints) in grossfarm receipts.
Source: OECD, PSE/CSE database, 2007.
Share of support based on commodity output and variable input use in the PSE
10
20
30
40
50
60
70
80
90
100
0 10 20 30 40 50 60 70 80 90 100% PSE
Australia
Canada
Switzerland
EU IcelandJapanKorea
MexicoNew Zealand
Norway
Turkey
United States
1986-882004-06
OECD
AGRICULTURAL POLICIES IN OECD COUNTRIES: MONITORING AND EVALUATION 2007 – ISBN 978-92-64-02746-6 – © OECD 2007 55
I.2. EVALUATION OF SUPPORT POLICY DEVELOPMENTS
Box 2.3. What has OECD analysis concluded about the impacts of producer support?
The OECD has been collecting and analysing information regarding support toagriculture for twenty years. In that time, it has tried to answer the question of what effectthis support has on production, prices, trade and the welfare of agricultural producers,and, more recently, on the environment. The lessons learned from this data collection andanalysis has assisted member countries in the ongoing process of policy reform as OECDmember countries continue to improve the efficiency and effectiveness of theiragricultural policies.
In Decoupling: A Conceptual Overview (OECD, 2001), three potential mechanisms throughwhich policies affect production and trade are highlighted. These are static effects, thatoccur whenever policies affect the incentive prices of agricultural outputs or inputs, riskeffects stemming from the risk-reducing or income-enhancing effects of policies anddynamic effects that occur through changes in investment decisions caused by policyexpectations.
In Decoupling: Policy Implications (OECD, 2006), the following summation was made:
● For static effects, it was found that payments based on area could be less distorting thanall other forms of support, and that among these payments, those that impose fewerconditions on the use of land are likely the least distorting. Further, MPS and paymentsbased on output could have similar impacts on production and trade that are higherthan the corresponding effects associated with any category of payments based on land.Payments based on variable inputs were found to potentially be the most productionand trade distorting among the five categories considered. It was found that high initiallevels of one type of support could reduce the marginal impact on production of anincrease in that category of support and could potentially reverse these results.
● When farmers are risk averse, risk effects can be important. Adding risk aversionparameters to the OECD Policy Evaluation Model (PEM) demonstrated that large risk-related effects are possible for some PSE categories (OECD, 2002). Insurance effects seemto be more important than wealth effects.
● For dynamic effects it was found that the effects of price expectations could besignificant. Under this assumption, OECD (2002) found that expectations of futurepayments – and especially their correlation with market prices – can have importanteffects on current production decisions.
In the Synthesis Report of the Case Studies on the Pig, Dairy and Arable Crop Sectors (OECD,2006), it was found that, despite the complexities involved in quantifying theenvironmental effects of the linkages between agriculture, trade and the environment:
● On balance, agricultural trade liberalisation could be beneficial to the environment, interms of the scale and intensity of input use, pesticide use, nitrogen uptake and off loadand GHG emissions.
● Decoupling agricultural support from production decisions, the provision of informationand investment in human capital would reduce environmental pressures and facilitatethe adoption and diffusion of environmentally benign farming systems.
● The simulation analysis undertaken in the arable crop study suggests that wheneverpayments decrease the average variable costs of production, production and trade flowscould potentially be affected.
AGRICULTURAL POLICIES IN OECD COUNTRIES: MONITORING AND EVALUATION 2007 – ISBN 978-92-64-02746-6 – © OECD 200756
I.2. EVALUATION OF SUPPORT POLICY DEVELOPMENTS
Despite this progress in policy reform, there remains scope for improvement. Meeting
the OECD ministers’ vision for agricultural policies to be targeted and tailored to specific
objectives, will require greater emphasis on policies based on meeting clearly defined
goals. It should be recalled, however, that market price support, considered to have the
greatest potential effects on markets and to be the least effective in improving farm
income, remains the dominant component of the PSE. Similarly, support (in accordance
with Table III.7) based on the production of a single commodity also represent the largest
share of the PSE. Producers receive nearly 30% of their revenue in the form of transfers
from taxpayers and consumers as a result of agricultural policy.
… while some countries have made more progress than others…
Different patterns of support and reform are evidenced across OECD countries as
shown by changes in the level of support, its composition, and the extent of commodity-
specific transfers between 1986-88 and 2004-06. In almost all countries there has been
some progress in policy reform, i.e. an improvement in one or more of the three elements,
but the extent to which further progress is necessary varies considerably. For more detail,
see the Summary of policy developments section for each country in Chapters 4-15.
● Australia: the level of producer support is the second lowest among OECD countries and
domestic and border prices are generally aligned, but Australia has seen increases,
though relatively small ones, in recent years due to the severity of drought.
● Canada: progress has been made in reducing the level of producer support and reliance
on the most distorting forms of support, with the exception of producer support for milk,
eggs and poultry.
● European Union: the level of producer support has fallen gradually relative to historical
levels, and bold steps have been made in recent years to decouple support from
production. Nonetheless, the level of production and trade distorting support remains
significant for livestock, milk, sugar, and rice production, even though support to sugar
has declined as a result of reforms to the sugar support regime that were implemented
late in 2006.
● Iceland: a significant reduction occurred in support levels relative to the value of
agricultural production. However, the level of producer support is one of the highest in
the OECD and has only fallen slightly, while the most distorting forms of support
continue to dominate.
● Japan: there has been a gradual fall in the level of producer support, but with little or no
movement to less distorting forms of support especially for rice, although a substantial
reduction did occur in the support for beef.
● Korea: the level of producer support has fallen slightly, but remains high, together with
a small reduction in the overall importance of the most distorting forms of support,
reflecting a reduction in market price support for rice along with increases for some
livestock products.
● Mexico: progress has been made by halving the level of producer support, reducing
support linked to production and decreasing differences in support levels between
commodities, although there is still some reliance on production-linked and input
subsidies.
AGRICULTURAL POLICIES IN OECD COUNTRIES: MONITORING AND EVALUATION 2007 – ISBN 978-92-64-02746-6 – © OECD 2007 57
I.2. EVALUATION OF SUPPORT POLICY DEVELOPMENTS
● New Zealand: the level of producer support is the lowest among OECD countries, having
been reduced from a relatively low base, domestic and border prices are closely aligned.
● Norway: the level of producer support is the second highest among OECD countries and
there has been little change over time, but progress has been made in lowering the
importance of the most distorting forms of support and allowing more flexibility in the
choices farmers have regarding what to produce.
● Switzerland: while the level of producer support has only fallen slightly, significant
improvements have been made in shifting away from commodity-specificity of support,
which is the most production distorting. The proportion of support relative to market
receipts of the sector has fallen significantly.
● Turkey: while below the OECD average, the level of producer support has increased over
time, as has the importance of the most distorting forms of support, and support for
specific commodities. Total support accounts for the largest share in GDP of OECD
countries, reflecting the relative importance of agriculture in the economy.
● United States: producer support as a percentage of farm receipts is relatively low. There
has been a significant reduction over time in reliance on the most distorting forms of
support and in the commodity specificity of support. Recent high commodity prices
contributed to a renewal of the downward trend in support, in particular in 2006, as
several policies connect support to price levels.
… but overall support remains high, most of which is linked to production
Government intervention continues to be significant, as does its potential impact on
production, trade and the environment. Although progress has been made since 1986-88,
about three-quarters of the total support to agriculture transferred from taxpayers and
consumers is provided to individual producers. Producer support accounts for just under
30% of farm receipts, of which over 60% is generated by the most distorting forms of
commodity and input linked support. Wide differences remain in the level of support
between commodities.
While the overall consumer and taxpayer costs of agricultural support policies have
fallen for the OECD economy as a whole, most producer support continues to be provided
through policies generating higher producer prices. This can bear heavily on low-income
consumer households, for whom food constitutes a larger share of their total expenditure.
Moreover, as most of the support provided to producers is still either output- or input-
linked, a high share of support goes to larger farms, which may increase farm income and
wealth disparities.
OECD governments are increasingly focusing on environmental performance, the
contribution of agriculture to rural development, animal welfare and food safety and
quality issues. These reflect consumer and citizen concerns, and are having an increasing
impact on the requirements for receiving producer support. For example, in 2006
approximately 26% of PSE support in OECD countries involved constraints on use of inputs
such as fertilizer and pesticides, or maintaining land according to best management
practices, up from 4% in 1986-88. For the European Union, Switzerland, and the United
States, the share of PSE support constraining the use of inputs was above 35% in 2006.
However, despite the greater emphasis on environmental performance, the majority of
support remains linked to production or factors of production. In such a policy
environment, producer support constraining the use of inputs is unlikely to offset the
AGRICULTURAL POLICIES IN OECD COUNTRIES: MONITORING AND EVALUATION 2007 – ISBN 978-92-64-02746-6 – © OECD 200758
I.2. EVALUATION OF SUPPORT POLICY DEVELOPMENTS
environmental impact linked to higher production levels arising from production-linked
support. In this respect, increasing the share of payments not requiring production (20% in
2006 for OECD) would enable countries to continue pursuing rural development objectives
while providing additional environmental improvements. Reform offers further
opportunities to better target environmental, animal welfare, and rural development
objectives in ways that are effective and economically efficient.
Notes
1. This report also covers those member states of the European Union that are not members of theOECD. However, as indicated in various tables in figures, they are not included in the total forOECD.
2. Readers should take care when looking for these figures in the estimates of support to agriculture-market receipts are the total value of production at the farm gate minus market price support.
3. The term “commodity specificity” is used in this report in a qualitative manner to denote thepreponderance of single commodity transfers (more commodity specific) relative to other types ofsupport.
AGRICULTURAL POLICIES IN OECD COUNTRIES: MONITORING AND EVALUATION 2007 – ISBN 978-92-64-02746-6 – © OECD 2007 59
I.2. EVALUATION OF SUPPORT POLICY DEVELOPMENTS
ANNEX 2.A1
Policy Principles
OECD Agriculture Ministers in 1998 adopted a set of policy principles, building on the
agricultural policy reform principles agreed by OECD ministers in 1987. These principles
stress the need to:*
● Pursue agricultural policy reform in accordance with Article 20 of the Uruguay Round
Agreement on Agriculture and the commitment to undertake further negotiations as
foreseen in that article and to the long-term goal of domestic and international policy
reform to allow for a greater influence of market signals.
● Address the problem of additional trade barriers, emerging trade issues and discipline
on export restrictions and export credits.
● Strengthen world food security.
● Promote innovative policies that facilitate responsiveness to market conditions by
agricultural producers.
● Facilitate improvement in the structures of the agriculture and agro-food sectors.
● Enhance the contribution of the agro-food sector to the viability of the rural economy.
● Take actions to ensure the protection of the environment and sustainable management
of natural resources in agriculture.
● Take account of consumer concerns.
● Encourage increased innovation, economic efficiency, and sustainability of agro-food
systems.
● Preserve and strengthen the multifunctional role of agriculture.
* The full text from the relevant Ministerial Communiqués can be found in www.oecd.org/agr/ministerial.
AGRICULTURAL POLICIES IN OECD COUNTRIES: MONITORING AND EVALUATION 2007 – ISBN 978-92-64-02746-6 – © OECD 200760
I.2. EVALUATION OF SUPPORT POLICY DEVELOPMENTS
ANNEX 2.A2
Operational Criteria
OECD Agriculture Ministers in 1998 agreed that policy measures should seek to meet a
number of operational criteria, to apply in both the domestic and the international
contexts, which should be:*
● Transparent: having easily identifiable policy objectives, costs, benefits and beneficiaries.
● Targeted: to specific outcomes and as far as possible decoupled.
● Tailored: providing transfers no greater than necessary to achieve clearly identified
outcomes.
● Flexible: reflecting the diversity of agricultural situations, be able to respond to changing
objectives and priorities, and applicable to the time period needed for the specific
outcome to be achieved.
● Equitable: taking into account the effects of the distribution of support between sectors,
farmers and regions.
* The full text from the Ministerial Communiqués can be found at www.oecd.org/agr/ministerial.
AGRICULTURAL POLICIES IN OECD COUNTRIES: MONITORING AND EVALUATION 2007 – ISBN 978-92-64-02746-6 – © OECD 2007 61

ISBN 978-92-64-02746-6
Agricultural Policies in OECD Countries
Monitoring and Evaluation 2007
© OECD 2007
PART I
Chapter 3
The New PSE Classification
In this publication the OECD Secretariat is using for the first time the new PSEmethod with new classification categories and using labels providing more detailedcharacteristics of policies applied. This chapter provides information on the overallconcept of estimation of support in agriculture and a detailed description of the newPSE classification and related indicators used in the report.
63
I.3. THE NEW PSE CLASSIFICATION
3.1. IntroductionEach year since the mid-1980s the OECD has measured the monetary transfers
(support) associated with agricultural policies in OECD countries (and increasingly, in non-
OECD countries), using a standard method. For this purpose the OECD has developed
several indicators of transfers, the most important and central one being the Producer
Support Estimate (PSE). The results, published annually by the OECD, are the only available
source of internationally comparable and transparent information on support levels in
agriculture. The support estimates have provided an important contribution to the
international policy dialogue on agriculture and trade.
Over the years, while the fundamental methodology to measure support has not
changed, policy measures have evolved. This has been partially reflected in the component
parts of the overall PSE, which are categorised to improve the evaluation of policy reform
and for use in policy analysis. With the further evolution of policies, following a two-year
period of discussion among experts, OECD countries decided to adopt significant changes
in the classification of the generic policy categories in the PSE, to change the measure of
support to commodities, and to improve the presentation of the relevant indicators. These
changes reflect the evolution of agricultural policies in OECD countries and are
incorporated into the 2007 report on Agricultural Policies in OECD Countries: Monitoring and
Evaluation. This chapter explains the new PSE classification, and how the data and
indicators can be used to monitor policy developments.
3.2. Measuring agricultural supportThe Producer Support Estimate (PSE) estimates the annual monetary transfers to
farmers from three broad categories of policy measures that:
● Maintain domestic prices for farm goods at levels higher (and occasionally lower) than
those at the country’s border (market price support [MPS] estimation).
● Provide payments to farmers based on, for example, the quantity of a commodity
produced, the amount of inputs used, the number of animals kept, the area farmed, an
historical (fixed) reference period, or farmers’ revenue or income (budgetary payments).
● Provide implicit budgetary support through tax or fee reductions that lower farm input
costs, for example for investment credit, energy and water (budgetary revenue foregone
estimation).
A crucial point to emphasise is that support not only comprises budget payments that
appear in government accounts (which is often the popular understanding of support), but
also estimations of budgetary revenues foregone and estimation of the gap between
domestic and world market prices for farm goods – market price support.
The PSE indicators are expressed in both absolute monetary terms (in national
currencies, in US dollars and in euros) and in relative terms – in the case of the %PSE as a
percentage of the value of gross farm receipts (including support payments) in each
AGRICULTURAL POLICIES IN OECD COUNTRIES: MONITORING AND EVALUATION 2007 – ISBN 978-92-64-02746-6 – © OECD 200764
I.3. THE NEW PSE CLASSIFICATION
country for which the estimates are made. The %PSE shows the degree to which farmers
are supported in a way that is not influenced by the sectoral structure and inflation rate of
the country concerned, making this estimate the most widely acceptable and useful
indicator for comparisons of support across countries and time.
Additional indicators are derived from the PSE, such as the Producer Nominal Assistance
Coefficient (producer NAC) and the Producer Nominal Protection Coefficient (producer NPC).
The producer NAC is expressed as a ratio between the value of gross farm receipts (including
all forms of measured support) and the gross farm receipts valued at border prices (without
support). The producer NPC is defined as a ratio between the average price received by the
producers (including payments based on current output) and the border price. The complete
set of OECD indicators of support is described in Annex 3.A1.
The main purpose of the calculations is to show the estimates and composition of support
each year, and to compare the trends across countries and through time, in order to monitor
and evaluate the extent to which OECD countries are making progress in policy reform to
which all OECD governments are committed. The PSE data (various indicators of support) are
also used as inputs in models used by the OECD (PEM, GTAP, SAPIM) to analyse the effects of
different policy instruments on production, trade, farm incomes and the environment.
3.3. Changes in the PSE methodology applied in this reportIn its work on monitoring and evaluating agricultural policy developments, the OECD
has always not only estimated the overall level of support, but also shown how that
support was composed of different categories of agricultural policy measures. The
classification of support into the different categories under the PSE is based on how
policies are actually implemented – and not on the objectives or impacts of those policies.
Changes in the composition of support have over time become an increasingly important
element in assessing progress towards reforming agricultural policies. Yet, as the nature of
agricultural policies continues to evolve, the policy categories used for classifying support
may have to adjust as well. This is why the nature of the policy categories shown under the
PSE has now been revised, as described in the following. It should be noted that the number
and definition of policy categories under the PSE, and hence the breakdown of support
according to its composition, is the only change to the PSE methodology that has been
made – the overall PSE level is not affected by that change.
Previous classification of PSE and related indicators
The PSE classification that has been used in recent years (including the 2006 report on
Agricultural Policies in OECD Countries: At a Glance) is shown in Box 3.1.
New classification of PSE and related indicators
In recent years in the process of policy reform, policies in many OECD countries have
been moving – to different degrees and at different speeds – towards providing support
that is less dependent on producing specific commodities. Policies are also increasingly
providing support based on farm area or on historical (fixed) criteria, which may be land,
animal numbers, or income, for example. In some cases, production is required (but the
actual commodities produced – currently or in the past – are not specified), in other cases
no agricultural commodity production is required or support is provided for the production
of non-commodity outputs. In many cases, there are other criteria that farmers must also
meet in order to be entitled to support, such as implementing constraints on the use of
AGRICULTURAL POLICIES IN OECD COUNTRIES: MONITORING AND EVALUATION 2007 – ISBN 978-92-64-02746-6 – © OECD 2007 65
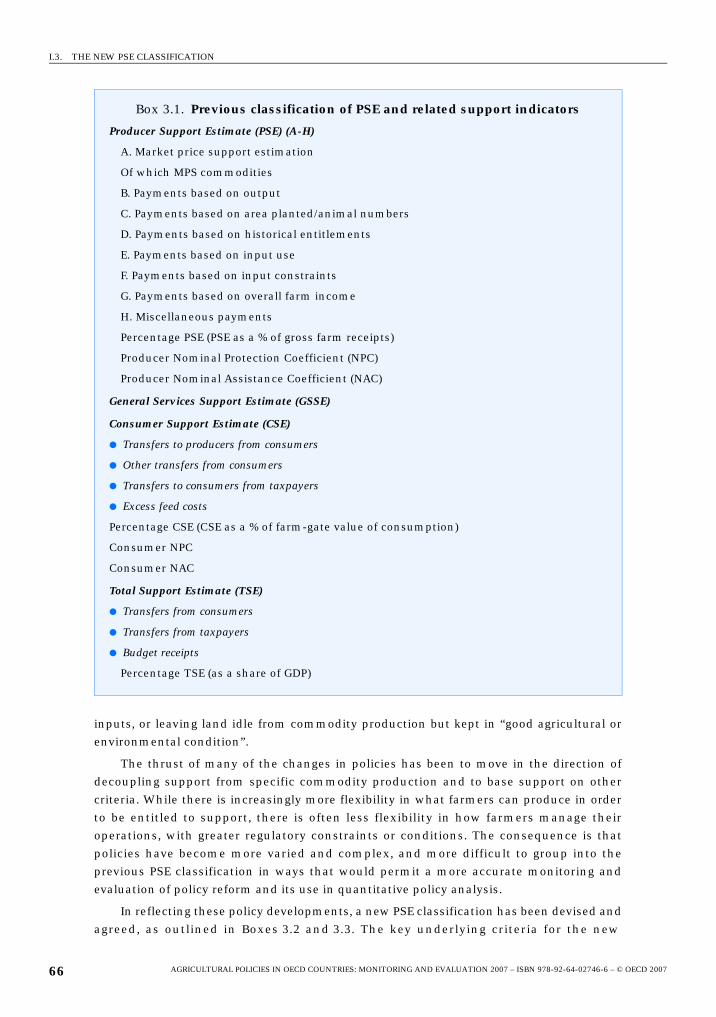
I.3. THE NEW PSE CLASSIFICATION
inputs, or leaving land idle from commodity production but kept in “good agricultural or
environmental condition”.
The thrust of many of the changes in policies has been to move in the direction of
decoupling support from specific commodity production and to base support on other
criteria. While there is increasingly more flexibility in what farmers can produce in order
to be entitled to support, there is often less flexibility in how farmers manage their
operations, with greater regulatory constraints or conditions. The consequence is that
policies have become more varied and complex, and more difficult to group into the
previous PSE classification in ways that would permit a more accurate monitoring and
evaluation of policy reform and its use in quantitative policy analysis.
In reflecting these policy developments, a new PSE classification has been devised and
agreed, as outlined in Boxes 3.2 and 3.3. The key underlying criteria for the new
Box 3.1. Previous classification of PSE and related support indicators
Producer Support Estimate (PSE) (A-H)
A. Market price support estimation
Of which MPS commodities
B. Payments based on output
C. Payments based on area planted/animal numbers
D. Payments based on historical entitlements
E. Payments based on input use
F. Payments based on input constraints
G. Payments based on overall farm income
H. Miscellaneous payments
Percentage PSE (PSE as a % of gross farm receipts)
Producer Nominal Protection Coefficient (NPC)
Producer Nominal Assistance Coefficient (NAC)
General Services Support Estimate (GSSE)
Consumer Support Estimate (CSE)
● Transfers to producers from consumers
● Other transfers from consumers
● Transfers to consumers from taxpayers
● Excess feed costs
Percentage CSE (CSE as a % of farm-gate value of consumption)
Consumer NPC
Consumer NAC
Total Support Estimate (TSE)
● Transfers from consumers
● Transfers from taxpayers
● Budget receipts
Percentage TSE (as a share of GDP)
AGRICULTURAL POLICIES IN OECD COUNTRIES: MONITORING AND EVALUATION 2007 – ISBN 978-92-64-02746-6 – © OECD 200766
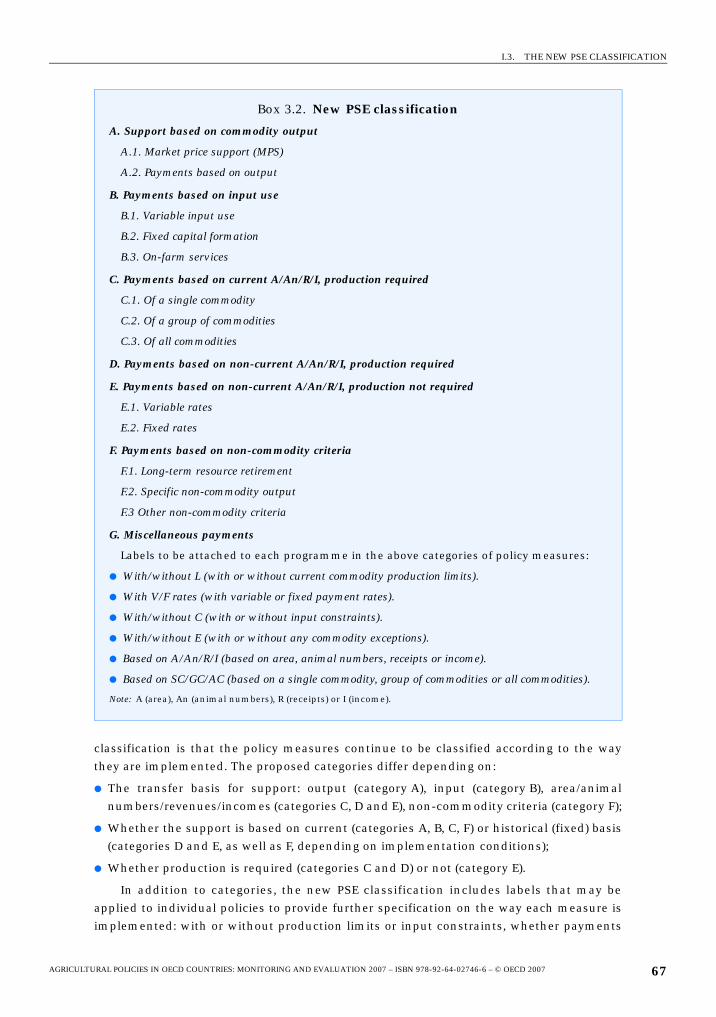
I.3. THE NEW PSE CLASSIFICATION
classification is that the policy measures continue to be classified according to the way
they are implemented. The proposed categories differ depending on:
● The transfer basis for support: output (category A), input (category B), area/animal
numbers/revenues/incomes (categories C, D and E), non-commodity criteria (category F);
● Whether the support is based on current (categories A, B, C, F) or historical (fixed) basis
(categories D and E, as well as F, depending on implementation conditions);
● Whether production is required (categories C and D) or not (category E).
In addition to categories, the new PSE classification includes labels that may be
applied to individual policies to provide further specification on the way each measure is
implemented: with or without production limits or input constraints, whether payments
Box 3.2. New PSE classification
A. Support based on commodity output
A.1. Market price support (MPS)
A.2. Payments based on output
B. Payments based on input use
B.1. Variable input use
B.2. Fixed capital formation
B.3. On-farm services
C. Payments based on current A/An/R/I, production required
C.1. Of a single commodity
C.2. Of a group of commodities
C.3. Of all commodities
D. Payments based on non-current A/An/R/I, production required
E. Payments based on non-current A/An/R/I, production not required
E.1. Variable rates
E.2. Fixed rates
F. Payments based on non-commodity criteria
F.1. Long-term resource retirement
F.2. Specific non-commodity output
F.3 Other non-commodity criteria
G. Miscellaneous payments
Labels to be attached to each programme in the above categories of policy measures:
● With/without L (with or without current commodity production limits).
● With V/F rates (with variable or fixed payment rates).
● With/without C (with or without input constraints).
● With/without E (with or without any commodity exceptions).
● Based on A/An/R/I (based on area, animal numbers, receipts or income).
● Based on SC/GC/AC (based on a single commodity, group of commodities or all commodities).
Note: A (area), An (animal numbers), R (receipts) or I (income).
AGRICULTURAL POLICIES IN OECD COUNTRIES: MONITORING AND EVALUATION 2007 – ISBN 978-92-64-02746-6 – © OECD 2007 67
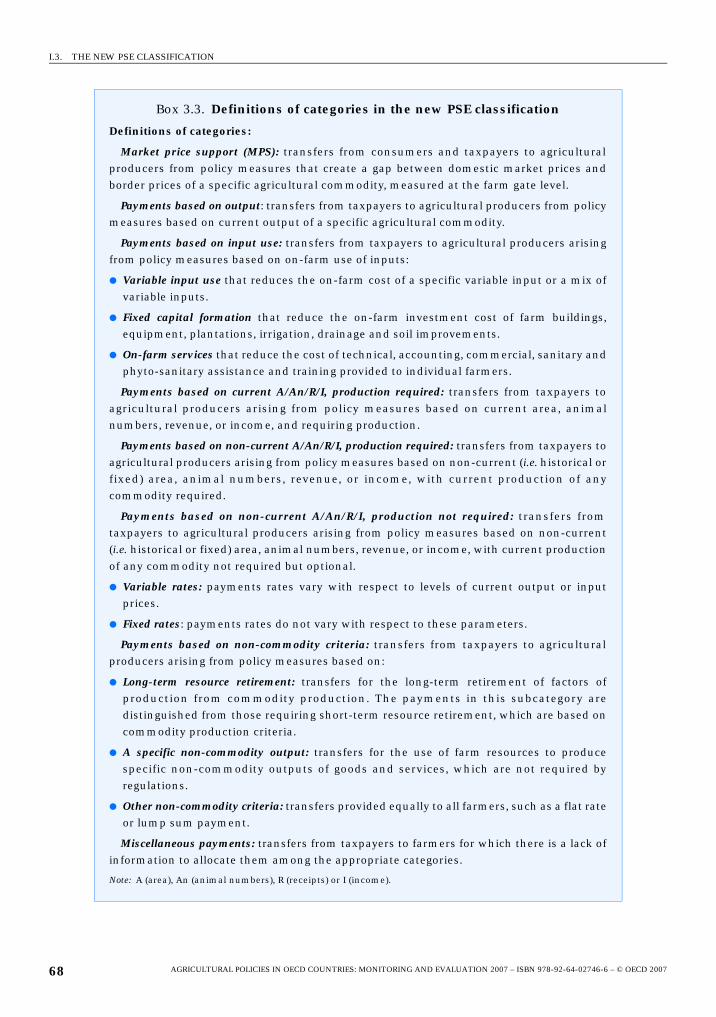
I.3. THE NEW PSE CLASSIFICATION
Box 3.3. Definitions of categories in the new PSE classification
Definitions of categories:
Market price support (MPS): transfers from consumers and taxpayers to agriculturalproducers from policy measures that create a gap between domestic market prices andborder prices of a specific agricultural commodity, measured at the farm gate level.
Payments based on output: transfers from taxpayers to agricultural producers from policymeasures based on current output of a specific agricultural commodity.
Payments based on input use: transfers from taxpayers to agricultural producers arisingfrom policy measures based on on-farm use of inputs:
● Variable input use that reduces the on-farm cost of a specific variable input or a mix ofvariable inputs.
● Fixed capital formation that reduce the on-farm investment cost of farm buildings,equipment, plantations, irrigation, drainage and soil improvements.
● On-farm services that reduce the cost of technical, accounting, commercial, sanitary andphyto-sanitary assistance and training provided to individual farmers.
Payments based on current A/An/R/I, production required: transfers from taxpayers toagricultural producers arising from policy measures based on current area, animalnumbers, revenue, or income, and requiring production.
Payments based on non-current A/An/R/I, production required: transfers from taxpayers toagricultural producers arising from policy measures based on non-current (i.e. historical orfixed) area, animal numbers, revenue, or income, with current production of anycommodity required.
Payments based on non-current A/An/R/I, production not required: transfers fromtaxpayers to agricultural producers arising from policy measures based on non-current(i.e. historical or fixed) area, animal numbers, revenue, or income, with current productionof any commodity not required but optional.
● Variable rates: payments rates vary with respect to levels of current output or inputprices.
● Fixed rates: payments rates do not vary with respect to these parameters.
Payments based on non-commodity criteria: transfers from taxpayers to agriculturalproducers arising from policy measures based on:
● Long-term resource retirement: transfers for the long-term retirement of factors ofproduction from commodity production. The payments in this subcategory aredistinguished from those requiring short-term resource retirement, which are based oncommodity production criteria.
● A specific non-commodity output: transfers for the use of farm resources to producespecific non-commodity outputs of goods and services, which are not required byregulations.
● Other non-commodity criteria: transfers provided equally to all farmers, such as a flat rateor lump sum payment.
Miscellaneous payments: transfers from taxpayers to farmers for which there is a lack ofinformation to allocate them among the appropriate categories.
Note: A (area), An (animal numbers), R (receipts) or I (income).
AGRICULTURAL POLICIES IN OECD COUNTRIES: MONITORING AND EVALUATION 2007 – ISBN 978-92-64-02746-6 – © OECD 200768
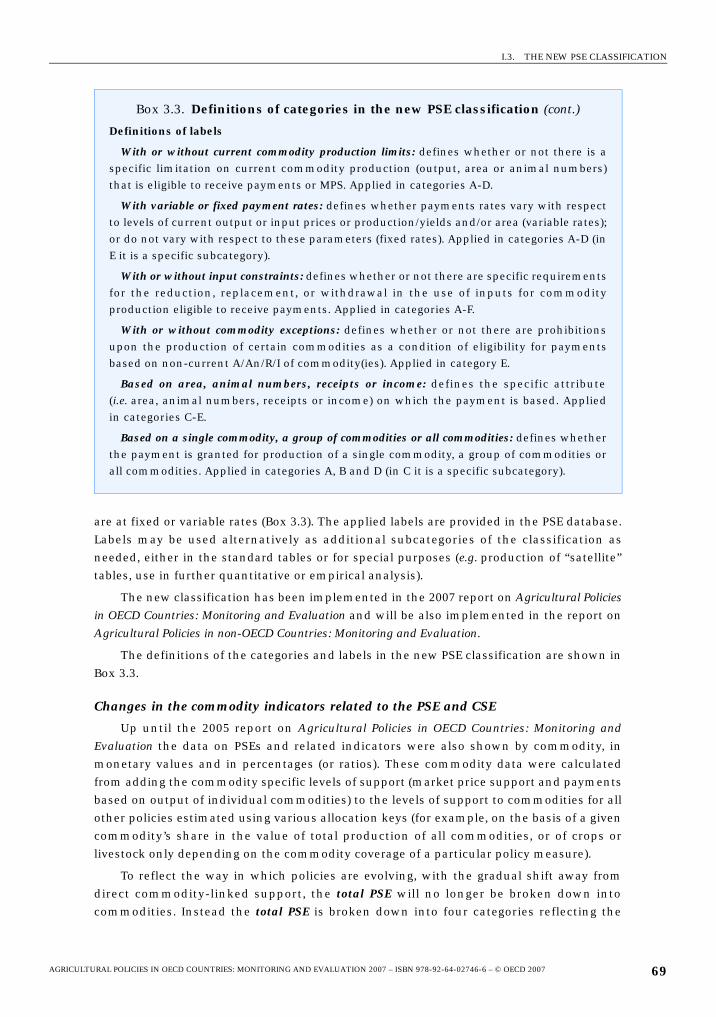
I.3. THE NEW PSE CLASSIFICATION
are at fixed or variable rates (Box 3.3). The applied labels are provided in the PSE database.
Labels may be used alternatively as additional subcategories of the classification as
needed, either in the standard tables or for special purposes (e.g. production of “satellite”
tables, use in further quantitative or empirical analysis).
The new classification has been implemented in the 2007 report on Agricultural Policies
in OECD Countries: Monitoring and Evaluation and will be also implemented in the report on
Agricultural Policies in non-OECD Countries: Monitoring and Evaluation.
The definitions of the categories and labels in the new PSE classification are shown in
Box 3.3.
Changes in the commodity indicators related to the PSE and CSE
Up until the 2005 report on Agricultural Policies in OECD Countries: Monitoring and
Evaluation the data on PSEs and related indicators were also shown by commodity, in
monetary values and in percentages (or ratios). These commodity data were calculated
from adding the commodity specific levels of support (market price support and payments
based on output of individual commodities) to the levels of support to commodities for all
other policies estimated using various allocation keys (for example, on the basis of a given
commodity’s share in the value of total production of all commodities, or of crops or
livestock only depending on the commodity coverage of a particular policy measure).
To reflect the way in which policies are evolving, with the gradual shift away from
direct commodity-linked support, the total PSE will no longer be broken down into
commodities. Instead the total PSE is broken down into four categories reflecting the
Box 3.3. Definitions of categories in the new PSE classification (cont.)
Definitions of labels
With or without current commodity production limits: defines whether or not there is aspecific limitation on current commodity production (output, area or animal numbers)that is eligible to receive payments or MPS. Applied in categories A-D.
With variable or fixed payment rates: defines whether payments rates vary with respectto levels of current output or input prices or production/yields and/or area (variable rates);or do not vary with respect to these parameters (fixed rates). Applied in categories A-D (inE it is a specific subcategory).
With or without input constraints: defines whether or not there are specific requirementsfor the reduction, replacement, or withdrawal in the use of inputs for commodityproduction eligible to receive payments. Applied in categories A-F.
With or without commodity exceptions: defines whether or not there are prohibitionsupon the production of certain commodities as a condition of eligibility for paymentsbased on non-current A/An/R/I of commodity(ies). Applied in category E.
Based on area, animal numbers, receipts or income: defines the specific attribute(i.e. area, animal numbers, receipts or income) on which the payment is based. Appliedin categories C-E.
Based on a single commodity, a group of commodities or all commodities: defines whetherthe payment is granted for production of a single commodity, a group of commodities orall commodities. Applied in categories A, B and D (in C it is a specific subcategory).
AGRICULTURAL POLICIES IN OECD COUNTRIES: MONITORING AND EVALUATION 2007 – ISBN 978-92-64-02746-6 – © OECD 2007 69
I.3. THE NEW PSE CLASSIFICATION
flexibility given to farmers’ production decisions within the various policy measures.
These categories are:
● Single Commodity Transfers (SCT): the annual monetary value of gross transfers from
policies linked to the production of a single commodity such that the producer must
produce the designated commodity in order to receive the transfer. This includes
broader policies where payments are specified on a per-commodity basis.
● Group Commodity Transfers (GCT): the annual monetary value of gross transfers from
policies whose payments are made on the basis that one or more of a designated list of
commodities is produced. That is, a producer may produce from a set of allowable
commodities and receive the transfer that does not vary with respect to this decision.
● All Commodity Transfers (ACT): the annual monetary value of gross transfers from
policies that place no restrictions on the commodity produced but require the recipient
to produce some commodity of their choice.
● Other Transfers to Producers (OTP): the annual monetary value of gross transfers made
under policies that do not fall in the above three cases (SCT, GCT, ACT). That is, transfers
that do not require any commodity production at all.
These four PSE breakdown categories are mutually exclusive in the sense that
payments included in one category are not included in others (i.e. transfers to wheat in the
SCT are not included in transfers to cereals as a group in the GCT category). In this way,
there are no overlaps between the categories and they therefore add up to the total PSE.
The Group Commodity Transfers include transfers to different commodity groups and
the PSE database provides information on transfers to these groups. The transfers to
different groups within the GCT are also mutually exclusive in the sense that payments
included in one group are not included in the others (i.e. transfers to grains are not included
in transfers in a group grains and oilseeds). The composition of the groups varies by country,
depending on countries’ programmes. The detailed lists (by country) of commodity groups
included in the GCT are provided in Annex 3.A2.
3.4. Indicators used in policy analysis
Indicators related to total support
The new PSE classification does not change the total PSE. The only change is its
breakdown into new categories based on well-established implementation criteria
(Box 3.2). The relative indicators linked to the total PSE (%PSE, producer NPC and producer
NAC) and CSE (%CSE, consumer NPC and consumer NAC) continue to be calculated as
previously. The GSSE is also still expressed as a share of total TSE and the %TSE in relation
to GDP. The Annex 3.A1 provides definitions of these indicators.
Commodity specific indicators
The changes in the application of the methodology do not allow a breakdown of the
total PSE by commodity. Therefore, the %PSE by commodity and the producer NAC by
commodity are no longer calculated, but the producer and consumer NPCs remain.
The Producer Single Commodity Transfer (Producer SCT) is by definition available for
specific commodities, as well as the derived relative indicator the %SCT. As mentioned
above, the SCT is the sum of transfers to producers through policies granted to a single
commodity, the most important element of which is in most cases the market price
AGRICULTURAL POLICIES IN OECD COUNTRIES: MONITORING AND EVALUATION 2007 – ISBN 978-92-64-02746-6 – © OECD 200770
I.3. THE NEW PSE CLASSIFICATION
support. The %SCT is the commodity SCT expressed as a share of gross farm receipts for
the specific commodity. Compared to the previously used commodity %PSE (which
included all PSE support), the %SCT includes only support provided through commodity
specific policies.
For the CSE, in the absence of transfers from taxpayers to consumers (i.e. the situation
in most cases), the CSE is the mirror image of the MPS and hence by definition is
commodity specific. By applying the same principle of not using allocation keys to
distribute transfers from taxpayers to consumers to commodities the commodity %CSE
and the consumer NAC by commodity is no longer calculated. However, in most cases the
consumer NPC is equal to the consumer NAC by commodity and captures all the transfers
to (from) consumers. Hence, the consumer NPC is the main tool used to analyse support to
consumers by commodity.
Use of labels in the PSE database
The use of labels gives considerable flexibility to break down the total PSE into
categories reflecting specific characteristics of policies in an ad hoc manner (i.e. whether
the policy includes a constraint on input use or not, or whether it is applied with or without
production limits – see the definition of labels in Box 3.3). When desired, the labels in the
database may be used alternatively as additional subcategories in the main classification
framework. Currently labels are used in this way as subcategories in C and E.
The labels applied in the database can be used to produce specific aggregations of
payments for the tables in the Monitoring and Evaluation report (see Annex Table III.7, and
Table III.20-Table III.31) to give emphasis to a specific implementation criteria used in the
policies applied. The label information can be used also in quantitative analyse based on
the PSE database, e.g. PEM work or when linking policies with environmental issues
(SAPIM).
3.5. The use of the new classification and related indicators in policy analysisThe new classification of categories of policy measures, based, as ever, on how the
policies are implemented, has the potential to show the degree of flexibility that farmers
have in their production choices and thus how different policies influence farmers’
decisions to produce commodities and other goods and services using farm resources.
Some policy measures deliver support directly related to the amount of a specific
commodity produced (market price support and payments based on commodity
production) or variable inputs used. As shown by the results of the Policy Evaluation Model
(PEM) on decoupling, these policy measures are the ones that potentially (ex ante) have the
strongest influence on commodity production incentives although this effect is weakened
in those countries that place constraints on output produced or inputs used. Policy
measures that are designed to deliver support based on current parameters, such as area
or animal numbers and require commodity production, have a potentially somewhat
weaker influence on production incentives. Policy measures providing support based on
historical parameters, such as the overall farm area or income situation of the farmer, have
potentially much less influence on production incentives, while those that provide support
based on non-commodity criteria (such as the provision of trees, stone walls and hedges),
have potentially the least influence on production. Clearly, the actual impacts (ex post) will
depend on many factors that determine the aggregate degree of responsiveness of farmers
AGRICULTURAL POLICIES IN OECD COUNTRIES: MONITORING AND EVALUATION 2007 – ISBN 978-92-64-02746-6 – © OECD 2007 71
I.3. THE NEW PSE CLASSIFICATION
to policy changes – including any constraints on production. Neither the total PSE nor its
composition in terms of different categories of policies can, therefore, be interpreted as
indicating the actual impact of policy on production and markets. Policy analysis based on
support composition can only provide information on the potential of some of the
individual policy categories (A, part of B) to influence producer decisions, while for other
categories (C) this potential is less clear, as they group more heterogeneous policies. It is
only through model-based analysis (such as provided in the OECD’S PEM) or empirical
analysis and the use of labels, that firmer conclusions can be drawn regarding production
and market impacts of given policy measures.
Against this background, the new classification of policy measures and the use of
labels will be able to better reflect the evolution of the policy mix. It is thus possible to
assess policy reform not only in terms of the trends in the overall level of support, but also
in terms of whether there were shifts towards policies that have less potential to distort
commodity production and trade. Identifying policy measures that provide support based
on a mixture of current and past production variables and those that deliver support not
based on farm commodity production provides a rich source of data to help to evaluate
progress in policy reform. Moreover, the data base can be marshalled to illustrate
developments on matters where specific policy interests within a country or across
countries are important.
Policies in the PSE are classified according to the basis on which support is delivered
(implementation criteria) and not on policy objectives or impacts. The new PSE data base
will provide a wealth of material to engage in model-based analysis of the effects of
different policy instruments on variables such as production, trade and the environment.
Increasingly, countries are interested in knowing the extent to which policy measures are
targeted to achieve the range of policy objectives (effectiveness), assessing the costs and
benefits of those efforts (efficiency), and understanding the implications for the
distribution of income (equity). In addressing these issues, it is important to recognise that
the PSE needs to be complemented with other data, as well as with information on the
overall policy mix. Moreover, the use and interpretation of PSE and associated indicators in
comparisons across countries and time needs to be undertaken with care.
AGRICULTURAL POLICIES IN OECD COUNTRIES: MONITORING AND EVALUATION 2007 – ISBN 978-92-64-02746-6 – © OECD 200772
I.3. THE NEW PSE CLASSIFICATION
ANNEX 3.A1
Definitions of the OECD Indicators of Support
Nominal indicatorsProducer Support Estimate (PSE): the annual monetary value of gross transfers from
consumers and taxpayers to agricultural producers, measured at the farm gate level,
arising from policy measures that support agriculture, regardless of their nature, objectives
or impacts on farm production or income. It includes market price support, budgetary
payments and budget revenue foregone, i.e. gross transfers from consumers and taxpayers
to agricultural producers arising from policy measures based on: current output, input use,
area planted/animal numbers/revenues/incomes (current, non-current), and non-
commodity criteria.
Market Price Support (MPS): the estimated annual monetary value of gross transfers
from consumers and taxpayers to agricultural producers arising from policy measures that
create a gap between domestic market prices and border prices of a specific agricultural
commodity, measured at the farm gate level. MPS is also available by commodity.
Single Commodity Transfers (SCT): the annual monetary value of gross transfers from
policies linked to the production of a single commodity such that the producer must
produce the designated commodity in order to receive the payment. This includes broader
policies where transfers are specified on a per-commodity basis. SCT is also available by
commodity.
Group Commodity Transfers (GCT): the annual monetary value of gross transfers from
policies whose payments are made on the basis that one or more of a designated list of
commodities is produced. That is, a producer may produce from a set of allowable
commodities and receive a transfer that does not vary with respect to this decision.
All Commodity Transfers (ACT): the annual monetary value of gross transfers from
policies that place no restrictions on the commodity produced but require the recipient to
produce some commodity of their choice.
Other Transfers to Producers (OTP): the annual monetary value of gross transfers made
under policies that do not require any commodity production at all.
Consumer Support Estimate (CSE): the annual monetary value of gross transfers to
(from) consumers of agricultural commodities, measured at the farm gate level, arising
from policy measures that support agriculture, regardless of their nature, objectives or
impacts on consumption of farm products. If negative, the CSE measures the burden
(implicit tax) on consumers through market price support (higher prices), that more than
offsets consumer subsidies that lower prices to consumers.
AGRICULTURAL POLICIES IN OECD COUNTRIES: MONITORING AND EVALUATION 2007 – ISBN 978-92-64-02746-6 – © OECD 2007 73
I.3. THE NEW PSE CLASSIFICATION
General Services Support Estimate (GSSE): the annual monetary value of gross transfers
to general services provided to agriculture as a sector (such as research, development,
training, inspection, marketing and promotion), arising from policy measures that support
agriculture regardless of their nature, objectives and impacts on farm production, income,
or consumption. The GSSE does not include any payments to individual producers.
Total Support Estimate (TSE): the annual monetary value of all gross transfers from
taxpayers and consumers arising from policy measures that support agriculture, net of the
associated budgetary receipts, regardless of their objectives and impacts on farm
production and income, or consumption of farm products.
Relative indicatorsPercentage PSE (%PSE): PSE transfers as a share of gross farm receipts (including
support in the denominator).
Percentage SCT (%SCT): is the commodity SCT expressed as a share of gross farm
receipts for the specific commodity (including support in the denominator).
Producer Nominal Protection Coefficient (producer NPC): the ratio between the average
price received by producers (at farm gate), including payments per tonne of current output,
and the border price (measured at farm gate). The PNPC is also available by commodity.
Producer Nominal Assistance Coefficient (producer NAC): the ratio between the value of
gross farm receipts including support and gross farm receipts (at farm gate) valued at
border prices (measured at farm gate).
Percentage CSE (%CSE): The %CSE measures the implicit tax (or subsidy, if CSE is
positive) on consumers as a share of consumption expenditure at the farm gate.
Consumer Nominal Protection Coefficient (consumer NPC): the ratio between the average
price paid by consumers (at farm gate) and the border price (measured at farm gate). The
CNPC is also available by commodity.
Consumer Nominal Assistance Coefficient (consumer NAC): the ratio between the value
of consumption expenditure on agricultural commodities (at farm gate) and that valued at
border prices.
Percentage TSE (%TSE): overall transfers to farming sector as a percentage of GDP.
Share indicators (these indicators express a share of a specific nominal indicator in the total PSE)
Share of SCT in total PSE (%): share of Single Commodity Transfers in the total PSE. This
indicator is also available by commodity.
Share of GCT in total PSE (%): share of Group specific transfers in the total PSE.
Share of ACT in total PSE (%): share of All Commodity Transfers in the total PSE.
Share of OTP in total PSE (%): share of Other Transfers to Producers in the total PSE.
Percentage GSSE (%GSSE): share of expenditures on general services in the Total
Support Estimate (TSE).
AGRICULTURAL POLICIES IN OECD COUNTRIES: MONITORING AND EVALUATION 2007 – ISBN 978-92-64-02746-6 – © OECD 200774
I.3. THE NEW PSE CLASSIFICATION
ANNEX 3.A2
Commodity Groups Applied in Member Countries
This annex provides illustrative information on the commodity groups identified in
member countries. This grouping is based on a common set of groups which are most
commonly to be found in the policies applied within OECD member-countries but leaves
flexibility to reflect specific policy mixes. The purpose is to use these generic categories as
a menu and use only those which are relevant. The selection of groups should provide an
opportunity to categorise all programmes summed up as transfers to groups of products
and may vary from year to year as new programmes are added and continuing
programmes may be modified. The Secretariat will continue his effort to improve the
consistency of the groups used in the different countries (i.e. the same group name should
have the same meaning in terms of commodities covered).
AustraliaThree different commodity groups have been defined for Australia based on the
policies in place over the period starting in 1986. These are:
● All crops: Includes mostly disaster payments and weed strategy payments.
● Fruits and vegetables: Disease control and eradication payments.
● All livestock: Payments related to animal identification and control and disease control
and eradication.
● Ruminants: Disease control and eradication payments.
CanadaThree different commodity groups have been defined for Canada based on the policies
in place over the period starting in 1986. These are:
● Crops: This includes any policy that is available to producers of any grain or oilseed crop.
● Livestock: This group includes policies directed at producers of livestock, including cattle,
pigs, dairy and poultry. Some examples are the BSE Recovery Program (2003) and the
Feed Freight Assistance Program (until 1995).
● All commodities except supply managed: This includes Canada’s major agricultural
support polices, including the stabilisation component of the Canadian Agricultural
Income Stabilisation (CAIS) programme (started 2003) and the Net Income Stabilization
Account (NISA) programme (1994-2002).
AGRICULTURAL POLICIES IN OECD COUNTRIES: MONITORING AND EVALUATION 2007 – ISBN 978-92-64-02746-6 – © OECD 2007 75
I.3. THE NEW PSE CLASSIFICATION
European UnionTwelve different commodity groups have been defined for the EU based on the policies
in place over the period starting in 1986. These commodity groups are:
● All crops: This includes any policy that is available to producers of any crop, such as
measures for irrigation, pest control or environmentally friendly crop farming.
● All arable crops: This includes any policy that is available to producers of any crop. This
group is only used for measures such as payments for crop rotation, as most area
payments under Agenda 2000 were restricted to COP (see below).
● Cereals, oilseeds and protein crops (COP): This includes any policy that is available to
producers of any COP crop, such as set-aside payments and Agenda 2000 area payments
after 2003.
● Grains: This includes payments per hectare of cereals, with a rate per ha for any cereal
different from that for oilseeds or protein crops. They were introduced by the 1992
reform. In 2004, these payments became part of the COP group.
● Oilseeds: This includes payments per hectare of oilseeds, with a rate per ha for any
oilseed different from that for cereals or protein crops.
● Protein crops: This includes payments per hectare of protein crops, with a rate per ha for
any protein crops different from that for cereals or oilseeds.
● All fruits and vegetables: This includes measures for the whole fruit and vegetable sector,
such as measures for orchard improvement.
● Other crops: This group includes payments to non-commodity specific crops other than
COP, including grass and forage crops.
● All livestock: This group includes policies directed at producers of livestock, including
cattle, pigs, dairy and poultry. Examples are measures for disease control, breeding
improvement, compensating losses or manure handling, as well as some regional
payments.
● Ruminants: This includes payments for beef, sheep and goats such as less-favoured area
payments before 2000, which were paid per livestock unit.
● Non-ruminants: No payment is made specifically to non-ruminants in EU member
states.
● Milk and beef: This includes payments to the dairy sector, which cannot be associated to
either milk production of meat production, such as investments in stables.
IcelandThree different commodity groups have been defined for Iceland based on the policies
in place over the period starting in 1986. These commodity groups are:
● Livestock: This group includes policies directed at producers of livestock, including cattle,
pigs, dairy and poultry. An example is the animal breeding programme.
● Ruminants: This group includes policies directed at producers of cattle, dairy and
sheepmeat.
● Sheepmeat and poultry: This group includes policies directed at producers of sheepmeat
and poultry. An example is the animal disease control programme.
AGRICULTURAL POLICIES IN OECD COUNTRIES: MONITORING AND EVALUATION 2007 – ISBN 978-92-64-02746-6 – © OECD 200776
I.3. THE NEW PSE CLASSIFICATION
JapanTwo different commodity groups have been defined for Japan based on the policies in
place over the period starting in 1986. These commodity groups are:
● Livestock: This group includes policy directed at producers of livestock, including cattle,
pigs, dairy and poultry. Animal disease control programme is an example.
● Wheat, barley and soybeans: This group includes policy that is available to producers of
wheat, barley and soybeans.
KoreaFour different commodity groups have been defined for Korea based on the policies in
place over the period starting in 1986. These commodity groups are:
● All crops: This includes any policy that is available to producers of any crop. This set of
transfers includes payments based on input use such as fertilizer, seeds and pesticides.
In more recent years (starting from 1999), this group includes also payments for set-
aside, direct payment for environment friendly farming practices, paddy-field
environmental conservation payment and direct payment for landscape preservation.
● All livestock: This includes policies directed at producers of livestock, including cattle,
pigs, dairy and poultry. The transfers in this category include three programmes; direct
payment for environmentally friendly livestock practices, payments for management of
livestock waste and credit concessions to livestock farmers.
● Beef and pigmeat: This includes payments in the meat quality enhancement programme.
It is the payments per head of animal to encourage good quality beef and pigmeat.
● Beef and milk: This includes payments in the cattle reproduction programme which
includes artificial insemination.
MexicoTwo main commodity groups have been defined for Mexico based on the policies in
place over the period starting in 1986. These commodity groups are:
● Crops: This includes any policy that is available to producers of any grain or oilseed crop.
Most of the policies in this group belong to ALIANZA. This group of policies decreased in
importance in the GCT between 1991-93 and 2004-06, decreasing from 6 to 2%.
● Livestock: This group includes policies directed at producers of livestock, including cattle,
pigs, dairy and poultry. Some examples are ALIANZA programmes such as the Livestock
Improvement and the Genetic Improvement. This group of policies has become an
important part of the GCT in 2004-06, but was not used at all in the base period of 1991-93.
● Several smaller groups of commodities emerged, such as fruits, flowers, industrial crops,and alternative crops. Some of these payments are subnational to take advantage of
specific agro-climatic conditions. None of these payments was materialized recently.
New ZealandTwo different commodity groups have been defined for New Zealand based on the
policies in place over the period starting in 1986. These commodity groups are:
● All livestock: This category represents the payments on animal disease control
programmes that seek to safeguard the health of the agricultural animal population.
AGRICULTURAL POLICIES IN OECD COUNTRIES: MONITORING AND EVALUATION 2007 – ISBN 978-92-64-02746-6 – © OECD 2007 77
I.3. THE NEW PSE CLASSIFICATION
These programmes include export quality assurance for live animals, the reduction of
production limiting diseases, disease surveillance and disease eradication. This
payment represented 100% of GCT since 1993 when the payments for the other group
(sheepmeat, wool, beef and milk) were completely stopped.
● Sheepmeat, wool, beef and milk: This category included policies directed at producers of
sheep and cattle. The transfers in this category represent payments in seven
programmes; labour subsidy programme, fertilizer price subsidy programme, livestock
incentive scheme, land development and encouragement loan scheme, interest
concession programme from the rural bank and finance corporation, debt discounting
write-off programme from the rural bank and finance corporation, the debt write-off
programme for producer boards. The payments for this category were completely
stopped in 1992 as the reform of these sectors was accomplished.
NorwayEleven different commodity groups have been defined for Norway based on the
policies in place over the period starting in 1986. The main commodity groups are:
● All crops: This includes any policy that is available to producers of any crop, such as
measures for irrigation, pest control or environmentally friendly crop farming.
● Grains: This group includes payments based on output, payments per hectare of grains,
transport subsidies and regional subsidies.
● All livestock: This group includes payments to producers of livestock, including cattle,
pigs, dairy and poultry. Examples are deficiency payments, headage payments and the
vacation and temporary substitute scheme for livestock producers, as well as some
regional payments.
● Feed crops: Here are included all subsidies to coarse feed, including acreage support to
mountain farming and support to meadowseed storage.
SwitzerlandEight different commodity groups have been defined for Switzerland based on the
policies in place over the period starting in 1986 (6 of them were used in 2004-06). These
commodity groups are:
● All livestock: This set of transfers includes policies that are available to livestock raised in
difficult conditions (livestock in mountain areas, 1986-98; livestock in difficult
conditions, 1999-2006). At a later stage this group includes also payments for animal
welfare (payments for animal housing systems, from 1996; payments for keeping animal
outdoors, from 1999).
● Ruminants: The transfers in the category represent payments of two programmes Base
area payment for grassland (1993-98) and Payments for roughage eating animals (from
1999). The programme consists of headage payments available to all producers for
ruminants (beef, sheep and goats, horses, lamas, alpagas, etc.).
● All crops: This includes any policy that is available to producers of any crop. This set of
transfers includes payments based on input use such as fertilizer, seeds and pesticides.
However, the most important part of transfers within this group were the payments for
integrated production (1992-98).
AGRICULTURAL POLICIES IN OECD COUNTRIES: MONITORING AND EVALUATION 2007 – ISBN 978-92-64-02746-6 – © OECD 200778
I.3. THE NEW PSE CLASSIFICATION
● Arable crops: Transfers to this group are mainly the Base area payment to arable land
applied in the 1992-98 period.
● Grains: This represents mainly the Base premium for coarse grains (1986-2000), a
relatively small amounts of payments were for Extensive production of grains (1992-98).
● Oilseeds: Area payments for oilseeds (from 1999).
● Grains and oilseeds: Area payments for extensive grains and rapeseed cultivation (from
1999).
● All crops except wine: Payments for crop production on steep slopes.
TurkeySix different commodity groups have been identified, based on the policies in place
over the period starting in 1986.
● All crops: This primarily includes support for input use, such as fertiliser subsidies,
pesticide subsidies, hybrid seed subsidies and support for natural disasters.
● All livestock: This entails transfers to livestock producers in the form of input support,
such as support for feed, capital grants, livestock replacement and control of disease.
● Milk, beef and sheepmeat: This group includes support to producers of cattle, dairy and
sheep for animal replacement due to natural disasters through the Livestock
Replacement Programme and for pasture improvement.
● Irrigated crops: Electricity and irrigation Subsidies
● Wheat, sugar, cotton, sunflower: It includes payments under the On Farm Development
Support Programme.
● Hazelnuts and tobacco: It includes payments under the Transition Programme.
United StatesThere are eight different commodity groups, based on the policies in place over the
period starting in 1986. Of these, the first four accounted for all of GCT support in 2004-06.
● All crops: This primarily includes payments for environmental conservation and
protection purposes. Examples of programmes in this group include the Farmland
Protection Program, Conservation Security Program, Environmental Quality
Improvement Program and Conservation Technical Assistance Program.
● Programme crops: This includes payments to producers of wheat, feed grains, upland
cotton, rice, oilseeds tobacco and peanuts under the Crop Disaster Payments Program.
● Irrigated crops: This includes support for irrigation provided through the Reclamation
Program.
● Milk, beef and sheepmeat: This includes support to producers of cattle, dairy and sheep
under the Feed Assistance Program and the Grassland Reserve Program.
● Non-programme crops: It includes payments under the Non-insured Crops Disaster
Assistance Program.
● Milk and beef: It includes payments under the Livestock Indemnity Program.
● Beef and sheepmeat: It includes payments for grazing support.
● Tree and vineyard: It includes payments under the Tree and Vineyard Disaster Payments
Program.
AGRICULTURAL POLICIES IN OECD COUNTRIES: MONITORING AND EVALUATION 2007 – ISBN 978-92-64-02746-6 – © OECD 2007 79

ISBN 978-92-64-02746-6
Agricultural Policies in OECD Countries
Monitoring and Evaluation 2007
© OECD 2007
PART II
Country Chapters
81
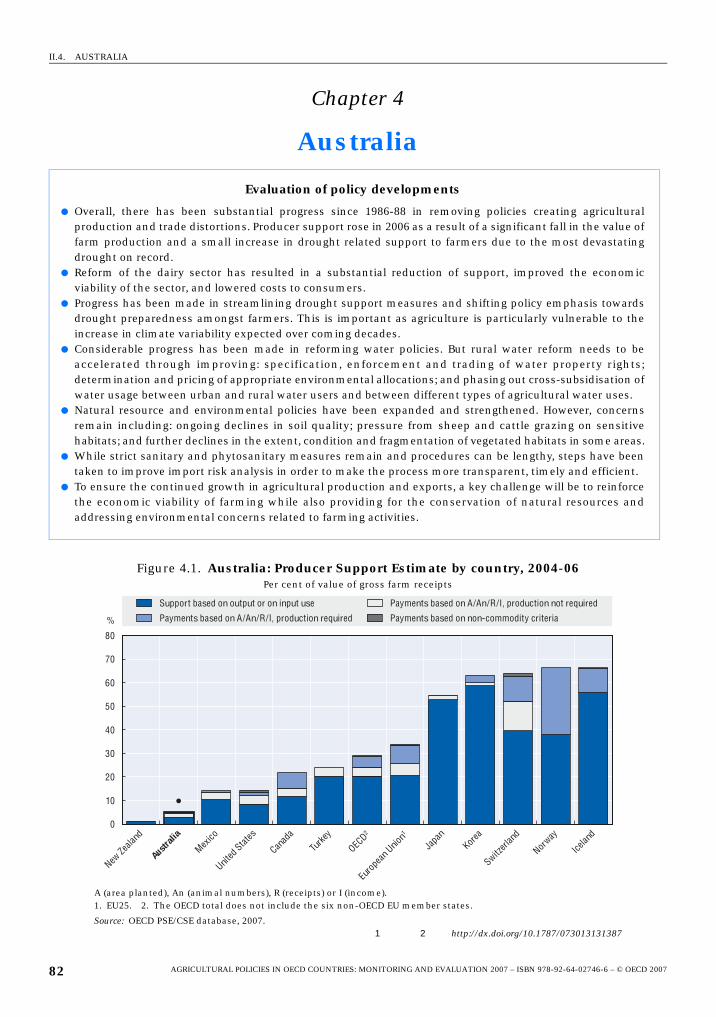
II.4. AUSTRALIA
alfg
ic
se
es;f
ses.n.ed
Chapter 4
Australia
Evaluation of policy developments
● Overall, there has been substantial progress since 1986-88 in removing policies creating agriculturproduction and trade distortions. Producer support rose in 2006 as a result of a significant fall in the value ofarm production and a small increase in drought related support to farmers due to the most devastatindrought on record.
● Reform of the dairy sector has resulted in a substantial reduction of support, improved the economviability of the sector, and lowered costs to consumers.
● Progress has been made in streamlining drought support measures and shifting policy emphasis towarddrought preparedness amongst farmers. This is important as agriculture is particularly vulnerable to thincrease in climate variability expected over coming decades.
● Considerable progress has been made in reforming water policies. But rural water reform needs to baccelerated through improving: specification, enforcement and trading of water property rightdetermination and pricing of appropriate environmental allocations; and phasing out cross-subsidisation owater usage between urban and rural water users and between different types of agricultural water uses.
● Natural resource and environmental policies have been expanded and strengthened. However, concernremain including: ongoing declines in soil quality; pressure from sheep and cattle grazing on sensitivhabitats; and further declines in the extent, condition and fragmentation of vegetated habitats in some area
● While strict sanitary and phytosanitary measures remain and procedures can be lengthy, steps have beetaken to improve import risk analysis in order to make the process more transparent, timely and efficient
● To ensure the continued growth in agricultural production and exports, a key challenge will be to reinforcthe economic viability of farming while also providing for the conservation of natural resources anaddressing environmental concerns related to farming activities.
Figure 4.1. Australia: Producer Support Estimate by country, 2004-06Per cent of value of gross farm receipts
A (area planted), An (animal numbers), R (receipts) or I (income).1. EU25. 2. The OECD total does not include the six non-OECD EU member states.
Source: OECD PSE/CSE database, 2007.1 2 http://dx.doi.org/10.1787/073013131387
0
10
20
30
40
50
60
70
80
New Ze
aland
Austra
lia
Mexico
United
States
Canad
a
Turke
y
OECD2
Euro
pean
Unio
n1
Japa
nKor
ea
Switzerl
and
Norway
Icelan
d
%
Support based on output or on input use
Payments based on A/An/R/I, production required
Payments based on A/An/R/I, production not required
Payments based on non-commodity criteria
AGRICULTURAL POLICIES IN OECD COUNTRIES: MONITORING AND EVALUATION 2007 – ISBN 978-92-64-02746-6 – © OECD 200782
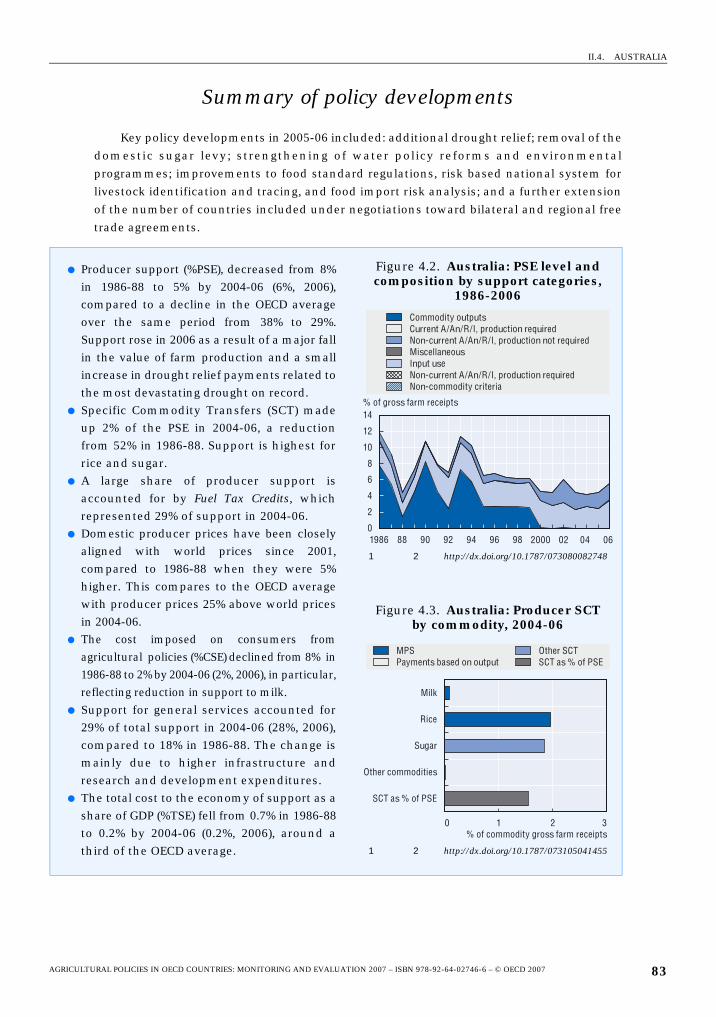
II.4. AUSTRALIA
Summary of policy developments
Key policy developments in 2005-06 included: additional drought relief; removal of the
domestic sugar levy; strengthening of water policy reforms and environmental
programmes; improvements to food standard regulations, risk based national system for
livestock identification and tracing, and food import risk analysis; and a further extension
of the number of countries included under negotiations toward bilateral and regional free
trade agreements.
● Producer support (%PSE), decreased from 8%in 1986-88 to 5% by 2004-06 (6%, 2006),compared to a decline in the OECD averageover the same period from 38% to 29%.Support rose in 2006 as a result of a major fallin the value of farm production and a smallincrease in drought relief payments related tothe most devastating drought on record.
● Specific Commodity Transfers (SCT) madeup 2% of the PSE in 2004-06, a reductionfrom 52% in 1986-88. Support is highest forrice and sugar.
● A large share of producer support isaccounted for by Fuel Tax Credits, whichrepresented 29% of support in 2004-06.
● Domestic producer prices have been closelyaligned with world prices since 2001,compared to 1986-88 when they were 5%higher. This compares to the OECD averagewith producer prices 25% above world pricesin 2004-06.
● The cost imposed on consumers fromagricultural policies (%CSE) declined from 8% in1986-88 to 2% by 2004-06 (2%, 2006), in particular,reflecting reduction in support to milk.
● Support for general services accounted for29% of total support in 2004-06 (28%, 2006),compared to 18% in 1986-88. The change ismainly due to higher infrastructure andresearch and development expenditures.
● The total cost to the economy of support as ashare of GDP (%TSE) fell from 0.7% in 1986-88to 0.2% by 2004-06 (0.2%, 2006), around athird of the OECD average.
Figure 4.2. Australia: PSE level and composition by support categories,
1986-2006
1 2 http://dx.doi.org/10.1787/073080082748
Figure 4.3. Australia: Producer SCT by commodity, 2004-06
1 2 http://dx.doi.org/10.1787/073105041455
0
2
4
6
8
10
12
14
1986 88 90 92 94 96 98 2000 02 04 06
% of gross farm receipts
Commodity outputsCurrent A/An/R/I, production requiredNon-current A/An/R/I, production not requiredMiscellaneousInput useNon-current A/An/R/I, production requiredNon-commodity criteria
MPS Payments based on output
Other SCTSCT as % of PSE
Milk
Rice
Sugar
Other commodities
SCT as % of PSE
0 1 2 3% of commodity gross farm receipts
AGRICULTURAL POLICIES IN OECD COUNTRIES: MONITORING AND EVALUATION 2007 – ISBN 978-92-64-02746-6 – © OECD 2007 83
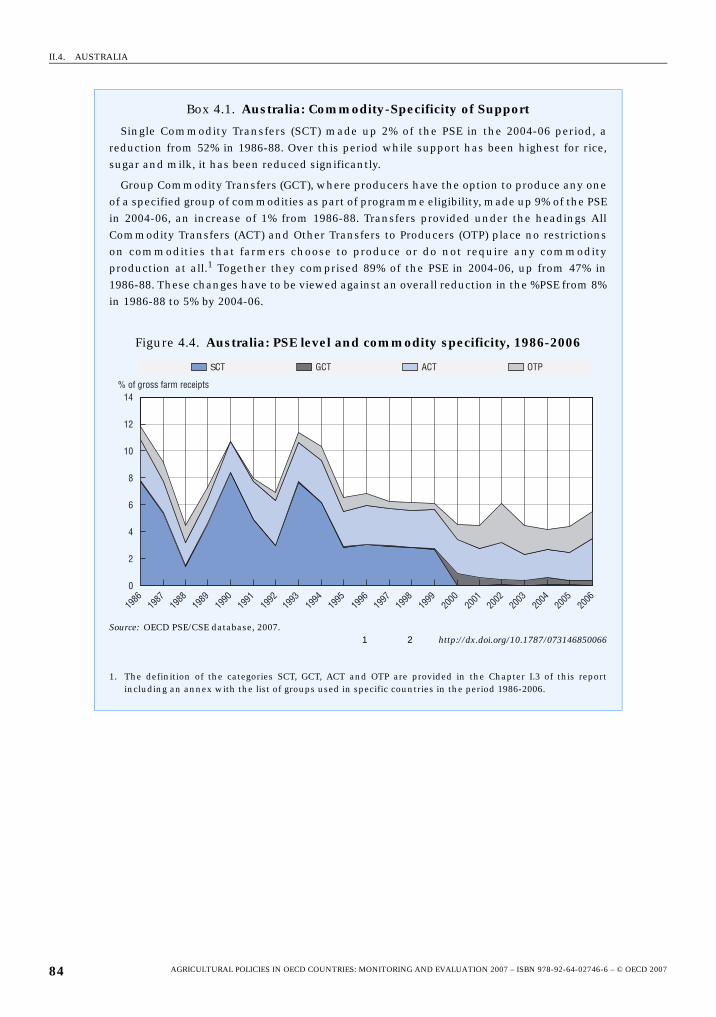
II.4. AUSTRALIA
Box 4.1. Australia: Commodity-Specificity of Support
Single Commodity Transfers (SCT) made up 2% of the PSE in the 2004-06 period, areduction from 52% in 1986-88. Over this period while support has been highest for rice,sugar and milk, it has been reduced significantly.
Group Commodity Transfers (GCT), where producers have the option to produce any oneof a specified group of commodities as part of programme eligibility, made up 9% of the PSEin 2004-06, an increase of 1% from 1986-88. Transfers provided under the headings AllCommodity Transfers (ACT) and Other Transfers to Producers (OTP) place no restrictionson commodities that farmers choose to produce or do not require any commodityproduction at all.1 Together they comprised 89% of the PSE in 2004-06, up from 47% in1986-88. These changes have to be viewed against an overall reduction in the %PSE from 8%in 1986-88 to 5% by 2004-06.
Figure 4.4. Australia: PSE level and commodity specificity, 1986-2006
Source: OECD PSE/CSE database, 2007.1 2 http://dx.doi.org/10.1787/073146850066
1. The definition of the categories SCT, GCT, ACT and OTP are provided in the Chapter I.3 of this reportincluding an annex with the list of groups used in specific countries in the period 1986-2006.
SCT GCT ACT OTP
14
1986
1987
1988
1989
1990
1991
1992
1993
1994
1995
1996
1997
1998
1999
2000
2001
2002
2003
2004
2005
2006
12
10
8
6
4
2
0
% of gross farm receipts
AGRICULTURAL POLICIES IN OECD COUNTRIES: MONITORING AND EVALUATION 2007 – ISBN 978-92-64-02746-6 – © OECD 200784
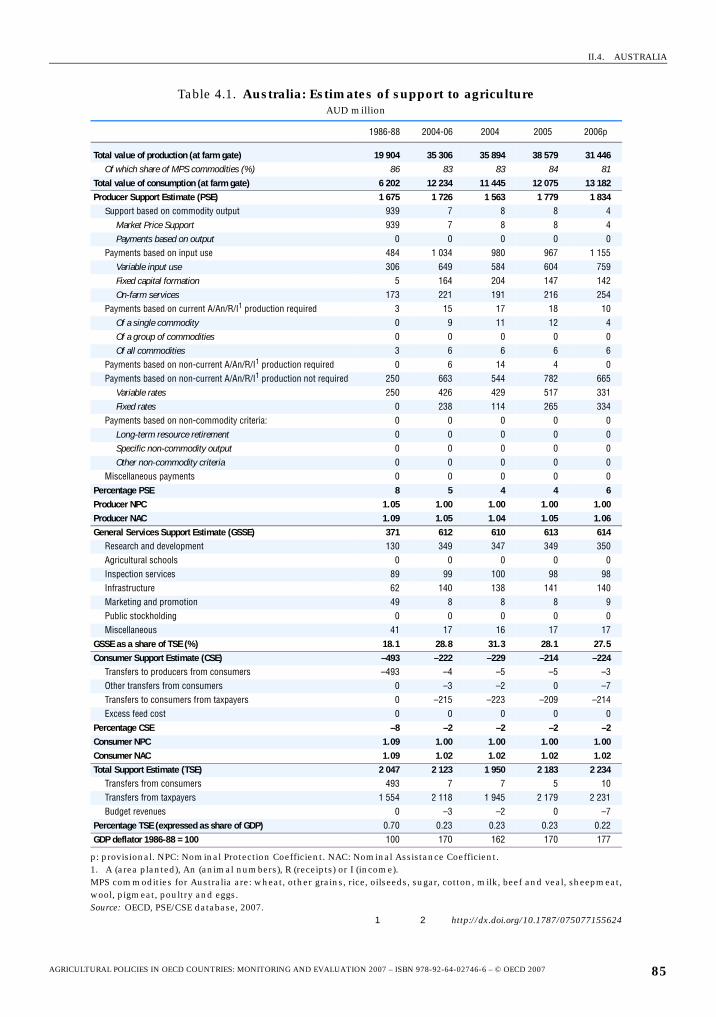
II.4. AUSTRALIA
Table 4.1. Australia: Estimates of support to agricultureAUD million
1986-88 2004-06 2004 2005 2006p
Total value of production (at farm gate) 19 904 35 306 35 894 38 579 31 446Of which share of MPS commodities (%) 86 83 83 84 81
Total value of consumption (at farm gate) 6 202 12 234 11 445 12 075 13 182Producer Support Estimate (PSE) 1 675 1 726 1 563 1 779 1 834
Support based on commodity output 939 7 8 8 4Market Price Support 939 7 8 8 4Payments based on output 0 0 0 0 0
Payments based on input use 484 1 034 980 967 1 155Variable input use 306 649 584 604 759Fixed capital formation 5 164 204 147 142On-farm services 173 221 191 216 254
Payments based on current A/An/R/I1 production required 3 15 17 18 10Of a single commodity 0 9 11 12 4Of a group of commodities 0 0 0 0 0Of all commodities 3 6 6 6 6
Payments based on non-current A/An/R/I1 production required 0 6 14 4 0Payments based on non-current A/An/R/I1 production not required 250 663 544 782 665
Variable rates 250 426 429 517 331Fixed rates 0 238 114 265 334
Payments based on non-commodity criteria: 0 0 0 0 0Long-term resource retirement 0 0 0 0 0Specific non-commodity output 0 0 0 0 0Other non-commodity criteria 0 0 0 0 0
Miscellaneous payments 0 0 0 0 0Percentage PSE 8 5 4 4 6Producer NPC 1.05 1.00 1.00 1.00 1.00Producer NAC 1.09 1.05 1.04 1.05 1.06General Services Support Estimate (GSSE) 371 612 610 613 614
Research and development 130 349 347 349 350Agricultural schools 0 0 0 0 0Inspection services 89 99 100 98 98Infrastructure 62 140 138 141 140Marketing and promotion 49 8 8 8 9Public stockholding 0 0 0 0 0Miscellaneous 41 17 16 17 17
GSSE as a share of TSE (%) 18.1 28.8 31.3 28.1 27.5Consumer Support Estimate (CSE) –493 –222 –229 –214 –224
Transfers to producers from consumers –493 –4 –5 –5 –3Other transfers from consumers 0 –3 –2 0 –7Transfers to consumers from taxpayers 0 –215 –223 –209 –214Excess feed cost 0 0 0 0 0
Percentage CSE –8 –2 –2 –2 –2Consumer NPC 1.09 1.00 1.00 1.00 1.00Consumer NAC 1.09 1.02 1.02 1.02 1.02Total Support Estimate (TSE) 2 047 2 123 1 950 2 183 2 234
Transfers from consumers 493 7 7 5 10Transfers from taxpayers 1 554 2 118 1 945 2 179 2 231Budget revenues 0 –3 –2 0 –7
Percentage TSE (expressed as share of GDP) 0.70 0.23 0.23 0.23 0.22GDP deflator 1986-88 = 100 100 170 162 170 177
p: provisional. NPC: Nominal Protection Coefficient. NAC: Nominal Assistance Coefficient.1. A (area planted), An (animal numbers), R (receipts) or I (income).MPS commodities for Australia are: wheat, other grains, rice, oilseeds, sugar, cotton, milk, beef and veal, sheepmeat,wool, pigmeat, poultry and eggs.Source: OECD, PSE/CSE database, 2007.
1 2 http://dx.doi.org/10.1787/075077155624
AGRICULTURAL POLICIES IN OECD COUNTRIES: MONITORING AND EVALUATION 2007 – ISBN 978-92-64-02746-6 – © OECD 2007 85
II.4. AUSTRALIA
Description of policy developments
Main policy instrumentsAgricultural support is mainly provided by budget-financed programmes as well as
through some regulatory arrangements and tax concessions. Budgetary financed
programmes, such as Agriculture-Advancing Australia, Natural Heritage Trust and the National
Water Initiative, are largely used for structural adjustment and for natural resource and
environmental management. There are some statutory and regulatory arrangements
(mainly at state level) that allow for export control of a few commodities, including wheat,
barley, rice, lupins and canola in certain states. Commonwealth (national) tax
arrangements are risk-management tools which allow primary producers to manage the
tax implications of fluctuating incomes. Consumers of diesel fuel, including farmers and
other primary producers, receive grants and rebates on excise taxes on fuel used for off-
road vehicles and machinery.
Landholders can claim accelerated depreciation for investments relating to land and
water conservation, aimed at improving natural resource management. Expenditure on
research and development is financed largely by funds collected through industry levies,
supplemented by funding from the Commonwealth budget. In exceptional circumstances
(e.g. droughts and floods) Commonwealth and state governments can provide a range of
assistance measures. Tariffs protect producers of certain types of cheese, unprocessed
tobacco, and processed fruit and vegetables.
Domestic policyIn March 2005, an independent Agriculture and Food Policy Reference Group was
commissioned by the government to review agriculture and food policies and the changes
needed to improve performance over the next 10-20 years. The Group’s report Creating our
Future: Agriculture and Food Policy for the Next Generation (www.agfoodgroup.gov.au/
next_generation.html) February, 2006, identified a number of key elements to improve
performance including: placing greater emphasis on innovation in production and
marketing, underpinned by research and development; focusing policies to achieve greater
self-reliance of business operators; reducing the regulatory burden on business; and
developing a partnership approach between businesses and Commonwealth and state
governments. The government has accepted many of the report’s 55 recommendations and
will outline the next steps in a government policy statement to be issued during 2007.
Since 2002, the national economy, and especially the agriculture sector, has been
affected by one of the most extensive and devastating droughts on record. The drought
caused a 70% fall in the net value of farm production between 2001-02 and 2002-03 and a
reduction in the rate of economic growth of 1%. Although there was some recovery in
seasonal conditions the following year, drought conditions again worsened, particularly in
the south-eastern part of the mainland, where more than 92% of producers in New South
Wales, Victoria and South Australia reported below average or drought conditions. The
Australian Bureau of Agricultural and Resource Economics (ABARE) has forecast that the
gross value of crop and livestock production will fall by 35%, or AUD 6.2 billion
(USD 4.7 billion), between 2005-06 and 2006-07 and estimated the drought will reduce the
national economic growth rate in 2006-07 by around 0.7% from what would have otherwise
been achieved.
AGRICULTURAL POLICIES IN OECD COUNTRIES: MONITORING AND EVALUATION 2007 – ISBN 978-92-64-02746-6 – © OECD 200786
II.4. AUSTRALIA
With the drought, relief under the Exceptional Circumstances Relief Payment Scheme(ECRP) totalled around AUD 1.25 billion (USD 0.93 billion) between 2002 and January 2007.
Nearly a half – AUD 560 million (USD 420 million) – of the drought relief under the ECRP
was provided to farmers for the 2006-07 drought as income support in the form of social
security payments, small business assistance, business interest subsidies, personal
counselling and other support programmes. The government is currently working towards
reforming drought policy through negotiations with state governments.
The implementation of the 2004 National Water Initiative (water policy reform
programme) continued over 2005 and 2006, including improvements to water resource
accounting, and measuring and metering of water, which will facilitate the development of
water trading markets. Under the Water Smart Australia programme, AUD 336 million
(USD 257 million) has been committed from 2005 to 2009 for projects to support
installation of water pipelines to agricultural areas, wastewater recycling and improved
water management. The total value of these projects, including contributions from state
governments and others, will be AUD 915 million (USD 700 million).
Both the severe drought and water policy reforms has focussed national attention on
water. This includes a proposal for a National Plan for Water Security (Box 4.2).
In November 2006, the Report of the Inquiry into certain Australian companies in relationto the UN Oil-For-Food Programme, the Cole Report, was released (www.offi.gov.au). The
inquiry was established by the government in November 2005 to examine possible legal
breaches by several Australian companies, including AWB International Ltd. (AWBI). The
Cole Report set out a range of findings and as recommended, in December 2006, the
government announced the establishment of a task force of relevant government agencies
to consider possible prosecutions in consultation with the Commonwealth Director of
Public Prosecutions.
In December 2006, the government implemented temporary changes to the bulk wheatexport marketing arrangements, effective until 30 June 2007, although this does not remove
the export single-desk arrangements (i.e. export monopoly). These changes are intended to
provide greater flexibility during the drought affected 2006-07 harvest, and provide time for
the government to review its long-term wheat export marketing arrangements. The
legislation transfers AWBI’s right to veto bulk wheat export applications by other traders to
the Minister for Agriculture, Fisheries and Forestry. These changes do not amend the
functions or objectives of the Wheat Export Authority (WEA) and AWBI remains exempt
from the WEA’s export controls. The temporary changes mean that the WEA will need to
seek the agreement of the minister before approving or rejecting an application for bulk
exports, taking into account the public interest.
Reform of the sugar industry under the Sugar Industry Reform Program (SIRP), which
provides funding of AUD 444 million (USD 326 million) over 5 years (2004 to 2009)
continued over 2005-06 (see Agricultural Policies in OECD Countries: Monitoring and Evaluation,
2005). The levy on domestic sugar sales, including imported sugar, introduced in January
2003 to partly fund the SIRP, was abolished in November 2006 to offset rising input costs for
sugar refiners. Between 2003 and 2006 the AUD 3 cents (USD 2 cents) per kilogram levy
raised about AUD 80 million (USD 58 million).
Support of between AUD 40-45 million (USD 30-34 million) will be provided in 2007
under the Tobacco Grower Adjustment Assistance Package. The purpose of the support is to
provide adjustment assistance for former tobacco growers to re-establish themselves in
AGRICULTURAL POLICIES IN OECD COUNTRIES: MONITORING AND EVALUATION 2007 – ISBN 978-92-64-02746-6 – © OECD 2007 87
II.4. AUSTRALIA
alternate economic activities, either by moving to other activities on their existing farm or
re-establishing themselves off-farm.
Various environmental programmes relevant to agriculture were continued over 2005
and 2006, including the Natural Heritage Trust, National Action Plan for Salinity and Water
Quality, the National Landcare Programme (see Agricultural Policies in OECD Countries:
Monitoring and Evaluation, 2003 and 2005). The Murray-Darling Basin Ministerial Council
approved the Asset Environmental Management Plans for six ecological assets identified
through the Living Murray Initiative, and AUD 37 million (USD 29 million) was provided in
January 2006 to recover an average 145 gigalitres of water annually to achieve the
environmental objectives identified under the Plans.
The Australian National Audit Office reviewed in 2006 the regulation of pesticides andveterinary medicines by the Australian Pesticides and Veterinary Medicines Authority
(APVMA) (www.anao.gov.au/). The Audit Office made recommendations to improve the
Box 4.2. Australia: Proposed National Plan for Water Security
In response to the ongoing and most extensive and devastating drought on record thePrime Minister announced in January 2007 a proposal for a AUD 10 billion (USD 7.5 billion)National Plan for Water Security. The Plan seeks on a national scale to secure long-termwater supplies, improve water efficiency and address the over-allocation of water in ruralareas. The 10-point plan more specifically aims to:
1. provide investment in irrigation infrastructure to line and pipe major deliverychannels;
2. improve on-farm irrigation technology and metering;
3. share water savings on a 50/50 basis between irrigators and the Commonwealth toenhance water security and environmental flows;
4. address over-allocation of water entitlements in the Murray-Darling Basin (MDB);
5. establish a new set of governance arrangements for the MDB;
6. place a sustainable cap on surface and groundwater use in the MDB;
7. undertake major engineering work at key MDB sites;
8. expand the role of the Australian Bureau of Meteorology to provide the necessary waterdata to improve decision making by governments and industry;
9. create a taskforce to explore future land and water development in Northern Australia;and,
10. complete the restoration of the Great Artesian Basin.
The Plan’s implementation is conditional on the acceptance of the proposal to move thepowers to manage the MDB from state governments to the Commonwealth, which isviewed by the Commonwealth as essential to speed up the process of the current waterpolicy reforms. The Plan’s funding over a 10-year period includes: some AUD 6 billion(USD 4.5 billion) for improvement to irrigation infrastructure and river delivery systems;around AUD 3 billion (USD 2.3 billion) to assist irrigators and their communities adjust toreductions in water allocation entitlements; AUD 0.6 billion for Murray-Darling BasinCommission reform; almost AUD 0.5 billion (USD 0.4 billion) for the Bureau of Meteorologyto improve information of water; and the remainder for other parts of the Plan.
AGRICULTURAL POLICIES IN OECD COUNTRIES: MONITORING AND EVALUATION 2007 – ISBN 978-92-64-02746-6 – © OECD 200788
II.4. AUSTRALIA
APVMA’s monitoring, reporting and registration processes all of which were accepted by
the APVMA to help strengthen the current system.
The Defeating the Weed Menace (DWM) programme was launched in 2005 and directs
over AUD 44 million (USD 34 million) during 4 years to support coordinated and strategic
action against the menace of weeds nationally. The DWM programme supports regionally
based on-ground weed management actions and nationally strategic activities including:
national coordination activities, national level research and education and awareness.
In August 2006, the Commonwealth and state governments released the NationalAgriculture and Climate Change Action Plan 2006-09. The Action Plan identifies four key
areas to manage multiple climate change risks to agriculture:
1. Adaptation – to build resilience into agricultural systems.
2. Mitigation – to reduce greenhouse gas emissions from agriculture.
3. Research and development investment – to enhance capacity in R&D and innovation to
address the challenges of climate change in agriculture.
4. Awareness and communication – to improve the understanding of climate change issues
by agricultural industries and rural communities to enable informed decision making.
Following the release of the Biofuels Action Plan (www.pmc.gov.au/biofuels/) in December
2005, the government reaffirmed that it will develop a domestic biofuels sector capable of
contributing at least 350 megalitres to the national fuel supply chain by 2010. Current
initiatives to encourage biofuels include: reduced taxes compared to fossil fuels; providing
ethanol production grants; and AUD 38 million (USD 29 million) under the Biofuels Capital
Grants Programme to fund one-off capital grants for projects that provide new or expanded
biofuels production capacity.
The government agreed in October 2005 to a nationally consistent definition of
threshold levels for the unintended presence of genetically modified (GM) material in canola
grain and seed. The threshold level for canola grain is 0.9% for the 2006 and 2007 seasons,
and for canola seed 0.5%.
In 2006, additional funding for the Rural Financial Counselling Service (RFCS)
Programme was provided of almost AUD 10 million (USD 7.5 million) over two years. The
extra funding aims to help primary producers, fishermen and small rural businesses
identify ways to become self-reliant and better equipped to manage change and
adjustment.
The Industry Partnership Programme commenced in July 2005 over 3 years as part of
the Agriculture-Advancing Australia package with funding of AUD 15 million (USD 11 million).
The Programme aims to assist partner industries at the national level to build their structural,
human and strategic capacity, and to develop strategies to respond to existing and
potential opportunities and threats.
Further effort was made to improve food industry competitiveness. Under the five year,
National Food Industry Strategy (started July 2002), an additional AUD 12 million
(USD 9 million) was provided in 2005 for the Food Innovation Grants, designed to assist the
food industry to improve its competitiveness through improvements in: innovation; the
business environment; sustainability; and international market development. The New
Industries Development Program, with funding of over AUD 34 million (USD 25 million) to
2010, helps farmers and the agro-food industry turn innovative business ideas into
profitable ventures through merit-based grants, scholarships and learning tools.
AGRICULTURAL POLICIES IN OECD COUNTRIES: MONITORING AND EVALUATION 2007 – ISBN 978-92-64-02746-6 – © OECD 2007 89
II.4. AUSTRALIA
In January 2007, the government launched an independent review to examine ways to
streamline food regulations to make them more nationally consistent, following the
findings of the Taskforce on Reducing Regulatory Burdens on Business. The review will examine
outstanding issues on the consistent application of food laws; levels of enforcement across
jurisdictions; and the role of the Australian government in the food regulatory system.
The Commonwealth and state governments agreed in 2003 to a risk-based nationalsystem for livestock identification and tracing (NLIS) (see Agricultural Policies in OECD
Countries: Monitoring and Evaluation, 2005). The Commonwealth government provided a
further AUD 20 million (USD 15 million) from 2004/05 to 2007/08 to assist with the national
implementation of the NLIS. Of this total, AUD 15 million (USD 11.3 million) has been
allocated to the cattle industry with the remainder assigned to other livestock industries
(e.g. sheep, goats and pigs). In January 2006, AUD 1.2 million (USD 0.9 million) has been
provided over three years to help the pork industry to develop and implement the NLIS.
The NLIS became a mandatory requirement for all cattle produced in June 2005, and for all
sheep and goats born after 1 January 2006. The Commonwealth government is also
providing additional resources to strengthen defences against bird flu, with an additional
AUD 44 million (USD 33 million) over three years, starting from 2006-07.
Trade policyA country of origin labelling standard requires packaged food and unpackaged fresh
and processed fruit, vegetables, nuts, seafood and pork, to be distinctly labelled with the
country of origin. The standard took effect from June 2006 for unpackaged fruit, vegetables
and seafood, from December 2006 for unpackaged pork, and will take effect in December
2007 for packaged food.
Following efforts to improve animal welfare for live animal exports the Australian Animal
Welfare Strategy was implemented in 2006 for Australia to share its experience with trading
partners and international fora, particularly the World Organisation for Animal Health
(OIE) in the development of international animal welfare guidelines. The government has
continued to implement a range of measures aimed at improving animal welfare aspects
of live export trade, and this includes a requirement to comply with the Australian Standards
for the Export of Livestock (the Standards). Further revisions of the Standards were
undertaken in 2006, including improving animal welfare conditions in the live export trade
to the Middle East with funding of AUD 11 million (USD 8 million), of which AUD 4 million
(USD 3 million) is investment to help improve animal welfare practices in importing
countries and to upgrade their handling procedures.
Changes to the import risk analysis (IRA) process, under Biosecurity Australia (BA), will
take effect in 2007 and include: improved consultation with stakeholders; timeframes for
the completion of IRAs; scope for scientific scrutiny; and improved processes for receiving
and prioritising import requests. The government also provided nearly AUD 8 million
(USD 6 million) over five years from 2006 to establish the Australian Centre of Excellence for
Risk Analysis (ACERA) to build on the capacity to use the best analytical tools available for
risk analysis, not just in quarantine but more generally, drawing on expertise in Australia
and from overseas. ACERA is working on a range of projects looking at the methods and
practice of risk analysis, such as biosecurity framework development and qualitative
modelling.
AGRICULTURAL POLICIES IN OECD COUNTRIES: MONITORING AND EVALUATION 2007 – ISBN 978-92-64-02746-6 – © OECD 200790
II.4. AUSTRALIA
Building on bilateral and regional free trade agreements (FTAs) with many key trading
partners, agreements on market access and negotiations for additional FTAs and
Memorandums of Understanding (MoU) were started between Australia and the following
countries or regional groupings:
● China: negotiations were launched in April 2005, following the consideration of a joint
FTA feasibility study. The seventh round of discussions for an FTA were held in
December 2006, which marked the beginning of market access negotiations as Australia
and China tabled their requests and offers on market access for goods (including agriculture)
and lists of barriers affecting market access requests on a range of services. In addition, a
four-year AUD 5.5 million (USD 4 million) Australia China Agricultural Technical Co-operation
programme was announced in 2006, to strengthen bilateral relationships in agriculture. This
includes the sharing of expertise in areas such as agricultural development, management of
supply chains, quarantine, rural adjustment and the environment.
● Japan: on 12 December 2006, Australia and Japan agreed to commence formal
negotiations on an FTA in 2007, following a joint government study which concluded
that a comprehensive and WTO consistent FTA would bring significant benefits to both
countries.
● Korea: access to the Korean rice market was agreed in 2004 with an annual quota of
9 030 tonnes for the next decade, with the first imports under the quota received in 2006.
A joint private sector FTA feasibility study was announced in December 2006 and is
expected to be concluded toward the end of 2007.
● Malaysia: negotiations on an FTA were announced in April 2005, and a MoU was signed
in March 2006 on broad based agricultural co-operation between the two countries.
● Australia, New Zealand and ASEAN: negotiations for an FTA between Australia, New
Zealand and ASEAN, started in November 2004 and are due for completion during 2007.
● Turkey: a MoU was signed in December 2005 which proposes exchange of scientific and
technical information, research reports and experts, agricultural trade and investment
related activities, and other joint activities. In June 2006, a Breeder Cattle Protocol was
agreed to facilitate the export of cattle from Australia to Turkey.
● Chile: following an approach by Chile in late 2006, Australia has agreed to explore the
feasibility of commencing negotiations for an FTA with Chile in the first half of 2007.
● Mexico: in December 2006, the terms of reference were agreed for the Joint Experts Group
(JEG) between Australia and Mexico. The first meeting of the JEG will occur in 2007, with
the group’s main consideration being to strengthen the bilateral relationship including
the consideration of the possible benefits and implications of progressing with an FTA.
● Gulf Co-operation Council (GCC): following a decision by the United Arab Emirates (UAE)
that the Australian FTA negotiations with them be incorporated into a wider GCC FTA,
investigations started in 2006 on an FTA with GCC nations (Bahrain, Kuwait, Oman,
Qatar, Saudi Arabia and the UAE), and negotiations are expected to commence in 2007.
In 2006, Australia assisted the GCC in developing a regional strategy, GCC Regional
Strategic Plan on Animal Handling and Transport Arrangements. The strategy focuses on
ensuring the health and welfare of all animals in the GCC countries is promoted and
protected by the development and adoption of sound welfare standards and handling
practices. Australia is facilitating the development of an implementation plan to help
the GCC countries apply these measures.
AGRICULTURAL POLICIES IN OECD COUNTRIES: MONITORING AND EVALUATION 2007 – ISBN 978-92-64-02746-6 – © OECD 2007 91
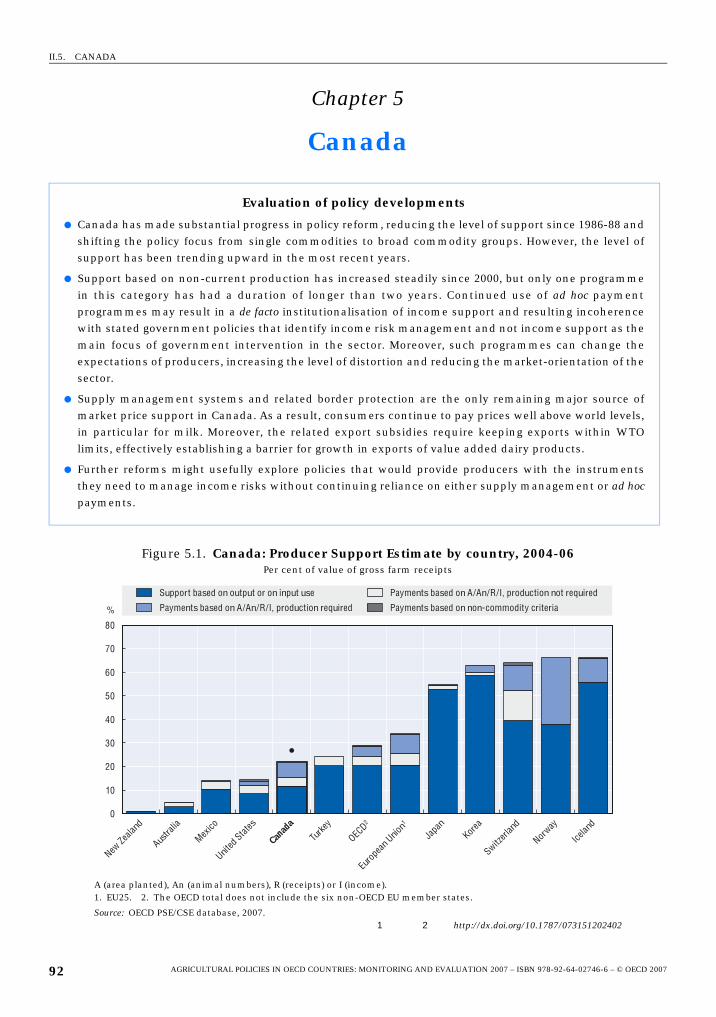
II.5. CANADA
df
eteeee
fs,O
tsc
Chapter 5
Canada
Evaluation of policy developments
● Canada has made substantial progress in policy reform, reducing the level of support since 1986-88 anshifting the policy focus from single commodities to broad commodity groups. However, the level osupport has been trending upward in the most recent years.
● Support based on non-current production has increased steadily since 2000, but only one programmin this category has had a duration of longer than two years. Continued use of ad hoc paymenprogrammes may result in a de facto institutionalisation of income support and resulting incoherencwith stated government policies that identify income risk management and not income support as thmain focus of government intervention in the sector. Moreover, such programmes can change thexpectations of producers, increasing the level of distortion and reducing the market-orientation of thsector.
● Supply management systems and related border protection are the only remaining major source omarket price support in Canada. As a result, consumers continue to pay prices well above world levelin particular for milk. Moreover, the related export subsidies require keeping exports within WTlimits, effectively establishing a barrier for growth in exports of value added dairy products.
● Further reforms might usefully explore policies that would provide producers with the instrumenthey need to manage income risks without continuing reliance on either supply management or ad ho
payments.
Figure 5.1. Canada: Producer Support Estimate by country, 2004-06Per cent of value of gross farm receipts
A (area planted), An (animal numbers), R (receipts) or I (income).1. EU25. 2. The OECD total does not include the six non-OECD EU member states.
Source: OECD PSE/CSE database, 2007.1 2 http://dx.doi.org/10.1787/073151202402
0
10
20
30
40
50
60
70
80
New Ze
aland
Austra
lia
Mexico
United
States
Canad
a
Turke
y
OECD2
Euro
pean
Unio
n1
Japa
nKor
ea
Switzerl
and
Norway
Icelan
d
%
Support based on output or on input use
Payments based on A/An/R/I, production required
Payments based on A/An/R/I, production not required
Payments based on non-commodity criteria
AGRICULTURAL POLICIES IN OECD COUNTRIES: MONITORING AND EVALUATION 2007 – ISBN 978-92-64-02746-6 – © OECD 200792
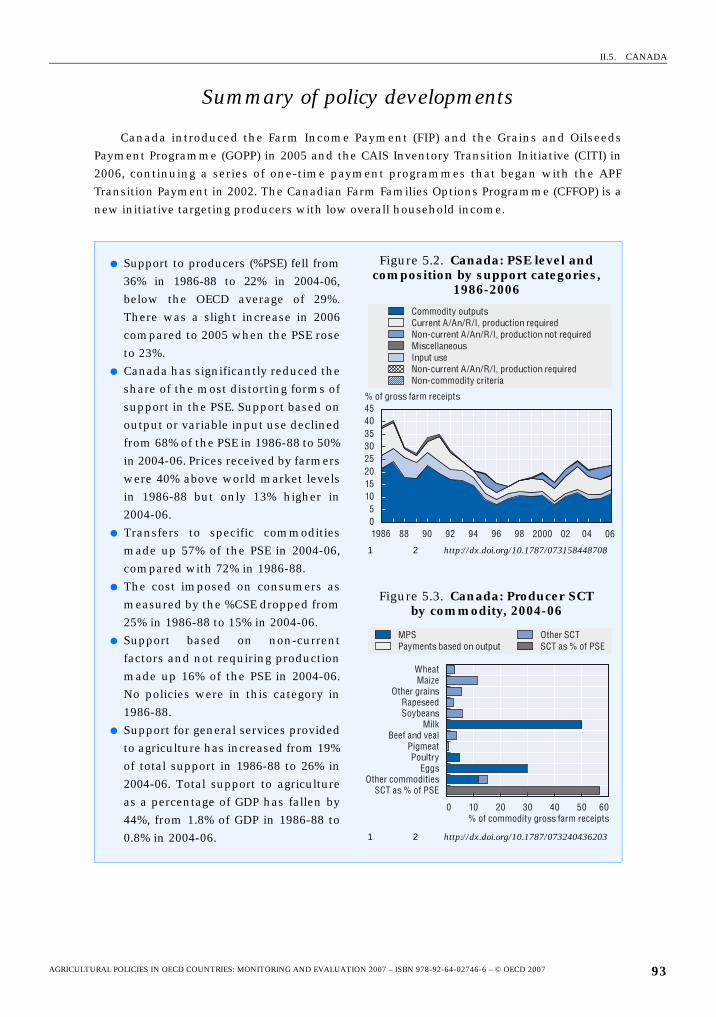
II.5. CANADA
Summary of policy developments
Canada introduced the Farm Income Payment (FIP) and the Grains and Oilseeds
Payment Programme (GOPP) in 2005 and the CAIS Inventory Transition Initiative (CITI) in
2006, continuing a series of one-time payment programmes that began with the APF
Transition Payment in 2002. The Canadian Farm Families Options Programme (CFFOP) is a
new initiative targeting producers with low overall household income.
● Support to producers (%PSE) fell from
36% in 1986-88 to 22% in 2004-06,
below the OECD average of 29%.
There was a slight increase in 2006
compared to 2005 when the PSE rose
to 23%.
● Canada has significantly reduced the
share of the most distorting forms of
support in the PSE. Support based on
output or variable input use declined
from 68% of the PSE in 1986-88 to 50%
in 2004-06. Prices received by farmers
were 40% above world market levels
in 1986-88 but only 13% higher in
2004-06.
● Transfers to specific commodities
made up 57% of the PSE in 2004-06,
compared with 72% in 1986-88.
● The cost imposed on consumers as
measured by the %CSE dropped from
25% in 1986-88 to 15% in 2004-06.
● Support based on non-current
factors and not requiring production
made up 16% of the PSE in 2004-06.
No policies were in this category in
1986-88.
● Support for general services provided
to agriculture has increased from 19%
of total support in 1986-88 to 26% in
2004-06. Total support to agriculture
as a percentage of GDP has fallen by
44%, from 1.8% of GDP in 1986-88 to
0.8% in 2004-06.
Figure 5.2. Canada: PSE level and composition by support categories,
1986-2006
1 2 http://dx.doi.org/10.1787/073158448708
Figure 5.3. Canada: Producer SCT by commodity, 2004-06
1 2 http://dx.doi.org/10.1787/073240436203
% of gross farm receipts
Commodity outputsCurrent A/An/R/I, production requiredNon-current A/An/R/I, production not requiredMiscellaneousInput useNon-current A/An/R/I, production requiredNon-commodity criteria
05
1015202530354045
1986 88 90 92 94 96 98 2000 02 04 06
MPS Payments based on output
Other SCTSCT as % of PSE
WheatMaize
Other grainsRapeseedSoybeans
MilkBeef and veal
PigmeatPoultry
EggsOther commodities
SCT as % of PSE
30 40 50 60% of commodity gross farm receipts
0 10 20
AGRICULTURAL POLICIES IN OECD COUNTRIES: MONITORING AND EVALUATION 2007 – ISBN 978-92-64-02746-6 – © OECD 2007 93
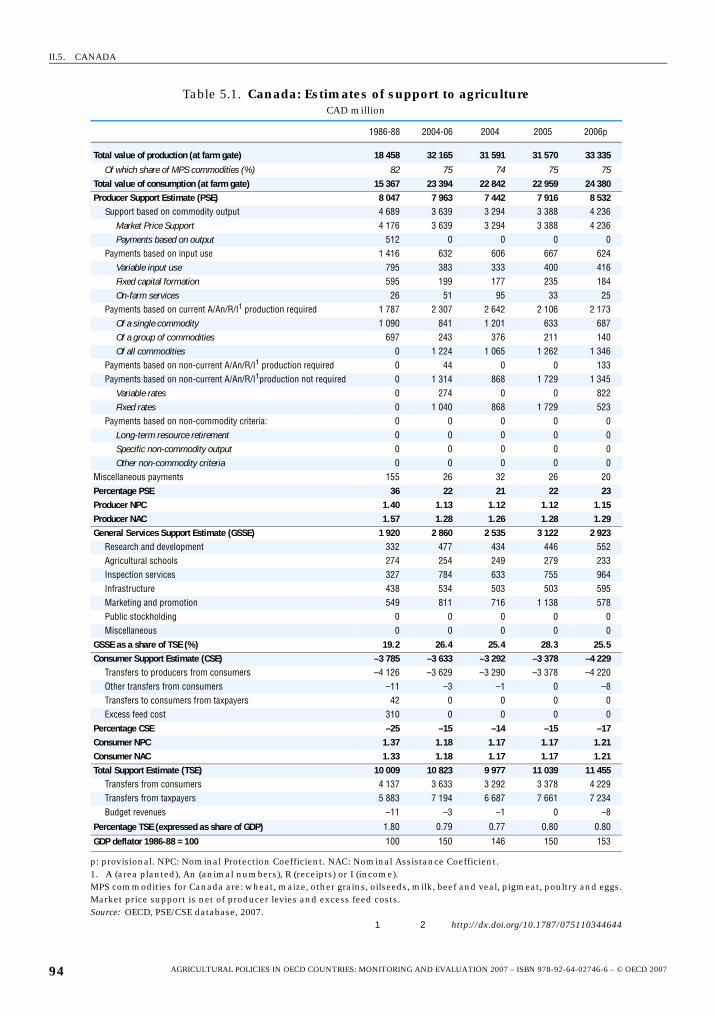
II.5. CANADA
Table 5.1. Canada: Estimates of support to agricultureCAD million
1986-88 2004-06 2004 2005 2006p
Total value of production (at farm gate) 18 458 32 165 31 591 31 570 33 335
Of which share of MPS commodities (%) 82 75 74 75 75Total value of consumption (at farm gate) 15 367 23 394 22 842 22 959 24 380Producer Support Estimate (PSE) 8 047 7 963 7 442 7 916 8 532
Support based on commodity output 4 689 3 639 3 294 3 388 4 236Market Price Support 4 176 3 639 3 294 3 388 4 236Payments based on output 512 0 0 0 0
Payments based on input use 1 416 632 606 667 624Variable input use 795 383 333 400 416Fixed capital formation 595 199 177 235 184On-farm services 26 51 95 33 25
Payments based on current A/An/R/I1 production required 1 787 2 307 2 642 2 106 2 173Of a single commodity 1 090 841 1 201 633 687Of a group of commodities 697 243 376 211 140Of all commodities 0 1 224 1 065 1 262 1 346
Payments based on non-current A/An/R/I1 production required 0 44 0 0 133Payments based on non-current A/An/R/I1production not required 0 1 314 868 1 729 1 345
Variable rates 0 274 0 0 822Fixed rates 0 1 040 868 1 729 523
Payments based on non-commodity criteria: 0 0 0 0 0Long-term resource retirement 0 0 0 0 0Specific non-commodity output 0 0 0 0 0Other non-commodity criteria 0 0 0 0 0
Miscellaneous payments 155 26 32 26 20Percentage PSE 36 22 21 22 23Producer NPC 1.40 1.13 1.12 1.12 1.15Producer NAC 1.57 1.28 1.26 1.28 1.29General Services Support Estimate (GSSE) 1 920 2 860 2 535 3 122 2 923
Research and development 332 477 434 446 552Agricultural schools 274 254 249 279 233Inspection services 327 784 633 755 964Infrastructure 438 534 503 503 595Marketing and promotion 549 811 716 1 138 578Public stockholding 0 0 0 0 0Miscellaneous 0 0 0 0 0
GSSE as a share of TSE (%) 19.2 26.4 25.4 28.3 25.5Consumer Support Estimate (CSE) –3 785 –3 633 –3 292 –3 378 –4 229
Transfers to producers from consumers –4 126 –3 629 –3 290 –3 378 –4 220Other transfers from consumers –11 –3 –1 0 –8Transfers to consumers from taxpayers 42 0 0 0 0Excess feed cost 310 0 0 0 0
Percentage CSE –25 –15 –14 –15 –17Consumer NPC 1.37 1.18 1.17 1.17 1.21Consumer NAC 1.33 1.18 1.17 1.17 1.21Total Support Estimate (TSE) 10 009 10 823 9 977 11 039 11 455
Transfers from consumers 4 137 3 633 3 292 3 378 4 229Transfers from taxpayers 5 883 7 194 6 687 7 661 7 234Budget revenues –11 –3 –1 0 –8
Percentage TSE (expressed as share of GDP) 1.80 0.79 0.77 0.80 0.80
GDP deflator 1986-88 = 100 100 150 146 150 153
p: provisional. NPC: Nominal Protection Coefficient. NAC: Nominal Assistance Coefficient.1. A (area planted), An (animal numbers), R (receipts) or I (income).MPS commodities for Canada are: wheat, maize, other grains, oilseeds, milk, beef and veal, pigmeat, poultry and eggs.Market price support is net of producer levies and excess feed costs.Source: OECD, PSE/CSE database, 2007.
1 2 http://dx.doi.org/10.1787/075110344644
AGRICULTURAL POLICIES IN OECD COUNTRIES: MONITORING AND EVALUATION 2007 – ISBN 978-92-64-02746-6 – © OECD 200794
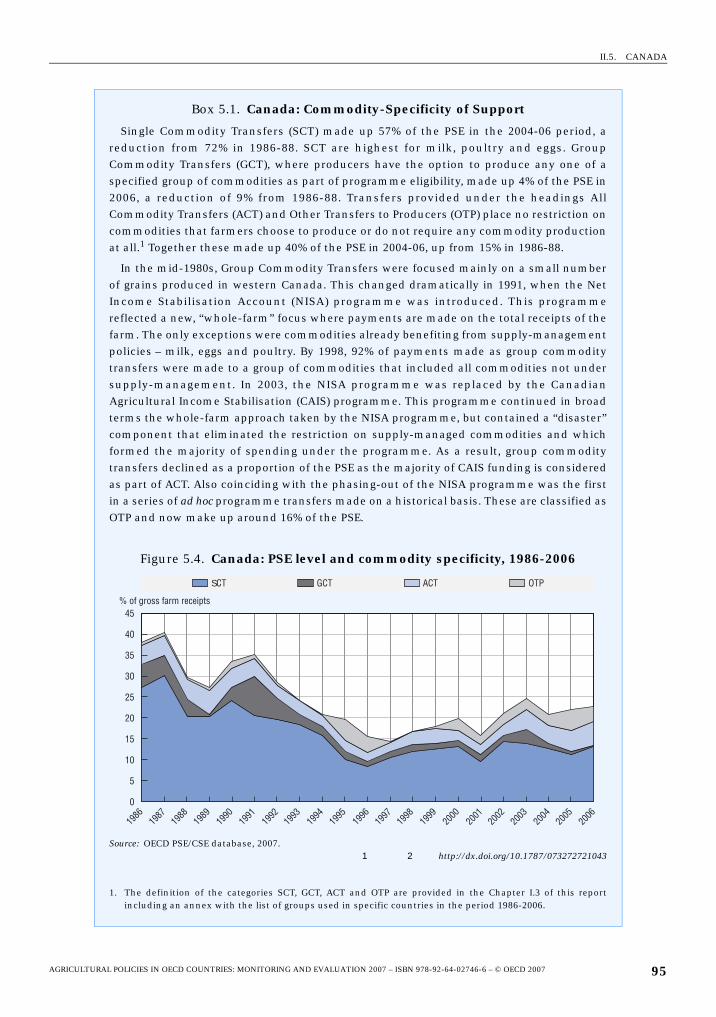
II.5. CANADA
Box 5.1. Canada: Commodity-Specificity of Support
Single Commodity Transfers (SCT) made up 57% of the PSE in the 2004-06 period, areduction from 72% in 1986-88. SCT are highest for milk, poultry and eggs. GroupCommodity Transfers (GCT), where producers have the option to produce any one of aspecified group of commodities as part of programme eligibility, made up 4% of the PSE in2006, a reduction of 9% from 1986-88. Transfers provided under the headings AllCommodity Transfers (ACT) and Other Transfers to Producers (OTP) place no restriction oncommodities that farmers choose to produce or do not require any commodity productionat all.1 Together these made up 40% of the PSE in 2004-06, up from 15% in 1986-88.
In the mid-1980s, Group Commodity Transfers were focused mainly on a small numberof grains produced in western Canada. This changed dramatically in 1991, when the NetIncome Stabilisation Account (NISA) programme was introduced. This programmereflected a new, “whole-farm” focus where payments are made on the total receipts of thefarm. The only exceptions were commodities already benefiting from supply-managementpolicies – milk, eggs and poultry. By 1998, 92% of payments made as group commoditytransfers were made to a group of commodities that included all commodities not undersupply-management. In 2003, the NISA programme was replaced by the CanadianAgricultural Income Stabilisation (CAIS) programme. This programme continued in broadterms the whole-farm approach taken by the NISA programme, but contained a “disaster”component that eliminated the restriction on supply-managed commodities and whichformed the majority of spending under the programme. As a result, group commoditytransfers declined as a proportion of the PSE as the majority of CAIS funding is consideredas part of ACT. Also coinciding with the phasing-out of the NISA programme was the firstin a series of ad hoc programme transfers made on a historical basis. These are classified asOTP and now make up around 16% of the PSE.
Figure 5.4. Canada: PSE level and commodity specificity, 1986-2006
Source: OECD PSE/CSE database, 2007.1 2 http://dx.doi.org/10.1787/073272721043
1. The definition of the categories SCT, GCT, ACT and OTP are provided in the Chapter I.3 of this reportincluding an annex with the list of groups used in specific countries in the period 1986-2006.
SCT GCT ACT OTP
45
1986
1987
1988
1989
1990
1991
1992
1993
1994
1995
1996
1997
1998
1999
2000
2001
2002
2003
2004
2005
2006
40
35
30
25
20
10
0
15
5
% of gross farm receipts
AGRICULTURAL POLICIES IN OECD COUNTRIES: MONITORING AND EVALUATION 2007 – ISBN 978-92-64-02746-6 – © OECD 2007 95
II.5. CANADA
Description of policy developments
Main policy instrumentsMajor Canadian agricultural policies are delivered through a policy framework agreed
with the provinces, who share in the cost of programme delivery. This Agricultural Policy
Framework (APF) is approaching the end of its implementation period and discussions
regarding its successor agreement are currently under way. While this framework
encompasses programmes targeting several different policy areas (business risk
management, food safety, environment, science and innovation, sector renewal), the
largest programme in terms of funding under the framework is the Canadian Agricultural
Income Stabilisation (CAIS) programme. This programme continues a long-standing policy
focus on income stabilisation rather than support, and is based on overall farm income in
comparison with a reference income based on the producers’ recent history. However,
special one-time payments have been made in recent years for exceptional circumstances.
Milk, poultry, and eggs receive support through the supply management system which
is a combination of price support through high out-of-quota tariff protection for these
commodities and production quotas designed to balance domestic supply and demand.
This system accounts for the great majority of market price support in Canada and has
been in place since the late 1960s for milk and the mid-1970s for poultry and eggs.
The Canadian Wheat Board (CWB) has statutory authority to market for export and
domestic use wheat and barley grown in designated areas of western Canada. In actual
practice, most feed quality wheat and barley are marketed outside the CWB. The CWB
pools sales revenue and returns proceeds to producers through a series of payments. The
CWB is also involved in the negotiation of rail car supply and allocation and manages the
flow of Board grains into the primary elevator system. During a plebiscite held in February
and March 2007, the majority (62%) of producers voted in favour of the marketing choice
option under which they would be able to market barley outside of the CWB. The
government of Canada has begun the process of amending the Canadian Wheat Board
Regulations with the intention of removing barley from the board’s single desk authority by
August 1, 2007, across the CWB’s designated area.
Domestic policyThe CAIS programme insures against drops in farm income through insuring a
“reference margin” based on a recent historical average. In its original design, in years
where the margin falls below the reference margin, producers are allowed to make a
withdrawal from a programme account they maintain and receive a matching payment
according to the extent of the shortfall relative to the reference margin. The programme
has been modified since its introduction in 2004 to include coverage of “negative margins”
to compensate for losses as well as reductions in income. The requirement for producers
to deposit one-third of the insured amount using their own funds was eliminated, and in
2006 was replaced by a participation fee of CAD 4.5 per CAD 1 000 of reference margin
protected. CAIS accounts were closed and the balances repaid to participants; participants
now directly receive a programme payment when their margin falls below the reference
level.
The Tobacco Adjustment Assistance Programme (TAAP) was implemented in 2005. This
programme was designed to aid in the transition of the Canadian tobacco growing industry
AGRICULTURAL POLICIES IN OECD COUNTRIES: MONITORING AND EVALUATION 2007 – ISBN 978-92-64-02746-6 – © OECD 200796
II.5. CANADA
by permanently retiring Base Production Quota (BPQ) through a reverse auction process.
The programme paid producers CAD 1.05 per pound of BPQ under the federal programme,
plus an additional payment of CAD 0.6690 per pound of BPQ from the province of Ontario
programme fund distributed by the Tobacco Board. Tobacco is grown primarily in the
province of Ontario.
The Canadian Farm Families Options Programme (CFFOP), started in 2006, is a two-year
programme providing payments to participants in order to maintain a minimum
household income (from all sources) of CAD 25 000 for a family or CAD 15 000 for an
individual. To remain eligible for the payment in the second year of the programme,
producers must either carry out a farm business assessment, or participate in a learning
programme provided through the Canadian Agricultural Skills Service. The second-year
payment will be reduced by at least 25% from the first-year payment.
The Cover Crop Protection Programme (CCPP), also initiated in 2006, is a national
initiative that provides financial assistance to Canadian producers who were unable to
seed commercial crops in spring 2005 and/or spring 2006 as a result of flooding. The
programme provides a payment to affected producers to assist in improving and protecting
flood-damaged soil until a commercial crop can be planted. The CCPP targets land that
producers normally seed with commercial crops as part of their ongoing farming
operation. The programme provides a one time payment of CAD 15 per acre for eligible
claims of 10 acres or more. In total, CAD 50 million will be available in 2006/07 fiscal year
for the 2005 and 2006 crop years. Payments are made to owners of flooded land and the
programme does not require producers to take any specific actions regarding cover crops.
In 2006, the CAIS Inventory Transition Initiative (CITI) is a one-time programme
providing a payment based on a retroactive change in the formula to calculate value of
farm inventories under the CAIS programme. The payments are limited to an individual
payment of CAD 500 000 for each programme year. A participant’s total payment cannot
exceed the overall CAIS payment cap of CAD 3 million or 70% of a programme year margin
decline, from CITI and CAIS for each programme year. Payments totalling CAD 822 million
were made under this programme.
The Grains and Oilseeds Payment Programme (GOPP), put in place in 2005, is a one-time
payment based on historical farm sales. The programme provides payments to producers
of grains, oilseeds, or special crops based on average net sales from 2000 to 2004. An initial
payment of 7.47% of a producer’s five-year average of net sales of eligible grains and
oilseeds for the 2000-04 tax years was followed by a final payment is based on 1.28% of
average net sales of eligible grains and oilseeds. Payments in 2005 totalled CAD 752 million.
Similar ad hoc payments were made under the APF transition payment programme (2002
and 2003), the Transitional Industry Support Programme (2004) and the Farm Income
Payment (2005). At the provincial level, the Disaster Declaration Programme in Alberta and
the Nova Scotia Margin Enhancement programme made payments in 2006 based on
historical CAIS participation, and the Ontario Grains and Oilseeds Payment Programme
was an enhancement to the national programme.
The Enhanced Spring Credit Advance Programme (ESCAP) is an enhancement to the
existing Spring Credit Advance Programme (SCAP) which doubles the interest free loan
maximum to CAD 100 000 and extends the repayment period for loans by nine months to
September 30, 2007. The advance is calculated by multiplying the producer’s insured yield
under crop insurance by the advance rate provided under the guarantee agreement. The
AGRICULTURAL POLICIES IN OECD COUNTRIES: MONITORING AND EVALUATION 2007 – ISBN 978-92-64-02746-6 – © OECD 2007 97
II.5. CANADA
amount of the advance must be less than the total insured value of the crop under crop
insurance. SCAP began as an emergency initiative in 2000 but has been extended until 2006.
Starting in January 2007, SCAP and the Advance Payments Program have been merged into
a single programme. This new Advance Payments Program is available to crop and livestock
producers.
Trade policyCanada had deregulated the marketing of milk (and cream) for dairy product exports
in response to a ruling of the Appellate Body of the World Trade Organization (WTO) in
1999. Commercial export milk (CEM) mechanisms were developed by dairy industry
stakeholders, implemented through provincial deregulation, and accommodated by
federal deregulation. Following a ruling by the WTO Appellate Body in December 2002 that
the supply of CEM involves export subsidies, provinces amended their respective
regulations to eliminate CEM. Canada now limits the provision of export subsidies to dairy
products to the levels specified in its WTO schedule of commitments.
Canada has requested consultations with the United States at the World Trade
Organization (WTO) on subsidies provided to US corn growers, as well as on the total level
of US trade-distorting agricultural support and certain US export credit programmes.
Canada’s position is that existing US corn subsidy programmes cause prejudice to
Canadian corn growers through their effects on prices in the Canadian market. Canada
also asserts that the United States’ export credit guarantees serve to subsidize the
exportation of certain US agricultural products. Canada’s position is that these
programmes are inconsistent with the United States’ WTO obligations. Moreover, Canada
believes that total US trade-distorting domestic support, specifically, the Total Aggregate
Measurement of Support (Total AMS), exceeds the United States’ corresponding WTO
commitment levels for certain years.
Canada is currently negotiating free trade agreements (FTAs) with the Republic of
Korea, Singapore, the Central America 4 (CA4, comprising El Salvador, Guatemala,
Honduras and Nicaragua) and the European Free Trade Association (EFTA, comprising
Norway, Iceland and Switzerland-Liechtenstein). Canada also held exploratory discussions
with a view to negotiate FTAs with the Andean Community countries (Colombia, Peru,
Ecuador and Bolivia), the Dominican Republic and the Caribbean Community (CARICOM).
AGRICULTURAL POLICIES IN OECD COUNTRIES: MONITORING AND EVALUATION 2007 – ISBN 978-92-64-02746-6 – © OECD 200798
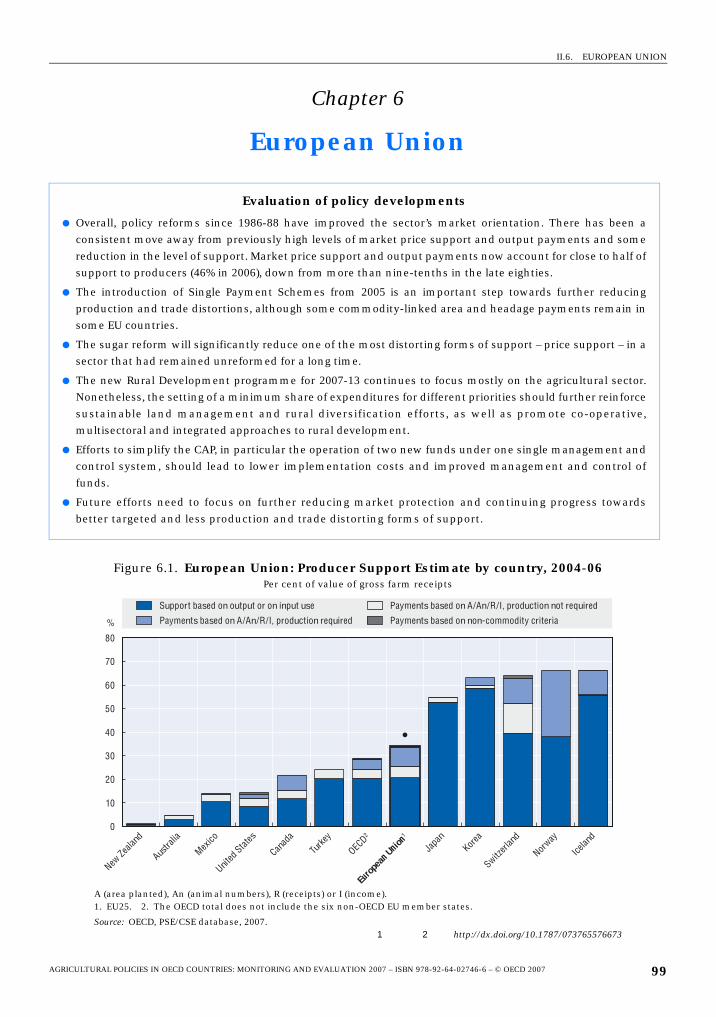
II.6. EUROPEAN UNION
ae
of
gin
a
r.cee,
dof
s
Chapter 6
European Union
Evaluation of policy developments
● Overall, policy reforms since 1986-88 have improved the sector’s market orientation. There has beenconsistent move away from previously high levels of market price support and output payments and somreduction in the level of support. Market price support and output payments now account for close to half support to producers (46% in 2006), down from more than nine-tenths in the late eighties.
● The introduction of Single Payment Schemes from 2005 is an important step towards further reducinproduction and trade distortions, although some commodity-linked area and headage payments remain some EU countries.
● The sugar reform will significantly reduce one of the most distorting forms of support – price support – insector that had remained unreformed for a long time.
● The new Rural Development programme for 2007-13 continues to focus mostly on the agricultural sectoNonetheless, the setting of a minimum share of expenditures for different priorities should further reinforsustainable land management and rural diversification efforts, as well as promote co-operativmultisectoral and integrated approaches to rural development.
● Efforts to simplify the CAP, in particular the operation of two new funds under one single management ancontrol system, should lead to lower implementation costs and improved management and control funds.
● Future efforts need to focus on further reducing market protection and continuing progress towardbetter targeted and less production and trade distorting forms of support.
Figure 6.1. European Union: Producer Support Estimate by country, 2004-06Per cent of value of gross farm receipts
A (area planted), An (animal numbers), R (receipts) or I (income).1. EU25. 2. The OECD total does not include the six non-OECD EU member states.
Source: OECD, PSE/CSE database, 2007.1 2 http://dx.doi.org/10.1787/073765576673
0
10
20
30
40
50
60
70
80
New Ze
aland
Austra
lia
Mexico
United
States
Canad
a
Turke
y
OECD2
Euro
pean
Unio
n1
Japa
nKor
ea
Switzerl
and
Norway
Icelan
d
%
Support based on output or on input use
Payments based on A/An/R/I, production required
Payments based on A/An/R/I, production not required
Payments based on non-commodity criteria
AGRICULTURAL POLICIES IN OECD COUNTRIES: MONITORING AND EVALUATION 2007 – ISBN 978-92-64-02746-6 – © OECD 2007 99
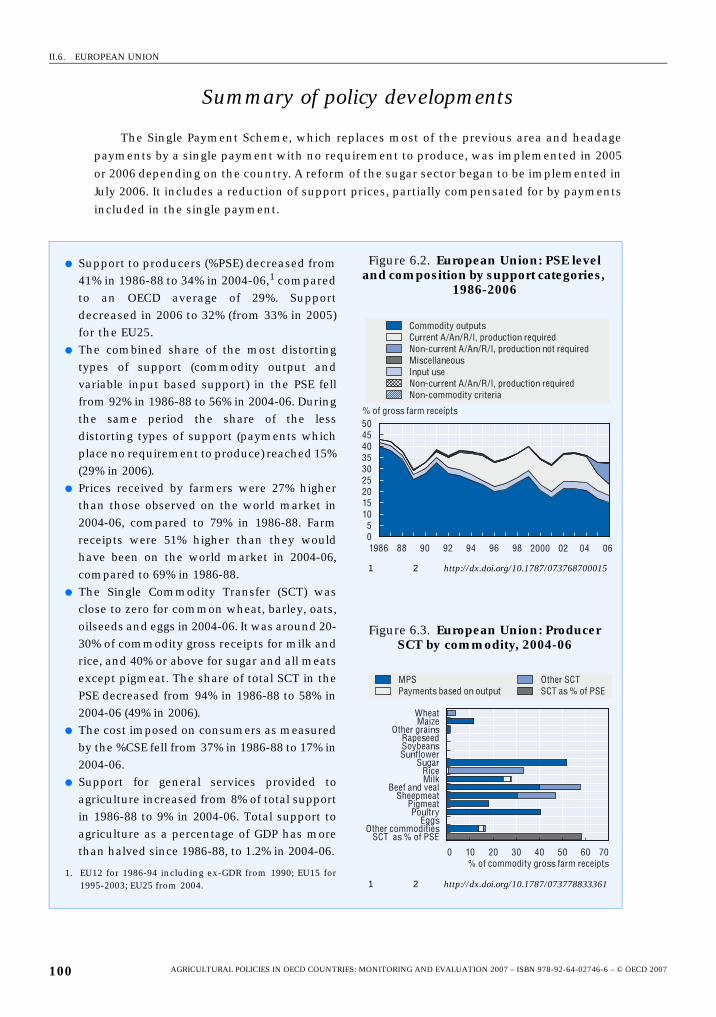
II.6. EUROPEAN UNION
Summary of policy developments
The Single Payment Scheme, which replaces most of the previous area and headage
payments by a single payment with no requirement to produce, was implemented in 2005
or 2006 depending on the country. A reform of the sugar sector began to be implemented in
July 2006. It includes a reduction of support prices, partially compensated for by payments
included in the single payment.
● Support to producers (%PSE) decreased from41% in 1986-88 to 34% in 2004-06,1 comparedto an OECD average of 29%. Supportdecreased in 2006 to 32% (from 33% in 2005)for the EU25.
● The combined share of the most distortingtypes of support (commodity output andvariable input based support) in the PSE fellfrom 92% in 1986-88 to 56% in 2004-06. Duringthe same period the share of the lessdistorting types of support (payments whichplace no requirement to produce) reached 15%(29% in 2006).
● Prices received by farmers were 27% higherthan those observed on the world market in2004-06, compared to 79% in 1986-88. Farmreceipts were 51% higher than they wouldhave been on the world market in 2004-06,compared to 69% in 1986-88.
● The Single Commodity Transfer (SCT) wasclose to zero for common wheat, barley, oats,oilseeds and eggs in 2004-06. It was around 20-30% of commodity gross receipts for milk andrice, and 40% or above for sugar and all meatsexcept pigmeat. The share of total SCT in thePSE decreased from 94% in 1986-88 to 58% in2004-06 (49% in 2006).
● The cost imposed on consumers as measuredby the %CSE fell from 37% in 1986-88 to 17% in2004-06.
● Support for general services provided toagriculture increased from 8% of total supportin 1986-88 to 9% in 2004-06. Total support toagriculture as a percentage of GDP has morethan halved since 1986-88, to 1.2% in 2004-06.
1. EU12 for 1986-94 including ex-GDR from 1990; EU15 for1995-2003; EU25 from 2004.
Figure 6.2. European Union: PSE level and composition by support categories,
1986-2006
1 2 http://dx.doi.org/10.1787/073768700015
Figure 6.3. European Union: Producer SCT by commodity, 2004-06
1 2 http://dx.doi.org/10.1787/073778833361
% of gross farm receipts
Commodity outputsCurrent A/An/R/I, production requiredNon-current A/An/R/I, production not requiredMiscellaneousInput useNon-current A/An/R/I, production requiredNon-commodity criteria
05
101520253035404550
1986 88 90 92 94 96 98 2000 02 04 06
MPS Payments based on output
Other SCTSCT as % of PSE
WheatMaize
Other grainsRapeseedSoybeansSunflower
SugarRiceMilk
Beef and vealSheepmeat
PigmeatPoultry
EggsOther commodities
SCT as % of PSE
0 10 20 30 40 50 60 70% of commodity gross farm receipts
AGRICULTURAL POLICIES IN OECD COUNTRIES: MONITORING AND EVALUATION 2007 – ISBN 978-92-64-02746-6 – © OECD 2007100
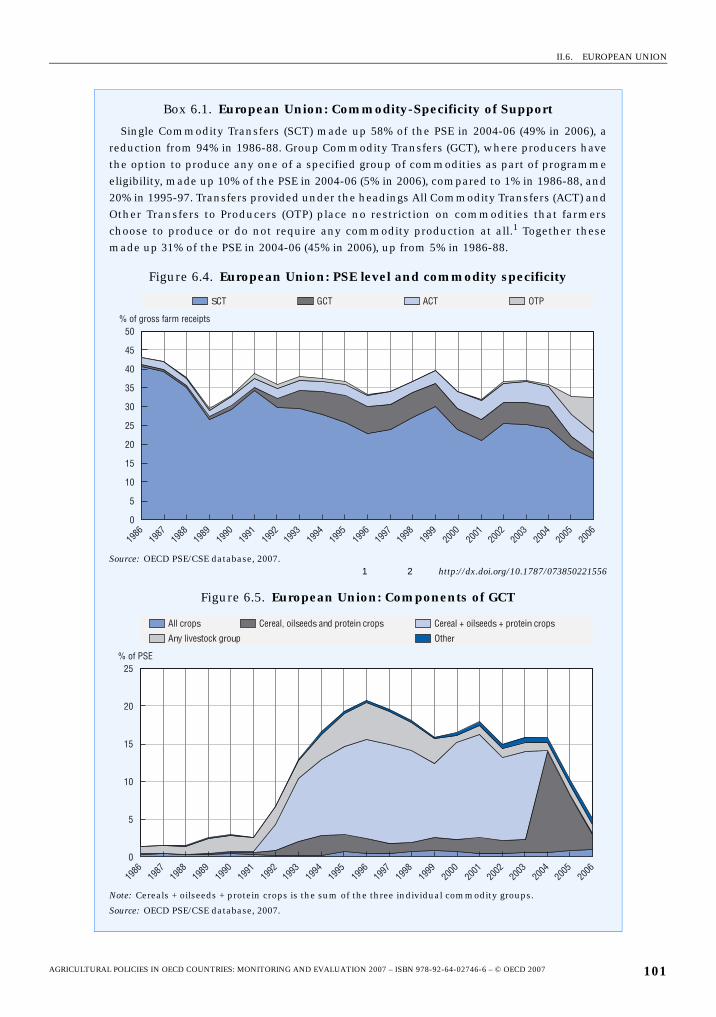
II.6. EUROPEAN UNION
Box 6.1. European Union: Commodity-Specificity of Support
Single Commodity Transfers (SCT) made up 58% of the PSE in 2004-06 (49% in 2006), areduction from 94% in 1986-88. Group Commodity Transfers (GCT), where producers havethe option to produce any one of a specified group of commodities as part of programmeeligibility, made up 10% of the PSE in 2004-06 (5% in 2006), compared to 1% in 1986-88, and20% in 1995-97. Transfers provided under the headings All Commodity Transfers (ACT) andOther Transfers to Producers (OTP) place no restriction on commodities that farmerschoose to produce or do not require any commodity production at all.1 Together thesemade up 31% of the PSE in 2004-06 (45% in 2006), up from 5% in 1986-88.
Figure 6.4. European Union: PSE level and commodity specificity
Source: OECD PSE/CSE database, 2007.1 2 http://dx.doi.org/10.1787/073850221556
Figure 6.5. European Union: Components of GCT
Note: Cereals + oilseeds + protein crops is the sum of the three individual commodity groups.
Source: OECD PSE/CSE database, 2007.
SCT GCT ACT OTP
50
1986
1987
1988
1989
1990
1991
1992
1993
1994
1995
1996
1997
1998
1999
2000
2001
2002
2003
2004
2005
2006
40
35
30
25
20
10
0
15
5
45
% of gross farm receipts
All crops Cereal, oilseeds and protein crops Cereal + oilseeds + protein crops
Any livestock group Other
25
1986
1987
1988
1989
1990
1991
1992
1993
1994
1995
1996
1997
1998
1999
2000
2001
2002
2003
2004
2005
2006
20
10
0
15
5
% of PSE
AGRICULTURAL POLICIES IN OECD COUNTRIES: MONITORING AND EVALUATION 2007 – ISBN 978-92-64-02746-6 – © OECD 2007 101
II.6. EUROPEAN UNION
Box 6.1. European Union: Commodity-Specificity of Support (cont.)
Support in the EU has become gradually less commodity specific over the period, asshown by the evolution of transfers within and outside the GCT categories. SCTsdominated the PSE and GCTs were small until 1992, when area and headage paymentswere introduced to partially compensate producers for the reduction in administeredprices. While headage payments in the livestock sector remained commodity specific, areapayments were made available to producers of any cereals, oilseeds or protein crops (COP),with the rate for cereals different from that for oilseeds or protein crops. The share of thesethree categories of GCTs in the PSE was between 9% and 13% over the period 1993-2003. In2003, a common rate was applied to any cereals and oilseeds, as it had been for set-asideland from 1992. As a result, the share of GCTs for COP in the PSE rose to 13% in 2004. Theshare of GCTs in the PSE decreased in 2005 and further in 2006 as the single payment,which does not require any production of any commodity and is classified in OTPs,replaced part or all of these former payments.
1. The definition of the categories SCT, GCT, ACT and OTP are provided in the Chapter I.3 of this reportincluding an annex with the list of groups used in specific countries in the period 1986-2006.
AGRICULTURAL POLICIES IN OECD COUNTRIES: MONITORING AND EVALUATION 2007 – ISBN 978-92-64-02746-6 – © OECD 2007102
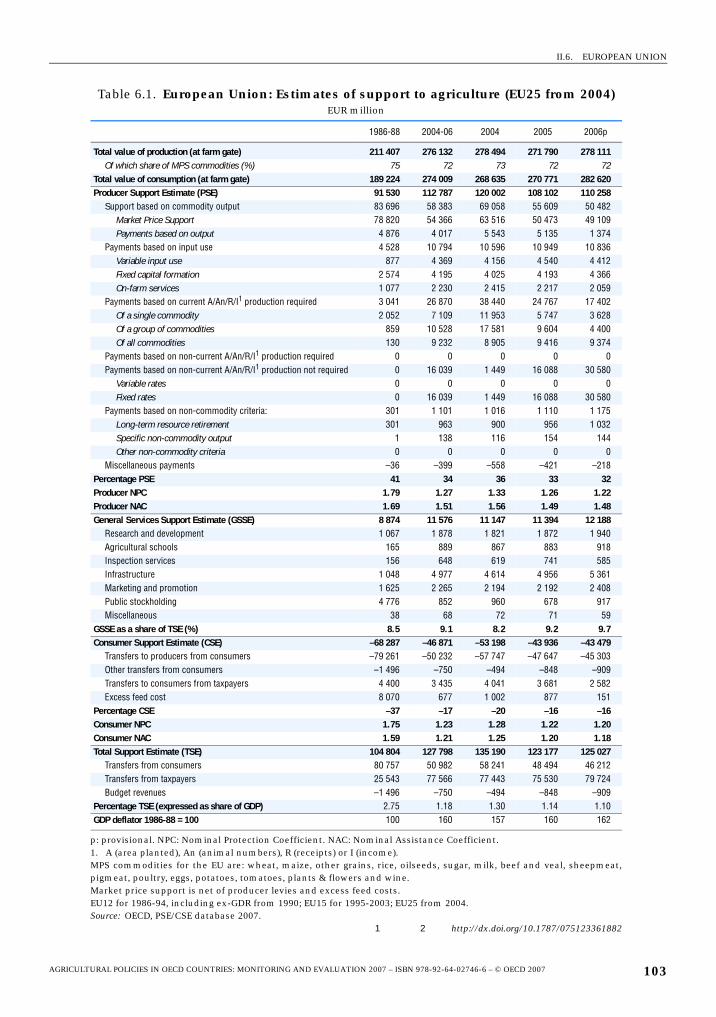
II.6. EUROPEAN UNION
Table 6.1. European Union: Estimates of support to agriculture (EU25 from 2004)EUR million
1986-88 2004-06 2004 2005 2006p
Total value of production (at farm gate) 211 407 276 132 278 494 271 790 278 111Of which share of MPS commodities (%) 75 72 73 72 72
Total value of consumption (at farm gate) 189 224 274 009 268 635 270 771 282 620Producer Support Estimate (PSE) 91 530 112 787 120 002 108 102 110 258
Support based on commodity output 83 696 58 383 69 058 55 609 50 482Market Price Support 78 820 54 366 63 516 50 473 49 109Payments based on output 4 876 4 017 5 543 5 135 1 374
Payments based on input use 4 528 10 794 10 596 10 949 10 836Variable input use 877 4 369 4 156 4 540 4 412Fixed capital formation 2 574 4 195 4 025 4 193 4 366On-farm services 1 077 2 230 2 415 2 217 2 059
Payments based on current A/An/R/I1 production required 3 041 26 870 38 440 24 767 17 402Of a single commodity 2 052 7 109 11 953 5 747 3 628Of a group of commodities 859 10 528 17 581 9 604 4 400Of all commodities 130 9 232 8 905 9 416 9 374
Payments based on non-current A/An/R/I1 production required 0 0 0 0 0Payments based on non-current A/An/R/I1 production not required 0 16 039 1 449 16 088 30 580
Variable rates 0 0 0 0 0Fixed rates 0 16 039 1 449 16 088 30 580
Payments based on non-commodity criteria: 301 1 101 1 016 1 110 1 175Long-term resource retirement 301 963 900 956 1 032Specific non-commodity output 1 138 116 154 144Other non-commodity criteria 0 0 0 0 0
Miscellaneous payments –36 –399 –558 –421 –218Percentage PSE 41 34 36 33 32Producer NPC 1.79 1.27 1.33 1.26 1.22Producer NAC 1.69 1.51 1.56 1.49 1.48General Services Support Estimate (GSSE) 8 874 11 576 11 147 11 394 12 188
Research and development 1 067 1 878 1 821 1 872 1 940Agricultural schools 165 889 867 883 918Inspection services 156 648 619 741 585Infrastructure 1 048 4 977 4 614 4 956 5 361Marketing and promotion 1 625 2 265 2 194 2 192 2 408Public stockholding 4 776 852 960 678 917Miscellaneous 38 68 72 71 59
GSSE as a share of TSE (%) 8.5 9.1 8.2 9.2 9.7Consumer Support Estimate (CSE) –68 287 –46 871 –53 198 –43 936 –43 479
Transfers to producers from consumers –79 261 –50 232 –57 747 –47 647 –45 303Other transfers from consumers –1 496 –750 –494 –848 –909Transfers to consumers from taxpayers 4 400 3 435 4 041 3 681 2 582Excess feed cost 8 070 677 1 002 877 151
Percentage CSE –37 –17 –20 –16 –16Consumer NPC 1.75 1.23 1.28 1.22 1.20Consumer NAC 1.59 1.21 1.25 1.20 1.18Total Support Estimate (TSE) 104 804 127 798 135 190 123 177 125 027
Transfers from consumers 80 757 50 982 58 241 48 494 46 212Transfers from taxpayers 25 543 77 566 77 443 75 530 79 724Budget revenues –1 496 –750 –494 –848 –909
Percentage TSE (expressed as share of GDP) 2.75 1.18 1.30 1.14 1.10GDP deflator 1986-88 = 100 100 160 157 160 162
p: provisional. NPC: Nominal Protection Coefficient. NAC: Nominal Assistance Coefficient.1. A (area planted), An (animal numbers), R (receipts) or I (income).MPS commodities for the EU are: wheat, maize, other grains, rice, oilseeds, sugar, milk, beef and veal, sheepmeat,pigmeat, poultry, eggs, potatoes, tomatoes, plants & flowers and wine.Market price support is net of producer levies and excess feed costs.EU12 for 1986-94, including ex-GDR from 1990; EU15 for 1995-2003; EU25 from 2004.Source: OECD, PSE/CSE database 2007.
1 2 http://dx.doi.org/10.1787/075123361882
AGRICULTURAL POLICIES IN OECD COUNTRIES: MONITORING AND EVALUATION 2007 – ISBN 978-92-64-02746-6 – © OECD 2007 103
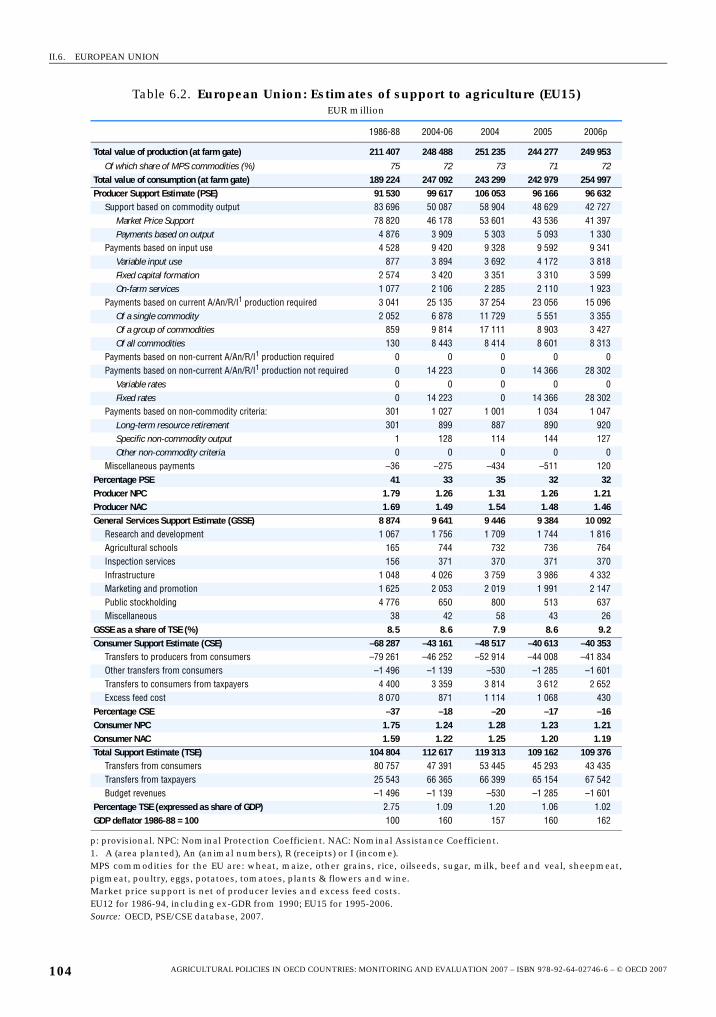
II.6. EUROPEAN UNION
Table 6.2. European Union: Estimates of support to agriculture (EU15)EUR million
1986-88 2004-06 2004 2005 2006p
Total value of production (at farm gate) 211 407 248 488 251 235 244 277 249 953Of which share of MPS commodities (%) 75 72 73 71 72
Total value of consumption (at farm gate) 189 224 247 092 243 299 242 979 254 997Producer Support Estimate (PSE) 91 530 99 617 106 053 96 166 96 632
Support based on commodity output 83 696 50 087 58 904 48 629 42 727Market Price Support 78 820 46 178 53 601 43 536 41 397Payments based on output 4 876 3 909 5 303 5 093 1 330
Payments based on input use 4 528 9 420 9 328 9 592 9 341Variable input use 877 3 894 3 692 4 172 3 818Fixed capital formation 2 574 3 420 3 351 3 310 3 599On-farm services 1 077 2 106 2 285 2 110 1 923
Payments based on current A/An/R/I1 production required 3 041 25 135 37 254 23 056 15 096Of a single commodity 2 052 6 878 11 729 5 551 3 355Of a group of commodities 859 9 814 17 111 8 903 3 427Of all commodities 130 8 443 8 414 8 601 8 313
Payments based on non-current A/An/R/I1 production required 0 0 0 0 0Payments based on non-current A/An/R/I1 production not required 0 14 223 0 14 366 28 302
Variable rates 0 0 0 0 0Fixed rates 0 14 223 0 14 366 28 302
Payments based on non-commodity criteria: 301 1 027 1 001 1 034 1 047Long-term resource retirement 301 899 887 890 920Specific non-commodity output 1 128 114 144 127Other non-commodity criteria 0 0 0 0 0
Miscellaneous payments –36 –275 –434 –511 120Percentage PSE 41 33 35 32 32Producer NPC 1.79 1.26 1.31 1.26 1.21Producer NAC 1.69 1.49 1.54 1.48 1.46General Services Support Estimate (GSSE) 8 874 9 641 9 446 9 384 10 092
Research and development 1 067 1 756 1 709 1 744 1 816Agricultural schools 165 744 732 736 764Inspection services 156 371 370 371 370Infrastructure 1 048 4 026 3 759 3 986 4 332Marketing and promotion 1 625 2 053 2 019 1 991 2 147Public stockholding 4 776 650 800 513 637Miscellaneous 38 42 58 43 26
GSSE as a share of TSE (%) 8.5 8.6 7.9 8.6 9.2Consumer Support Estimate (CSE) –68 287 –43 161 –48 517 –40 613 –40 353
Transfers to producers from consumers –79 261 –46 252 –52 914 –44 008 –41 834Other transfers from consumers –1 496 –1 139 –530 –1 285 –1 601Transfers to consumers from taxpayers 4 400 3 359 3 814 3 612 2 652Excess feed cost 8 070 871 1 114 1 068 430
Percentage CSE –37 –18 –20 –17 –16Consumer NPC 1.75 1.24 1.28 1.23 1.21Consumer NAC 1.59 1.22 1.25 1.20 1.19Total Support Estimate (TSE) 104 804 112 617 119 313 109 162 109 376
Transfers from consumers 80 757 47 391 53 445 45 293 43 435Transfers from taxpayers 25 543 66 365 66 399 65 154 67 542Budget revenues –1 496 –1 139 –530 –1 285 –1 601
Percentage TSE (expressed as share of GDP) 2.75 1.09 1.20 1.06 1.02GDP deflator 1986-88 = 100 100 160 157 160 162
p: provisional. NPC: Nominal Protection Coefficient. NAC: Nominal Assistance Coefficient.1. A (area planted), An (animal numbers), R (receipts) or I (income).MPS commodities for the EU are: wheat, maize, other grains, rice, oilseeds, sugar, milk, beef and veal, sheepmeat,pigmeat, poultry, eggs, potatoes, tomatoes, plants & flowers and wine.Market price support is net of producer levies and excess feed costs.EU12 for 1986-94, including ex-GDR from 1990; EU15 for 1995-2006.Source: OECD, PSE/CSE database, 2007.
AGRICULTURAL POLICIES IN OECD COUNTRIES: MONITORING AND EVALUATION 2007 – ISBN 978-92-64-02746-6 – © OECD 2007104
II.6. EUROPEAN UNION
Description of policy developments1
Main policy instrumentsThe Common Agricultural Policy (CAP) is composed of two pillars. The first pillar
defines Common Market Organisations (CMOs), and now includes the Single Payment
Scheme. The second pillar or Rural Development Regulation (RDR) of Agenda 2000 includes
various measures co-financed by EU member states, drawn from a list of available
measures that can be tailored to the specific conditions facing their rural areas.
A major reform of the CAP was decided in 2003 (see OECD, 2004, Analysis of the 2003
CAP reform for a full description of CAP changes, available at www.oecd.org/agr/policy). The
reform includes adjustments to CMO parameters for crops, beef and dairy products, which
were introduced from 2004. A second package of reforms was decided in 2004 for the olive
oil, cotton, tobacco and hop sectors. The main feature of the 2003 reform is the
introduction, as part of the Single Payment Scheme, of a single payment which does not
require recipients to produce. It replaces part or all of the premia that existed under
different CMOs. Implementation of the Single Payment Scheme started in 2005 or 2006 in
the EU15, depending on the country, using various formulas described in Table 6.A2.1.
Farmers were allotted payment entitlements based on historical reference amounts
received during the period 2000-02. Depending on the country, payment entitlements were
established either at the farm level or at the regional level, or a mixture of both. Some area
payments to crops and headage payments to beef and sheep are maintained in some EU15
countries.
Direct payments were introduced in 2004 in new member states, starting at 25% of the
EU15 level and being progressively increased to reach 100% in 2013. Specific transitional
schemes apply in new member states. Eight apply the Single Area Payment Scheme (SAPS),
under which each eligible hectare receives the same payment rate. It will apply until 2010.
Malta and Slovenia chose to maintain former area and headage payments until 2006 and
implemented the Single Payment Scheme in 2007. During the ten-year phase-in period,
new EU member states may complement EU funds with Complementary National Direct
payments (CNDP or top-up payments) from national funds. They are granted as
commodity-specific area or headage payments. Over the period 2004-06, a maximum of
20% of the CNDP can be co-financed from RDR funds on average. Total payments cannot
exceed 100% of the EU15 payment rate. Similar arrangements were made for Bulgaria and
Romania when they joined the EU in January 2007.
There are intervention prices for cereals (with the exception of rye) but not for oilseeds
and protein crops (peas, beans and sweet lupins). The market support regime for cereals
and sugar comprises trade protection through tariffs, tariff rate quotas (TRQs) and export
subsidies. Until July 2006, when a new regime came into force (Box 6.2), the sugar support
regime comprised intervention prices and production quotas, while producers (growers
and processors) jointly paid the cost of disposing of production in excess of the quota
through producer levies.
Intervention prices and production quotas are used for milk in conjunction with
import protection and export subsidies. The beef market is supported by basic prices,
tariffs, TRQs and export subsidies. Support for pigmeat is provided mainly through import
protection and export subsidies. For sheepmeat, the market support regime comprises
tariffs and TRQs, with most country-specific TRQs subject to a zero customs duty. For
AGRICULTURAL POLICIES IN OECD COUNTRIES: MONITORING AND EVALUATION 2007 – ISBN 978-92-64-02746-6 – © OECD 2007 105
II.6. EUROPEAN UNION
poultry and eggs, there are no intervention prices, although there are TRQs and export
subsidies.
The RDR is implemented through National (or Regional) Development Plans, which
define the list of measures chosen by the country and their funding. Available measures
include agri-environmental measures, early retirement schemes, and payments to assist
farmers in less-favoured areas (LFAs), as well as payments available to both farmers and
non farmers for afforestation, tourist infrastructure and the development of non-
agricultural businesses. Other measures such as farm investment, the installation of young
farmers, training, investment aid for processing and marketing facilities, additional
assistance for forestry, promotion and conversion of agriculture, are also either co-
financed or entirely financed by EU member states. Four additional measures were
introduced under the 2003 CAP reform: quality incentives for farmers, support to help
farmers to meet standards, a farm advisory system and support to cover animal welfare
costs. Specific measures are also available in new member states: temporary income
support for semi-subsistence farms undergoing restructuring, support to producer groups,
technical assistance and a temporary measure until 2006 to help farmers meet costs
related to compliance with EU environmental, hygiene, welfare, food safety and
occupational safety standards.
Domestic policyIn 2006, EU25 expenditures and direct aids (Heading 1.A of the guarantee section of the
European Agricultural Guidance and Guarantee Fund (EAGGF) amounted to EUR 42.2 billion
(USD 52.8 billion), compared to EUR 42.1 billion (USD 52.7 billion) in 2005. In the budget for
2007, expenditures on market and direct aids (from the European Agricultural Fund for
Guarantee, EAFG) amount to EUR 42.9 billion (USD 53.7 billion) for the EU27. This increase
is mainly explained by the phasing-in of direct payments in new member states and some
market expenditures in Bulgaria and Romania. Figures for the 2007 budget reflect the
implementation of the single payment which accounts for more than 80% of direct
payments under this heading. This share will come close to 90% once the reforms are fully
implemented.
Total expenditures on agriculture (market, direct aids and rural development) are
estimated at EUR 53.8 billion (USD 67.3 billion) in 2007 for the EU27, compared to
EUR 53.4 billion (USD 66.8 billion) in 2006 for the EU25.
As part of the first step of the 2003 CAP reform introduced in 2004, intervention was
abolished for rye, the support price for rice was cut by 50% and the first cuts applied to the
dairy sector. Intervention prices for butter and skimmed milk powder continued to be
reduced, by 7.5% and 5.3% respectively in 2005/06 and by 8.1% and 5.6% respectively in
2006/07 (Table 6.3). The decline between 2004 and 2007 will reach a total of 25% for butter
and 15% for skimmed milk powder. Following the sugar reform, the minimum sugar beet
price decreased by 25% in 2006/07 compared to its level in previous marketing years (see
Box 6.2). In mid-December 2006, the commission proposed the abolition of maize
intervention as from July 2007. Other intervention prices remained unchanged during the
marketing years 2004/05 to 2006/07.
For those countries that have partially retained Agenda 2000 crop payments, the rates
(per hectare) were maintained at the 2004/05 levels adjusted by the coupling rate.
Depending on the country, these may include payments per hectare of cereals, oilseeds
AGRICULTURAL POLICIES IN OECD COUNTRIES: MONITORING AND EVALUATION 2007 – ISBN 978-92-64-02746-6 – © OECD 2007106
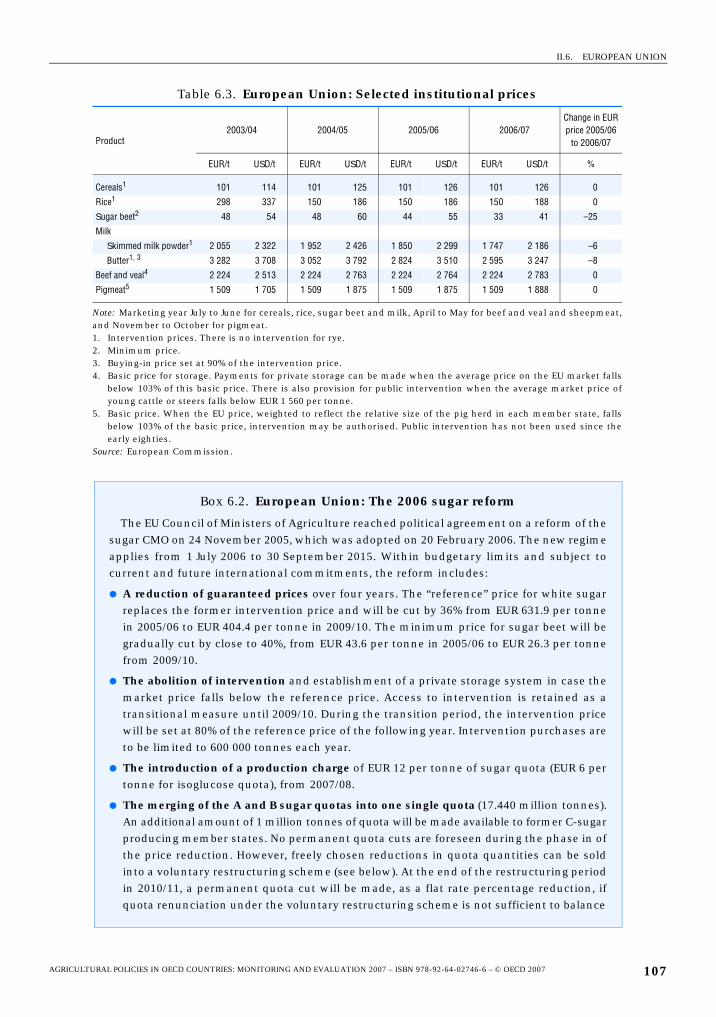
II.6. EUROPEAN UNION
Table 6.3. European Union: Selected institutional prices
Product2003/04 2004/05 2005/06 2006/07
Change in EUR price 2005/06
to 2006/07
EUR/t USD/t EUR/t USD/t EUR/t USD/t EUR/t USD/t %
Cereals1 101 114 101 125 101 126 101 126 0
Rice1 298 337 150 186 150 186 150 188 0
Sugar beet2 48 54 48 60 44 55 33 41 –25
Milk
Skimmed milk powder1 2 055 2 322 1 952 2 426 1 850 2 299 1 747 2 186 –6
Butter1, 3 3 282 3 708 3 052 3 792 2 824 3 510 2 595 3 247 –8
Beef and veal4 2 224 2 513 2 224 2 763 2 224 2 764 2 224 2 783 0
Pigmeat5 1 509 1 705 1 509 1 875 1 509 1 875 1 509 1 888 0
Note: Marketing year July to June for cereals, rice, sugar beet and milk, April to May for beef and veal and sheepmeat,and November to October for pigmeat.1. Intervention prices. There is no intervention for rye.2. Minimum price.3. Buying-in price set at 90% of the intervention price.4. Basic price for storage. Payments for private storage can be made when the average price on the EU market falls
below 103% of this basic price. There is also provision for public intervention when the average market price ofyoung cattle or steers falls below EUR 1 560 per tonne.
5. Basic price. When the EU price, weighted to reflect the relative size of the pig herd in each member state, fallsbelow 103% of the basic price, intervention may be authorised. Public intervention has not been used since theearly eighties.
Source: European Commission.
Box 6.2. European Union: The 2006 sugar reform
The EU Council of Ministers of Agriculture reached political agreement on a reform of thesugar CMO on 24 November 2005, which was adopted on 20 February 2006. The new regimeapplies from 1 July 2006 to 30 September 2015. Within budgetary limits and subject tocurrent and future international commitments, the reform includes:
● A reduction of guaranteed prices over four years. The “reference” price for white sugarreplaces the former intervention price and will be cut by 36% from EUR 631.9 per tonnein 2005/06 to EUR 404.4 per tonne in 2009/10. The minimum price for sugar beet will begradually cut by close to 40%, from EUR 43.6 per tonne in 2005/06 to EUR 26.3 per tonnefrom 2009/10.
● The abolition of intervention and establishment of a private storage system in case themarket price falls below the reference price. Access to intervention is retained as atransitional measure until 2009/10. During the transition period, the intervention pricewill be set at 80% of the reference price of the following year. Intervention purchases areto be limited to 600 000 tonnes each year.
● The introduction of a production charge of EUR 12 per tonne of sugar quota (EUR 6 pertonne for isoglucose quota), from 2007/08.
● The merging of the A and B sugar quotas into one single quota (17.440 million tonnes).An additional amount of 1 million tonnes of quota will be made available to former C-sugarproducing member states. No permanent quota cuts are foreseen during the phase in ofthe price reduction. However, freely chosen reductions in quota quantities can be soldinto a voluntary restructuring scheme (see below). At the end of the restructuring periodin 2010/11, a permanent quota cut will be made, as a flat rate percentage reduction, ifquota renunciation under the voluntary restructuring scheme is not sufficient to balance
AGRICULTURAL POLICIES IN OECD COUNTRIES: MONITORING AND EVALUATION 2007 – ISBN 978-92-64-02746-6 – © OECD 2007 107
II.6. EUROPEAN UNION
and protein crops (COP) and land set-aside, as well as payments introduced by the 2003
CAP reform for which production is required (e.g. payments for rice and dried fodder).
Similarly, for those countries that have partially retained Agenda 2000 livestock
payments, the rates (per head) were maintained at the 2004/05 levels adjusted by the
coupling rate – the suckler cow premium, special beef premium, deseasonalisation
premium, the extensification premium, slaughter premium, ewe premium and additional
ewe premium in less-favoured areas – have been partially retained by some countries.
Following the cut in prices decided in the 2003 CAP reform, the dairy premium was
increased to EUR 16.31 per tonne in 2005, and EUR 24.49 per tonne in 2006. This payment is
Box 6.2. European Union: The 2006 sugar reform (cont.)
the internal market. A levy for any surplus production will be introduced to controlproduction above quota. Isoglucose quotas will be increased by 100 000 tonnes per yearover three years. In addition, a further 103 000 tonnes of isoglucose quota will beavailable to Lithuania (8 000 tonnes), Sweden (35 000 tonnes) and Italy (60 000 tonnes),upon payment of a charge of EUR 730 per tonne. Inulin quota will be unchanged.
● The introduction of a partial compensation in a form of a payment to sugar beetgrowers to be integrated in the single payment. Farmers will be compensated for, onaverage, 64.2% of the price cut through a payment with no production requirement. Forthose member states with more than 50% reduction in quota production, a temporarycommodity-specific aid corresponding to a further 30% of revenue loss is payable forfour years. Limited national aids are permitted in Italy, Finland and for the Frenchoverseas departments. The EU has made sugar beet eligible for the energy crop aid ofEUR 45 per hectare.
● The introduction of a voluntary restructuring scheme with funds available for factoryclosures, for assistance to sugar beet growers, for diversification measures in affectedregions of member states and for transition measures. Funds will be provided by a levyon all sugar, isoglucose and inulin quota, in the first instance, and will be borne by sugarusers in the form of higher prices.
● Necessary modifications to preferential import systems: Preferential imports of1.3 million tonnes of sugar, white value, per year from the African, Caribbean and Pacificcountries (ACP) as well as India under the Sugar Protocol of the Cotonou Agreementcontinue under the sugar reform, but at the lower reference price. The zero tariffimports foreseen under the Everything But Arms (EBA) initiative for Least DevelopedCountries (LDCs) from 2009/10 is also maintained. From 2009 to 2015 the EU will apply aceiling on duty-free imports from LDCs and ACP countries together of 3.5 million tonnes,with normal tariffs applicable on any imports above this volume from ACP countries butnot LDCs. After 2015, the idea is to apply an EBA safeguard clause for sugar. An initial aidpackage of EUR 40 million will be made available in 2006 and a total of EUR 1 244 millionhas been earmarked for a period of seven years to assist ACP countries adverselyaffected by the lowering of the price that they receive for their exports. Raw cane sugarfor EU refiners will continue to be imported on the current basis of “traditional supplyneeds” (TSN). From 2009/10, the TSN will be fixed at the EU level for all origins. Thetraditional monopoly held by sugar refiners in refining preferential imports of raw sugarfrom cane under the TSN is set to expire after 2009/10.
Source: EU Commission, Press Release IP/05/1473, 24 November 2005; OECD (2007), “EU sugar policy reform”,(AGR/CA/APM[2006]15/FINAL).
AGRICULTURAL POLICIES IN OECD COUNTRIES: MONITORING AND EVALUATION 2007 – ISBN 978-92-64-02746-6 – © OECD 2007108
II.6. EUROPEAN UNION
included in the single payment over the years 2005 to 2007, depending on the country.
Member states have the possibility to add to the premium out of the so-called national
envelops.
In the first marketing year under the reformed sugar regime, sugar production underquota was subject to a one-year cut of 2.5 million tonnes (13.6%) in order to improve the
balance on the sugar market. Production quotas for starch potatoes were extended, at the
same level, for two years in June 2005 and again for two years in December 2006. As part of
the Agenda 2000 and 2003 CAP reform, milk quotas in the EU15 were increased from
119.013 million tonnes in 2004/05 to 119.063 tonnes in 2005/06 and 119.544 tonnes in 2006/07.
Quotas for new member states were unchanged in 2005/06 but were increased as of the
2006/07 marketing year as the totality of the milk quota reserves were allocated to them.
The implementation of the Single Payment Scheme started in 2005. Ten of the EU15
countries implemented it in 2005 and five in 2006. Five countries included the dairy
payment in the single payment in 2005, six in 2006 and four will do so in 2007. Payments
resulting from the reform of the sugar sector entered the single payment in 2006 (Box 6.2)
as well as part or all of the payments for hop, cotton, tobacco and olive oil, as decided in the
2004 reform. In the case of tobacco, integration in the single payment will be carried out
gradually over a four year transition period. From 2010 onwards 50% of the payment will be
included in the single payment with the other half used for restructuring under rural
development programmes. In the case of cotton, while the pre-reform support was based
on a per tonne payment to processors, 65% of support is integrated into the single
payment, another part is transferred to rural development and the remaining part is paid
per hectare. The processing aid to flax and hemp, which was due to expire in 2005/06, was
extended until 2007/08.
The transitional period of application of the SAPS in new member states, which was
2004-06 with two additional years if requested, was extended until 2010. After that date the
Single Payment Scheme will apply. The phasing-in of direct payments in new member
states proceeded as planned: they received 30% of the EU15 payment rate in 2005, 35% in
2006 and 40% in 2007. For sugar the full payment is included in the single payment without
phasing-in.
In December 2006, EU ministers agreed to a reform of the CMO for bananas. It is applied
since January 2007. The current aid scheme, which compensates producers for drops in
prices, is replaced with a budget transfer to the POSEI scheme (Programme d’options spécifiques
à l’éloignement et l’insularité). POSEI provides support to the outermost regions, where most
EU bananas are grown, to assist local agricultural production and marketing. For producers
in non-outermost-regions bananas are included in the single payment.
In January 2007, the Commission unveiled its plan for a reform of the CMO for fruits
and vegetables. The main proposals are outlined in Box 6.3.
In three consecutive years 2004/05, 2005/06 and 2006/07, wine producers were
allocated about EUR 450 million for the restructuring and conversion of vineyards. This
support, which is granted under Regulation 1493/1999, covers measures for varietal
conversion, relocation of vineyards and improvements to vineyard management
techniques.
In July 2006, the EU Commission authorised farmers affected by the drought to use set-
aside land to feed animals. Subsequently, it allowed member countries to grant advance
AGRICULTURAL POLICIES IN OECD COUNTRIES: MONITORING AND EVALUATION 2007 – ISBN 978-92-64-02746-6 – © OECD 2007 109
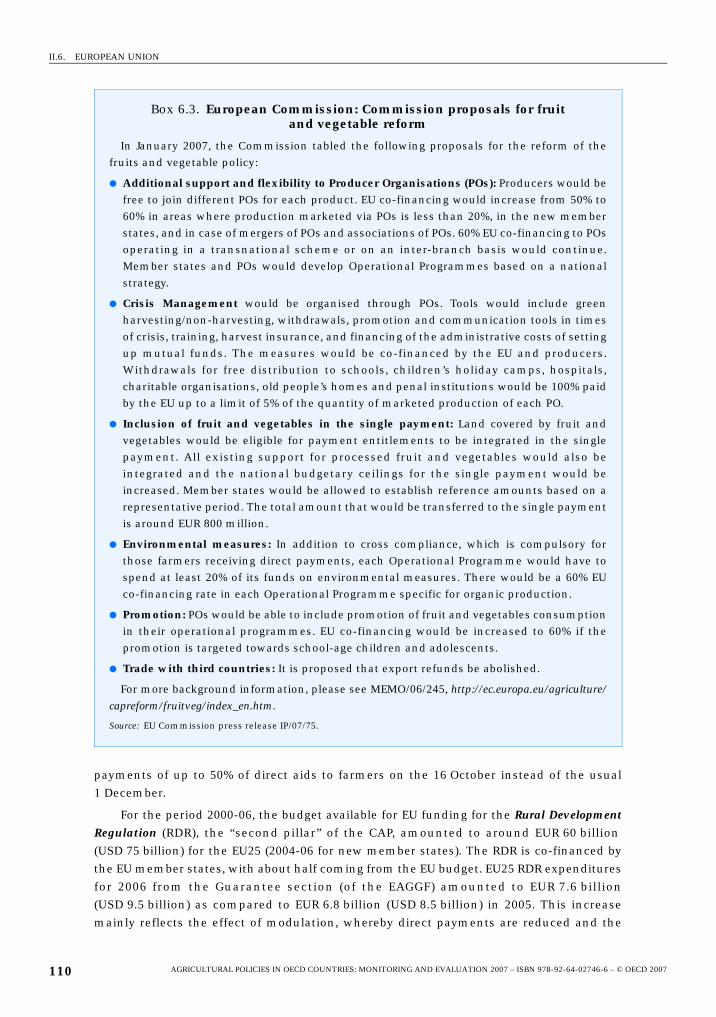
II.6. EUROPEAN UNION
payments of up to 50% of direct aids to farmers on the 16 October instead of the usual
1 December.
For the period 2000-06, the budget available for EU funding for the Rural DevelopmentRegulation (RDR), the “second pillar” of the CAP, amounted to around EUR 60 billion
(USD 75 billion) for the EU25 (2004-06 for new member states). The RDR is co-financed by
the EU member states, with about half coming from the EU budget. EU25 RDR expenditures
for 2006 from the Guarantee section (of the EAGGF) amounted to EUR 7.6 billion
(USD 9.5 billion) as compared to EUR 6.8 billion (USD 8.5 billion) in 2005. This increase
mainly reflects the effect of modulation, whereby direct payments are reduced and the
Box 6.3. European Commission: Commission proposals for fruit and vegetable reform
In January 2007, the Commission tabled the following proposals for the reform of thefruits and vegetable policy:
● Additional support and flexibility to Producer Organisations (POs): Producers would befree to join different POs for each product. EU co-financing would increase from 50% to60% in areas where production marketed via POs is less than 20%, in the new memberstates, and in case of mergers of POs and associations of POs. 60% EU co-financing to POsoperating in a transnational scheme or on an inter-branch basis would continue.Member states and POs would develop Operational Programmes based on a nationalstrategy.
● Crisis Management would be organised through POs. Tools would include greenharvesting/non-harvesting, withdrawals, promotion and communication tools in timesof crisis, training, harvest insurance, and financing of the administrative costs of settingup mutual funds. The measures would be co-financed by the EU and producers.Withdrawals for free distribution to schools, children’s holiday camps, hospitals,charitable organisations, old people’s homes and penal institutions would be 100% paidby the EU up to a limit of 5% of the quantity of marketed production of each PO.
● Inclusion of fruit and vegetables in the single payment: Land covered by fruit andvegetables would be eligible for payment entitlements to be integrated in the singlepayment. All existing support for processed fruit and vegetables would also beintegrated and the national budgetary ceilings for the single payment would beincreased. Member states would be allowed to establish reference amounts based on arepresentative period. The total amount that would be transferred to the single paymentis around EUR 800 million.
● Environmental measures: In addition to cross compliance, which is compulsory forthose farmers receiving direct payments, each Operational Programme would have tospend at least 20% of its funds on environmental measures. There would be a 60% EUco-financing rate in each Operational Programme specific for organic production.
● Promotion: POs would be able to include promotion of fruit and vegetables consumptionin their operational programmes. EU co-financing would be increased to 60% if thepromotion is targeted towards school-age children and adolescents.
● Trade with third countries: It is proposed that export refunds be abolished.
For more background information, please see MEMO/06/245, http://ec.europa.eu/agriculture/
capreform/fruitveg/index_en.htm.
Source: EU Commission press release IP/07/75.
AGRICULTURAL POLICIES IN OECD COUNTRIES: MONITORING AND EVALUATION 2007 – ISBN 978-92-64-02746-6 – © OECD 2007110
II.6. EUROPEAN UNION
corresponding amount is transferred to EU support for rural development. EU25
expenditures for 2006 from the Guidance section were stable at EUR 3.6 billion
(USD 4.5 billion). The appropriations available for rural development payments from the
European Agricultural Fund for Rural Development (EAFRD, the new unified fund) under
the 2007 budget amount to EUR 10.9 billion (USD 13.6 billion) for the EU27.
The rural development (RD) programme for the new implementation period 2007-13
was agreed in June 2005. While during the 2000-06 period, RDR funds were under either the
guarantee section or the guidance section of the EAAGF, depending on the region, they will
be under a new single European Agricultural Fund for Rural Development (EAFRD) from
2007. The existing three types of programming (RD programmes, LEADER and Operational
programmes in Objective 1 areas) and the two types of financial management and control
systems (guarantee and guidance sections of the EAAGF) are simplified and brought under
a single funding, programming, financial management and control framework. Current
RDR measures are grouped under three thematic axes plus a separate axis applying the
multi-sectoral approach and principles of LEADER. Axis 1, “Improving the competitiveness
of the agricultural and forestry sector”, includes measures to improve human and physical
capital such as training, setting-up of young farmers, farm modernisation, as well as
measures to improve product quality. Axis 2, “land management”, encompasses less-
favoured areas, agri-environmental schemes, animal welfare, afforestation and non-
productive investments. Axis 3, “Diversification of the rural economy and quality of life in
rural areas”, concerns measures for non-agricultural sectors such as micro businesses,
tourism, renovation of villages, rural services and the conservation of rural heritage.
Minimum funding percentages are fixed for each of these axes, to ensure that RD
programmes are balanced. The current definition of less-favoured areas will be maintained
until 2010.
The financial contribution will be at least 10% for axis 1 and 3, 25% for axis 2 and 5%
for the LEADER axis. EAFRD support for the EU25/27 will amount, in current EUR, to
EUR 77.7/88.3 billion (USD 97/110 billion) for the period 2007-13. Member states will first
submit National Strategy Plans and afterwards more detailed programmes laying out the
programmed measures and corresponding funds.
In December 2005, the European Commission adopted an Action Plan designed to
increase the use of biomass from forestry, agriculture and waste materials for energy
purposes. To help meet the 2010 target – a 5.75% market share for biofuels in the overall
transport fuel supply – the European Commission adopted an EU Strategy for Biofuels in
February 2006, along seven policy axes: 1) Stimulating demand for biofuels; 2) Capturing
environmental benefits; 3) Developing the production and distribution of biofuels;
4) Expanding feedstock supplies; 5) Enhancing trade opportunities; 6) Supporting
developing countries; and 7) Supporting research and development. In September 2006, the
Commission adopted a proposal aiming at reinforcing the use of the energy crop premium
scheme. In addition to the extension of the scheme to the new member states (finally
agreed by ministers in December 2006), the Commission also proposed to allow member
states to grant national aid of up to 50% of the costs of establishing multi-annual crops on
areas on which an application for the energy crop aid has been made. In March 2007, the
EU Council agreed a target for biofuels of 10% for the overall fuel supply by 2020.
From January 2006, the use of the last four antibiotics still allowed as feed additiveswas banned and farmers are forbidden from using any antibiotics as growth promoters in
AGRICULTURAL POLICIES IN OECD COUNTRIES: MONITORING AND EVALUATION 2007 – ISBN 978-92-64-02746-6 – © OECD 2007 111
II.6. EUROPEAN UNION
animal feed. In February 2006, the Commission tightened dioxin legislation by adding to
the maximum limits on dioxin in food products set in 2002, new ceilings that include
dioxin-like molecules.
The European Commission allowed the producers of organic food to choose whether
or not to use the EU organic logo. Imports of organic products are allowed but cannot be
marketed as organic unless they comply with EU standards or come with equivalent
guarantees from the country of origin.
In spring 2006, the Commission agreed to fund 50% of the cost of measures taken to
support the poultry market affected by Avian flu, such as the destruction of hatching eggs
and chicks, the early slaughter of the breeding flock, other voluntary reductions in output
and the compensation of income losses, even if the farm itself is not affected by Avian flu
(April, June). The ban on British beef exports to other EU countries introduced in 1996 at the
height of the BSE crisis was lifted in spring 2006.
Various efforts were made to simplify the implementation of the CAP. A new
regulation was adopted in May 2005, which creates two new funds: the European
Agricultural Guarantee Fund (EAGF) and the European Agricultural Fund for Rural
Development (EAFRD) that will both operate under a single management and control
system. It will include the use of accredited paying agencies, accredited coordination
bodies, a better system of certification of the accounts, an improved annual accounting
system completed by a declaration of assurance from the director of the national paying
agencies, an annual clearance of accounts exercise, and an annual conformity clearance of
accounts exercise. The regulation also includes reinforced rules for budgetary discipline.
The new system was implemented in January 2007. As part of the 2003 reform, each
member state had also been required to set up an integrated administration and control
system to facilitate the implementation of the Single Payment Scheme and other aid
schemes (Chapter 4 of Council Regulation [EC No. 1782/2003]). It comprises:
● a computerised data base;
● an identification system for agricultural parcels;
● a system for the identification and registration of payments entitlements;
● aid applications;
● an integrated control system; and
● a single system to record the identity of each farmer who submits an aid application.
As part of a broad initiative to simplify the CAP (see http://europa.eu.int/comm/agriculture/
simplification/index_en.htm for more details), the Commission proposed to:
● identify and eliminate unnecessary or out of date provisions through a “legal audit” of
existing rules, and to improve the structure and presentation of agricultural law; and
● amalgamate the existing CMOs into a single CMO to provide a single set of harmonised
rules in the areas of market policy such as intervention, private storage, tariff rate
quotas, export refunds, safeguard measures, promotion of agricultural products, state
aid rules, communications and reporting of data, without changing the substance of the
existing instruments and mechanisms.
In October 2006, a CAP simplification action plan with concrete measures was
presented and a simplification conference was held, focusing on the views and needs of
stakeholders. In December 2006, the Commission tabled a proposal for a Council
AGRICULTURAL POLICIES IN OECD COUNTRIES: MONITORING AND EVALUATION 2007 – ISBN 978-92-64-02746-6 – © OECD 2007112
II.6. EUROPEAN UNION
Regulation establishing a common organisation of agricultural markets and on specific
provisions for certain agricultural products. The plan is to replace the 21 individual CMOs
with one CMO, without changing policies.
Trade policyIn 2005 and 2006, export subsidy spending was close to EUR 2.5 and 1.8 billion
respectively (USD 3.1 and 2.3 billion), compared to EUR 3.2 billion (USD 4 billion) in 2004.
This fall occurred as a result of the rise in world prices. According to the most recent EU
notifications to the WTO on export subsidies, in the marketing year 2002/03, the EU
remained well below its WTO ceiling for export subsidies except in the case of cheese, rice,
fresh fruits and vegetables and wine where over 90% of the allowance was used, in volume.
On market access, 40% of the EU’s individual TRQs were fully filled, while 13 of the
87 individual TRQs registered a fill rate of zero in 2002/03. The EU is in the process of
compiling consolidated commitments for the enlarged EU25, but as of February 2007 they
had not yet been submitted to WTO.
To provide compensatory adjustment for EU enlargement, the EU offered new TRQs.
Some of them are erga omnes and some allocated to specific countries such as Australia,
Canada, China, New Zealand, Brazil, Thailand and the United States. These TRQs
compensate countries for the increase in new member states’ tariffs. In addition, WTO
TRQs of the new member states were merged into the WTO TRQs of the EU15 in cases
where new member states in-quota rates were lower than the EU out-of-quota rates.
Following a European Court of Justice ruling, the EU introduced new import
arrangements for its WTO bound tariff rate quota for butter from New Zealand applicable
from 2007. Licences for quota butter imports from New Zealand into the EU will no longer
be awarded exclusively to the single European importer that the New Zealand exporter
historically chose to trade with. From 2007 onwards, any importer on the European
approved list may apply for an import licence. 45% of import licences will be allocated to
new entrants. In 2001, the EU had agreed to replace its tariff quota system for bananas by a
single tariff to be applied on 1 January 2006. The tariff rate of EUR 230 per tonne proposed
by the EU in January 2005 was rejected by WTO arbitrators. In November 2005, the EU
agreed a new import tariff of EUR 176 per tonne for most favoured nation suppliers of
bananas, which applied from 1 January 2006. A tariff quota for ACP (African, Caribbean,
Pacific) countries of 775 000 tonnes at zero duty also applies. Ecuador made a formal
request for WTO consultation over EU import arrangements for bananas in November
2006, on the alleged basis that there was a discriminatory treatment for bananas from Latin
American countries. In March 2007, it then requested a panel be set up on this issue.
In October 2006, a WTO panel launched at the request of the United States in 2003,
ruled that the EU moratorium on the authorisation of new genetically modified (GM) crops
in place between 2001 and 2004 broke international trade laws because the long approval
process for sales of GM crops in the EU market hampered trade. It also ruled that the
banning of certain GM organisms imposed by some EU member states, was inconsistent
with the EU’s WTO obligations.
In January 2005, the EU asked the WTO to establish a new panel on the beef hormone
issue stating that Canada and the United States failed to lift their sanctions against the EU
despite the fact that the EU had adopted new legislation in 2003. The EU maintains that
this new legislation had been based on a comprehensive risk assessment following the
AGRICULTURAL POLICIES IN OECD COUNTRIES: MONITORING AND EVALUATION 2007 – ISBN 978-92-64-02746-6 – © OECD 2007 113
II.6. EUROPEAN UNION
conclusion of the first panel. Canada and the United States do not believe that the revised
legislation can be considered an implementation of the WTO recommendations and
rulings related to beef hormones. A WTO Panel is expected to issue a report on this topic
before the end of 2007.
In December 2006, the EU requested a dispute settlement panel to investigate extra
duties imposed on European olive oil exports by Mexico.
A WTO arbitration panel ruled in February 2006 that the EU must adjust its tariffs on
frozen boneless chicken cuts within four months. Following that ruling, the EU decided to
readjust its schedule and agreed with Brazil and Thailand on Tariff Rate Quotas (TRQ) for
imports of certain meat categories from Brazil and from Thailand (not yet adopted by the
Council).
The European Commission proposed new rules on geographical name protection in
January 2006. Non-EU producers wanting to register a product as a Protected Geographical
Indication (PGI), a protected Designation of Origin (PDO) or a Traditional Specialties
Guaranteed (TSG) will be able to apply directly to the EU and no longer have to have their
governments apply on their behalf. In addition, their governments will not have to satisfy
the EU that they give similar protection to corresponding European goods in their own
market, allowing coffee and other products not grown in the EU to obtain such
denominations.
In September 2006, the EU modified the specification for high-quality beef imports
from Argentina, Brazil and Uruguay, in agreement with these countries, specifying that the
label “Hilton Beef” refers to grass-fed animals.
The EU rice import system was revised as it could no longer operate given its link to the
intervention price for rice, which was halved following the 2003 EU reform. After similar
arrangements with the United States, India and Pakistan, a new rice import deal was struck
with Thailand in December 2005.
In March 2006, the EU and the United States signed a bilateral wine trade agreement. It
includes a partial mutual recognition of names of origin, technical oenological practices
and simplified certification rules. The United States has changed the legal status of
17 traditional European wine names, such as Burgundy, Champagne, Port and Sherry, in
order to restrict their use in future to wine originating from the EU.
A bilateral agreement between the EU and Switzerland was signed in February 2005.
As a result, export refunds and import duties between the two countries were either
abolished or reduced. Russia and the EU agreed to apply trade bans at the regional rather
than national level in the event of animal disease outbreaks, to improve co-operation
between veterinary and customs authorities and to work towards creating a standard
procedure for reporting frauds. The EU and China signed an agreement to reduce the
imports of illegal food products into Europe, by improving exchange of information and
speed of communication. The EU started or resumed trade talks with Mediterranean
partner countries and Mercosur countries in 2005.
The EU banned poultry imports from various countries affected by avian influenza over
the period 2005-06. As the disease spread in 2005, a ban on live birds from all countries was
imposed in October and was maintained until the end of January 2006. Regional bans on
poultry imports from Bulgaria and Romania were also imposed in spring 2006 to prevent
the spread of Newcastle disease.
AGRICULTURAL POLICIES IN OECD COUNTRIES: MONITORING AND EVALUATION 2007 – ISBN 978-92-64-02746-6 – © OECD 2007114
II.6. EUROPEAN UNION
In October 2005, the EU temporarily banned beef imports from Brazil as Foot and MouthDisease cases were found. It has also banned imports of de-boned and mature beef from
eight Argentinean regions for the same reason in February 2006.
A new generalised system of preferences entered into force in January 2006. It awards
trade concessions to developing countries, by focusing on smaller, more disadvantaged
countries, and less on large developing economies such as China and India. The number of
schemes is reduced from five to three: the normal Generalised System of Preference (GSP),
the Everything But Arms (EBA) initiative and a “GSP+” category, which would reward
actions against drug trafficking or that combat governmental corruption. Preferences for
some products would be downgraded once countries reach a given level of
competitiveness. GSP+ had entered into force from July 2005 and was extended to
15 additional countries in December 2005.
Bulgaria and Romania joined the EU on 1 January 2007. The pre-accession agreement
between the EU and Croatia, which aims to create a free trade area in most agricultural
goods between the two countries, entered into force in February 2005. The EU launched
accession negotiations with Croatia and Turkey in October 2005.
AustriaSector-wide policy initiatives. Environmental sustainability continued to be a major
focus of Austrian farm policies. The main instrument is the Agri-Environmental
Programme (ÖPUL) which has been evolving since 1989. The current ÖPUL-2000 offers
32 measures that aim at improving the environmental sustainability of farming, with a
heavy emphasis on promoting organic farming practices.2 Participants in the scheme sign
up for a contract which specifies precisely what actions are to be taken, or what services
are to be delivered in return for payments. In 2006, EUR 643 million (2005, EUR 653 million)
was disbursed under this scheme, which amounted to an average of EUR 5 060 (2005,
EUR 4 820) per participant. The majority of farmers participate in this scheme, that is 80%
of all enterprises representing 88% of the total utilised agricultural area in Austria.
The emphasis on organic farming has resulted in a visible increase of the arable area
devoted to organic farming. About 11% of the arable area is now cropped according to
organic standards and about 13% of the farms are officially certified “organic” (Biobetriebe).
Austria followed a horizontal approach to bioenergy by introducing an obligation for
the oil industry to substitute a specific percentage of fuels based on mineral oil by biofuels.
It is expected that this approach will lead to meeting the EU-wide bioenergy targets in the
short run.
The year 2005 was characterized by a drought in early summer and floods in July and
August, leading to scarcity of feed for livestock. In order to ease the burden, the prohibition
to use crops from set aside acreage was lifted on 13 July in certain areas. Additional support
measures comprised a postponement of repayments of subsidised agricultural investment
loans and support to farmers for the purchase of fodder. Some regions in Austria suffered
drought again in 2006.
Implementation of the Single Payment Scheme. Austria introduced the Single Payment
Scheme in 2005, based on historical entitlements in 2000-02. All arable crop payments were
integrated into the single payment, but suckler cow and calf slaughter premiums remain
fully commodity-specific. In addition, 40% of the adult cattle slaughter premiums and 25%
of the payments for hops remain product specific. In 2005, 80 123 farms received livestock
AGRICULTURAL POLICIES IN OECD COUNTRIES: MONITORING AND EVALUATION 2007 – ISBN 978-92-64-02746-6 – © OECD 2007 115
II.6. EUROPEAN UNION
premiums (suckler cow and slaughter premiums). These payments amounted to about
EUR 98 million.
Milk premiums were introduced in 2004 and were increased annually up to 2006 (from
11.81 EUR/t in 2004, to 23.77 EUR/t in 2005 and to 35.44 EUR/t in 2006) as elsewhere in the
EU. From 2007 onwards milk premiums will be integrated into the Single Payment Scheme
based on the milk quota distribution on 31 March.
Under the Single Payment Scheme, EUR 497 million were transferred to 130 960 farms
on the basis of 2.38 million payment entitlements in 2005. The payment entitlements are
transferable and tradable within Austria, either with or without the accompanying
acreage.3 In the latter case, parts of the entitlements (50% in 2007) must be transferred to a
“national reserve.”
In Austria, as in other EU member states, the introduction of the Single Payment
Scheme was a massive administrative task. The total cost for administration of the support
programmes, including the switch to the new system, is estimated at 1.8% of the total
support payments. The cornerstone is the INVEKOS system (Integriertes Verwaltungs- und
Kontrollsystem) that is used to administer and monitor these programmes. The execution of
the support programmes is done by a semi-independent paying agency, Agrarmarkt
Austria (AMA). This agency monitored a sample of at least 1% of the payment recipients in
2005 in order to check adherence to cross-compliance criteria.
In 2005, the average direct payment per hectare transferred within INVEKOS (basically
payments within the framework of the first pillar, agri-environmental payments and
compensatory allowances) amounted to EUR 621. The distribution of payments across
farms is skewed towards larger holdings; 3% of the holdings received payments larger than
EUR 36 366. Altogether they accounted for 17% of the payments received and they farmed
15% of the agricultural area. At the lower end, 30% of the holdings received payments no
larger than EUR 3 643, totalling 5% of the payments, while they accounted for 10% of the
farmed acreage.
Implementation of the Rural Development Plan. Rural development has an important
place in the Austrian portfolio of farm policies.4 The share of rural development
expenditure in the budget amounts to 58% (including federal and subnational
contributions), as compared to 14% in the EU agricultural budget (which excludes national
co-finance). Within the framework of the second pillar of the CAP a total of EUR 995 million
was paid to 141 847 holdings and a total of EUR 57 million was paid to other applicants.
133 096 enterprises with a utilized agricultural area of 2.25 million hectares (without alpine
pastures) participated in the Agri-Environmental Programme (ÖPUL).
ÖPUL is subsumed under the Rural Development Agenda since 2000. All rural
development expenditures are co-financed by the EU. In addition to ÖPUL the measures
comprise less-favoured area payments, agricultural investment programmes, start-up
subsidies, processing and marketing premiums, payments to foster the adaptation and
development of rural areas, education programmes and forestry programmes. The rural
development programme for the new period of implementation 2007-13 has been
completed and submitted to the European Commission; the launching of the programme
is planned for 2007.
Within the 2005 tax reform, the sparkling wine tax (1.08 EUR/bottle) was abolished and
a refund of petroleum tax for agriculture was introduced. Amendments of the milk
quantity regulation (BGBl II Nr 240/2005) contained some crucial modifications concerning
AGRICULTURAL POLICIES IN OECD COUNTRIES: MONITORING AND EVALUATION 2007 – ISBN 978-92-64-02746-6 – © OECD 2007116
II.6. EUROPEAN UNION
restrictions on the partial leasing of milk quota and the introduction of a tighter notification
period for quota transfer. The milk quota allocation regulation (BGBl. II Nr 102/2006) described
the allocation of additional quota stipulated in the Agenda 2000 and CAP reform 2003
(linear allocation in three steps). Some minor changes were made in the wine law
(minimum charges for vintage inspections, changes of wine regions), fertiliser law, health
law and food safety law (adoption of charges).
Change in national budget expenditures. National expenditures for Austria’s agriculture
and forestry amounted to EUR 99 million in 2005, an increase of 7% compared to 2004. This
increase is due to budgetary technicalities resulting from the coincidence of animal
premiums paid out for the last time in February 2005 and the single payments paid out for
the first time in December 2005. Another reason for the increased budget was the
scheduled rise of the milk premiums. For 2006, a budget increase of 3% was projected. Of
the total expenditures, 59% was financed by the European Union, 20% by the federal
government, and 21% by the federal states. In Austria, 42% of the funds are allocated to the
first pillar of the Common Agricultural Policy (basically the single payment, area, animal
and product premiums) and the remainder to the second pillar (rural development).
Changes in regulations and institutions. The adaptation of agricultural laws came into
force at the beginning of 2005 and led to a number of changes in the agricultural research-
and training infrastructure. The Bundesamt und Forschungszentrum für Wald (BFW) is now
subdivided into a “Federal research and training centre for forests, natural risks and
landscape” and a “Federal forest authority”, which is bestowed with the status of a public
institution as of January 2005. The Federal Institute for Alpine Agriculture was merged with
the Alpine Agricultural College to form the Higher Research and Training Institute
Raumberg-Gumpenstein. Similarly the Federal institute for agricultural technology will
merge with the Agricultural College Franzisco Josephinum.
BelgiumImplementation of the Single Payment Scheme. The Single Payment Scheme was
introduced in 2005 in both the Flemish and Walloon regions, based on farm level historical
entitlements in 2000-02. Both regions have chosen to include all the payments for cereals,
oilseeds and protein crops in the single payment, as well as most livestock payments. In
both regions, dairy payments were integrated into the single payment in 2006. In the
Flemish region, the suckler cow premium, the calf slaughter premium and payments for
linseed and spelt remain commodity-specific. In the Walloon region, the suckler cow
premium and payments for linseed and spelt remain commodity-specific.
Implementation of the Rural Development Plan. Three Rural Development Plans are
implemented in Belgium: one for the Flemish region, one for the Walloon region, and a
third one at the federal level. The Wallon government programme focuses on the
improvement of agriculture profitability with measures in favour of young farmers and
woman farmers and the creation of a fund designed to boost rural economic development.
The Flemish agricultural investment fund measure (Vlaams Landbouwinvesteringsfonds) was
modified by the Flemish government on 16 June 2006 with respect to support for
agricultural investments and establishing young farmers. The modification aims to better
adapt current investment to farmers needs and to seek a balance between demand for
investment support and available funding.
AGRICULTURAL POLICIES IN OECD COUNTRIES: MONITORING AND EVALUATION 2007 – ISBN 978-92-64-02746-6 – © OECD 2007 117
II.6. EUROPEAN UNION
A new planning programme for the 2007-13 period (PDPO II) was developed in Flanders
from 2005 and finalised in 2006, the previous programme having ended in 2006. The new
programme has three objectives:
● Developing the agricultural and forestry sectors competitiveness through support
measures for the development of physical capital and to encourage innovation as well as
production and commodity quality improvement.
● Enhancing the environment and rural land use planning through support measures for
a sustainable use of agricultural and forested lands.
● Improving the quality of life in rural areas, and encouraging the diversification of the
rural economy.
Other changes in national policies. Organic farming remains a key element of
agricultural policy and, from 2006 onwards, the Flemish government has attempted to
simplify the per hectare premium system, in order to make it more accessible to farmers
who want to convert to organic farming. The Flemish government has approved a subsidy
of around EUR 460 000 for an organic food promotion campaign by the Flemish Centre for
Agricultural and Fisheries Marketing (VLAM). The three-year campaign, amounting to a
total of EUR 1.5 million, aims to boost consumption of organic products in the region and
therefore to promote the expansion of organic farming.
The Flemish poultry sector lost an estimated EUR 60 million at the beginning of 2006
due to avian influenza. The Flemish agriculture minister has allocated EUR 300 000 to fund
a promotion campaign for poultrymeat. Poultry farms recording losses following the
outbreak of avian influenza in the autumn of 2005 and the spring of 2006 will be given
compensation. Payment started in February 2007.
In accordance with the sustainable development objective, the Wallon authorities
have undertaken the promotion of renewable energy, particularly agricultural renewable
energy: promotion of energy crops, feasibility study for the location of biofuel plants,
support for investment. At the same time, the Flemish government made big efforts for the
promotion of fuel crops, and premiums of 45 EUR/ha are granted for the production of fuel
crops.
Change in national budget expenditures. Agricultural budgetary expenditure for 2005,
excluding EU payments, was EUR 234 million, a 3% increase from 2004.
Changes in regulations and institutions. The Flemish government adopted the
legislation relating to the implementation, from 1 April 2006, of the new structure for the
Agriculture and Fisheries Department, which is responsible for the formulation and
delivery of agricultural policy in Flanders. The Department is made up of four divisions:
● Agricultural and fisheries policy (ALVB).
● Sustainable agriculture development (ADLO).
● Monitoring and studies (AMS).
● Management support service (MOD).
The work of the Agriculture and Fisheries Department is complemented by the
following institutions:
● An independent agency for agriculture and fisheries (ALV).
● An agricultural and fisheries research institute (ILVO).
● The Flemish centre for agricultural and fisheries marketing (VLAM).
AGRICULTURAL POLICIES IN OECD COUNTRIES: MONITORING AND EVALUATION 2007 – ISBN 978-92-64-02746-6 – © OECD 2007118
II.6. EUROPEAN UNION
Czech RepublicImplementation of the single payment. From 2004, the Czech Republic (CR) opted for a
Simplified Area Payment Scheme (SAPS) with a flat rate per hectare of all agricultural land.
These payments were set at 30% of payments to the EU15 in 2005 and increased to 35% in
2006. In 2005 and 2006, Complementary National Direct Payments (“top-ups”) were paid per
hectare for selected arable crops (grains, oilseeds, protein crops), hops, flax and per head
(livestock unit) of ruminants. In principle, the ceiling on top-up payments from the
national budget has been fixed at 30%. In 2005, the “top-up” payments were paid at the
level of 28.4%, and the total payment reached 58.4% of the EU15 level. In 2006, the “top-up”
payments were paid close to their ceiling level, allowing direct payments to be paid nearly
at the maximum 65% of the EU15 level.
Implementation of the Rural Development Plan and the Single Programming Document.Under the programmes implemented within the Horizontal Rural Development Plan (RDP)
in 2004-06, agri-environmental measures represented around half of the payments and,
together with payments to less-favoured areas (LFAs) (more than 40%), represent the bulk
of the RDP payments. Most of the agri-environmental payments were for extensive
livestock production on grassland (around 60% of AE payments) and for catch crops
production on arable land (around 30%). The payments to LFAs and areas with
environmental restrictions are made per hectare of grassland. Overall, more than 80% of
RDP payments are linked to grassland areas. The payments within the RDP plan were
financed from EU funds at a rate of 80%.
Other projects co-financed from EU funds include programmes providing investment
support to farming. After accession the Special Accession Programme for Agriculture and
Rural Development (SAPARD) was replaced by Special Programming Document funds
(Operational Programme – OP) set for 2004-06. Both SAPARD and OP projects focus mainly
on investments to agriculture, but also provide payments for the development of food
processing activities and infrastructure projects in rural areas.
Other changes in national policies. National programmes that have been maintained
since EU accession are mainly credit subsidies, fuel tax rebates and disaster payments. In
addition to the “top-up” payments mentioned above, national funding is used to finance
the maintenance of the genetic livestock and crop potential, prevention of the spread of
livestock and crop diseases. National funding also provided support for the renewal of
vineyards, hop-gardens and orchards.
Change in national budget expenditures. The total amount of national payments
(including those co-financing the EU programmes) increased in 2005 by 13% over 2004 to
reach CZK 12.4 billion (EUR 418 million) and remained around that level in 2006.
Changes in regulations and institutions. Apart from the consolidation of the
institutions administering the CAP, there were no major changes in regulations and
institutions in 2005 and 2006.
DenmarkSector-wide policy initiatives. A new food policy was implemented in 2006 to promote
food safety and ensure quality nutrition. This policy focuses on making such food available
to the general public, ensuring transparency through sufficient labelling of foods,
delineating the responsibilities of the producer, government and retailers, as well as
providing a framework for food and veterinary research.
AGRICULTURAL POLICIES IN OECD COUNTRIES: MONITORING AND EVALUATION 2007 – ISBN 978-92-64-02746-6 – © OECD 2007 119
II.6. EUROPEAN UNION
In 2006, legislation covering farms with livestock production was reformed to facilitate
the localization and expansion of farms and to reduce pressure on the price of agricultural
land. According to the so-called harmony-requirement, the area of a farm with livestock
production shall be large enough to allow for spreading part of the manure produced by the
livestock of that farm. For farms consisting of more than one holding, this requirement
previously have been met on the holding where the livestock was situated. Since the
reform, however, this requirement can be met with land from all holdings and the
minimum share of land to be owned by the farmer to fulfil the requirement was reduced.
Finally, the existing upper limit of 750 animal units for a farm is to be raised to 950 animals
units, provided supplementary requirements on animal welfare are met.
Implementation of the Single Payment Scheme. The Single Payment Scheme was
implemented in Denmark in 2005 and was based on a combination of both the regional and
farm level models. This scheme was adjusted following the reform of the common market
organisation for sugar in 2006 to compensate for the price reduction in sugar beet. For 2006
and 2007, compensation is allocated as a flat rate increase of all payment entitlements. As
of 2008, part of the compensation will be reallocated as a “sugar top-up” to the
entitlements of farmers growing sugar beet, the calculation of which will be based on the
farmers’ delivery rights of sugar beet for production of quota sugar in 2006.
Implementation of the Rural Development Plan. The total support for rural development
amounted to DKK 610 million (EUR 82 million) in 2005 and approximately DKK 1 030 million
(EUR 138 million) in 2006, including the EU contribution. The rural development plan for
2000-06 covers a large number of measures, including support to encourage
environmentally sustainable farming, organic farming and planting of shelter belts. The
emphasis is on agri-environmental measures. The total budget for this period is
approximately DKK 5.4 billion (EUR 0.7 billion). For 2006, a number of amendments were
made to the plan, including support to the training of rural district advisors, extension
services to farmers on cross compliance, and investment and demonstration of new farm
technologies.
In 2005 and 2006, extensive planning of the Danish implementation of the new rural
development programme for the period 2007-13 was undertaken. The main objectives of
the draft rural development strategy is to promote entrepreneurship and new places of
work in rural areas, to improve the competitiveness of agriculture and forestry, to diversify
rural landscapes, nature and the environment, as well as to improve the conditions of life
in rural areas. The measures needed to undertake these objectives are specified in the draft
programme and the total budget that has been allocated for this period is approximately
DKK 6.2 billion (EUR 0.8 billion). It is expected that for 2007-08, about 25% will be spent on
the development of agriculture; about 55% on nature and environment and about 20% on
quality of life in rural areas.
Change in national budget expenditures. The total agricultural support budget for 2006
(including EU payments) was around DKK 10.2 billion (EUR 1.4 billion) in 2006, which is 4%
above the 2005 level. From 2004 to 2005, total support fell by 5%. EU payments accounted
for 90% of the budget.
Changes in regulation and institutions. In Denmark, from 1 January 2007, a major
reform of the municipal structure has taken effect. The new larger municipalities assume
a number of responsibilities from the former counties including administration of
regulations on nature protection, environment and physical planning. Approval in respect
AGRICULTURAL POLICIES IN OECD COUNTRIES: MONITORING AND EVALUATION 2007 – ISBN 978-92-64-02746-6 – © OECD 2007120
II.6. EUROPEAN UNION
of Environmental Impact Assessments, nature and water protection, and odour was
combined into a single administration in the new municipalities. At the same time the
regulation of livestock production was simplified and all concerns with respect to
Environmental Impact Assessments (EIA), nature and water protection, odours, etc. are
now dealt with by a single administration in the new municipalities. The new regulation
incorporates all changes, extensions and establishment of new livestock farms with more
than 75 animal units.
From 1 January 2007, a major reform of the Danish university and research sector also
occurred. This reform seeks to enhance the synergies and the impact of Danish research by
creating three large universities by merging existing universities and government research
institutions. As part of this reform, the Institute of Agricultural Sciences and the Danish
National Environmental Research Institute were merged with the University of Aarhus; the
Danish Institute for Food and Veterinary Research and the Danish Institute for Fisheries
Research were merged with the Technical University of Denmark; and the Royal Veterinary
and Agricultural University has been merged with the University of Copenhagen. To
coordinate food research, a National Food Forum has been established.
FinlandImplementation of the Single Payment Scheme. The Single Payment Scheme adopted in
the context of the 2003 CAP reform was introduced in Finland in 2006. CAP support remains
commodity-specific mainly for suckler cows, male bovines, ewes and starch potato, while
support for arable crops was almost completely included in the single payment as of 2006.
Overall, about 93% of CAP payments are granted through the single payment in Finland.
The Single Payment Scheme is implemented on the basis of a hybrid model consisting
of a regional flat-rate payment and farm-specific top-ups. Farm level top-ups are based on
farmers’ historical entitlement to 69% of the dairy payments, 30% of the male bovine
premiums, and 16% of starch potato aid. These farm-level top-ups will stay at the same
level until 2010 and then gradually decrease and be incorporated into the flat rate regional
payments by 2016. Gradually decreasing farm-level top-up is also paid to sugar beet
growers until 2019. The value of payment entitlements were established at the end of 2006.
Cross-compliance conditions attached to CAP support are being introduced gradually
between 2005-07. In addition to cross compliance, Finland has decided nationally that if a
farmer sets aside more than the mandatory area, this unused arable area must be under
grass (perennial green fallow) to be eligible for CAP support. The funds released through
the modulation of direct payments are allocated to agri-environmental support.
Implementation of the Rural Development Plan. Payments are provided under the
Continental Horizontal Rural Development Programme 2000-06, Regional Rural
Development Programme 2000-06 outside Objective 1 regions for Continental Finland and
for the Rural Development Programme of Åland Islands 2000-06. The most important
categories are compensation to less-favoured areas (LFAs) and agri-environmental support
which represented 43% and 30% of RDP expenditure in 2005, respectively. The EU
contribution is about 31% of LFA and 42% of the agri-environmental support and the rest is
paid from national funds. In addition to the EU co-financed LFA and agri-environmental
support, Finland provides national supplements (top-ups) for both LFA and agri-
environmental support and these top-ups are fully financed by the national budget. Taking
AGRICULTURAL POLICIES IN OECD COUNTRIES: MONITORING AND EVALUATION 2007 – ISBN 978-92-64-02746-6 – © OECD 2007 121
II.6. EUROPEAN UNION
into account national supplements, LFA compensation amounted to EUR 543 million and
agri-environmental support EUR 348 million.
The key emphasis of the agri-environmental support is on water protection, but
measures also aim to limit air pollution, reduce pesticide risks and promote conservation
of biodiversity and cultural landscapes. The agri-environmental scheme consists of
mandatory basic and additional measures and special measures. The basic and additional
measures cover 94% of farmers and 98% of the arable area. Expenditure on the basic and
additional measures totalled EUR 254 million in 2005 while expenditure on special
measures amounted to EUR 40 million (of which organic production EUR 17 million). The
rural development funding has been cut in the context of the new EU financial frameworks
for 2007-13 and in Finland this has led to a reduction in rural development funding of about
EUR 100 million/year. The new financial framework also cut the regional and structural
policy support for Finland by about 25%.
Change in national budget expenditures. National support paid in Finland consists of
three main parts: northern aid, national aid for southern Finland, and national
supplements to LFA and agri-environmental support. The national support totalled
EUR 609 million in 2005 and EUR 614 in 2006. A national supplement to LFA compensation
was introduced in 2005 (total of EUR 120 million) with the constraint that the total amount
of co-financed LFA and national supplement may not exceed an average of EUR 250 per
hectare.
FranceSector-wide policy initiatives. A law on the development of rural areas was adopted in
February 2005. In addition to economic development, employment, housing and services,
the law includes measures related to land zoning in peri-urban areas, land consolidation,
and the sustainable management of private forests, wetlands (through fiscal measures)
and Natura 2000 sites. Specific attention is given to mountainous areas. In January 2006, it
was complemented by a new agricultural Framework Law, which aims to:
● Update legislation applying to farm enterprises by modernising their legal status and
facilitating transmission; improving farmers’ working conditions and social protection;
and facilitating the use of hired labour.
● Maintain farm income by developing biofuels and bioproducts; strengthening the
economic organisation of the agri-food sector; and improving risk management.
● Better respond to societal and consumer concerns by improving food safety; promoting
food quality; and encouraging environmentally friendly farming practices.
● Develop regions by protecting all types of agricultural land; ensuring the sustainability of
farming in mountainous areas; and improving the performance of forestry.
● Modernise the institutional environment of agriculture.
Specific measures under this law include simplification of farm business registration,
a requirement that rural leases must have been held for at least three years before they can
be transferred outside the farmer’s family, improvement of social security cover for
spouses, provisions allowing farmers who have contributed to the general pension regime
to benefit from the special provisions of farm pensions, extension of crop insurance, a tax
rebate for labour replacement costs, and provisions to support the installation of young
farmers and the transmission of farms between generations. These include interest
AGRICULTURAL POLICIES IN OECD COUNTRIES: MONITORING AND EVALUATION 2007 – ISBN 978-92-64-02746-6 – © OECD 2007122
II.6. EUROPEAN UNION
concessions on loans, and the possibility for young farmers, to spread some of the cost of
farm acquisition over time.
Implementation of the Single Payment Scheme. As planned, the single payment was
implemented in 2006 based on farm level historical entitlements in 2000-02. It included the
dairy and sugar payments from the start. Farm entitlements were established in October
2005 and applications were made in May 2006. Due to exceptional climatic circumstances,
advance payments totalling EUR 2.77 billion were made in October 2006. On 1 December
2006, farmers received, as planned, the reminder of the SFP. In total, the single payment
amounted to EUR 5.28 billion. In addition, farmers received EUR 1.10 billion in area and
headage payments linked to commodity production, which France had opted to maintain
at the following rates: 25% of arable crop and hop payments; 50% of the sheep premium,
100% of the suckler cow premium, 100% of the calf slaughter premium and 40% of the adult
cattle slaughter premium, as well as 100% of payments to all products in overseas
territories.
By October 2006, there had been over 300 000 transfers of single payment
entitlements, covering a total of 4.5 million hectares, to reflect changes in land holding.
Mechanisms to allocate the national reserve of single payment entitlements were put in
place. Priority is given to new entrants and individual imbalances resulting from the
reform are then addressed. A complementary, national programme to allocate
entitlements from the reserve was introduced at the end of 2006. The Minister of
Agriculture decided that initially, the national reserve would be funded by a 2.2% levy. In
May 2006, the Minister of Agriculture decided to reduce single payment entitlements of
farmers, who did not activate their entitlements in 2006, by the amount of the unused
entitlements.
Implementation of the national Rural Development Plan. The implementation of the
French Rural Development Plan 2000-06 continued. In 2005, close to 30% of national
expenditures were allocated to less-favoured area payments, and close to one-quarter to
agri-environmental payments, among which the environmental grass premium.
Assistance to investments in agricultural holdings and setting up of young farmers made
up around 15% of national expenditures under the RDP. In addition, around
EUR 310 million were granted to assistance to the development of rural areas through
single programming documents for objective 2 areas.
In October 2006, the government announced the new national programming plan for
the implementation of rural development measures covering the period 2007-13. Funds
allocated to this programme will amount to EUR 13 billion, of which EUR 6.4 billion will
come from the EU budget (compared to EUR 13.8 billion, of which EUR 6.7 billion from EU
funds in the 2000-06 programming plan). The focus of the 2007-13 plan is on the
regionalization of management (50% of funds will be managed by regions), simplification
in terms of the number of measures and procedures, and consensus building.
In September 2006, a crop plan for the environment was introduced, with government
funding of EUR 20 million, including 50% from the EU, which can be complemented by
regional funds. It will form part of the national rural development plan being drawn up for
2007-13. As the plan for the improvement of livestock buildings does for livestock farmers,
the crop plan provides investment assistance to help crop farmers adjust to environmental
regulations. The main objectives of the plan are the reduction of pollution from fertilisers
and chemicals, the reduction of water use, and better protection from soil erosion. Regional
AGRICULTURAL POLICIES IN OECD COUNTRIES: MONITORING AND EVALUATION 2007 – ISBN 978-92-64-02746-6 – © OECD 2007 123
II.6. EUROPEAN UNION
priorities will be defined in consultation with all actors in the region. As of 2007, the plan
will also focus on energy savings in greenhouses and plant biodiversity. Already in 2006,
the government contribution to energy saving investments was raised from 22 to 35% for
farmers that are members of a producer group (from 25 to 40% for young farmers).
Other changes in national policies with a direct budgetary impact. Within the framework
of the reform of the Common Organization of the market for sugar, France is authorized to
grant national aids in oversees departments within a maximum limit of EUR 90 million per
annum. In 2006, the government set aside an extra EUR 10 million to aid consolidation and
restructuring in the dairy industry. Within the strategic plan launched in 2004 to
modernize the dairy sector, the government allocated EUR 25 million in 2005 to help
producers who left the dairy sector and to facilitate the reallocation of milk production
quota thus released to producers entering dairy production or wishing to develop their
dairy activity in a sustainable way in the long term.
A number of measures were taken to respond to the crisis that is affecting the wine
sector. They include interest concessions to producers and cooperatives, (EUR 49 million),
assistance to investments (EUR 5 million) and promotion for enterprises (EUR 12 million),
cash flow assistance to producers (EUR 15 million), and reductions in social security
contributions (EUR 6 million). Various tax rebates and delays in social contribution
payments were also granted to producers. The EU Commission has allowed France to distill
1.3 million hectolitres of drinkable alcohol. In addition, the EU Wine Management
Committee had agreed to allow France to convert up to 1.5 million hectolitres of table wine
and 1.1 million hectolitres of quality wine into bio-ethanol, as part of the crisis distillation
scheme.
A plan to support fruit and vegetable producers was announced in late 2005. Funds
granted in 2006 amounted to EUR 15 million for exceptional measures to support income of
farmers most affected by the crisis in the sector and EUR 25 million for interest
concessions to modernize orchards, manage supply, support producer groups and for
marketing and promotion actions. In March 2006, a new strategic plan was announced
with a further EUR 40 million in payments and EUR 25 million in interest concessions on
loans to facilitate consolidation.
A crop insurance scheme was introduced in 2005 to help farmers insure either
individual crops, or the whole farm. The government subsidizes 35% of premiums (40% for
young farmers). Government expenditures for this scheme amounted to EUR 20 million in
2005. In summer of both 2005 and 2006, farmers in regions affected by drought were
allowed to use set-aside land for livestock grazing and fodder harvesting. This measure
was applied to most of the regions (departments) in 2005 and in 2006.
Avian influenza reached France at the end of 2005 and the country was cleared of the
disease in June 2006. An initial aid package for the poultry sector amounted
EUR 63.5 million. It includes an information campaign to promote poultrymeat,
compensation of income losses registered between November 2005 and April 2006 for
producers specialized in poultry production, interest concessions, reductions in social
security contributions, and extra support for label producers. Of these EUR 63.5 million,
EUR 30 million were allocated to slaughterers and processors to compensate them for the
income losses they incurred when forced to reduce their activity during the crisis. A
complementary support plan was announced in September 2006. Broiler producers will
receive aid in proportion to their losses and without ceiling, with co-financing from the EU,
AGRICULTURAL POLICIES IN OECD COUNTRIES: MONITORING AND EVALUATION 2007 – ISBN 978-92-64-02746-6 – © OECD 2007124
II.6. EUROPEAN UNION
on top of the EUR 1 000 per farm advance payments they received under the first plan.
Hatcheries and genetic selection businesses will receive additional compensation for the
destruction of eggs and breeding flocks, over and above the maximum of EUR 150 000 that
they have been able to claim under the first plan.
At the end of 2006, the government took or announced measures to support livestock
producers experiencing the most difficulty following outbreaks of bluetongue disease,
which affects ruminants. They include reductions and delays for social security
contributions, partial interest concessions (EUR 1 million allocated), payments for keeping
animals, that would otherwise have been killed, on farms (within a budget of
EUR 1.5 million) and payments to compensate for income losses due to market
disturbances, limited to EUR 3 000 per farm, with a total budget of EUR 7.5 million. In
addition, costs of tests, analysis and veterinary visits were partially reimbursed.
In addition to traditional fuel tax rebates, farmers were reimbursed for part of the tax
on domestic fuel and natural gas until the end of 2005. These rebates amounted to
EUR 1 030 million in 2005.
A new plan for biofuel production was announced in September 2004 and reinforced
in September 2005. Targets have been set by law in January 2006 as follows: biofuels should
be incorporated into fuels at a rate of 5.75% by 2008, 7% in 2010 and 10% in 2015. To reach
these targets, an incentive tax system based on two main instruments has been
implemented. The first instrument is a fuel tax rebate which is granted to eligible
production of bio-ethanol and bio-diesel. The tax rebate (calculated in EUR per litre of
biofuel) should amount to around EUR 275 million in 2006 and around EUR 900 million in
2008 (if the reduction rate per litre remains the same). The second instrument is an
“additional tax” (Taxe Générale sur les Activités Polluantes – TGAP) which is paid by the
suppliers that do not comply with the national targets set by the law. This additional tax
acts as a penalty for the fuel suppliers who do not incorporate enough biofuels into road
fuels. Therefore, the aim is to incorporate into fuels around 0.65 million tonnes of bio-ethanol
and 2.1 million tonnes of bio-diesel by 2008 and around 0.75 million tonnes of bio-ethanol and
2.8 million tonnes of bio-diesel by 2010. Diesel consumption dominates (two-thirds) total
road fuel consumption in France.
In the new Agricultural Framework Law, measures to boost organic farming were
announced. A tax rebate is offered to farmers who earn 40% of their income from organic
farming. This will be worth up to EUR 2 000 over three years, and was expected to cost a
total of EUR 15 million in 2006. Farmers are also able to discount their conversion years
when calculating historic reference amounts for the single payment.
Change in national budget expenditures: National expenditures on agriculture
increased by 5% in 2005 compared to 2004, and decreased by 7% in 2006, reflecting
variations in fuel tax rebates. National expenditures other than these rebates decreased by
8% in 2005 and were stable in 2006.
Changes in regulations and institutions. As part of efforts towards administrative
simplification, a number of measures (100 by March 2007) were taken from February 2006.
They include a reduction of control time, advance payments for controlled farms,
simplified application forms, pre-filled forms accessible online forms and information
available on the Internet, and sharing of information between administrations.
A law for the creation of private limited dairy companies (sociétés civiles laitières) was
introduced in November 2005. According to this law, milk quotas can be transferred,
AGRICULTURAL POLICIES IN OECD COUNTRIES: MONITORING AND EVALUATION 2007 – ISBN 978-92-64-02746-6 – © OECD 2007 125
II.6. EUROPEAN UNION
without charge, to a company whose object is to pool the milk production activities of the
partners without transferring the corresponding land. This law will allow producers to
make common investments and share work constraints and risks.
The public rendering service was re-organised to clarify responsibilities, increase
transparency and reduce costs. Direct contracting and auctioning were developed.
Government funding for the service will remain at EUR 44 million per year, covering a
quarter of total costs.
GermanySector-wide policy initiatives. The promotion of organic farming and focus on
renewable resources for energy production and industrial purposes has received much
attention in recent years. Around EUR 20 million was spent on the Federal Organic Farming
Scheme in both 2005 and 2006. This scheme includes a variety of measures at all levels of
the food chain, such as training, information, advisory activities, supporting research and
development projects, and technology transfers. In order to promote sustainable growth in
the sector, payments to producers for the introduction and maintenance of organic
production were continued and use of the German eco-label on a voluntary basis has
steadily increased. Support options for further ecologically sound and animal-welfare
oriented methods have been continued within the framework of agri-environmental
support under the Joint Task for the Improvement of Agricultural Structures and Coastal
Protection (GAK).
The production of energy and raw materials derived from agriculture for industrial
production has steadily become an additional source of income in the agriculture and
forestry sectors. The area devoted to renewable resources from agriculture has doubled
since 2003, to 1.6 million hectares in 2006 which represents about 13% of the total crop
area. Measures for the promotion of research, development and demonstration projects as
well as marketing measures in the area of renewable resources from agriculture accounted
for EUR 52.2 million in 2006. A law was passed in October 2006 to oblige firms in the mineral
oil economy to use a minimum quota of biofuels as of January 2007 onward. The firm-
specific and tradable biofuel quota will be increased over time and the biofuels used under
the quota can no longer benefit from tax exemptions that were granted previously.
Implementation of the Single Payment Scheme. Germany introduced the Single Payment
Scheme in 2005, based on a hybrid model combining elements of the first model (when
direct payments were granted according to farm specific payments in the reference period
2000-02) and a regional model (a uniform payment per hectare in a region derived from
total payments to the region in the past and the share of the region in the total eligible
area). In 2006, dairy payments were combined into a single payment, using the quota
holding on 31 March 2005 as a reference. Germany opted for full decoupling with the
exception of payments for hops (25%) and tobacco (60%) which will remain product-
specific until 2009. New and stricter cross-compliance restrictions came into force in 2006.
All payment entitlements will be gradually transformed so that by 2013 there will be a
uniform payment rate in each region.
Payment entitlements are tradable and transferable, but with some restrictions.
Entitlements can only be activated if the corresponding acreage is situated in the same
region in which payment entitlement was granted. Hence, a producer cannot buy
entitlements in one region and utilize them in another region. There is a national reserve
AGRICULTURAL POLICIES IN OECD COUNTRIES: MONITORING AND EVALUATION 2007 – ISBN 978-92-64-02746-6 – © OECD 2007126
II.6. EUROPEAN UNION
of entitlements that serves to accommodate both the need of farmers in specific situations
and new entrants into the farming sector. Germany has set up a nationwide registration
and monitoring system (InVeKos) that links payment entitlements to individual
entrepreneurs.
In 2005, Germany granted payments to 383 690 farmers for a total of EUR 4.96 billion.
In 2006, the national ceiling for Germany for the single payment was EUR 5.65 billion,
compared to EUR 5.15 billion in 2005, and which was in line with Commission Regulation
(EC) No. 1156/2006. This increase is due to the inclusion of sugar and tobacco in the single
payment, to the last increase of the milk premium, and to the additional payment for milk
(for a total premium amount of 3.55 ct/kg). In total, about EUR 950 million was paid to
individual milk producers in 2006.
Implementation of the National Rural Development Plan. The GAK will continue to serve
as the national framework for rural development programmes of the Länder for the period
2007-13. In addition to the traditional measures in Axis 1 which seek to improve the
competitiveness of farmers (infrastructure, investment-aid, etc.) and the agri-
environmental schemes in Axis 2, new initiatives were taken in Axis 3 to promote
subregional approaches that are expected to be better suited to subregional needs. Special
schemes were introduced for the setting-up of cross-sectoral regional development-
strategies and their coordinated implementation steered by rural public-private
partnerships. The government imposes a bottom-up participation for the development
and implementation of this strategy. In so far as income-diversification-investments and
investments in rural infrastructure are concerned, top-ups are foreseen if the investments
can be integrated into the subregional development strategy.
Change in national budget expenditures. The 2006 agricultural budget of the federal
government, excluding EU contributions and expenditures by the Länder, amounted to
EUR 5.1 billion, the same level as in 2005. As in previous years, social policy in agriculture
accounted for the largest share, almost three-quarters (about EUR 3.8 billion). In 2006,
about EUR 612 million were earmarked for the GAK programme, the most important
federal measure supporting structural change and development in rural areas. These
federal expenditures were co-financed by the Länder so that the GAK spent EUR 1 billion on
measures such as investment aids (about 25% of GAK expenditure), improvement of
agricultural structures (34%), sustainable agriculture (less-favoured areas and agri-
environmental measures, together covering 24% of GAK expenditure).
Changes in regulations and institutions. Germany is authorized by the European
Commission to employ a special clause in the nitrate directive to allow on a case-by-casebasis the application of manure up to a maximum quantity of 230kg nitrogen/ha instead of
the usual maximum standard of 170 kg/ha, This possibility is limited to intensively used
grassland and allows a better recycling of on farm nutrients.
In January 2007, the Animal Breeding Law was thoroughly revised with the aim to
simplify cross-border trade in animal semen. The former governmental task of rating
breeding results and performance monitoring in animal breeding was privatised. To
conserve biological diversity a periodical monitoring of animal genetic resources was
introduced.
AGRICULTURAL POLICIES IN OECD COUNTRIES: MONITORING AND EVALUATION 2007 – ISBN 978-92-64-02746-6 – © OECD 2007 127
II.6. EUROPEAN UNION
GreeceImplementation of the Single Payment Scheme. Implementation of the Single Payment
Scheme in the 2003 CAP reform began in January 2006 based on farm level historical
entitlements in 2000-02. Core elements are: full decoupling of direct payments for the
majority of products; the introduction of new cross-compliance measures; and mandatory
retention of up to 10% of the single payment to encourage specific sectors of importance in
the areas of environment, quality production and marketing. The inter-ministerial Acts
which provide the national legal framework for the implementation of the CAP reform
were signed in 2005.
Greece opted for full integration of support in the single payment for all products
except for seeds, which remain fully specific to commodity production and cotton, where
35% of the payment remains in the form of a commodity specific area payment. For cotton,
payments can be granted to a maximum area of 370 000 hectares. Both farming
organisations (farmer groups and co-operatives) and individual farmers are eligible to
receive this support. The first 300 000 hectares are eligible for the cotton-specific payment
of EUR 594 per hectare and the remaining 70 000 hectares for EUR 343 per hectare. This is
equivalent to a weighted average of EUR 546 per hectare, or a total of EUR 202.2 million. If
the threshold acreage is exceeded, a payment policy is applied for acreage up to 70 000
hectares. The 65% of the support that is included in the single payment amounts to
EUR 967 per hectare, with total expenditure of EUR 367.4 million. A roster of farmers
qualified for support with no link to commodity production, known in Greece as the “List
of Cotton Producers’ Rights”, has been established by the government. If the eligible area
planted with cotton exceeds the maximum area limit, the per-hectare payment will be
reduced proportionally. Provisional estimates for 2006 suggest that the area planted
exceeds the threshold.
In conformity with Article 69 of Regulation (EC) No. 1782/2003, which allows member
states to provide an additional payment for specific types of farming important for the
protection or enhancement of the environment or for improving the quality and marketing
of agricultural products, Greece decided on the following retention rates: 10% of support for
arable crops, sugar and beef; 5% for sheep and goats; 4% for olive oil; and 2% for tobacco (to
be used for investment on premium quality produce); in addition, for olive oil, 2% will be
retained for the funding of working programmes established by producer organisations
and 3% for pest management.
Cross-compliance conditions for receiving payments have been applied gradually over
the 2005-07 period. Requirements for maintaining land in good agricultural and
environmental condition and the identification of animals were introduced in 2005, while
conditions for maintaining plant and animal health, notification of diseases and food
safety issues were introduced in 2006.
Concerning the establishment of statutory management requirements (SMRs)
(Annex III of Regulation [(EC) No. 1782/2003]), which require compliance with a number of
articles from 19 pre-existing EU directives and regulations, the requirements adopted
include protection of groundwater, sewage sludge, conservation of natural habitats, wild
flora and fauna, protection of water from pollution caused by nitrates originating from
agricultural sources, public and animal health, and identification and registration of bovine
and caprine animals. To comply with the EU Nitrate Directive, action programmes relating
to vulnerable zones were established with rules relating to periods when the application of
AGRICULTURAL POLICIES IN OECD COUNTRIES: MONITORING AND EVALUATION 2007 – ISBN 978-92-64-02746-6 – © OECD 2007128
II.6. EUROPEAN UNION
certain types of fertiliser is prohibited. The list of approved pesticides was completed and
made available on the Internet.
Greece has implemented measures for virtually all of the standards concerning the
minimum requirements that are aimed at avoiding the abandonment of agricultural land
and ensuring that all agricultural land is maintained in good agricultural and
environmental condition (GAECs) (Annex IV of Regulation [EC] No. 1782/2003). In particular,
measures were established to avoid soil run-off on sloping lands, to improve post-harvest
management of land, to ensure crop rotation and appropriate use of machinery, minimum
livestock densities, protection of hedgerows and permanent pasture, and prevention of the
encroachment of unwanted vegetation on agricultural land.
For the requirement concerning measures designed to ensure maintenance of
permanent pastures at the 2003 level, Greece has established maximum and minimum
grazing densities to prevent abandonment in mountainous and less-favoured areas and to
protect permanent pastures in mountainous areas and islands from overgrazing and
degradation. Grazing density in Greece is calculated on a livestock unit per hectare basis.
Control committees of the Prefecture Authorities monitor SMR and GAEC standards.
Only those farms that have been pre-selected according to the EU’s Integrated
Administration and Control System (IACS) criteria for the eligibility controls (such as size
of payments, number of plots and animals, size of farms and former non-compliance) are
checked. The severity of penalty, imposed by the national payment agency, is based on the
relevant EU regulation.
A farm advisory system has been established and came into operation on 1 January
2007, as stipulated by EU regulations. Its principle aim is to assist farmers in the
implementation of cross-compliance requirements and, in addition, to increase farmers’
awareness of on-farm processes relating to the environment, food safety and animal
health. The system is run by private geotechnical scientists and the Geotechnical Chamber
and is under the responsibility of the Ministry of Rural Development and Food. Financial
support up to a maximum level of 80% of the farmers’ cost, but not exceeding EUR 1 500 per
year will be granted annually from the rural development programme. Funding for farmers
wishing to employ an advisory service is estimated at around EUR 30 million per year, 25%
of which consists of national funding. The estimated cost of setting up the system is
EUR 1.5 billion.
Implementation of the Rural Development Plan. For 2006, rural development
expenditures are provisionally estimated at EUR 652 million, 38% of which was financed
from the national budget. About 46% of the payments financed by the national budget were
allocated to less-favoured areas, and another 24% for early retirement. A proposal to
include livestock producers in the early retirement scheme, estimated to cost
EUR 40 million, was announced in 2006. As at the end of 2006, 57.3% (or EUR 1.2 billion) for
the national funds of the horizontal rural development programme 2000-06 had been
disbursed. Under Axis 3 of the programme, owners of olive groves and vineyards in two
areas in central Greece will be eligible for EUR 90 per hectare payments if they comply with
certain traditional farming practices. A task force has been formed for the finalisation and
fine-tuning of the 2007-13 Rural Development Plan.
Other changes in national policies. In April 2005, due to major wine stock surpluses, the
European Commission, at the request of the Greek government, allowed crisis distillation
measures to come into effect for certain types of wine, which included financial support
AGRICULTURAL POLICIES IN OECD COUNTRIES: MONITORING AND EVALUATION 2007 – ISBN 978-92-64-02746-6 – © OECD 2007 129
II.6. EUROPEAN UNION
for the distillation of 340 000 hectolitres of table wine and 40 000 hectolitres of quality
wines produced in specific regions. Similar measures were approved by the European
Commission also for 2006. Payments for processing figs almost doubled in 2005, from
EUR 139 to EUR 258.6 per tonne. Farmers’ pensions are to be increased by EUR 50 per month
and, as of January 2007, the minimum pension is to be set at EUR 280 per month.
The EU regulation introducing specific measures in favour of certain agricultural
products from the smaller Aegean islands was amended by the EU Council of Agriculture
Ministers in 2006. The amendment envisages the presentation by Greece of a programme
concerning the specific supply arrangements for those agricultural products essential in
the smaller Aegean islands (whether for human consumption, as agricultural inputs or for
processing) and support for local production. The programme, due to come into effect in
January 2007, will be fully financed by the EU and is estimated to cost EUR 24 million; the
amount to be allocated annually may not exceed EUR 5.5 million.
Payments for natural disasters amounted to EUR 536 million in 2004, EUR 260 million
in 2005, and EUR 421 million in 2006. An amount of EUR 22 million was paid from the
national budget to compensate producers from losses due to fires which occurred over the
March 2003-December 2005 period. A number of measures were adopted in 2005 to assist
livestock producers, including debt write-offs, increases of interest concessions to young
farmers up to 100%, 25% reduction of their insurance contributions and waiving of the
usual charge of a construction license.
As from 2005, farmers have been able to buy diesel fuel at subsidised prices
throughout the year. In 2006, diesel fuel tax concessions were estimated at around
EUR 11 million. A number of policies introduced in 2005-06 are aimed at encouraging the
production and domestic consumption of bioenergy. An update of the Greek Law 343/2005
forms the basis for the production of biofuels. Measures include support of 40% of the
capital costs for bio-diesel plants and tax exemptions when biofuels are produced on the
basis of contracts between farmers and production units. In accordance with European
Union regulations, 5.75% of fuels consumed in Greece will be biofuels by 2010.
Change in national budget expenditures. In 2006, total agricultural budgetary support to
agriculture is provisionally estimated to have increased slightly, to EUR 4.5 billion, of which
40% (EUR 1.8 billion) was financed by the national budget. Up to mid-December 2006,
payments of EUR 1 250 million (or 75% of the total SFP), had been made, benefiting
792 200 farmers (or 94.4% of total eligible farmers). Increasing emphasis is being given to
public investment for rural development, which has increased from EUR 430 million in
2002-03, to EUR 823 million in 2004-05, and which is estimated to reach EUR 479 million in
2006.
Changes in regulations and institutions. The relevant national laws concerning organic
farming have been updated to promote and facilitate the production of organic vegetable
and animal food products. The 4% retention of the SFP for organic olive oil and table olives
will take the form of payments up to EUR 65 per hectare. In 2006, compensation from
natural disasters for organic farming increased by 4%.
Greece was among the first European countries to detect H5N1 avian flu in wild swans
in February 2006, although no cases were detected in domestic poultry. The government
has provided loan guarantees to poultry businesses equivalent to EUR 40.8 million. The
total compensation to Greek poultry producers in 2006 is estimated at EUR 18.9 million,
AGRICULTURAL POLICIES IN OECD COUNTRIES: MONITORING AND EVALUATION 2007 – ISBN 978-92-64-02746-6 – © OECD 2007130
II.6. EUROPEAN UNION
50% of which will be financed by the EU. The implementation of the Emergency Action Plan
for the prevention of avian flu continues.
Complementary measures regarding geographical indications and protected
designation of origin olives and olive oil were adopted by the EU Council of Agriculture
Ministers in mid-2006. In October 2006, within the framework of the new EU regulation
regarding alcoholic drinks, the EU Council of Agriculture Ministers decided that the Greek
alcoholic drinks ouzo, tsipouro, tsikoudia and the Cypriot drink zivania, are protected
products within the EU.
HungaryImplementation of the single payment. The Single Area Payment Scheme (SAPS) was
implemented as of 2004. In accordance to the phasing in of the Single Payment Scheme,
these payments were set at 30% of payments to the EU15 in 2005 and increased to 35% in
2006. The total amount reached HUF 87 billion (EUR 351 million) and HUF 118 billion
(EUR 446 million) respectively.
Complementary National Direct Payments (“top-up”) were paid in the form of area
(arable crops) and headage (suckler cows, beef cattle, sheep and goat) payments. Top-up
payments were also paid per tonne of milk. The total value of the national “top-up”
payments was HUF 26 billion (EUR 105 million) in 2005 and increased more than three
times to reach HUF 90 billion (EUR 340 million) in 2006. The ceiling of “top-up” payments
from the national budget has been fixed at 30% of the payments to the EU15. However, in
2005 and 2006 these payments remained below this ceiling due to budgetary problems.
Implementation of the Rural Development Plan and the Single Programming Document.The EU Special Accession Programme for Agriculture and Rural Development (SAPARD)
ceased to exist as of May 2004. However, SAPARD funds were still used in 2005 and 2006 to
finance projects established before that date. The Rural Development Plan (RDP) and Single
Programming Document (SPD) programmes were set for the years 2004-06. Overall, the RDP
is worth EUR 754 million and the foreseen SPD spending is EUR 417 million for the period
2004-06. The rate of national co-funding was set at 20% for the RDP and 25% for SPD.
During 2005 and 2006, about EUR 400 million (HUF 100 billion) were spent to finance
the RDP programmes and EUR 273 million (HUF 70 billion) on SPD programmes (the
remaining sums to be spent in 2007). Most of the RDP payments were agri-environmental
in nature (Agricultural Environment Protection Programme). These payments represented
85% of RDP expenditures in 2005 and declined to 70% in 2006 as new RDP programmes were
implemented, such as the establishment of producer groups and technical assistance
programmes. The SPD funds financed mainly investments to agriculture and food and
marketing activities in order to improve the quality of production and meet EU quality
standards. From 2006, SPD payments were also used to finance investments in rural
infrastructure.
Other changes in national policies. Several national support programmes were
maintained following EU accession. In addition to the national top-ups to the Single Area
Payment, the most important programmes in terms of payments provided include credit
subsidies to loans for agriculture, support for on-farm afforestation, subsidised veterinary
costs, and breeding and genetic development. There were no major changes in these
policies in 2005 and 2006.
AGRICULTURAL POLICIES IN OECD COUNTRIES: MONITORING AND EVALUATION 2007 – ISBN 978-92-64-02746-6 – © OECD 2007 131
II.6. EUROPEAN UNION
Change in national budgetary expenditures. Changes in policies linked to EU accession,
together with national fiscal austerity, led to a reduction of payments from the national
budget in 2004 and 2005. The total amount of national payments in 2005 (including those
which co-financed the EU programmes) increased by one third compared to 2004, and
remained around that level in 2006 at HUF 175 billion (EUR 661 million).
Changes in regulations and institutions. Changes in regulations and institutions in 2005
and 2006 were mostly related to entry into the EU in May 2004, the adoption of the CAP, and
implementation of CAP mechanisms (market regulation, administration of payments) and
regulatory measures. At the end of 2006, Hungary adopted a new law allowing for
genetically modified (GM) plants to be planted, albeit subject to stringent conditions. Under
the new law, a 400-metre buffer zone must be established between GM crops and adjacent
fields in order to prevent cross-pollination. Written permission to plant GM crops is
required from all landowners within the buffer zone.
IrelandSector-wide policy initiatives. The Department of Agriculture and Food produced an
Action Plan in response to the report of the Agri Vision 2015 committee. The Plan sets out
the actions required by all actors, both public and private, to ensure the future success of
the sector. These actions are organised around five requirements:
● take full advantage of the freedom to farm exclusively for the market arising from the
decoupling of farm direct payments;
● focus on the requirements of the consumer at every stage in the value chain, especially
in ensuring the highest standards of food safety, quality as well as on the range and type
of product;
● continue, and accelerate the process of structural change at farm and processor level to
achieve the most competitive structures possible;
● ensure that the knowledge base and technical skills of the sector are developed to place
it in a world-leading position; and
● match these capabilities with an entrepreneurial focus on exploiting all market
opportunities to the full.
Implementation of the Single Payment Scheme. The Single Payment Scheme was
introduced in 2005, based on farm level historical entitlements in 2000-02. Ireland chose to
include the maximum amount of payments in the single payment, with dairy payments
included from 2005. It is based on the average number of animals (hectares in the case of
the Arable Aid Schemes) on which payment was made under each scheme in the reference
years (2000-02) multiplied by the 2002 payment rate for that scheme (EUR 383.04 for Arable
Aid Schemes).
The rate of sugar beet compensation, based on historical production contracts, to be
incorporated into the Single Payment Scheme was set. The rate is EUR 9.62 per contracted
tonne in 2006, rising to EUR 13.63 in 2012.
Implementation of the Rural Development Plan. Payments for agri-environmental
programmes, principally the Rural Environmental Protection Scheme (REPS), and to less-
favoured areas under the Disadvantaged Area Compensatory Allowance are the main focus
of expenditures under the CAP Rural Development Plan 2000-06.
AGRICULTURAL POLICIES IN OECD COUNTRIES: MONITORING AND EVALUATION 2007 – ISBN 978-92-64-02746-6 – © OECD 2007132
II.6. EUROPEAN UNION
In 2004, a revised REPS scheme, under the reference REPS 3, was introduced. REPS
obliges participants to draw up and follow a nutrient and grassland management plan, as
well as undertaking other measures. REPS also provides additional support to producers
wishing to convert to organic farming. Payments made through REPS totalled
EUR 329 million in 2006.
The total area designated as less-favoured area (LFA) is 5.155 million hectares,
comprising almost 75% of Ireland’s total land area. The majority of LFAs are classified
under Article 19 of Council Regulation No. 1257/00 – areas in danger of abandonment and
where conservation of the countryside is essential. Area-based compensation payments
under the Disadvantaged Area Compensatory Allowance totalled EUR 257 million in 2006.
Other changes in national policies. The Scheme of Investment Aid for Farm Waste
Management was introduced in 2006. This scheme is designed to help farmers meet the
requirements of the EU Nitrates Directive and provides for expanded eligibility and grant
amounts compared with the previous regional farm waste management schemes.
The Pilot Mineral Oil Tax (MOT) Relief Scheme was introduced in 2005. This incentive
scheme for biofuels has resulted in eight projects being awarded excise relief for a two year
period. The eight companies can produce a certain amount of biofuels each year and do not
have to pay excise to the Revenue Commissioners on a particular quantity they are
producing. In 2006, excise relief of EUR 0.69 million was granted under this scheme. A
further Biofuels Mineral Oil Tax Relief Scheme II was introduced in 2006. Under this
scheme sixteen projects have been awarded excise relief to the period 2010. When fully
operational the relief is expected to support the use and production of some 163 million
litres of biofuels each year. In addition, Green Diesel Excise Relief of EUR 14.62 million was
provided to producers in 2005.
Disease levies on milk and beef production were reduced by 50% effective 1 January
2007. The reduction follows improvements in the disease situation. The reduction in the
amount of the levy amounts to approximately EUR 5 million per year.
The maximum capital allowance under the accelerated scheme for investment in
pollution control facilities increased to EUR 50 000 from EUR 31 750. From 1 January 2005,
Single Payment Scheme entitlements were recognised as qualifying assets for CAT
agricultural relief and CGT retirement relief. Stamp duty relief for young trained farmers
was extended to 31 December 2008.
At the end of 2005 there were just over 7 824 low-income farmers (about 6% of total
farm holders) in receipt of social welfare payments through the Farm Assist Scheme.
Change in national budget expenditures. Total public expenditure on agriculture
increased by 13% in 2005 to EUR 457 million. Total public expenditures increased by a
further 8% in 2006 to EUR 496 million. A significant portion of the increase is due to
increases in environmental payments under the REPS scheme.
Changes in regulations and institutions. A new Milk Quota Trading Scheme was
established to supersede the Milk Quota Restructuring Scheme. The new system has two
elements, a priority pool and a market pool, the latter in the form of an Exchange.
Producers are obliged to provide 30% of milk quota offered for trade to the priority pool,
where a maximum price of 12 cents per litre is in effect. The remainder is traded on the
market pool at a market-determined rate.
AGRICULTURAL POLICIES IN OECD COUNTRIES: MONITORING AND EVALUATION 2007 – ISBN 978-92-64-02746-6 – © OECD 2007 133
II.6. EUROPEAN UNION
ItalySector-wide policy initiatives. The Economic and Financial Planning Document for 2004-07
covers strategic directives in the areas of: i) competitiveness of farms and agri-food
business, ii) agri-food traditions and specialities, iii) multipurpose values: product quality,
protection of land and environmental landscape, food safety and consumer protection,
and iv) reform of public administration and integration of various levels of governance.
Continuing decentralization of subsidy provision reinforces the principle of assigning
competence to the territorial government nearest to where citizens live.
In the context of the stated priorities, the Finance Act of 2006 (law 266/2005) contains
several measures including tax concessions and related extensions, support for
investments, farm businesses and agricultural supply chains for food and promotion and
use of biofuels. Furthermore, legislation entitled “Urgent measures for the agriculture, agri-
business and fishing sectors, as well as taxation of companies” (Law 81/2006), called for
major changes in: farm welfare, support for the agri-energy supply chain, restructuring and
reconversion of the sugar beet-sugar sector and stronger support for the poultry sector.
Implementation of the Single Payment Scheme. The Single Payment Scheme has been
extended to include olive oil, tobacco and sugar and national rules for application were
adopted during 2005 and early 2006. Moreover, Italy decided to introduce the single
payment of aid to the milk and milk products sector in advance, recognizing as
beneficiaries those producers who received payments based on the quotas they held as of
31 March 2006.
Italy has decided to opt for total inclusion of aid to olive oil in the single payment,
giving up the opportunity to maintain up to 40% of aid as under previous support
programmes, in the form of supplementary payments to farms with at least 0.3 hectares of
area planted to olive trees. Sector financing of 5% was set aside for programmes worked out
by recognized producer groups, to support action for quality, traceability, market,
environmental improvement and protection, and diffusion of information. As regards
tobacco, Italy moved toward including part of the aid in the single payment. In the first
phase of reform (2006-09), 60% of aid will remain specific to commodity production,
whereas the remaining part will go toward single payments (except for Puglia where the
rate of inclusion in the single payment is 100%). In the second reform phase (from 2010
onwards), aid will be completely independent from commodity production, but 50% of
direct payments will be channeled into restructuring programmes in traditional tobacco-
growing areas, within the framework of rural development policies.
For sugar, Italy decided to use the three-year period 2000/01-2002/03 to calculate aid to
be included in the Single Payment Scheme. Furthermore, as part of the reform of the
relevant CMO (Common Market Organisation), Italy decided to give up 50% of its
production quota. However, the reduction in quotas was accompanied by a guarantee of
additional payments independent from commodity production to continuing sugar beet
farmers and funds for processing industries for diversification and restructuring. The
application of Article 69 of the horizontal regulation of CAP reform (EC 1782/2003) calls for
withholding 8% of financial resources from the sector.
Implementation of the Rural Development Plan. During 2005, more emphasis was placed
on the dual management of various programmes for rural development financed through
the EAGGF Guidance and Guarantee sections. Implementation of RDPs in 2005 resulted in
spending of EUR 1 400 million. That amount, together with what was spent in the preceding
AGRICULTURAL POLICIES IN OECD COUNTRIES: MONITORING AND EVALUATION 2007 – ISBN 978-92-64-02746-6 – © OECD 2007134
II.6. EUROPEAN UNION
five planning years, brings the total spending to approximately EUR 8 000 million, or 90% of
total available RDP financing for the 2000-06 period.
Expenditures for environmental measures under the RDP accounted for 48% of total
disbursements from 2000 to 2005. A large increase in spending has been recorded in the
past few years in the category of investments.
Other changes in national policies. To reduce labour costs, the Financial Act (commas
361-362) provides a reduction of 1% in social security contribution payments for temporary
labour to the INPS (National Institute of Social Insurance), beginning on 1 January 2006.
Furthermore, legislation was passed providing for social security concessions for
agricultural employers in disadvantaged areas (Law 81/2006). In particularly disadvantaged
mountain areas, social security relief is raised to 75% of the employers’ share (as opposed
to 70% previously), whereas in disadvantaged agricultural areas, including Objective 1
areas named in Regulation EC 1260/99 and territory in the municipalities of Abruzzo,
Molise and Basilicata, relief is raised to 68% (compared to 40% previously).
Urgent measures for the prevention of avian flu were put in place (Law 244/2005)
allowing for the purchase of medicines and other prophylactic material and supporting the
poultry market. AGEA is authorised to buy frozen meat and other products in quantities
not in excess of 17 000 tonnes, and at a maximum expense of EUR 20 million. The government
can grant aid to facilitate reconversion and restructuring loans to businesses affected by
emergency situations in the poultry supply chain. Beginning on 1 January 2006, measures
to suspend or defer certain taxes are provided for poultry raisers, poultry butchers and
wholesale poultrymeat dealers.
Also in November 2005, urgent measures were put in place in agriculture to counteract
low prices in the grapes and wine sector, with EUR 90 million being appropriated to take
grapes off the market.
The Financial Act granting concessions for production of bio-diesel, provides that a
share of production will be used for the production of biofuels, as dealt with in special
planting contracts or supply chain agreements, for inclusion in the experimental “bio-
ethanol” programme. The six-year programme beginning on 1 January 2005 called for
exemption of bio-diesel from excise taxes within a contingent annual limit of
200 000 tonnes.
Change in national budget expenditures. National expenditures in 2005 have increased
by 4% over 2004 levels, and preliminary data indicate a reduction of 9% in 2006 relative to
2005. These changes are likely to affect expenditure for infrastructural services and
subsidies for crop insurance most, but will most likely have had repercussions across the
board.
Changes in regulations and institutions. Provisions concerning the simplification of the
procedures for enrolling in the business register and the economic and administrative
archive and the securitization of welfare credits and exclusion for farm welfare credits
were recently introduced. The same legislation also introduced certification of regular
repayments of European Community subsidies and renewed the terms for revaluation of
land and shares. Legislative Decree No. 152 of 3 April 2006 put into effect the delegation of
powers for the so-called “Environment Code”, which simplifies, rationalises and reorganises
environmental regulations into six key sectors: waste and reclamation, water, soil
protection, air pollution, environmental assessment, and environmental damage.
AGRICULTURAL POLICIES IN OECD COUNTRIES: MONITORING AND EVALUATION 2007 – ISBN 978-92-64-02746-6 – © OECD 2007 135
II.6. EUROPEAN UNION
LuxembourgImplementation of the Single Payment Scheme. Payment entitlements are allocated
according to a “mixed-regional model”. The reference payment is composed of a regional
component (the same for all regions) and an individually determined component that
depends on the historical amount of premiums during a reference period (2000-02). This
single payment replaces all previous commodity specific payment regimes; that is,
Luxembourg applies 100% decoupling as defined by the European Union. The ceiling for
total payments has been fixed at EUR 33.4 million in 2005, EUR 36.6 million in 2006, and
EUR 37.1 million in 2007.
Implementation of the Rural Development Plan. The Rural Development Plan in
Luxembourg aims to: support the competitiveness and income of the agriculture sector;
assure the viability of agriculture in less-favoured areas; protect the natural environment;
promote sustainable forestry practices; and encourage adaptation and development in
rural areas. The budget foresees a total transfer of about EUR 465 million to rural areas
(EUR 374 million national funding, EUR 91 million European Guidance and Guarantee
Fund, Guarantee Section).
Funding is provided for five major axes. Axis 1, Improving the Structure of the
Agriculture Sector, includes investments to farm holdings and young farmers, training, and
aids for transformation and commercialisation of agriculture products. It accounts for 43%
of national expenditures. Axis 2, Support for Agriculture in less-favoured areas, accounts
for 25% of national expenditures. Axis 3, Protection of the Environment and Natural
Spaces, accounts for 23% of national expenditures. Axis 4 (Forestry) and Axis 5 (Adaptation
and Development of Rural Areas) account for the remaining 9% of the budget.
The Rural Development Plan for the new period of implementation 2007-13 will be
based on three areas or axes of development: Axis 1, improving the competitiveness of the
agriculture and forestry sector; Axis 2, improving the environment and rural spaces; and
Axis 3, improving the quality of life and diversification of activities in rural areas. A fourth
Axis, based on the experience of the EU’s LEADER programme focuses on local strategies
for rural development. The budget foresees a total transfer (for the period 2007-13) of
EUR 367 million.
Other changes in national policies. In 2004, the Ministry of Agriculture, Viticulture, and
Rural Development introduced a disaster insurance programme for agricultural field crops
and wines. The programme covers part of the losses in revenue resulting from natural
disasters. This programme was enlarged in 2006 to include horticultural crops. Plans to
include the livestock sector are foreseen for 2007. The long-term goal is to eliminate the
need for direct intervention by the state in case of disaster through implementation of a
single insurance programme for the sector.
Change in national budget expenditures. Total national budget expenditures for
agriculture are estimated to be EUR 80.3 million in 2006. This is nearly 3% higher than the
EUR 78.0 million spent in 2005.
NetherlandsSector-wide policy initiatives. In the memorandum “The Choice for Agriculture”,
published in September 2005, the government sets out its vision of the Dutch agricultural
sector for the future.5 It was discussed in parliament and subsequently with stakeholders
from primary agriculture and the agro food industry over a period of several months. This
AGRICULTURAL POLICIES IN OECD COUNTRIES: MONITORING AND EVALUATION 2007 – ISBN 978-92-64-02746-6 – © OECD 2007136
II.6. EUROPEAN UNION
innovative policy memorandum uses medium-term scenario studies (until the year 2015)
to identify the main drivers of development within and around the sector and to pinpoint
the main challenges for entrepreneurs and policy makers. It defines the division of roles
and responsibilities of government and entrepreneurs. The government is mainly seen as
facilitating development towards a more market oriented yet sustainable agriculture
against the background of changing demands from society and the market. The document
points towards opportunities for the sector and expresses confidence in the future. It
underscores that declining income support will generate more opportunities for
economically viable commercial farming in the future. It also addresses the role of farmers
in maintaining the quality of the countryside. It states that farmers in areas with a natural
handicap can expect compensation for their efforts to protect the natural environment and
to conserve nature.
Deregulation and the reduction of policy related transaction costs has been another
key policy priority in the most recent period. A target of a 25% overall reduction of the
administrative burden was set. The Ministry of Agriculture, Nature and Food Quality has
already achieved this target in 2006. According to the latest calculations, the regulatory
burden can be reduced by a further 12 percentage points in 2007, bringing the total
reduction to 37%.
Implementation of the Single Payment Scheme. The Single Payment Scheme was
introduced in the Netherlands in 2006. Payments are based on historical entitlements,
i.e. based on payments received in the past, with 2000-02 as the reference period. The
Netherlands opted for keeping specific support for flax seed, for slaughtering premiums for
veal calves (EUR 50 per animal) and for full grown cattle (EUR 80 per animal). Dairy
payments are integrated into the single payment on the basis of the milk quota holding on
31 March 2007. The historical model has led to wide variation in payments per hectare.
While the average payment amounts to about EUR 400 per hectare, producers of open-field
horticulture receive only EUR 76/h and producers of veal calves EUR 3500/ha. The total
amount for the single payment is set at EUR 325 million, and while the average farm
receives EUR 10 000, payments can reach up to EUR 20 000 for some crop and dairy farms,
representing a substantial 40-50% of their net farm income.6
If a farmer does not meet the cross-compliance criteria, payments are reduced and
infringement may lead to prosecution. Single payment entitlements are tradable in the
Netherlands, but only within the farm sector. Since the single payment is linked to the
farm and not to land ownership, buying and selling of entitlements is possible without
farmland ownership attached to them. However, in order to receive the actual payment,
the farmer has to prove that he has the required area in agricultural use, although the land
may be leased, rented or owned. Entitlements can also be rented, but only in combination
with farmland.
Implementation of Rural Development Plan: The Agenda for a Living Countryside. Dutch
policy on securing a viable, sustainable and living countryside is laid down in the Agenda
for a Living Countryside.7 To secure its rural development objectives, the government
provides funding for nature, agriculture, recreation, landscape, soil, water, reconstruction
of sandy soil areas and socio-economic vitality. The new Multi-Year Programme 2007-13 for
the Agenda, presented in December 2006 under the leadership of the Ministry of
Agriculture, Nature and Food Quality and involving three other ministries, brings together
these national objectives and the associated government funding.
AGRICULTURAL POLICIES IN OECD COUNTRIES: MONITORING AND EVALUATION 2007 – ISBN 978-92-64-02746-6 – © OECD 2007 137
II.6. EUROPEAN UNION
The main reason for embarking on this Second Multi-Year Programme is that the
various administrative layers involved in rural areas – national government, provincial and
local authorities, and water boards – are joining forces in 2007 under a new administrative
model with a new funding system, the Investment Budget for Rural Areas (ILG,
Investeringsfonds Landelijk Gebied). This model assigns control to the provincial authorities
for the achievement of national policy objectives for the countryside at regional level. The
Second Multi-Year Programme incorporates the realisation of national objectives for rural
areas through “physical consolidation” (acquisition, consolidation and management),
management and use of natural resources and “socio-economic vitality” (space for
development, public participation, social infrastructure). The emphasis is on achieving
national objectives through regional and local approaches. Urban areas (housing), the main
road network, the railways and national waterways (safety) fall outside the scope of the
Second Multi-Year Programme.
This large decentralisation operation concluded in December 2006 with the signing of
management agreements for the ILG between the national government and each of the
12 provinces. In these agreements, covering a period of seven years, measurable
performance targets are set for each national objective and the government will make
available financial resources to help achieve the targets. The Investment Budget contains
EUR 3.7 billion from national sources; together with investments from provincial and local
authorities, water boards and private parties, a total of EUR 7.5 billion is available in the
next seven years for the integrated development of rural areas.
Other changes in national policies. In January 2006, a new policy on manure was
introduced in the Netherlands after the European Court of Justice ruled that the old
minerals accounting system (MINAS) was not in conformity with the obligations of the EU
nitrate directive. Under MINAS farmers were required to keep an account of minerals
imported, applied and exported from their farms. The new system introduces direct
technical norms for the application of nitrogen from animal manure, for total nitrogen
application per ha (and specific to each crop), and for total phosphate application per ha.
For some categories animal manure production rights will be maintained. Emissions in
excess of maximum levels are subject to penalty payments of up to EUR 7/kg of nitrate and
EUR 11/kg of phosphate, and may result in prosecution. While this system of technical
norms aims at reducing emissions to maximum allowable levels it is also expected to
reduce the administrative burden by some 40%. In addition, a derogation from the EU-wide
maximum level of nitrate emissions of 170 kg per ha was obtained from the European
Commission in 2006 for nitrate application from grazing animals. A maximum of 250 kg of
nitrate per ha is allowed for grass land for manure only from grazing animals. The
derogation will be in force for a period up to 2010.
Change in national budgetary expenditures. The total national budget for the Ministry
of Agriculture, Nature and Food Quality was EUR 2.1 billion in 2006. This represents an
increase of 8% compared to 2005.
PolandImplementation of the Single Payment. The Single Area Payment Scheme (SAPS) was
implemented in 2004. According to the schedule for the phasing in of the Single Payment
Scheme, payments were set at 30% of the payments in the EU15 in 2005 and increased to
35% in 2006.
AGRICULTURAL POLICIES IN OECD COUNTRIES: MONITORING AND EVALUATION 2007 – ISBN 978-92-64-02746-6 – © OECD 2007138
II.6. EUROPEAN UNION
Complementary National Direct Payments (CNDP) are paid using a mechanism similar
to that used for the SAPS (except for starch potato and tobacco). Payments for sector I
(bovine and ovine animals, milk, arable crops, legumes, seeds and nuts), sector II (hops)
and sector V (energy crops) are made in proportion to land area. Payments in sectors III
(starch potato) and IV (tobacco) are related to the production quotas allocated to Poland.
Overall, the CNDP increased the value of total direct payments to 65% of the EU15 level.
Implementation of the Rural Development Plan and the Single Programming Document.The EU Special Accession Programme for Agriculture and Rural Development (SAPARD)
was due to expire in 2004. However, SAPARD remained in place in 2005 and 2006 to finance
projects approved before that date. By the end of January 2006, SAPARD funds had been
fully used and remaining payments were covered from the Rural Development Plan (RDP)
funds (Projects under Regulation 1268/1999).
The RDP, set for the years 2004-06, comprises eight categories covering a broad range
of policies ranging from funding of early retirement to support for agri-environment and
improvement of animal welfare. In addition, funds are also provided for partial financing
of two measures implemented under other aid schemes (complementary area payments
and Projects under Regulation 1268/1999). Funds allocated in the period 2004-06 amount to
EUR 6 458.8 million, of which EUR 2 866.4 million are from EU and EUR 3 592.4 million from
Poland’s national budget.
The Polish Single Programming Document, the Sectoral Operational Programme (SOP),
designed to assist adjustments in the agricultural and food sector, sustainable
development of rural areas, and to provide technical assistance, was implemented during
the period 2004-06, but payments may continue to be disbursed until the end of 2008. The
funds are provided by the EU, the Polish budget and private sector participants.
Other changes in national policies. Several national support programmes have been
maintained following EU accession. The most important programmes in place until the
end of 2006 include interest rate subsidies provided for: investment and disaster loans
granted up until accession; new loans granted under preferential credit lines declared as
existing aid for investments in agriculture, the agri-food sector, the purchase of agricultural
land, new production technologies and investments under professional programmes. The
resources from national budget allocated for support of crops and livestock improvement
were relatively unchanged from PLN 123.7 million in 2005 (EUR 31.7 million) to
PLN 122.5 million in 2006 (EUR 31.4 million). 2006 was the second year of implementation
of the 3-year National Apiculture Programme, to which the EC has allocated
PLN 56.25 million (EUR 14.4 million). Fifty per cent of the programme’s expenditures are
financed from the national budget. In 2006, for the first time, the Agricultural Market
Agency provided refunds for the processing of straw from flax and hemp into fibre.
Refunds totalled PLN 0.16 million (EUR 0.04 million). In addition, Poland allocated
PLN 650 million (EUR 166.6 million) in 2006 for fuel tax concessions.
Change in national budgetary expenditures. Total national expenditures on agriculture
(including the co-financing of the EU programmes) increased (in PLN) in 2005 by 2.8%
reaching PLN 4.1 billion (EUR 1 025 million) and then increased by another 5.7% to
PLN 4.4 billion (EUR 1 019 million) in 2006. The observed increase in the national budgetary
expenditures (in PLN terms) is mainly due to financing of the CNDP. The observed changes
measured in EUR are significantly different from those measured in PLN due to the fall in
AGRICULTURAL POLICIES IN OECD COUNTRIES: MONITORING AND EVALUATION 2007 – ISBN 978-92-64-02746-6 – © OECD 2007 139
II.6. EUROPEAN UNION
the exchange rate between the Polish zloty and the euro in the 2004-06 period (15.9% and
9.2% respectively).
Changes in regulations and institutions. Changes in regulations and institutions in 2005
and 2006 were mostly related to entry into the EU in May 2004, the adoption of the CAP and
implementation of its mechanisms (market regulation, administration of payments), and
regulatory measures.
PortugalSector-wide policy initiatives. Most national policy initiatives dealt with the
consequences of major forest fires and drought, as well as bluetongue disease. There was
an outbreak of bluetongue disease at the end of 2004 and which affected traditional trade
circuits during 2005. A plan limiting animal traffic within the national territory was
implemented. In addition to forestry specific plans, the National council for afforestation
approved, in 2005, strategic orientations to restore burnt-out areas in 2003 and 2004. These
orientations will also apply to the area devastated by fires in 2005.
Implementation of the Single Payment Scheme. As planned, the Single Payment Scheme
was introduced in 2005 based on the 2000-02 farm level historical entitlements. From
January 2006, the single payment included 100% of cotton and olive oil payments and 50%
of tobacco payments. From mid-2006, it included the new sugar payment and, from
January 2007, the milk payment originally introduced in 2004 and the banana payment.
Under Article 69 of EC Regulation 1782/2003, Portugal opted to keep 10% of the single
payment national envelope for complementary payments to the olive oil and sugar sectors,
and 1% each for the arable crops, rice, beef and sheep sectors.
Regarding cross-compliance, new indicators were defined in order to comply with the
legislation with respect to public health, animal health and phytosanitary rules.
Implementation of the Rural Development Plan 2000-06 continued and the rules and
strategic options for the next planning period (2007-13) were adopted. Most expenditures
under the 2000-06 plan were for investments in farm holdings and development and
structural adjustment in rural areas.
Other changes in national policies. In order to alleviate the effects of the 2005 drought
on farmers’ income, a number of decisions were made. These include:
● to allow the possibility to use set-aside lands for animal feed over the entire country;
● early payment of milk and milk-product aid to allow producers to cope with liquidity
problems;
● in the context of the VITIS programme, to extend the time limit for conversion and
restructuring of vineyards until the end of May 2006;
● to temporarily exempt farmers from social security contributions in order to help them
face the decrease in revenue due to the fall in production, or to help meet the need to
purchase means of production essential to the pursuit of agricultural activity;
● to open a credit line to help with hydraulic work for agriculture, namely to ease the
watering of livestock in the regions most affected by the drought; and
● to open another credit line in some regions to compensate for feed and pasture shortage.
AGRICULTURAL POLICIES IN OECD COUNTRIES: MONITORING AND EVALUATION 2007 – ISBN 978-92-64-02746-6 – © OECD 2007140
II.6. EUROPEAN UNION
To compensate livestock farmers for income losses they incurred because of the
drought and the bluetongue outbreak, the following measures were approved:
● use of set-aside land to feed animals and the possibility of non compliance with the
mandatory requirements to the premium rights without incurring any reduction in aids;
● increase in advance premium payments from 60% to 80% for suckler cows and male
bovines in 2004-05;
● granting of advance payments for the supplementary sheep and goat premiums for 2005;
● reinforcement of the project to fight against animal disease included in PIDDAC
(Investment and expenditure programme for central administration development) up to
EUR 5.5 billion of national contribution; and
● non co-financed aid granted to aviary producers (without repayment) to help
compensate the additional cost of feed.
Changes in national budget expenditures. National expenditures on agriculture
increased in 2005 because of measures related to exceptional circumstances, such as
drought, forest fires and animal disease.
Changes in regulations and institutions. A new licence for bovine farming was
established and which for the first time clarified the framework for that activity. In 2005,
following the European regulation, GMOs were cultivated in Portugal: 772.3 hectares of
maize were planted.
In the context of the EU regulation on the prevention of water pollution by nitrates
from agricultural sources, new vulnerable zones (VZ) were designated in 2005 and some
existing ones were expanded. Continental Portugal now has eight VZ corresponding to
110 808 hectares. By the end of 2005, 9 of the 24 protected areas, as designated in the
national legislation on biodiversity conservation, had a management plan.
Some progress was made in the preparation of the strategic programme for the
management of agricultural residues; an advisory group was established. The programme
Natura 2000 was analysed to identify implementation solutions, including the definition of
sectoral goals, measurement of achievement and monitoring of actions taken in 2004 and
perspectives for 2010. The new estimates suggest a declining trend in greenhouse gas
emissions produced from 3% to 7% from the baseline in the agriculture sector.
Slovak RepublicImplementation of the Single Payment. From 2004 the Slovak Republic (SR) opted for a
Single Area Payment Scheme (SAPS) with a flat rate per hectare of all agricultural land.
According to the scheme for phasing them in, the Single Payments were set at 30% of the
payments to the EU15 in 2005 and increased to 35% in 2006. In 2005 and 2006,
Complementary National Direct Payments (“top-ups”) were paid as area payment for
selected arable crops (grains, oilseeds, protein crops), hops, tobacco, and headage
payments to suckler cows, sheep and goats. The ceiling of “top-up” payments from the
national budget has been fixed at 30%. However, both in 2005 and 2006, these payments
remained below that ceiling. In 2005, the “top-up” payments were made at the level of 24%
and 19% in 2006, i.e. in both years the total payments (SAPS+“top-up”) were at 54% of EU15
level.
Implementation of the Rural Development Plan and the Single Programming Document.Under the programmes implemented within the Rural Development Plan (RDP), payments
AGRICULTURAL POLICIES IN OECD COUNTRIES: MONITORING AND EVALUATION 2007 – ISBN 978-92-64-02746-6 – © OECD 2007 141
II.6. EUROPEAN UNION
to less-favoured areas (LFAs) and payments for agri-environmental measures represented
the core of the RDP payments (90% of RDP payments in 2005 and 70% in 2006). Although in
nominal terms, both payments increased in 2006, the decline of their share in the total RPD
expenditure was due to the development of other programmes not financed in 2005
(investments in agriculture, food processing and marketing). Most of the agri-
environmental payments were for payments provided under the basic scheme which is an
area payment provided per hectare of arable land, permanent grassland, orchards and
vineyards (a fixed rate is defined for each of these categories) cultivated under specific
environmentally friendly conditions. The payments to LFAs are paid per hectare of
agricultural land in less-favoured areas (mainly mountainous and hilly areas). The
payments within the RDP plan were financed from EU funds at a rate of 80%.
After accession, the Special Accession Programme for Agriculture and Rural
Development (SAPARD) was replaced by a Sectoral Operational Programme Agriculture and
Rural Development (SOP) set for 2004-06 (in Objective 1 regions). Both SAPARD and SOP
projects focus mainly on investments in agriculture, but also provide payments for the
development of food processing activities and infrastructure projects in rural areas.
Overall, the total amount of payments financing rural development (RDP, SOP and SAPARD)
almost doubled in 2006 compared with 2005.
Other changes in national policies. Most of the national programmes providing
payments to agriculture were terminated at the end of April 2004. Some of the national
payments continued to be provided from May 2004 within the “state aid” basket. They
focused on conservation of livestock and crop genetic resources, credit subsidies, water
subsidies and support to irrigation infrastructure, fuel tax rebates and disaster payments.
Slovakia also maintained its interest rate support of commodity loans secured by
warehouse receipts up to the end of 2006.
Change in national budget expenditures. The total amount of national payments
(including those co-financing the EU programmes) in 2005 declined by 6% compared to
2004, but in 2006 the national payments increased by 46% to reach SKK 5.6 billion
(EUR 149 million). These developments were mainly due to the time lag between the start
and completion of individual projects and related financing of projects under the RDP and
SPD programmes (most of the programmes except payments to LFAs).
Changes in regulations and institutions. Other than the consolidation of the institutions
administering the CAP, there were no major changes in regulations and institutions in 2005
and 2006. The Slovak government (Ministry of Agriculture and Ministry of Health) issued
11 decrees during 2006 in order to update and complete the Codex Alimentarius which
provides food quality and food safety regulation for different group of commodities and
products. Concerning institutional changes, three research institutes financed by the
Ministry of Agriculture (crop production, livestock production, and wine production) were
merged into a single institution, the Slovak Centre for Agricultural Research in Nitra
(Slovenské centrum pol’nohosporárského výskumu Nitra), as of 1 January 2006.
SpainImplementation of Single Payment Scheme. The Single Payment Scheme was
implemented in 2006. Spain applied the scheme at the national level with payments based
on historical entitlements and with a common regulatory framework for all regions.
Autonomous communities manage the single payments, but coordination is carried out by
AGRICULTURAL POLICIES IN OECD COUNTRIES: MONITORING AND EVALUATION 2007 – ISBN 978-92-64-02746-6 – © OECD 2007142
II.6. EUROPEAN UNION
the central government. A national database has been created by the Ministry of
Agriculture in order to calculate reference amounts and payment entitlements. A National
Reserve has been created by a linear 3% reduction of the reference amounts.
Payments will remain specific to commodity production for the following
commodities: seeds (100% of the payment); arable crops (25%); sheep and goat premiums
(50%); suckler cow premium (100%); slaughter premium for calves (100%); slaughter
premium for adult bovines (40%). Payments in the outermost regions will also remain 100%
specific to commodity production.
Implementation of the Rural Development Plan. The implementation of the Spanish
Rural Development Plan 2000-06 is completed. In 2006, a Rural Development National
Strategic Plan was drawn up, establishing the basic framework for the 2007-13
programmes. Agriculture is the main focus of the Spanish strategy on rural development.
Measures are to be applied through seventeen regional programmes, each including at
least the following horizontal measures: water management; aid for adding value to
agricultural and forestry products; support for meeting standards and; prevention actions
against forest fire and desertification. Proceedings have been initiated so as to develop a
basic Law on Sustainable Rural Development, which will address basic economic, social
and environmental problems in rural areas.
Other changes in national policies. The Combined Agricultural Insurance System is the
largest agricultural programme in terms of national expenditure in Spain, with a budget of
EUR 240 million in 2006, a 7% increase on 2005. The State Agricultural Insurance Agency
(ENESA) draws up an annual plan each year; in 2006, it is aimed at consolidating risks and
crops already covered by the scheme and to improve others. Some novelties are cattle
insurance for foot and mouth disease, and poultry insurance. Various lines have been
improved so as to include organic production. The cost of insurance premiums is
subsidised taking different factors into account facts such as being a young farmer or
contracting through producer organizations.
Irrigation water in Spain has become scarce due to unfavourable climatic conditions in
recent years. The use of this resource depends on two legal texts which affect irrigation
policy: the Water Framework Directive and the New Adapted Text of the Water Law. This
situation has led to an in-depth review of the National Irrigation Plan (PNR) known as the
Action Plan for the Modernisation of Irrigation, which is being applied in 2006 and 2007.
The objective of the review is to find ways of making important efficiency gains in the
consumption of water.
The Action Plan consists of an ambitious set of projects aimed at improving
infrastructures implemented through a 2006 decree established between the Ministries of
the Environment and of Agriculture, Fishing and Food. Farmers who are to benefit from the
Plan are committed to adopting measures to reduce pollution through a rigorous
programme of environmental surveillance. The Ministry of Agriculture, Fishing and Food
will invest EUR 712 million in Action Plan projects in three ways: funds allocated by the
Ministry as direct investment by the General Directorate for Rural Development; financing
and execution of projects by the government Agrarian Infrastructures Corporation
(SEIASAS); and, projects commissioned by the government.
In 2005 and 2006, temporary support was granted to compensate producers for the
effects of drought. Some tax concessions were applied, particularly value added tax rebates
and reductions in personal income tax, as well as in social security contributions. The
AGRICULTURAL POLICIES IN OECD COUNTRIES: MONITORING AND EVALUATION 2007 – ISBN 978-92-64-02746-6 – © OECD 2007 143
II.6. EUROPEAN UNION
Institute for Official Credit (ICO) provided farmers with subsidised loans in order to lessen
the impact of the adverse climatic conditions. In 2005 and 2006, temporary support was
provided to compensate producers for the increase in costs, particularly those due to
higher oil prices. The main measure is a direct payment of EUR 0.06 per litre of petrol
consumed. Only professional farmers were eligible for this aid.
Change in national budgetary expenditures. The total agricultural budget of the
government for 2006, (excluding transfers from the EU), is estimated to have increased by
3%, with a budget of EUR 1 267 million.
A new Action Plan on Organic Farming for 2007-10 was announced. Three measures
are foreseen: promoting development of organic farms; increasing domestic consumption
of organic products and; improving institutional coordination. A survey commissioned by
the Ministry of Agriculture, Fishing and Food revealed that domestic consumption in Spain
could be enhanced by providing consumers with more information on organic products. A
two-year promotional campaign commenced in 2006.
Changes in regulations and institutions. A new decree in late 2006 set a new structure
for the Spanish Agricultural Guarantee Fund (FEGA), which is the coordination body that
ensures consistency in the management of European funds by the various paying agencies.
The structure of FEGA has been changed so as to conform to the new procedures for
implementing direct payments, including the Single Payment Scheme. FEGA is also the
body responsible for coordinating both the European Agricultural Guarantee Fund and the
European Agricultural Fund for Rural Development from 2007.
SwedenSector-wide policy initiatives. A biofuels committee has been appointed to evaluate
Sweden’s capacity to produce biofuels from field crops and forestry. The committee is also
mandated to examine the ethical aspects of producing biofuels because it is considered
that there are trade-offs between using crops for food and for fuel, particularly in a context
where large parts of the world’s population cannot afford to buy sufficient food.
Recommendations are due in April 2007.
Implementation of the Single Payment Scheme. The Single Payment Scheme, introduced
in 2005, is based on a combination of both the regional and farm level models. Payments
totalling about SEK 6.6 billion (EUR 711 million) consist of two components: a basic amount
paid per hectare throughout the region; and an additional amount based on the average of
certain payments made to individual farmers during the period 2000-02. As a transitional
measure (to be reviewed in 2009), 75% of the male beef premium remains commodity-
specific to minimize the risk that slaughter animal production is significantly reduced.
Implementation of the Rural Development Plan. The Rural Development Plan for Sweden
(2000-06) sought to promote environmentally sustainable development by supporting
farmers through agri-environmental payments and generating new opportunities for
economic diversification through forestry and tourism. The total cost of the programme
was EUR 2.55 billion, of which EUR 1.13 billion was provided by the European Guidance and
Guarantee Fund, Guarantee Section.
Priority 1: Ecologically sustainable rural development consisted of different measures
that have been defined to channel environmental payments to farmers for the services
they provide for the public good. The management of pastures, meadows, and leys are
considered to be important in supporting a rich biodiversity and reducing the leaching of
AGRICULTURAL POLICIES IN OECD COUNTRIES: MONITORING AND EVALUATION 2007 – ISBN 978-92-64-02746-6 – © OECD 2007144
II.6. EUROPEAN UNION
chemicals. Other measures included retaining traditional agricultural practices (including
breeds of livestock), less-favoured area payments, and training in environmental farming
techniques and investments in farms. These agri-environmental measures accounted for
85% of total expenditures.
Priority 2: Economically and socially sustainable rural development emphasizes well-
targeted, cost-effective projects to increase the competitiveness of farm and rural
businesses. Measures included investment in farms, setting-up aid for young farmers,
business training and investments to improve processing and marketing. Rural
communities were supported by measures to promote tourism, the development of
villages, and conservation of rural cultural heritage.
Two regions, Norra Norrland (EUR 50.6 million) and Sodra Skoglanen (EUR 61.1 million),
were covered by EAGGF/Guidance measures (Objective 1). These included: Investment in
agricultural, plant and reindeer companies; setting-up aid for young farmers and reindeer
businesses; marketing and processing of agricultural goods; training, rural development
and development of reindeer husbandry and Sami villages; and environmental measures
in connection with forestry. The strategy differentiated between the coast and inland
areas.
The Rural Development Programme for the new period of implementation 2007-13
came into force in 2007. The largest share, about 75%, will be allocated to various
environmental measures, including support to less-favoured areas (axis 2). The remaining
25% will go to measures aimed at furthering competitiveness, diversification, and quality
of life in rural areas (axes 1 and 3). The programme will transfer about SEK 5 billion
(EUR 676 million) a year to rural areas in Sweden, an increase of around SEK 1 billion
(EUR 135 million) compared to the previous programme including Objective 1 and Leader+.
While the new programme increases resources to all axes, more emphasis will be
placed on development and competitiveness. This is reflected in increased funding for
training and education as well as measures to diversify the rural economy.
An important element of the new programme is the increased role of local and
regional authorities in planning, decision making, implementation and follow-up of the
various measures. The aim is a more efficient use of the funds.
Other changes in national policies. The green tax shift strategy, gradually implemented
since 2001, raised taxes having an impact on the environment while at the same time
reducing taxes on labour. Accordingly higher taxes on petrol and diesel have been
implemented since January 2004. However, since 2005 farmers can get a refund for 77% of
the carbon dioxide tax on diesel used in farm and forestry machinery, to bring rates paid by
Swedish farmers in line with those paid by competitors. Carbon dioxide neutral fuels
continue to be given competitive fiscal conditions. Biofuels are exempt from carbon
dioxide and energy taxes from 2004 to 2008.
Change in national budget expenditures. National budget expenditures for agriculture
totalled SEK 3.9 billion (EUR 388 million) in 2006. This was 7% higher than the
SEK 3.6 billion (EUR 418 million) spent in 2005.
Changes in regulations and institutions. The Swedish Animal Welfare Agency will
merge with the Board of Agriculture in 2007. The Agency, founded in 2004, is responsible
for ensuring the welfare of domestic animals, animals used in research, wild animals in
captivity and pet animals.
AGRICULTURAL POLICIES IN OECD COUNTRIES: MONITORING AND EVALUATION 2007 – ISBN 978-92-64-02746-6 – © OECD 2007 145
II.6. EUROPEAN UNION
United KingdomSector-wide policy initiatives. The government’s priorities for delivering a sustainable
farming and food sector were outlined in the Department for Environment, Food and Rural
Affairs (Defra) July 2006 report Sustainable Farming and Food Strategy: Forward Look for
England8 which builds on the 2002 Sustainable Farming and Food Strategy (see Agricultural
Policies in OECD Countries: Monitoring and Evaluation, 2003). The report sets out five priority
themes:
● Succeeding in the market: reconnecting farmers with their markets and strengthening the
links between the numerous elements of the food chain. For farm businesses and the
food chain collectively to move away from dependence on subsidy and towards a more
professional business-focussed approach.
● Improving the environmental performance of farming: building on progress in integrating
environmental concerns into agriculture by addressing key issues related to
environmental protection, resource management and pollution control.
● Sustainable consumption and production: encouraging production and consumption
patterns of food with lower environmental impacts.
● Climate change and agriculture: contributing to national climate change initiatives by
exploiting opportunities to reduce emissions from agriculture and seeking opportunities
to expand the production of bioenergy and other non-food crops which can help to
reduce overall UK carbon emissions.
● Animal health and welfare: delivering high standards of animal health and welfare as a
contribution to the economic, social and environmental sustainability of farming.
The administrations in Northern Ireland, Scotland and Wales have also recently
published their forward looking strategies as follows:
● Northern Ireland: Within the context of their five year Strategic Plan (2006/11)9 the
Department of Agriculture and Rural Development (DARD) Northern Ireland published
the Northern Ireland Animal Health and Welfare Strategy10 during 2006. The Strategy
provides a comprehensive, strategic approach to animal health and welfare in Northern
Ireland and sets out a vision of a Northern Ireland where standards of animal health and
welfare are amongst the highest in the world, and where all stakeholders fully
understand and accept their roles and responsibilities. The Strategy reflects Northern
Ireland’s geographical position within the Island of Ireland and the corresponding work
on seeking an agreed strategic approach to animal health and welfare across the island
and also addresses DARD’s commitment to produce a strategy that is consistent, in
terms of its principles and outcomes, with the GB Animal Health and Welfare Strategy
published in 2004. In 2006, DARD published its Rural Strategy11 to provide a broad
strategic framework for rural policy in Northern Ireland over the next seven years.
Additionally, in 2007 it published a Renewable Energy Action Plan12 aimed at enabling
farmers, landowners and the wider rural community to capitalize on the opportunities
presented by renewable energy.
● Scotland: The Scottish Executive published its A Forward Strategy for Scottish Agriculture:
Next Steps13 in March 2006, which builds on the achievements of the Forward Strategy for
Scottish Agriculture published in 2001 in areas such as animal health and welfare,
diversification and the environment, and seeks to maintain momentum and to take
account of the changing world. The Scottish Parliament debated the Crofting Reform Bill14
AGRICULTURAL POLICIES IN OECD COUNTRIES: MONITORING AND EVALUATION 2007 – ISBN 978-92-64-02746-6 – © OECD 2007146
II.6. EUROPEAN UNION
during 2006, which introduces powers to create new crofts, bring neglected croft land
back into production and extend crofting tenure beyond the crofting counties. The Bill
builds on the Land Reform Act introduced in 2003 and passed in January 2007.15
● Wales: The Welsh assembly government published in March 2006 the Environment
Strategy for Wales.16 The Strategy recognises the importance of the environment and
explains how the assembly government will tackle the challenges facing it over the next
20 years. It sets out the assembly government’s long-term vision for the environment in
Wales, which is “By 2026, we want to see our distinctive Welsh environment thriving and
contributing to the economic and social well-being and health of all of the people of
Wales.”
As well as Defra’s Forward Look report for England, the Department has also launched
a number of joint reports with other government departments, including:
● A Vision for the Common Agricultural Policy,17 with the HM Treasury in December 2005,
contributes to the debate on how to achieve a sustainable future for the EU’s CAP by
considering the economic, social and environmental costs of the CAP, the impact of the
CAP on developing countries, and examines further scope for reform of the CAP.
● The government’s response to the Biomass Task Force,18 with the Department of Trade and
Industry in April 2006, sets out some key measures to unlock the potential for renewable
energy in biomass, including: a five-year capital grant scheme for biomass boilers and
Combined Heat and Power (CHP) systems; the establishment of a new Biomass Energy
Centre to provide advice and guidance on all aspect of biomass energy; a second round
of the Bioenergy Infrastructure Scheme; and a commitment to consider the suitability
for using biomass heat and/or power in government buildings.
● Creating Value for Renewable Materials,19 with the Department of Trade and Industry in
November 2006, reviews progress since the 2004 report Strategy for Non-Food Crops and
Uses (see Agricultural Policies in OECD Countries: Monitoring and Evaluation, 2005) and
identifies the priorities for the next three years, especially greater focus on bioenergy,
plant based pharmaceuticals, and renewable construction materials and chemicals.
Implementation of the Single Payment Scheme. Following difficulties in implementing
payments to which farmers in England were entitled under the single payment for 2005,
the government in April 2006 authorised partial payments to those who had not already
received a payment. By December 2006 nearly all claimants had received full or partial
payments of an estimated total value of GBP 1 528 million (EUR 2 247 million). Payments
made by the devolved administrations to farmers in Scotland, Wales and Northern Ireland
were unaffected and paid according to schedule. The government announced in June 2006
that additional support arising from reform of the CAP sugar regime agreed in November 2005,
would be incorporated into the single payment by adding to entitlements held by sugar
beet producers meeting certain criteria.
Implementation of the Rural Development Plan. Each of the four devolved
administrations of the United Kingdom carried out consultations on their respective Rural
Development Programmes for the period 2007-13, the previous programme having ended
in 2006. The first payments to farmers in England through the Environmental Stewardship
Scheme, which was launched in March 2005 and replaced the Environmentally Sensitive Areas,
Countryside Stewardship and Organic Farming Schemes – were made in spring 2006. The
Scheme is made up of three elements; Entry Level Stewardship (ELS), Organic Entry Level
Stewardship (OELS) and Higher Level Stewardship (HLS). By July 2006 over 30% of eligible
AGRICULTURAL POLICIES IN OECD COUNTRIES: MONITORING AND EVALUATION 2007 – ISBN 978-92-64-02746-6 – © OECD 2007 147
II.6. EUROPEAN UNION
agricultural land in England was under some form of funded environmental management
scheme. In Wales, the first payments to farmers through Tir Cynnal, a new entry-level agri-
environment scheme, were made in April 2006, following approval by the EU Commission
during 2005. A modification to the Northern Ireland Rural Development Programme in 2005
introduced new options and higher payment rates for some existing options available to
participants in the Environmentally Sensitive Areas Scheme and the Countryside
Management Scheme.
The Land Management Contract Menu Scheme was introduced in Scotland in 2005. The
scheme is aimed at encouraging farmers to carry out activities which are beneficial for the
environment, for their business and for the wider public. It is funded by the proceeds of
modulation and UK matching funding. In Northern Ireland, the Organic Farming (Conversion
of Animal Housing) Scheme, which opened in December 2003 with a budget of GBP 2 million
(EUR 2.9 million), was closed to new applicants from September 2005. The scheme
facilitated the development of organic livestock production and was funded through the
Northern Ireland Assembly’s Executive Programme Fund. The Farm Nutrient Management
Scheme opened for applications in January 2005. The scheme, which has funding of
GBP 45 million (EUR 66 million), aims to assist farmers to comply with the manure storage
requirement of the EU Nitrates Directives and the Northern Ireland requirements of the
Control of Pollution (Silage, Slurry and Agricultural Fuel Oil) Regulations. A weather aid package,
which provided partial compensation of GBP 4.6 million (EUR 6.8 million) for losses to
production and increased costs during bad weather in 2002, was paid to farmers in
November 2005.
The government’s headline indicator of wild bird populations shows that overall
populations were 10% higher in 2004 compared to 1970, but for farmland birds they are
under 60% of their 1970 level. However, since the mid-1990s the farmland bird indicator has
remained fairly stable, although there are regional differences with northern parts of
England showing a recovery in farmland birds since 1994.20 For other flora and fauna
(e.g. mammals, butterflies), incomplete evidence for terrestrial and aquatic species
suggests that intensive farming practices continue as a major threat to species diversity
and abundance.21
Other changes in national policies. The National Fallen Stock Scheme (NFSS), introduced in
November 2004, was jointly set up by the government and the farming industry to help
farmers meet their legal responsibilities for disposing of dead animals. Previously, many
farmers disposed of fallen stock in a burial pit. This practice is now illegal and the Scheme
provides a means of disposing of fallen stock in compliance with the law. By the end of
November 2006 over GBP 11 million (EUR 16 million) of support was provided under the
NFSS, and after an independent review of the scheme the government agreed funding for
the Scheme should continue to November 2008.
Change in national budget expenditures. Agricultural budgetary expenditure for 2005
and 2006, excluding EU payments, was GBP 712 million (EUR 1 047 million) and
GBP 675 million (EUR 993 million) respectively, a 10% decrease from 2004 to 2005 and 5%
decrease from 2005 to 2006 (in GBP terms). Under the Freedom of Information Act, data was
released in 2006 by the government on recipients of CAP budgetary support in England
during 2004/05. The data reveals that GBP 1.4 billion (EUR 2.1 billion) was paid to nearly
90 800 farm businesses, cooperatives and private landowners, with six recipients each
receiving over GBP 1 million (EUR 1.5 million). CAP payments to non-farm businesses were
AGRICULTURAL POLICIES IN OECD COUNTRIES: MONITORING AND EVALUATION 2007 – ISBN 978-92-64-02746-6 – © OECD 2007148
II.6. EUROPEAN UNION
more significant, with sugar and dairy processors dominant. Seven companies received in
excess of GBP 10 million (EUR 15 million) in 2004/05, with Tate and Lyle, the sugar refiner,
the largest recipient of CAP payments totaling almost GBP 125 million (EUR 184 million).
Total income from farming in the UK is estimated to have risen in 2006 by over 10% in
current prices, or by nearly 7% in real terms, to GBP 2.72 billion (EUR 4 billion). Total income
from farming per full time person equivalent is estimated to have risen by almost 13% in
current prices, or by more than 9% in real terms, to GBP 13 840 (EUR 20 353). Increases in
the value of output, due in particular to higher prices for cereals, potatoes and cattle, have
more than offset higher input costs.22
Changes in regulations and institutions. Farm regulation and charging strategy:Defra published (2005) a strategy, Partners for Success – A Farm Regulation and Charging
Strategy,23 for England. This strategy seeks a new relationship in which government and
the farming industry will work together to deliver a better environment, improved animal
health and welfare, safer food and working conditions and a sustainable industry over a
10-year period.
Sharing responsibility and costs of animal disease: As announced in The Partners for
Success – A Farm Regulation and Charging Strategy the Department established the Joint
Industry/Government Working Group on Sharing Responsibility and Costs of Animal
Disease24 to work in partnership to make recommendations that would help inform debate
on how responsibilities and costs of animal disease outbreaks should be shared between
government and the industry in England. The Group published its report on 12 July 2006.
Government and farming industry representatives achieved a consensus around the
principles of sharing costs and responsibilities in the event of an exotic disease outbreak,
recommending that where costs are shared, responsibilities should also be shared.
The Over Thirty Month Scheme, an exceptional market support measure, which was
introduced in May 1996 to remove older cattle at risk of incubating BSE from the food chain,
was replaced in January 2006 by a rigorous BSE testing scheme for cattle over thirty months
old slaughtered for human consumption and the Older Cattle Disposal Scheme, an
exceptional market support measure providing for disposal of and compensation for cattle
born before 1 August 1996, and will end on 31 December 2008. The ten-year ban on UK beef
and cattle exports was lifted in May 2006, following progress in reducing cases of BSE in
cattle to less than 200 cases per million cattle in 2006.
The bulk of the Animal Welfare Act 200625 came into effect in April 2007. The Act
extends (while also consolidating and simplifying) animal welfare legislation, applying to
both farmed and non-farmed animals. In November 2006, the government consulted on a
draft animal welfare delivery strategy to pursue improvements to welfare through
partnership-based, non-legislative mechanisms; the consultation closed at the end of
March 2007 and it is anticipated that the final strategy will be published late summer 2007.
The government (with the Scottish executive and the Welsh assembly government)
established the poultry register in December 2005 to collect essential information about
certain bird species to help reduce the impact of a disease outbreak, with more than
250 million birds now included under the register. The UK’s first outbreak of the H5N1
strain of avian influenza occurred in January/February 2007.
AGRICULTURAL POLICIES IN OECD COUNTRIES: MONITORING AND EVALUATION 2007 – ISBN 978-92-64-02746-6 – © OECD 2007 149
II.6. EUROPEAN UNION
Notes
1. The description of policy developments at the European Union level is followed by information onpolicy development at member states level. Policy developments in European Union countries thatare not members of the OECD are presented in Annex 6.A1.
2. ÖPUL 2000, www.ama.at /Por ta l .Node/pub l i c ?rm=PCP&pm=gt i_ fu l l&p.content id=10008.30392&Merkblatt_OEPUL_2000.pdf.
3. Antragstellung MFA 2007, www.ama.at /Por ta l .Node/pub l i c ?rm=PCP&pm=gt i_ fu l l&p.content id=10008.35027&Merkblatt_Uebertragung_A4.pdf.
4. Grüner Bericht, http://publikationen.lebensministerium.at/.
5. Ministry of Agriculture, Nature and Food Quality (2005), Kiezen voor landbouw. Een visie op detoekomst van de Nederlandse agrarische sector, www9.minlnv.nl/pls/portal30/docs/FOLDER/MINLNV/LNV/STAF/STAF_DV/DOSSIERS/MLV_GOIK/DUURZAAM_ONDERNEMEN/MLV_GOIK_DON_KVL/BBR_2005_305BIJLAGE.PDF.
6. De Bont C.J.A.M. et al. (2006), Betekenis van subsidies voor de continuïteit van landbouwbedrijven,Den Haag, LEI, Rapport 6.06.10, www.lei.dlo.nl/publicaties/PDF/2006/6_xxx/6_06_10.pdf.
7. Ministry of Agriculture, Nature and Food Quality (2006), Agenda voor een Vitaal Platteland MJP2Meerjarenprogramma Vitaal Platteland 2007-2013, “SAMEN WERKEN”, www9.minlnv.nl/pls/portal30/docs/FOLDER/MINLNV/LNV/STAF/STAF_DV/KAMERCORRESPONDENTIE/2006/02/20060221_DP_2006_216BIJLAGE_V2.PDF.
8. www.defra.gov.uk/farm/policy/sustain/pdf/sffs-fwd-060718.pdf.
9. www.dardni.gov.uk/index/strategies-report-accounts/dard-strategies.htm.
10. www.dardni.gov.uk/index/strategies-reports-accounts/animal-health-and-welfare-strategy.htm.
11. www.dardni.gov.uk/pubs-dard-rural-strategy-2007-2013.
12. www.dardni.gov.uk/content-newpage-renewable-energy-action-plan.
13. www.scotland.gov.uk/Publications/2006/03/01142456/0.
14. Crofting: System of land management based on small holdings.
15. www.scotland.gov.uk/News/Releases/2007/01/25172652.
16. http://new.wales.gov.uk/topics/environmentcountryside/epq/Envstratforwales/?lang=en.
17. www.hm-treasury.gov.uk./documents/international_issues/global_challenges/the_common_agricultural_policy.cfm.
18. www.defra.gov.uk/farm/crops/industrial/energy/biomass-taskforce/index.htm.
19. www.defra.gov.uk/farm/crops/industrial/pdf/nfc-progress-0611.pdf.
20. www.defra.gov.uk/environment/statistics/wildlife/index.htm.
21. www.defra.gov.uk/wildlife-countryside/resprog/findings/atlas.htm; and www.jncc.gov.uk/page-1829.
22. http://statistics.defra.gov.uk/esg/statnot/account.pdf.
23. www.defra.gov.uk/farm/policy/regulation/charge/index.htm.
24. www.defra.gov.uk/farm/policy/regulation/csharead/jigwg/index.htm.
25. www.defra.gov.uk/animalh/welfare/act/index.htm.
AGRICULTURAL POLICIES IN OECD COUNTRIES: MONITORING AND EVALUATION 2007 – ISBN 978-92-64-02746-6 – © OECD 2007150
II.6. EUROPEAN UNION
ANNEX 6.A1
Policy Developments in European Union Countriesthat are not Members of the OECD*
EstoniaImplementation of the single payment. The Single Area Payment Scheme (SAPS) was
continued in 2005 and 2006. All national direct support schemes were changed to CAP-like
schemes in 2005 and provided under the Complementary National Direct Payment (CNDP)
(“top-up” payments) to producers of arable crops, milk, beef and sheepmeat. Altogether,
the CNDP and SAPS support amounted to EUR 66 million in 2006, which is significantly
more than the EUR 49 million spent in 2005. Actual payments for dairy cows under CNDP
remained below the maximum authorised level of 95% of the EU support level for milk. For
other products under CNDP, the maximum level of support was set at 65% of the EU
support level, partly (EUR 5 million) financed from the Rural Development Plan 2004-06
(RDP) for arable crops and seeds. In April 2006, EU reserve quotas of milk were opened to
new member states. The total milk quota for Estonia increased by 3%.
The implementation of the Single Payment Scheme will start from 2011 according to
Article 143b of Council Regulation (EC) No. 1782/2003.
Implementation of the Rural Development Plan and the Single Programming Document.The Rural Development Plan (EAGGF and co-financing) and the National Development Plan
2004-06 (NDP) (structural funds and co-financing) replaced the Special Accession
Programme for Agriculture and Rural Development (SAPARD). The last payments under
pre-accession SAPARD were made in the third quarter of 2006. Within five years a total of
EUR 62 million was paid out and investments worth EUR 147 million were made under
SAPARD. The RDP included less-favoured area payments and agri-environmental
measures. Around 80% was financed by the EU. In 2005, RDP was extended to support
afforestation of agricultural land, support for areas with environmental restrictions and
support for establishment, restoration and maintenance of stonewalls. The NDP mainly
includes investment support measures to farmers and agro food of which 70% of the costs
are covered by the EU.
Other changes in national policies. A new market development measure was introduced
in 2005. It is provided to non-profit organisations to cover costs associated with market
* The work on non-OECD EU member countries (Cyprus, Estonia, Latvia, Lithuania, Malta andSlovenia) has been made possible by a voluntary contribution from the European Commissionapproved by Council on 22 May 2005 (C/M[2005]19 and Annex 1).
AGRICULTURAL POLICIES IN OECD COUNTRIES: MONITORING AND EVALUATION 2007 – ISBN 978-92-64-02746-6 – © OECD 2007 151
II.6. EUROPEAN UNION
promotion and research; product developments; and quality improvement that increase
marketing possibilities of (processed) agricultural products. Close to EUR 0.6 million was
provided for market development support in 2005 and EUR 1 million was planned for the
year 2006 of which 80% was spent.
The Rural Development Foundation (RDF) and the Estonian Agricultural Registers and
Information Board (ARIB) implement state aid schemes that are introduced under the Rural
Development and Agricultural Market Regulation Act. In 2005 and 2006, the RDF continued
to grant loans and to provide collateral on loans to farmers and other entrepreneurs in
rural areas for different purposes and on different terms.
In 2005, the RDF supported disaster payments for farm structures and compensation
for production losses, which were paid through the Agricultural Registers and Information
Board (ARIB).
2006 was the first year of implementation of the development plan, “Estonian Food
2006-08”, approved by the government at the end of 2005. The development plan is
financed from the state budget; total expenditure in 2006 was EUR 1.3 million,
EUR 1 million is planned for 2007. Within the plan no direct support to producers will be
granted. The aim of the development plan is to help identify traditional Estonian food,
increase the competitiveness of local food products and to promote the food production
industry of Estonia and the reputation of Estonian cuisine both at home and abroad.
In 2006, ARIB assigned EUR 0.5 million to compensate partially producers for increases
in diesel fuel excise tax. Only these producers eligible for SAPS in 2005 could apply.
In 2005, vocational educational support was made conditional upon undertaking to
work and live in the country once the studies have been completed. The amount of the
support depends on academic achievement. This support cost EUR 0.2 million in 2005 and
EUR 0.15 million in 2006.
Change in national budget expenditures. In total the support provided to agriculture and
rural development was EUR 149 million in 2006, up from EUR 128 million provided in 2005.
About 30% of this support was financed from national funds and the remainder was EU
funded. The level of support has increased significantly as compared to the pre-accession
period; in 2003, total support provided was EUR 47 million.
Changes in regulations and institutions. The Plant Reproduction and Variety Protection
Law was adopted in 2005. The Organic Farming Law that was adopted in 2006 specifies the
requirements for organic farming in the areas that are not covered by EU regulations.
In January 2005, the first processing factory for animal waste materials was opened.
The factory is state owned and was constructed with support from the EU. Agricultural
producers and the food industry must pay for the service, but the government has set
prices low enough to promote the legal marketing of animal waste materials.
In 2006, the government decided that, as from July 2007, the Veterinary and Food Board
(VFB) would control food safety at all stages of the food chain. At present, this
responsibility is shared by three ministries: the Ministry of Agriculture, the Ministry of
Social Affairs and the Ministry of Economic Affairs and Communications. Since January
2007, the VFB has taken over the functions of maintaining the authorized alcohol register.
In 2006, the authorized holder of the state security reserve of cereals was privatized.
AGRICULTURAL POLICIES IN OECD COUNTRIES: MONITORING AND EVALUATION 2007 – ISBN 978-92-64-02746-6 – © OECD 2007152
II.6. EUROPEAN UNION
LatviaImplementation of the Single Payment. Complementary national direct payments were
continued in 2005 and 2006 in the form of area payments for arable crops, fodder, payments
per slaughtered or exported animals for adult bovines, per heads for suckler cows and
ewes, and potato starch and seed for grassland and flax seeds. The number of applicants
increased from 67 900 in 2004 to 80 500 in 2006. In 2006, the declared area for arable crop
payments and for Single Area Payment exceeded the maximum reference area.
Implementation of the Rural Development Plan and the Single Programming Document. To
date, most payments have been made to less-favoured areas. However, this share declined
to 60% in 2006 (from 81% in 2004) as new programmes have been set up. Support for
Restructuring of Semi-subsistence Farms and Support for Producer Groups were continued
and received 11% of total expenditures and agri-environmental measures received 8%.
New programmes were implemented in 2005. The largest payments were made to
meet EU standards in the fields of environmental protection, human, animal and plant
protection, and animal welfare on farms (17% of total payments in 2006), while payments
to compensate for restrictions related to environmental protection objectives received 2%
of the payments and the early retirement programme received less than 1%.
Other changes in national policies with a direct budgetary impact. In 2005 and 2006,
disaster payments were paid to cover the renovation of farm structures, the purchase of
equipment and for production loss.
The Credit Programme for Purchase of Agricultural Land ceased in 2006,
EUR 12.85 million were spent under this programme which granted loans for the purchase
of agricultural land to farmers with a repayment term of 20 years and an annual interest
rate of 4%. In 2005, a differentiated interest rate was charged under the Agricultural Long-
Term Investment Credit Programme with a 4% rate applied to organic farms and
cooperative companies of agricultural services, compared to 5% charged to other farmers.
In 2006, a five-year scheme to support intensification of the fruit and vegetable sector
was established. Farmers who comply with the standards of this scheme are eligible to
receive support.
Change in national budget expenditures. National expenditures on agriculture and rural
development increased by close to 50% in 2005 and again by 29% in 2006 to reach
EUR 194 million.
LithuaniaImplementation of the Single Payment Scheme. The implementation of the Single
Payment Scheme will start in 2011. The Single Area Payment Scheme and Complementary
National Direct Payments (CNDP) continued to be applied in 2006 with expenditures of
EUR 265 million, of which EUR 33 million were paid from the national budget. CNDPs for
arable crops such as grains, rapeseed, starch potatoes, protein crops, fibre flax and other
crops were financed by the EAGGF-Guarantee section (EU Rural Development Fund) and
the national budget. The livestock sector was supported by CNDPs for suckler cows, bulls,
slaughtered adult cattle, ewes, and milk. The acreage of agricultural land qualifying for
direct support increased in 2006, reaching 2.64 million hectares as compared to 2.57 in 2005
and 2.55 in 2004. Income support averaged 64% of the direct payments level in EU15, one
percentage point below the maximum rate authorized by EU regulations, while this share
AGRICULTURAL POLICIES IN OECD COUNTRIES: MONITORING AND EVALUATION 2007 – ISBN 978-92-64-02746-6 – © OECD 2007 153
II.6. EUROPEAN UNION
was up to 97% for flax fibre (maximum authorized 100%) and 63% for milk (maximum
authorized 95%). The area sown with fibre flax has decreased sharply in Lithuania since
2004.
Implementation of the Rural Development Plan and the Single Programming Document.Each measure under the Rural Development Plan is financed from the EU EAGGF-
Guarantee section (80% of total funds allocated for each measure) and co-financed from
the national budget (20%). The most important measures were those dealing with less-
favoured areas (LFAs), with meeting EU standards, and early retirement. In 2005, LFAs
received EUR 77 million, 34% of all RDP funds. Support given to farmers to meet EU
standards amounted to EUR 67 million. There were 7 522 applications submitted under the
early retirement measure, and these received EUR 48 million in 2006. Agri-environmental
commitments were supported under RDP to the amount of EUR 22 million, almost three
times what was paid in the previous two programming years.
Investment aid for rural development was distributed through the Lithuanian Single
Programming Document (SPD) for 2004-06. Public funding can amount to up to 50% of the
total budget of the project, of which 25% comes from the national budget. Up to
EUR 192 million was allocated for rural development under SPD over this three-year period.
The implementation of the SPD was slow, however, and 2006 was the first year when
significant financial support was granted. In 2006, support under SPD amounted to
EUR 114 million. Investment in farm holdings, development of rural areas and the
establishment of young farmers were the most important measures in terms of spending.
EUR 51 million was allocated to support investments in farm holdings. Applications for
this measure were 50% higher than the resources available. The year 2006 was important
for the promotion of rural areas: investment in water management systems, rural tourism
and other alternative entrepreneurial activities in rural areas. The support for this type of
measure reached EUR 23 million and accounted for 27% of total public support allocated
for the three programme years. During the whole programming period only 41% of
available public support was allocated.
Other changes in national policies. Support to bio-diesel production doubled over the
period 2005 and 2006. Disaster payments paid to compensate for crop losses amounted to
EUR 201 million in 2006.
Change in national budget expenditures. National expenditures on agriculture and rural
development increased by 26% in 2005 and by 28% in 2006 to reach EUR 313 million.
MaltaImplementation of the Single Payment. Malta did not apply for the Single Area Payment
Scheme (SAPS), but provides per holding payments under the Ad Hoc Specific Temporary
Support to Full-Time Farmers. Three payment rates were defined – per hectare of irrigated
land, non-irrigated land and per livestock unit. These rates are multiplied by the number of
hectares and livestock units on the farm as of 1 May 2004, to establish the total annual
payment per holding. Per hectare and per livestock unit payment rates are reduced each
year by 20% of their level in 2004 in order to phase out this assistance within a five-year
period. In 2006, these rates were: EUR 460 per hectare of irrigated land, EUR 120 per hectare
of non-irrigated land, and EUR 40 per livestock unit. A total of EUR 7.4 million was
budgeted for this assistance over the three years 2004-06, with 80% co-financed by the
European Union. An estimated 75% of full-time farmers could be eligible for such
AGRICULTURAL POLICIES IN OECD COUNTRIES: MONITORING AND EVALUATION 2007 – ISBN 978-92-64-02746-6 – © OECD 2007154
II.6. EUROPEAN UNION
payments, with payments covering 25% of irrigated, 10% of non-irrigated land and 60% of
livestock units.
The Single Payment Scheme will be introduced in 2007 and is based on a regional
model. It will gradually incorporate less-favoured area payments and other eligible land-
based payments.
Special Marketing Policy Programme for Maltese Agriculture. Upon its accession to the
European Union on 1 May 2004, Malta adopted the mechanisms of the CAP, including
mechanisms of market regulation and the border regime. At the time of joining the
European Union, Malta was to phase out import levies applied previously to imports from
the European Union and align border protection with the EU common tariff. This implied
income losses in some key agricultural sectors, leading Malta to negotiate a special
transition aid – Special Marketing Policy Programme for Maltese Agriculture (SMPPMA).
The SMPPMA incorporates nine sector-specific aid schemes: for tomatoes, fresh fruits,
fresh vegetables, potatoes, wine, pigs, dairy, poultry and egg farming. All sector schemes
provide for price subsidies for the products concerned to compensate for the eliminated
import levies. The subsidy is based on the differential between the EU and Malta prices in
1998-2000. It is to be progressively reduced each year from 100% of that differential to 18%
for livestock products and to 15% for crop products. The implementation period is set at
7 years for the livestock sector and 11 years for the crop sector. In addition to the price
subsidy, some SMPPMA sector schemes contain restructuring and marketing assistance,
and per hectare aid. Thus, restructuring (investment) assistance is available for wine and
all livestock sectors, marketing aid for tomatoes and potatoes, and per hectare assistance
for wine grapes and potatoes.
Implementation of the Rural Development and the Single Programming Document. Malta
was not included in the SAPARD programme and had limited pre-accession experience of
EU-type rural development measures. The totality of Malta’s territory is recognised as an
Objective 1 region. After accession, the Rural Development Regulation was implemented
through the Rural Development Programme (RDP) and the Single Programming Document
(SPD) for 2004-06, providing respectively for 80% and 70% EU co-financing. Total EU funding
under these two programmes, amounted to EUR 3.1 million in 2004 (34% of planned
expenditure), EUR 8.3 million in 2005 (80% of planned expenditure), and EUR 11.6 million
was budgeted for 2006.
The 2004-06 RDP contained common EU measures, such as assistance to less-favoured
areas, agri-environmental measures, as well as actions foreseen specifically for the new
members, such as support of producer groups, compliance with EU standards, technical
assistance, and financing of the SMPPMA and the Ad Hoc Assistance to Full-Time Farmers
(a derogation for Malta). The latter two take up the largest share of Malta’s overall spending
under its RDP (around 42%). In the first three years after accession, Malta could direct up to
20% of the national rural development allocation under the EAGGF Guarantee Fund for this
purpose. Malta’s 2004-06 SPD financed investments in agricultural holdings and in
processing and marketing. In 2004-05, the actual SPD spending was only 16% of the
budgeted amounts.
In 2006, Malta prepared the national Rural Development Strategy for 2007-13 to launch
its next Rural Development Plan (RDP). About EUR 76.6 million will be allocated from the
European Agricultural Fund for Rural Development (EAFRD) over its implementation period
and EUR 25 million as the national contribution. Almost one half of EAFRD funds (41%) are
AGRICULTURAL POLICIES IN OECD COUNTRIES: MONITORING AND EVALUATION 2007 – ISBN 978-92-64-02746-6 – © OECD 2007 155
II.6. EUROPEAN UNION
budgeted for enhancing competitiveness of the agricultural sector (Axis 1), reflecting
Malta’s most pressing adjustment need. Improving environment and the country side
(Axis 2) will also be emphasised, with 25 % of RDP spending directed for this purpose,
notably for preservation of rural landscapes, environmental and ecological sustainability
and maintaining biodiversity. Another 27 % will be allocated for improving the quality of
life in rural areas and diversification (Axis 3), with 3 % reserved for building local capacity
(Axis 4), and 4% for technical assistance.
In addition to the RDR measures, a new programme co-financed by the European
Union for vineyard restructuring was launched in 2006.
Other changes in national policies. The largest national measure, in terms of budgetary
cost, is subsidising the marketing expenses of agricultural cooperatives (with
EUR 0.6 million budgeted annually). Services to producers are the next most important
item in national spending. These include testing for animal diseases (EUR 0.18 million
budgeted per year) and subsidising farmers located in Gozo island for use of ferry
transportation (EUR 0.075 million per year). A national programme of credit assistance
provides interest rate subsidies to farmers taking loans for construction and
reconstruction of farms and structural works. The programme’s annual budget is about
EUR 0.097 million per year. An implicit budgetary support is also provided through tax
preferences; thus, small farmers in Malta are exempt from payment of the Final Settlement
Tax (representing a 3% sales tax).
The Republic of CyprusImplementation of the Single Area Payment and Complementary National Direct
Payments. As of 2004, the Republic of Cyprus (RC) opted for a Simplified Area Payment
Scheme (SAPS) with a flat rate per hectare of all agricultural land. In accordance with the
phasing-in rules for the Single Payment Scheme, these payments were set at 30% of the
payments to the EU15 in 2005 and were increased to 35% in 2006. The RC supplemented the
SAPS with Complementary National Direct Payments (CNDPs) and direct state aids to
arable crops, durum wheat, broad beans, fodder crops, olives, raisins, bananas, tobacco,
dairy cows, and sheep and goats.
Implementation of the Rural Development Plan. Cyprus merged all schemes available
under the Temporary Rural Development Instrument (TRDI) for new member states into a
single “Cyprus Rural Development Plan 2004-06 (RDP)”. The main objective of the RDP is to
integrate the Cypriot agri-food sector into the European agri-food sector under current
conditions of competition and sustainable development so that Cypriot farmers will be
prepared to face the competition they will be confronted with in the near future.
The RDP 2004-06 includes 21 measures to develop and strengthen the agricultural
sector. Approximately 50% of the RDP 2004-06 was co-financed by the EU, with the
exception of agri-environmental measures for which the EU contribution was 60%.
The first payments were made in 2005. At the end of December 2006, close to 33% of
all RDP funds had been spent to support investments in farm holdings, less-favoured area
payments received 32% of RDP funds, and agri-environmental payments accounted for
18%. Assistance to young farmers, to the processing industry, and projects designed to
meet EU standards accounted each for around 5% of RDP funds.
AGRICULTURAL POLICIES IN OECD COUNTRIES: MONITORING AND EVALUATION 2007 – ISBN 978-92-64-02746-6 – © OECD 2007156
II.6. EUROPEAN UNION
Change in national budget expenditures. National expenditures on agriculture
(excluding those covered by the EU) are estimated to have increased by 17% between 2005
and 2006.
SloveniaImplementation of the Single Payment. Slovenia did not apply for the Single Area
Payment Scheme (SAPS), but chose to implement all CMO direct payments according to the
pre-reform Agenda 2000 scheme. These payments, together with the national top-ups,
reached 90% of the comparable (pre-reform) level in the EU15 in 2005 and 95% in 2006.
Topping-up of direct payments to 100% of the national envelope is foreseen for 2007. In
addition to regular CMO measures, temporary support was provided to poultry producers
in 2006 to compensate for the loss of revenue due to avian influenza.
The Single Payment Scheme will be introduced in Slovenia in 2007. The payment will
consist of two components: a basic flat rate per hectare, uniform across the country
(EUR 332 per hectare of arable land and about EUR 133 per hectare of permanent
grassland), and a specific supplement based on historical farm entitlements. The latter will
absorb 100% of sugar payments, 80% of dairy premiums, and 30% of all premiums for the
beef sector. Of the current commodity-specific payments Slovenia will retain 65% of the
special beef premium, 50% of the sheep and goats premiums and 25% of the hop premium.
A 10% rule will be applied to support extensive systems of quality beef production, namely
extensive rearing of cows and heifers for meat.
Compliance conditions for receiving payments are being introduced gradually over the
2005-07 period. In 2005, conditions for maintaining land in good agricultural and
environmental condition and animal identification were adopted, and in 2006 conditions
for maintaining human, plant and animal health. The remaining regulations are to be put
in place in 2007.
Implementation of the Rural Development Plan and the Single Programming Document.After accession, the Rural Development Regulation (RDR) was implemented through the
Rural Development Plan (RDP) for 2004-06, (with 80% EU co-financing) and the Single
Programming Document (SPD) for 2004-06 (50% EU co-financing). The SAPARD programme
ended upon Slovenia’s entry to the European Union, but payments were disbursed up to
October 2006, of which two-thirds were from EU funds. Total expenditure for rural
development under these three RDR programmes, including both EU and national
contributions, amounted to EUR 102 million in 2005 and approximately EUR 121 million in
2006.
Agri-environmental measures, less-favoured area payments and measures for
meeting standards accounted for the highest shares of EU-financed RDR funds – 32%, 33%
and 22% respectively in 2005-06. Structural measures, such as investments in farm
holdings, early retirement, processing and marketing, represented 9% of EU RDR funds,
while other rural development measures, such as forestry, diversification of activities on
farms, rural infrastructure, and technical assistance accounted for another 4%. The
national contribution varied from around 50% for investments in farm holdings, processing
and marketing, forestry, and development and structural adjustment of rural areas, to
around 20% for other RDR measures.
Total EU RDR funding more than doubled in 2005 and increased by 22% in 2006. This
was largely due to the post-accession re-evaluation of per ha payment rates for less-
AGRICULTURAL POLICIES IN OECD COUNTRIES: MONITORING AND EVALUATION 2007 – ISBN 978-92-64-02746-6 – © OECD 2007 157
II.6. EUROPEAN UNION
favoured areas and agri-environmental payments. Also, starting from 2005 additional
measures, such as early retirement and meeting standards have been implemented.
Besides the RDR measures, two specific programmes were launched in 2005. One is the
restructuring of vineyards, entirely financed by the European Union (EUR 2.9 million in
2005 and EUR 2.3 million in 2006). This programme replaced a similar national one
implemented previously. Another special programme concerns support for beekeepers
(EUR 0.4 million in 2005 and EUR 0.5 million in 2006), with 50% co-financing from the
European Union. This programme provides support to increase the economic viability of
beekeeping (including vocational training, information, extension services, quality
analysis of honey, and disease eradication).
The National Strategic Plan for Rural Development and the Rural Development
Programme for the period 2007-13 were submitted for public discussion in 2006. These
documents change, to some degree, the emphasis in rural development policy. It is now
intended to increase funds for economic development of rural areas, including such
measures as competitiveness, quality of life, and diversification of activities. The Rural
Development Programme envisages total funding of about EUR 1 159 million over the
seven-year period, of which EUR 900 million (80%) is the contribution from the European
Agricultural Fund for Rural Development (EAFRD). About 33% of the total budget is destined
for raising competitiveness of agriculture and forestry (Axis 1), reflecting the growing
developmental and restructuring needs and a lack of competitiveness in these sectors.
Another 53% is to be allocated for maintenance of cultural landscape and environmental
protection (Axis 2) and for support of the multifunctional role of agriculture. Nearly 11% is
budgeted for improvement of quality of life in rural areas and economic diversification
(Axis 3), and the remaining 3% – for the LEADER activities (Axis 4).
Other changes in national policies. National assistance was provided to farmers for
mitigating the effects of unfavourable weather conditions. In 2005, a second payment of
state aid amounting to EUR 7.1 million was transferred to producers affected by a
hailstorm in 2004. Another EUR 10.2 million of state aid was paid in 2006 to alleviate the
consequences of various natural disasters that occurred in 2005 (storms, frost, and
hailstorms), covering 28% of damage. To help minimise risks of crop production, a new
programme was launched in 2006, offering producers a 30% insurance premium subsidy.
EUR 1.7 million were spent for this assistance in 2006.
In addition to the beekeeping programme co-financed by the European Union, a
national programme was introduced in 2005, providing support for preservation of
autochthonous bees. Total expenditures under this programme amounted to
EUR 0.8 million in 2005 and EUR 0.7 million in 2006. Another national measure was a
transitional LFA payment of EUR 0.6 million per year in 2005-06. This payment was
provided to farmers in areas covered by the LFA support under the national criteria
(effective before accession), but not included in the list of eligible areas under the Rural
Development Programme 2004-06.
A new Personal Income Tax Act was adopted in 2004, and subsequently amended in
2005/06. According to it, most agricultural payments and state aid received by agricultural
producers will be gradually included in their personal income tax base.
Change in national budget expenditures. National agricultural budget expenditures on
agriculture were reduced to EUR 136 million in 2005, or by 27% compared to 2004. This
reduction reflected the shift in financing of most measures from the national budget to
AGRICULTURAL POLICIES IN OECD COUNTRIES: MONITORING AND EVALUATION 2007 – ISBN 978-92-64-02746-6 – © OECD 2007158
II.6. EUROPEAN UNION
EAGGF. In 2006, national spending rose to EUR 158 million (by 16%), mainly due to an
increase in EAGGF funds, which had to be co-financed from the national budget. Overall
budgetary spending on agriculture (national and EU) amounted to EUR 265 million in 2005
(up by 17%) and EUR 314 million in 2006 (up by 18%).
Changes in regulations and institutions. The alignment of national legislation with EU
requirements continued in 2005-06, mainly in the areas of agricultural policy measures and
food safety and quality (phyto-sanitary and veterinary regulations, origin protection, and
other). A decree setting conditions for maintaining land in good agricultural and
environmental condition was published in March 2005 and amended in December 2005.
AGRICULTURAL POLICIES IN OECD COUNTRIES: MONITORING AND EVALUATION 2007 – ISBN 978-92-64-02746-6 – © OECD 2007 159
II.6. EUROPEAN UNION
ANNEX 6.A2
Overview of the Implementation of Direct Paymentsin European Union Member States
AGRICULTURAL POLICIES IN OECD COUNTRIES: MONITORING AND EVALUATION 2007 – ISBN 978-92-64-02746-6 – © OECD 2007160
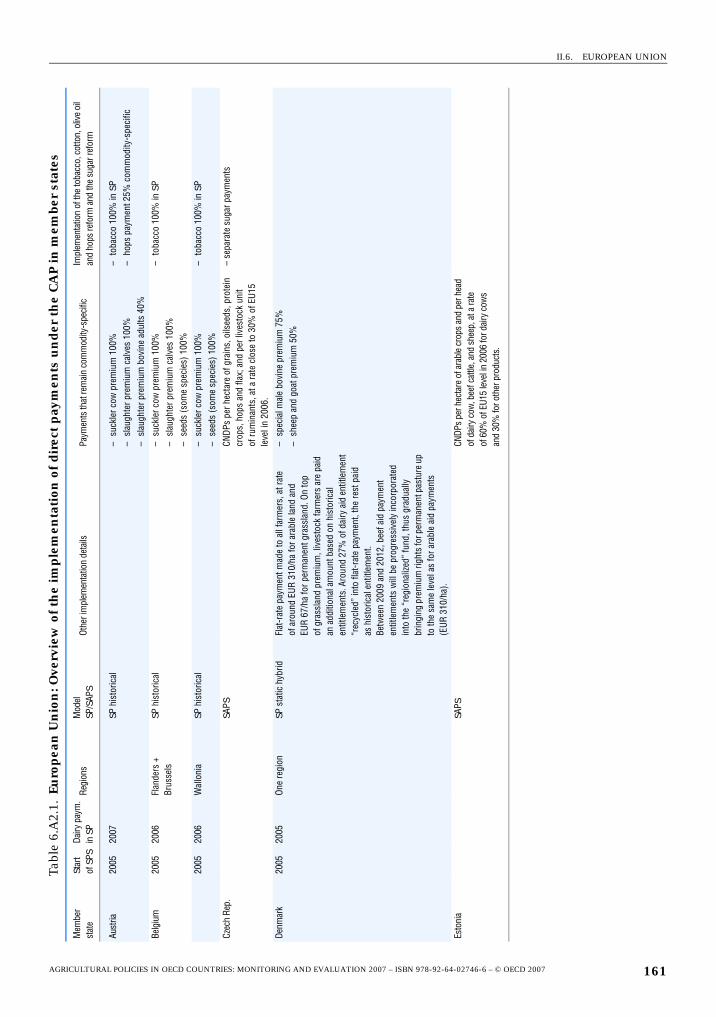
II.6. EUROPEAN UNION
Table
6.A
2.1.
Euro
pea
n U
nio
n: O
verv
iew
of t
he
imp
lem
enta
tion
of d
irec
t p
aym
ents
un
der
th
e C
AP
in m
embe
r st
ates
Mem
ber
stat
eSt
art
of S
PSDa
iry p
aym
.in
SP
Regi
ons
Mod
el
SP/S
APS
Othe
r im
plem
enta
tion
deta
ilsPa
ymen
ts th
at re
mai
n co
mm
odity
-spe
cific
Impl
emen
tatio
n of
the
toba
cco,
cot
ton,
oliv
e oi
l an
d ho
ps re
form
and
the
suga
r ref
orm
Aust
ria20
0520
07SP
his
toric
al–
suck
ler c
ow p
rem
ium
100
%–
slau
ghte
r pre
miu
m c
alve
s 10
0%–
slau
ghte
r pre
miu
m b
ovin
e ad
ults
40%
– to
bacc
o 10
0% in
SP
– ho
ps p
aym
ent 2
5% c
omm
odity
-spe
cific
Belg
ium
2005
2006
Flan
ders
+
Brus
sels
SP h
isto
rical
– su
ckle
r cow
pre
miu
m 1
00%
– sl
augh
ter p
rem
ium
cal
ves
100%
– se
eds
(som
e sp
ecie
s) 1
00%
– to
bacc
o 10
0% in
SP
2005
2006
Wal
loni
aSP
his
toric
al–
suck
ler c
ow p
rem
ium
100
%–
seed
s (s
ome
spec
ies)
100
%–
toba
cco
100%
in S
P
Czec
h Re
p.SA
PSCN
DPs
per h
ecta
re o
f gra
ins,
oils
eeds
, pro
tein
cr
ops,
hop
s an
d fla
x; a
nd p
er li
vest
ock
unit
ofru
min
ants
, at a
rate
clo
se to
30%
of E
U15
leve
l in
2006
.
– se
para
te s
ugar
pay
men
ts
Denm
ark
2005
2005
One
regi
onSP
sta
tic h
ybrid
Flat
-rat
e pa
ymen
t mad
e to
all
farm
ers,
at r
ate
ofar
ound
EUR
310/
ha fo
r ara
ble
land
and
EUR
67/h
a fo
r per
man
ent g
rass
land
. On
top
ofgr
assl
and
prem
ium
, liv
esto
ck fa
rmer
s ar
e pa
id
an a
dditi
onal
am
ount
bas
ed o
n hi
stor
ical
en
title
men
ts. A
roun
d 27
% o
f dai
ry a
id e
ntitl
emen
t “r
ecyc
led”
into
flat
-rat
e pa
ymen
t, th
e re
st p
aid
ashi
stor
ical
ent
itlem
ent.
Betw
een
2009
and
201
2, b
eef a
id p
aym
ent
entit
lem
ents
will
be
prog
ress
ivel
y in
corp
orat
ed
into
the
“reg
iona
lized
” fu
nd, t
hus
grad
ually
br
ingi
ng p
rem
ium
righ
ts fo
r per
man
ent p
astu
re u
p to
the
sam
e le
vel a
s fo
r ara
ble
aid
paym
ents
(E
UR31
0/ha
).
– sp
ecia
l mal
e bo
vine
pre
miu
m 7
5%–
shee
p an
d go
at p
rem
ium
50%
Esto
nia
SAPS
CNDP
s pe
r hec
tare
of a
rabl
e cr
ops
and
per h
ead
ofda
iry c
ow, b
eef c
attle
, and
she
ep, a
t a ra
te
of60
% o
f EU1
5 le
vel i
n 20
06 fo
r dai
ry c
ows
and
30%
for o
ther
pro
duct
s.
AGRICULTURAL POLICIES IN OECD COUNTRIES: MONITORING AND EVALUATION 2007 – ISBN 978-92-64-02746-6 – © OECD 2007 161
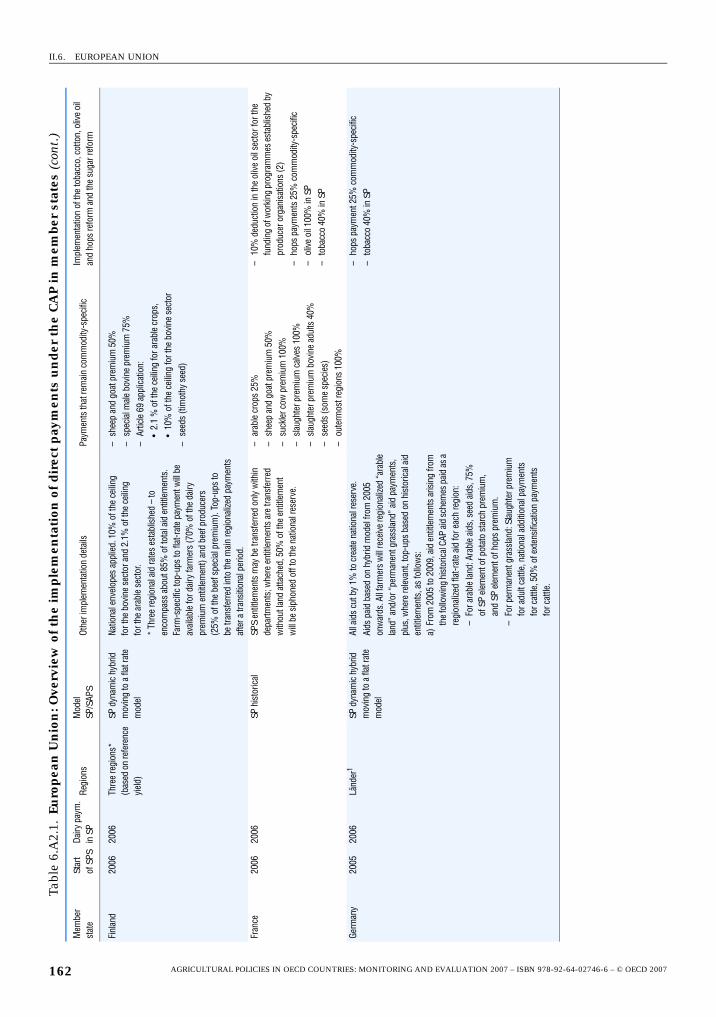
II.6. EUROPEAN UNION
Finl
and
2006
2006
Thre
e re
gion
s*
(bas
ed o
n re
fere
nce
yiel
d)
SP d
ynam
ic h
ybrid
m
ovin
g to
a fl
at ra
te
mod
el
Natio
nal e
nvel
opes
app
lied.
10%
of t
he c
eilin
g fo
rthe
bovi
ne s
ecto
r and
2.1
% o
f the
cei
ling
fort
hear
able
sec
tor.
* Th
ree
regi
onal
aid
rate
s es
tabl
ishe
d–
to
enco
mpa
ss a
bout
85%
of t
otal
aid
ent
itlem
ents
. Fa
rm-s
peci
fic to
p-up
s to
flat
-rat
e pa
ymen
t will
be
avai
labl
e fo
r dai
ry fa
rmer
s (7
0% o
f the
dai
ry
prem
ium
ent
itlem
ent)
and
beef
pro
duce
rs
(25%
ofth
e be
ef s
peci
al p
rem
ium
). To
p-up
s to
be
trans
ferr
ed in
to th
e m
ain
regi
onal
ized
paym
ents
af
ter a
tran
sitio
nal p
erio
d.
– sh
eep
and
goat
pre
miu
m 5
0%–
spec
ial m
ale
bovi
ne p
rem
ium
75%
– Ar
ticle
69
appl
icat
ion:
•2.
1 %
of t
he c
eilin
g fo
r ara
ble
crop
s,•
10%
of t
he c
eilin
g fo
r the
bov
ine
sect
or–
seed
s (ti
mot
hy s
eed)
Fran
ce20
0620
06SP
his
toric
alSP
S en
title
men
ts m
ay b
e tra
nsfe
rred
onl
y w
ithin
de
partm
ents
; whe
re e
ntitl
emen
ts a
re tr
ansf
erre
d w
ithou
t lan
d at
tach
ed, 5
0% o
f the
ent
itlem
ent
will
besi
phon
ed o
ff to
the
natio
nal r
eser
ve.
–ar
able
cro
ps 2
5%–
shee
p an
d go
at p
rem
ium
50%
– su
ckle
r cow
pre
miu
m 1
00%
– sl
augh
ter p
rem
ium
cal
ves
100%
– sl
augh
ter p
rem
ium
bov
ine
adul
ts 4
0%–
seed
s (s
ome
spec
ies)
– ou
term
ost r
egio
ns 1
00%
– 10
% d
educ
tion
in th
e ol
ive
oil s
ecto
r for
the
fund
ing
of w
orki
ng p
rogr
amm
es es
tabl
ishe
d by
pr
oduc
er o
rgan
isat
ions
(2)
– ho
ps p
aym
ents
25%
com
mod
ity-s
peci
fic–
oliv
e oi
l 100
% in
SP
– to
bacc
o 40
% in
SP
Germ
any
2005
2006
Länd
er1
SP d
ynam
ic h
ybrid
m
ovin
g to
a fl
at ra
te
mod
el
All a
ids
cut b
y 1%
to c
reat
e na
tiona
l res
erve
.Ai
ds p
aid
base
d on
hyb
rid m
odel
from
200
5 on
war
ds. A
ll far
mer
s w
ill re
ceiv
e re
gion
alize
d “a
rabl
e la
nd” a
nd/o
r “pe
rman
ent g
rass
land
” aid
pay
men
ts,
plus
, whe
re re
leva
nt, t
op-u
ps b
ased
on
hist
oric
al a
id
entit
lem
ents
, as
follo
ws:
a)Fr
om 2
005
to 2
009,
aid
ent
itlem
ents
aris
ing
from
th
e fol
low
ing
hist
oric
al C
AP ai
d sc
hem
es p
aid
as a
regi
onal
ized
flat-r
ate
aid
for e
ach
regi
on:
– Fo
r ara
ble
land
: Ara
ble
aids
, see
d ai
ds, 7
5%
ofSP
ele
men
t of p
otat
o st
arch
pre
miu
m,
and
SP e
lem
ent o
f hop
s pr
emiu
m.
– Fo
r per
man
ent g
rass
land
: Sla
ught
er p
rem
ium
fo
r adu
lt ca
ttle,
nat
iona
l add
ition
al p
aym
ents
fo
rcat
tle, 5
0% o
f ext
ensi
ficat
ion
paym
ents
fo
rcat
tle.
– ho
ps p
aym
ent 2
5% c
omm
odity
-spe
cific
– to
bacc
o 40
% in
SP
Tabl
e 6.
A2.
1.Eu
rop
ean
Un
ion
: Ove
rvie
w o
f th
e im
ple
men
tati
on o
f dir
ect
pay
men
ts u
nd
er t
he
CA
P in
mem
ber
stat
es (
cont
.)
Mem
ber
stat
eSt
art
of S
PSDa
iry p
aym
.in
SP
Regi
ons
Mod
el
SP/S
APS
Othe
r im
plem
enta
tion
deta
ilsPa
ymen
ts th
at re
mai
n co
mm
odity
-spe
cific
Impl
emen
tatio
n of
the
toba
cco,
cot
ton,
oliv
e oi
l an
d ho
ps re
form
and
the
suga
r ref
orm
AGRICULTURAL POLICIES IN OECD COUNTRIES: MONITORING AND EVALUATION 2007 – ISBN 978-92-64-02746-6 – © OECD 2007162
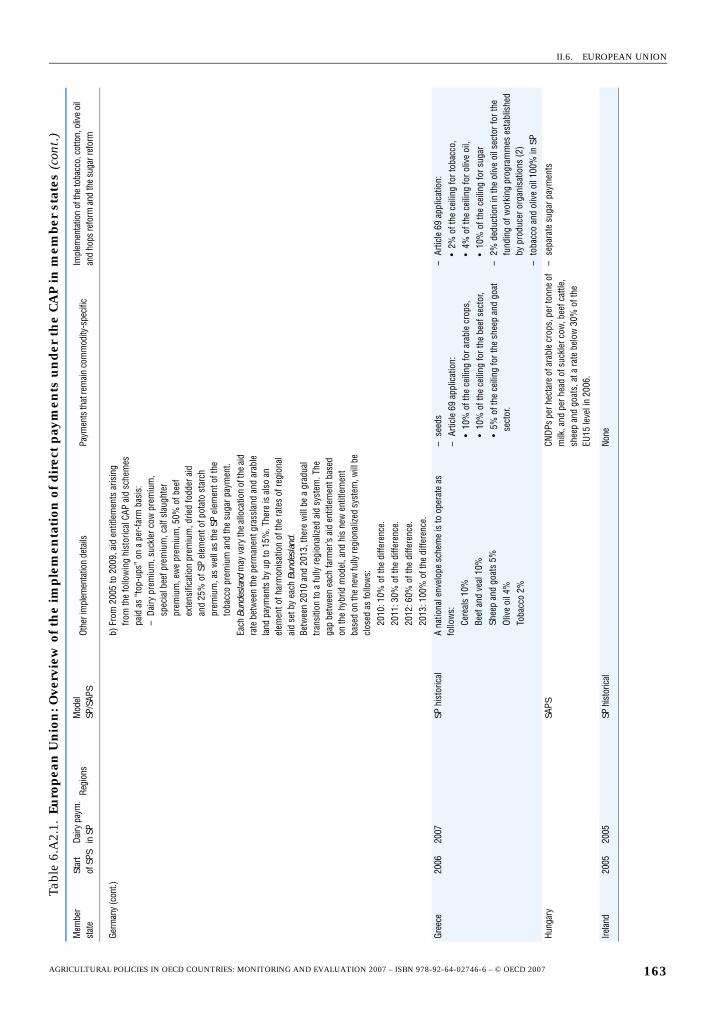
II.6. EUROPEAN UNION
Germ
any
(con
t.)b)
From
200
5 to
200
9, a
id e
ntitl
emen
ts a
risin
g fro
m th
e fo
llow
ing
hist
oric
al C
AP a
id s
chem
es
paid
as
“top
-ups
” on
a p
er-f
arm
bas
is:
– D
airy
pre
miu
m, s
uckl
er c
ow p
rem
ium
, sp
ecia
l bee
f pre
miu
m, c
alf s
laug
hter
pr
emiu
m, e
we
prem
ium
, 50%
of b
eef
exte
nsifi
catio
n pr
emiu
m, d
ried
fodd
er a
id
and
25%
of S
P el
emen
t of p
otat
o st
arch
pr
emiu
m, a
s w
ell a
s th
e SP
ele
men
t of t
he
toba
cco
prem
ium
and
the
suga
r pay
men
t.Ea
ch B
unde
slan
d m
ay v
ary
the
allo
catio
n of
the
aid
rate
bet
wee
n th
e pe
rman
ent g
rass
land
and
ara
ble
land
pay
men
ts b
y up
to 1
5%. T
here
is a
lso
an
elem
ent o
f har
mon
isat
ion
of th
e ra
tes
of re
gion
al
aid
set b
y ea
ch B
unde
slan
d.Be
twee
n 20
10 a
nd 2
013,
ther
e w
ill b
e a
grad
ual
trans
ition
to a
fully
regi
onal
ized
aid
syst
em. T
he
gap
betw
een
each
farm
er’s
aid
entit
lem
ent b
ased
on
the
hybr
id m
odel
, and
his
new
ent
itlem
ent
base
d on
the
new
fully
regi
onal
ized
syst
em, w
ill b
e cl
osed
as
follo
ws:
2010
: 10%
of t
he d
iffer
ence
.20
11: 3
0% o
f the
diff
eren
ce.
2012
: 60%
of t
he d
iffer
ence
.20
13: 1
00%
of t
he d
iffer
ence
.
Gree
ce20
0620
07SP
his
toric
alA
natio
nal e
nvel
ope
sche
me
is to
ope
rate
as
follo
ws:
Cere
als
10%
Beef
and
vea
l 10%
Shee
p an
d go
ats
5%Ol
ive
oil 4
%To
bacc
o 2%
– se
eds
– Ar
ticle
69
appl
icat
ion:
•10
% o
f the
cei
ling
for a
rabl
e cr
ops,
•10
% o
f the
cei
ling
for t
he b
eef s
ecto
r,•
5% o
f the
cei
ling
for t
he s
heep
and
goa
t se
ctor
.
– Ar
ticle
69
appl
icat
ion:
•2%
of t
he c
eilin
g fo
r tob
acco
,•
4% o
f the
cei
ling
for o
live
oil,
•10
% o
f the
cei
ling
for s
ugar
– 2%
ded
uctio
n in
the
oliv
e oi
l sec
tor f
or th
e fu
ndin
g of
wor
king
pro
gram
mes
est
ablis
hed
by p
rodu
cer o
rgan
isat
ions
(2)
– to
bacc
o an
d ol
ive
oil 1
00%
in S
P
Hung
ary
SAPS
CNDP
s pe
r hec
tare
of a
rabl
e cr
ops,
per
tonn
e of
m
ilk, a
nd p
er h
ead
of s
uckl
er c
ow, b
eef c
attle
, sh
eep
and
goat
s, a
t a ra
te b
elow
30%
of t
he
EU15
leve
l in
2006
.
– se
para
te s
ugar
pay
men
ts
Irela
nd20
0520
05SP
his
toric
alNo
ne
Tabl
e 6.
A2.
1.Eu
rop
ean
Un
ion
: Ove
rvie
w o
f th
e im
ple
men
tati
on o
f dir
ect
pay
men
ts u
nd
er t
he
CA
P in
mem
ber
stat
es (
cont
.)
Mem
ber
stat
eSt
art
of S
PSDa
iry p
aym
.in
SP
Regi
ons
Mod
el
SP/S
APS
Othe
r im
plem
enta
tion
deta
ilsPa
ymen
ts th
at re
mai
n co
mm
odity
-spe
cific
Impl
emen
tatio
n of
the
toba
cco,
cot
ton,
oliv
e oi
l an
d ho
ps re
form
and
the
suga
r ref
orm
AGRICULTURAL POLICIES IN OECD COUNTRIES: MONITORING AND EVALUATION 2007 – ISBN 978-92-64-02746-6 – © OECD 2007 163
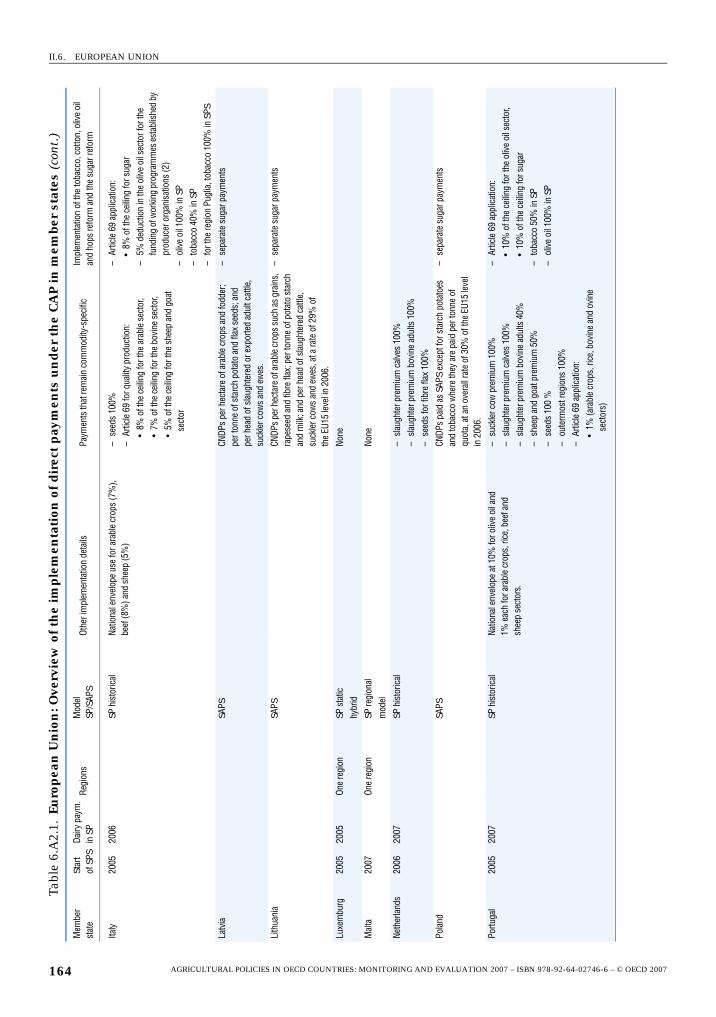
II.6. EUROPEAN UNION
Italy
2005
2006
SP h
isto
rical
Natio
nal e
nvel
ope
use
for a
rabl
e cr
ops
(7%
), be
ef(8
%) a
nd s
heep
(5%
)–
seed
s 10
0%–
Artic
le 6
9 fo
r qua
lity
prod
uctio
n:•
8% o
f the
cei
ling
for t
he a
rabl
e se
ctor
,•
7% o
f the
cei
ling
for t
he b
ovin
e se
ctor
,•
5% o
f the
cei
ling
for t
he s
heep
and
goa
t se
ctor
– Ar
ticle
69
appl
icat
ion:
•8%
of t
he c
eilin
g fo
r sug
ar–
5% d
educ
tion
in th
e ol
ive
oil s
ecto
r for
the
fund
ing
of w
orki
ng p
rogr
amm
es es
tabl
ishe
d by
pr
oduc
er o
rgan
isat
ions
(2)
– ol
ive
oil 1
00%
in S
P–
toba
cco
40%
in S
P–
for t
he re
gion
Pug
lia, t
obac
co 1
00%
in S
PS
Latv
iaSA
PSCN
DPs
per h
ecta
re o
f ara
ble
crop
s an
d fo
dder
; pe
rton
ne o
f sta
rch
pota
to a
nd fl
ax s
eeds
; and
pe
rhea
d of
sla
ught
ered
or e
xpor
ted
adul
t cat
tle,
suck
ler c
ows
and
ewes
.
– se
para
te s
ugar
pay
men
ts
Lith
uani
aSA
PSCN
DPs
per h
ecta
re o
f ara
ble
crop
s su
ch a
s gr
ains
, ra
pese
ed a
nd fi
bre
flax;
per
tonn
e of
pot
ato
star
ch
and
milk
; and
per
hea
d of
sla
ught
ered
cat
tle,
suck
ler c
ows
and
ewes
, at a
rate
of 2
9% o
f th
eEU
15 le
vel i
n 20
06.
– se
para
te s
ugar
pay
men
ts
Luxe
mbu
rg20
0520
05On
e re
gion
SP s
tatic
hybr
idNo
ne
Mal
ta20
07On
e re
gion
SP re
gion
alm
odel
None
Neth
erla
nds
2006
2007
SP h
isto
rical
– sl
augh
ter p
rem
ium
cal
ves
100%
– sl
augh
ter p
rem
ium
bov
ine
adul
ts 1
00%
– se
eds
for f
ibre
flax
100
%
Pola
ndSA
PSCN
DPs
paid
as
SAPS
exc
ept f
or s
tarc
h po
tato
es
and
toba
cco
whe
re th
ey a
re p
aid
per t
onne
of
quot
a, a
t an
over
all r
ate
of30
% o
f the
EU1
5 le
vel
in20
06.
– se
para
te s
ugar
pay
men
ts
Portu
gal
2005
2007
SP h
isto
rical
Natio
nal e
nvel
ope
at 1
0% fo
r oliv
e oi
l and
1%
each
for a
rabl
e cr
ops,
rice
, bee
f and
sh
eep
sect
ors.
– su
ckle
r cow
pre
miu
m 1
00%
– sl
augh
ter p
rem
ium
cal
ves
100%
– sl
augh
ter p
rem
ium
bov
ine
adul
ts 4
0%–
shee
p an
d go
at p
rem
ium
50%
– se
eds
100
%–
oute
rmos
t reg
ions
100
%–
Artic
le 6
9 ap
plic
atio
n:•
1% (a
rabl
e cr
ops,
rice
, bov
ine
and
ovin
e se
ctor
s)
– Ar
ticle
69
appl
icat
ion:
•10
% o
f the
cei
ling
for t
he o
live
oil s
ecto
r,•
10%
of t
he c
eilin
g fo
r sug
ar–
toba
cco
50%
in S
P–
oliv
e oi
l 100
% in
SP
Tabl
e 6.
A2.
1.Eu
rop
ean
Un
ion
: Ove
rvie
w o
f th
e im
ple
men
tati
on o
f dir
ect
pay
men
ts u
nd
er t
he
CA
P in
mem
ber
stat
es (
cont
.)
Mem
ber
stat
eSt
art
of S
PSDa
iry p
aym
.in
SP
Regi
ons
Mod
el
SP/S
APS
Othe
r im
plem
enta
tion
deta
ilsPa
ymen
ts th
at re
mai
n co
mm
odity
-spe
cific
Impl
emen
tatio
n of
the
toba
cco,
cot
ton,
oliv
e oi
l an
d ho
ps re
form
and
the
suga
r ref
orm
AGRICULTURAL POLICIES IN OECD COUNTRIES: MONITORING AND EVALUATION 2007 – ISBN 978-92-64-02746-6 – © OECD 2007164
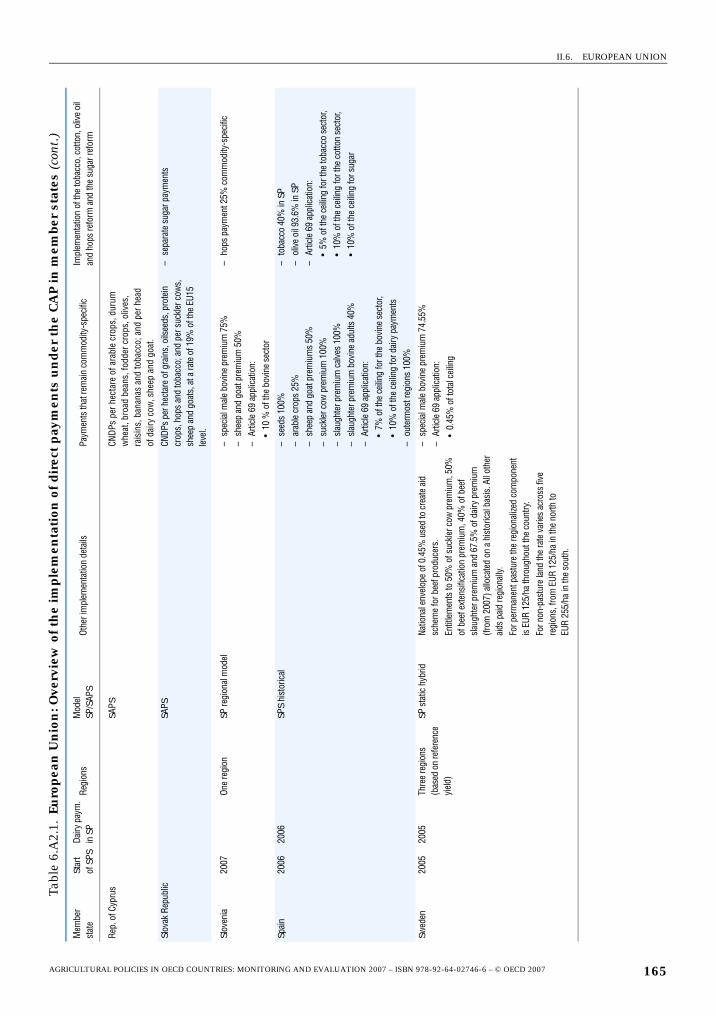
II.6. EUROPEAN UNION
Rep.
of C
ypru
sSA
PSCN
DPs
per h
ecta
re o
f ara
ble
crop
s, d
urum
w
heat
, bro
ad b
eans
, fod
der c
rops
, oliv
es,
rais
ins,
ban
anas
and
toba
cco;
and
per
hea
d of
dairy
cow
, she
ep a
nd g
oat.
Slov
ak R
epub
licSA
PSCN
DPs
per h
ecta
re o
f gra
ins,
oils
eeds
, pro
tein
cr
ops,
hop
s an
d to
bacc
o; a
nd p
er s
uckl
er c
ows,
sh
eep
and
goat
s, a
t a ra
te o
f 19%
of t
heEU
15
leve
l.
– se
para
te s
ugar
pay
men
ts
Slov
enia
2007
One
regi
onSP
regi
onal
mod
el–
spec
ial m
ale
bovi
ne p
rem
ium
75%
– sh
eep
and
goat
pre
miu
m 5
0%–
Artic
le 6
9 ap
plic
atio
n:•
10 %
of t
he b
ovin
e se
ctor
– ho
ps p
aym
ent 2
5% c
omm
odity
-spe
cific
Spai
n20
0620
06SP
S hi
stor
ical
– se
eds
100%
– ar
able
cro
ps 2
5%–
shee
p an
d go
at p
rem
ium
s 50
%–
suck
ler c
ow p
rem
ium
100
%–
slau
ghte
r pre
miu
m c
alve
s 10
0%–
slau
ghte
r pre
miu
m b
ovin
e ad
ults
40%
– Ar
ticle
69
appl
icat
ion:
•7%
of t
he c
eilin
g fo
r the
bov
ine
sect
or,
•10
% o
f the
cei
ling
for d
airy
pay
men
ts–
oute
rmos
t reg
ions
100
%
– to
bacc
o 40
% in
SP
– ol
ive
oil 9
3.6%
in S
P–
Artic
le 6
9 ap
plic
atio
n:•
5% o
f the
cei
ling
for t
he to
bacc
o se
ctor
,•
10%
of t
he c
eilin
g fo
r the
cot
ton
sect
or,
•10
% o
f the
cei
ling
for s
ugar
Swed
en20
0520
05Th
ree
regi
ons
(bas
ed o
n re
fere
nce
yiel
d)
SP s
tatic
hyb
ridNa
tiona
l env
elop
e of
0.4
5% u
sed
to c
reat
e ai
d sc
hem
e fo
r bee
f pro
duce
rs.
Entit
lem
ents
to 5
0% o
f suc
kler
cow
pre
miu
m, 5
0%
of b
eef e
xten
sific
atio
n pr
emiu
m, 4
0% o
f bee
f sl
augh
ter p
rem
ium
and
67.
5% o
f dai
ry p
rem
ium
(fr
om 2
007)
allo
cate
d on
a h
isto
rical
bas
is. A
ll ot
her
aids
pai
d re
gion
ally.
For p
erm
anen
t pas
ture
the
regi
onal
ized
com
pone
nt
isEU
R12
5/ha
thro
ugho
ut th
e co
untry
.Fo
r non
-pas
ture
land
the
rate
var
ies
acro
ss fi
ve
regi
ons,
from
EUR
125/
ha in
the
north
to
EUR
255/
ha in
the
sout
h.
– sp
ecia
l mal
e bo
vine
pre
miu
m 7
4.55
%–
Artic
le 6
9 ap
plic
atio
n:•
0.45
% o
f tot
al c
eilin
g
Tabl
e 6.
A2.
1.Eu
rop
ean
Un
ion
: Ove
rvie
w o
f th
e im
ple
men
tati
on o
f dir
ect
pay
men
ts u
nd
er t
he
CA
P in
mem
ber
stat
es (
cont
.)
Mem
ber
stat
eSt
art
of S
PSDa
iry p
aym
.in
SP
Regi
ons
Mod
el
SP/S
APS
Othe
r im
plem
enta
tion
deta
ilsPa
ymen
ts th
at re
mai
n co
mm
odity
-spe
cific
Impl
emen
tatio
n of
the
toba
cco,
cot
ton,
oliv
e oi
l an
d ho
ps re
form
and
the
suga
r ref
orm
AGRICULTURAL POLICIES IN OECD COUNTRIES: MONITORING AND EVALUATION 2007 – ISBN 978-92-64-02746-6 – © OECD 2007 165
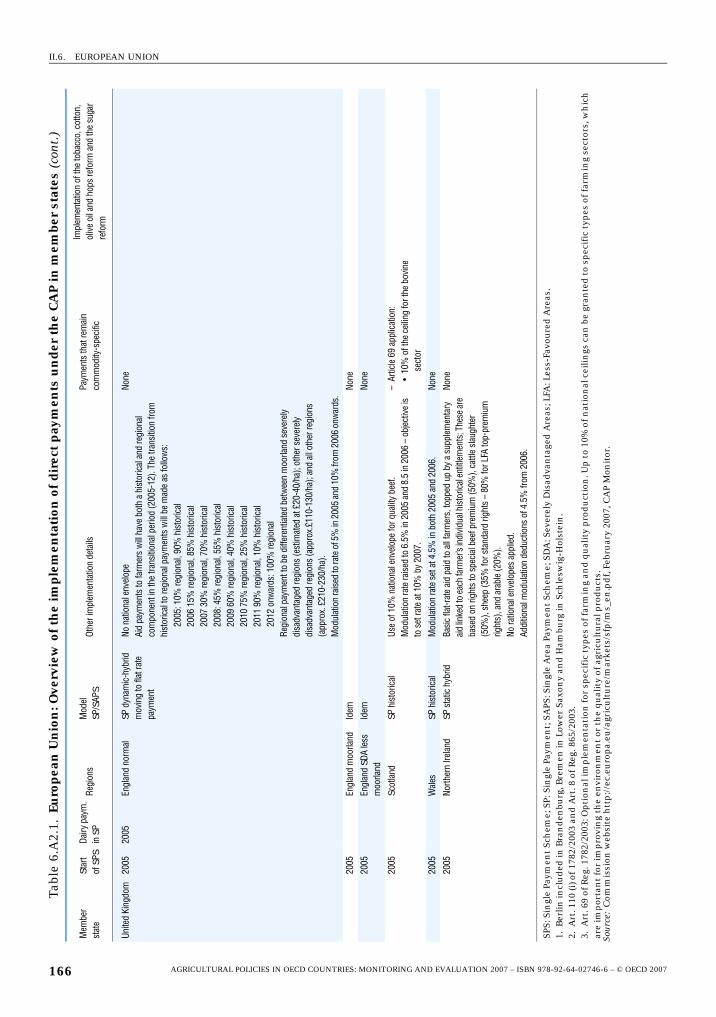
II.6. EUROPEAN UNION
Table
6.A
2.1.
Euro
pea
n U
nio
n: O
verv
iew
of t
he
imp
lem
enta
tion
of d
irec
t p
aym
ents
un
der
th
e C
AP
in m
embe
r st
ates
(con
t.)
Mem
ber
stat
eSt
art
of S
PSDa
iry p
aym
.in
SP
Regi
ons
Mod
el
SP/S
APS
Othe
r im
plem
enta
tion
deta
ilsPa
ymen
ts th
at re
mai
n co
mm
odity
-spe
cific
Impl
emen
tatio
n of
the
toba
cco,
cot
ton,
ol
ive
oil a
nd h
ops
refo
rm a
nd th
e su
gar
refo
rm
Unite
d Ki
ngdo
m20
0520
05En
glan
d no
rmal
SP d
ynam
ic-h
ybrid
m
ovin
g to
flat
rate
pa
ymen
t
No n
atio
nal e
nvel
ope
Aid
paym
ents
to fa
rmer
s w
ill ha
ve b
oth
a hi
stor
ical
and
regi
onal
co
mpo
nent
in th
e tra
nsiti
onal
per
iod
(200
5-12
). Th
e tra
nsiti
on fr
om
hist
oric
al to
regi
onal
pay
men
ts w
ill be
mad
e as
follo
ws:
2005
: 10%
regi
onal
, 90%
his
toric
al20
06 1
5% re
gion
al, 8
5% h
isto
rical
2007
30%
regi
onal
, 70%
his
toric
al20
08: 4
5% re
gion
al, 5
5% h
isto
rical
2009
60%
regi
onal
, 40%
his
toric
al20
10 7
5% re
gion
al, 2
5% h
isto
rical
2011
90%
regi
onal
, 10%
his
toric
al20
12 o
nwar
ds: 1
00%
regi
onal
Regi
onal
pay
men
t to
be d
iffer
entia
ted
betw
een
moo
rland
sev
erel
y di
sadv
anta
ged
regi
ons
(est
imat
ed a
t £20
-40/
ha);
othe
r sev
erel
y di
sadv
anta
ged
regi
ons
(app
rox.
£110
-130
/ha)
; and
all
othe
r reg
ions
(a
ppro
x. £
210-
230/
ha).
Mod
ulat
ion
rais
ed to
rate
of 5
% in
200
5 an
d 10
% fr
om 2
006
onw
ards
.
None
2005
Engl
and
moo
rland
Idem
None
2005
Engl
and
SDA
less
m
oorla
ndId
emNo
ne
2005
Scot
land
SP h
isto
rical
Use
of 1
0% n
atio
nal e
nvel
ope
for q
ualit
y be
ef.
Mod
ulat
ion
rate
rais
ed to
6.5
% in
200
5 an
d 8.
5 in
200
6–
obje
ctiv
e is
to
set
rate
at 1
0% b
y 20
07.
–Ar
ticle
69
appl
icat
ion:
•10
% o
f the
cei
ling
for t
he b
ovin
e se
ctor
2005
Wal
esSP
his
toric
alM
odul
atio
n ra
te s
et a
t 4.5
% in
bot
h 20
05 a
nd 2
006.
None
2005
North
ern
Irela
ndSP
sta
tic h
ybrid
Basi
c fla
t-rat
e ai
d pa
id to
all
farm
ers,
topp
ed u
p by
a s
uppl
emen
tary
ai
d lin
ked
to ea
ch fa
rmer
’s in
divi
dual
hist
oric
al en
title
men
ts; T
hese
are
base
d on
righ
ts to
spe
cial
bee
f pre
miu
m (5
0%),
cattl
e sl
augh
ter
(50%
), sh
eep
(35%
for s
tand
ard
right
s–
80%
for L
FA to
p-pr
emiu
m
right
s), a
nd a
rabl
e (2
0%).
No ra
tiona
l env
elop
es a
pplie
d.Ad
ditio
nal m
odul
atio
n de
duct
ions
of 4
.5%
from
200
6.
None
SPS:
Sin
gle
Paym
ent
Sch
eme;
SP:
Sin
gle
Paym
ent;
SA
PS: S
ingl
e A
rea
Paym
ent
Sch
eme;
SD
A: S
ever
ely
Dis
adva
nta
ged
Are
as; L
FA: L
ess-
Favo
ure
d A
reas
.1.
Ber
lin in
clu
ded
in B
ran
den
burg
, Bre
men
in L
ower
Sax
ony
and
Ham
burg
in S
chle
swig
-Hol
stei
n.
2.A
rt. 1
10 (i
) of
1782
/200
3 an
d A
rt. 8
of
Reg
. 865
/200
3.3.
Art
. 69
of R
eg. 1
782/
2003
: Op
tion
al im
ple
men
tati
on f
or s
pec
ific
typ
es o
f fa
rmin
g an
d q
ual
ity
pro
du
ctio
n. U
p t
o 10
% o
f nat
ion
al c
eilin
gs c
an b
e gr
ante
d t
o sp
ecif
ic t
ypes
of
farm
ing
sect
ors,
wh
ich
are
imp
orta
nt
for
imp
rovi
ng
the
envi
ron
men
t or
th
e q
ual
ity
of a
gric
ult
ura
l pro
du
cts.
Sou
rce:
Com
mis
sion
web
site
htt
p:/
/ec.
euro
pa.
eu/a
gric
ult
ure
/mar
kets
/sfp
/ms_
en.p
df,
Feb
ruar
y 20
07, C
AP
Mon
itor
.
AGRICULTURAL POLICIES IN OECD COUNTRIES: MONITORING AND EVALUATION 2007 – ISBN 978-92-64-02746-6 – © OECD 2007166
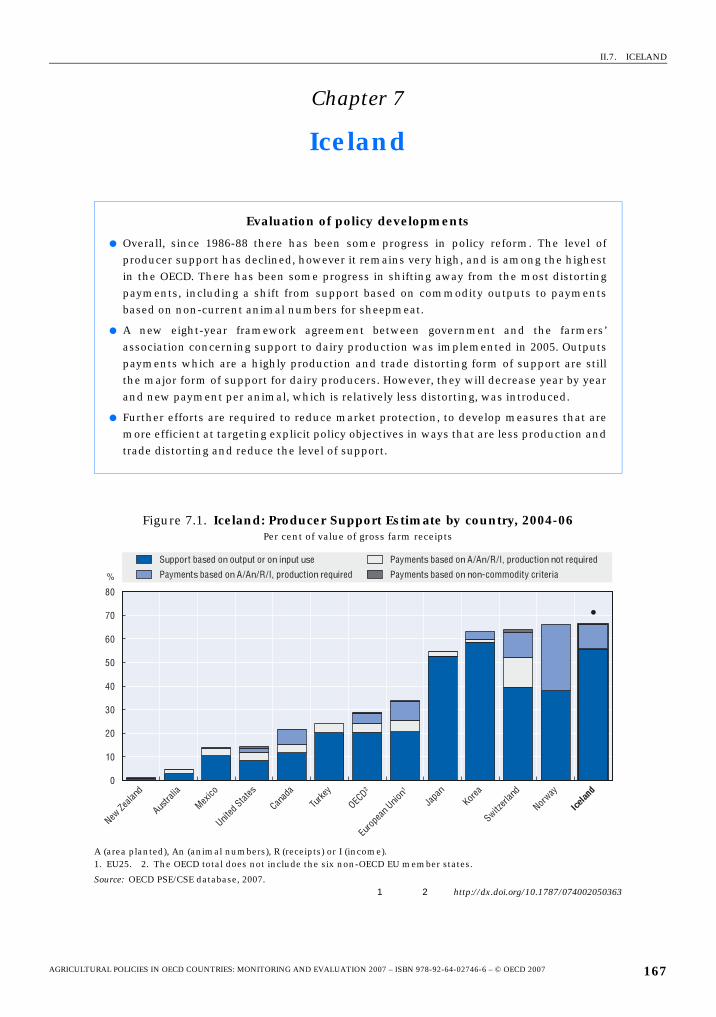
II.7. ICELAND
Chapter 7
Iceland
Evaluation of policy developments
● Overall, since 1986-88 there has been some progress in policy reform. The level ofproducer support has declined, however it remains very high, and is among the highestin the OECD. There has been some progress in shifting away from the most distortingpayments, including a shift from support based on commodity outputs to paymentsbased on non-current animal numbers for sheepmeat.
● A new eight-year framework agreement between government and the farmers’association concerning support to dairy production was implemented in 2005. Outputspayments which are a highly production and trade distorting form of support are stillthe major form of support for dairy producers. However, they will decrease year by yearand new payment per animal, which is relatively less distorting, was introduced.
● Further efforts are required to reduce market protection, to develop measures that aremore efficient at targeting explicit policy objectives in ways that are less production andtrade distorting and reduce the level of support.
Figure 7.1. Iceland: Producer Support Estimate by country, 2004-06Per cent of value of gross farm receipts
A (area planted), An (animal numbers), R (receipts) or I (income).1. EU25. 2. The OECD total does not include the six non-OECD EU member states.
Source: OECD PSE/CSE database, 2007.1 2 http://dx.doi.org/10.1787/074002050363
0
10
20
30
40
50
60
70
80
New Ze
aland
Austra
lia
Mexico
United
States
Canad
a
Turke
y
OECD2
Euro
pean
Unio
n1
Japa
nKor
ea
Switzerl
and
Norway
Icelan
d
%
Support based on output or on input use
Payments based on A/An/R/I, production required
Payments based on A/An/R/I, production not required
Payments based on non-commodity criteria
AGRICULTURAL POLICIES IN OECD COUNTRIES: MONITORING AND EVALUATION 2007 – ISBN 978-92-64-02746-6 – © OECD 2007 167
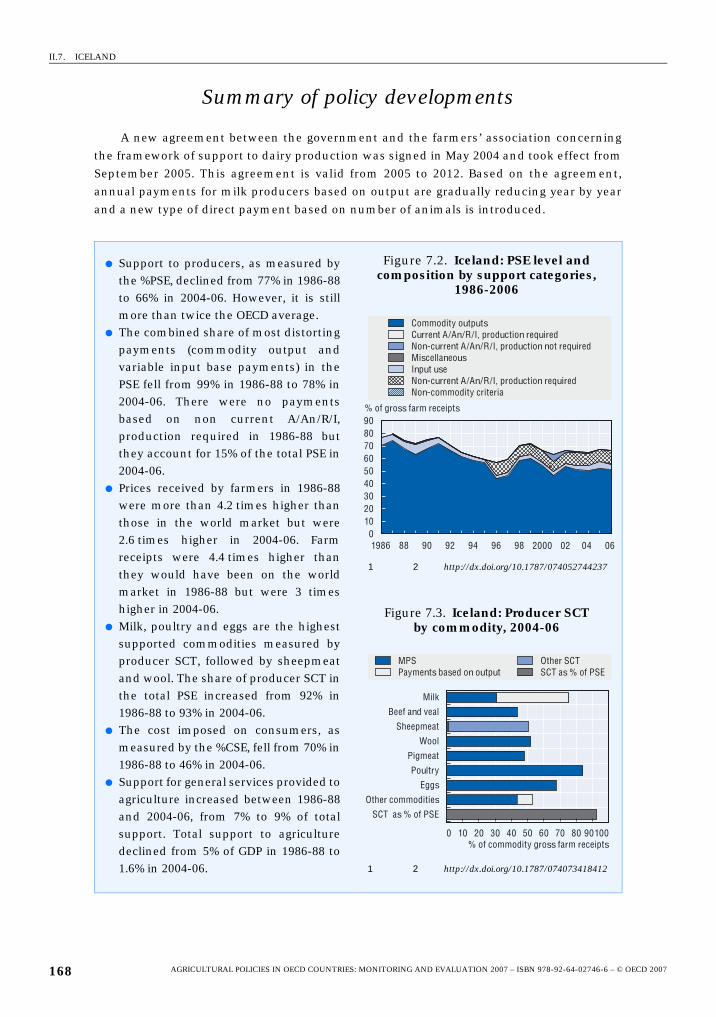
II.7. ICELAND
Summary of policy developments
A new agreement between the government and the farmers’ association concerning
the framework of support to dairy production was signed in May 2004 and took effect from
September 2005. This agreement is valid from 2005 to 2012. Based on the agreement,
annual payments for milk producers based on output are gradually reducing year by year
and a new type of direct payment based on number of animals is introduced.
● Support to producers, as measured bythe %PSE, declined from 77% in 1986-88to 66% in 2004-06. However, it is stillmore than twice the OECD average.
● The combined share of most distortingpayments (commodity output andvariable input base payments) in thePSE fell from 99% in 1986-88 to 78% in2004-06. There were no paymentsbased on non current A/An/R/I,production required in 1986-88 butthey account for 15% of the total PSE in2004-06.
● Prices received by farmers in 1986-88were more than 4.2 times higher thanthose in the world market but were2.6 times higher in 2004-06. Farmreceipts were 4.4 times higher thanthey would have been on the worldmarket in 1986-88 but were 3 timeshigher in 2004-06.
● Milk, poultry and eggs are the highestsupported commodities measured byproducer SCT, followed by sheepmeatand wool. The share of producer SCT inthe total PSE increased from 92% in1986-88 to 93% in 2004-06.
● The cost imposed on consumers, asmeasured by the %CSE, fell from 70% in1986-88 to 46% in 2004-06.
● Support for general services provided toagriculture increased between 1986-88and 2004-06, from 7% to 9% of totalsupport. Total support to agriculturedeclined from 5% of GDP in 1986-88 to1.6% in 2004-06.
Figure 7.2. Iceland: PSE level and composition by support categories,
1986-2006
1 2 http://dx.doi.org/10.1787/074052744237
Figure 7.3. Iceland: Producer SCT by commodity, 2004-06
1 2 http://dx.doi.org/10.1787/074073418412
% of gross farm receipts
Commodity outputsCurrent A/An/R/I, production requiredNon-current A/An/R/I, production not requiredMiscellaneousInput useNon-current A/An/R/I, production requiredNon-commodity criteria
0102030405060708090
1986 88 90 92 94 96 98 2000 02 04 06
MPS Payments based on output
Other SCTSCT as % of PSE
Milk
Beef and veal
Sheepmeat
Wool
Pigmeat
Poultry
Eggs
Other commodities
SCT as % of PSE
0 10 20 30 40 50 60 70 80 90100% of commodity gross farm receipts
AGRICULTURAL POLICIES IN OECD COUNTRIES: MONITORING AND EVALUATION 2007 – ISBN 978-92-64-02746-6 – © OECD 2007168
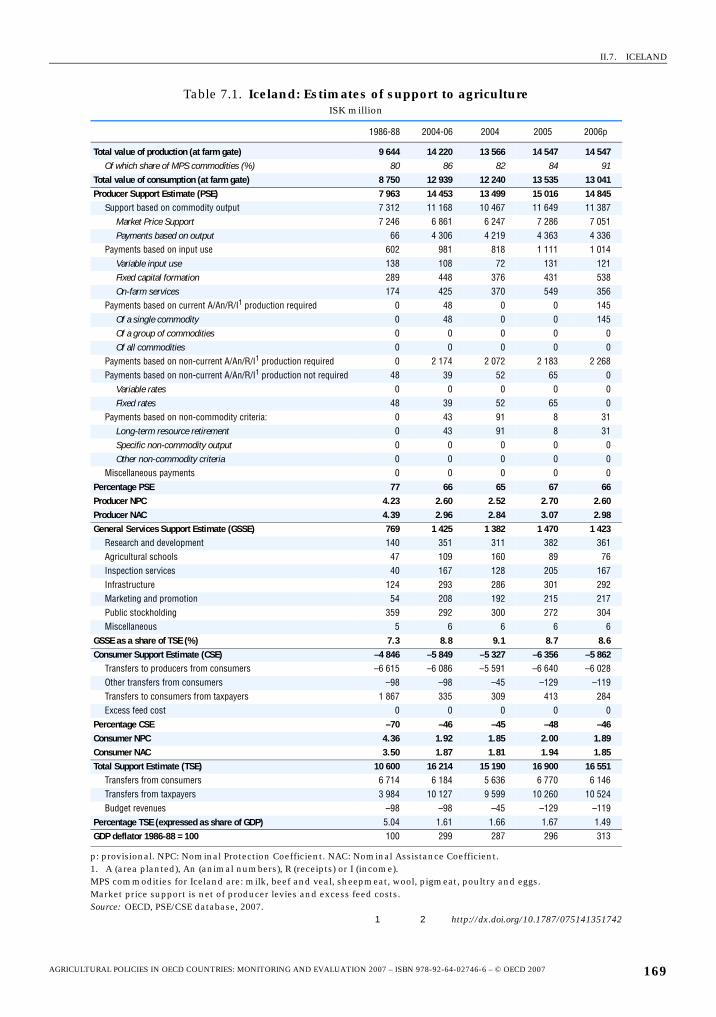
II.7. ICELAND
Table 7.1. Iceland: Estimates of support to agricultureISK million
1986-88 2004-06 2004 2005 2006p
Total value of production (at farm gate) 9 644 14 220 13 566 14 547 14 547Of which share of MPS commodities (%) 80 86 82 84 91
Total value of consumption (at farm gate) 8 750 12 939 12 240 13 535 13 041Producer Support Estimate (PSE) 7 963 14 453 13 499 15 016 14 845
Support based on commodity output 7 312 11 168 10 467 11 649 11 387Market Price Support 7 246 6 861 6 247 7 286 7 051Payments based on output 66 4 306 4 219 4 363 4 336
Payments based on input use 602 981 818 1 111 1 014Variable input use 138 108 72 131 121Fixed capital formation 289 448 376 431 538On-farm services 174 425 370 549 356
Payments based on current A/An/R/I1 production required 0 48 0 0 145Of a single commodity 0 48 0 0 145Of a group of commodities 0 0 0 0 0Of all commodities 0 0 0 0 0
Payments based on non-current A/An/R/I1 production required 0 2 174 2 072 2 183 2 268Payments based on non-current A/An/R/I1 production not required 48 39 52 65 0
Variable rates 0 0 0 0 0Fixed rates 48 39 52 65 0
Payments based on non-commodity criteria: 0 43 91 8 31Long-term resource retirement 0 43 91 8 31Specific non-commodity output 0 0 0 0 0Other non-commodity criteria 0 0 0 0 0
Miscellaneous payments 0 0 0 0 0Percentage PSE 77 66 65 67 66Producer NPC 4.23 2.60 2.52 2.70 2.60Producer NAC 4.39 2.96 2.84 3.07 2.98General Services Support Estimate (GSSE) 769 1 425 1 382 1 470 1 423
Research and development 140 351 311 382 361Agricultural schools 47 109 160 89 76Inspection services 40 167 128 205 167Infrastructure 124 293 286 301 292Marketing and promotion 54 208 192 215 217Public stockholding 359 292 300 272 304Miscellaneous 5 6 6 6 6
GSSE as a share of TSE (%) 7.3 8.8 9.1 8.7 8.6Consumer Support Estimate (CSE) –4 846 –5 849 –5 327 –6 356 –5 862
Transfers to producers from consumers –6 615 –6 086 –5 591 –6 640 –6 028Other transfers from consumers –98 –98 –45 –129 –119Transfers to consumers from taxpayers 1 867 335 309 413 284Excess feed cost 0 0 0 0 0
Percentage CSE –70 –46 –45 –48 –46Consumer NPC 4.36 1.92 1.85 2.00 1.89Consumer NAC 3.50 1.87 1.81 1.94 1.85Total Support Estimate (TSE) 10 600 16 214 15 190 16 900 16 551
Transfers from consumers 6 714 6 184 5 636 6 770 6 146Transfers from taxpayers 3 984 10 127 9 599 10 260 10 524Budget revenues –98 –98 –45 –129 –119
Percentage TSE (expressed as share of GDP) 5.04 1.61 1.66 1.67 1.49GDP deflator 1986-88 = 100 100 299 287 296 313
p: provisional. NPC: Nominal Protection Coefficient. NAC: Nominal Assistance Coefficient.1. A (area planted), An (animal numbers), R (receipts) or I (income).MPS commodities for Iceland are: milk, beef and veal, sheepmeat, wool, pigmeat, poultry and eggs.Market price support is net of producer levies and excess feed costs.Source: OECD, PSE/CSE database, 2007.
1 2 http://dx.doi.org/10.1787/075141351742
AGRICULTURAL POLICIES IN OECD COUNTRIES: MONITORING AND EVALUATION 2007 – ISBN 978-92-64-02746-6 – © OECD 2007 169
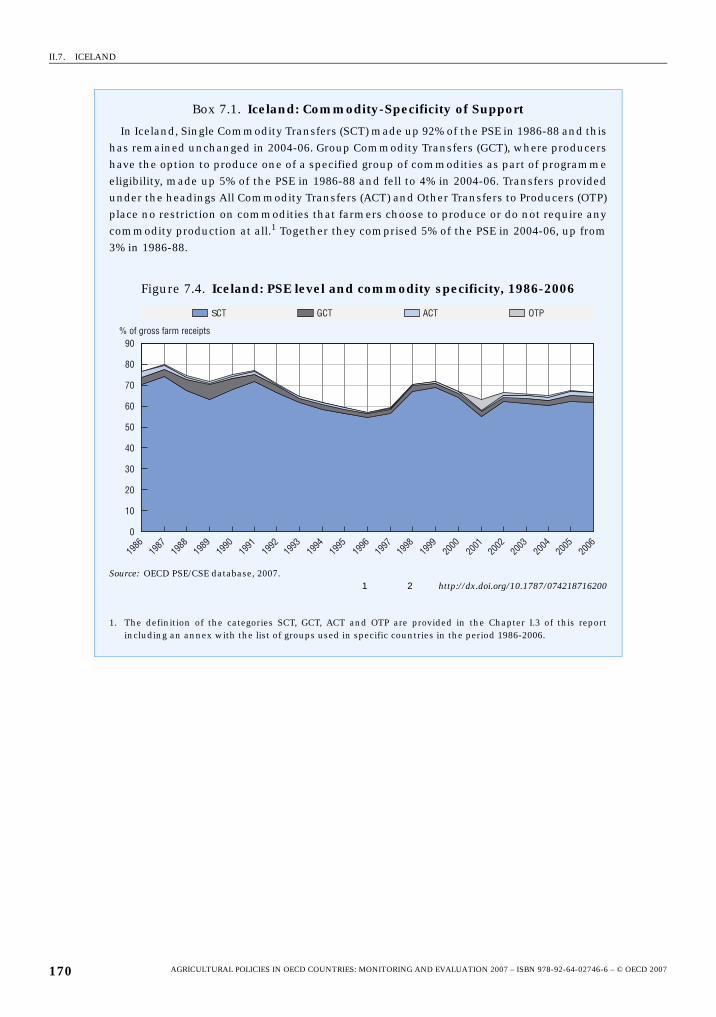
II.7. ICELAND
Box 7.1. Iceland: Commodity-Specificity of Support
In Iceland, Single Commodity Transfers (SCT) made up 92% of the PSE in 1986-88 and thishas remained unchanged in 2004-06. Group Commodity Transfers (GCT), where producershave the option to produce one of a specified group of commodities as part of programmeeligibility, made up 5% of the PSE in 1986-88 and fell to 4% in 2004-06. Transfers providedunder the headings All Commodity Transfers (ACT) and Other Transfers to Producers (OTP)place no restriction on commodities that farmers choose to produce or do not require anycommodity production at all.1 Together they comprised 5% of the PSE in 2004-06, up from3% in 1986-88.
Figure 7.4. Iceland: PSE level and commodity specificity, 1986-2006
Source: OECD PSE/CSE database, 2007.1 2 http://dx.doi.org/10.1787/074218716200
1. The definition of the categories SCT, GCT, ACT and OTP are provided in the Chapter I.3 of this reportincluding an annex with the list of groups used in specific countries in the period 1986-2006.
SCT GCT ACT OTP
90
1986
1987
1988
1989
1990
1991
1992
1993
1994
1995
1996
1997
1998
1999
2000
2001
2002
2003
2004
2005
2006
70
60
50
40
30
10
0
20
80
% of gross farm receipts
AGRICULTURAL POLICIES IN OECD COUNTRIES: MONITORING AND EVALUATION 2007 – ISBN 978-92-64-02746-6 – © OECD 2007170
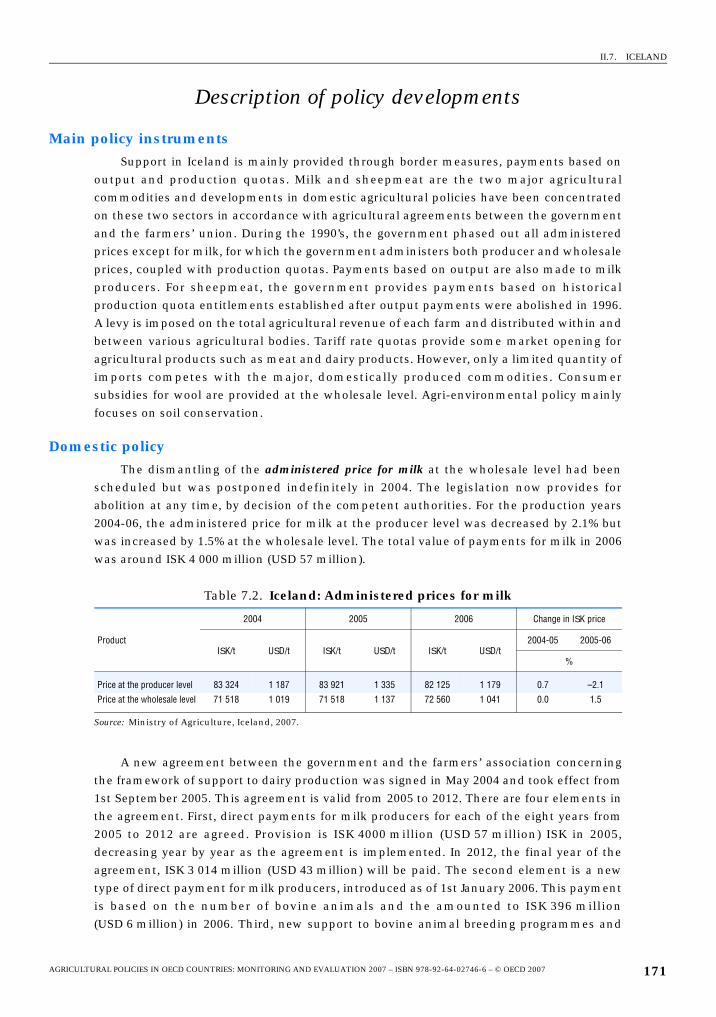
II.7. ICELAND
Description of policy developments
Main policy instrumentsSupport in Iceland is mainly provided through border measures, payments based on
output and production quotas. Milk and sheepmeat are the two major agricultural
commodities and developments in domestic agricultural policies have been concentrated
on these two sectors in accordance with agricultural agreements between the government
and the farmers’ union. During the 1990’s, the government phased out all administered
prices except for milk, for which the government administers both producer and wholesale
prices, coupled with production quotas. Payments based on output are also made to milk
producers. For sheepmeat, the government provides payments based on historical
production quota entitlements established after output payments were abolished in 1996.
A levy is imposed on the total agricultural revenue of each farm and distributed within and
between various agricultural bodies. Tariff rate quotas provide some market opening for
agricultural products such as meat and dairy products. However, only a limited quantity of
imports competes with the major, domestically produced commodities. Consumer
subsidies for wool are provided at the wholesale level. Agri-environmental policy mainly
focuses on soil conservation.
Domestic policyThe dismantling of the administered price for milk at the wholesale level had been
scheduled but was postponed indefinitely in 2004. The legislation now provides for
abolition at any time, by decision of the competent authorities. For the production years
2004-06, the administered price for milk at the producer level was decreased by 2.1% but
was increased by 1.5% at the wholesale level. The total value of payments for milk in 2006
was around ISK 4 000 million (USD 57 million).
A new agreement between the government and the farmers’ association concerning
the framework of support to dairy production was signed in May 2004 and took effect from
1st September 2005. This agreement is valid from 2005 to 2012. There are four elements in
the agreement. First, direct payments for milk producers for each of the eight years from
2005 to 2012 are agreed. Provision is ISK 4000 million (USD 57 million) ISK in 2005,
decreasing year by year as the agreement is implemented. In 2012, the final year of the
agreement, ISK 3 014 million (USD 43 million) will be paid. The second element is a new
type of direct payment for milk producers, introduced as of 1st January 2006. This payment
is based on the number of bovine animals and the amounted to ISK 396 million
(USD 6 million) in 2006. Third, new support to bovine animal breeding programmes and
Table 7.2. Iceland: Administered prices for milk
Product
2004 2005 2006 Change in ISK price
ISK/t USD/t ISK/t USD/t ISK/t USD/t2004-05 2005-06
%
Price at the producer level 83 324 1 187 83 921 1 335 82 125 1 179 0.7 –2.1
Price at the wholesale level 71 518 1 019 71 518 1 137 72 560 1 041 0.0 1.5
Source: Ministry of Agriculture, Iceland, 2007.
AGRICULTURAL POLICIES IN OECD COUNTRIES: MONITORING AND EVALUATION 2007 – ISBN 978-92-64-02746-6 – © OECD 2007 171
II.7. ICELAND
general development issues was introduced from 2005. Fourth, a payment for land
improvement will be introduced from 1st September 2007.
A renewed agreement between the government and the Farmers’ Association
concerning overall agricultural support was signed in May of 2005. The agreement is valid
for the years from 2006 to 2010. The agreement secures ISK 612.7 million (USD 8.8 million)
in 2006. The farmers’ association manages these funds, which are for advisory services,
sheep rearing programme, and developmental programmes, marketing programmes and
for the Agricultural Productivity Fund.
There were several institutional changes in 2005 and 2006. The Agricultural University
of Iceland was established 1st January 2005 in order to strengthen research in agriculture.
The new institute combines three research institutions, The Agricultural University at
Hvanneyri, The Agricultural Research Institute and The State Horticultural School. The
Agricultural Authority of Iceland started operation on 1st January 2006 under the Ministry
of Agriculture. This institution combines The Chief Veterinary Officer, the Institute of
Freshwater Fishing, the State Meat Valuation Inspectorate and the State Feed, Seed and
Fertilizer Surveillance Authority. The Authority’s role is to monitor and give guidance to the
Ministry of Agriculture in all areas concerning health and safety of livestock rearing and
production. In addition, the Authority has taken over some of the monitoring of health and
safety, formerly carried out by the farmers’ association and the Plant Protection Service,
formerly carried out by Agricultural University of Iceland
The Agricultural Loan fund ceased operations on 31 December 2005. The fund was sold
off to the banking sector and government revenues from the sale were allocated to the
Farmers Pension Fund in fiscal year 2006.
Trade policyTariff-rate-quotas under the minimum access commitments were fully filled in 2005
and 2006 except for meat and edible offal of pigs, sheep and butter which were underfilled.
Some additional quotas for beefmeat and meat of poultry were granted to importers, due
to the market situation in Iceland.
AGRICULTURAL POLICIES IN OECD COUNTRIES: MONITORING AND EVALUATION 2007 – ISBN 978-92-64-02746-6 – © OECD 2007172
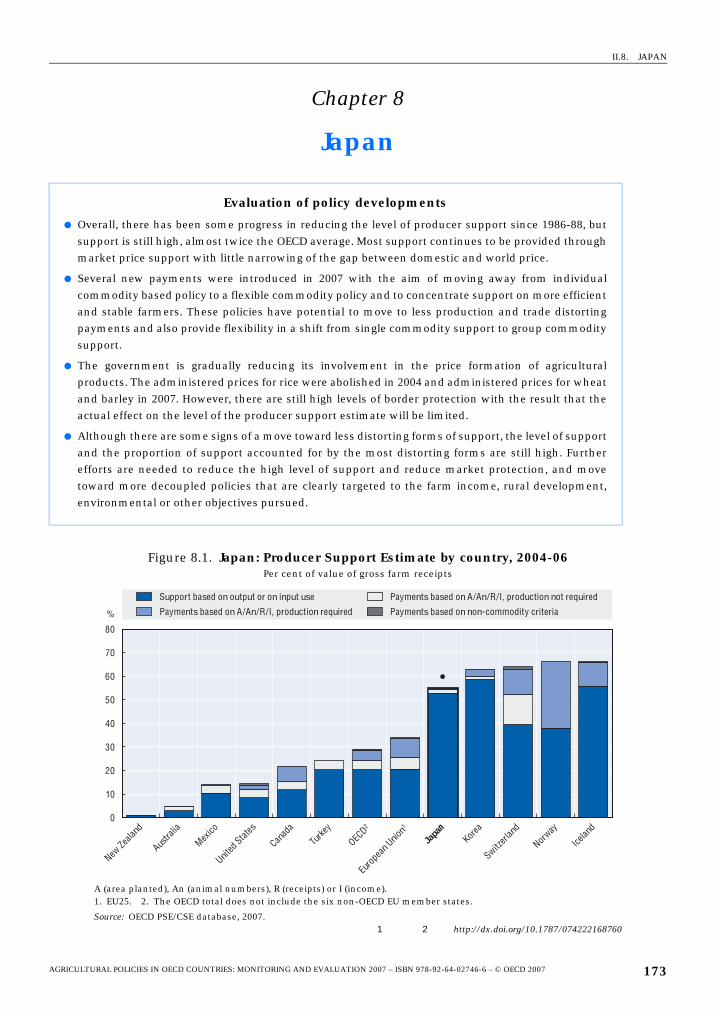
II.8. JAPAN
Chapter 8
Japan
Evaluation of policy developments
● Overall, there has been some progress in reducing the level of producer support since 1986-88, butsupport is still high, almost twice the OECD average. Most support continues to be provided throughmarket price support with little narrowing of the gap between domestic and world price.
● Several new payments were introduced in 2007 with the aim of moving away from individualcommodity based policy to a flexible commodity policy and to concentrate support on more efficientand stable farmers. These policies have potential to move to less production and trade distortingpayments and also provide flexibility in a shift from single commodity support to group commoditysupport.
● The government is gradually reducing its involvement in the price formation of agriculturalproducts. The administered prices for rice were abolished in 2004 and administered prices for wheatand barley in 2007. However, there are still high levels of border protection with the result that theactual effect on the level of the producer support estimate will be limited.
● Although there are some signs of a move toward less distorting forms of support, the level of supportand the proportion of support accounted for by the most distorting forms are still high. Furtherefforts are needed to reduce the high level of support and reduce market protection, and movetoward more decoupled policies that are clearly targeted to the farm income, rural development,environmental or other objectives pursued.
Figure 8.1. Japan: Producer Support Estimate by country, 2004-06Per cent of value of gross farm receipts
A (area planted), An (animal numbers), R (receipts) or I (income).1. EU25. 2. The OECD total does not include the six non-OECD EU member states.
Source: OECD PSE/CSE database, 2007.1 2 http://dx.doi.org/10.1787/074222168760
0
10
20
30
40
50
60
70
80
New Ze
aland
Austra
lia
Mexico
United
States
Canad
a
Turke
y
OECD2
Euro
pean
Unio
n1
Japa
nKor
ea
Switzerl
and
Norway
Icelan
d
%
Support based on output or on input use
Payments based on A/An/R/I, production required
Payments based on A/An/R/I, production not required
Payments based on non-commodity criteria
AGRICULTURAL POLICIES IN OECD COUNTRIES: MONITORING AND EVALUATION 2007 – ISBN 978-92-64-02746-6 – © OECD 2007 173
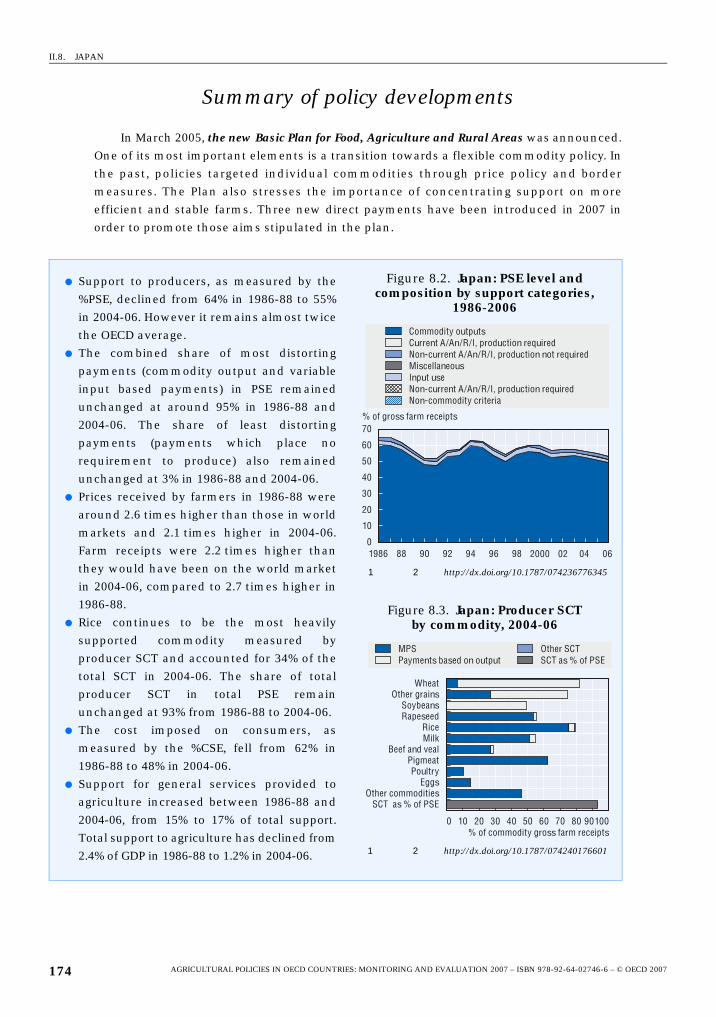
II.8. JAPAN
Summary of policy developments
In March 2005, the new Basic Plan for Food, Agriculture and Rural Areas was announced.
One of its most important elements is a transition towards a flexible commodity policy. In
the past, policies targeted individual commodities through price policy and border
measures. The Plan also stresses the importance of concentrating support on more
efficient and stable farms. Three new direct payments have been introduced in 2007 in
order to promote those aims stipulated in the plan.
● Support to producers, as measured by the
%PSE, declined from 64% in 1986-88 to 55%
in 2004-06. However it remains almost twice
the OECD average.
● The combined share of most distorting
payments (commodity output and variable
input based payments) in PSE remained
unchanged at around 95% in 1986-88 and
2004-06. The share of least distorting
payments (payments which place no
requirement to produce) also remained
unchanged at 3% in 1986-88 and 2004-06.
● Prices received by farmers in 1986-88 were
around 2.6 times higher than those in world
markets and 2.1 times higher in 2004-06.
Farm receipts were 2.2 times higher than
they would have been on the world market
in 2004-06, compared to 2.7 times higher in
1986-88.
● Rice continues to be the most heavily
supported commodity measured by
producer SCT and accounted for 34% of the
total SCT in 2004-06. The share of total
producer SCT in total PSE remain
unchanged at 93% from 1986-88 to 2004-06.
● The cost imposed on consumers, as
measured by the %CSE, fell from 62% in
1986-88 to 48% in 2004-06.
● Support for general services provided to
agriculture increased between 1986-88 and
2004-06, from 15% to 17% of total support.
Total support to agriculture has declined from
2.4% of GDP in 1986-88 to 1.2% in 2004-06.
Figure 8.2. Japan: PSE level and composition by support categories,
1986-2006
1 2 http://dx.doi.org/10.1787/074236776345
Figure 8.3. Japan: Producer SCT by commodity, 2004-06
1 2 http://dx.doi.org/10.1787/074240176601
% of gross farm receipts
Commodity outputsCurrent A/An/R/I, production requiredNon-current A/An/R/I, production not requiredMiscellaneousInput useNon-current A/An/R/I, production requiredNon-commodity criteria
0
10
20
30
40
50
60
70
1986 88 90 92 94 96 98 2000 02 04 06
MPS Payments based on output
Other SCTSCT as % of PSE
SCT as % of PSE
0 10 20 30 40 50 60 70 80 90100% of commodity gross farm receipts
WheatOther grains
RapeseedSoybeans
RiceMilk
Beef and vealPigmeatPoultry
EggsOther commodities
AGRICULTURAL POLICIES IN OECD COUNTRIES: MONITORING AND EVALUATION 2007 – ISBN 978-92-64-02746-6 – © OECD 2007174
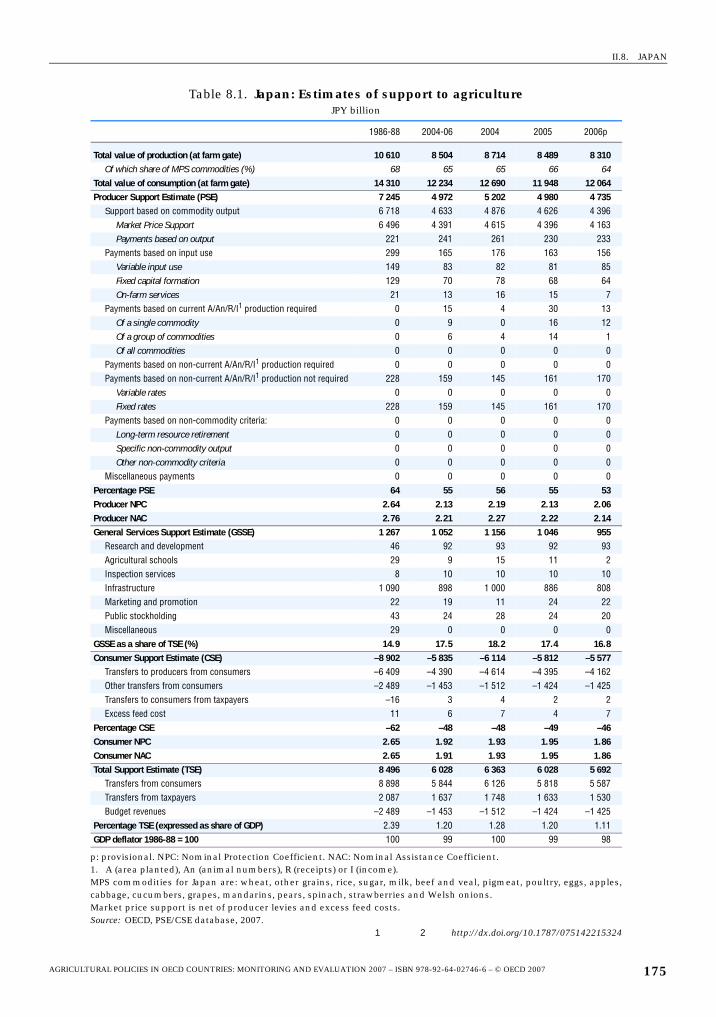
II.8. JAPAN
Table 8.1. Japan: Estimates of support to agricultureJPY billion
1986-88 2004-06 2004 2005 2006p
Total value of production (at farm gate) 10 610 8 504 8 714 8 489 8 310Of which share of MPS commodities (%) 68 65 65 66 64
Total value of consumption (at farm gate) 14 310 12 234 12 690 11 948 12 064Producer Support Estimate (PSE) 7 245 4 972 5 202 4 980 4 735
Support based on commodity output 6 718 4 633 4 876 4 626 4 396Market Price Support 6 496 4 391 4 615 4 396 4 163Payments based on output 221 241 261 230 233
Payments based on input use 299 165 176 163 156Variable input use 149 83 82 81 85Fixed capital formation 129 70 78 68 64On-farm services 21 13 16 15 7
Payments based on current A/An/R/I1 production required 0 15 4 30 13Of a single commodity 0 9 0 16 12Of a group of commodities 0 6 4 14 1Of all commodities 0 0 0 0 0
Payments based on non-current A/An/R/I1 production required 0 0 0 0 0Payments based on non-current A/An/R/I1 production not required 228 159 145 161 170
Variable rates 0 0 0 0 0Fixed rates 228 159 145 161 170
Payments based on non-commodity criteria: 0 0 0 0 0Long-term resource retirement 0 0 0 0 0Specific non-commodity output 0 0 0 0 0Other non-commodity criteria 0 0 0 0 0
Miscellaneous payments 0 0 0 0 0Percentage PSE 64 55 56 55 53Producer NPC 2.64 2.13 2.19 2.13 2.06Producer NAC 2.76 2.21 2.27 2.22 2.14General Services Support Estimate (GSSE) 1 267 1 052 1 156 1 046 955
Research and development 46 92 93 92 93Agricultural schools 29 9 15 11 2Inspection services 8 10 10 10 10Infrastructure 1 090 898 1 000 886 808Marketing and promotion 22 19 11 24 22Public stockholding 43 24 28 24 20Miscellaneous 29 0 0 0 0
GSSE as a share of TSE (%) 14.9 17.5 18.2 17.4 16.8Consumer Support Estimate (CSE) –8 902 –5 835 –6 114 –5 812 –5 577
Transfers to producers from consumers –6 409 –4 390 –4 614 –4 395 –4 162Other transfers from consumers –2 489 –1 453 –1 512 –1 424 –1 425Transfers to consumers from taxpayers –16 3 4 2 2Excess feed cost 11 6 7 4 7
Percentage CSE –62 –48 –48 –49 –46Consumer NPC 2.65 1.92 1.93 1.95 1.86Consumer NAC 2.65 1.91 1.93 1.95 1.86Total Support Estimate (TSE) 8 496 6 028 6 363 6 028 5 692
Transfers from consumers 8 898 5 844 6 126 5 818 5 587Transfers from taxpayers 2 087 1 637 1 748 1 633 1 530Budget revenues –2 489 –1 453 –1 512 –1 424 –1 425
Percentage TSE (expressed as share of GDP) 2.39 1.20 1.28 1.20 1.11GDP deflator 1986-88 = 100 100 99 100 99 98
p: provisional. NPC: Nominal Protection Coefficient. NAC: Nominal Assistance Coefficient.1. A (area planted), An (animal numbers), R (receipts) or I (income).MPS commodities for Japan are: wheat, other grains, rice, sugar, milk, beef and veal, pigmeat, poultry, eggs, apples,cabbage, cucumbers, grapes, mandarins, pears, spinach, strawberries and Welsh onions.Market price support is net of producer levies and excess feed costs.Source: OECD, PSE/CSE database, 2007.
1 2 http://dx.doi.org/10.1787/075142215324
AGRICULTURAL POLICIES IN OECD COUNTRIES: MONITORING AND EVALUATION 2007 – ISBN 978-92-64-02746-6 – © OECD 2007 175
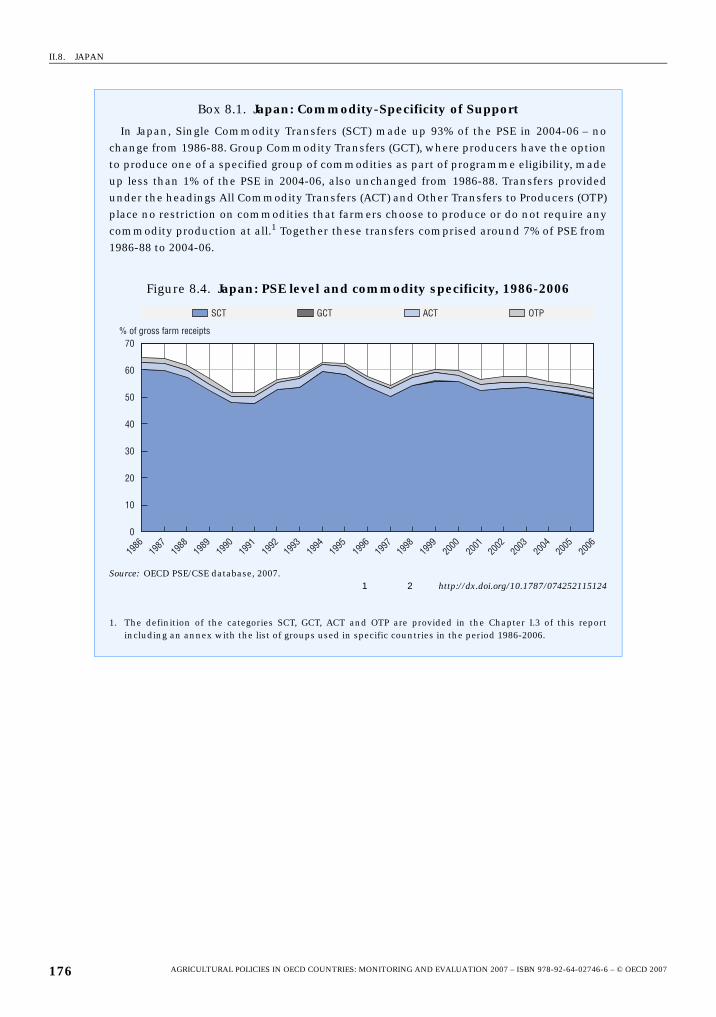
II.8. JAPAN
Box 8.1. Japan: Commodity-Specificity of Support
In Japan, Single Commodity Transfers (SCT) made up 93% of the PSE in 2004-06 – nochange from 1986-88. Group Commodity Transfers (GCT), where producers have the optionto produce one of a specified group of commodities as part of programme eligibility, madeup less than 1% of the PSE in 2004-06, also unchanged from 1986-88. Transfers providedunder the headings All Commodity Transfers (ACT) and Other Transfers to Producers (OTP)place no restriction on commodities that farmers choose to produce or do not require anycommodity production at all.1 Together these transfers comprised around 7% of PSE from1986-88 to 2004-06.
Figure 8.4. Japan: PSE level and commodity specificity, 1986-2006
Source: OECD PSE/CSE database, 2007.1 2 http://dx.doi.org/10.1787/074252115124
1. The definition of the categories SCT, GCT, ACT and OTP are provided in the Chapter I.3 of this reportincluding an annex with the list of groups used in specific countries in the period 1986-2006.
��� ��� ��� ���
�� �
��
��
�� �
���
����
����
����
����
����
����
���
���
����
�
��
��
��
��
��
��
�
�
�
�
�
�
���������������������� �
AGRICULTURAL POLICIES IN OECD COUNTRIES: MONITORING AND EVALUATION 2007 – ISBN 978-92-64-02746-6 – © OECD 2007176
II.8. JAPAN
Description of policy developments
Main policy instrumentsMarket price support provided through tariffs and tariff rate quotas (TRQs), and
payments based on output serve as the basis of agricultural policies in Japan. Tariff-rate
quota systems are applied to major commodities such as rice, wheat, barley and dairy
products. The Food Department within the Ministry of Agriculture, Forestry and Fisheries
(MAFF) is responsible for importing rice under Japan’s WTO URAA minimum-access
commitment.
Government is reducing its involvement in price formation of agricultural products.
The administered price for rice was abolished in 2004 and administered prices for wheat
and barley in 2007. However, there are still several commodities for which administered
prices are set, such as sugar beet, sugar cane and pigmeat. As for beef and pigmeat, the
Agriculture and Livestock Industries Corporation (ALIC) operates price stabilisation
systems.
Budgetary support is provided mainly towards infrastructure needs, such as irrigation
and drainage facilities and the readjustment of agricultural land. Prefecture and local
governments provide infrastructure and extension services. Agri-environment
programmes include measures to encourage farmers to adopt sustainable agricultural
practices that reduce fertiliser and pesticide usage as well as to improve the quality of soil
through composting. Direct payments to farmers in hilly and mountainous areas aim to
prevent the abandonment of agricultural land and to maintain the multifunctional
character of agriculture.
Domestic policyPurchasing prices for wheat and barley declined, while selling prices remained
unchanged in 2006. The minimum producer prices for sugar beet and sugar cane were
reduced slightly in 2006 (Table 8.1). The floor level of the pigmeat price stabilization band
has remained unchanged since 2000. The government set a ceiling of 2 million tonnes on
manufacturing milk to be covered by direct payments in 2006, the same level as in 2005. All
administered prices for calves have remained constant since 2001, with the exception of
dairy breeds for which prices were reduced by 1.5% in 2006 (Table 8.2).
In March 2005, the new Basic Plan for Food, Agriculture and Rural Areas was announced.
A number of new directions in agricultural policy were proposed. One of the most
important elements was a transition towards a flexible commodity support policy. In the
past, policies provided support to individual commodities through price policy and border
measures, but this had the effect of delaying necessary structural adjustment. The Plan
also stresses the importance of concentrating support on more efficient and stable farms.
Another important element of the Basic Plan is the proposed revision of the agricultural
land ownership and land use system so that farmland is used effectively. This is
consequent to the yearly reduction in the total area of land used for agricultural purposes
that results largely from an increase in farmland abandonment and conversion to other
purposes.
The Outline of the Farm Management Stabilization Programme was elaborated in
October 2005 with the objective of implementing the Basic Plan. This programme lays out
AGRICULTURAL POLICIES IN OECD COUNTRIES: MONITORING AND EVALUATION 2007 – ISBN 978-92-64-02746-6 – © OECD 2007 177
II.8. JAPAN
the details of the commodity flexible, efficient and stable farm concentration policy,
including the criterion to receive payments and the commodities covered. It also
recommends the introduction of a rural development programme in order to conserve the
quality of farm resources. This programme would also have the benefit of underlining the
importance of promoting rice policy reform.
The law on farm income stabilization came into effect on 1 April 2007 and three newdirect payments were introduced as part of the commodity flexibility policy. The first
payment is based on historical area planted in a defined and fixed base period; wheat,
barley, soybeans, sugar beet and starch potatoes are eligible for this payment. The aim of
this payment is to correct disadvantages in domestic agriculture caused by geographical
handicaps as compared to other countries. The second payment seeks to encourage
quality improvement of domestic products by farmers producing any of the above five
crops. The third payment is to compensate for part of the loss of income compared with
the average income of the preceding years in order to mitigate income instabilities caused
by price and yield fluctuations. Six crops are eligible for this payment: rice, wheat, barley,
soybeans, sugar beet and starch potatoes. These new direct payments are targeted to
individual farmers who manage at least 4 ha of land (in the Hokkaido area where relatively
larger farms exist, the minimum is set at 10 ha) and to local community units that manage
more than 20 ha along with other conditions. Eligible farmers should also respect certain
environment related conditions established by the government to promote environment
friendly agriculture. With the introduction of these new payments, relevant commodity
specific payments which were payments base on output were abolished.
A new rural development programme was introduced in 2007 to encourage
community initiatives aimed at conserving the quality of rural resources such as land and
water, as well as to improve the environment with a view to sustainable rural development.
As depopulation, ageing population and other problems increase in rural areas,
maintaining the quality of rural resources has become more difficult. In addition,
increasing public concern over environmental problems has made clear the need to place
more emphasis on environmental conservation. This led to the introduction of the newrural development programme.
Rice policy reform is also under way, based on the Principle and Outline of Rice Policy
Reform established in 2002. The basic concept of this reform, which is to be completed by
2012, is to produce rice that meets market demand, especially from a quality point of view.
One of the most important reforms in rice policy implemented in 2007 was the reform of
the production adjustment system. In the past, it was mainly the government which
decided how much would be produced in consultation with the farmers’ organization. As
of 2007, production adjustment policies will be decided by the farmers themselves and
farmers’ organizations.
The second important element of the Basic Plan, the reform of the agricultural landownership and land use system, was completed in 2005. The number of retirees in the
agricultural sector is increasing as ageing of the farmer population progress. Not enough
younger farmers are taking over the management of their farms and the total area of
abandoned farmland has increased. The new law allows companies to rent and manage
agricultural land. Whereas in the past only individuals or agricultural production legal
persons (a corporation owned by farmers) could rent and manage agricultural land, now
companies can use these abandoned lands for agricultural purposes.
AGRICULTURAL POLICIES IN OECD COUNTRIES: MONITORING AND EVALUATION 2007 – ISBN 978-92-64-02746-6 – © OECD 2007178
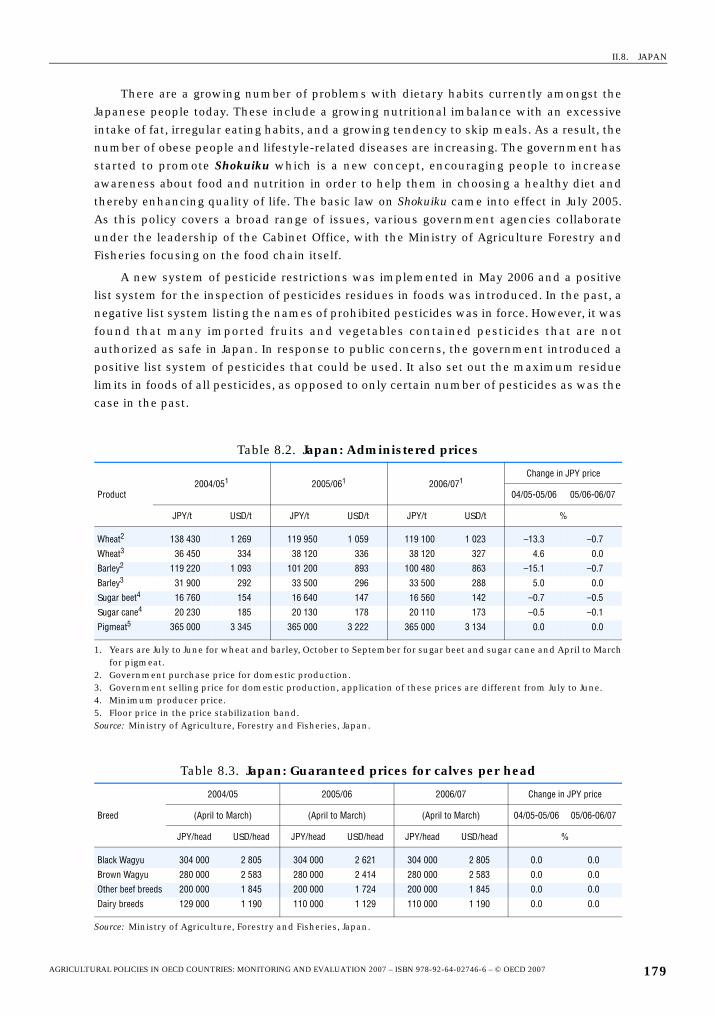
II.8. JAPAN
There are a growing number of problems with dietary habits currently amongst the
Japanese people today. These include a growing nutritional imbalance with an excessive
intake of fat, irregular eating habits, and a growing tendency to skip meals. As a result, the
number of obese people and lifestyle-related diseases are increasing. The government has
started to promote Shokuiku which is a new concept, encouraging people to increase
awareness about food and nutrition in order to help them in choosing a healthy diet and
thereby enhancing quality of life. The basic law on Shokuiku came into effect in July 2005.
As this policy covers a broad range of issues, various government agencies collaborate
under the leadership of the Cabinet Office, with the Ministry of Agriculture Forestry and
Fisheries focusing on the food chain itself.
A new system of pesticide restrictions was implemented in May 2006 and a positive
list system for the inspection of pesticides residues in foods was introduced. In the past, a
negative list system listing the names of prohibited pesticides was in force. However, it was
found that many imported fruits and vegetables contained pesticides that are not
authorized as safe in Japan. In response to public concerns, the government introduced a
positive list system of pesticides that could be used. It also set out the maximum residue
limits in foods of all pesticides, as opposed to only certain number of pesticides as was the
case in the past.
Table 8.2. Japan: Administered prices
Product2004/051 2005/061 2006/071
Change in JPY price
04/05-05/06 05/06-06/07
JPY/t USD/t JPY/t USD/t JPY/t USD/t %
Wheat2 138 430 1 269 119 950 1 059 119 100 1 023 –13.3 –0.7
Wheat3 36 450 334 38 120 336 38 120 327 4.6 0.0
Barley2 119 220 1 093 101 200 893 100 480 863 –15.1 –0.7
Barley3 31 900 292 33 500 296 33 500 288 5.0 0.0
Sugar beet4 16 760 154 16 640 147 16 560 142 –0.7 –0.5
Sugar cane4 20 230 185 20 130 178 20 110 173 –0.5 –0.1
Pigmeat5 365 000 3 345 365 000 3 222 365 000 3 134 0.0 0.0
1. Years are July to June for wheat and barley, October to September for sugar beet and sugar cane and April to Marchfor pigmeat.
2. Government purchase price for domestic production.3. Government selling price for domestic production, application of these prices are different from July to June.4. Minimum producer price.5. Floor price in the price stabilization band.Source: Ministry of Agriculture, Forestry and Fisheries, Japan.
Table 8.3. Japan: Guaranteed prices for calves per head
Breed
2004/05 2005/06 2006/07 Change in JPY price
(April to March) (April to March) (April to March) 04/05-05/06 05/06-06/07
JPY/head USD/head JPY/head USD/head JPY/head USD/head %
Black Wagyu 304 000 2 805 304 000 2 621 304 000 2 805 0.0 0.0
Brown Wagyu 280 000 2 583 280 000 2 414 280 000 2 583 0.0 0.0
Other beef breeds 200 000 1 845 200 000 1 724 200 000 1 845 0.0 0.0
Dairy breeds 129 000 1 190 110 000 1 129 110 000 1 190 0.0 0.0
Source: Ministry of Agriculture, Forestry and Fisheries, Japan.
AGRICULTURAL POLICIES IN OECD COUNTRIES: MONITORING AND EVALUATION 2007 – ISBN 978-92-64-02746-6 – © OECD 2007 179
II.8. JAPAN
As a result of the steep rise in oil prices, the development of bioenergy has been
promoted in recent years in Japan. The Japanese government has set a target for using
bioenergy of 3 080 million liters by 2012. As Japan has only a limited capacity to produce
agricultural products such as maize and sugar cane, which are widely used for producing
bioenergy in other countries, it is seeking new methods, such as the chemical processing of
waste food oil, or the use of methane gas fermented from livestock waste.
Trade policyThe quantitative restriction on rice imports was abolished and replaced by a tariff-
quota system in 1999. In 2006, the over-quota tariff-rate was JPY 341 000 (USD 2 928) per
tonne, the tariff-quota for rice was 767 000 tonnes (brown rice basis) and the maximum
mark-up for rice imports was set at JPY 292 000 (USD 2 507) per tonne. Food aid to
developing countries, which includes both domestically produced rice as well as imported
rice, was approximately 136 000 tonnes in 2005. Japan’s tariff-rate-quotas continue to be
underfilled in 2006 for some products, including skimmed milk powder for school lunches
and for feed, mineral concentrated whey, whey for infant formula and for feed, butter and
butter oil for specific uses, and ground nuts. Japan used special safeguard measures in 2005
and 2006 in accordance with the WTO Agricultural Agreement on several products
including milk powder and maize (corn) starch.
Up to the beginning of 2000, Japan was not active in concluding Free Trade Agreements(FTA). The first FTA was signed with Singapore in 2002 and the second with Mexico in 2004;
the latter was the first FTA in which agricultural products were actually included. In 2005
and 2006, Japan signed FTAs with several countries, mainly in South-East Asia. These FTAs
require Japan to eliminate or reduce tariffs, or to introduce preferential tariff-quotas for
several sensitive agricultural products such as poultrymeat and several fruits. Japan is now
negotiating FTAs with Korea, ASEAN, Co-operation council for the Arab states of the Gulf,
Viet Nam, and India. Japan will also start FTA negotiations with Australia and Switzerland.
In May 2003, a case of BSE infection was confirmed in Canada for the first time. Japan
immediately suspended imports of Canadian beef and related products. In December 2003,
BSE was also confirmed in the US, the largest beef exporter to Japan, and imports of US beef
and related products were suspended. After a two-year suspension, and following
scientifically based risk assessments by the Food Safety Commission, imports of US beef
and beef products were resumed in December 2005 on condition of compliance with the
Export Program agreed between the US and Japan. Imports from Canada were also resumed
in 2005 under similar conditions. However, imports from the US were suspended in January
2006 because specified risk materials (SRMs) were found in US beef. Japan requested that
the US explain the causes and that it take measures to prevent any recurrences; imports
were resumed in July 2006.
AGRICULTURAL POLICIES IN OECD COUNTRIES: MONITORING AND EVALUATION 2007 – ISBN 978-92-64-02746-6 – © OECD 2007180
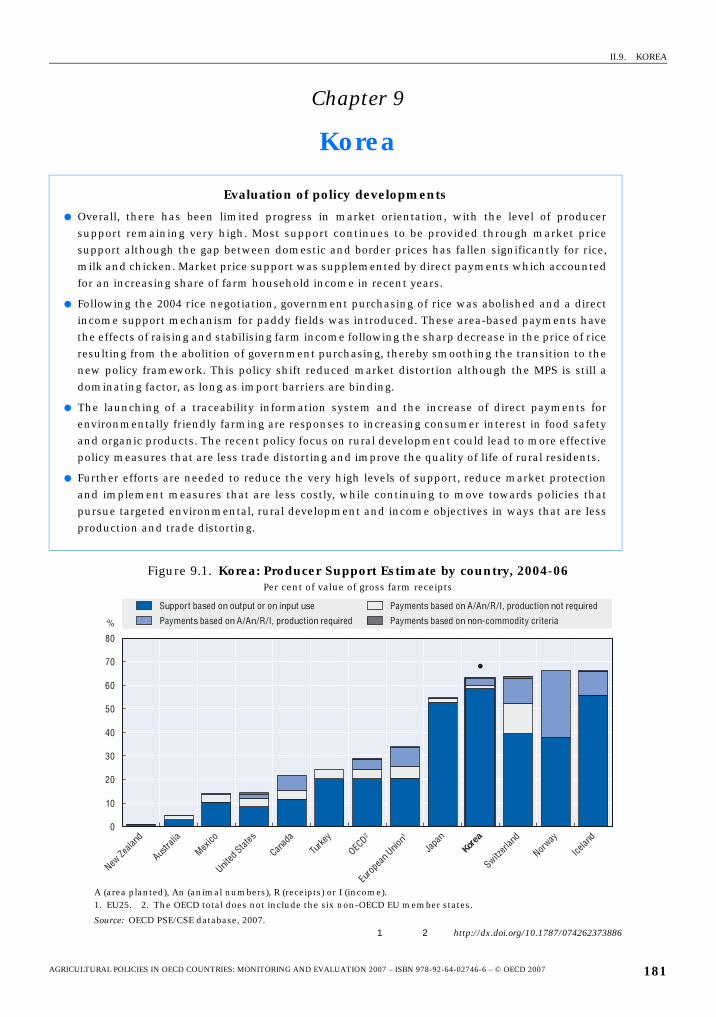
II.9. KOREA
Chapter 9
Korea
Evaluation of policy developments
● Overall, there has been limited progress in market orientation, with the level of producersupport remaining very high. Most support continues to be provided through market pricesupport although the gap between domestic and border prices has fallen significantly for rice,milk and chicken. Market price support was supplemented by direct payments which accountedfor an increasing share of farm household income in recent years.
● Following the 2004 rice negotiation, government purchasing of rice was abolished and a directincome support mechanism for paddy fields was introduced. These area-based payments havethe effects of raising and stabilising farm income following the sharp decrease in the price of riceresulting from the abolition of government purchasing, thereby smoothing the transition to thenew policy framework. This policy shift reduced market distortion although the MPS is still adominating factor, as long as import barriers are binding.
● The launching of a traceability information system and the increase of direct payments forenvironmentally friendly farming are responses to increasing consumer interest in food safetyand organic products. The recent policy focus on rural development could lead to more effectivepolicy measures that are less trade distorting and improve the quality of life of rural residents.
● Further efforts are needed to reduce the very high levels of support, reduce market protectionand implement measures that are less costly, while continuing to move towards policies thatpursue targeted environmental, rural development and income objectives in ways that are lessproduction and trade distorting.
Figure 9.1. Korea: Producer Support Estimate by country, 2004-06Per cent of value of gross farm receipts
A (area planted), An (animal numbers), R (receipts) or I (income).1. EU25. 2. The OECD total does not include the six non-OECD EU member states.
Source: OECD PSE/CSE database, 2007.1 2 http://dx.doi.org/10.1787/074262373886
0
10
20
30
40
50
60
70
80
New Ze
aland
Austra
lia
Mexico
United
States
Canad
a
Turke
y
OECD2
Euro
pean
Unio
n1
Japa
nKor
ea
Switzerl
and
Norway
Icelan
d
%
Support based on output or on input use
Payments based on A/An/R/I, production required
Payments based on A/An/R/I, production not required
Payments based on non-commodity criteria
AGRICULTURAL POLICIES IN OECD COUNTRIES: MONITORING AND EVALUATION 2007 – ISBN 978-92-64-02746-6 – © OECD 2007 181
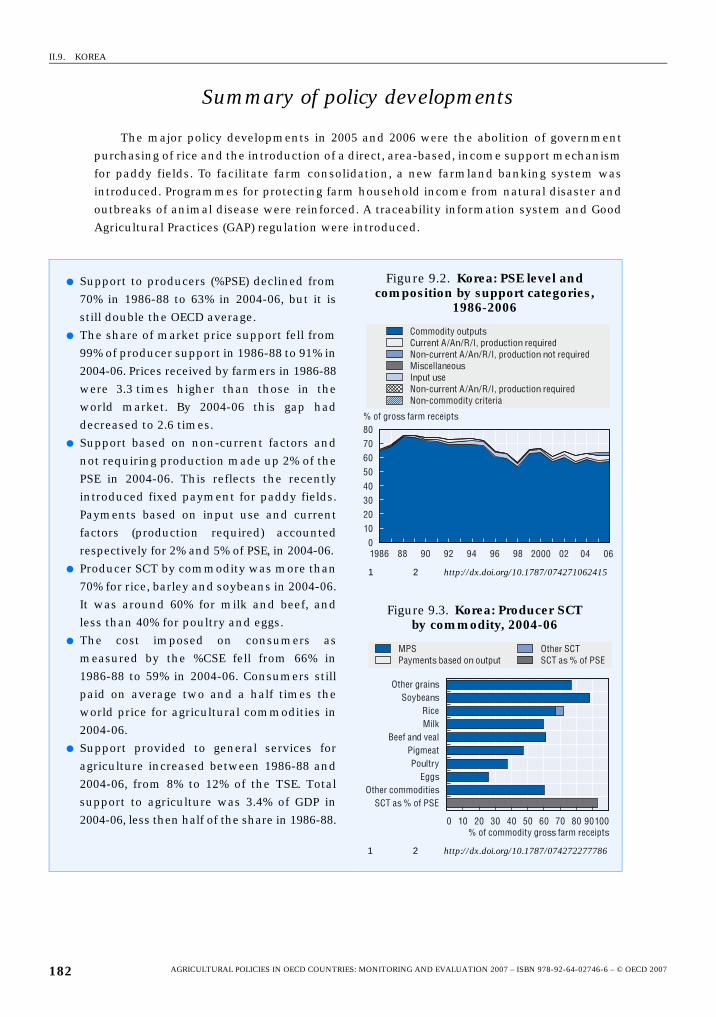
II.9. KOREA
Summary of policy developments
The major policy developments in 2005 and 2006 were the abolition of government
purchasing of rice and the introduction of a direct, area-based, income support mechanism
for paddy fields. To facilitate farm consolidation, a new farmland banking system was
introduced. Programmes for protecting farm household income from natural disaster and
outbreaks of animal disease were reinforced. A traceability information system and Good
Agricultural Practices (GAP) regulation were introduced.
● Support to producers (%PSE) declined from
70% in 1986-88 to 63% in 2004-06, but it is
still double the OECD average.
● The share of market price support fell from
99% of producer support in 1986-88 to 91% in
2004-06. Prices received by farmers in 1986-88
were 3.3 times higher than those in the
world market. By 2004-06 this gap had
decreased to 2.6 times.
● Support based on non-current factors and
not requiring production made up 2% of the
PSE in 2004-06. This reflects the recently
introduced fixed payment for paddy fields.
Payments based on input use and current
factors (production required) accounted
respectively for 2% and 5% of PSE, in 2004-06.
● Producer SCT by commodity was more than
70% for rice, barley and soybeans in 2004-06.
It was around 60% for milk and beef, and
less than 40% for poultry and eggs.
● The cost imposed on consumers as
measured by the %CSE fell from 66% in
1986-88 to 59% in 2004-06. Consumers still
paid on average two and a half times the
world price for agricultural commodities in
2004-06.
● Support provided to general services for
agriculture increased between 1986-88 and
2004-06, from 8% to 12% of the TSE. Total
support to agriculture was 3.4% of GDP in
2004-06, less then half of the share in 1986-88.
Figure 9.2. Korea: PSE level and composition by support categories,
1986-2006
1 2 http://dx.doi.org/10.1787/074271062415
Figure 9.3. Korea: Producer SCT by commodity, 2004-06
1 2 http://dx.doi.org/10.1787/074272277786
% of gross farm receipts
Commodity outputsCurrent A/An/R/I, production requiredNon-current A/An/R/I, production not requiredMiscellaneousInput useNon-current A/An/R/I, production requiredNon-commodity criteria
01020304050607080
1986 88 90 92 94 96 98 2000 02 04 06
MPS Payments based on output
Other SCTSCT as % of PSE
0 10 20 30 40 50 60 70 80 90100% of commodity gross farm receipts
Other grainsSoybeans
RiceMilk
Beef and vealPigmeatPoultry
EggsOther commodities
SCT as % of PSE
AGRICULTURAL POLICIES IN OECD COUNTRIES: MONITORING AND EVALUATION 2007 – ISBN 978-92-64-02746-6 – © OECD 2007182
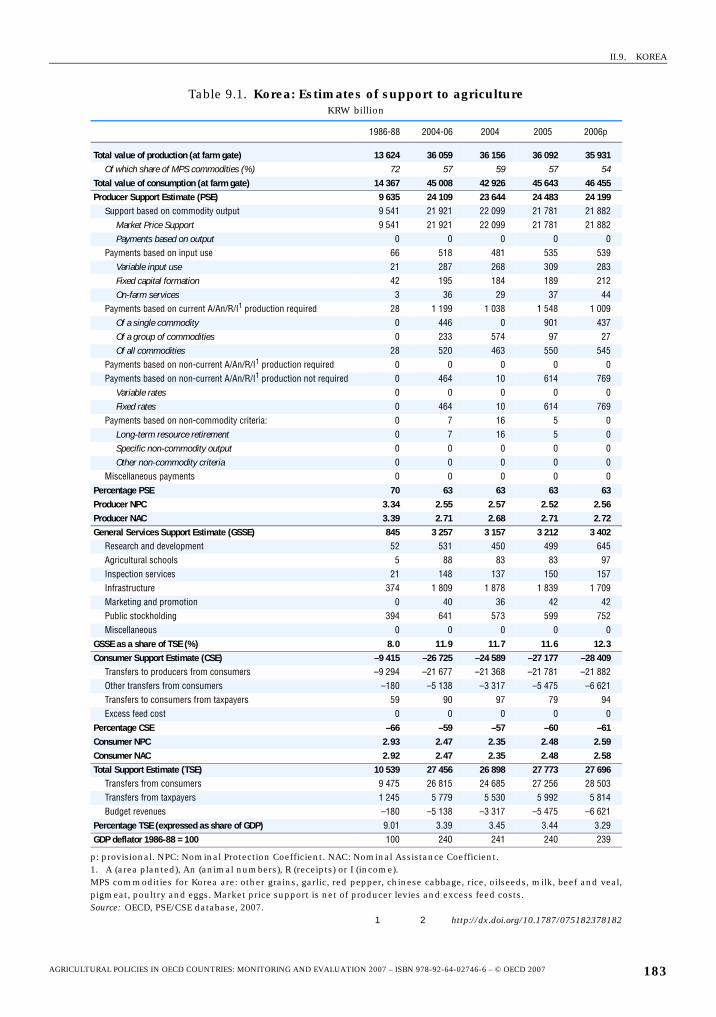
II.9. KOREA
Table 9.1. Korea: Estimates of support to agricultureKRW billion
1986-88 2004-06 2004 2005 2006p
Total value of production (at farm gate) 13 624 36 059 36 156 36 092 35 931Of which share of MPS commodities (%) 72 57 59 57 54
Total value of consumption (at farm gate) 14 367 45 008 42 926 45 643 46 455Producer Support Estimate (PSE) 9 635 24 109 23 644 24 483 24 199
Support based on commodity output 9 541 21 921 22 099 21 781 21 882Market Price Support 9 541 21 921 22 099 21 781 21 882Payments based on output 0 0 0 0 0
Payments based on input use 66 518 481 535 539Variable input use 21 287 268 309 283Fixed capital formation 42 195 184 189 212On-farm services 3 36 29 37 44
Payments based on current A/An/R/I1 production required 28 1 199 1 038 1 548 1 009Of a single commodity 0 446 0 901 437Of a group of commodities 0 233 574 97 27Of all commodities 28 520 463 550 545
Payments based on non-current A/An/R/I1 production required 0 0 0 0 0Payments based on non-current A/An/R/I1 production not required 0 464 10 614 769
Variable rates 0 0 0 0 0Fixed rates 0 464 10 614 769
Payments based on non-commodity criteria: 0 7 16 5 0Long-term resource retirement 0 7 16 5 0Specific non-commodity output 0 0 0 0 0Other non-commodity criteria 0 0 0 0 0
Miscellaneous payments 0 0 0 0 0Percentage PSE 70 63 63 63 63Producer NPC 3.34 2.55 2.57 2.52 2.56Producer NAC 3.39 2.71 2.68 2.71 2.72General Services Support Estimate (GSSE) 845 3 257 3 157 3 212 3 402
Research and development 52 531 450 499 645Agricultural schools 5 88 83 83 97Inspection services 21 148 137 150 157Infrastructure 374 1 809 1 878 1 839 1 709Marketing and promotion 0 40 36 42 42Public stockholding 394 641 573 599 752Miscellaneous 0 0 0 0 0
GSSE as a share of TSE (%) 8.0 11.9 11.7 11.6 12.3Consumer Support Estimate (CSE) –9 415 –26 725 –24 589 –27 177 –28 409
Transfers to producers from consumers –9 294 –21 677 –21 368 –21 781 –21 882Other transfers from consumers –180 –5 138 –3 317 –5 475 –6 621Transfers to consumers from taxpayers 59 90 97 79 94Excess feed cost 0 0 0 0 0
Percentage CSE –66 –59 –57 –60 –61Consumer NPC 2.93 2.47 2.35 2.48 2.59Consumer NAC 2.92 2.47 2.35 2.48 2.58Total Support Estimate (TSE) 10 539 27 456 26 898 27 773 27 696
Transfers from consumers 9 475 26 815 24 685 27 256 28 503Transfers from taxpayers 1 245 5 779 5 530 5 992 5 814Budget revenues –180 –5 138 –3 317 –5 475 –6 621
Percentage TSE (expressed as share of GDP) 9.01 3.39 3.45 3.44 3.29GDP deflator 1986-88 = 100 100 240 241 240 239
p: provisional. NPC: Nominal Protection Coefficient. NAC: Nominal Assistance Coefficient.1. A (area planted), An (animal numbers), R (receipts) or I (income).MPS commodities for Korea are: other grains, garlic, red pepper, chinese cabbage, rice, oilseeds, milk, beef and veal,pigmeat, poultry and eggs. Market price support is net of producer levies and excess feed costs.Source: OECD, PSE/CSE database, 2007.
1 2 http://dx.doi.org/10.1787/075182378182
AGRICULTURAL POLICIES IN OECD COUNTRIES: MONITORING AND EVALUATION 2007 – ISBN 978-92-64-02746-6 – © OECD 2007 183
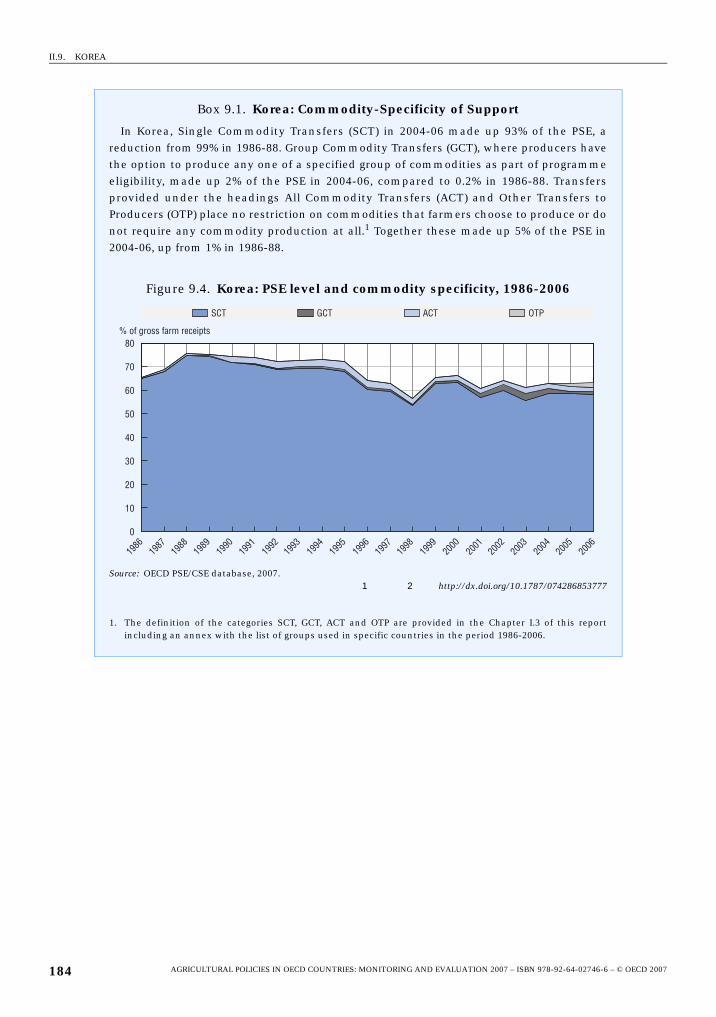
II.9. KOREA
Box 9.1. Korea: Commodity-Specificity of Support
In Korea, Single Commodity Transfers (SCT) in 2004-06 made up 93% of the PSE, areduction from 99% in 1986-88. Group Commodity Transfers (GCT), where producers havethe option to produce any one of a specified group of commodities as part of programmeeligibility, made up 2% of the PSE in 2004-06, compared to 0.2% in 1986-88. Transfersprovided under the headings All Commodity Transfers (ACT) and Other Transfers toProducers (OTP) place no restriction on commodities that farmers choose to produce or donot require any commodity production at all.1 Together these made up 5% of the PSE in2004-06, up from 1% in 1986-88.
Figure 9.4. Korea: PSE level and commodity specificity, 1986-2006
Source: OECD PSE/CSE database, 2007.1 2 http://dx.doi.org/10.1787/074286853777
1. The definition of the categories SCT, GCT, ACT and OTP are provided in the Chapter I.3 of this reportincluding an annex with the list of groups used in specific countries in the period 1986-2006.
��� ��� ��� ���
�� �
��
��
�� �
���
����
����
����
����
����
����
���
���
����
�
��
��
��
��
��
��
�
�
�
�
�
�
���������������������� �
AGRICULTURAL POLICIES IN OECD COUNTRIES: MONITORING AND EVALUATION 2007 – ISBN 978-92-64-02746-6 – © OECD 2007184
II.9. KOREA
Description of policy developments
Main policy instrumentsAgricultural policies consist mainly of market price support implemented through
trade measures and domestic price stabilization mechanisms, including government
purchase and public stockholding. Market price support is supplemented by direct
payments. Direct payments account for an increasing share of farm household income in
recent years, especially after the introduction of fixed and variable direct payment
schemes for paddy fields in 2005. The government has implemented programmes to
enhance agriculture’s competitiveness by developing the agricultural infrastructure,
including farm consolidation through a farmland banking system. A mechanism to
stabilise farm household income in the case of natural disasters and animal diseases has
been reinforced. Policy priorities have been widened to include agri-environment,
consumers’ interests and rural development. Environmental improvement is supported
through payments for reduction of input use. Also, payments are being provided for
environmentally friendly farming. The HACCP (Hazard Analysis Critical Control Point)
system is being applied widely in the livestock industry. A traceability scheme for
agricultural and livestock products has been launched. From 2006, a GAP (Good
Agricultural Practices) system was introduced for 96 agricultural products. The
government is also seeking to enhance the quality of life of rural communities through the
promotion of rural development. The diversification of off-farm income sources is being
encouraged through agro-tourism.
Domestic policyFollowing the 2004 rice negotiation, government purchasing was abolished and a direct
income support mechanism for paddy field was introduced. The direct income support
mechanism comprises a fixed payments system and a variable payments system from the
2005/06 crop year. To be eligible for the fixed payment, paddy fields had to be in production
during the period 1998-2000. The fixed payment per hectare for registered paddy fields was
KRW 600 000 (USD 586) in 2005 and increased to KRW 700 000 (USD 732) in 2006.
Expenditure was KRW 716.8 billion (USD 750 million) for 951 000 hectares, eligible for the
fixed payment in 2006. The variable payment is given only to farmers who are currently
producing rice on registered farmland. The amount of the variable payment is determined
according to the difference between a target price and each year’s post-harvest price. For
the years 2005-07, the target price is KRW 170 083 (USD 178) per 80 kilograms of rice,
determined by adding the income effect of past government purchasing and paddy-field
environmental conservation payments to the 3 year average of the harvest price from 2001
to 2003. If the post-harvest price is lower than the target price, farmers receive 85% of the
difference, after deduction of the fixed payment, which is multiplied by a fixed national
reference yield to calculate the payment per hectare. The variable payment per hectare was
KRW 958 310 (USD 936) in 2005 and fell to KRW 459 757 (USD 481) in 2006. Rice production
fell from 4 768 000 tonnes in 2005 to 4 680 000 tonnes in 2007 reflecting a decrease in
cultivated area.
From 2005, the Korean government implemented a Public Stockholding Scheme for rice,
which is a purchase and release mechanism based on the current market price. The target
amount of public stockholding for rice is 864 000 tonnes. In 2006, 22 000 tonnes of imported
AGRICULTURAL POLICIES IN OECD COUNTRIES: MONITORING AND EVALUATION 2007 – ISBN 978-92-64-02746-6 – © OECD 2007 185
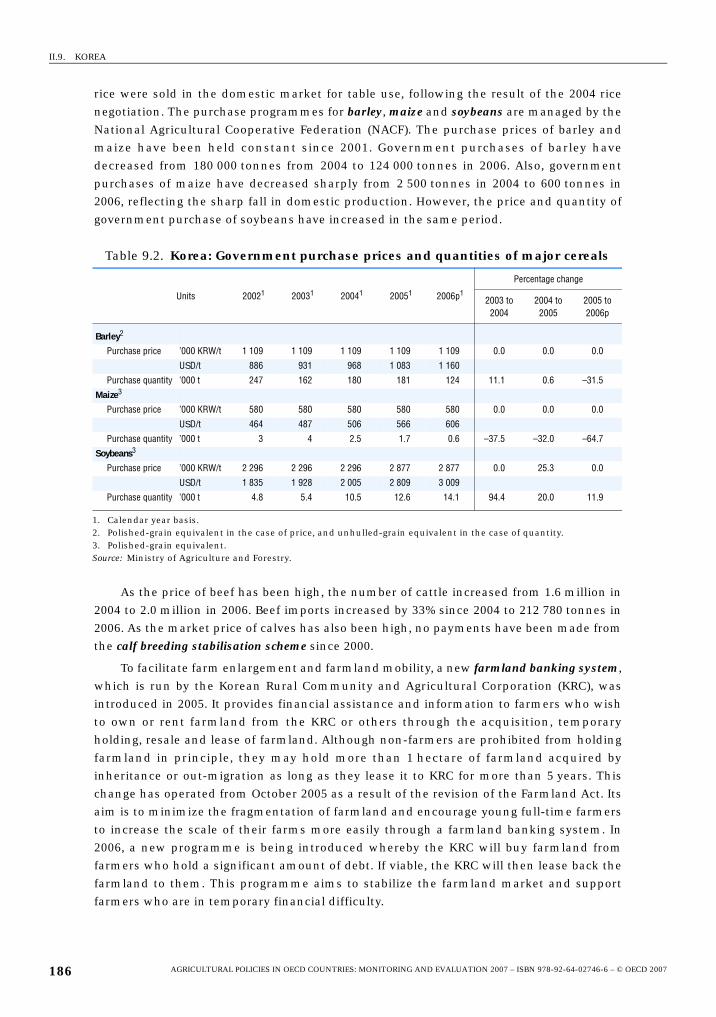
II.9. KOREA
rice were sold in the domestic market for table use, following the result of the 2004 rice
negotiation. The purchase programmes for barley, maize and soybeans are managed by the
National Agricultural Cooperative Federation (NACF). The purchase prices of barley and
maize have been held constant since 2001. Government purchases of barley have
decreased from 180 000 tonnes from 2004 to 124 000 tonnes in 2006. Also, government
purchases of maize have decreased sharply from 2 500 tonnes in 2004 to 600 tonnes in
2006, reflecting the sharp fall in domestic production. However, the price and quantity of
government purchase of soybeans have increased in the same period.
As the price of beef has been high, the number of cattle increased from 1.6 million in
2004 to 2.0 million in 2006. Beef imports increased by 33% since 2004 to 212 780 tonnes in
2006. As the market price of calves has also been high, no payments have been made from
the calf breeding stabilisation scheme since 2000.
To facilitate farm enlargement and farmland mobility, a new farmland banking system,
which is run by the Korean Rural Community and Agricultural Corporation (KRC), was
introduced in 2005. It provides financial assistance and information to farmers who wish
to own or rent farmland from the KRC or others through the acquisition, temporary
holding, resale and lease of farmland. Although non-farmers are prohibited from holding
farmland in principle, they may hold more than 1 hectare of farmland acquired by
inheritance or out-migration as long as they lease it to KRC for more than 5 years. This
change has operated from October 2005 as a result of the revision of the Farmland Act. Its
aim is to minimize the fragmentation of farmland and encourage young full-time farmers
to increase the scale of their farms more easily through a farmland banking system. In
2006, a new programme is being introduced whereby the KRC will buy farmland from
farmers who hold a significant amount of debt. If viable, the KRC will then lease back the
farmland to them. This programme aims to stabilize the farmland market and support
farmers who are in temporary financial difficulty.
Table 9.2. Korea: Government purchase prices and quantities of major cereals
Units 20021 20031 20041 20051 2006p1
Percentage change
2003 to 2004
2004 to 2005
2005 to 2006p
Barley2
Purchase price ’000 KRW/t 1 109 1 109 1 109 1 109 1 109 0.0 0.0 0.0
USD/t 886 931 968 1 083 1 160
Purchase quantity ’000 t 247 162 180 181 124 11.1 0.6 –31.5
Maize3
Purchase price ’000 KRW/t 580 580 580 580 580 0.0 0.0 0.0
USD/t 464 487 506 566 606
Purchase quantity ’000 t 3 4 2.5 1.7 0.6 –37.5 –32.0 –64.7
Soybeans3
Purchase price ’000 KRW/t 2 296 2 296 2 296 2 877 2 877 0.0 25.3 0.0
USD/t 1 835 1 928 2 005 2 809 3 009
Purchase quantity ’000 t 4.8 5.4 10.5 12.6 14.1 94.4 20.0 11.9
1. Calendar year basis.2. Polished-grain equivalent in the case of price, and unhulled-grain equivalent in the case of quantity.3. Polished-grain equivalent.Source: Ministry of Agriculture and Forestry.
AGRICULTURAL POLICIES IN OECD COUNTRIES: MONITORING AND EVALUATION 2007 – ISBN 978-92-64-02746-6 – © OECD 2007186
II.9. KOREA
The government introduced a new pilot project of direct payments for landscapeconservation in 2005 with a budget of KRW 600 million (USD 586 thousand). It involves a
payment per hectare to farmers who cultivate plants for aesthetic purposes to preserve
traditional landscape in selected villages. About 470 hectares from 1 000 farm households
participated in this pilot payments programme in 2006. A direct payments for less-favouredareas programme, which was introduced on a pilot basis in 2004, became a national
programme in 2006. Its budget increased from KRW 10 billion (USD 8.7 million) in 2004 to
KRW 52 billion (USD 54.4 million) and the participating areas increased from
31 000 hectares to 119 000 hectares in the same period. In 2006, 2 779 villages, where the
share of arable land is below 22% and the land gradient is over 14%, were eligible to receive
KRW 400 000 (USD 418) per hectare for dry fields and KRW 200 000 (USD 209) per hectare for
pasture.
Programmes for protecting farm household income from natural disasters were
reinforced. A crop insurance scheme, which was introduced for apples and pears in 2001,
was implemented for seven agricultural products in 2006. The farmers’ share of the
premium decreased from 41% in 2002 to 31% in 2006 with the remainder paid by the
government. Also, the product coverage of the livestock insurance scheme to protect
farmers’ income from outbreaks of animal disease and natural disaster increased from
four livestock products (cattle, pork, chicken and horses) in 2002 to nine livestock products,
including deer, duck, pheasant, quail and turkey, in 2006.
Policies for promoting environmentally friendly farming have been continued. In 2006, the
payment per hectare for environmentally friendly farming was increased to KRW 524-794 000
(USD 548-831) for dry fields and KRW 217-392 000 (USD 227-410) for paddy fields. About
27 000 farm households who participate in the production of low-chemical, chemical-free
and organic products received total payments of KRW 11.4 billion (USD 11.9 million) in
2006. The pilot programme of direct payments for environmentally friendly livestockpractices, which was introduced in 2004, was continued for nine hundred livestock
producing farm households with a budget of KRW 5.8 billion (USD 6 million) in 2006.
Policies to cope with growing consumer concerns on food safety are being intensified.
The traceability scheme for agricultural and livestock products, which was launched in
2004 on a pilot basis for beef, has begun to be applied throughout the market. In 2006, the
government established a traceability information system for agricultural products
(www.agros.go.kr) and about 8 800 farm households and 800 distributors are participating in
this programme. In 2006, the government launched the Good Agricultural Practices (GAP)regulation and designated 21 institutions as GAP inspection agencies. About 3 700 farm
households participated in this programme. The number of safety tests for agricultural
products rose from 56 000 items in 2002 to 66 000 items in 2006.
To promote rural development and to improve the quality of life of rural residents, the
government established a comprehensive law in 2004: the Special Act for Improving the
Quality of Life of Farmers and Fishermen and Promoting Development in Rural,
Mountainous and Fishing Communities. The implementation of the Special Act, which
involves 15 ministries and 1 government agency, started in 2005. The government lowered
health insurance premiums for farmers by 50% (the other 50% is paid by the government)
and expanded government support of pension payments. The government also
implemented support programmes for the purpose of improving living conditions such as
education, medical services, roads, dwellings, drinking water supply, and infrastructure for
AGRICULTURAL POLICIES IN OECD COUNTRIES: MONITORING AND EVALUATION 2007 – ISBN 978-92-64-02746-6 – © OECD 2007 187
II.9. KOREA
the Internet. The government also implemented several policy measures to increase off-
farm income by promoting agro-tourism with a budget of KRW 10.6 billion (USD 11.1 million)
in 2006. To establish regional networks among the academic community, research
institutes, the industrial sector, and local governments for providing technical or
marketing assistance to farmers, the government implemented the regional agriculturecluster programme with a budget of KRW 12 billion (USD 12.6 million) in 2005 and
KRW 20 billion (USD 20.9 million) in 2006.
Trade policyThe result of Korea’s 2004 rice negotiation was ratified in the national assembly in
November 2005. The key result was to extend special treatment for rice until 2014 and to
increase minimum market access (MMA) amounts from 225 575 tonnes in 2005 to
408 700 tonnes in 2014 in equal annual instalments. Since the ratification by the national
assembly was delayed, the minimum market access for 2005 was imported in 2006.
The Free Trade Agreements (FTA) with Singapore and the European Free Trade
Association (EFTA) went into effect in March 2006 and September 2006 respectively.
Agreement on the commodity sector was reached in the FTA negotiations with ASEAN
countries in August 2006. In the FTA with ASEAN, 71 sensitive agricultural products of
Korea are exempt from tariff reductions. FTA negotiations were under way with the United
States, Canada, India, Japan, and Mexico in 2006.
The fill rate of tariff-rate quota (TRQs) was around 67% in 2006. Out of 63 agricultural
products subject to TRQ, 26 were completely filled, 24 were partially filled and there were
no imports of 13 products.
AGRICULTURAL POLICIES IN OECD COUNTRIES: MONITORING AND EVALUATION 2007 – ISBN 978-92-64-02746-6 – © OECD 2007188
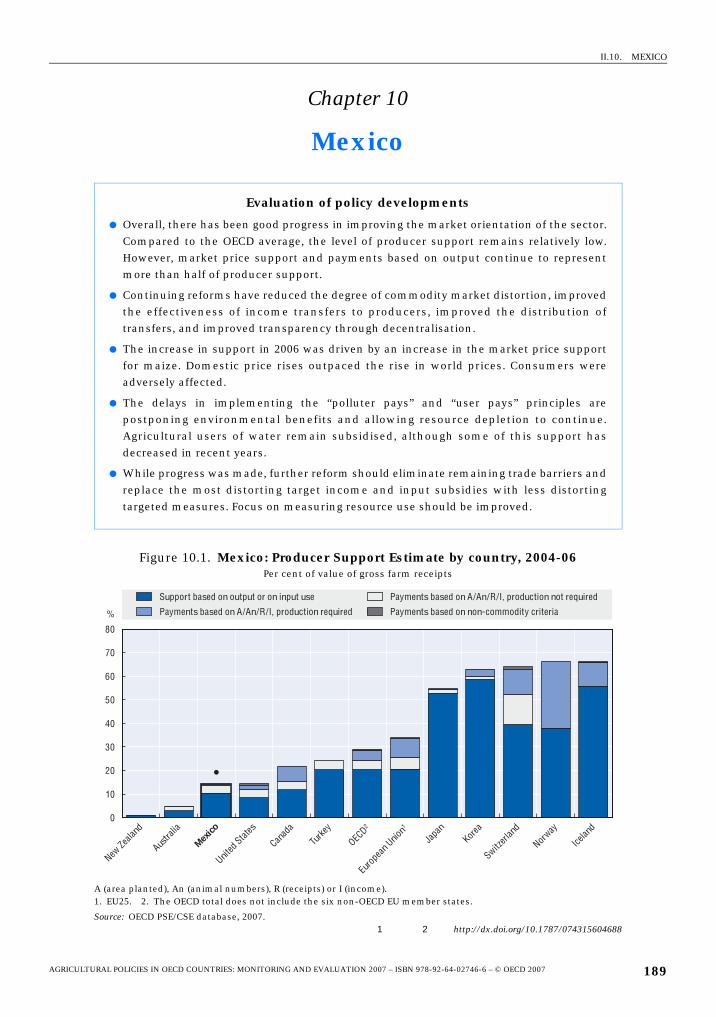
II.10. MEXICO
Chapter 10
Mexico
Evaluation of policy developments
● Overall, there has been good progress in improving the market orientation of the sector.Compared to the OECD average, the level of producer support remains relatively low.However, market price support and payments based on output continue to representmore than half of producer support.
● Continuing reforms have reduced the degree of commodity market distortion, improvedthe effectiveness of income transfers to producers, improved the distribution oftransfers, and improved transparency through decentralisation.
● The increase in support in 2006 was driven by an increase in the market price supportfor maize. Domestic price rises outpaced the rise in world prices. Consumers wereadversely affected.
● The delays in implementing the “polluter pays” and “user pays” principles arepostponing environmental benefits and allowing resource depletion to continue.Agricultural users of water remain subsidised, although some of this support hasdecreased in recent years.
● While progress was made, further reform should eliminate remaining trade barriers andreplace the most distorting target income and input subsidies with less distortingtargeted measures. Focus on measuring resource use should be improved.
Figure 10.1. Mexico: Producer Support Estimate by country, 2004-06Per cent of value of gross farm receipts
A (area planted), An (animal numbers), R (receipts) or I (income).1. EU25. 2. The OECD total does not include the six non-OECD EU member states.
Source: OECD PSE/CSE database, 2007.1 2 http://dx.doi.org/10.1787/074315604688
0
10
20
30
40
50
60
70
80
New Ze
aland
Austra
lia
Mexico
United
States
Canad
a
Turke
y
OECD2
Euro
pean
Unio
n1
Japa
nKor
ea
Switzerl
and
Norway
Icelan
d
%
Support based on output or on input use
Payments based on A/An/R/I, production required
Payments based on A/An/R/I, production not required
Payments based on non-commodity criteria
AGRICULTURAL POLICIES IN OECD COUNTRIES: MONITORING AND EVALUATION 2007 – ISBN 978-92-64-02746-6 – © OECD 2007 189
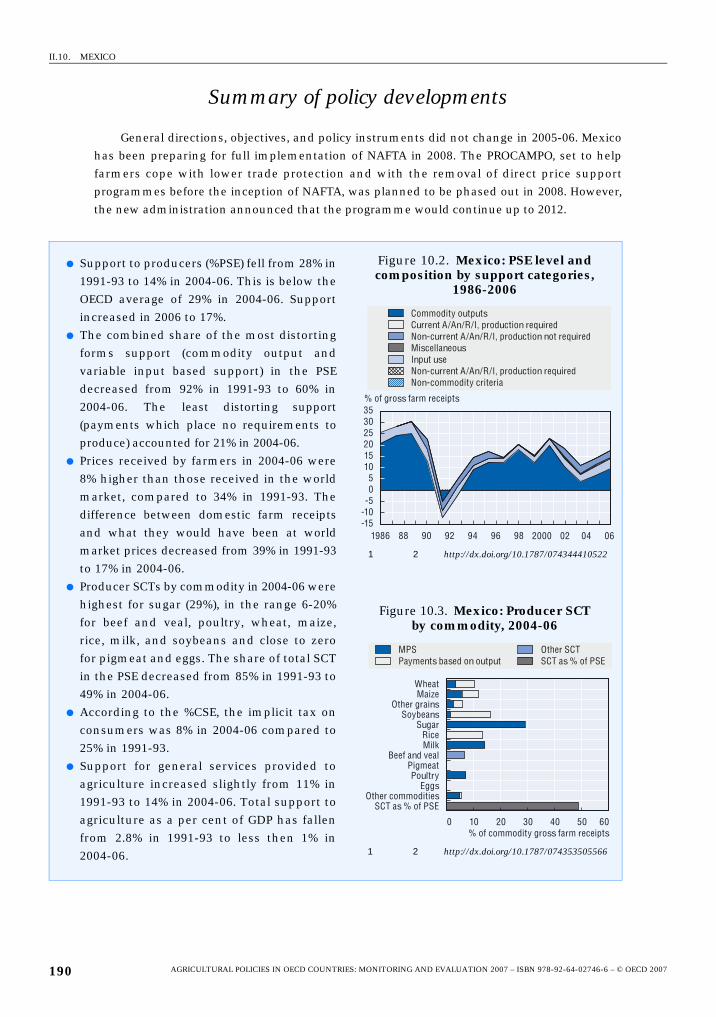
II.10. MEXICO
Summary of policy developments
General directions, objectives, and policy instruments did not change in 2005-06. Mexico
has been preparing for full implementation of NAFTA in 2008. The PROCAMPO, set to help
farmers cope with lower trade protection and with the removal of direct price support
programmes before the inception of NAFTA, was planned to be phased out in 2008. However,
the new administration announced that the programme would continue up to 2012.
● Support to producers (%PSE) fell from 28% in
1991-93 to 14% in 2004-06. This is below the
OECD average of 29% in 2004-06. Support
increased in 2006 to 17%.
● The combined share of the most distorting
forms support (commodity output and
variable input based support) in the PSE
decreased from 92% in 1991-93 to 60% in
2004-06. The least distorting support
(payments which place no requirements to
produce) accounted for 21% in 2004-06.
● Prices received by farmers in 2004-06 were
8% higher than those received in the world
market, compared to 34% in 1991-93. The
difference between domestic farm receipts
and what they would have been at world
market prices decreased from 39% in 1991-93
to 17% in 2004-06.
● Producer SCTs by commodity in 2004-06 were
highest for sugar (29%), in the range 6-20%
for beef and veal, poultry, wheat, maize,
rice, milk, and soybeans and close to zero
for pigmeat and eggs. The share of total SCT
in the PSE decreased from 85% in 1991-93 to
49% in 2004-06.
● According to the %CSE, the implicit tax on
consumers was 8% in 2004-06 compared to
25% in 1991-93.
● Support for general services provided to
agriculture increased slightly from 11% in
1991-93 to 14% in 2004-06. Total support to
agriculture as a per cent of GDP has fallen
from 2.8% in 1991-93 to less then 1% in
2004-06.
Figure 10.2. Mexico: PSE level and composition by support categories,
1986-2006
1 2 http://dx.doi.org/10.1787/074344410522
Figure 10.3. Mexico: Producer SCT by commodity, 2004-06
1 2 http://dx.doi.org/10.1787/074353505566
% of gross farm receipts
Commodity outputsCurrent A/An/R/I, production requiredNon-current A/An/R/I, production not requiredMiscellaneousInput useNon-current A/An/R/I, production requiredNon-commodity criteria
-15-10-505
101520253035
1986 88 90 92 94 96 98 2000 02 04 06
MPS Payments based on output
Other SCTSCT as % of PSE
WheatMaize
Other grainsSoybeans
SugarRiceMilk
Beef and vealPigmeatPoultry
EggsOther commodities
SCT as % of PSE
0 10 20 30 40 50 60% of commodity gross farm receipts
AGRICULTURAL POLICIES IN OECD COUNTRIES: MONITORING AND EVALUATION 2007 – ISBN 978-92-64-02746-6 – © OECD 2007190
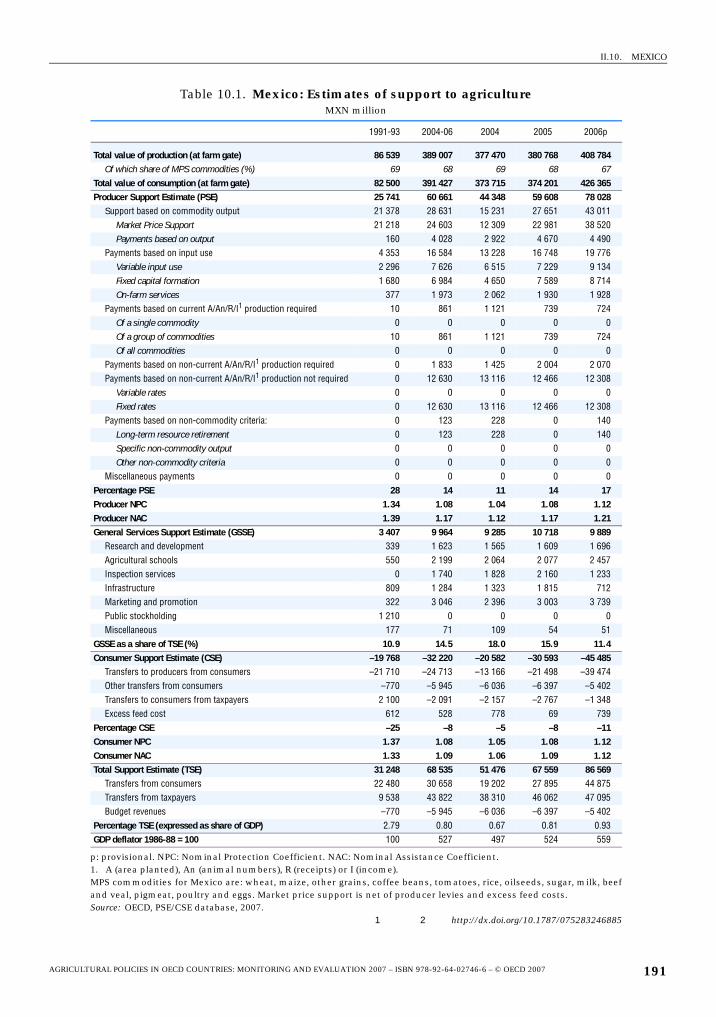
II.10. MEXICO
Table 10.1. Mexico: Estimates of support to agricultureMXN million
1991-93 2004-06 2004 2005 2006p
Total value of production (at farm gate) 86 539 389 007 377 470 380 768 408 784Of which share of MPS commodities (%) 69 68 69 68 67
Total value of consumption (at farm gate) 82 500 391 427 373 715 374 201 426 365Producer Support Estimate (PSE) 25 741 60 661 44 348 59 608 78 028
Support based on commodity output 21 378 28 631 15 231 27 651 43 011Market Price Support 21 218 24 603 12 309 22 981 38 520Payments based on output 160 4 028 2 922 4 670 4 490
Payments based on input use 4 353 16 584 13 228 16 748 19 776Variable input use 2 296 7 626 6 515 7 229 9 134Fixed capital formation 1 680 6 984 4 650 7 589 8 714On-farm services 377 1 973 2 062 1 930 1 928
Payments based on current A/An/R/I1 production required 10 861 1 121 739 724Of a single commodity 0 0 0 0 0Of a group of commodities 10 861 1 121 739 724Of all commodities 0 0 0 0 0
Payments based on non-current A/An/R/I1 production required 0 1 833 1 425 2 004 2 070Payments based on non-current A/An/R/I1 production not required 0 12 630 13 116 12 466 12 308
Variable rates 0 0 0 0 0Fixed rates 0 12 630 13 116 12 466 12 308
Payments based on non-commodity criteria: 0 123 228 0 140Long-term resource retirement 0 123 228 0 140Specific non-commodity output 0 0 0 0 0Other non-commodity criteria 0 0 0 0 0
Miscellaneous payments 0 0 0 0 0Percentage PSE 28 14 11 14 17Producer NPC 1.34 1.08 1.04 1.08 1.12Producer NAC 1.39 1.17 1.12 1.17 1.21General Services Support Estimate (GSSE) 3 407 9 964 9 285 10 718 9 889
Research and development 339 1 623 1 565 1 609 1 696Agricultural schools 550 2 199 2 064 2 077 2 457Inspection services 0 1 740 1 828 2 160 1 233Infrastructure 809 1 284 1 323 1 815 712Marketing and promotion 322 3 046 2 396 3 003 3 739Public stockholding 1 210 0 0 0 0Miscellaneous 177 71 109 54 51
GSSE as a share of TSE (%) 10.9 14.5 18.0 15.9 11.4Consumer Support Estimate (CSE) –19 768 –32 220 –20 582 –30 593 –45 485
Transfers to producers from consumers –21 710 –24 713 –13 166 –21 498 –39 474Other transfers from consumers –770 –5 945 –6 036 –6 397 –5 402Transfers to consumers from taxpayers 2 100 –2 091 –2 157 –2 767 –1 348Excess feed cost 612 528 778 69 739
Percentage CSE –25 –8 –5 –8 –11Consumer NPC 1.37 1.08 1.05 1.08 1.12Consumer NAC 1.33 1.09 1.06 1.09 1.12Total Support Estimate (TSE) 31 248 68 535 51 476 67 559 86 569
Transfers from consumers 22 480 30 658 19 202 27 895 44 875Transfers from taxpayers 9 538 43 822 38 310 46 062 47 095Budget revenues –770 –5 945 –6 036 –6 397 –5 402
Percentage TSE (expressed as share of GDP) 2.79 0.80 0.67 0.81 0.93GDP deflator 1986-88 = 100 100 527 497 524 559
p: provisional. NPC: Nominal Protection Coefficient. NAC: Nominal Assistance Coefficient.1. A (area planted), An (animal numbers), R (receipts) or I (income).MPS commodities for Mexico are: wheat, maize, other grains, coffee beans, tomatoes, rice, oilseeds, sugar, milk, beefand veal, pigmeat, poultry and eggs. Market price support is net of producer levies and excess feed costs.Source: OECD, PSE/CSE database, 2007.
1 2 http://dx.doi.org/10.1787/075283246885
AGRICULTURAL POLICIES IN OECD COUNTRIES: MONITORING AND EVALUATION 2007 – ISBN 978-92-64-02746-6 – © OECD 2007 191
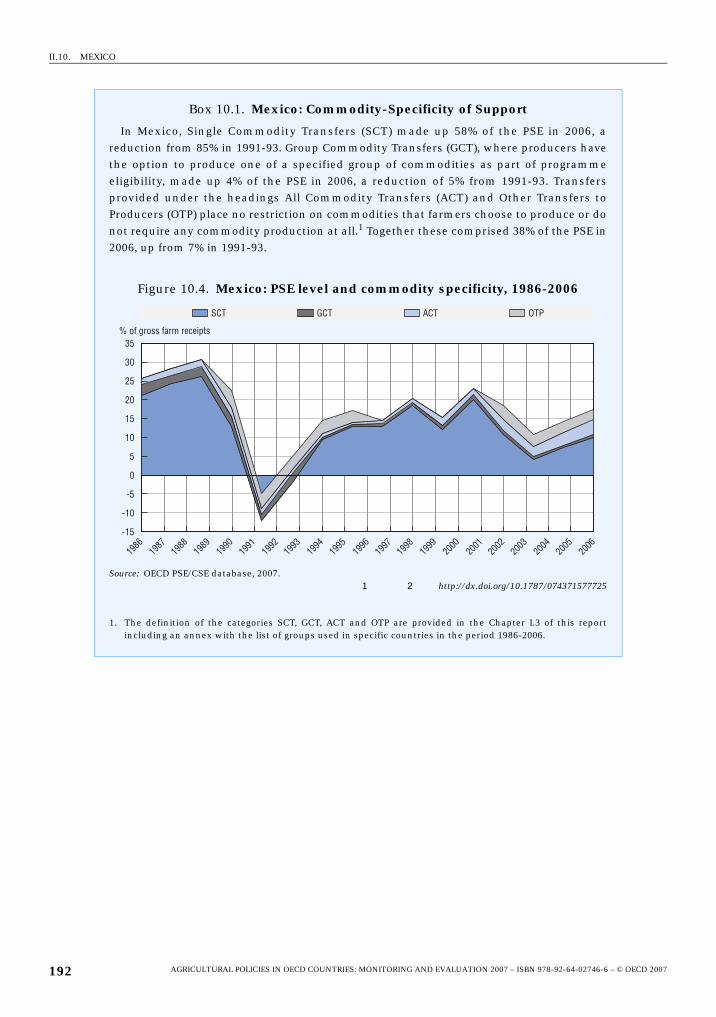
II.10. MEXICO
Box 10.1. Mexico: Commodity-Specificity of Support
In Mexico, Single Commodity Transfers (SCT) made up 58% of the PSE in 2006, areduction from 85% in 1991-93. Group Commodity Transfers (GCT), where producers havethe option to produce one of a specified group of commodities as part of programmeeligibility, made up 4% of the PSE in 2006, a reduction of 5% from 1991-93. Transfersprovided under the headings All Commodity Transfers (ACT) and Other Transfers toProducers (OTP) place no restriction on commodities that farmers choose to produce or donot require any commodity production at all.1 Together these comprised 38% of the PSE in2006, up from 7% in 1991-93.
Figure 10.4. Mexico: PSE level and commodity specificity, 1986-2006
Source: OECD PSE/CSE database, 2007.1 2 http://dx.doi.org/10.1787/074371577725
1. The definition of the categories SCT, GCT, ACT and OTP are provided in the Chapter I.3 of this reportincluding an annex with the list of groups used in specific countries in the period 1986-2006.
��� ��� ��� ���
��
�� �
��
��
�� �
���
����
����
����
����
����
����
���
���
����
�
��
��
��
��
��
��
��
�
��
�
!�
!�
!��
�
�
���������������������� �
AGRICULTURAL POLICIES IN OECD COUNTRIES: MONITORING AND EVALUATION 2007 – ISBN 978-92-64-02746-6 – © OECD 2007192
II.10. MEXICO
Description of policy developments1
Main policy instrumentsThe direction, objectives, and policy instruments of agricultural policy in Mexico over the
2005-06 period continued to be determined by the Sectoral Program of Agriculture, Livestock,
Rural Development, Fisheries and Food 2001-06. They aimed to align current productivity
development programmes with marketing opportunities and the needs of domestic and
export markets, ensure cohesion between incentives to increase agricultural production and
the sustainability of resources and the environment, promote public policies that create a level
playing field for competition with other North American Free Trade Agreement (NAFTA)
members and improve efforts to fight poverty. Efforts to create and implement decentralized
agricultural and rural development policies were continuing through Alianza Programs.
Agricultural policies consisted of market price support provided through tariffs and tariff
rate quotas (TRQs), marketing support (ASERCA2 Target Income Program); income support
payments (PROCAMPO3), input support measures (energy subsidies, irrigation subsidies, rural
and farm credit support policy), policies for water and other natural resources (Water Rights
Acquisition Program, environmental stewardship provisions in PROCAMPO and PROGAN4),
policies to improve productivity (ALIANZA5) and other policy measures (commercial
promotion and agro-business development, weather-related disasters).
Domestic policyThe marketing programmes operated by ASERCA accounted for MXN 6.5 billion,
representing 14% of the SAGARPA (Secretaría de Agricultura, Ganadería, Desarrollo Rural, Pesca
y Alimentación – Secretariat of Agriculture, Livestock, Rural Development, Fisheries and Food)
budget in 2005. The Target Income sub-programme operates as a deficiency payment. The
provisions of the programme, which imposes a maximum yield per hectare that is determined
for each region, vary according to each commodity covered. ASERCA also operates a series of
measures designed to deal with surplus production and to improve market integration. The
most important measures relate to price hedging and generally to the promotion of the
knowledge and skills necessary for risk management. There are also measures for crop
conversion.
PROCAMPO started in 1993, before the inception of NAFTA, to help farmers cope with
lower trade protection and with the removal of direct price support programmes. By linking the
payment to historical use of land, it was intended to help farmers switch to more profitable
crops in the context of a more competitive economy. By paying all land owners who grew one
of a list of eligible crops, rather than only those who sold their output, the programme’s scope
extends to subsistence farmers. The programme was planned to be phased out in 2008.
However, it has been announced that the programme would continue up to 2012.
Expenditure under the PROCAMPO programme has varied little in real terms in recent
years, accounting for about 14 billion MXN in 2005 and about one-third of all SAGARPA
spending. One of the changes made recently by arrangement with certain financial
institutions allowed for a producer to receive the present value of future entitlements in
exchange for which the producer must submit an investment plan (capital formation). In 2006,
over 20% of PROCAMPO was capitalised under this provision (up from 17% in 2005).
AGRICULTURAL POLICIES IN OECD COUNTRIES: MONITORING AND EVALUATION 2007 – ISBN 978-92-64-02746-6 – © OECD 2007 193
II.10. MEXICO
The agricultural sector currently accounts for 76% of Mexico’s water use. Water policy has
long subsidised agricultural users relative to others, although some of this support has
decreased in recent years. The strengthening of hydro-agricultural infrastructure and projects
for increasing efficiency in water management have been priorities for some time. The
irrigation infrastructure for agricultural activities has been improved. Since 2005, two
important projects, Baluarte Presidio and El Tigre, facilitate irrigation on an area of
22 500 hectares.
Alianza (Alianza para el Campo) began in 1996 and was revised in 2003 (Alianza Contigo) to
serve as an umbrella for several programmes including many that focus on increasing
agricultural productivity and helping farmers to add more capital to their operations. The basic
objectives of Alianza elements that focus on agricultural productivity are to increase
productive infrastructure, combat animal diseases, transfer relevant technology and promote
integrated development of rural communities. In general, Alianza’s yearly expenditures (which
also includes rural poverty alleviation) have been around 3% of agricultural GDP. Final
beneficiaries are required to provide matching contributions in order to access certain
programmes. Operation of Alianza programmes is designed to decentralise decision making
and implementation, through the participation and funding of federal and local governments
as well as producers. Alianza currently accounts for about 16% of total spending by SAGARPA.
Trade policyWith the inception of the NAFTA in 1994, all the import barriers insulating the agricultural
sector against trade with Canada6 and the United States became tariffs or tariff quotas, and
were scheduled to be eliminated gradually for all commodities. As of 2006, most of the tariffson agricultural imports either have been phased-out, or are close to zero. However, transitional
tariffs for the four products deemed most sensitive (maize, beans, milk and sugar) are to be
phased out by 2008. In 2005, 78% of total agro-food imports came from NAFTA countries, and
86% of Mexico’s agricultural and food exports were destined for those same countries.
Mexico has continued to conclude trade agreements with other countries. To date, 12 free
trade agreements have been signed with countries or blocks of countries within North
America, Central America, South America, Europe and Asia. Most recently trade agreements
with Uruguay and Japan entered into force in 2004 and 2005, respectively.
In response to a WTO ruling in March 2006, Mexico eliminated the 20% tax on beverages
containing high fructose corn syrup (HFCS) and sweeteners other than sugar.
Notes
1. OECD (2006), “Agricultural and Fisheries Policies in Mexico: Recent Achievements, Continuing theReform Agenda”, Paris.
2. ASERCA: “Apoyos y Servicios a la Comercialización Agropecuaria” (Agricultural Marketing Supportand Services).
3. PROCAMPO: “Programa de Apoyos Directos al Campo” (Direct Payments Program for theCountryside).
4. PROGAN: “Programa de Estímulos a la Productividad Ganadera” (Programme to Improve LivestockProductivity).
5. Alianza covers three streams: Agriculture Enhancement Program, Livestock Enhancement Program,ALIANZA – rural development.
6. Agreement with Canada does not include sugar, poultry, milk and eggs.
AGRICULTURAL POLICIES IN OECD COUNTRIES: MONITORING AND EVALUATION 2007 – ISBN 978-92-64-02746-6 – © OECD 2007194
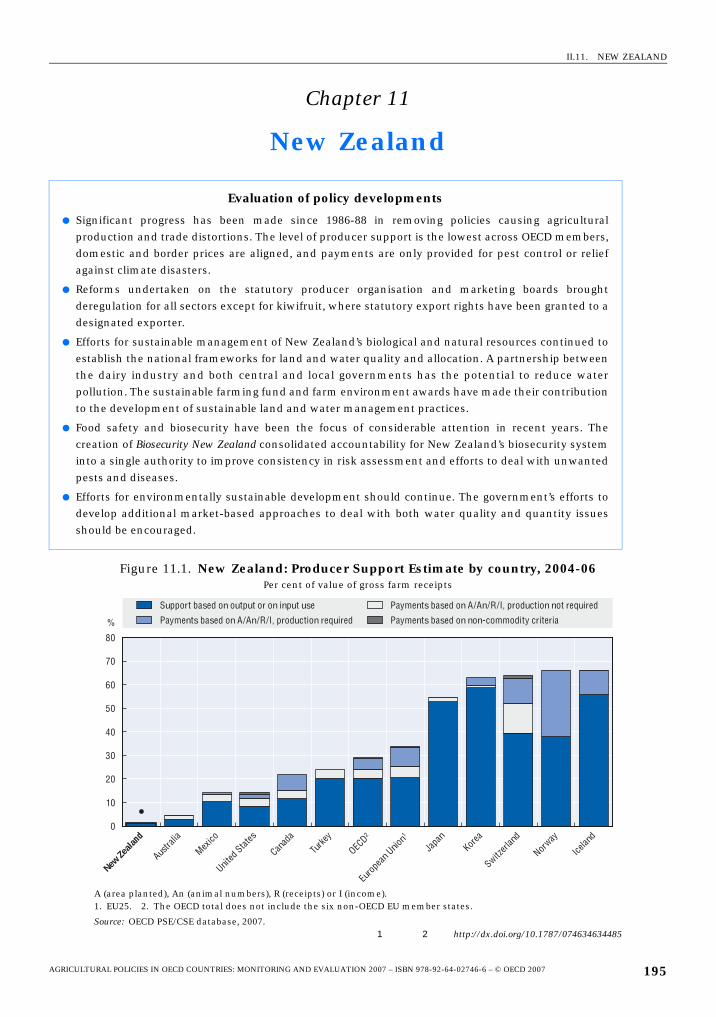
II.11. NEW ZEALAND
Chapter 11
New Zealand
Evaluation of policy developments
● Significant progress has been made since 1986-88 in removing policies causing agriculturalproduction and trade distortions. The level of producer support is the lowest across OECD members,domestic and border prices are aligned, and payments are only provided for pest control or reliefagainst climate disasters.
● Reforms undertaken on the statutory producer organisation and marketing boards broughtderegulation for all sectors except for kiwifruit, where statutory export rights have been granted to adesignated exporter.
● Efforts for sustainable management of New Zealand’s biological and natural resources continued toestablish the national frameworks for land and water quality and allocation. A partnership betweenthe dairy industry and both central and local governments has the potential to reduce waterpollution. The sustainable farming fund and farm environment awards have made their contributionto the development of sustainable land and water management practices.
● Food safety and biosecurity have been the focus of considerable attention in recent years. Thecreation of Biosecurity New Zealand consolidated accountability for New Zealand’s biosecurity systeminto a single authority to improve consistency in risk assessment and efforts to deal with unwantedpests and diseases.
● Efforts for environmentally sustainable development should continue. The government’s efforts todevelop additional market-based approaches to deal with both water quality and quantity issuesshould be encouraged.
Figure 11.1. New Zealand: Producer Support Estimate by country, 2004-06Per cent of value of gross farm receipts
A (area planted), An (animal numbers), R (receipts) or I (income).1. EU25. 2. The OECD total does not include the six non-OECD EU member states.
Source: OECD PSE/CSE database, 2007.1 2 http://dx.doi.org/10.1787/074634634485
0
10
20
30
40
50
60
70
80
New Zea
land
Austra
lia
Mexico
United
States
Canad
a
Turke
y
OECD2
Euro
pean
Unio
n1
Japa
nKor
ea
Switzerl
and
Norway
Icelan
d
%
Support based on output or on input use
Payments based on A/An/R/I, production required
Payments based on A/An/R/I, production not required
Payments based on non-commodity criteria
AGRICULTURAL POLICIES IN OECD COUNTRIES: MONITORING AND EVALUATION 2007 – ISBN 978-92-64-02746-6 – © OECD 2007 195
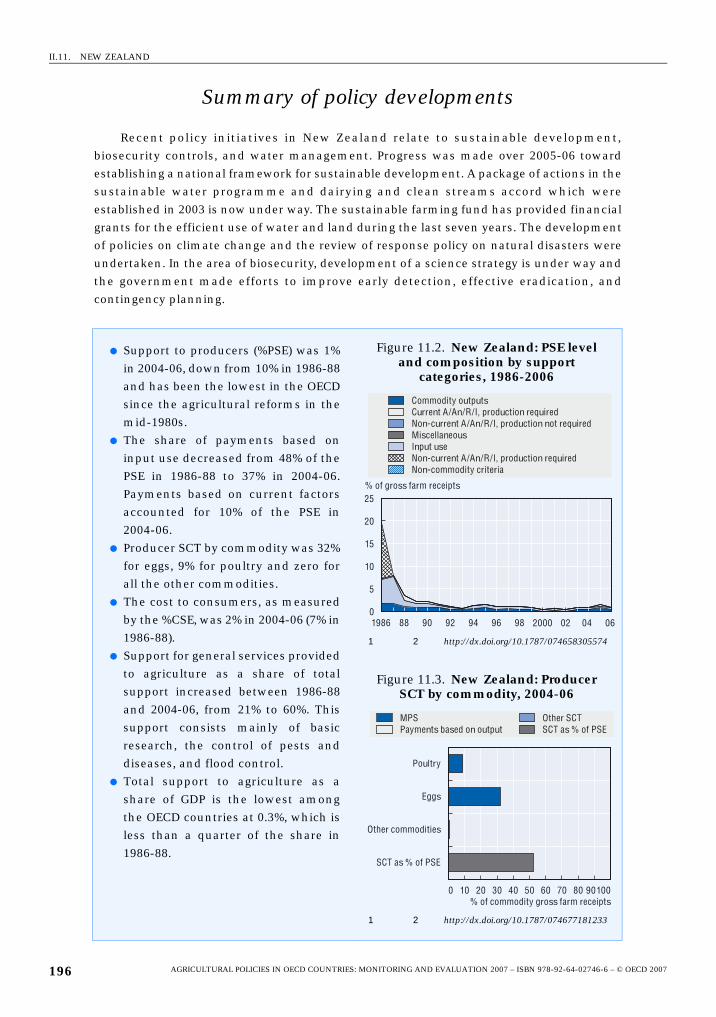
II.11. NEW ZEALAND
Summary of policy developments
Recent policy initiatives in New Zealand relate to sustainable development,
biosecurity controls, and water management. Progress was made over 2005-06 toward
establishing a national framework for sustainable development. A package of actions in the
sustainable water programme and dairying and clean streams accord which were
established in 2003 is now under way. The sustainable farming fund has provided financial
grants for the efficient use of water and land during the last seven years. The development
of policies on climate change and the review of response policy on natural disasters were
undertaken. In the area of biosecurity, development of a science strategy is under way and
the government made efforts to improve early detection, effective eradication, and
contingency planning.
● Support to producers (%PSE) was 1%
in 2004-06, down from 10% in 1986-88
and has been the lowest in the OECD
since the agricultural reforms in the
mid-1980s.
● The share of payments based on
input use decreased from 48% of the
PSE in 1986-88 to 37% in 2004-06.
Payments based on current factors
accounted for 10% of the PSE in
2004-06.
● Producer SCT by commodity was 32%
for eggs, 9% for poultry and zero for
all the other commodities.
● The cost to consumers, as measured
by the %CSE, was 2% in 2004-06 (7% in
1986-88).
● Support for general services provided
to agriculture as a share of total
support increased between 1986-88
and 2004-06, from 21% to 60%. This
support consists mainly of basic
research, the control of pests and
diseases, and flood control.
● Total support to agriculture as a
share of GDP is the lowest among
the OECD countries at 0.3%, which is
less than a quarter of the share in
1986-88.
Figure 11.2. New Zealand: PSE level and composition by support
categories, 1986-2006
1 2 http://dx.doi.org/10.1787/074658305574
Figure 11.3. New Zealand: Producer SCT by commodity, 2004-06
1 2 http://dx.doi.org/10.1787/074677181233
% of gross farm receipts
Commodity outputsCurrent A/An/R/I, production requiredNon-current A/An/R/I, production not requiredMiscellaneousInput useNon-current A/An/R/I, production requiredNon-commodity criteria
0
5
10
15
20
25
1986 88 90 92 94 96 98 2000 02 04 06
MPS Payments based on output
Other SCTSCT as % of PSE
0 10 20 30 40 50 60 70 80 90100% of commodity gross farm receipts
SCT as % of PSE
Poultry
Eggs
Other commodities
AGRICULTURAL POLICIES IN OECD COUNTRIES: MONITORING AND EVALUATION 2007 – ISBN 978-92-64-02746-6 – © OECD 2007196
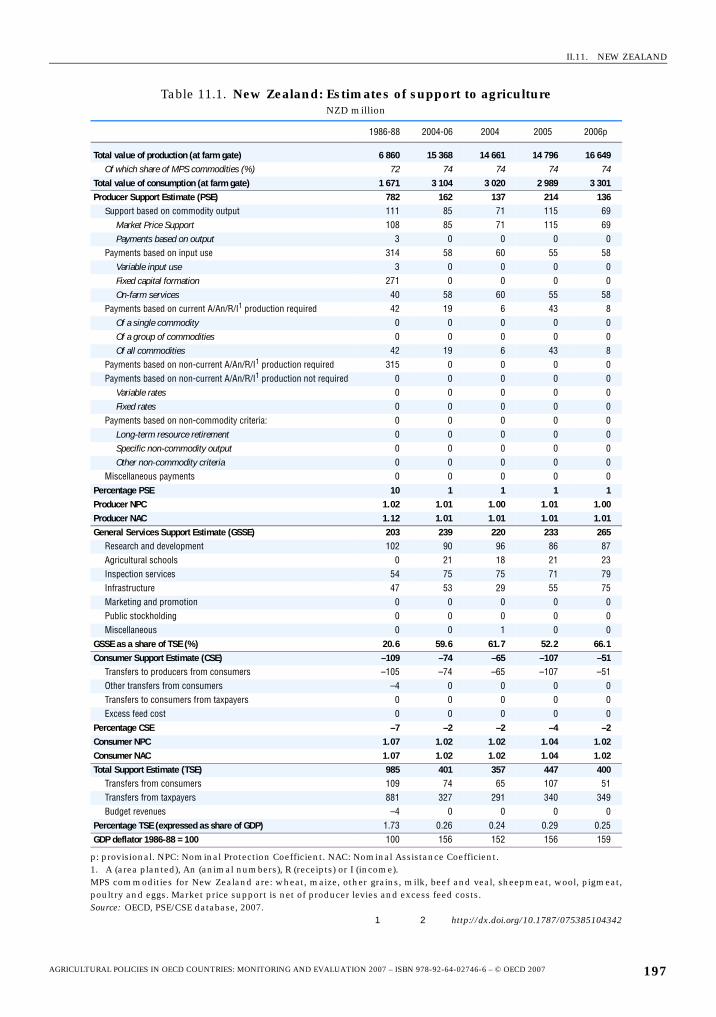
II.11. NEW ZEALAND
Table 11.1. New Zealand: Estimates of support to agricultureNZD million
1986-88 2004-06 2004 2005 2006p
Total value of production (at farm gate) 6 860 15 368 14 661 14 796 16 649Of which share of MPS commodities (%) 72 74 74 74 74
Total value of consumption (at farm gate) 1 671 3 104 3 020 2 989 3 301Producer Support Estimate (PSE) 782 162 137 214 136
Support based on commodity output 111 85 71 115 69Market Price Support 108 85 71 115 69Payments based on output 3 0 0 0 0
Payments based on input use 314 58 60 55 58Variable input use 3 0 0 0 0Fixed capital formation 271 0 0 0 0On-farm services 40 58 60 55 58
Payments based on current A/An/R/I1 production required 42 19 6 43 8Of a single commodity 0 0 0 0 0Of a group of commodities 0 0 0 0 0Of all commodities 42 19 6 43 8
Payments based on non-current A/An/R/I1 production required 315 0 0 0 0Payments based on non-current A/An/R/I1 production not required 0 0 0 0 0
Variable rates 0 0 0 0 0Fixed rates 0 0 0 0 0
Payments based on non-commodity criteria: 0 0 0 0 0Long-term resource retirement 0 0 0 0 0Specific non-commodity output 0 0 0 0 0Other non-commodity criteria 0 0 0 0 0
Miscellaneous payments 0 0 0 0 0Percentage PSE 10 1 1 1 1Producer NPC 1.02 1.01 1.00 1.01 1.00Producer NAC 1.12 1.01 1.01 1.01 1.01General Services Support Estimate (GSSE) 203 239 220 233 265
Research and development 102 90 96 86 87Agricultural schools 0 21 18 21 23Inspection services 54 75 75 71 79Infrastructure 47 53 29 55 75Marketing and promotion 0 0 0 0 0Public stockholding 0 0 0 0 0Miscellaneous 0 0 1 0 0
GSSE as a share of TSE (%) 20.6 59.6 61.7 52.2 66.1Consumer Support Estimate (CSE) –109 –74 –65 –107 –51
Transfers to producers from consumers –105 –74 –65 –107 –51Other transfers from consumers –4 0 0 0 0Transfers to consumers from taxpayers 0 0 0 0 0Excess feed cost 0 0 0 0 0
Percentage CSE –7 –2 –2 –4 –2Consumer NPC 1.07 1.02 1.02 1.04 1.02Consumer NAC 1.07 1.02 1.02 1.04 1.02Total Support Estimate (TSE) 985 401 357 447 400
Transfers from consumers 109 74 65 107 51Transfers from taxpayers 881 327 291 340 349Budget revenues –4 0 0 0 0
Percentage TSE (expressed as share of GDP) 1.73 0.26 0.24 0.29 0.25GDP deflator 1986-88 = 100 100 156 152 156 159
p: provisional. NPC: Nominal Protection Coefficient. NAC: Nominal Assistance Coefficient.1. A (area planted), An (animal numbers), R (receipts) or I (income).MPS commodities for New Zealand are: wheat, maize, other grains, milk, beef and veal, sheepmeat, wool, pigmeat,poultry and eggs. Market price support is net of producer levies and excess feed costs.Source: OECD, PSE/CSE database, 2007.
1 2 http://dx.doi.org/10.1787/075385104342
AGRICULTURAL POLICIES IN OECD COUNTRIES: MONITORING AND EVALUATION 2007 – ISBN 978-92-64-02746-6 – © OECD 2007 197
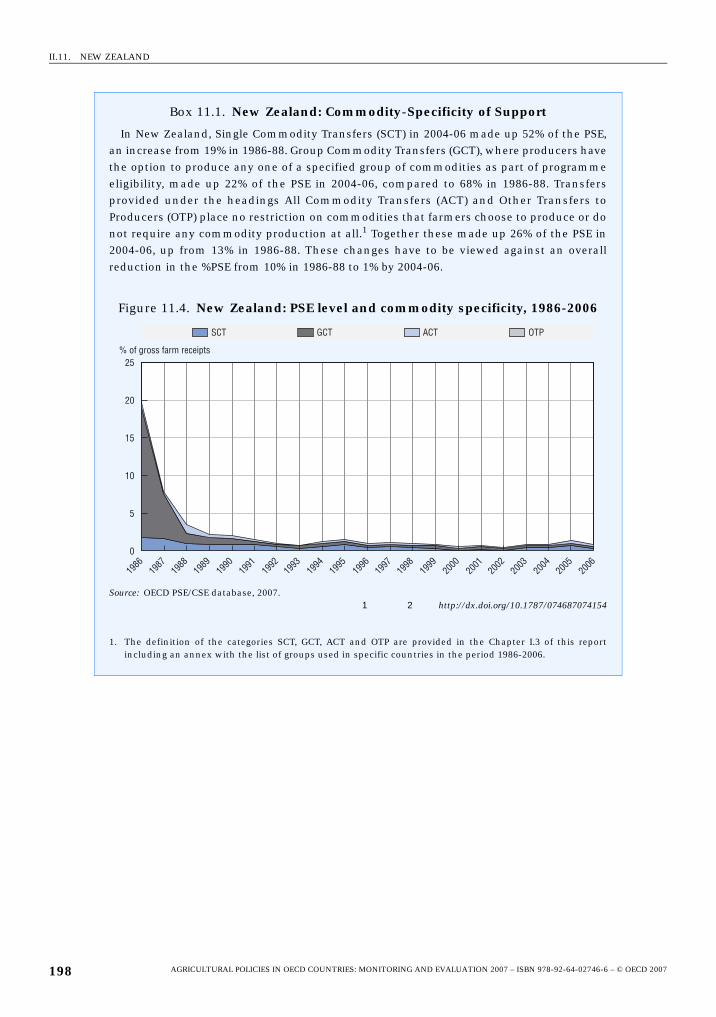
II.11. NEW ZEALAND
Box 11.1. New Zealand: Commodity-Specificity of Support
In New Zealand, Single Commodity Transfers (SCT) in 2004-06 made up 52% of the PSE,an increase from 19% in 1986-88. Group Commodity Transfers (GCT), where producers havethe option to produce any one of a specified group of commodities as part of programmeeligibility, made up 22% of the PSE in 2004-06, compared to 68% in 1986-88. Transfersprovided under the headings All Commodity Transfers (ACT) and Other Transfers toProducers (OTP) place no restriction on commodities that farmers choose to produce or donot require any commodity production at all.1 Together these made up 26% of the PSE in2004-06, up from 13% in 1986-88. These changes have to be viewed against an overallreduction in the %PSE from 10% in 1986-88 to 1% by 2004-06.
Figure 11.4. New Zealand: PSE level and commodity specificity, 1986-2006
Source: OECD PSE/CSE database, 2007.1 2 http://dx.doi.org/10.1787/074687074154
1. The definition of the categories SCT, GCT, ACT and OTP are provided in the Chapter I.3 of this reportincluding an annex with the list of groups used in specific countries in the period 1986-2006.
��� ��� ��� ���
��
�� �
��
��
�� �
���
����
����
����
����
����
����
���
���
����
�
��
��
��
��
��
��
�
��
�
�
���������������������� �
AGRICULTURAL POLICIES IN OECD COUNTRIES: MONITORING AND EVALUATION 2007 – ISBN 978-92-64-02746-6 – © OECD 2007198
II.11. NEW ZEALAND
Description of policy developments
Main policy instrumentsSupport to agriculture in New Zealand is provided mainly through expenditures on
general services such as agricultural research and biosecurity controls for pests and
diseases. A large portion of the costs of regulatory and operational functions, including
border control, are in fact charged to the appropriate beneficiaries. In the event of large-
scale emergencies of national significance that are beyond the response capacity of private
insurance, local farmer organisations and territorial local authorities, payments to farmers
are granted to replace losses resulting from adverse climatic events and natural disasters.
The only commodities for which market price support is provided in New Zealand are eggs
and poultry due to border measures imposed to prevent the entry of pests and diseases.
Historically, marketing of most agricultural production was largely under the control
of statutory producer and marketing boards. Reforms undertaken over the 1990s mean that
today almost all sectors are deregulated. In two cases, statutory export rights have been
granted to designated exporters. Exports of dairy products are regulated where importing
countries have country-specific tariff quotas for New Zealand products. The New Zealand
Dairy Board, a wholly owned subsidiary of Fonterra, holds exclusive access to these
markets for fixed periods. This legislation is currently under review. Legislation provides
for Zespri to be the main exporter of kiwifruit. Those who wish to export this fruit must
obtain a permit from the New Zealand Kiwifruit Board to market collaboratively with
Zespri. The exception is exports of kiwifruit to Australia which are governed by the New
Zealand Horticulture Export Authority Act 1987. This legislation, which has the objective of
developing effective export marketing of horticultural products, provides the means for
collaborative marketing amongst growers and exporters who choose to work under this
legislative framework.
To fund activities such as market research, development, quality assurance, and plant
and animal health protection, two industry organisations have statutory powers to collect
levies from producers. These producer organisations are Deer Industry New Zealand and
the Pork Industry Board. The trend in New Zealand is for sector-specific legislation to be
replaced with a harmonised approach under the Commodity Levies Act 1990. Under this
legislation, levies can only be imposed if they are supported by producers, and producers
themselves decide how levies are spent. The levying organisations must seek a new
mandate to collect levies every six years through a referendum of levy payers.
The two principal policy measures that address agri-environmental issues are the
Resource Management Act 1991 (RMA) and the Sustainable Farming Fund (SFF). The
objective of the RMA is to promote the sustainable management of natural and physical
resources, including soil, water, air, biodiversity and the coastal environment. Most
responsibilities under the RMA are assigned to regional and district councils. Examples of
relevant activities include soil conservation cost-share programmes, flood control and
drainage works, and pest plant and animal control programmes. The SFF supports
community-driven projects aimed at improving the productive and environmental
performance of the land-based sectors.
AGRICULTURAL POLICIES IN OECD COUNTRIES: MONITORING AND EVALUATION 2007 – ISBN 978-92-64-02746-6 – © OECD 2007 199
II.11. NEW ZEALAND
Domestic policyProgress was made over 2005-06 towards establishing a sustainable development
framework and improving understanding of the needs for and the impediments to
implementing economically profitable sustainable development in this area. The next step
will be the development of national frameworks for land and water quality and allocation.
The Pastoral Greenhouse Gas Research Consortium (PGGRC) continues to develop
technologies and systems for improving the economic and environmental performance of
agriculture. Globally, 14% of greenhouse gas emissions come from agriculture. In
comparison, 49% of New Zealand’s greenhouse gas emissions come from the agricultural
sector. The Consortium, a combined industry and government initiative established in
2002, seeks to discover innovative ways to reduce methane and nitrous oxide production
from sheep, cattle and deer. A full review of its governance and science, involving
independent experts, was completed in 2006. As part of the continuing development of
climate change policy for the agriculture and forestry sectors a discussion document on
sustainable land management and climate change was released by the government in late
2006; a wide range of options are presented to reduce greenhouse gas emissions from
agriculture, to encourage afforestation, and to manage deforestation. Public consultation
was undertaken in early 2007.
The Sustainable Water Programme of Action, established in 2003, aims to address the
issues of maintaining water quality and the increasing demand for water, including for
irrigation. This inter-departmental effort is co-led by the Ministry of Agriculture and
Forestry (MAF) and the Ministry for the Environment. After a public consultation process in
2005, a package of actions, including both regulatory and voluntary approaches to water
quality and management, is now under way. Through the Programme of Action, the
government is seeking to raise public awareness of water management issues and to
develop innovative responses to water allocation issues. In addition, the government has
been developing and disseminating best practice for riparian management and improved
targeting of fertilisers and agrichemicals use through the SFF.
The Dairying and Clean Streams Accord was agreed between Fonterra Co-operative
Group, the Minister for the Environment, the Minister of Agriculture, and regional councils
in May 2003. The parties to the Accord agreed to work together to achieve clean water,
including streams, rivers, lakes, groundwater and wetlands, in dairying areas. Five targets
were set for farmers to implement. Among these, stock exclusion and stream-crossing
targets set for 2007 were attained in 2006. Since 2004, a yearly report provides a stocktaking
of progress in implementing this Accord (www.maf.govt.nz or www.mfe.govt.nz)
The discussion on Nitrogen Restrictions in the Lake Taupo Catchment is under progress.
Lake Taupo is building up increasing levels of nitrates which come from waterways in its
catchment. Environment Waikato has proposed capping nitrogen levels in the lake and
reducing by 20% manageable discharges in the lake’s catchment by 2020. For the initial
allocation of nitrogen discharge, MAF proposed in September 2005 that a variation of
grandparenting (allocation based on current or historical levels) be adopted in its
submission to Environment Waikato. No final decision has yet been taken on the initial
allocation method.
The Sustainable Farming Fund (SFF) has provided financial grants to 460 producer-led
projects during its seven years of operation. It provides money for projects that enable
access to information, technology, or tools that bring together communities to address
AGRICULTURAL POLICIES IN OECD COUNTRIES: MONITORING AND EVALUATION 2007 – ISBN 978-92-64-02746-6 – © OECD 2007200
II.11. NEW ZEALAND
problems as well as to improve their economic base. The focus of the Fund is on short-term
projects (1-3 years) and examples of projects funded include investigations into the
efficient use of water and identifying options for improved land use. All results stemming
from these projects must be shared with the community, including farmers.
The New Zealand Farm Environment Awards Trust is a charitable organization which
aims to promote sustainable environmental management of land and other resources on
farms. The Farm Environment Awards were established in 1993 as a joint initiative between
the Waikato Conservation Board and Environment Waikato (the Regional Council). In 2007,
the Awards were enlarged to incorporate eight regions. The key objective of the Awards is
to encourage sustainable land management and to illustrate to farmers that profitability
can be balanced with environmental concerns. Through feedback and profiling winners,
the Awards encourage other farmers to be more proactive in their resource management by
providing role models for sustainable land management.
New Zealand experienced severe damage from flooding and storms in 2004. To
develop a new process for recovering from severe climatic events or natural disasters that
are beyond the ability of individual communities to cope with, a review of New Zealand’s
adverse events response policy is in progress, with consultation with stakeholders
undertaken late in 2006. The aim of the review of the On-farm Adverse Events RecoveryFramework is to promote a shared understanding of the roles and responsibilities of central
government, local government, and the primary production sector in preparing for, and
recovering from, adverse events.
Recent expansion of New Zealand’s orchards and vineyards requires increasing
numbers of seasonal labourers. A seasonal labour strategy for horticulture and viticulturewas launched by MAF, Department of Labour, Ministry of Social Development and the
industry in 2005. It seeks to ensure that the sector has access to skilled people in an area
that has faced labour shortages in recent years, with a view to lifting productivity within
the sector on a sustainable basis.
The government is developing a suite of agricultural performance indicators spanning
the economic, environmental, and social domains. The final set will include core indicators
linking the national, regional, and territorial authority levels with quantitative
information. The Ministry of Agriculture and Forestry participated along with livestock
industry representatives in an Animal Identification Working Party to consider the
development of a national animal identification and traceability framework. A new code of
welfare for deer was developed in 2005 under the Animal Welfare Act 1999.
In the area of biosecurity, development of a science strategy is under way, reflecting the
importance that New Zealand places on ensuring that sanitary and phytosanitary
measures are based on scientific evidence. The cost of Operation Waiheke, a response to a
hoax letter claiming foot and mouth disease (FMD) had been released on Waiheke Island in
May 2005, was NZD 2 million. The Reserve Bank estimated the impact of a real case of FMD
on the New Zealand economy at NZD 10 billion over two years. The government has
undertaken a programme of work that focuses on better determining issues that are
unique to Mori interests in the field of biosecurity response and management since 2004.
This includes, for example, identifying potential pests of a number of native plants and
assessing the impacts of these identified pests on Mori cultural values, identifying marine
species of significance to Mori and determining the values that Mori attribute to
waterways.
AGRICULTURAL POLICIES IN OECD COUNTRIES: MONITORING AND EVALUATION 2007 – ISBN 978-92-64-02746-6 – © OECD 2007 201
II.11. NEW ZEALAND
Trade policyAccomplishing more liberal rules-based trade through the WTO Doha Round
negotiation is the top agricultural trade policy priority. New Zealand has already finalised
four Free Trade Agreements (FTA): the 1983 Australia-New Zealand Closer Economic
Relations Trade Agreement; the 2001 Agreement between New Zealand and Singapore on a
Closer Economic Partnership; the 2005 Thailand-New Zealand Closer Economic
Partnership Agreement; and the 2005 Trans-Pacific (involving New Zealand, Singapore,
Brunei and Chile) Strategic Economic Partnership Agreement. Currently, New Zealand is
negotiating three FTAs: New Zealand-China, New Zealand-Malaysia, and ASEAN-Australia/
New Zealand, and soon to begin negotiation with the Gulf Co-operation Council (GCC)
(Saudi Arabia, UAE, Oman, Qatar, Bahrain, and Kuwait).
The World Animal Health Organisation (OIE) officially recognised New Zealand as
bovine spongiform encephalopathy (BSE) free in early 2006. There has never been a case of
BSE in New Zealand.
AGRICULTURAL POLICIES IN OECD COUNTRIES: MONITORING AND EVALUATION 2007 – ISBN 978-92-64-02746-6 – © OECD 2007202
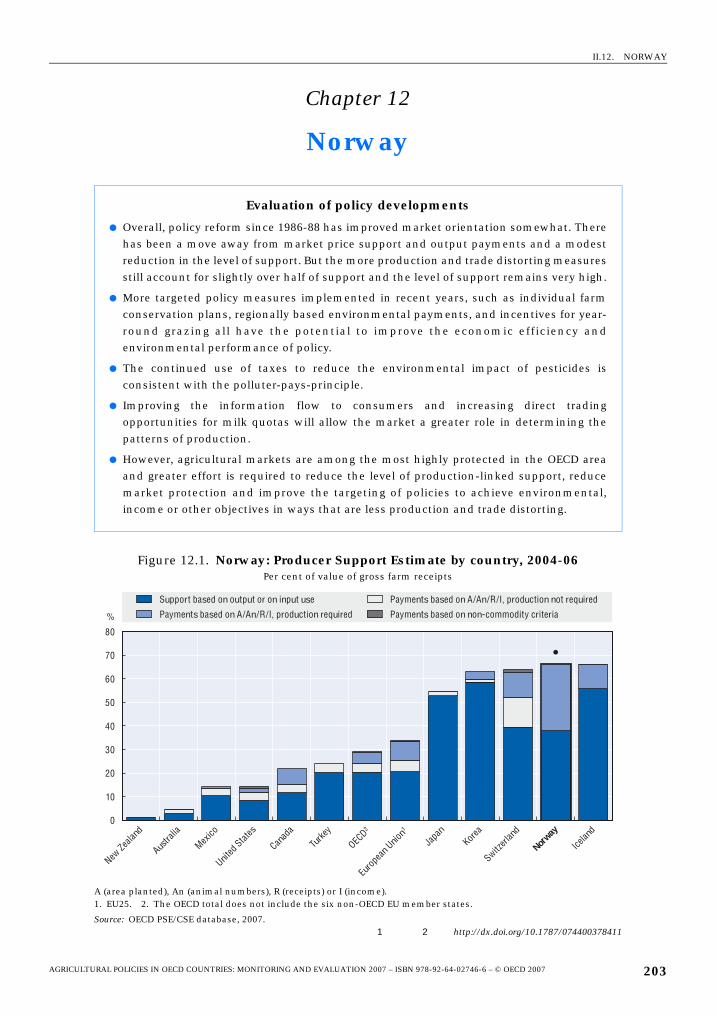
II.12. NORWAY
Chapter 12
Norway
Evaluation of policy developments
● Overall, policy reform since 1986-88 has improved market orientation somewhat. Therehas been a move away from market price support and output payments and a modestreduction in the level of support. But the more production and trade distorting measuresstill account for slightly over half of support and the level of support remains very high.
● More targeted policy measures implemented in recent years, such as individual farmconservation plans, regionally based environmental payments, and incentives for year-round grazing all have the potential to improve the economic efficiency andenvironmental performance of policy.
● The continued use of taxes to reduce the environmental impact of pesticides isconsistent with the polluter-pays-principle.
● Improving the information flow to consumers and increasing direct tradingopportunities for milk quotas will allow the market a greater role in determining thepatterns of production.
● However, agricultural markets are among the most highly protected in the OECD areaand greater effort is required to reduce the level of production-linked support, reducemarket protection and improve the targeting of policies to achieve environmental,income or other objectives in ways that are less production and trade distorting.
Figure 12.1. Norway: Producer Support Estimate by country, 2004-06Per cent of value of gross farm receipts
A (area planted), An (animal numbers), R (receipts) or I (income).1. EU25. 2. The OECD total does not include the six non-OECD EU member states.
Source: OECD PSE/CSE database, 2007.1 2 http://dx.doi.org/10.1787/074400378411
0
10
20
30
40
50
60
70
80
New Ze
aland
Austra
lia
Mexico
United
States
Canad
a
Turke
y
OECD2
Euro
pean
Unio
n1
Japa
nKor
ea
Switzerl
and
Norway
Icelan
d
%
Support based on output or on input use
Payments based on A/An/R/I, production required
Payments based on A/An/R/I, production not required
Payments based on non-commodity criteria
AGRICULTURAL POLICIES IN OECD COUNTRIES: MONITORING AND EVALUATION 2007 – ISBN 978-92-64-02746-6 – © OECD 2007 203
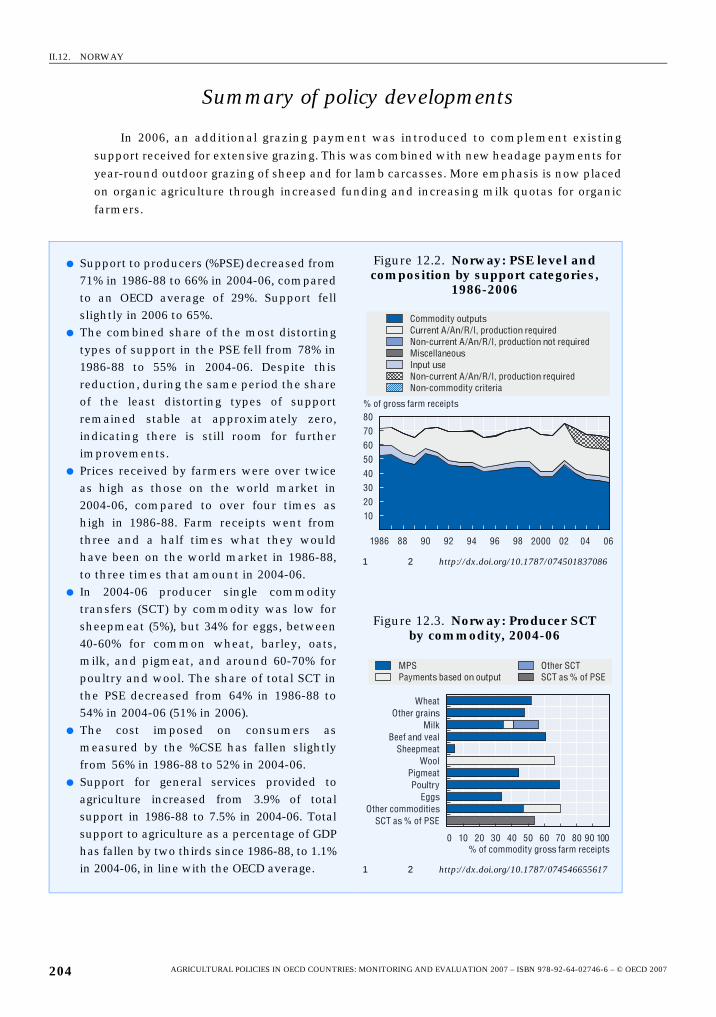
II.12. NORWAY
Summary of policy developments
In 2006, an additional grazing payment was introduced to complement existing
support received for extensive grazing. This was combined with new headage payments for
year-round outdoor grazing of sheep and for lamb carcasses. More emphasis is now placed
on organic agriculture through increased funding and increasing milk quotas for organic
farmers.
● Support to producers (%PSE) decreased from71% in 1986-88 to 66% in 2004-06, comparedto an OECD average of 29%. Support fellslightly in 2006 to 65%.
● The combined share of the most distortingtypes of support in the PSE fell from 78% in1986-88 to 55% in 2004-06. Despite thisreduction, during the same period the shareof the least distorting types of supportremained stable at approximately zero,indicating there is still room for furtherimprovements.
● Prices received by farmers were over twiceas high as those on the world market in2004-06, compared to over four times ashigh in 1986-88. Farm receipts went fromthree and a half times what they wouldhave been on the world market in 1986-88,to three times that amount in 2004-06.
● In 2004-06 producer single commoditytransfers (SCT) by commodity was low forsheepmeat (5%), but 34% for eggs, between40-60% for common wheat, barley, oats,milk, and pigmeat, and around 60-70% forpoultry and wool. The share of total SCT inthe PSE decreased from 64% in 1986-88 to54% in 2004-06 (51% in 2006).
● The cost imposed on consumers asmeasured by the %CSE has fallen slightlyfrom 56% in 1986-88 to 52% in 2004-06.
● Support for general services provided toagriculture increased from 3.9% of totalsupport in 1986-88 to 7.5% in 2004-06. Totalsupport to agriculture as a percentage of GDPhas fallen by two thirds since 1986-88, to 1.1%in 2004-06, in line with the OECD average.
Figure 12.2. Norway: PSE level and composition by support categories,
1986-2006
1 2 http://dx.doi.org/10.1787/074501837086
Figure 12.3. Norway: Producer SCT by commodity, 2004-06
1 2 http://dx.doi.org/10.1787/074546655617
% of gross farm receipts
Commodity outputsCurrent A/An/R/I, production requiredNon-current A/An/R/I, production not requiredMiscellaneousInput useNon-current A/An/R/I, production requiredNon-commodity criteria
1020304050607080
1986 88 90 92 94 96 98 2000 02 04 06
MPS Payments based on output
Other SCTSCT as % of PSE
0 10 20 30 40 50 60 70 80 90 100% of commodity gross farm receipts
SCT as % of PSE
WheatOther grains
MilkBeef and veal
SheepmeatWool
PigmeatPoultry
EggsOther commodities
AGRICULTURAL POLICIES IN OECD COUNTRIES: MONITORING AND EVALUATION 2007 – ISBN 978-92-64-02746-6 – © OECD 2007204
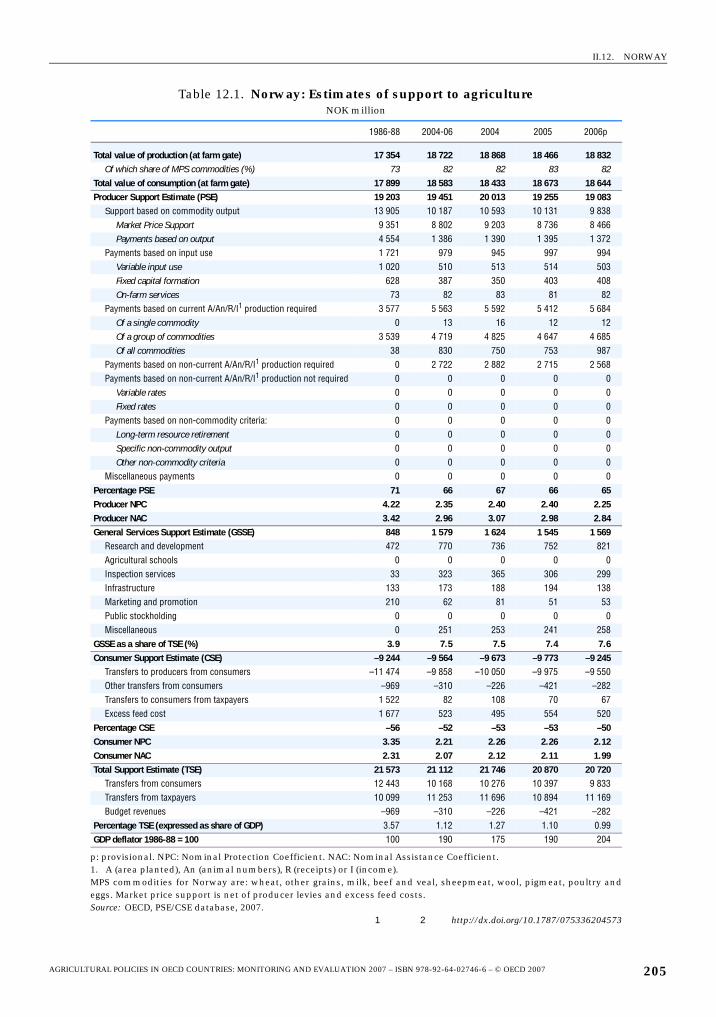
II.12. NORWAY
Table 12.1. Norway: Estimates of support to agricultureNOK million
1986-88 2004-06 2004 2005 2006p
Total value of production (at farm gate) 17 354 18 722 18 868 18 466 18 832Of which share of MPS commodities (%) 73 82 82 83 82
Total value of consumption (at farm gate) 17 899 18 583 18 433 18 673 18 644Producer Support Estimate (PSE) 19 203 19 451 20 013 19 255 19 083
Support based on commodity output 13 905 10 187 10 593 10 131 9 838Market Price Support 9 351 8 802 9 203 8 736 8 466Payments based on output 4 554 1 386 1 390 1 395 1 372
Payments based on input use 1 721 979 945 997 994Variable input use 1 020 510 513 514 503Fixed capital formation 628 387 350 403 408On-farm services 73 82 83 81 82
Payments based on current A/An/R/I1 production required 3 577 5 563 5 592 5 412 5 684Of a single commodity 0 13 16 12 12Of a group of commodities 3 539 4 719 4 825 4 647 4 685Of all commodities 38 830 750 753 987
Payments based on non-current A/An/R/I1 production required 0 2 722 2 882 2 715 2 568Payments based on non-current A/An/R/I1 production not required 0 0 0 0 0
Variable rates 0 0 0 0 0Fixed rates 0 0 0 0 0
Payments based on non-commodity criteria: 0 0 0 0 0Long-term resource retirement 0 0 0 0 0Specific non-commodity output 0 0 0 0 0Other non-commodity criteria 0 0 0 0 0
Miscellaneous payments 0 0 0 0 0Percentage PSE 71 66 67 66 65Producer NPC 4.22 2.35 2.40 2.40 2.25Producer NAC 3.42 2.96 3.07 2.98 2.84General Services Support Estimate (GSSE) 848 1 579 1 624 1 545 1 569
Research and development 472 770 736 752 821Agricultural schools 0 0 0 0 0Inspection services 33 323 365 306 299Infrastructure 133 173 188 194 138Marketing and promotion 210 62 81 51 53Public stockholding 0 0 0 0 0Miscellaneous 0 251 253 241 258
GSSE as a share of TSE (%) 3.9 7.5 7.5 7.4 7.6Consumer Support Estimate (CSE) –9 244 –9 564 –9 673 –9 773 –9 245
Transfers to producers from consumers –11 474 –9 858 –10 050 –9 975 –9 550Other transfers from consumers –969 –310 –226 –421 –282Transfers to consumers from taxpayers 1 522 82 108 70 67Excess feed cost 1 677 523 495 554 520
Percentage CSE –56 –52 –53 –53 –50Consumer NPC 3.35 2.21 2.26 2.26 2.12Consumer NAC 2.31 2.07 2.12 2.11 1.99Total Support Estimate (TSE) 21 573 21 112 21 746 20 870 20 720
Transfers from consumers 12 443 10 168 10 276 10 397 9 833Transfers from taxpayers 10 099 11 253 11 696 10 894 11 169Budget revenues –969 –310 –226 –421 –282
Percentage TSE (expressed as share of GDP) 3.57 1.12 1.27 1.10 0.99GDP deflator 1986-88 = 100 100 190 175 190 204
p: provisional. NPC: Nominal Protection Coefficient. NAC: Nominal Assistance Coefficient.1. A (area planted), An (animal numbers), R (receipts) or I (income).MPS commodities for Norway are: wheat, other grains, milk, beef and veal, sheepmeat, wool, pigmeat, poultry andeggs. Market price support is net of producer levies and excess feed costs.Source: OECD, PSE/CSE database, 2007.
1 2 http://dx.doi.org/10.1787/075336204573
AGRICULTURAL POLICIES IN OECD COUNTRIES: MONITORING AND EVALUATION 2007 – ISBN 978-92-64-02746-6 – © OECD 2007 205
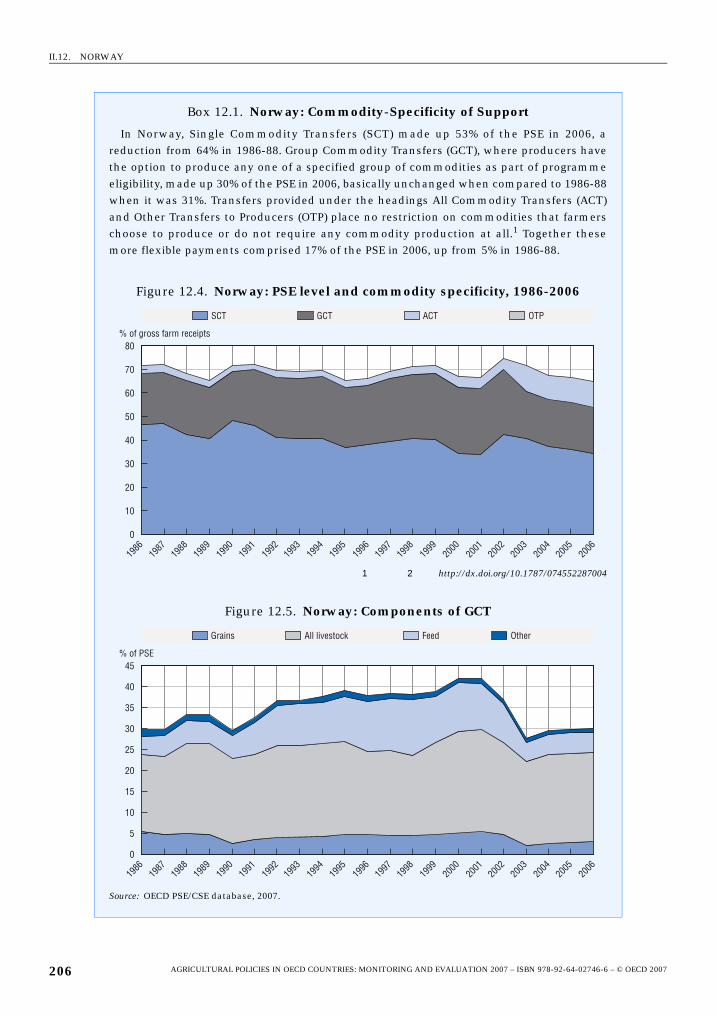
II.12. NORWAY
Box 12.1. Norway: Commodity-Specificity of Support
In Norway, Single Commodity Transfers (SCT) made up 53% of the PSE in 2006, areduction from 64% in 1986-88. Group Commodity Transfers (GCT), where producers havethe option to produce any one of a specified group of commodities as part of programmeeligibility, made up 30% of the PSE in 2006, basically unchanged when compared to 1986-88when it was 31%. Transfers provided under the headings All Commodity Transfers (ACT)and Other Transfers to Producers (OTP) place no restriction on commodities that farmerschoose to produce or do not require any commodity production at all.1 Together thesemore flexible payments comprised 17% of the PSE in 2006, up from 5% in 1986-88.
Figure 12.4. Norway: PSE level and commodity specificity, 1986-2006
1 2 http://dx.doi.org/10.1787/074552287004
Figure 12.5. Norway: Components of GCT
Source: OECD PSE/CSE database, 2007.
��� ��� ��� ���
�� �
��
��
�� �
���
����
����
����
����
����
����
���
���
����
�
��
��
��
��
��
��
�
�
�
�
�
�
���������������������� �
�""�"�#�� ��$����%� � &��'��(
��
�� �
��
��
�� �
���
����
����
����
����
����
����
���
���
����
�
��
��
��
��
��
��
�
�
��
�
��
��
�
�
�������)
AGRICULTURAL POLICIES IN OECD COUNTRIES: MONITORING AND EVALUATION 2007 – ISBN 978-92-64-02746-6 – © OECD 2007206
II.12. NORWAY
Box 12.1. Norway: Commodity-Specificity of Support (cont.)
The increase in more flexible payments dates back to 2003 when the Cultural LandscapeProgramme was introduced, providing all farmers with a per hectare payment whilerequiring only landscape maintenance and the use of environmentally sound productionpractices. Transfers for producing any one of a group of commodities (GCT), accounting for30% of PSE support are sizable, with the largest share (21% of PSE) going to livestockproducers (irrespective of animal type), followed by 5% of PSE supporting production ofcoarse feeds, including mountain farming, and the rest going to either producers of grains(3%), or other groups. The relative importance of the different groups in terms of share ofPSE support did not change much from 1986 to 2006.
1. The definition of the categories SCT, GCT, ACT and OTP are provided in the Chapter I.3 of this reportincluding an annex with the list of groups used in specific countries in the period 1986-2006.
AGRICULTURAL POLICIES IN OECD COUNTRIES: MONITORING AND EVALUATION 2007 – ISBN 978-92-64-02746-6 – © OECD 2007 207
II.12. NORWAY
Description of policy developments
Main policy instrumentsBorder measures and budgetary payments are the main policy instruments supporting
agriculture in Norway. Market price support, in the form of wholesale target prices, is
provided for most commodities. These target prices and most payments are negotiated
annually between the government and producer representatives resulting in an
Agricultural Agreement, on a July/June basis. Milk production quotas were introduced in
1983. Most of Norway’s tariff-rate-quotas (TRQs) were eliminated in 2000 when the WTO
bound tariff rates for these products became equal to the in-tariff quota rates. Tariffs for
the vast majority of products are set between 100-400% although there is a system of “open
periods” for imports at reduced tariff rates when domestic prices rise above threshold
levels.
Market price support is supplemented by a variety of other support measures,
including area, headage, and deficiency payments. A significant proportion of these
payments are differentiated by region and farm size. Agri-environmental payments have
been increasing in recent years. Producer levies are used for marketing activities, including
export subsidies for livestock products, while exports of processed products and marketing
activities for horticultural products are financed directly by the government.
The current direction of Norwegian agricultural policy emphasises increased
consumer orientation, food safety and the multifunctional character of agriculture, while
continuing to focus on promoting food security, enhancing rural development, and
protecting the cultural landscape and biodiversity. The Norwegian Agricultural Authority(NAA), established in 2000 under the authority of the Ministry of Agriculture, is the central
body implementing agricultural policy.
The Norwegian Food Safety Authority was established in 2004 bringing together into
one organisation responsibilities previously held by several Norwegian agencies. The
Authority is responsible for all matters relating to health, quality and other consumer
interests in feed and food production and marketing. Also in 2004, a new Food Production
and Safety Act was enacted to replace previous laws regulating the food chain and plant
and animal health.
Another responsibility of the Authority is to implement the measures contained in AnAction Plan for the Consumer Orientation of Food Policy (2004-05) jointly established by four
government agencies, including the Ministry of Agriculture and Food. The objectives of the
plan are to strengthen the opportunities of consumers to influence the development of
food policy and to make an informed choice based on personal preference, and their
confidence in the food they consume. Projects include consumer panels for advising
politicians and Internet-based information sources.
Domestic policyTarget prices for cereals, after having typically fallen every year since the target price
system was introduced for grains in 2001, were basically left unchanged in 2005 and 2006
(Table 12.2). Increases in target prices occurred for beef in 2005 and for sheepmeat in 2006.
On 1 January 2004 a new target price for raw milk for all uses was established. Previously
there were separate target prices for different groups of milk uses. This target price was
AGRICULTURAL POLICIES IN OECD COUNTRIES: MONITORING AND EVALUATION 2007 – ISBN 978-92-64-02746-6 – © OECD 2007208
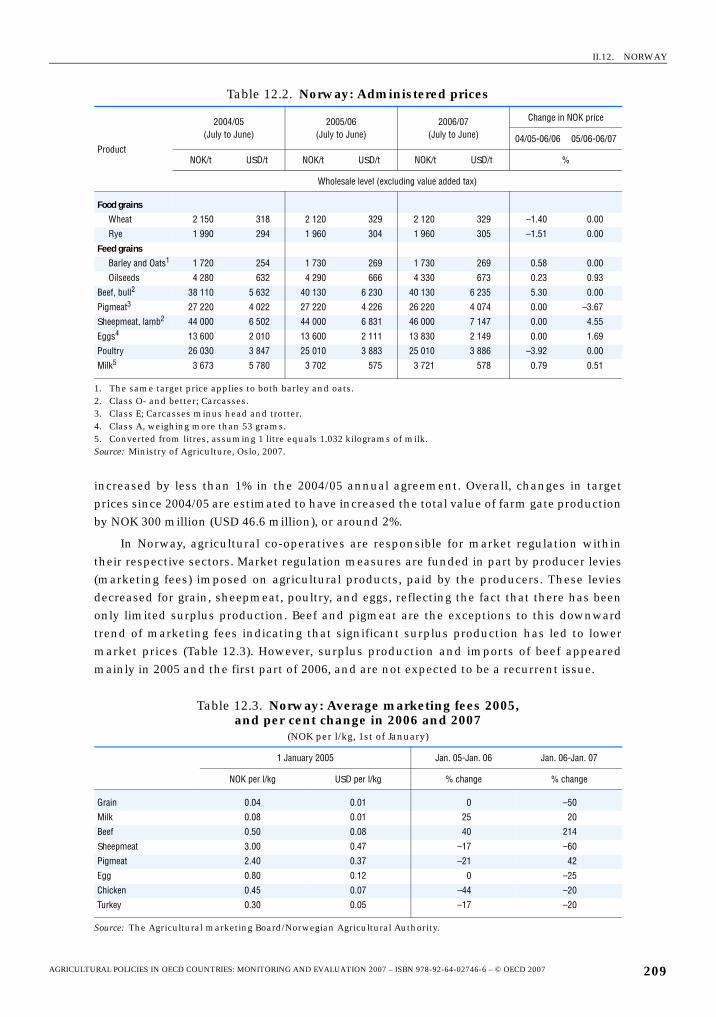
II.12. NORWAY
increased by less than 1% in the 2004/05 annual agreement. Overall, changes in target
prices since 2004/05 are estimated to have increased the total value of farm gate production
by NOK 300 million (USD 46.6 million), or around 2%.
In Norway, agricultural co-operatives are responsible for market regulation within
their respective sectors. Market regulation measures are funded in part by producer levies
(marketing fees) imposed on agricultural products, paid by the producers. These levies
decreased for grain, sheepmeat, poultry, and eggs, reflecting the fact that there has been
only limited surplus production. Beef and pigmeat are the exceptions to this downward
trend of marketing fees indicating that significant surplus production has led to lower
market prices (Table 12.3). However, surplus production and imports of beef appeared
mainly in 2005 and the first part of 2006, and are not expected to be a recurrent issue.
Table 12.2. Norway: Administered prices
Product
2004/05(July to June)
2005/06(July to June)
2006/07(July to June)
Change in NOK price
04/05-06/06 05/06-06/07
NOK/t USD/t NOK/t USD/t NOK/t USD/t %
Wholesale level (excluding value added tax)
Food grains
Wheat 2 150 318 2 120 329 2 120 329 –1.40 0.00
Rye 1 990 294 1 960 304 1 960 305 –1.51 0.00
Feed grains
Barley and Oats1 1 720 254 1 730 269 1 730 269 0.58 0.00
Oilseeds 4 280 632 4 290 666 4 330 673 0.23 0.93
Beef, bull2 38 110 5 632 40 130 6 230 40 130 6 235 5.30 0.00
Pigmeat3 27 220 4 022 27 220 4 226 26 220 4 074 0.00 –3.67
Sheepmeat, lamb2 44 000 6 502 44 000 6 831 46 000 7 147 0.00 4.55
Eggs4 13 600 2 010 13 600 2 111 13 830 2 149 0.00 1.69
Poultry 26 030 3 847 25 010 3 883 25 010 3 886 –3.92 0.00
Milk5 3 673 5 780 3 702 575 3 721 578 0.79 0.51
1. The same target price applies to both barley and oats.2. Class O- and better; Carcasses.3. Class E; Carcasses minus head and trotter.4. Class A, weighing more than 53 grams.5. Converted from litres, assuming 1 litre equals 1.032 kilograms of milk.Source: Ministry of Agriculture, Oslo, 2007.
Table 12.3. Norway: Average marketing fees 2005,and per cent change in 2006 and 2007
(NOK per l/kg, 1st of January)
1 January 2005 Jan. 05-Jan. 06 Jan. 06-Jan. 07
NOK per l/kg USD per l/kg % change % change
Grain 0.04 0.01 0 –50
Milk 0.08 0.01 25 20
Beef 0.50 0.08 40 214
Sheepmeat 3.00 0.47 –17 –60
Pigmeat 2.40 0.37 –21 42
Egg 0.80 0.12 0 –25
Chicken 0.45 0.07 –44 –20
Turkey 0.30 0.05 –17 –20
Source: The Agricultural marketing Board/Norwegian Agricultural Authority.
AGRICULTURAL POLICIES IN OECD COUNTRIES: MONITORING AND EVALUATION 2007 – ISBN 978-92-64-02746-6 – © OECD 2007 209
II.12. NORWAY
Milk production quotas have been tradable since 1997 through a system whereby the
NAA purchases and on-sells quota. The government has used this system to reduce
production in response to lower domestic consumption and the WTO limits on subsidised
exports. Over the period 1997-2001, the government on-sold only 36% of the quota it
purchased, withdrawing the other 64% (275 million litres or 15% of production) from the
market. Since 2001, it has not been necessary to withdraw quota from the market and so
all milk quota purchased by the NAA has been on-sold. In fact, quotas were increased by
2% in 2005 and will be increased by an additional 1% in 2007.
Some flexibility in the system was introduced in 2003 with the government restricting
itself to purchasing only 70% of the offered quota (for either on-sale or withdrawal), with
the remainder able to be traded directly between farmers. In 2004, the share that farmers
could sell directly was increased to 60%, but will be brought down again to 50% in 2007.
Sales remain restricted through both systems to existing producers within the same
county, with any surplus held by the NAA offered to new milk producers. In addition, in
2006 the maximum milk quota for individual farms was increased by 9%, from 375 000 to
400 000 litres for cow milk and from 187 500 to 200 000 litres for goat milk. In 2006, 10% of
the quota bought by the state was earmarked for producers of organic milk, and this
amount can be redistributed between counties.
Since July 2003, Tine, the farmer co-operative responsible for raw milk price setting
and market regulation, has separated its functions of collecting and selling raw milk from
that of processing dairy products. Efforts are also being made to ensure that the prices of
processed dairy products charged by Tine are cost-based in an attempt to increase
competition in the milk processing sector.
Following the elimination of the base deficiency payment for milk in 2002, the NOK 1.81/kg
deficiency payment for beef and veal was eliminated in 2003. Deficiency payments remain
only for wool, sheepmeat, goatmeat and goat milk, with payment rates for these products
remaining constant except for goat milk that was increased by 25% in 2005 and by 12% in
2006. No changes were made to the regional deficiency payments except for a small increase
starting in 2007 for cow milk and goat milk (only in some regions) and for eggs.
Support for NOK 2.1 billion (USD 333 million), approximately 18% of budgetary
support, is provided in the form of headage payments under the Production Subsidy to
Livestock Programme for cows, beef cattle, sheep, goats, breeding pigs, pig for slaughter
and laying hens (Table 12.4). Limits are placed on the animals per farm eligible to receive
headage payments. In contrast to the area payment programme, a regional distinction is
only made for laying hens and breeding pigs. In 2005/06, headage payments decreased or
remained unchanged for all animals except sheep and suckler goats up to 100 animals. New
headage payments were introduced in 2005/06 for i) lamb carcasses paying NOK 200 per
animal (USD 31/animal) and for ii) year-round outdoor grazing of sheep NOK 100/animal
(USD 15/animal) for up to 300 animals.
In 2003, the Acreage and Cultural Landscape Programme, worth around NOK 3 billion
(USD 440 million) or one quarter of total budgetary support to farmers, was separated into
two programmes. Under the Cultural Landscape Programme in 2006 farmers received a
uniform payment of NOK 1 870 (USD 277) per hectare for all agricultural land, down from
NOK 2 000 (USD 296) in 2004. To receive funds farmers must meet the compliance
requirements already in place relating to the maintenance of the landscape and the use of
environmentally sound production practices.
AGRICULTURAL POLICIES IN OECD COUNTRIES: MONITORING AND EVALUATION 2007 – ISBN 978-92-64-02746-6 – © OECD 2007210
II.12. NORWAY
The separate Acreage Support Programme also provides area payments to producers,
but focuses on providing payments to less-favoured areas, encouraging certain crops or
providing support to small farmers, to compensate for the maintenance of certain
landscapes which incur extra costs. Consequently payment rates vary by crop, region and
farm size. In 2004/05, an additional payment of NOK 500 (US 74) per hectare was introduced
on grassland over 20 hectares. Starting in 2007 acreage support payments for vegetable and
for fruit and berries, previously limited to 3 hectares, will be expanded to areas up to
6 hectares for vegetables and 4 hectares for fruits and berries, albeit at a lower rate for the
additional acres. Total expenditures in 2006 for the Acreage Support and the Cultural
Landscape Programmes remained stable at NOK 3 billion (USD 470 million).
To better co-ordinate the range of payments being provided for environmental
objectives, a National Environmental Programme was established in 2004. It includes
national agri-environmental goals with the objectives of safeguarding the cultural
landscape, including biodiversity, cultural heritage, public access, and reducing pollution.
Under the Programme all farms are required to establish an environmental plan. Several
payment schemes fall under the Programme, including Acreage Cultural Landscape
Support, payments to extensive grazing, support to organic agriculture, and regional
environmental programmes. In 2006, an additional grazing payment, complementary to
the support received for extensive grazing in outlying fields, was introduced. For 2007, the
funding for the new scheme is NOK 125 million (USD 19.4 million). Concerning support to
organic agriculture, funding in 2007 will be increased by 25 million NOK to 150 million NOK
(USD 23.3 million).
The National Environmental Programme also provides a greater role for the
18 regional administrations. In particular, several national environmental payment
programmes paid out of the Agricultural Development Fund have been abolished
(e.g. payments to administer cooperatives for extensive grazing, payments to mountain
farming and support to changed cultivation practices), with the funding being made
available to the 18 counties for the establishment of new environmental and forestry
measures. Each of the 18 counties must establish an environmental programme based on
regional priorities for achieving the national goals. The main reasons for the devolution of
responsibility are to raise local public awareness of agri-environmental issues, to better
target local needs and to improve the efficiency of delivery. Funding for this programme
was increased from NOK 350 million (USD 54 million) in 2005 to NOK 390 million
(USD 61 million) in 2007.
In 2003, the Norwegian authorities conducted an evaluation of the National Plan for
Pesticide Risk Reduction (1998-2002), which includes a banded, area-based tax on pesticide
use. It revealed that farmers are shifting their pesticide use to less environmentally
harmful varieties. A new Action Plan for Pesticide Risk Reduction (2004-08), built on the
equivalent main elements contained in the previous plan, began on 1 October 2004. It
includes an increase in the number of tax classes from three to five to give a better
differentiation of the health and environment risks and an increase in the pesticide tax
rates by approximately 25% in 2005 with no further changes in later years.
Trade policyExport subsidies are used for the promotion of branded cheese, exports of processed
agricultural products and to dispose of surplus meat, eggs and dairy products. Although
AGRICULTURAL POLICIES IN OECD COUNTRIES: MONITORING AND EVALUATION 2007 – ISBN 978-92-64-02746-6 – © OECD 2007 211
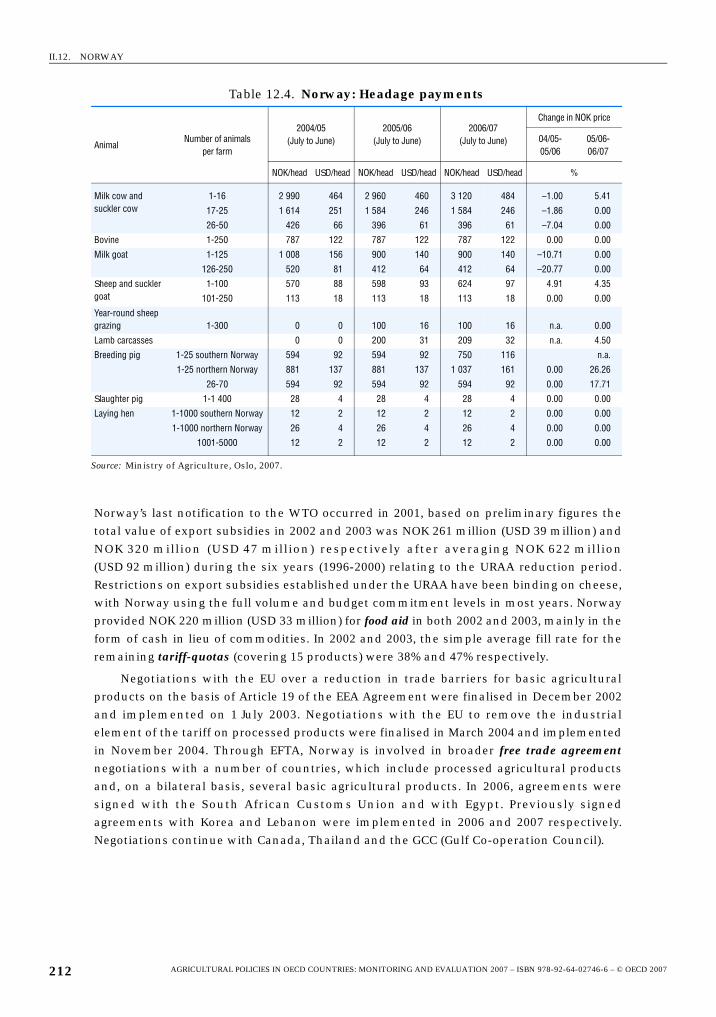
II.12. NORWAY
Norway’s last notification to the WTO occurred in 2001, based on preliminary figures the
total value of export subsidies in 2002 and 2003 was NOK 261 million (USD 39 million) and
NOK 320 million (USD 47 million) respectively after averaging NOK 622 million
(USD 92 million) during the six years (1996-2000) relating to the URAA reduction period.
Restrictions on export subsidies established under the URAA have been binding on cheese,
with Norway using the full volume and budget commitment levels in most years. Norway
provided NOK 220 million (USD 33 million) for food aid in both 2002 and 2003, mainly in the
form of cash in lieu of commodities. In 2002 and 2003, the simple average fill rate for the
remaining tariff-quotas (covering 15 products) were 38% and 47% respectively.
Negotiations with the EU over a reduction in trade barriers for basic agricultural
products on the basis of Article 19 of the EEA Agreement were finalised in December 2002
and implemented on 1 July 2003. Negotiations with the EU to remove the industrial
element of the tariff on processed products were finalised in March 2004 and implemented
in November 2004. Through EFTA, Norway is involved in broader free trade agreementnegotiations with a number of countries, which include processed agricultural products
and, on a bilateral basis, several basic agricultural products. In 2006, agreements were
signed with the South African Customs Union and with Egypt. Previously signed
agreements with Korea and Lebanon were implemented in 2006 and 2007 respectively.
Negotiations continue with Canada, Thailand and the GCC (Gulf Co-operation Council).
Table 12.4. Norway: Headage payments
AnimalNumber of animals
per farm
2004/05(July to June)
2005/06(July to June)
2006/07(July to June)
Change in NOK price
04/05-05/06
05/06-06/07
NOK/head USD/head NOK/head USD/head NOK/head USD/head %
Milk cow and suckler cow
1-16 2 990 464 2 960 460 3 120 484 –1.00 5.41
17-25 1 614 251 1 584 246 1 584 246 –1.86 0.00
26-50 426 66 396 61 396 61 –7.04 0.00
Bovine 1-250 787 122 787 122 787 122 0.00 0.00
Milk goat 1-125 1 008 156 900 140 900 140 –10.71 0.00
126-250 520 81 412 64 412 64 –20.77 0.00
Sheep and suckler goat
1-100 570 88 598 93 624 97 4.91 4.35
101-250 113 18 113 18 113 18 0.00 0.00
Year-round sheep grazing 1-300 0 0 100 16 100 16 n.a. 0.00
Lamb carcasses 0 0 200 31 209 32 n.a. 4.50
Breeding pig 1-25 southern Norway 594 92 594 92 750 116 n.a.
1-25 northern Norway 881 137 881 137 1 037 161 0.00 26.26
26-70 594 92 594 92 594 92 0.00 17.71
Slaughter pig 1-1 400 28 4 28 4 28 4 0.00 0.00
Laying hen 1-1000 southern Norway 12 2 12 2 12 2 0.00 0.00
1-1000 northern Norway 26 4 26 4 26 4 0.00 0.00
1001-5000 12 2 12 2 12 2 0.00 0.00
Source: Ministry of Agriculture, Oslo, 2007.
AGRICULTURAL POLICIES IN OECD COUNTRIES: MONITORING AND EVALUATION 2007 – ISBN 978-92-64-02746-6 – © OECD 2007212
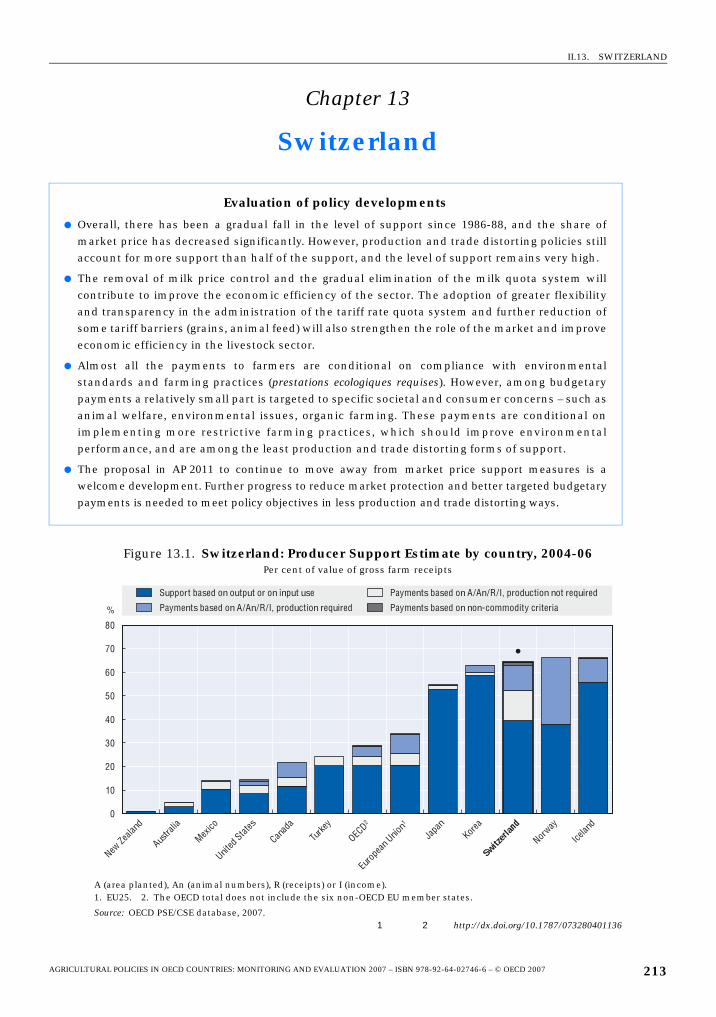
II.13. SWITZERLAND
Chapter 13
Switzerland
Evaluation of policy developments
● Overall, there has been a gradual fall in the level of support since 1986-88, and the share ofmarket price has decreased significantly. However, production and trade distorting policies stillaccount for more support than half of the support, and the level of support remains very high.
● The removal of milk price control and the gradual elimination of the milk quota system willcontribute to improve the economic efficiency of the sector. The adoption of greater flexibilityand transparency in the administration of the tariff rate quota system and further reduction ofsome tariff barriers (grains, animal feed) will also strengthen the role of the market and improveeconomic efficiency in the livestock sector.
● Almost all the payments to farmers are conditional on compliance with environmentalstandards and farming practices (prestations ecologiques requises). However, among budgetarypayments a relatively small part is targeted to specific societal and consumer concerns – such asanimal welfare, environmental issues, organic farming. These payments are conditional onimplementing more restrictive farming practices, which should improve environmentalperformance, and are among the least production and trade distorting forms of support.
● The proposal in AP 2011 to continue to move away from market price support measures is awelcome development. Further progress to reduce market protection and better targeted budgetarypayments is needed to meet policy objectives in less production and trade distorting ways.
Figure 13.1. Switzerland: Producer Support Estimate by country, 2004-06Per cent of value of gross farm receipts
A (area planted), An (animal numbers), R (receipts) or I (income).1. EU25. 2. The OECD total does not include the six non-OECD EU member states.
Source: OECD PSE/CSE database, 2007.1 2 http://dx.doi.org/10.1787/073280401136
0
10
20
30
40
50
60
70
80
New Ze
aland
Austra
lia
Mexico
United
States
Canad
a
Turke
y
OECD2
Euro
pean
Unio
n1
Japa
nKor
ea
Switzer
land
Norway
Icelan
d
%
Support based on output or on input use
Payments based on A/An/R/I, production required
Payments based on A/An/R/I, production not required
Payments based on non-commodity criteria
AGRICULTURAL POLICIES IN OECD COUNTRIES: MONITORING AND EVALUATION 2007 – ISBN 978-92-64-02746-6 – © OECD 2007 213
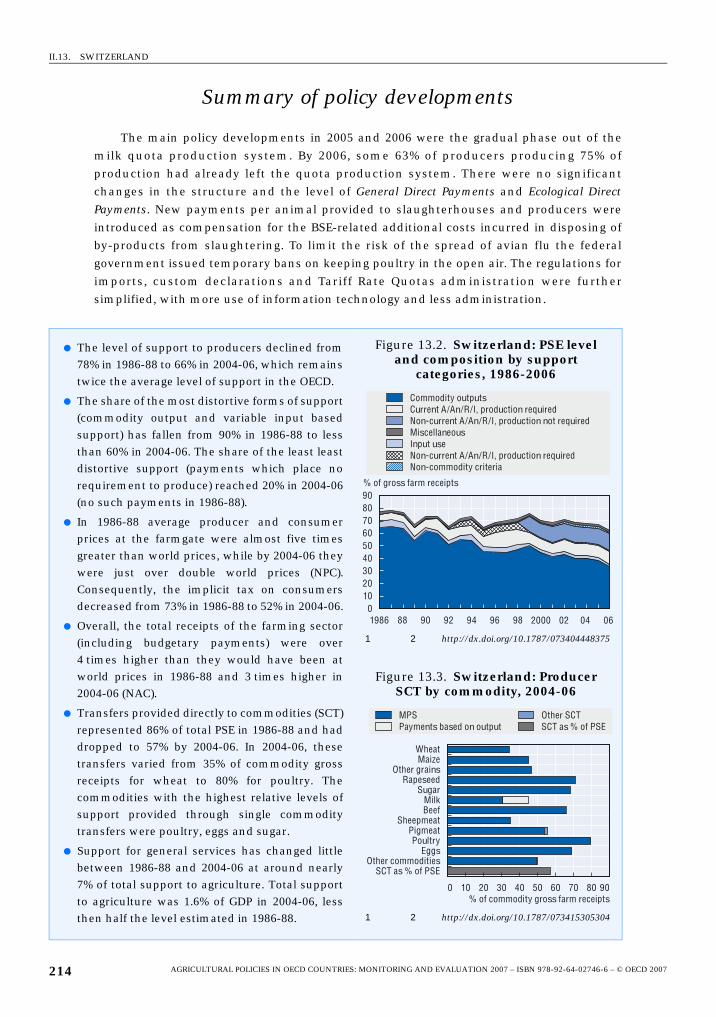
II.13. SWITZERLAND
Summary of policy developments
The main policy developments in 2005 and 2006 were the gradual phase out of the
milk quota production system. By 2006, some 63% of producers producing 75% of
production had already left the quota production system. There were no significant
changes in the structure and the level of General Direct Payments and Ecological Direct
Payments. New payments per animal provided to slaughterhouses and producers were
introduced as compensation for the BSE-related additional costs incurred in disposing of
by-products from slaughtering. To limit the risk of the spread of avian flu the federal
government issued temporary bans on keeping poultry in the open air. The regulations for
imports, custom declarations and Tariff Rate Quotas administration were further
simplified, with more use of information technology and less administration.
● The level of support to producers declined from78% in 1986-88 to 66% in 2004-06, which remainstwice the average level of support in the OECD.
● The share of the most distortive forms of support(commodity output and variable input basedsupport) has fallen from 90% in 1986-88 to lessthan 60% in 2004-06. The share of the least leastdistortive support (payments which place norequirement to produce) reached 20% in 2004-06(no such payments in 1986-88).
● In 1986-88 average producer and consumerprices at the farmgate were almost five timesgreater than world prices, while by 2004-06 theywere just over double world prices (NPC).Consequently, the implicit tax on consumersdecreased from 73% in 1986-88 to 52% in 2004-06.
● Overall, the total receipts of the farming sector(including budgetary payments) were over4 times higher than they would have been atworld prices in 1986-88 and 3 times higher in2004-06 (NAC).
● Transfers provided directly to commodities (SCT)represented 86% of total PSE in 1986-88 and haddropped to 57% by 2004-06. In 2004-06, thesetransfers varied from 35% of commodity grossreceipts for wheat to 80% for poultry. Thecommodities with the highest relative levels ofsupport provided through single commoditytransfers were poultry, eggs and sugar.
● Support for general services has changed littlebetween 1986-88 and 2004-06 at around nearly7% of total support to agriculture. Total supportto agriculture was 1.6% of GDP in 2004-06, lessthen half the level estimated in 1986-88.
Figure 13.2. Switzerland: PSE level and composition by support
categories, 1986-2006
1 2 http://dx.doi.org/10.1787/073404448375
Figure 13.3. Switzerland: Producer SCT by commodity, 2004-06
1 2 http://dx.doi.org/10.1787/073415305304
% of gross farm receipts
Commodity outputsCurrent A/An/R/I, production requiredNon-current A/An/R/I, production not requiredMiscellaneousInput useNon-current A/An/R/I, production requiredNon-commodity criteria
0102030405060708090
1986 88 90 92 94 96 98 2000 02 04 06
MPS Payments based on output
Other SCTSCT as % of PSE
WheatMaize
Other grainsRapeseed
SugarMilkBeef
SheepmeatPigmeatPoultry
EggsOther commodities
SCT as % of PSE
0 10 20 30 40 50 60 70 80 90% of commodity gross farm receipts
AGRICULTURAL POLICIES IN OECD COUNTRIES: MONITORING AND EVALUATION 2007 – ISBN 978-92-64-02746-6 – © OECD 2007214
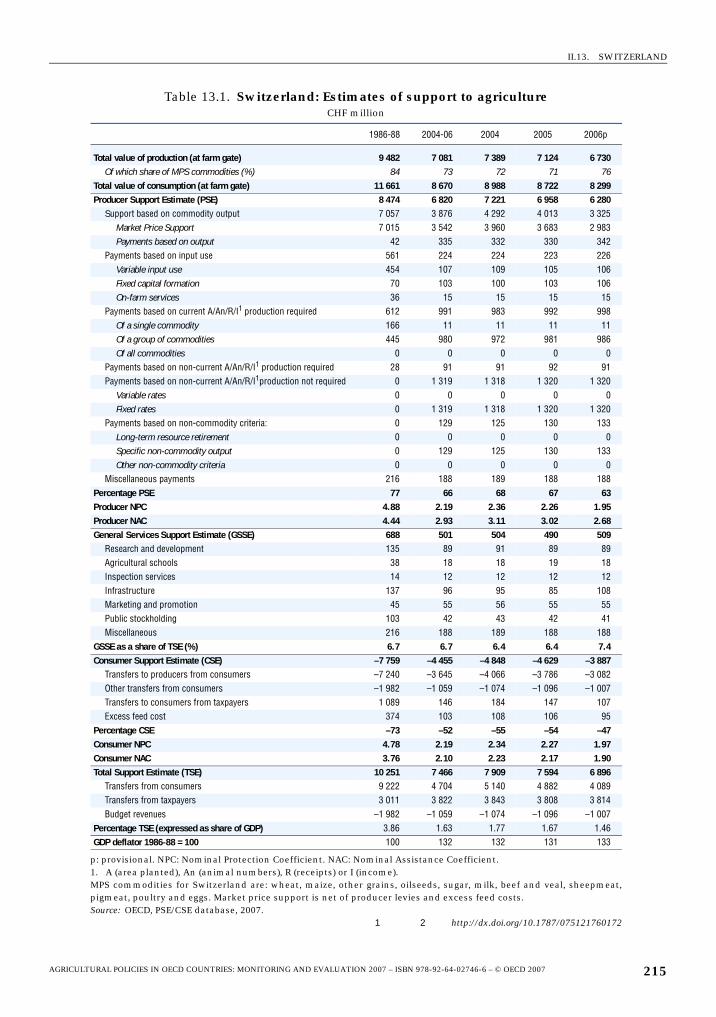
II.13. SWITZERLAND
Table 13.1. Switzerland: Estimates of support to agricultureCHF million
1986-88 2004-06 2004 2005 2006p
Total value of production (at farm gate) 9 482 7 081 7 389 7 124 6 730Of which share of MPS commodities (%) 84 73 72 71 76
Total value of consumption (at farm gate) 11 661 8 670 8 988 8 722 8 299Producer Support Estimate (PSE) 8 474 6 820 7 221 6 958 6 280
Support based on commodity output 7 057 3 876 4 292 4 013 3 325Market Price Support 7 015 3 542 3 960 3 683 2 983Payments based on output 42 335 332 330 342
Payments based on input use 561 224 224 223 226Variable input use 454 107 109 105 106Fixed capital formation 70 103 100 103 106On-farm services 36 15 15 15 15
Payments based on current A/An/R/I1 production required 612 991 983 992 998Of a single commodity 166 11 11 11 11Of a group of commodities 445 980 972 981 986Of all commodities 0 0 0 0 0
Payments based on non-current A/An/R/I1 production required 28 91 91 92 91Payments based on non-current A/An/R/I1production not required 0 1 319 1 318 1 320 1 320
Variable rates 0 0 0 0 0Fixed rates 0 1 319 1 318 1 320 1 320
Payments based on non-commodity criteria: 0 129 125 130 133Long-term resource retirement 0 0 0 0 0Specific non-commodity output 0 129 125 130 133Other non-commodity criteria 0 0 0 0 0
Miscellaneous payments 216 188 189 188 188Percentage PSE 77 66 68 67 63Producer NPC 4.88 2.19 2.36 2.26 1.95Producer NAC 4.44 2.93 3.11 3.02 2.68General Services Support Estimate (GSSE) 688 501 504 490 509
Research and development 135 89 91 89 89Agricultural schools 38 18 18 19 18Inspection services 14 12 12 12 12Infrastructure 137 96 95 85 108Marketing and promotion 45 55 56 55 55Public stockholding 103 42 43 42 41Miscellaneous 216 188 189 188 188
GSSE as a share of TSE (%) 6.7 6.7 6.4 6.4 7.4Consumer Support Estimate (CSE) –7 759 –4 455 –4 848 –4 629 –3 887
Transfers to producers from consumers –7 240 –3 645 –4 066 –3 786 –3 082Other transfers from consumers –1 982 –1 059 –1 074 –1 096 –1 007Transfers to consumers from taxpayers 1 089 146 184 147 107Excess feed cost 374 103 108 106 95
Percentage CSE –73 –52 –55 –54 –47Consumer NPC 4.78 2.19 2.34 2.27 1.97Consumer NAC 3.76 2.10 2.23 2.17 1.90Total Support Estimate (TSE) 10 251 7 466 7 909 7 594 6 896
Transfers from consumers 9 222 4 704 5 140 4 882 4 089Transfers from taxpayers 3 011 3 822 3 843 3 808 3 814Budget revenues –1 982 –1 059 –1 074 –1 096 –1 007
Percentage TSE (expressed as share of GDP) 3.86 1.63 1.77 1.67 1.46GDP deflator 1986-88 = 100 100 132 132 131 133
p: provisional. NPC: Nominal Protection Coefficient. NAC: Nominal Assistance Coefficient.1. A (area planted), An (animal numbers), R (receipts) or I (income).MPS commodities for Switzerland are: wheat, maize, other grains, oilseeds, sugar, milk, beef and veal, sheepmeat,pigmeat, poultry and eggs. Market price support is net of producer levies and excess feed costs.Source: OECD, PSE/CSE database, 2007.
1 2 http://dx.doi.org/10.1787/075121760172
AGRICULTURAL POLICIES IN OECD COUNTRIES: MONITORING AND EVALUATION 2007 – ISBN 978-92-64-02746-6 – © OECD 2007 215
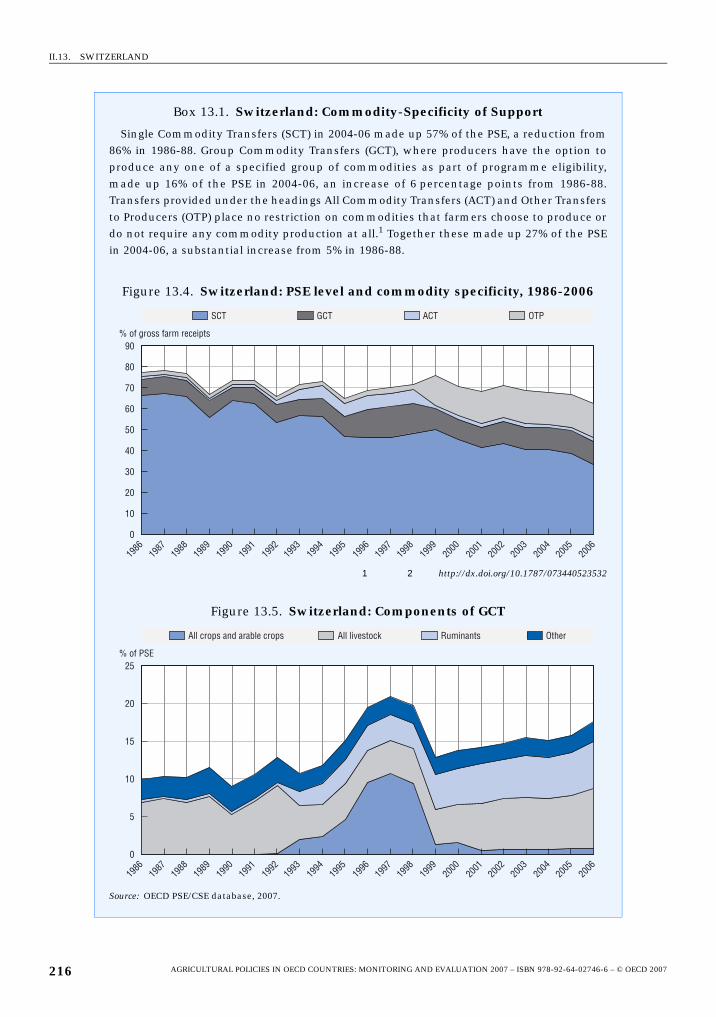
II.13. SWITZERLAND
Box 13.1. Switzerland: Commodity-Specificity of Support
Single Commodity Transfers (SCT) in 2004-06 made up 57% of the PSE, a reduction from86% in 1986-88. Group Commodity Transfers (GCT), where producers have the option toproduce any one of a specified group of commodities as part of programme eligibility,made up 16% of the PSE in 2004-06, an increase of 6 percentage points from 1986-88.Transfers provided under the headings All Commodity Transfers (ACT) and Other Transfersto Producers (OTP) place no restriction on commodities that farmers choose to produce ordo not require any commodity production at all.1 Together these made up 27% of the PSEin 2004-06, a substantial increase from 5% in 1986-88.
Figure 13.4. Switzerland: PSE level and commodity specificity, 1986-2006
1 2 http://dx.doi.org/10.1787/073440523532
Figure 13.5. Switzerland: Components of GCT
Source: OECD PSE/CSE database, 2007.
��� ��� ��� ���
�
�� �
��
��
�� �
���
����
����
����
����
����
����
���
���
����
�
��
��
��
��
��
��
�
�
�
�
�
�
���������������������� �
�""�"�#�� ��$�""��������%(����*"������� � &��+,��%�% �
��
�� �
��
��
�� �
���
����
����
����
����
����
����
���
���
����
�
��
��
��
��
��
��
�
��
�
�
�������)
AGRICULTURAL POLICIES IN OECD COUNTRIES: MONITORING AND EVALUATION 2007 – ISBN 978-92-64-02746-6 – © OECD 2007216
II.13. SWITZERLAND
Box 13.1. Switzerland: Commodity-Specificity of Support (cont.)
Support in Switzerland has become less commodity specific over the period, as thepayments to group of commodities or all commodities were introduced (or increased) tocompensate for the reduction of market price support. Over the whole period an importantpart of the GCT was provided to all categories of livestock (cattle, sheep, pigs and poultry)raised in difficult conditions (Livestock in mountain areas, 1986-98; livestock in difficultconditions, 1999-2006) and a general payment to ruminants (beef, sheep and goats, horses,lamas, alpagas, etc.) introduced in 1993. Payments for animal welfare (Payments for Animalhousing systems, from 1996; and Payments for keeping animal outdoors, from 1999) alsocontributed to increase payments within the group all livestock. In the period 1993-98important transfers were provided to groups all commodities and arable commodities,which led to an increase in the share of GCT in total PSE. From 1999 these payments (aswell as part of payments to livestock groups) were replaced by by more general area andfarm payments which contributed to the relative increase of OTP in the overall level ofsupport.
1. The definition of the categories SCT, GCT, ACT and OTP are provided in the Chapter I.3 of this reportincluding an annex with the list of groups used in specific countries in the period 1986-2006.
AGRICULTURAL POLICIES IN OECD COUNTRIES: MONITORING AND EVALUATION 2007 – ISBN 978-92-64-02746-6 – © OECD 2007 217
II.13. SWITZERLAND
Description of policy developments
Main policy instrumentsThe AP 2007 agricultural policy reform programme provides the basic legislative
framework governing agricultural policy for the period 2004-07. Border measures and
budgetary payments remain the main policy instruments used to support agriculture in
Switzerland. Production quotas and deficiency payments have been further reduced since
2004. All state guarantees for prices and sales were abolished and budgetary payments are
subject to environmental and other cross-compliance requirements. Import measures
consist of relatively high tariffs for most products and a system of tariff rate quotas (TRQs)
to support prices on the domestic market. For some products, such as feed grains and
animal feed, imports are subject to custom duties based on threshold prices. The federal
Parliament is presently debating the legislative changes proposed for AP 2011 –
Agricultural policy reform programme to be implemented in 2008-11 (Box 13.2).
There are two main categories of direct payments. General Direct Payments are mainly
granted in the form of general area and headage payments, and to a lesser extent also
includes payments to farmers operating in less-favoured conditions. General Direct
Payments are based on the condition that farmers comply with a set of environmental
farm management practice requirements (prestations écologiques requises – PER). Ecological
Direct Payments are mainly granted in the form of area and headage payments to farmers
who voluntarily apply stricter farming practices than those required by regulations and the
farm management practice requirements (PER).
Box 13.2. Switzerland: Agricultural Policy 2011
Since the introduction of the new Agriculture Act in 1999, legislative changes andfunding for Swiss agriculture is granted by Parliament for a 4-year period.
The proposals of the Swiss Federal Council presently being discussed in Parliamentpursue three objectives. Firstly, the potential for lowering costs to consumers andtaxpayers in the food sector. At the same time, this should make Swiss agricultural andfood sector more competitive and less vulnerable to the impact of future tradeliberalization measures. Secondly, the reform steps should be implemented at a pacewhich is socially sustainable. And finally, the progress achieved over the past few yearswith regard to ecological aspects should be consolidated and agriculture should beencouraged to make further improvements. The key feature of Agricultural Policy 2011 is afurther reduction of 50% in market price support with the savings thus made being usedfor direct payments. All remaining export subsidies for agricultural commodities are to beeliminated by 2009, and customs duties on imported fodder and cereals are to be reduced.It is widely accepted that farmers carry out tasks for the benefit of the whole population,helping to ensure sufficient food supplies, preserving culturally valuable landscape orsafeguarding natural resources, and contributing to settlement in remote andeconomically disadvantaged areas. The provision of these services involves costs tofarmers which are remunerated by way of public payments.
The modifications planned for Agricultural Policy 2011 will be finalized during thesummer or autumn 2007, and implementation measures are to be adopted in late 2007.
AGRICULTURAL POLICIES IN OECD COUNTRIES: MONITORING AND EVALUATION 2007 – ISBN 978-92-64-02746-6 – © OECD 2007218
II.13. SWITZERLAND
Domestic policyMilk quotas are to be progressively abolished by 2009. From May 2009, the milk quota
system will be abolished for all dairy farmers, although until May 2012 they will only be
able to sell milk under the terms of contracts drawn up with buyers. As from May 2006,
branch organisations or dairy farmers’ associations with a significant regional processor
can decide production quantities independently. Dairy farmers who are members of such
an organisation can be exempted from the state quota system. In 2006, 9 producers’
organisations and 18 producer and processor organisations decided to leave the state milk
quota system ahead of schedule. This represents 63% of milk producers and 75% of milk
production.
As in previous years, price support expenditures (price supplements, domestic price
support and export refunds) for dairy products were reduced in 2005 and 2006 by 5.8% and
8.8% respectively to reach CHF 393 million (USD 313 million) in 2006. Payments for the
price supplement paid to processors for milk transformed into cheese and the non-silage
use premium for milk increased slightly in 2006, while domestic market support for butter
and export subsidies for cheeses and other milk products were further reduced. In
January 2005, new payments per head of animal provided to slaughterhouses and producers
were introduced as compensation for the BSE-related additional costs incurred in
disposing of by-products from slaughtering. The payment rates for slaughterhouses are
CHF 25 (USD 19) for bovine animals and CHF 4.50 (USD 3.50) for sheep, goats and swine.
The rate for producers is CHF 25 (USD 19) per calf as compensation for cost incurred
because of earmarking, reporting etc. In 2006, these payments were maintained at the
same level.
While the structure of the programmes and the eligibility conditions applied within
the General Direct Payments and the Ecological Direct Payments categories have remained
unchanged under the AP 2007 (implemented from 2004), the payment rates for some
programmes have increased. Outlays to farmers for these two categories remained stable
in 2005 and 2006 (Table 13.2). About 80% of the total is granted under General DirectPayments. Area payments per hectare of arable land and permanent cropland is the most
important single category and accounts for 66% of general direct payments. The other
important category of general payments is the payment per livestock unit (LU) for
roughage-consuming animals. For beef cattle, buffalos, horses, sheep and goats for milk
production the payment per LU was set at CHF 900, while for other sheep and goats, lamas,
alpacas and deers the payment was set at CHF 400 per LU. The upper limit to qualify for
payments for holding livestock under “difficult conditions” in mountain areas is set at
20 LU. Headage payments for roughage-consuming animals and animals raised in difficult
conditions together account for 29% of general direct payments. The remaining 5% of
General Direct Payments are paid to cultivate the steep slopes in mountain regions.
Ecological Direct Payments increased overall by less than 1% to CHF 484 million
(USD 385 million) in 2006. About 40% of total are provided to improve animal welfare and
these payments also increased the most in 2006. Payments for animal friendly husbandry
systems and headage payments for animals kept outdoors increased by 2.2% and 4.7%
respectively (Table 13.2). Another 26% of total ecological payments are granted for
“ecological compensation”: payments for extensive meadows, litter areas, hedges, floral
and rotation fallow, extensive area strips and high-stem fruit trees. The level of these
payments remained unchanged compared with previous years, while the remaining
AGRICULTURAL POLICIES IN OECD COUNTRIES: MONITORING AND EVALUATION 2007 – ISBN 978-92-64-02746-6 – © OECD 2007 219
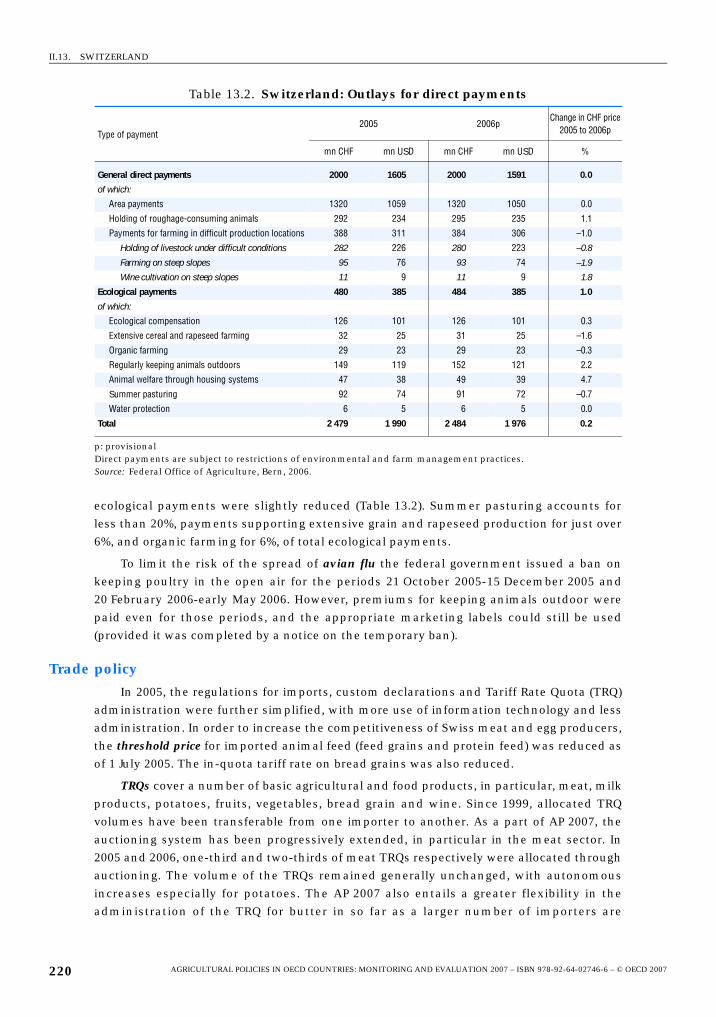
II.13. SWITZERLAND
ecological payments were slightly reduced (Table 13.2). Summer pasturing accounts for
less than 20%, payments supporting extensive grain and rapeseed production for just over
6%, and organic farming for 6%, of total ecological payments.
To limit the risk of the spread of avian flu the federal government issued a ban on
keeping poultry in the open air for the periods 21 October 2005-15 December 2005 and
20 February 2006-early May 2006. However, premiums for keeping animals outdoor were
paid even for those periods, and the appropriate marketing labels could still be used
(provided it was completed by a notice on the temporary ban).
Trade policyIn 2005, the regulations for imports, custom declarations and Tariff Rate Quota (TRQ)
administration were further simplified, with more use of information technology and less
administration. In order to increase the competitiveness of Swiss meat and egg producers,
the threshold price for imported animal feed (feed grains and protein feed) was reduced as
of 1 July 2005. The in-quota tariff rate on bread grains was also reduced.
TRQs cover a number of basic agricultural and food products, in particular, meat, milk
products, potatoes, fruits, vegetables, bread grain and wine. Since 1999, allocated TRQ
volumes have been transferable from one importer to another. As a part of AP 2007, the
auctioning system has been progressively extended, in particular in the meat sector. In
2005 and 2006, one-third and two-thirds of meat TRQs respectively were allocated through
auctioning. The volume of the TRQs remained generally unchanged, with autonomous
increases especially for potatoes. The AP 2007 also entails a greater flexibility in the
administration of the TRQ for butter in so far as a larger number of importers are
Table 13.2. Switzerland: Outlays for direct payments
Type of payment2005 2006p
Change in CHF price2005 to 2006p
mn CHF mn USD mn CHF mn USD %
General direct payments 2000 1605 2000 1591 0.0
of which:
Area payments 1320 1059 1320 1050 0.0
Holding of roughage-consuming animals 292 234 295 235 1.1
Payments for farming in difficult production locations 388 311 384 306 –1.0
Holding of livestock under difficult conditions 282 226 280 223 –0.8
Farming on steep slopes 95 76 93 74 –1.9
Wine cultivation on steep slopes 11 9 11 9 1.8
Ecological payments 480 385 484 385 1.0
of which:
Ecological compensation 126 101 126 101 0.3
Extensive cereal and rapeseed farming 32 25 31 25 –1.6
Organic farming 29 23 29 23 –0.3
Regularly keeping animals outdoors 149 119 152 121 2.2
Animal welfare through housing systems 47 38 49 39 4.7
Summer pasturing 92 74 91 72 –0.7
Water protection 6 5 6 5 0.0
Total 2 479 1 990 2 484 1 976 0.2
p: provisionalDirect payments are subject to restrictions of environmental and farm management practices.Source: Federal Office of Agriculture, Bern, 2006.
AGRICULTURAL POLICIES IN OECD COUNTRIES: MONITORING AND EVALUATION 2007 – ISBN 978-92-64-02746-6 – © OECD 2007220
II.13. SWITZERLAND
authorised to import and the TRQs will not longer be reserved for the downstream and
upstream sector. The special safeguard closes were not invoked during 2005 and 2006.
Export subsidies are applied mainly to dairy products (around 85% of total export
subsidies in 2005 and 2006), the remaining 15% were essentially for live animal exports,
and to a lesser extent for fruits and potatoes. In accordance with the bilateral tradeagreement with the EU which became effective on 1 May 2002, tariffs for a number of
agricultural products, including cheese, certain other dairy products, and fruits and
vegetables, as well as export subsidies for cheese, will be eliminated by 2007. In fact, export
subsidies were no longer applied to cheese exports to the EU as from 2005. Preferential
tariff rates are applied to imports from developing countries. In the context of the initiative
of the Swiss government to grant zero tariffs on all products from least developed countries
by 2007, a further 50% reduction to that implemented in 2002 has been effective as from
April 2004. The third step towards full tariff elimination in favour of the least developed
countries will be implemented in 2007 with the exception of sugar and broken rice for
feeding purposes, both of which will have a longer dismantling period up to 2009.
AGRICULTURAL POLICIES IN OECD COUNTRIES: MONITORING AND EVALUATION 2007 – ISBN 978-92-64-02746-6 – © OECD 2007 221
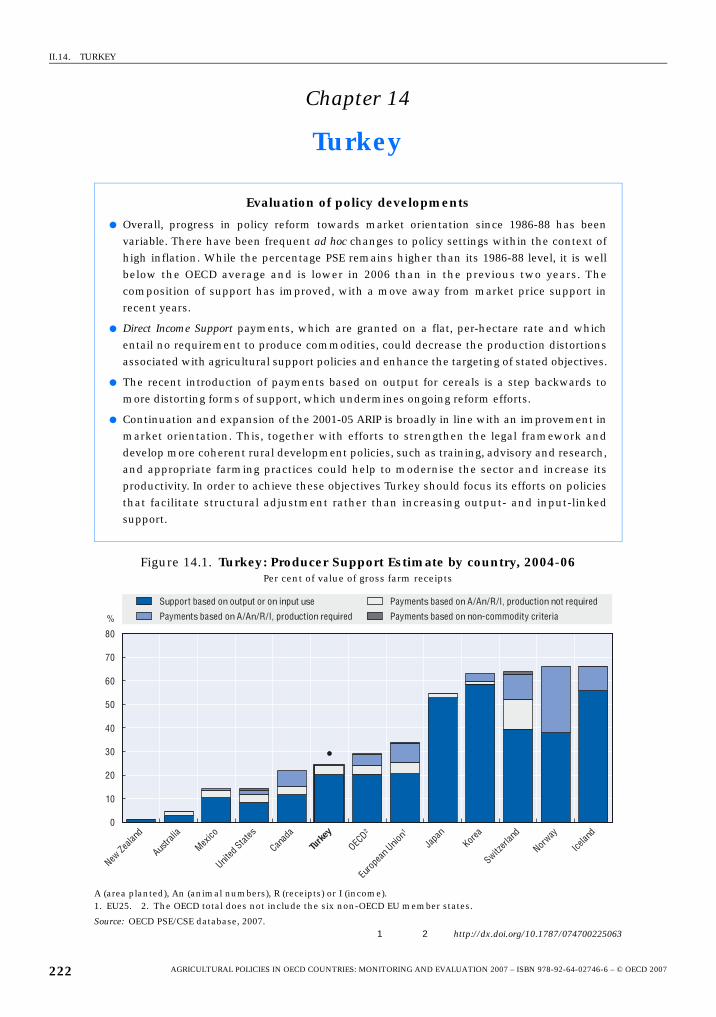
II.14. TURKEY
Chapter 14
Turkey
Evaluation of policy developments
● Overall, progress in policy reform towards market orientation since 1986-88 has beenvariable. There have been frequent ad hoc changes to policy settings within the context ofhigh inflation. While the percentage PSE remains higher than its 1986-88 level, it is wellbelow the OECD average and is lower in 2006 than in the previous two years. Thecomposition of support has improved, with a move away from market price support inrecent years.
● Direct Income Support payments, which are granted on a flat, per-hectare rate and whichentail no requirement to produce commodities, could decrease the production distortionsassociated with agricultural support policies and enhance the targeting of stated objectives.
● The recent introduction of payments based on output for cereals is a step backwards tomore distorting forms of support, which undermines ongoing reform efforts.
● Continuation and expansion of the 2001-05 ARIP is broadly in line with an improvement inmarket orientation. This, together with efforts to strengthen the legal framework anddevelop more coherent rural development policies, such as training, advisory and research,and appropriate farming practices could help to modernise the sector and increase itsproductivity. In order to achieve these objectives Turkey should focus its efforts on policiesthat facilitate structural adjustment rather than increasing output- and input-linkedsupport.
Figure 14.1. Turkey: Producer Support Estimate by country, 2004-06Per cent of value of gross farm receipts
A (area planted), An (animal numbers), R (receipts) or I (income).1. EU25. 2. The OECD total does not include the six non-OECD EU member states.
Source: OECD PSE/CSE database, 2007.1 2 http://dx.doi.org/10.1787/074700225063
0
10
20
30
40
50
60
70
80
New Ze
aland
Austra
lia
Mexico
United
States
Canad
a
Turke
y
OECD2
Euro
pean
Unio
n1
Japa
nKor
ea
Switzerl
and
Norway
Icelan
d
%
Support based on output or on input use
Payments based on A/An/R/I, production required
Payments based on A/An/R/I, production not required
Payments based on non-commodity criteria
AGRICULTURAL POLICIES IN OECD COUNTRIES: MONITORING AND EVALUATION 2007 – ISBN 978-92-64-02746-6 – © OECD 2007222
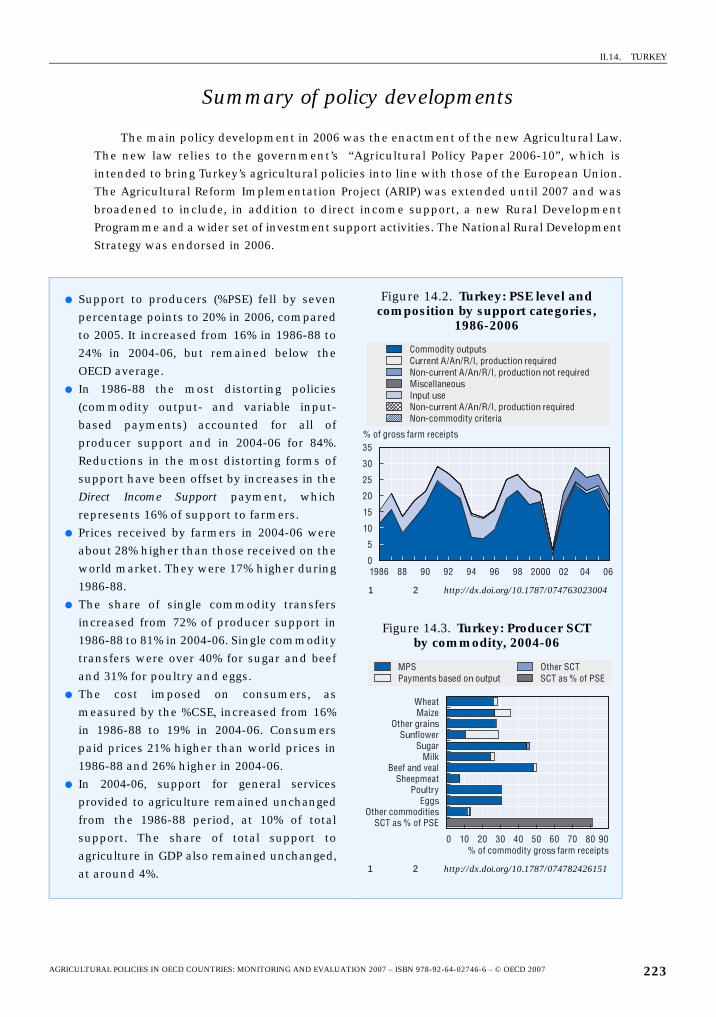
II.14. TURKEY
Summary of policy developments
The main policy development in 2006 was the enactment of the new Agricultural Law.
The new law relies to the government’s “Agricultural Policy Paper 2006-10”, which is
intended to bring Turkey’s agricultural policies into line with those of the European Union.
The Agricultural Reform Implementation Project (ARIP) was extended until 2007 and was
broadened to include, in addition to direct income support, a new Rural Development
Programme and a wider set of investment support activities. The National Rural Development
Strategy was endorsed in 2006.
● Support to producers (%PSE) fell by seven
percentage points to 20% in 2006, compared
to 2005. It increased from 16% in 1986-88 to
24% in 2004-06, but remained below the
OECD average.
● In 1986-88 the most distorting policies
(commodity output- and variable input-
based payments) accounted for all of
producer support and in 2004-06 for 84%.
Reductions in the most distorting forms of
support have been offset by increases in the
Direct Income Support payment, which
represents 16% of support to farmers.
● Prices received by farmers in 2004-06 were
about 28% higher than those received on the
world market. They were 17% higher during
1986-88.
● The share of single commodity transfers
increased from 72% of producer support in
1986-88 to 81% in 2004-06. Single commodity
transfers were over 40% for sugar and beef
and 31% for poultry and eggs.
● The cost imposed on consumers, as
measured by the %CSE, increased from 16%
in 1986-88 to 19% in 2004-06. Consumers
paid prices 21% higher than world prices in
1986-88 and 26% higher in 2004-06.
● In 2004-06, support for general services
provided to agriculture remained unchanged
from the 1986-88 period, at 10% of total
support. The share of total support to
agriculture in GDP also remained unchanged,
at around 4%.
Figure 14.2. Turkey: PSE level and composition by support categories,
1986-2006
1 2 http://dx.doi.org/10.1787/074763023004
Figure 14.3. Turkey: Producer SCT by commodity, 2004-06
1 2 http://dx.doi.org/10.1787/074782426151
% of gross farm receipts
Commodity outputsCurrent A/An/R/I, production requiredNon-current A/An/R/I, production not requiredMiscellaneousInput useNon-current A/An/R/I, production requiredNon-commodity criteria
0
5
10
15
20
25
30
35
1986 88 90 92 94 96 98 2000 02 04 06
MPS Payments based on output
Other SCTSCT as % of PSE
SCT as % of PSE
WheatMaize
Other grainsSunflower
SugarMilk
Beef and vealSheepmeat
PoultryEggs
Other commodities
0 10 20 30 40 50 60 70 80 90% of commodity gross farm receipts
AGRICULTURAL POLICIES IN OECD COUNTRIES: MONITORING AND EVALUATION 2007 – ISBN 978-92-64-02746-6 – © OECD 2007 223
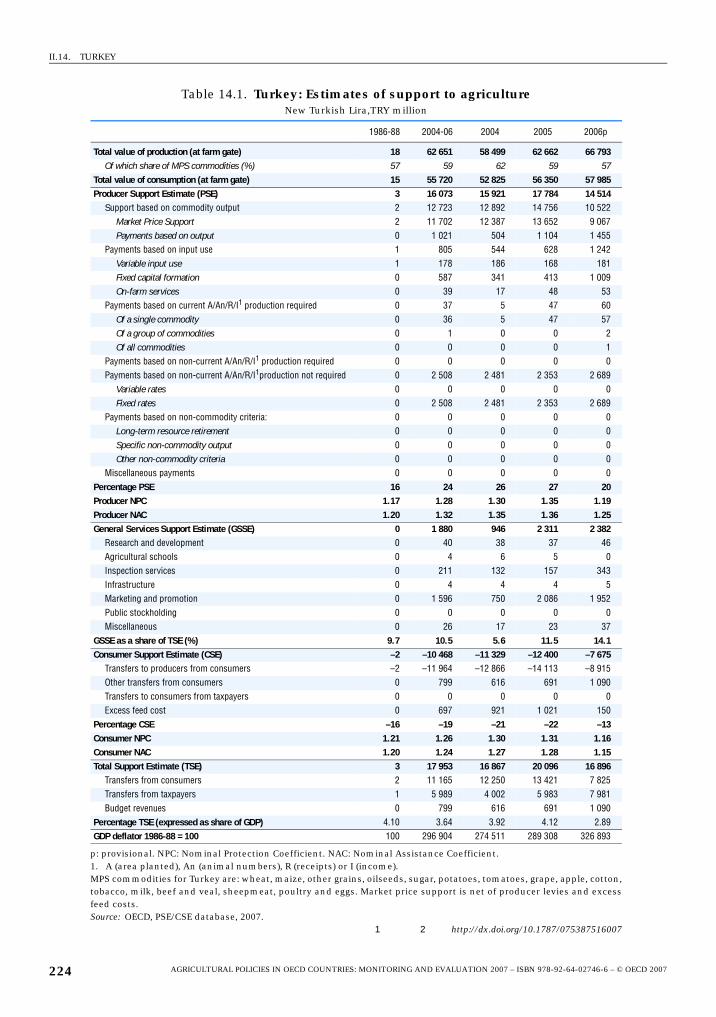
II.14. TURKEY
Table 14.1. Turkey: Estimates of support to agricultureNew Turkish Lira,TRY million
1986-88 2004-06 2004 2005 2006p
Total value of production (at farm gate) 18 62 651 58 499 62 662 66 793Of which share of MPS commodities (%) 57 59 62 59 57
Total value of consumption (at farm gate) 15 55 720 52 825 56 350 57 985Producer Support Estimate (PSE) 3 16 073 15 921 17 784 14 514
Support based on commodity output 2 12 723 12 892 14 756 10 522Market Price Support 2 11 702 12 387 13 652 9 067Payments based on output 0 1 021 504 1 104 1 455
Payments based on input use 1 805 544 628 1 242Variable input use 1 178 186 168 181Fixed capital formation 0 587 341 413 1 009On-farm services 0 39 17 48 53
Payments based on current A/An/R/I1 production required 0 37 5 47 60Of a single commodity 0 36 5 47 57Of a group of commodities 0 1 0 0 2Of all commodities 0 0 0 0 1
Payments based on non-current A/An/R/I1 production required 0 0 0 0 0Payments based on non-current A/An/R/I1production not required 0 2 508 2 481 2 353 2 689
Variable rates 0 0 0 0 0Fixed rates 0 2 508 2 481 2 353 2 689
Payments based on non-commodity criteria: 0 0 0 0 0Long-term resource retirement 0 0 0 0 0Specific non-commodity output 0 0 0 0 0Other non-commodity criteria 0 0 0 0 0
Miscellaneous payments 0 0 0 0 0Percentage PSE 16 24 26 27 20Producer NPC 1.17 1.28 1.30 1.35 1.19Producer NAC 1.20 1.32 1.35 1.36 1.25General Services Support Estimate (GSSE) 0 1 880 946 2 311 2 382
Research and development 0 40 38 37 46Agricultural schools 0 4 6 5 0Inspection services 0 211 132 157 343Infrastructure 0 4 4 4 5Marketing and promotion 0 1 596 750 2 086 1 952Public stockholding 0 0 0 0 0Miscellaneous 0 26 17 23 37
GSSE as a share of TSE (%) 9.7 10.5 5.6 11.5 14.1Consumer Support Estimate (CSE) –2 –10 468 –11 329 –12 400 –7 675
Transfers to producers from consumers –2 –11 964 –12 866 –14 113 –8 915Other transfers from consumers 0 799 616 691 1 090Transfers to consumers from taxpayers 0 0 0 0 0Excess feed cost 0 697 921 1 021 150
Percentage CSE –16 –19 –21 –22 –13Consumer NPC 1.21 1.26 1.30 1.31 1.16Consumer NAC 1.20 1.24 1.27 1.28 1.15Total Support Estimate (TSE) 3 17 953 16 867 20 096 16 896
Transfers from consumers 2 11 165 12 250 13 421 7 825Transfers from taxpayers 1 5 989 4 002 5 983 7 981Budget revenues 0 799 616 691 1 090
Percentage TSE (expressed as share of GDP) 4.10 3.64 3.92 4.12 2.89GDP deflator 1986-88 = 100 100 296 904 274 511 289 308 326 893
p: provisional. NPC: Nominal Protection Coefficient. NAC: Nominal Assistance Coefficient.1. A (area planted), An (animal numbers), R (receipts) or I (income).MPS commodities for Turkey are: wheat, maize, other grains, oilseeds, sugar, potatoes, tomatoes, grape, apple, cotton,tobacco, milk, beef and veal, sheepmeat, poultry and eggs. Market price support is net of producer levies and excessfeed costs.Source: OECD, PSE/CSE database, 2007.
1 2 http://dx.doi.org/10.1787/075387516007
AGRICULTURAL POLICIES IN OECD COUNTRIES: MONITORING AND EVALUATION 2007 – ISBN 978-92-64-02746-6 – © OECD 2007224
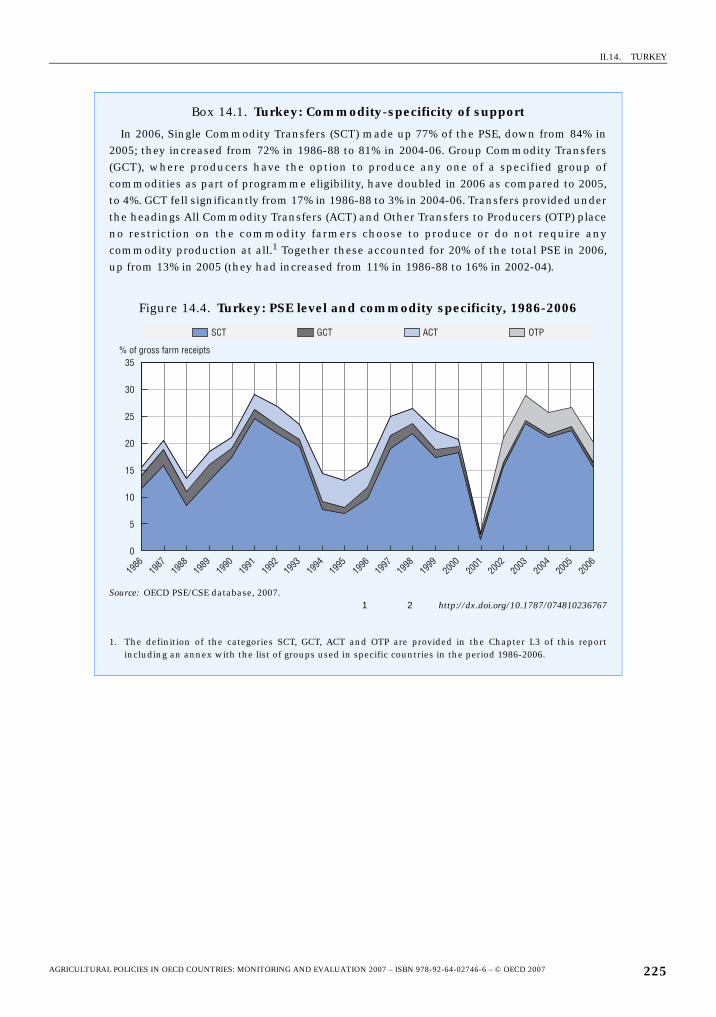
II.14. TURKEY
Box 14.1. Turkey: Commodity-specificity of support
In 2006, Single Commodity Transfers (SCT) made up 77% of the PSE, down from 84% in2005; they increased from 72% in 1986-88 to 81% in 2004-06. Group Commodity Transfers(GCT), where producers have the option to produce any one of a specified group ofcommodities as part of programme eligibility, have doubled in 2006 as compared to 2005,to 4%. GCT fell significantly from 17% in 1986-88 to 3% in 2004-06. Transfers provided underthe headings All Commodity Transfers (ACT) and Other Transfers to Producers (OTP) placeno restriction on the commodity farmers choose to produce or do not require anycommodity production at all.1 Together these accounted for 20% of the total PSE in 2006,up from 13% in 2005 (they had increased from 11% in 1986-88 to 16% in 2002-04).
Figure 14.4. Turkey: PSE level and commodity specificity, 1986-2006
Source: OECD PSE/CSE database, 2007.1 2 http://dx.doi.org/10.1787/074810236767
1. The definition of the categories SCT, GCT, ACT and OTP are provided in the Chapter I.3 of this reportincluding an annex with the list of groups used in specific countries in the period 1986-2006.
��� ��� ��� ���
��
�� �
��
��
�� �
���
����
����
����
����
����
����
���
���
����
�
��
��
��
��
��
��
�
��
�
�
��
�
���������������������� �
AGRICULTURAL POLICIES IN OECD COUNTRIES: MONITORING AND EVALUATION 2007 – ISBN 978-92-64-02746-6 – © OECD 2007 225
II.14. TURKEY
Description of policy developments
Main policy instrumentsBorder measures and budgetary payments are the main policy instruments supporting
agriculture. Under the 2001-05 ARIP, an annual direct income support payment to cushion
the losses associated with the removal of administered prices and input subsidies is
granted on a per-hectare basis to all farmers registered with the National Farmer
Registration System (NFRS) at a flat rate. The ARIP programme was extended for the period
2005-07 and its scope enlarged. Import tariffs – complemented by purchasing prices fixed
for cereals, sugar and tobacco – provide support for domestic production. Export subsidies
are applied to a number of products, including fresh and processed fruit and vegetables
and derived food products, poultrymeat and eggs. Production quotas at processing plant
level are applied for sugar beet.
Deficiency payments – based on production costs, world and domestic prices – are
implemented for olive oil, oilseeds, cotton, tea, and, as of 2005, for cereals. Tea growers are
partially (70%) compensated for the costs incurred in implementing the strict pruning
requirements to control supply. Compensatory payments are also granted to potato and
livestock producers to compensate for income losses. A farmer transition programme,
originally designed to reduce excess supply of hazelnuts and tobacco, was put in place in
2005 for these crops. Livestock sector support policies include numerous health and quality
measures to meet the EU’s sanitary and phytosanitary standards.
Most farmers are exempt from income tax. Subsidies on fertilisers were abolished in
2002, as were those on hybrid seeds and pesticides for all commodities. Input subsidies are
provided mainly in the form of interest concessions, and payments to improve animal
breeds and farm production capacity (e.g. field levelling, drainage, soil improvement and
protection, and land consolidation). Farmers also receive an area-based payment for
gasoline use. Financial aid is granted to assist in the restructuring and transformation of
Agricultural Sales Co-operatives (ASC) and their unions (ASCU) into independent,
financially autonomous and self-managed co-operatives. Financial aid is also provided for
improving public services to facilitate reform implementation.
A number of regulations control water and soil pollution, and protect wetlands.
National and regional plans provide information to help farmers to combat land
desertification and reduce the discharge of nutrients. The government plays a major role in
providing infrastructure investment, especially for irrigation. Capital costs relating to
irrigation and operation and maintenance expenditures incurred by the General
Directorate of the State Hydraulic works (DSI) are subject to repayment.
A new agriculture law to facilitate implementation of the “Agricultural Strategy Paper
2006-10” was enacted in April 2005. This law puts emphasis on increasing productivity and
ensuring food supply. The tools of agricultural support to be used for achieving the
strategic objectives, principles and priorities of the agricultural policies outlined in the
strategy paper include direct payments, deficiency payments, compensatory payments,
livestock support (fodder crops, artificial insemination, milk premiums, risk-free livestock
regions, bee-keeping, fisheries), crop insurance support, rural development support and
environmental set-aside. In addition, funds will be allocated to selected credit supports
and research and development.
AGRICULTURAL POLICIES IN OECD COUNTRIES: MONITORING AND EVALUATION 2007 – ISBN 978-92-64-02746-6 – © OECD 2007226
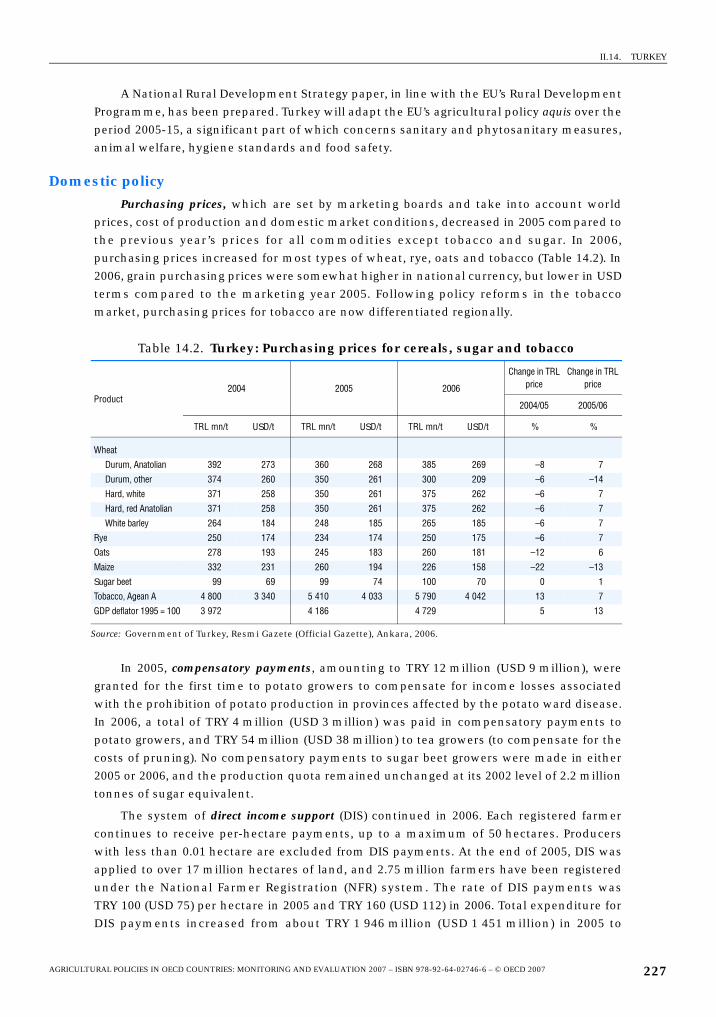
II.14. TURKEY
A National Rural Development Strategy paper, in line with the EU’s Rural Development
Programme, has been prepared. Turkey will adapt the EU’s agricultural policy aquis over the
period 2005-15, a significant part of which concerns sanitary and phytosanitary measures,
animal welfare, hygiene standards and food safety.
Domestic policyPurchasing prices, which are set by marketing boards and take into account world
prices, cost of production and domestic market conditions, decreased in 2005 compared to
the previous year’s prices for all commodities except tobacco and sugar. In 2006,
purchasing prices increased for most types of wheat, rye, oats and tobacco (Table 14.2). In
2006, grain purchasing prices were somewhat higher in national currency, but lower in USD
terms compared to the marketing year 2005. Following policy reforms in the tobacco
market, purchasing prices for tobacco are now differentiated regionally.
In 2005, compensatory payments, amounting to TRY 12 million (USD 9 million), were
granted for the first time to potato growers to compensate for income losses associated
with the prohibition of potato production in provinces affected by the potato ward disease.
In 2006, a total of TRY 4 million (USD 3 million) was paid in compensatory payments to
potato growers, and TRY 54 million (USD 38 million) to tea growers (to compensate for the
costs of pruning). No compensatory payments to sugar beet growers were made in either
2005 or 2006, and the production quota remained unchanged at its 2002 level of 2.2 million
tonnes of sugar equivalent.
The system of direct income support (DIS) continued in 2006. Each registered farmer
continues to receive per-hectare payments, up to a maximum of 50 hectares. Producers
with less than 0.01 hectare are excluded from DIS payments. At the end of 2005, DIS was
applied to over 17 million hectares of land, and 2.75 million farmers have been registered
under the National Farmer Registration (NFR) system. The rate of DIS payments was
TRY 100 (USD 75) per hectare in 2005 and TRY 160 (USD 112) in 2006. Total expenditure for
DIS payments increased from about TRY 1 946 million (USD 1 451 million) in 2005 to
Table 14.2. Turkey: Purchasing prices for cereals, sugar and tobacco
Product2004 2005 2006
Change in TRL price
Change in TRL price
2004/05 2005/06
TRL mn/t USD/t TRL mn/t USD/t TRL mn/t USD/t % %
Wheat
Durum, Anatolian 392 273 360 268 385 269 –8 7
Durum, other 374 260 350 261 300 209 –6 –14
Hard, white 371 258 350 261 375 262 –6 7
Hard, red Anatolian 371 258 350 261 375 262 –6 7
White barley 264 184 248 185 265 185 –6 7
Rye 250 174 234 174 250 175 –6 7
Oats 278 193 245 183 260 181 –12 6
Maize 332 231 260 194 226 158 –22 –13
Sugar beet 99 69 99 74 100 70 0 1
Tobacco, Agean A 4 800 3 340 5 410 4 033 5 790 4 042 13 7
GDP deflator 1995 = 100 3 972 4 186 4 729 5 13
Source: Government of Turkey, Resmi Gazete (Official Gazette), Ankara, 2006.
AGRICULTURAL POLICIES IN OECD COUNTRIES: MONITORING AND EVALUATION 2007 – ISBN 978-92-64-02746-6 – © OECD 2007 227
II.14. TURKEY
TRY 2 689 million (USD 1 877 million) in 2006. Farmers on the DIS payment register also
received a so-called “diesel payment” of TRY 23.9 (USD 18) per hectare (up to a maximum
of 50 hectares) in 2005; no payment has been reported for 2006.
The uptake of the transition payment programme, aimed at helping farmers switch
from overproduced commodities (namely hazelnuts and tobacco) to other commodities,
was weak and only TRY 5 million (USD 4 million) out of the TRY 298 million (USD 213 million)
available, were paid over the 2001-05 period. No payments have been reported for 2006.
The total amount of the price premium was increased by 41% for milk, while it was
negligible for beef producers. Deficiency payments in nominal terms decreased by 86% for
olive oil, but increased by 24% for cotton, 53% for oilseeds and 76% for cereals. To increase
the quality of cereals – mainly wheat – a certified seed supply programme was developed
in 2005 by the Ministry of Agriculture and Rural Affairs (MARA). This policy initiative was
complemented by a deficiency payment mechanism for cereals in 2005: TRY 35
(USD 28 million) per tonne of wheat and TRY 25 (USD 19 million) per tonne of barley, rye
and oats for registered farmers. If crop production is stored by the Turkish Grain Board
(TMO), it will make an advance payment to farmers of up to 25% of the total crop value.
These farmers will also be able to receive credit from banks with the receipt vouchers they
receive from the TMO for their crops.
An insurance support scheme was implemented in 2006. The scheme is open to all
producers and covers hailstorm and frost for aquaculture, greenhouse and livestock,
including poultry. The government reimburses 50% of the premium costs. In 2006,
TRY 1.2 million (USD 1 million) were paid to insure crops and TRY 0.6 million
(USD 0.4 million) to insure livestock.
In 2006, more than 80% of the total government expenditure on input subsidies were
for improving livestock breeds. Interest subsidies were abolished in 2002. However, in 2005
a new credit scheme at an interest rate of 25-60%, equivalent to TRY 36 million
(USD 27 million) in 2005 and TRY 146 million (USD 102 million) in 2006, was provided to
producers for organic farming, certified seed production and use, agricultural research and
development, fishery products, investments on mechanisation, animal husbandry,
irrigation, greenhouse farming, gardening nurseries, aromatic and medicinal crops, and
good farming practices. The application period of the Restructuring Farmers’ Debts Law,
enacted in mid-2003, ended in January 2006.
Enterprises that operate or invest in animal husbandry (including aquaculture and
poultry), greenhouse production, certificated seed production and cooling warehouse
sectors and agro-industry, are eligible for support at rates ranging from 20-50% of the cost
of electricity energy consumption, according to their existing employment levels and levels
of new recruitment. As from 2005, there has been a growing interest in producing energycrops in Turkey. The government supports production of canola through a deficiency
payment scheme.
With regard to agricultural state economic enterprises, all state-owned sugar factories
(SEKER), the state tobacco company (TEKEL) and the state tea processing companies are to
be privatized by 2013, while the TMO will be maintained. Financing practice based on
warehouse-receipts by ASCUs and TMO was introduced in 2006. The state hazelnut
co-operative, FISKOBIRLIK, has ceased setting purchasing prices and the government
eliminated all of its debts of about TRY 2.1 billion (USD 2 billion) during 2000-06. Following
AGRICULTURAL POLICIES IN OECD COUNTRIES: MONITORING AND EVALUATION 2007 – ISBN 978-92-64-02746-6 – © OECD 2007228
II.14. TURKEY
the decision of an inter-ministerial committee chaired by the Prime Minister, procurement
of hazelnuts was assigned to the TMO.
Several projects have been implemented to harmonise domestic food safety andquality standards with those of the European Union. On 12 November 2006, a new
Agricultural Quarantine Regulation was published in the Official Gazette. A new regulation
concerning the establishment of agricultural producer organisations was published in 2004.
On rural development, a new component, the “Participatory Rural Development
Programme”, was included in the amended ARIP, consisting of three sub-components:
i) land consolidation; ii) institutional reinforcement of farmers’ organisations; and iii) a
village-based participatory investment programme. The first sub-component aims at
achieving an optimal size of land holdings, while the second aims at strengthening the
institutional capacity of farmer organisations, such as co-operatives, water user
associations and farmers’ unions. The objective of the “village-based participatory
investments” sub-component, which is divided into both private and public sector
programmes, is to support community-based activities in small-scale agricultural
processing, marketing and other off-farm businesses, as well as the rehabilitation of public
infrastructure related to the provision of public services in remote rural areas. Projects on
the following investment areas in 16 pilot provinces are to be implemented: maize drying
and storage; collection, cooling and processing of milk; storage, processing and packing of
fruits and vegetables; construction of greenhouses using alternative sources of energy
(geo-thermal, solar, wind, etc.); meat processing, food legume processing and packing, and
bee products processing and packing. Under the programme which focuses on the private
sector, individual farmers and other private individuals engaged in small rural businesses
would be eligible to participate, as well as groups of farmers, co-operatives, and other
farmers’ organisations. A 50% grant element for private-sector investment proposals and
75% for investments by the public sector have been set. The maximum project size as a
basis for the loan financing will be TRY 49 000 (USD 35 000) for individuals and TRY 350 000
(USD 250 000) for private enterprises, groups of farmers, and non-profit organisations, and
TRY 420 000 (USD 300 000) for public-sector investments.
Concerning environmental protection, the Law for the implementation of Soil
Protection and Land Use regulation was enacted in July 2005. The “Environmentally Based
Agricultural Land Utilisation” sub-component of the amended ARIP aims to protect
environmentally fragile areas by setting aside agricultural areas formerly planted to crops
in excess production or subject to severe erosion and replacing harmful agricultural farm
practices with more environmentally friendly ones such as contour tillage, reduced flow
irrigation, organic agriculture, production of fodder and adoption of pasture rehabilitation
measures. It will be implemented in four pilot provinces totaling approximately 5 000
hectares: farmers in these areas would be offered annual transition payments (5 to
10 years) of TRY 560-1260 (USD 400-900) per hectare.
Trade policyIn 2006, most duties remained at the same rates as in 2005. Duty rates for wheat,
barley, corn, sorghum, sunflower seeds, crude sunflower oil and soybean meal were raised
in 2006. The average rate of customs duties for agricultural products was 56.4% in 2005 and
59.2% in 2006.
AGRICULTURAL POLICIES IN OECD COUNTRIES: MONITORING AND EVALUATION 2007 – ISBN 978-92-64-02746-6 – © OECD 2007 229
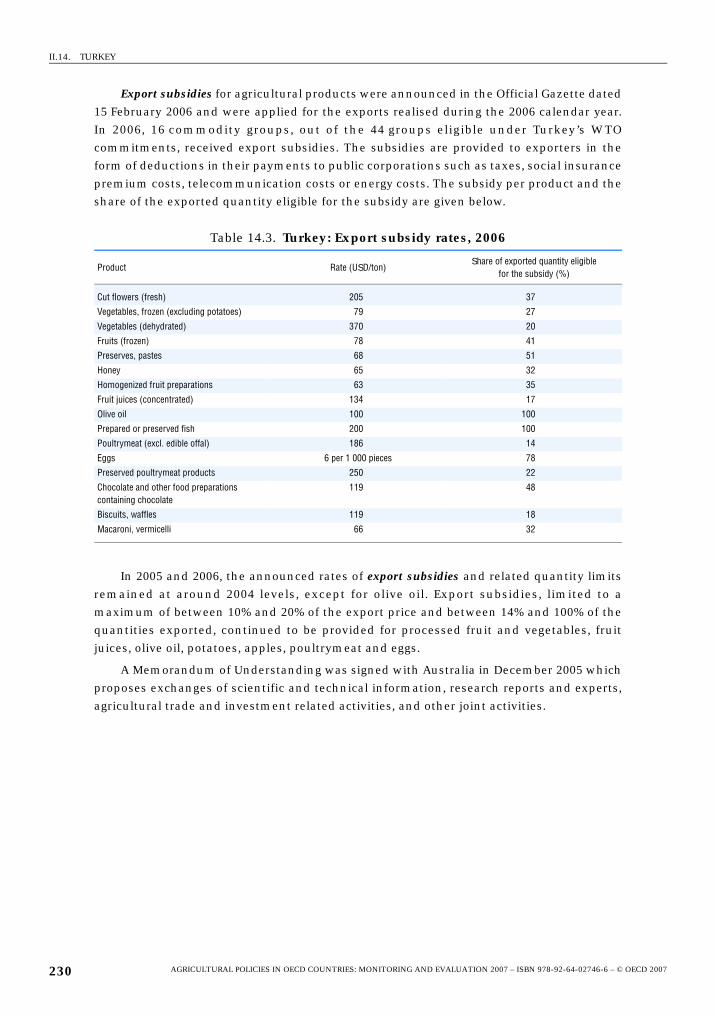
II.14. TURKEY
Export subsidies for agricultural products were announced in the Official Gazette dated
15 February 2006 and were applied for the exports realised during the 2006 calendar year.
In 2006, 16 commodity groups, out of the 44 groups eligible under Turkey’s WTO
commitments, received export subsidies. The subsidies are provided to exporters in the
form of deductions in their payments to public corporations such as taxes, social insurance
premium costs, telecommunication costs or energy costs. The subsidy per product and the
share of the exported quantity eligible for the subsidy are given below.
In 2005 and 2006, the announced rates of export subsidies and related quantity limits
remained at around 2004 levels, except for olive oil. Export subsidies, limited to a
maximum of between 10% and 20% of the export price and between 14% and 100% of the
quantities exported, continued to be provided for processed fruit and vegetables, fruit
juices, olive oil, potatoes, apples, poultrymeat and eggs.
A Memorandum of Understanding was signed with Australia in December 2005 which
proposes exchanges of scientific and technical information, research reports and experts,
agricultural trade and investment related activities, and other joint activities.
Table 14.3. Turkey: Export subsidy rates, 2006
Product Rate (USD/ton)Share of exported quantity eligible
for the subsidy (%)
Cut flowers (fresh) 205 37
Vegetables, frozen (excluding potatoes) 79 27
Vegetables (dehydrated) 370 20
Fruits (frozen) 78 41
Preserves, pastes 68 51
Honey 65 32
Homogenized fruit preparations 63 35
Fruit juices (concentrated) 134 17
Olive oil 100 100
Prepared or preserved fish 200 100
Poultrymeat (excl. edible offal) 186 14
Eggs 6 per 1 000 pieces 78
Preserved poultrymeat products 250 22
Chocolate and other food preparations containing chocolate
119 48
Biscuits, waffles 119 18
Macaroni, vermicelli 66 32
AGRICULTURAL POLICIES IN OECD COUNTRIES: MONITORING AND EVALUATION 2007 – ISBN 978-92-64-02746-6 – © OECD 2007230
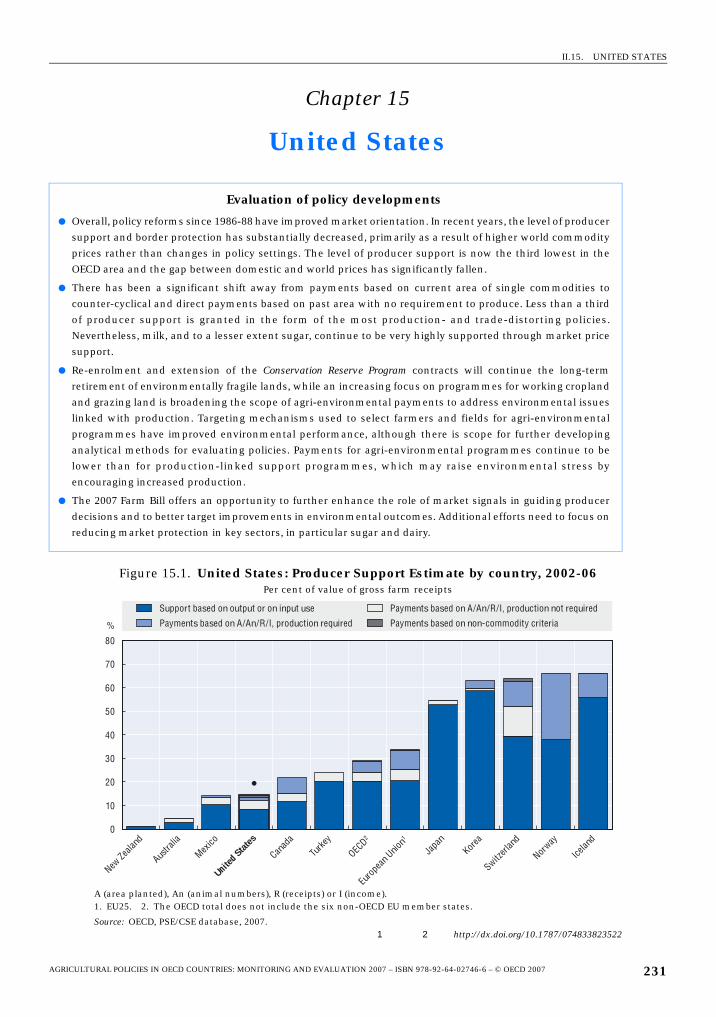
II.15. UNITED STATES
Chapter 15
United States
Evaluation of policy developments
● Overall, policy reforms since 1986-88 have improved market orientation. In recent years, the level of producer
support and border protection has substantially decreased, primarily as a result of higher world commodity
prices rather than changes in policy settings. The level of producer support is now the third lowest in the
OECD area and the gap between domestic and world prices has significantly fallen.
● There has been a significant shift away from payments based on current area of single commodities to
counter-cyclical and direct payments based on past area with no requirement to produce. Less than a third
of producer support is granted in the form of the most production- and trade-distorting policies.
Nevertheless, milk, and to a lesser extent sugar, continue to be very highly supported through market price
support.
● Re-enrolment and extension of the Conservation Reserve Program contracts will continue the long-term
retirement of environmentally fragile lands, while an increasing focus on programmes for working cropland
and grazing land is broadening the scope of agri-environmental payments to address environmental issues
linked with production. Targeting mechanisms used to select farmers and fields for agri-environmental
programmes have improved environmental performance, although there is scope for further developing
analytical methods for evaluating policies. Payments for agri-environmental programmes continue to be
lower than for production-linked support programmes, which may raise environmental stress by
encouraging increased production.
● The 2007 Farm Bill offers an opportunity to further enhance the role of market signals in guiding producer
decisions and to better target improvements in environmental outcomes. Additional efforts need to focus on
reducing market protection in key sectors, in particular sugar and dairy.
Figure 15.1. United States: Producer Support Estimate by country, 2002-06Per cent of value of gross farm receipts
A (area planted), An (animal numbers), R (receipts) or I (income).1. EU25. 2. The OECD total does not include the six non-OECD EU member states.
Source: OECD, PSE/CSE database, 2007.1 2 http://dx.doi.org/10.1787/074833823522
0
10
20
30
40
50
60
70
80
New Ze
aland
Austra
lia
Mexico
United
States
Canad
a
Turke
y
OECD2
Euro
pean
Unio
n1
Japa
nKor
ea
Switzerl
and
Norway
Icelan
d
%
Support based on output or on input use
Payments based on A/An/R/I, production required
Payments based on A/An/R/I, production not required
Payments based on non-commodity criteria
AGRICULTURAL POLICIES IN OECD COUNTRIES: MONITORING AND EVALUATION 2007 – ISBN 978-92-64-02746-6 – © OECD 2007 231

II.15. UNITED STATES
Summary of policy developments
Higher crop prices in 2006 triggered a decrease by over two-thirds in counter-cyclical
payments and an 84% decline in payments based on output (mainly loan deficiency
payments for maize and certificate exchange payments for cotton). Environmental
contracts for the Conservation Reserve Program were extended. Additional emergency
payments for natural disasters were granted. The Upland Cotton User Marketing Certificate
Program was repealed. Production quotas for tobacco were terminated in 2005,
compensated by new time-limited payments.
● In 2006, support to producers (%PSE)
declined from 16% in 2005 to 11%. It fell from
22% in 1986-88 to 14% in 2004-06, which is
around half the OECD average.
● The combined share of the most distorting
forms of support (market price support, and
commodity output- and variable input-
based payments) in the PSE decreased from
56% in 1986-88 to 43% in 2004-06, while the
share of the least production- and trade-
distorting support (payments with no
requirement to produce) increased fifteen-
fold, to 31% in 2004-06.
● Producer prices were 14% higher than world
prices in 1986-88 and 6% higher in 2004-06.
● The share of single commodity transfers to
producers decreased from 72% of PSE in
1986-88 to 37% in 2004-06. Around two-fifths
of this support in 2004-06 is attributable to
support provided to the milk sector and
about one-fifth to maize.
● Although domestic prices were on average
3% higher than world prices in 2006, the
%CSE constituted an implicit subsidy of 10%
in 2004-06, in part due to food consumption
aid (part of Food Stamps), which represented
an implicit tax of 3% in 1986-88.
● Support for general services provided to
agriculture increased from 25% of total
support in 1986-88 to 33% in 2004-06. Total
support to agriculture represents 0.8% of
GDP, down from 1.4% in 1986-88.
Figure 15.2. United States: PSE level and composition by support
categories, 1986-2006
1 2 http://dx.doi.org/10.1787/074834166338
Figure 15.3. United States: Producer SCT by commodity, 2004-06
1 2 http://dx.doi.org/10.1787/074870725706
% of gross farm receipts
Commodity outputsCurrent A/An/R/I, production requiredNon-current A/An/R/I, production not requiredMiscellaneousInput useNon-current A/An/R/I, production requiredNon-commodity criteria
0
5
10
15
20
25
30
1986 88 90 92 94 96 98 2000 02 04 06
MPS Payments based on output
Other SCTSCT as % of PSE
SCT as % of PSE
0 10 20 30 40 50 60% of commodity gross farm receipts
WheatMaize
Other grainsSoybeans
SugarRiceMilk
SheepmeatWool
Other commodities
AGRICULTURAL POLICIES IN OECD COUNTRIES: MONITORING AND EVALUATION 2007 – ISBN 978-92-64-02746-6 – © OECD 2007232
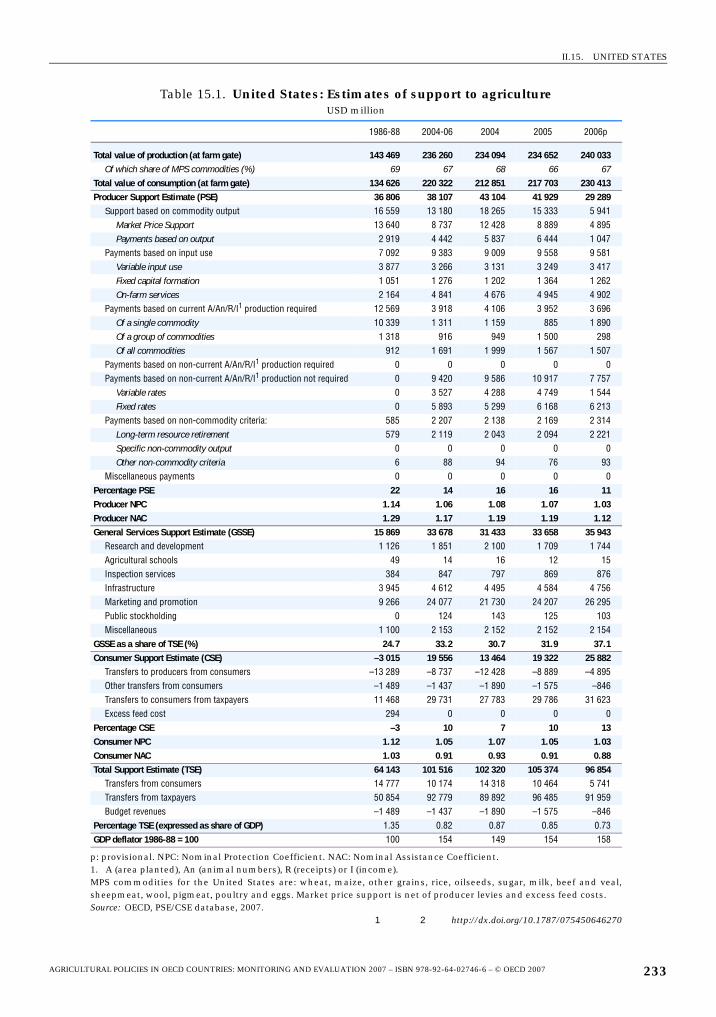
II.15. UNITED STATES
Table 15.1. United States: Estimates of support to agricultureUSD million
1986-88 2004-06 2004 2005 2006p
Total value of production (at farm gate) 143 469 236 260 234 094 234 652 240 033Of which share of MPS commodities (%) 69 67 68 66 67
Total value of consumption (at farm gate) 134 626 220 322 212 851 217 703 230 413Producer Support Estimate (PSE) 36 806 38 107 43 104 41 929 29 289
Support based on commodity output 16 559 13 180 18 265 15 333 5 941Market Price Support 13 640 8 737 12 428 8 889 4 895Payments based on output 2 919 4 442 5 837 6 444 1 047
Payments based on input use 7 092 9 383 9 009 9 558 9 581Variable input use 3 877 3 266 3 131 3 249 3 417Fixed capital formation 1 051 1 276 1 202 1 364 1 262On-farm services 2 164 4 841 4 676 4 945 4 902
Payments based on current A/An/R/I1 production required 12 569 3 918 4 106 3 952 3 696Of a single commodity 10 339 1 311 1 159 885 1 890Of a group of commodities 1 318 916 949 1 500 298Of all commodities 912 1 691 1 999 1 567 1 507
Payments based on non-current A/An/R/I1 production required 0 0 0 0 0Payments based on non-current A/An/R/I1 production not required 0 9 420 9 586 10 917 7 757
Variable rates 0 3 527 4 288 4 749 1 544Fixed rates 0 5 893 5 299 6 168 6 213
Payments based on non-commodity criteria: 585 2 207 2 138 2 169 2 314Long-term resource retirement 579 2 119 2 043 2 094 2 221Specific non-commodity output 0 0 0 0 0Other non-commodity criteria 6 88 94 76 93
Miscellaneous payments 0 0 0 0 0Percentage PSE 22 14 16 16 11Producer NPC 1.14 1.06 1.08 1.07 1.03Producer NAC 1.29 1.17 1.19 1.19 1.12General Services Support Estimate (GSSE) 15 869 33 678 31 433 33 658 35 943
Research and development 1 126 1 851 2 100 1 709 1 744Agricultural schools 49 14 16 12 15Inspection services 384 847 797 869 876Infrastructure 3 945 4 612 4 495 4 584 4 756Marketing and promotion 9 266 24 077 21 730 24 207 26 295Public stockholding 0 124 143 125 103Miscellaneous 1 100 2 153 2 152 2 152 2 154
GSSE as a share of TSE (%) 24.7 33.2 30.7 31.9 37.1Consumer Support Estimate (CSE) –3 015 19 556 13 464 19 322 25 882
Transfers to producers from consumers –13 289 –8 737 –12 428 –8 889 –4 895Other transfers from consumers –1 489 –1 437 –1 890 –1 575 –846Transfers to consumers from taxpayers 11 468 29 731 27 783 29 786 31 623Excess feed cost 294 0 0 0 0
Percentage CSE –3 10 7 10 13Consumer NPC 1.12 1.05 1.07 1.05 1.03Consumer NAC 1.03 0.91 0.93 0.91 0.88Total Support Estimate (TSE) 64 143 101 516 102 320 105 374 96 854
Transfers from consumers 14 777 10 174 14 318 10 464 5 741Transfers from taxpayers 50 854 92 779 89 892 96 485 91 959Budget revenues –1 489 –1 437 –1 890 –1 575 –846
Percentage TSE (expressed as share of GDP) 1.35 0.82 0.87 0.85 0.73GDP deflator 1986-88 = 100 100 154 149 154 158
p: provisional. NPC: Nominal Protection Coefficient. NAC: Nominal Assistance Coefficient.1. A (area planted), An (animal numbers), R (receipts) or I (income).MPS commodities for the United States are: wheat, maize, other grains, rice, oilseeds, sugar, milk, beef and veal,sheepmeat, wool, pigmeat, poultry and eggs. Market price support is net of producer levies and excess feed costs.Source: OECD, PSE/CSE database, 2007.
1 2 http://dx.doi.org/10.1787/075450646270
AGRICULTURAL POLICIES IN OECD COUNTRIES: MONITORING AND EVALUATION 2007 – ISBN 978-92-64-02746-6 – © OECD 2007 233
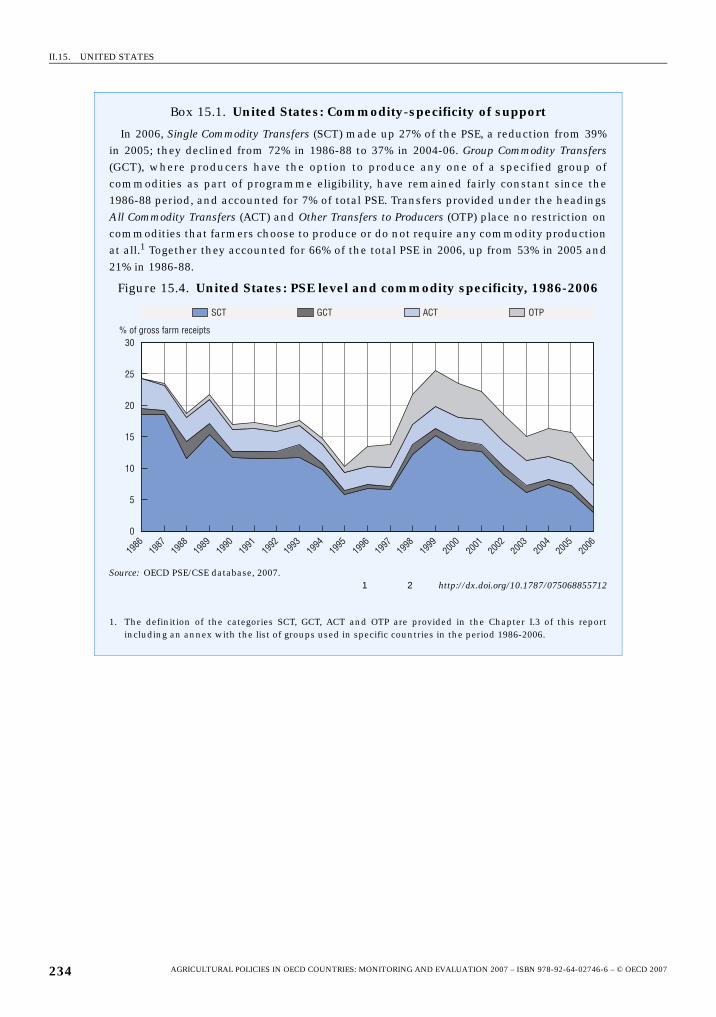
II.15. UNITED STATES
Box 15.1. United States: Commodity-specificity of support
In 2006, Single Commodity Transfers (SCT) made up 27% of the PSE, a reduction from 39%in 2005; they declined from 72% in 1986-88 to 37% in 2004-06. Group Commodity Transfers(GCT), where producers have the option to produce any one of a specified group ofcommodities as part of programme eligibility, have remained fairly constant since the1986-88 period, and accounted for 7% of total PSE. Transfers provided under the headingsAll Commodity Transfers (ACT) and Other Transfers to Producers (OTP) place no restriction oncommodities that farmers choose to produce or do not require any commodity productionat all.1 Together they accounted for 66% of the total PSE in 2006, up from 53% in 2005 and21% in 1986-88.
Figure 15.4. United States: PSE level and commodity specificity, 1986-2006
Source: OECD PSE/CSE database, 2007.1 2 http://dx.doi.org/10.1787/075068855712
1. The definition of the categories SCT, GCT, ACT and OTP are provided in the Chapter I.3 of this reportincluding an annex with the list of groups used in specific countries in the period 1986-2006.
��� ��� ��� ���
�
�� �
��
��
�� �
���
����
����
����
����
����
����
���
���
����
�
��
��
��
��
��
��
�
��
�
�
��
���������������������� �
AGRICULTURAL POLICIES IN OECD COUNTRIES: MONITORING AND EVALUATION 2007 – ISBN 978-92-64-02746-6 – © OECD 2007234
II.15. UNITED STATES
Description of policy developments
Main policy instrumentsThe Farm Security and Rural Investment Act of 2002 (the 2002 Farm Act) provides the
basic legislation governing farm policy for the period 2002-07. The main policy instruments
for the crop sector are Direct Payments (DP), Counter-Cyclical Payments (CCP) and support-
price provisions operating through non-recourse marketing loans for cereals, rice, upland
cotton, oilseeds, peanuts and pulses (small chickpeas, lentils and dry peas). DPs are based
on pre-determined rates and past production. CCPs are based on current prices and past
production. Neither requires any current production as a basis for payment eligibility.
Sugar is supported by a tariff-rate-quota (TRQ), together with provisions for non-recourse
loans and marketing allotments. Milk and dairy products are supported by minimum
prices with government purchases of butter, SMP and cheddar cheese, as well as by tariffs
and TRQs. When prices fall below target levels, a payment is made per tonne of milk
marketed below a per-farm production limit. There are marketing loans for wool, mohair
and honey, and border measures, including TRQs, for beef and sheepmeat.
Interest concessions, fuel tax concessions, payments for natural disasters, and
payments for grazing and irrigation are also provided. Environmental programmes form a
relatively important and increasing dimension of agricultural policy, focusing on measures
to convert highly erodible cropland to approved conservation uses (including long-term
retirement), to re-convert farmland back into wetlands, and to encourage crop and
livestock producers to adopt practices that reduce environmental problems. Land
retirement remains a key strategy. Ethanol production is supported through tax credit and
import tariff. Research and advice are increasingly focused on food safety and promoting
sustainable farming practices.
Commodity programmes authorised under the 2002 Farm Act are set to expire at the
end of the 2007 crop year. The 2007 Farm Bill will provide the legislative framework
governing agricultural policies for the following 5-7 years. The Administration released a
proposal for the new bill on 31 January 2007 (see Box 15.2). The congressional agricultural
committees have initiated hearings and internal discussions in preparation for writing the
new bill. The process is likely to continue throughout most of 2007, and the Administration
proposal will be one of a number of proposals received and considered by the congressional
agriculture committees during the process of writing the new law.
Domestic policyLoan rates for the marketing loan programme were pre-determined for the period
2002-07 (Table 15.2). The direct payment rates and the target prices used to determine the
counter-cyclical payment rates are also fixed for all eligible commodities for 2002-07, with
target prices for cereals increasing for 2004-07 as scheduled. In 2005, marketing loan
benefits increased by 31%, to USD 4.9 billion, but they decreased by 94%, to USD 0.3 billion,
in 2006. CCPs also increased by 11% to USD 4.8 billion in 2005, but decreased by two-thirds
to USD 1.5 billion in 2006. DPs remained almost stable at USD 5.2 billion in both years.
Overall, these payments decreased by more than twofold, to USD 7.1 billion in 2006, mainly
due to higher world crop prices.
The tobacco quota buy-out legislation terminated the tobacco price support and quota
programme effective with the 2005 crop year. In return, tobacco producers and quota
AGRICULTURAL POLICIES IN OECD COUNTRIES: MONITORING AND EVALUATION 2007 – ISBN 978-92-64-02746-6 – © OECD 2007 235
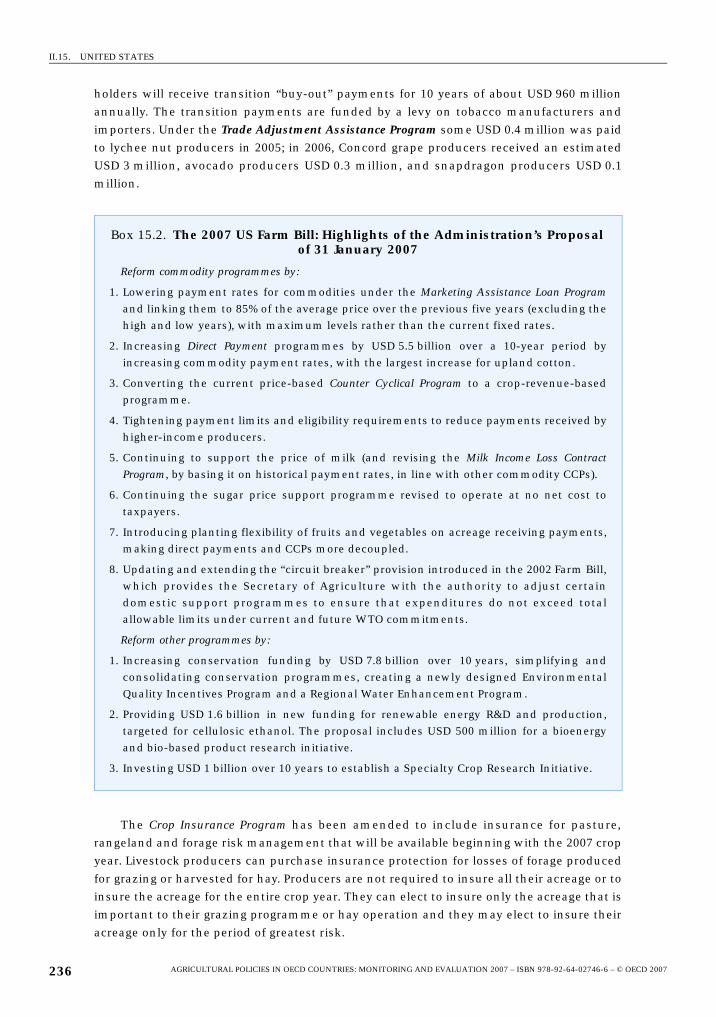
II.15. UNITED STATES
holders will receive transition “buy-out” payments for 10 years of about USD 960 million
annually. The transition payments are funded by a levy on tobacco manufacturers and
importers. Under the Trade Adjustment Assistance Program some USD 0.4 million was paid
to lychee nut producers in 2005; in 2006, Concord grape producers received an estimated
USD 3 million, avocado producers USD 0.3 million, and snapdragon producers USD 0.1
million.
The Crop Insurance Program has been amended to include insurance for pasture,
rangeland and forage risk management that will be available beginning with the 2007 crop
year. Livestock producers can purchase insurance protection for losses of forage produced
for grazing or harvested for hay. Producers are not required to insure all their acreage or to
insure the acreage for the entire crop year. They can elect to insure only the acreage that is
important to their grazing programme or hay operation and they may elect to insure their
acreage only for the period of greatest risk.
Box 15.2. The 2007 US Farm Bill: Highlights of the Administration’s Proposal of 31 January 2007
Reform commodity programmes by:
1. Lowering payment rates for commodities under the Marketing Assistance Loan Program
and linking them to 85% of the average price over the previous five years (excluding thehigh and low years), with maximum levels rather than the current fixed rates.
2. Increasing Direct Payment programmes by USD 5.5 billion over a 10-year period byincreasing commodity payment rates, with the largest increase for upland cotton.
3. Converting the current price-based Counter Cyclical Program to a crop-revenue-basedprogramme.
4. Tightening payment limits and eligibility requirements to reduce payments received byhigher-income producers.
5. Continuing to support the price of milk (and revising the Milk Income Loss Contract
Program, by basing it on historical payment rates, in line with other commodity CCPs).
6. Continuing the sugar price support programme revised to operate at no net cost totaxpayers.
7. Introducing planting flexibility of fruits and vegetables on acreage receiving payments,making direct payments and CCPs more decoupled.
8. Updating and extending the “circuit breaker” provision introduced in the 2002 Farm Bill,which provides the Secretary of Agriculture with the authority to adjust certaindomestic support programmes to ensure that expenditures do not exceed totalallowable limits under current and future WTO commitments.
Reform other programmes by:
1. Increasing conservation funding by USD 7.8 billion over 10 years, simplifying andconsolidating conservation programmes, creating a newly designed EnvironmentalQuality Incentives Program and a Regional Water Enhancement Program.
2. Providing USD 1.6 billion in new funding for renewable energy R&D and production,targeted for cellulosic ethanol. The proposal includes USD 500 million for a bioenergyand bio-based product research initiative.
3. Investing USD 1 billion over 10 years to establish a Specialty Crop Research Initiative.
AGRICULTURAL POLICIES IN OECD COUNTRIES: MONITORING AND EVALUATION 2007 – ISBN 978-92-64-02746-6 – © OECD 2007236
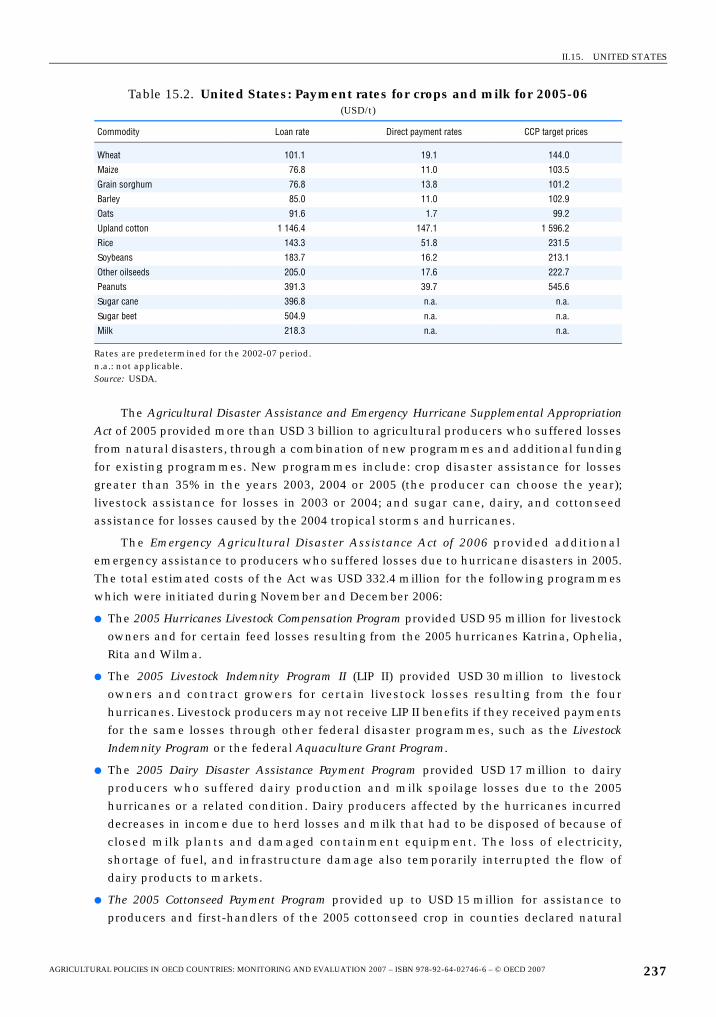
II.15. UNITED STATES
The Agricultural Disaster Assistance and Emergency Hurricane Supplemental Appropriation
Act of 2005 provided more than USD 3 billion to agricultural producers who suffered losses
from natural disasters, through a combination of new programmes and additional funding
for existing programmes. New programmes include: crop disaster assistance for losses
greater than 35% in the years 2003, 2004 or 2005 (the producer can choose the year);
livestock assistance for losses in 2003 or 2004; and sugar cane, dairy, and cottonseed
assistance for losses caused by the 2004 tropical storms and hurricanes.
The Emergency Agricultural Disaster Assistance Act of 2006 provided additional
emergency assistance to producers who suffered losses due to hurricane disasters in 2005.
The total estimated costs of the Act was USD 332.4 million for the following programmes
which were initiated during November and December 2006:
● The 2005 Hurricanes Livestock Compensation Program provided USD 95 million for livestock
owners and for certain feed losses resulting from the 2005 hurricanes Katrina, Ophelia,
Rita and Wilma.
● The 2005 Livestock Indemnity Program II (LIP II) provided USD 30 million to livestock
owners and contract growers for certain livestock losses resulting from the four
hurricanes. Livestock producers may not receive LIP II benefits if they received payments
for the same losses through other federal disaster programmes, such as the Livestock
Indemnity Program or the federal Aquaculture Grant Program.
● The 2005 Dairy Disaster Assistance Payment Program provided USD 17 million to dairy
producers who suffered dairy production and milk spoilage losses due to the 2005
hurricanes or a related condition. Dairy producers affected by the hurricanes incurred
decreases in income due to herd losses and milk that had to be disposed of because of
closed milk plants and damaged containment equipment. The loss of electricity,
shortage of fuel, and infrastructure damage also temporarily interrupted the flow of
dairy products to markets.
● The 2005 Cottonseed Payment Program provided up to USD 15 million for assistance to
producers and first-handlers of the 2005 cottonseed crop in counties declared natural
Table 15.2. United States: Payment rates for crops and milk for 2005-06(USD/t)
Commodity Loan rate Direct payment rates CCP target prices
Wheat 101.1 19.1 144.0
Maize 76.8 11.0 103.5
Grain sorghum 76.8 13.8 101.2
Barley 85.0 11.0 102.9
Oats 91.6 1.7 99.2
Upland cotton 1 146.4 147.1 1 596.2
Rice 143.3 51.8 231.5
Soybeans 183.7 16.2 213.1
Other oilseeds 205.0 17.6 222.7
Peanuts 391.3 39.7 545.6
Sugar cane 396.8 n.a. n.a.
Sugar beet 504.9 n.a. n.a.
Milk 218.3 n.a. n.a.
Rates are predetermined for the 2002-07 period.n.a.: not applicable.Source: USDA.
AGRICULTURAL POLICIES IN OECD COUNTRIES: MONITORING AND EVALUATION 2007 – ISBN 978-92-64-02746-6 – © OECD 2007 237
II.15. UNITED STATES
disaster areas resulting from hurricanes Katrina, Ophelia, Rita and Wilma in 2005. The
payment rate may not exceed the national average price of the 2005 cottonseed crop (or
USD 98 per tonne). Payments are based on 2003 cottonseed production data.
● Another USD 95 million was authorised and will be distributed by a combination of the
following programmes for specialty crops and nursery crops producers resulting from
hurricanes Katrina, Ophelia, Rita and Wilma in 2005: the 2005 Hurricanes Citrus Program
(which provides financial assistance to producers who suffered citrus crop production
losses and associated fruit-bearing tree damage, including related clean-up and
rehabilitation costs); the 2005 Hurricanes Nursery Program (which provides financial
assistance to qualifying commercial ornamental nursery and fernery producers who
suffered inventory losses and incurred clean-up costs); the 2005 Hurricanes Fruit and
Vegetable Program (which provides financial assistance to fruit and vegetable producers
who suffered crop production losses, including related clean-up costs); the 2005
Hurricanes Tropical Fruit Program which provides financial assistance for carambola,
longan, lychee and mango producers who suffered crop production losses, including
related clean-up costs.
The 2002 Farm Act sharply increased funding for environmental conservation andprotection programmes. The primary land retirement programmes have retired over
14 million environmentally sensitive hectares, most under 10- to 15-year contracts. In
budgetary terms, the largest of these programmes is the Conservation Reserve Program (CRP),
estimated at USD 2.1 billion in 2006. Under the CRP, farmers and ranchers can re-enrol or
extend their contracts expiring in 2007 until 2010 (Box 15.3). The Conservation Security
Program (CSP), which provides payments and technical assistance to producers to promote
ongoing conservation stewardship, was extended in 2006. In 2006, CSP was implemented in
220 eligible watersheds across the country and now covers 4.5 million hectares. Budgetary
Box 15.3. United States: Conservation Reserve Program (CRP) general sign-up and re-enrolments
The Environmental Benefits Index (EBI), which was in place when the contracts werefirst written, is used to determine eligibility for CRP re-enrolment or extensions on thebasis of multiple environmental objectives and budgetary costs, giving additional credit forcontracts within national CRP conservation priority areas. To determine what form ofre-enrollment or extension would be offered to the over 6.1 million hectares of landexpiring in 2007, the EBI scores are divided into five ranking tiers. In the first tier, eligibleproducers ranked in the top 20% of the EBI can re-enrol their land in new 10-year contracts,and farmers and ranchers with wetlands in this ranking are eligible for a 15-yearcontract. Eligible participants ranked within the second tier (between 61-80%) can extendtheir contracts for five years. Farmers and ranchers ranking within the third tier(between 41-60%) can extend their CRP contracts by four years. Those ranked in thefourth tier (between 21-40%) can receive 3-year extensions. Eligible participants rankedin the fifth tier can extend their contracts by two years. Fifteen-year contracts expiringon 30 September 2007, are not eligible for extension. Rental rates for land enrolled havebeen reviewed and updated. For the CRP general sign-up, which ran from 27 March to28 April 2006, 0.4 million hectares out of the 0.6 million hectares offered were selected,while for re-enrolment and extension contracts set to expire on 20 September 2007,5.3 million – almost 84% of the 6.3 million hectares set to expire – were selected.
AGRICULTURAL POLICIES IN OECD COUNTRIES: MONITORING AND EVALUATION 2007 – ISBN 978-92-64-02746-6 – © OECD 2007238

II.15. UNITED STATES
expenditures are estimated at USD 342 million in FY2007. Some USD 400 million was
budgeted in FY2007 for the Wetlands Reserve Program and it is estimated that
101 174 hectares will be enrolled in 2007 – 40 469 hectares more than in 2006.
In 2006, there were no changes in USDA’s rural development programmes. Overall
funding was below the estimate for 2005, largely due to lower loan levels for the electric
and telecommunications programmes. In the field of food safety, the National Poultry
Improvement Program, a voluntary co-operative federal, state and industry programme
designed to prevent the spread of poultry diseases in commercial poultry operations, was
expanded. The government provides a 100% indemnity for specified costs associated with
eradication of avian influenza (H5 and H7 LPAI) at commercial poultry operations
participating in the programme, and offers a 25% indemnity for costs associated with
eradication at commercial facilities that choose not to participate in the active surveillance
portion of the programme. In 2006, the US Department of Agriculture’s Food Safety and
Inspection Service issued compliance guidelines regarding salmonella control in poultry
slaughter. The compliance guideline describes validated controls and outlines best
management practices for each step in the broiler slaughter process and targets small and
very small poultry plants to help them better comply with regulatory requirements.
Trade policyThe total value of products covered by export credit guarantees under the Export Credit
Guarantee Program decreased by 26% in 2005 and again by 37%, to USD 1.4 billion, in 2006. In
FY2005, funding for foreign food aid under Titles I and II totalled USD 1.5 billion and
provided over 3 million tonnes of commodity assistance. Also in that year, 0.7 million tons
(at a value of USD 377 million) were provided under the Bill Emerson Humanitarian Trust
(BEHT), mainly to Eritrea, Ethiopia and Sudan. The BEHT is a food reserve programme,
administered by the Secretary of Agriculture, and is used for emergency situations. For
FY2006, Titles I and II increased slightly over the previous year to USD 1.57 billion due to
higher commodity prices, but quantities fell to 2.6 million tons. The BEHT was not used in
FY2006. There were no expenditures on export subsidies under the Dairy Export Incentive
Program or the Export Enhancement Program for both 2005 and 2006.
In July 2005, the United States announced a number of measures it was taking to
comply with a WTO ruling on the United States – Subsidies on Upland Cotton, a dispute with
Brazil regarding certain US agricultural programmes primarily benefiting cotton. Following
these announcements, the United States ceased accepting applications for the long-term
Export Credit Guarantee Program GSM-103 and “risk-based” fees were introduced for two,
shorter-term export credit guarantee programmes (the Export Credit Guarantee Program
GSM-102 – the primary export programme – and the Supplier Credit Guarantee Program).
On 8 February 2006, the President signed legislation to repeal the Upland Cotton User
Marketing Certificate Program (known as “Step-2”), which came into effect 1 August 2006.
Payments under this programme totalled USD 582 million for the crop year 2004 and
USD 312.2 million for 2005. No payments were made for 2006.
Trade agreementsImplementing legislation for the U.S.-Central America-Dominican Republic Free Trade
Agreement (CAFTA-DR) (Costa Rica, the Dominican Republic, El Salvador, Guatemala,
Honduras, and Nicaragua) was passed by the US Senate in June 2005 and the House of
AGRICULTURAL POLICIES IN OECD COUNTRIES: MONITORING AND EVALUATION 2007 – ISBN 978-92-64-02746-6 – © OECD 2007 239
II.15. UNITED STATES
Representatives in July 2005 and was signed by the President in August of that year. All but
Costa Rica have ratified the agreement. During 2006, the agreement entered into force for
El Salvador, Honduras, Nicaragua, and Guatemala. CAFTA-DR is designed to eliminate
tariffs on more than 80% of US exports of consumer and industrial products to those
countries, phasing out the remaining tariffs over 10 years. More than half of current US
farm exports to Central America and the Dominican Republic will become duty-free
immediately upon implementation, including high-quality cuts of beef, soybeans, cotton,
wheat, many fruits and vegetables, and processed food products. Tariffs on most US farm
products will be phased out within 15 years, with all tariffs eliminated in 20 years.
Important US sectors will benefit, including maize, beef, pork, poultry, rice, dry beans, dairy
and vegetable oil. 80% of CAFTA-DR imports already enter the United States duty-free
under the Caribbean Basin Initiative, the Generalized System of Preferences and Most-
Favoured Nation programs. The CAFTA-DR agreement makes permanent the existing CBI
and GSP duty-free benefits and phases out the remaining tariffs over 10, 15, or – at most –
20 years.
The US-Oman Free Trade Agreement was implemented in 2006, building on existing
agreements in the region with Israel, Jordan, Morocco and Bahrain. The agreement
eliminates duties and commercial barriers to most bilateral trade in goods and services
between the two countries, and the United States provides immediate duty-free access on
all current agricultural products from Oman. Oman agrees to the immediate elimination of
tariffs on all consumer and industrial products and on 87% of agricultural products. Tariffs
on the remaining products will be phased out over 10 years
On 27 July 2006, the United States and Mexico announced an agreement that resolves
trade disputes related to each nation’s interpretation of the sweetener provisions under the
North American Free Trade Agreement (NAFTA). Under the Agreement, the United States
provides for duty-free access to 250 000 metric tonnes (raw value) of Mexican sugar for
FY2007. As of 1 January 2008, no duties or quantitative restraints will be placed on any form
of sugar.
AGRICULTURAL POLICIES IN OECD COUNTRIES: MONITORING AND EVALUATION 2007 – ISBN 978-92-64-02746-6 – © OECD 2007240
ISBN 978-92-64-02746-6
Agricultural Policies in OECD Countries
Monitoring and Evaluation 2007
© OECD 2007
PART III
Summary Tables of Estimates of Support for OECD countries
241
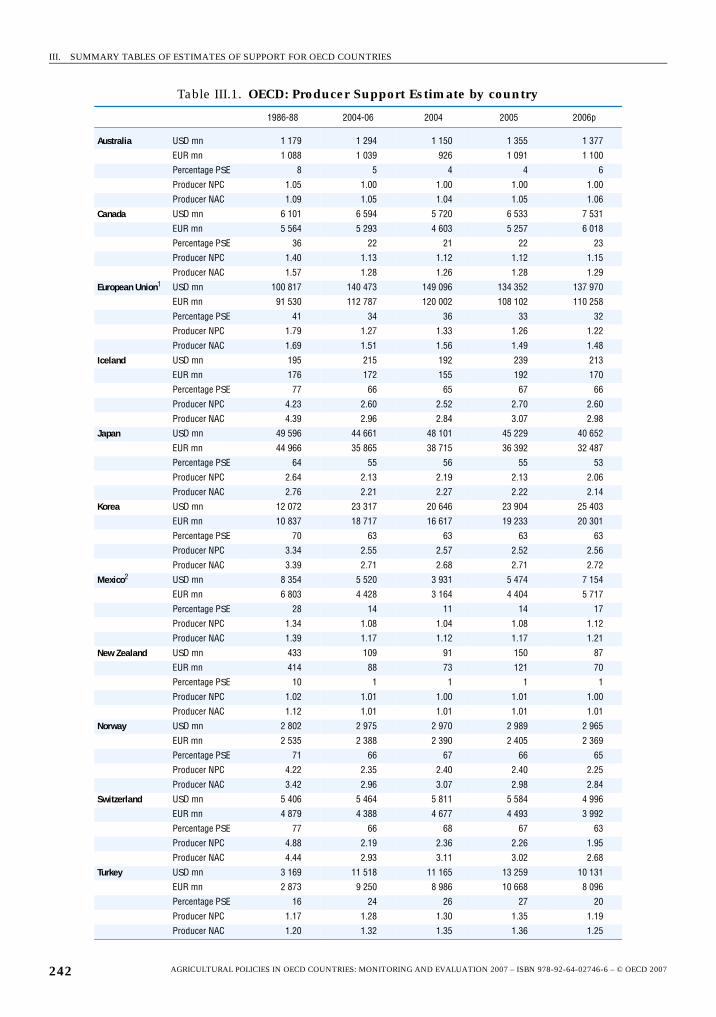
III. SUMMARY TABLES OF ESTIMATES OF SUPPORT FOR OECD COUNTRIES
Table III.1. OECD: Producer Support Estimate by country
1986-88 2004-06 2004 2005 2006p
Australia USD mn 1 179 1 294 1 150 1 355 1 377
EUR mn 1 088 1 039 926 1 091 1 100
Percentage PSE 8 5 4 4 6
Producer NPC 1.05 1.00 1.00 1.00 1.00
Producer NAC 1.09 1.05 1.04 1.05 1.06
Canada USD mn 6 101 6 594 5 720 6 533 7 531
EUR mn 5 564 5 293 4 603 5 257 6 018
Percentage PSE 36 22 21 22 23
Producer NPC 1.40 1.13 1.12 1.12 1.15
Producer NAC 1.57 1.28 1.26 1.28 1.29
European Union1 USD mn 100 817 140 473 149 096 134 352 137 970
EUR mn 91 530 112 787 120 002 108 102 110 258
Percentage PSE 41 34 36 33 32
Producer NPC 1.79 1.27 1.33 1.26 1.22
Producer NAC 1.69 1.51 1.56 1.49 1.48
Iceland USD mn 195 215 192 239 213
EUR mn 176 172 155 192 170
Percentage PSE 77 66 65 67 66
Producer NPC 4.23 2.60 2.52 2.70 2.60
Producer NAC 4.39 2.96 2.84 3.07 2.98
Japan USD mn 49 596 44 661 48 101 45 229 40 652
EUR mn 44 966 35 865 38 715 36 392 32 487
Percentage PSE 64 55 56 55 53
Producer NPC 2.64 2.13 2.19 2.13 2.06
Producer NAC 2.76 2.21 2.27 2.22 2.14
Korea USD mn 12 072 23 317 20 646 23 904 25 403
EUR mn 10 837 18 717 16 617 19 233 20 301
Percentage PSE 70 63 63 63 63
Producer NPC 3.34 2.55 2.57 2.52 2.56
Producer NAC 3.39 2.71 2.68 2.71 2.72
Mexico2 USD mn 8 354 5 520 3 931 5 474 7 154
EUR mn 6 803 4 428 3 164 4 404 5 717
Percentage PSE 28 14 11 14 17
Producer NPC 1.34 1.08 1.04 1.08 1.12
Producer NAC 1.39 1.17 1.12 1.17 1.21
New Zealand USD mn 433 109 91 150 87
EUR mn 414 88 73 121 70
Percentage PSE 10 1 1 1 1
Producer NPC 1.02 1.01 1.00 1.01 1.00
Producer NAC 1.12 1.01 1.01 1.01 1.01
Norway USD mn 2 802 2 975 2 970 2 989 2 965
EUR mn 2 535 2 388 2 390 2 405 2 369
Percentage PSE 71 66 67 66 65
Producer NPC 4.22 2.35 2.40 2.40 2.25
Producer NAC 3.42 2.96 3.07 2.98 2.84
Switzerland USD mn 5 406 5 464 5 811 5 584 4 996
EUR mn 4 879 4 388 4 677 4 493 3 992
Percentage PSE 77 66 68 67 63
Producer NPC 4.88 2.19 2.36 2.26 1.95
Producer NAC 4.44 2.93 3.11 3.02 2.68
Turkey USD mn 3 169 11 518 11 165 13 259 10 131
EUR mn 2 873 9 250 8 986 10 668 8 096
Percentage PSE 16 24 26 27 20
Producer NPC 1.17 1.28 1.30 1.35 1.19
Producer NAC 1.20 1.32 1.35 1.36 1.25
AGRICULTURAL POLICIES IN OECD COUNTRIES: MONITORING AND EVALUATION 2007 – ISBN 978-92-64-02746-6 – © OECD 2007242
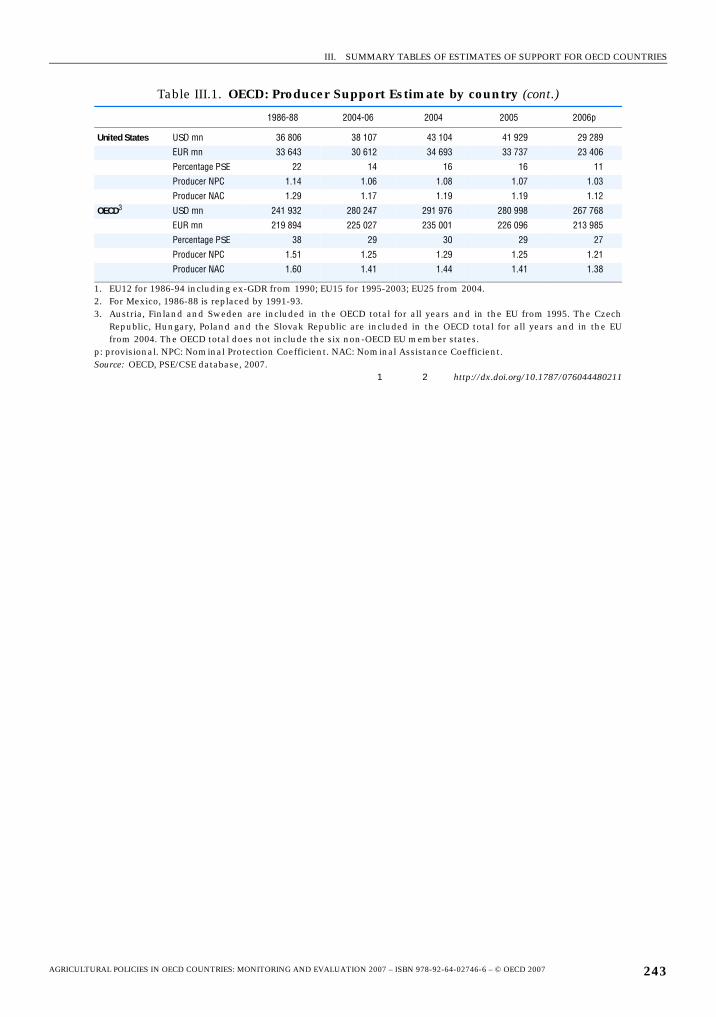
III. SUMMARY TABLES OF ESTIMATES OF SUPPORT FOR OECD COUNTRIES
United States USD mn 36 806 38 107 43 104 41 929 29 289
EUR mn 33 643 30 612 34 693 33 737 23 406
Percentage PSE 22 14 16 16 11
Producer NPC 1.14 1.06 1.08 1.07 1.03
Producer NAC 1.29 1.17 1.19 1.19 1.12
OECD3 USD mn 241 932 280 247 291 976 280 998 267 768
EUR mn 219 894 225 027 235 001 226 096 213 985
Percentage PSE 38 29 30 29 27
Producer NPC 1.51 1.25 1.29 1.25 1.21
Producer NAC 1.60 1.41 1.44 1.41 1.38
1. EU12 for 1986-94 including ex-GDR from 1990; EU15 for 1995-2003; EU25 from 2004.2. For Mexico, 1986-88 is replaced by 1991-93.3. Austria, Finland and Sweden are included in the OECD total for all years and in the EU from 1995. The Czech
Republic, Hungary, Poland and the Slovak Republic are included in the OECD total for all years and in the EUfrom 2004. The OECD total does not include the six non-OECD EU member states.
p: provisional. NPC: Nominal Protection Coefficient. NAC: Nominal Assistance Coefficient.Source: OECD, PSE/CSE database, 2007.
1 2 http://dx.doi.org/10.1787/076044480211
Table III.1. OECD: Producer Support Estimate by country (cont.)
1986-88 2004-06 2004 2005 2006p
AGRICULTURAL POLICIES IN OECD COUNTRIES: MONITORING AND EVALUATION 2007 – ISBN 978-92-64-02746-6 – © OECD 2007 243
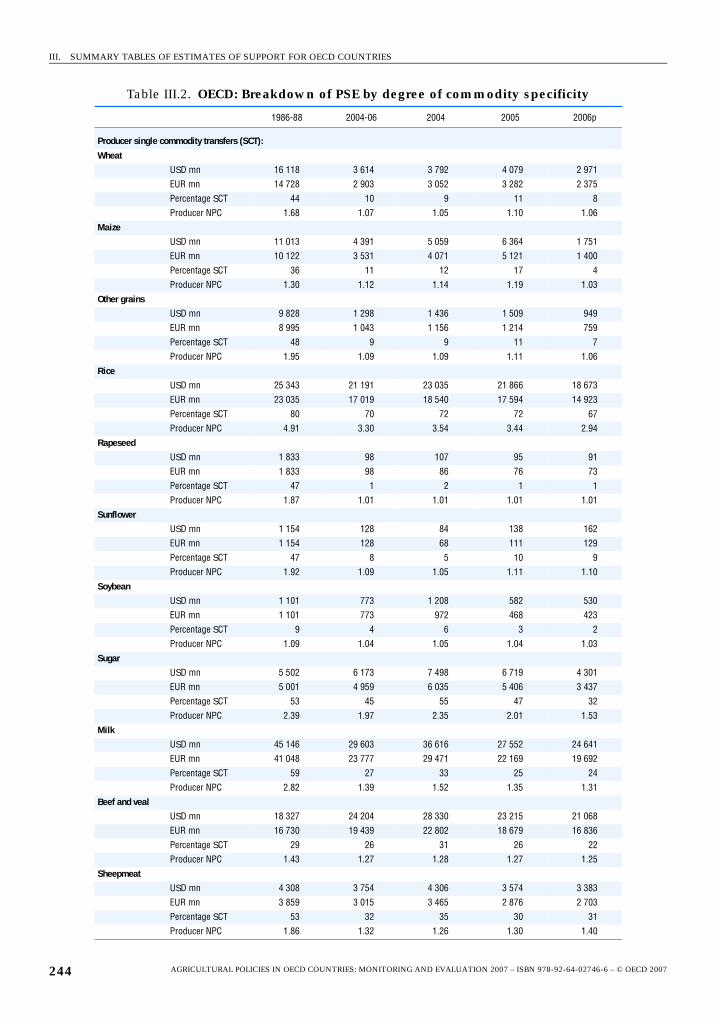
III. SUMMARY TABLES OF ESTIMATES OF SUPPORT FOR OECD COUNTRIES
Table III.2. OECD: Breakdown of PSE by degree of commodity specificity
1986-88 2004-06 2004 2005 2006p
Producer single commodity transfers (SCT):
Wheat
USD mn 16 118 3 614 3 792 4 079 2 971
EUR mn 14 728 2 903 3 052 3 282 2 375
Percentage SCT 44 10 9 11 8
Producer NPC 1.68 1.07 1.05 1.10 1.06
Maize
USD mn 11 013 4 391 5 059 6 364 1 751
EUR mn 10 122 3 531 4 071 5 121 1 400
Percentage SCT 36 11 12 17 4
Producer NPC 1.30 1.12 1.14 1.19 1.03
Other grains
USD mn 9 828 1 298 1 436 1 509 949
EUR mn 8 995 1 043 1 156 1 214 759
Percentage SCT 48 9 9 11 7
Producer NPC 1.95 1.09 1.09 1.11 1.06
Rice
USD mn 25 343 21 191 23 035 21 866 18 673
EUR mn 23 035 17 019 18 540 17 594 14 923
Percentage SCT 80 70 72 72 67
Producer NPC 4.91 3.30 3.54 3.44 2.94
Rapeseed
USD mn 1 833 98 107 95 91
EUR mn 1 833 98 86 76 73
Percentage SCT 47 1 2 1 1
Producer NPC 1.87 1.01 1.01 1.01 1.01
Sunflower
USD mn 1 154 128 84 138 162
EUR mn 1 154 128 68 111 129
Percentage SCT 47 8 5 10 9
Producer NPC 1.92 1.09 1.05 1.11 1.10
Soybean
USD mn 1 101 773 1 208 582 530
EUR mn 1 101 773 972 468 423
Percentage SCT 9 4 6 3 2
Producer NPC 1.09 1.04 1.05 1.04 1.03
Sugar
USD mn 5 502 6 173 7 498 6 719 4 301
EUR mn 5 001 4 959 6 035 5 406 3 437
Percentage SCT 53 45 55 47 32
Producer NPC 2.39 1.97 2.35 2.01 1.53
Milk
USD mn 45 146 29 603 36 616 27 552 24 641
EUR mn 41 048 23 777 29 471 22 169 19 692
Percentage SCT 59 27 33 25 24
Producer NPC 2.82 1.39 1.52 1.35 1.31
Beef and veal
USD mn 18 327 24 204 28 330 23 215 21 068
EUR mn 16 730 19 439 22 802 18 679 16 836
Percentage SCT 29 26 31 26 22
Producer NPC 1.43 1.27 1.28 1.27 1.25
Sheepmeat
USD mn 4 308 3 754 4 306 3 574 3 383
EUR mn 3 859 3 015 3 465 2 876 2 703
Percentage SCT 53 32 35 30 31
Producer NPC 1.86 1.32 1.26 1.30 1.40
AGRICULTURAL POLICIES IN OECD COUNTRIES: MONITORING AND EVALUATION 2007 – ISBN 978-92-64-02746-6 – © OECD 2007244
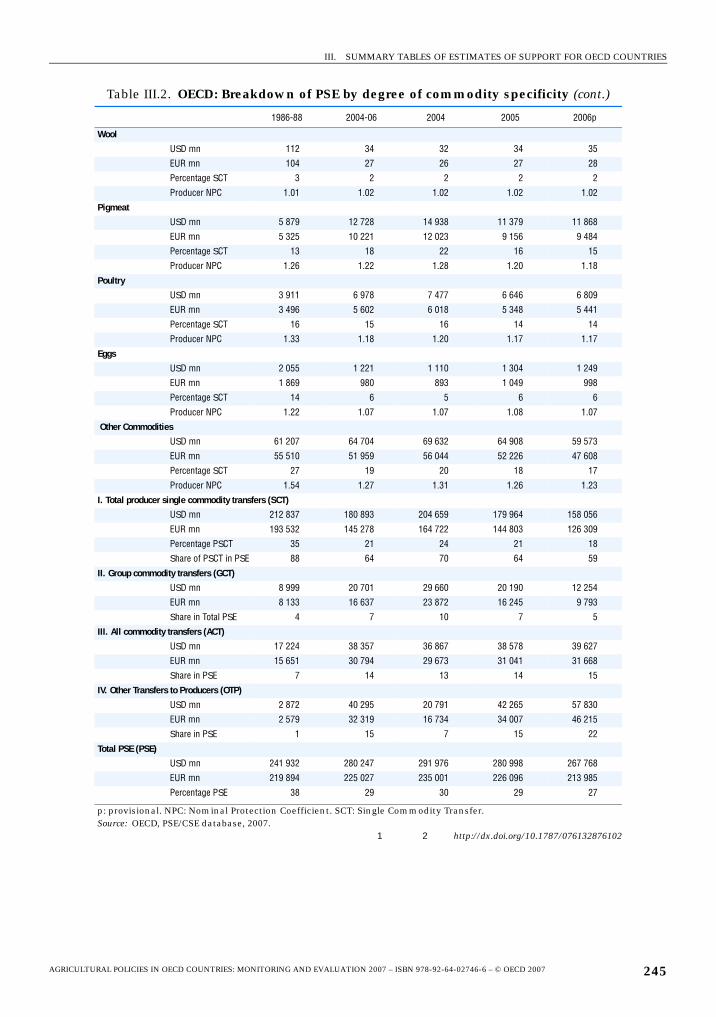
III. SUMMARY TABLES OF ESTIMATES OF SUPPORT FOR OECD COUNTRIES
Wool
USD mn 112 34 32 34 35
EUR mn 104 27 26 27 28
Percentage SCT 3 2 2 2 2
Producer NPC 1.01 1.02 1.02 1.02 1.02
Pigmeat
USD mn 5 879 12 728 14 938 11 379 11 868
EUR mn 5 325 10 221 12 023 9 156 9 484
Percentage SCT 13 18 22 16 15
Producer NPC 1.26 1.22 1.28 1.20 1.18
Poultry
USD mn 3 911 6 978 7 477 6 646 6 809
EUR mn 3 496 5 602 6 018 5 348 5 441
Percentage SCT 16 15 16 14 14
Producer NPC 1.33 1.18 1.20 1.17 1.17
Eggs
USD mn 2 055 1 221 1 110 1 304 1 249
EUR mn 1 869 980 893 1 049 998
Percentage SCT 14 6 5 6 6
Producer NPC 1.22 1.07 1.07 1.08 1.07
Other Commodities
USD mn 61 207 64 704 69 632 64 908 59 573
EUR mn 55 510 51 959 56 044 52 226 47 608
Percentage SCT 27 19 20 18 17
Producer NPC 1.54 1.27 1.31 1.26 1.23
I. Total producer single commodity transfers (SCT)
USD mn 212 837 180 893 204 659 179 964 158 056
EUR mn 193 532 145 278 164 722 144 803 126 309
Percentage PSCT 35 21 24 21 18
Share of PSCT in PSE 88 64 70 64 59
II. Group commodity transfers (GCT)
USD mn 8 999 20 701 29 660 20 190 12 254
EUR mn 8 133 16 637 23 872 16 245 9 793
Share in Total PSE 4 7 10 7 5
III. All commodity transfers (ACT)
USD mn 17 224 38 357 36 867 38 578 39 627
EUR mn 15 651 30 794 29 673 31 041 31 668
Share in PSE 7 14 13 14 15
IV. Other Transfers to Producers (OTP)
USD mn 2 872 40 295 20 791 42 265 57 830
EUR mn 2 579 32 319 16 734 34 007 46 215
Share in PSE 1 15 7 15 22
Total PSE (PSE)
USD mn 241 932 280 247 291 976 280 998 267 768
EUR mn 219 894 225 027 235 001 226 096 213 985
Percentage PSE 38 29 30 29 27
p: provisional. NPC: Nominal Protection Coefficient. SCT: Single Commodity Transfer.Source: OECD, PSE/CSE database, 2007.
1 2 http://dx.doi.org/10.1787/076132876102
Table III.2. OECD: Breakdown of PSE by degree of commodity specificity (cont.)
1986-88 2004-06 2004 2005 2006p
AGRICULTURAL POLICIES IN OECD COUNTRIES: MONITORING AND EVALUATION 2007 – ISBN 978-92-64-02746-6 – © OECD 2007 245
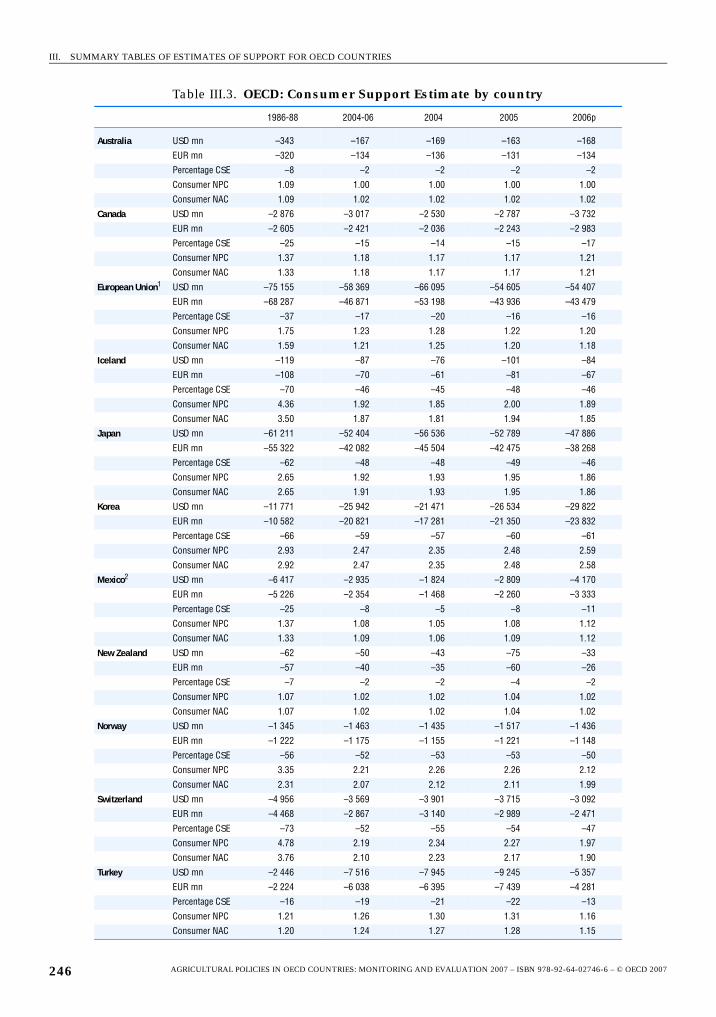
III. SUMMARY TABLES OF ESTIMATES OF SUPPORT FOR OECD COUNTRIES
Table III.3. OECD: Consumer Support Estimate by country
1986-88 2004-06 2004 2005 2006p
Australia USD mn –343 –167 –169 –163 –168
EUR mn –320 –134 –136 –131 –134
Percentage CSE –8 –2 –2 –2 –2
Consumer NPC 1.09 1.00 1.00 1.00 1.00
Consumer NAC 1.09 1.02 1.02 1.02 1.02
Canada USD mn –2 876 –3 017 –2 530 –2 787 –3 732
EUR mn –2 605 –2 421 –2 036 –2 243 –2 983
Percentage CSE –25 –15 –14 –15 –17
Consumer NPC 1.37 1.18 1.17 1.17 1.21
Consumer NAC 1.33 1.18 1.17 1.17 1.21
European Union1 USD mn –75 155 –58 369 –66 095 –54 605 –54 407
EUR mn –68 287 –46 871 –53 198 –43 936 –43 479
Percentage CSE –37 –17 –20 –16 –16
Consumer NPC 1.75 1.23 1.28 1.22 1.20
Consumer NAC 1.59 1.21 1.25 1.20 1.18
Iceland USD mn –119 –87 –76 –101 –84
EUR mn –108 –70 –61 –81 –67
Percentage CSE –70 –46 –45 –48 –46
Consumer NPC 4.36 1.92 1.85 2.00 1.89
Consumer NAC 3.50 1.87 1.81 1.94 1.85
Japan USD mn –61 211 –52 404 –56 536 –52 789 –47 886
EUR mn –55 322 –42 082 –45 504 –42 475 –38 268
Percentage CSE –62 –48 –48 –49 –46
Consumer NPC 2.65 1.92 1.93 1.95 1.86
Consumer NAC 2.65 1.91 1.93 1.95 1.86
Korea USD mn –11 771 –25 942 –21 471 –26 534 –29 822
EUR mn –10 582 –20 821 –17 281 –21 350 –23 832
Percentage CSE –66 –59 –57 –60 –61
Consumer NPC 2.93 2.47 2.35 2.48 2.59
Consumer NAC 2.92 2.47 2.35 2.48 2.58
Mexico2 USD mn –6 417 –2 935 –1 824 –2 809 –4 170
EUR mn –5 226 –2 354 –1 468 –2 260 –3 333
Percentage CSE –25 –8 –5 –8 –11
Consumer NPC 1.37 1.08 1.05 1.08 1.12
Consumer NAC 1.33 1.09 1.06 1.09 1.12
New Zealand USD mn –62 –50 –43 –75 –33
EUR mn –57 –40 –35 –60 –26
Percentage CSE –7 –2 –2 –4 –2
Consumer NPC 1.07 1.02 1.02 1.04 1.02
Consumer NAC 1.07 1.02 1.02 1.04 1.02
Norway USD mn –1 345 –1 463 –1 435 –1 517 –1 436
EUR mn –1 222 –1 175 –1 155 –1 221 –1 148
Percentage CSE –56 –52 –53 –53 –50
Consumer NPC 3.35 2.21 2.26 2.26 2.12
Consumer NAC 2.31 2.07 2.12 2.11 1.99
Switzerland USD mn –4 956 –3 569 –3 901 –3 715 –3 092
EUR mn –4 468 –2 867 –3 140 –2 989 –2 471
Percentage CSE –73 –52 –55 –54 –47
Consumer NPC 4.78 2.19 2.34 2.27 1.97
Consumer NAC 3.76 2.10 2.23 2.17 1.90
Turkey USD mn –2 446 –7 516 –7 945 –9 245 –5 357
EUR mn –2 224 –6 038 –6 395 –7 439 –4 281
Percentage CSE –16 –19 –21 –22 –13
Consumer NPC 1.21 1.26 1.30 1.31 1.16
Consumer NAC 1.20 1.24 1.27 1.28 1.15
AGRICULTURAL POLICIES IN OECD COUNTRIES: MONITORING AND EVALUATION 2007 – ISBN 978-92-64-02746-6 – © OECD 2007246
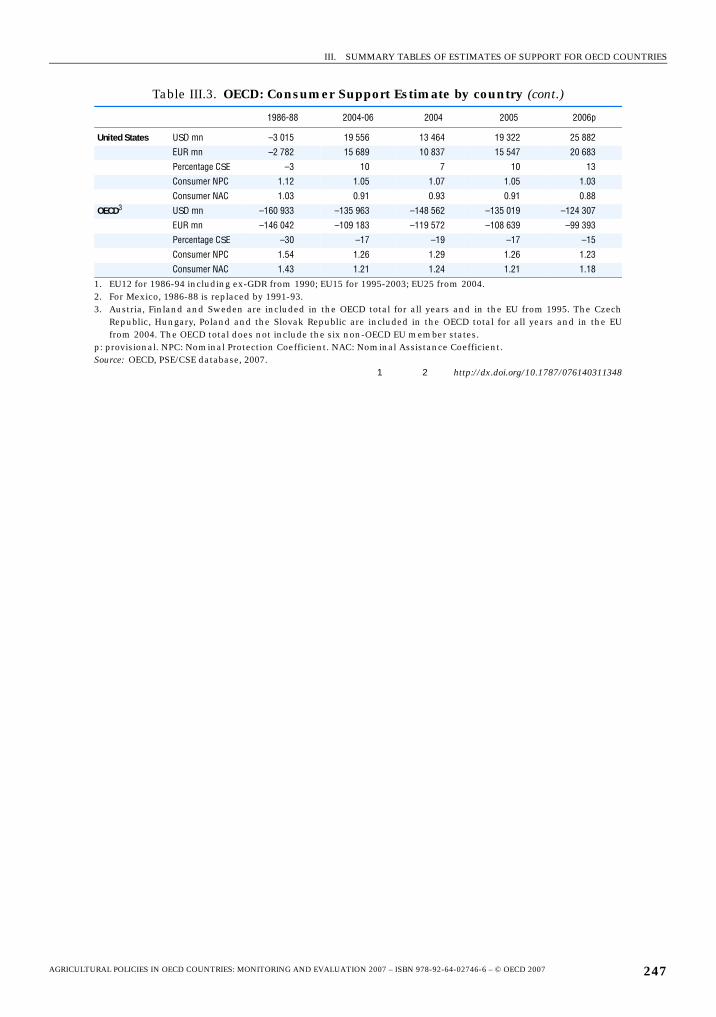
III. SUMMARY TABLES OF ESTIMATES OF SUPPORT FOR OECD COUNTRIES
United States USD mn –3 015 19 556 13 464 19 322 25 882
EUR mn –2 782 15 689 10 837 15 547 20 683
Percentage CSE –3 10 7 10 13
Consumer NPC 1.12 1.05 1.07 1.05 1.03
Consumer NAC 1.03 0.91 0.93 0.91 0.88
OECD3 USD mn –160 933 –135 963 –148 562 –135 019 –124 307
EUR mn –146 042 –109 183 –119 572 –108 639 –99 393
Percentage CSE –30 –17 –19 –17 –15
Consumer NPC 1.54 1.26 1.29 1.26 1.23
Consumer NAC 1.43 1.21 1.24 1.21 1.18
1. EU12 for 1986-94 including ex-GDR from 1990; EU15 for 1995-2003; EU25 from 2004.2. For Mexico, 1986-88 is replaced by 1991-93.3. Austria, Finland and Sweden are included in the OECD total for all years and in the EU from 1995. The Czech
Republic, Hungary, Poland and the Slovak Republic are included in the OECD total for all years and in the EUfrom 2004. The OECD total does not include the six non-OECD EU member states.
p: provisional. NPC: Nominal Protection Coefficient. NAC: Nominal Assistance Coefficient.Source: OECD, PSE/CSE database, 2007.
1 2 http://dx.doi.org/10.1787/076140311348
Table III.3. OECD: Consumer Support Estimate by country (cont.)
1986-88 2004-06 2004 2005 2006p
AGRICULTURAL POLICIES IN OECD COUNTRIES: MONITORING AND EVALUATION 2007 – ISBN 978-92-64-02746-6 – © OECD 2007 247
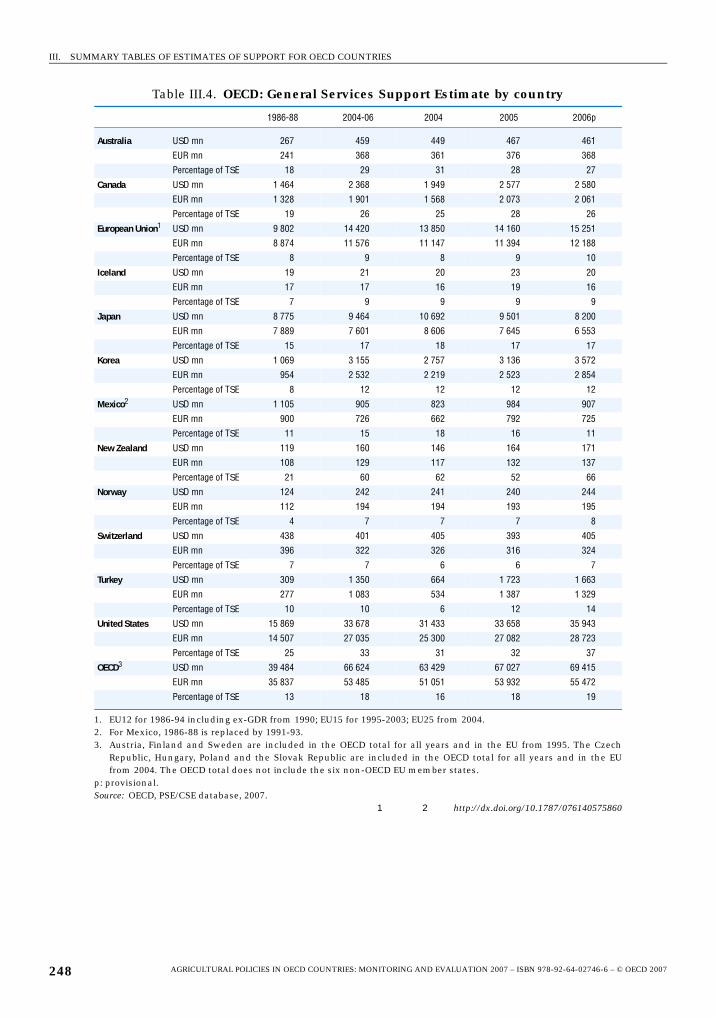
III. SUMMARY TABLES OF ESTIMATES OF SUPPORT FOR OECD COUNTRIES
Table III.4. OECD: General Services Support Estimate by country
1986-88 2004-06 2004 2005 2006p
Australia USD mn 267 459 449 467 461
EUR mn 241 368 361 376 368
Percentage of TSE 18 29 31 28 27
Canada USD mn 1 464 2 368 1 949 2 577 2 580
EUR mn 1 328 1 901 1 568 2 073 2 061
Percentage of TSE 19 26 25 28 26
European Union1 USD mn 9 802 14 420 13 850 14 160 15 251
EUR mn 8 874 11 576 11 147 11 394 12 188
Percentage of TSE 8 9 8 9 10
Iceland USD mn 19 21 20 23 20
EUR mn 17 17 16 19 16
Percentage of TSE 7 9 9 9 9
Japan USD mn 8 775 9 464 10 692 9 501 8 200
EUR mn 7 889 7 601 8 606 7 645 6 553
Percentage of TSE 15 17 18 17 17
Korea USD mn 1 069 3 155 2 757 3 136 3 572
EUR mn 954 2 532 2 219 2 523 2 854
Percentage of TSE 8 12 12 12 12
Mexico2 USD mn 1 105 905 823 984 907
EUR mn 900 726 662 792 725
Percentage of TSE 11 15 18 16 11
New Zealand USD mn 119 160 146 164 171
EUR mn 108 129 117 132 137
Percentage of TSE 21 60 62 52 66
Norway USD mn 124 242 241 240 244
EUR mn 112 194 194 193 195
Percentage of TSE 4 7 7 7 8
Switzerland USD mn 438 401 405 393 405
EUR mn 396 322 326 316 324
Percentage of TSE 7 7 6 6 7
Turkey USD mn 309 1 350 664 1 723 1 663
EUR mn 277 1 083 534 1 387 1 329
Percentage of TSE 10 10 6 12 14
United States USD mn 15 869 33 678 31 433 33 658 35 943
EUR mn 14 507 27 035 25 300 27 082 28 723
Percentage of TSE 25 33 31 32 37
OECD3 USD mn 39 484 66 624 63 429 67 027 69 415
EUR mn 35 837 53 485 51 051 53 932 55 472
Percentage of TSE 13 18 16 18 19
1. EU12 for 1986-94 including ex-GDR from 1990; EU15 for 1995-2003; EU25 from 2004.2. For Mexico, 1986-88 is replaced by 1991-93.3. Austria, Finland and Sweden are included in the OECD total for all years and in the EU from 1995. The Czech
Republic, Hungary, Poland and the Slovak Republic are included in the OECD total for all years and in the EUfrom 2004. The OECD total does not include the six non-OECD EU member states.
p: provisional.Source: OECD, PSE/CSE database, 2007.
1 2 http://dx.doi.org/10.1787/076140575860
AGRICULTURAL POLICIES IN OECD COUNTRIES: MONITORING AND EVALUATION 2007 – ISBN 978-92-64-02746-6 – © OECD 2007248
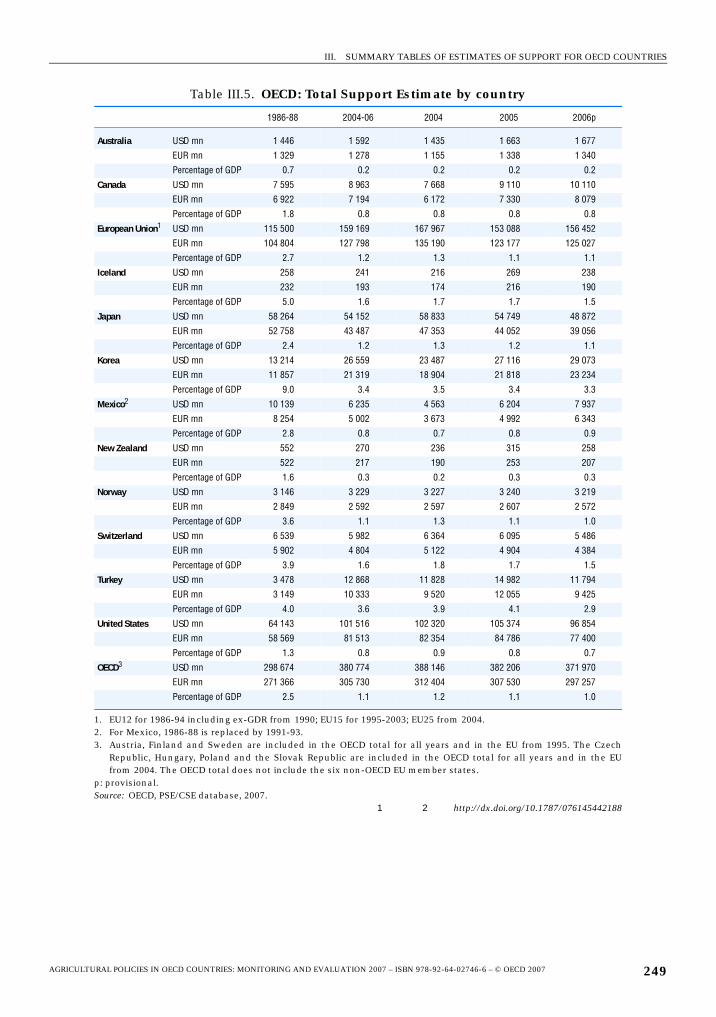
III. SUMMARY TABLES OF ESTIMATES OF SUPPORT FOR OECD COUNTRIES
Table III.5. OECD: Total Support Estimate by country
1986-88 2004-06 2004 2005 2006p
Australia USD mn 1 446 1 592 1 435 1 663 1 677
EUR mn 1 329 1 278 1 155 1 338 1 340
Percentage of GDP 0.7 0.2 0.2 0.2 0.2
Canada USD mn 7 595 8 963 7 668 9 110 10 110
EUR mn 6 922 7 194 6 172 7 330 8 079
Percentage of GDP 1.8 0.8 0.8 0.8 0.8
European Union1 USD mn 115 500 159 169 167 967 153 088 156 452
EUR mn 104 804 127 798 135 190 123 177 125 027
Percentage of GDP 2.7 1.2 1.3 1.1 1.1
Iceland USD mn 258 241 216 269 238
EUR mn 232 193 174 216 190
Percentage of GDP 5.0 1.6 1.7 1.7 1.5
Japan USD mn 58 264 54 152 58 833 54 749 48 872
EUR mn 52 758 43 487 47 353 44 052 39 056
Percentage of GDP 2.4 1.2 1.3 1.2 1.1
Korea USD mn 13 214 26 559 23 487 27 116 29 073
EUR mn 11 857 21 319 18 904 21 818 23 234
Percentage of GDP 9.0 3.4 3.5 3.4 3.3
Mexico2 USD mn 10 139 6 235 4 563 6 204 7 937
EUR mn 8 254 5 002 3 673 4 992 6 343
Percentage of GDP 2.8 0.8 0.7 0.8 0.9
New Zealand USD mn 552 270 236 315 258
EUR mn 522 217 190 253 207
Percentage of GDP 1.6 0.3 0.2 0.3 0.3
Norway USD mn 3 146 3 229 3 227 3 240 3 219
EUR mn 2 849 2 592 2 597 2 607 2 572
Percentage of GDP 3.6 1.1 1.3 1.1 1.0
Switzerland USD mn 6 539 5 982 6 364 6 095 5 486
EUR mn 5 902 4 804 5 122 4 904 4 384
Percentage of GDP 3.9 1.6 1.8 1.7 1.5
Turkey USD mn 3 478 12 868 11 828 14 982 11 794
EUR mn 3 149 10 333 9 520 12 055 9 425
Percentage of GDP 4.0 3.6 3.9 4.1 2.9
United States USD mn 64 143 101 516 102 320 105 374 96 854
EUR mn 58 569 81 513 82 354 84 786 77 400
Percentage of GDP 1.3 0.8 0.9 0.8 0.7
OECD3 USD mn 298 674 380 774 388 146 382 206 371 970
EUR mn 271 366 305 730 312 404 307 530 297 257
Percentage of GDP 2.5 1.1 1.2 1.1 1.0
1. EU12 for 1986-94 including ex-GDR from 1990; EU15 for 1995-2003; EU25 from 2004.2. For Mexico, 1986-88 is replaced by 1991-93.3. Austria, Finland and Sweden are included in the OECD total for all years and in the EU from 1995. The Czech
Republic, Hungary, Poland and the Slovak Republic are included in the OECD total for all years and in the EUfrom 2004. The OECD total does not include the six non-OECD EU member states.
p: provisional.Source: OECD, PSE/CSE database, 2007.
1 2 http://dx.doi.org/10.1787/076145442188
AGRICULTURAL POLICIES IN OECD COUNTRIES: MONITORING AND EVALUATION 2007 – ISBN 978-92-64-02746-6 – © OECD 2007 249
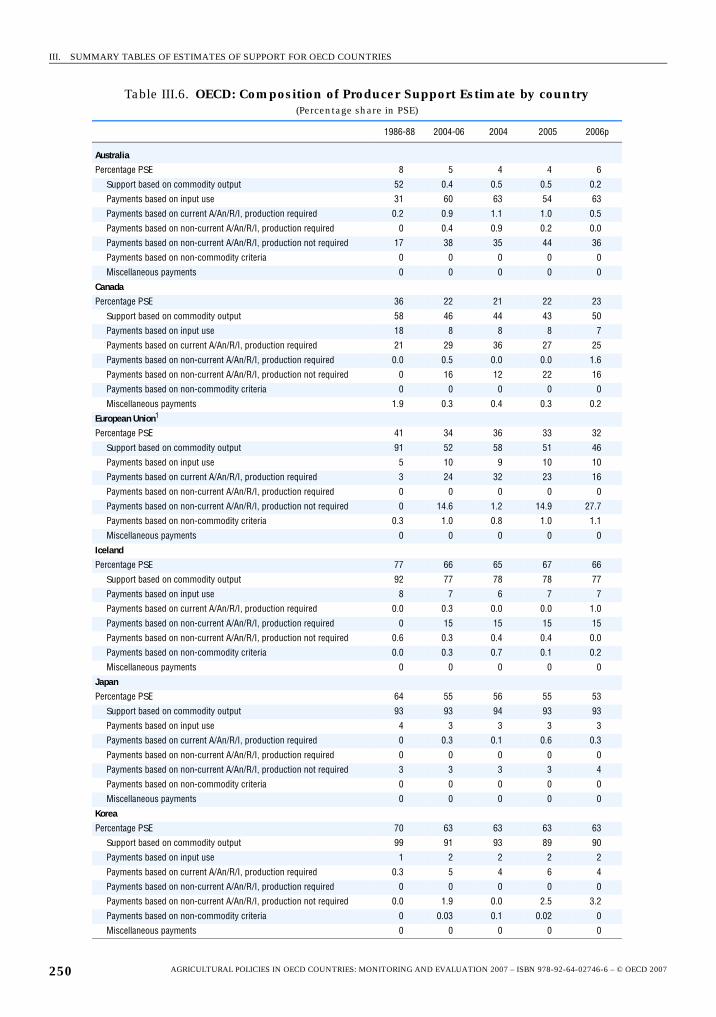
III. SUMMARY TABLES OF ESTIMATES OF SUPPORT FOR OECD COUNTRIES
Table III.6. OECD: Composition of Producer Support Estimate by country(Percentage share in PSE)
1986-88 2004-06 2004 2005 2006p
Australia
Percentage PSE 8 5 4 4 6
Support based on commodity output 52 0.4 0.5 0.5 0.2
Payments based on input use 31 60 63 54 63
Payments based on current A/An/R/I, production required 0.2 0.9 1.1 1.0 0.5
Payments based on non-current A/An/R/I, production required 0 0.4 0.9 0.2 0.0
Payments based on non-current A/An/R/I, production not required 17 38 35 44 36
Payments based on non-commodity criteria 0 0 0 0 0
Miscellaneous payments 0 0 0 0 0
Canada
Percentage PSE 36 22 21 22 23
Support based on commodity output 58 46 44 43 50
Payments based on input use 18 8 8 8 7
Payments based on current A/An/R/I, production required 21 29 36 27 25
Payments based on non-current A/An/R/I, production required 0.0 0.5 0.0 0.0 1.6
Payments based on non-current A/An/R/I, production not required 0 16 12 22 16
Payments based on non-commodity criteria 0 0 0 0 0
Miscellaneous payments 1.9 0.3 0.4 0.3 0.2
European Union1
Percentage PSE 41 34 36 33 32
Support based on commodity output 91 52 58 51 46
Payments based on input use 5 10 9 10 10
Payments based on current A/An/R/I, production required 3 24 32 23 16
Payments based on non-current A/An/R/I, production required 0 0 0 0 0
Payments based on non-current A/An/R/I, production not required 0 14.6 1.2 14.9 27.7
Payments based on non-commodity criteria 0.3 1.0 0.8 1.0 1.1
Miscellaneous payments 0 0 0 0 0
Iceland
Percentage PSE 77 66 65 67 66
Support based on commodity output 92 77 78 78 77
Payments based on input use 8 7 6 7 7
Payments based on current A/An/R/I, production required 0.0 0.3 0.0 0.0 1.0
Payments based on non-current A/An/R/I, production required 0 15 15 15 15
Payments based on non-current A/An/R/I, production not required 0.6 0.3 0.4 0.4 0.0
Payments based on non-commodity criteria 0.0 0.3 0.7 0.1 0.2
Miscellaneous payments 0 0 0 0 0
Japan
Percentage PSE 64 55 56 55 53
Support based on commodity output 93 93 94 93 93
Payments based on input use 4 3 3 3 3
Payments based on current A/An/R/I, production required 0 0.3 0.1 0.6 0.3
Payments based on non-current A/An/R/I, production required 0 0 0 0 0
Payments based on non-current A/An/R/I, production not required 3 3 3 3 4
Payments based on non-commodity criteria 0 0 0 0 0
Miscellaneous payments 0 0 0 0 0
Korea
Percentage PSE 70 63 63 63 63
Support based on commodity output 99 91 93 89 90
Payments based on input use 1 2 2 2 2
Payments based on current A/An/R/I, production required 0.3 5 4 6 4
Payments based on non-current A/An/R/I, production required 0 0 0 0 0
Payments based on non-current A/An/R/I, production not required 0.0 1.9 0.0 2.5 3.2
Payments based on non-commodity criteria 0 0.03 0.1 0.02 0
Miscellaneous payments 0 0 0 0 0
AGRICULTURAL POLICIES IN OECD COUNTRIES: MONITORING AND EVALUATION 2007 – ISBN 978-92-64-02746-6 – © OECD 2007250
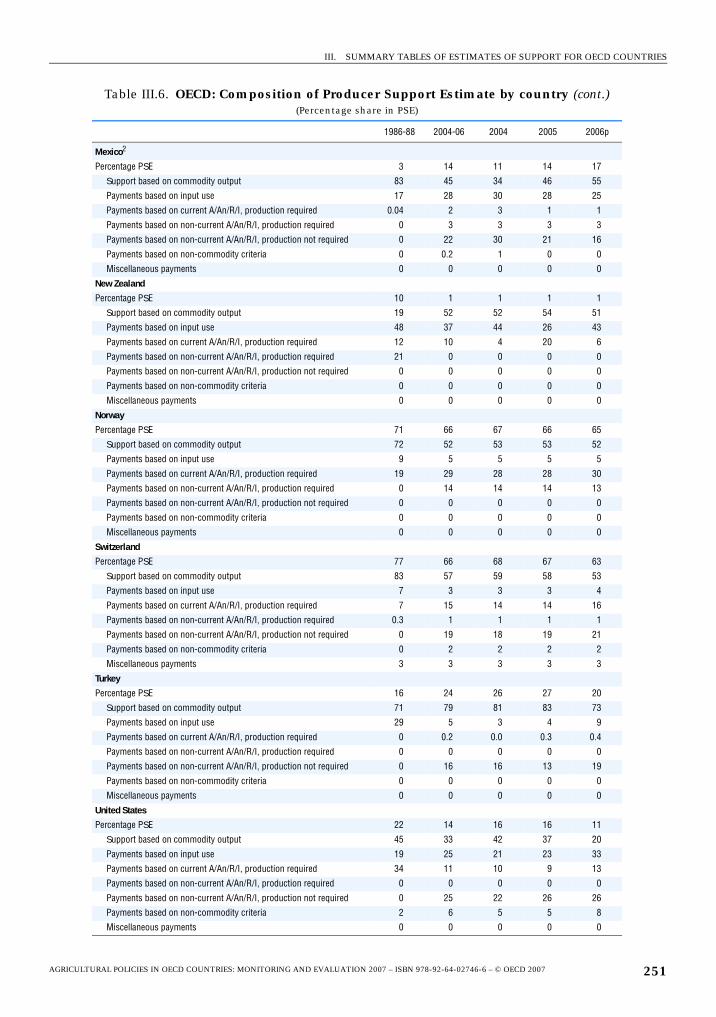
III. SUMMARY TABLES OF ESTIMATES OF SUPPORT FOR OECD COUNTRIES
Mexico2
Percentage PSE 3 14 11 14 17
Support based on commodity output 83 45 34 46 55
Payments based on input use 17 28 30 28 25
Payments based on current A/An/R/I, production required 0.04 2 3 1 1
Payments based on non-current A/An/R/I, production required 0 3 3 3 3
Payments based on non-current A/An/R/I, production not required 0 22 30 21 16
Payments based on non-commodity criteria 0 0.2 1 0 0
Miscellaneous payments 0 0 0 0 0
New Zealand
Percentage PSE 10 1 1 1 1
Support based on commodity output 19 52 52 54 51
Payments based on input use 48 37 44 26 43
Payments based on current A/An/R/I, production required 12 10 4 20 6
Payments based on non-current A/An/R/I, production required 21 0 0 0 0
Payments based on non-current A/An/R/I, production not required 0 0 0 0 0
Payments based on non-commodity criteria 0 0 0 0 0
Miscellaneous payments 0 0 0 0 0
Norway
Percentage PSE 71 66 67 66 65
Support based on commodity output 72 52 53 53 52
Payments based on input use 9 5 5 5 5
Payments based on current A/An/R/I, production required 19 29 28 28 30
Payments based on non-current A/An/R/I, production required 0 14 14 14 13
Payments based on non-current A/An/R/I, production not required 0 0 0 0 0
Payments based on non-commodity criteria 0 0 0 0 0
Miscellaneous payments 0 0 0 0 0
Switzerland
Percentage PSE 77 66 68 67 63
Support based on commodity output 83 57 59 58 53
Payments based on input use 7 3 3 3 4
Payments based on current A/An/R/I, production required 7 15 14 14 16
Payments based on non-current A/An/R/I, production required 0.3 1 1 1 1
Payments based on non-current A/An/R/I, production not required 0 19 18 19 21
Payments based on non-commodity criteria 0 2 2 2 2
Miscellaneous payments 3 3 3 3 3
Turkey
Percentage PSE 16 24 26 27 20
Support based on commodity output 71 79 81 83 73
Payments based on input use 29 5 3 4 9
Payments based on current A/An/R/I, production required 0 0.2 0.0 0.3 0.4
Payments based on non-current A/An/R/I, production required 0 0 0 0 0
Payments based on non-current A/An/R/I, production not required 0 16 16 13 19
Payments based on non-commodity criteria 0 0 0 0 0
Miscellaneous payments 0 0 0 0 0
United States
Percentage PSE 22 14 16 16 11
Support based on commodity output 45 33 42 37 20
Payments based on input use 19 25 21 23 33
Payments based on current A/An/R/I, production required 34 11 10 9 13
Payments based on non-current A/An/R/I, production required 0 0 0 0 0
Payments based on non-current A/An/R/I, production not required 0 25 22 26 26
Payments based on non-commodity criteria 2 6 5 5 8
Miscellaneous payments 0 0 0 0 0
Table III.6. OECD: Composition of Producer Support Estimate by country (cont.)(Percentage share in PSE)
1986-88 2004-06 2004 2005 2006p
AGRICULTURAL POLICIES IN OECD COUNTRIES: MONITORING AND EVALUATION 2007 – ISBN 978-92-64-02746-6 – © OECD 2007 251
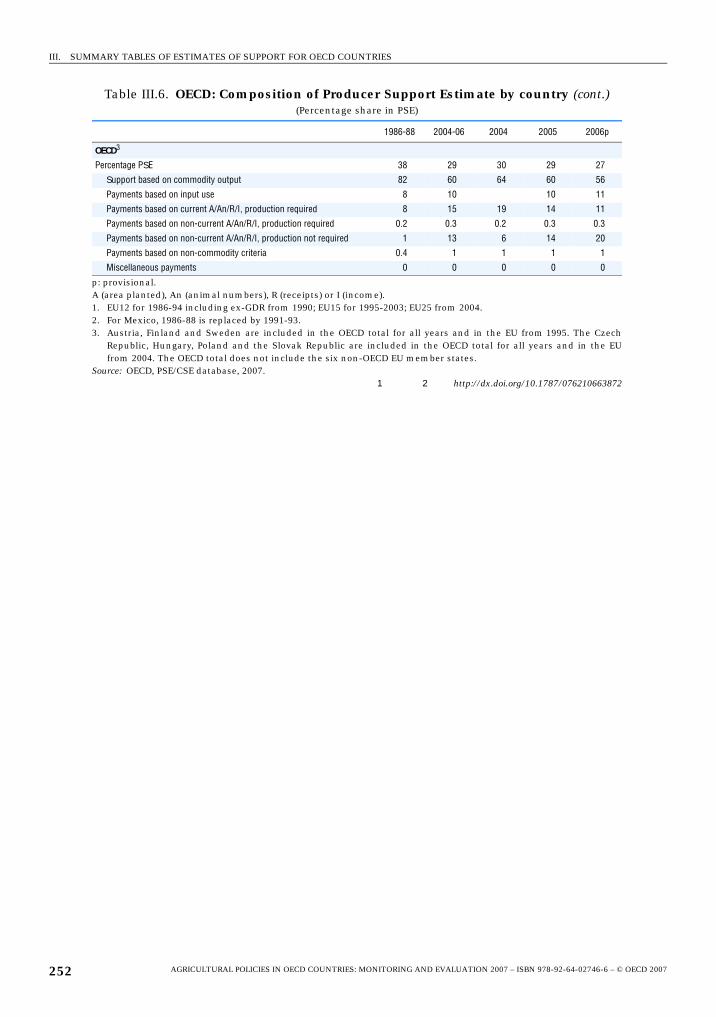
III. SUMMARY TABLES OF ESTIMATES OF SUPPORT FOR OECD COUNTRIES
OECD3
Percentage PSE 38 29 30 29 27
Support based on commodity output 82 60 64 60 56
Payments based on input use 8 10 10 11
Payments based on current A/An/R/I, production required 8 15 19 14 11
Payments based on non-current A/An/R/I, production required 0.2 0.3 0.2 0.3 0.3
Payments based on non-current A/An/R/I, production not required 1 13 6 14 20
Payments based on non-commodity criteria 0.4 1 1 1 1
Miscellaneous payments 0 0 0 0 0
p: provisional.A (area planted), An (animal numbers), R (receipts) or I (income).1. EU12 for 1986-94 including ex-GDR from 1990; EU15 for 1995-2003; EU25 from 2004.2. For Mexico, 1986-88 is replaced by 1991-93.3. Austria, Finland and Sweden are included in the OECD total for all years and in the EU from 1995. The Czech
Republic, Hungary, Poland and the Slovak Republic are included in the OECD total for all years and in the EUfrom 2004. The OECD total does not include the six non-OECD EU member states.
Source: OECD, PSE/CSE database, 2007.1 2 http://dx.doi.org/10.1787/076210663872
Table III.6. OECD: Composition of Producer Support Estimate by country (cont.)(Percentage share in PSE)
1986-88 2004-06 2004 2005 2006p
AGRICULTURAL POLICIES IN OECD COUNTRIES: MONITORING AND EVALUATION 2007 – ISBN 978-92-64-02746-6 – © OECD 2007252
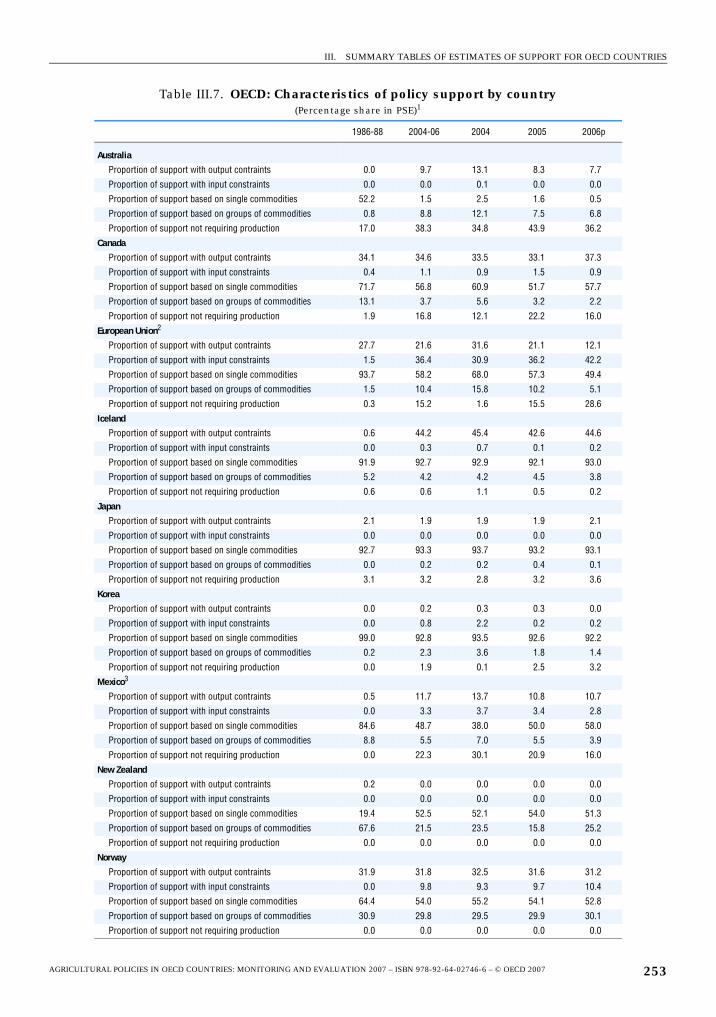
III. SUMMARY TABLES OF ESTIMATES OF SUPPORT FOR OECD COUNTRIES
Table III.7. OECD: Characteristics of policy support by country(Percentage share in PSE)1
1986-88 2004-06 2004 2005 2006p
Australia
Proportion of support with output contraints 0.0 9.7 13.1 8.3 7.7
Proportion of support with input constraints 0.0 0.0 0.1 0.0 0.0
Proportion of support based on single commodities 52.2 1.5 2.5 1.6 0.5
Proportion of support based on groups of commodities 0.8 8.8 12.1 7.5 6.8
Proportion of support not requiring production 17.0 38.3 34.8 43.9 36.2
Canada
Proportion of support with output contraints 34.1 34.6 33.5 33.1 37.3
Proportion of support with input constraints 0.4 1.1 0.9 1.5 0.9
Proportion of support based on single commodities 71.7 56.8 60.9 51.7 57.7
Proportion of support based on groups of commodities 13.1 3.7 5.6 3.2 2.2
Proportion of support not requiring production 1.9 16.8 12.1 22.2 16.0
European Union2
Proportion of support with output contraints 27.7 21.6 31.6 21.1 12.1
Proportion of support with input constraints 1.5 36.4 30.9 36.2 42.2
Proportion of support based on single commodities 93.7 58.2 68.0 57.3 49.4
Proportion of support based on groups of commodities 1.5 10.4 15.8 10.2 5.1
Proportion of support not requiring production 0.3 15.2 1.6 15.5 28.6
Iceland
Proportion of support with output contraints 0.6 44.2 45.4 42.6 44.6
Proportion of support with input constraints 0.0 0.3 0.7 0.1 0.2
Proportion of support based on single commodities 91.9 92.7 92.9 92.1 93.0
Proportion of support based on groups of commodities 5.2 4.2 4.2 4.5 3.8
Proportion of support not requiring production 0.6 0.6 1.1 0.5 0.2
Japan
Proportion of support with output contraints 2.1 1.9 1.9 1.9 2.1
Proportion of support with input constraints 0.0 0.0 0.0 0.0 0.0
Proportion of support based on single commodities 92.7 93.3 93.7 93.2 93.1
Proportion of support based on groups of commodities 0.0 0.2 0.2 0.4 0.1
Proportion of support not requiring production 3.1 3.2 2.8 3.2 3.6
Korea
Proportion of support with output contraints 0.0 0.2 0.3 0.3 0.0
Proportion of support with input constraints 0.0 0.8 2.2 0.2 0.2
Proportion of support based on single commodities 99.0 92.8 93.5 92.6 92.2
Proportion of support based on groups of commodities 0.2 2.3 3.6 1.8 1.4
Proportion of support not requiring production 0.0 1.9 0.1 2.5 3.2
Mexico3
Proportion of support with output contraints 0.5 11.7 13.7 10.8 10.7
Proportion of support with input constraints 0.0 3.3 3.7 3.4 2.8
Proportion of support based on single commodities 84.6 48.7 38.0 50.0 58.0
Proportion of support based on groups of commodities 8.8 5.5 7.0 5.5 3.9
Proportion of support not requiring production 0.0 22.3 30.1 20.9 16.0
New Zealand
Proportion of support with output contraints 0.2 0.0 0.0 0.0 0.0
Proportion of support with input constraints 0.0 0.0 0.0 0.0 0.0
Proportion of support based on single commodities 19.4 52.5 52.1 54.0 51.3
Proportion of support based on groups of commodities 67.6 21.5 23.5 15.8 25.2
Proportion of support not requiring production 0.0 0.0 0.0 0.0 0.0
Norway
Proportion of support with output contraints 31.9 31.8 32.5 31.6 31.2
Proportion of support with input constraints 0.0 9.8 9.3 9.7 10.4
Proportion of support based on single commodities 64.4 54.0 55.2 54.1 52.8
Proportion of support based on groups of commodities 30.9 29.8 29.5 29.9 30.1
Proportion of support not requiring production 0.0 0.0 0.0 0.0 0.0
AGRICULTURAL POLICIES IN OECD COUNTRIES: MONITORING AND EVALUATION 2007 – ISBN 978-92-64-02746-6 – © OECD 2007 253
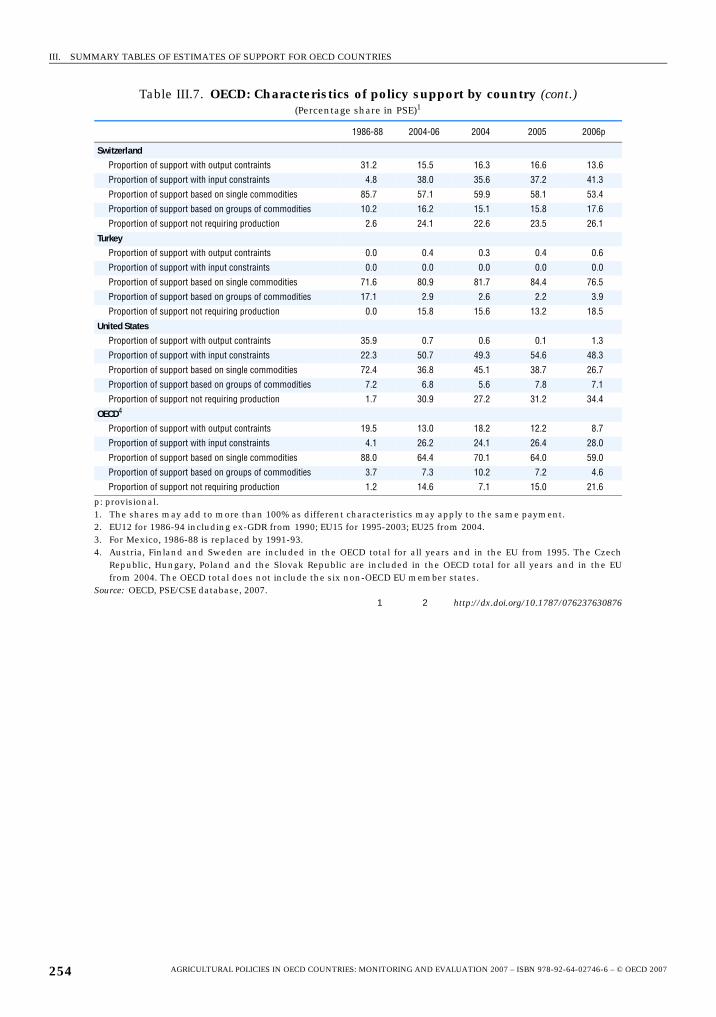
III. SUMMARY TABLES OF ESTIMATES OF SUPPORT FOR OECD COUNTRIES
Switzerland
Proportion of support with output contraints 31.2 15.5 16.3 16.6 13.6
Proportion of support with input constraints 4.8 38.0 35.6 37.2 41.3
Proportion of support based on single commodities 85.7 57.1 59.9 58.1 53.4
Proportion of support based on groups of commodities 10.2 16.2 15.1 15.8 17.6
Proportion of support not requiring production 2.6 24.1 22.6 23.5 26.1
Turkey
Proportion of support with output contraints 0.0 0.4 0.3 0.4 0.6
Proportion of support with input constraints 0.0 0.0 0.0 0.0 0.0
Proportion of support based on single commodities 71.6 80.9 81.7 84.4 76.5
Proportion of support based on groups of commodities 17.1 2.9 2.6 2.2 3.9
Proportion of support not requiring production 0.0 15.8 15.6 13.2 18.5
United States
Proportion of support with output contraints 35.9 0.7 0.6 0.1 1.3
Proportion of support with input constraints 22.3 50.7 49.3 54.6 48.3
Proportion of support based on single commodities 72.4 36.8 45.1 38.7 26.7
Proportion of support based on groups of commodities 7.2 6.8 5.6 7.8 7.1
Proportion of support not requiring production 1.7 30.9 27.2 31.2 34.4
OECD4
Proportion of support with output contraints 19.5 13.0 18.2 12.2 8.7
Proportion of support with input constraints 4.1 26.2 24.1 26.4 28.0
Proportion of support based on single commodities 88.0 64.4 70.1 64.0 59.0
Proportion of support based on groups of commodities 3.7 7.3 10.2 7.2 4.6
Proportion of support not requiring production 1.2 14.6 7.1 15.0 21.6
p: provisional.1. The shares may add to more than 100% as different characteristics may apply to the same payment.2. EU12 for 1986-94 including ex-GDR from 1990; EU15 for 1995-2003; EU25 from 2004.3. For Mexico, 1986-88 is replaced by 1991-93.4. Austria, Finland and Sweden are included in the OECD total for all years and in the EU from 1995. The Czech
Republic, Hungary, Poland and the Slovak Republic are included in the OECD total for all years and in the EUfrom 2004. The OECD total does not include the six non-OECD EU member states.
Source: OECD, PSE/CSE database, 2007.1 2 http://dx.doi.org/10.1787/076237630876
Table III.7. OECD: Characteristics of policy support by country (cont.)(Percentage share in PSE)1
1986-88 2004-06 2004 2005 2006p
AGRICULTURAL POLICIES IN OECD COUNTRIES: MONITORING AND EVALUATION 2007 – ISBN 978-92-64-02746-6 – © OECD 2007254
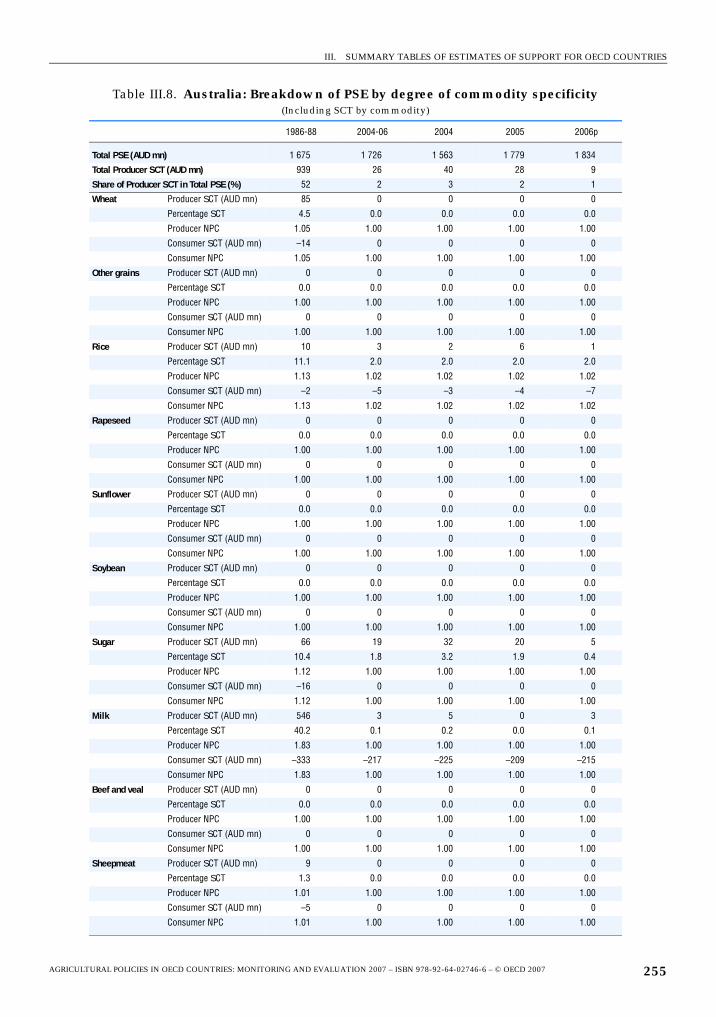
III. SUMMARY TABLES OF ESTIMATES OF SUPPORT FOR OECD COUNTRIES
Table III.8. Australia: Breakdown of PSE by degree of commodity specificity(Including SCT by commodity)
1986-88 2004-06 2004 2005 2006p
Total PSE (AUD mn) 1 675 1 726 1 563 1 779 1 834
Total Producer SCT (AUD mn) 939 26 40 28 9
Share of Producer SCT in Total PSE (%) 52 2 3 2 1
Wheat Producer SCT (AUD mn) 85 0 0 0 0
Percentage SCT 4.5 0.0 0.0 0.0 0.0
Producer NPC 1.05 1.00 1.00 1.00 1.00
Consumer SCT (AUD mn) –14 0 0 0 0
Consumer NPC 1.05 1.00 1.00 1.00 1.00
Other grains Producer SCT (AUD mn) 0 0 0 0 0
Percentage SCT 0.0 0.0 0.0 0.0 0.0
Producer NPC 1.00 1.00 1.00 1.00 1.00
Consumer SCT (AUD mn) 0 0 0 0 0
Consumer NPC 1.00 1.00 1.00 1.00 1.00
Rice Producer SCT (AUD mn) 10 3 2 6 1
Percentage SCT 11.1 2.0 2.0 2.0 2.0
Producer NPC 1.13 1.02 1.02 1.02 1.02
Consumer SCT (AUD mn) –2 –5 –3 –4 –7
Consumer NPC 1.13 1.02 1.02 1.02 1.02
Rapeseed Producer SCT (AUD mn) 0 0 0 0 0
Percentage SCT 0.0 0.0 0.0 0.0 0.0
Producer NPC 1.00 1.00 1.00 1.00 1.00
Consumer SCT (AUD mn) 0 0 0 0 0
Consumer NPC 1.00 1.00 1.00 1.00 1.00
Sunflower Producer SCT (AUD mn) 0 0 0 0 0
Percentage SCT 0.0 0.0 0.0 0.0 0.0
Producer NPC 1.00 1.00 1.00 1.00 1.00
Consumer SCT (AUD mn) 0 0 0 0 0
Consumer NPC 1.00 1.00 1.00 1.00 1.00
Soybean Producer SCT (AUD mn) 0 0 0 0 0
Percentage SCT 0.0 0.0 0.0 0.0 0.0
Producer NPC 1.00 1.00 1.00 1.00 1.00
Consumer SCT (AUD mn) 0 0 0 0 0
Consumer NPC 1.00 1.00 1.00 1.00 1.00
Sugar Producer SCT (AUD mn) 66 19 32 20 5
Percentage SCT 10.4 1.8 3.2 1.9 0.4
Producer NPC 1.12 1.00 1.00 1.00 1.00
Consumer SCT (AUD mn) –16 0 0 0 0
Consumer NPC 1.12 1.00 1.00 1.00 1.00
Milk Producer SCT (AUD mn) 546 3 5 0 3
Percentage SCT 40.2 0.1 0.2 0.0 0.1
Producer NPC 1.83 1.00 1.00 1.00 1.00
Consumer SCT (AUD mn) –333 –217 –225 –209 –215
Consumer NPC 1.83 1.00 1.00 1.00 1.00
Beef and veal Producer SCT (AUD mn) 0 0 0 0 0
Percentage SCT 0.0 0.0 0.0 0.0 0.0
Producer NPC 1.00 1.00 1.00 1.00 1.00
Consumer SCT (AUD mn) 0 0 0 0 0
Consumer NPC 1.00 1.00 1.00 1.00 1.00
Sheepmeat Producer SCT (AUD mn) 9 0 0 0 0
Percentage SCT 1.3 0.0 0.0 0.0 0.0
Producer NPC 1.01 1.00 1.00 1.00 1.00
Consumer SCT (AUD mn) –5 0 0 0 0
Consumer NPC 1.01 1.00 1.00 1.00 1.00
AGRICULTURAL POLICIES IN OECD COUNTRIES: MONITORING AND EVALUATION 2007 – ISBN 978-92-64-02746-6 – © OECD 2007 255
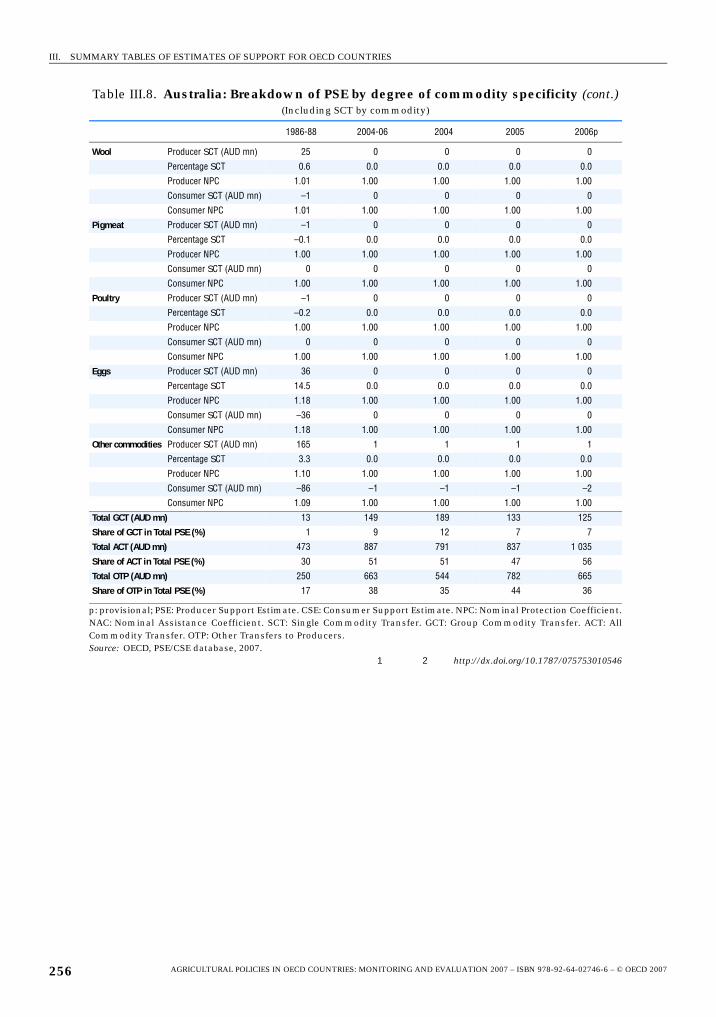
III. SUMMARY TABLES OF ESTIMATES OF SUPPORT FOR OECD COUNTRIES
Wool Producer SCT (AUD mn) 25 0 0 0 0
Percentage SCT 0.6 0.0 0.0 0.0 0.0
Producer NPC 1.01 1.00 1.00 1.00 1.00
Consumer SCT (AUD mn) –1 0 0 0 0
Consumer NPC 1.01 1.00 1.00 1.00 1.00
Pigmeat Producer SCT (AUD mn) –1 0 0 0 0
Percentage SCT –0.1 0.0 0.0 0.0 0.0
Producer NPC 1.00 1.00 1.00 1.00 1.00
Consumer SCT (AUD mn) 0 0 0 0 0
Consumer NPC 1.00 1.00 1.00 1.00 1.00
Poultry Producer SCT (AUD mn) –1 0 0 0 0
Percentage SCT –0.2 0.0 0.0 0.0 0.0
Producer NPC 1.00 1.00 1.00 1.00 1.00
Consumer SCT (AUD mn) 0 0 0 0 0
Consumer NPC 1.00 1.00 1.00 1.00 1.00
Eggs Producer SCT (AUD mn) 36 0 0 0 0
Percentage SCT 14.5 0.0 0.0 0.0 0.0
Producer NPC 1.18 1.00 1.00 1.00 1.00
Consumer SCT (AUD mn) –36 0 0 0 0
Consumer NPC 1.18 1.00 1.00 1.00 1.00
Other commodities Producer SCT (AUD mn) 165 1 1 1 1
Percentage SCT 3.3 0.0 0.0 0.0 0.0
Producer NPC 1.10 1.00 1.00 1.00 1.00
Consumer SCT (AUD mn) –86 –1 –1 –1 –2
Consumer NPC 1.09 1.00 1.00 1.00 1.00
Total GCT (AUD mn) 13 149 189 133 125
Share of GCT in Total PSE (%) 1 9 12 7 7
Total ACT (AUD mn) 473 887 791 837 1 035
Share of ACT in Total PSE (%) 30 51 51 47 56
Total OTP (AUD mn) 250 663 544 782 665
Share of OTP in Total PSE (%) 17 38 35 44 36
p: provisional; PSE: Producer Support Estimate. CSE: Consumer Support Estimate. NPC: Nominal Protection Coefficient.NAC: Nominal Assistance Coefficient. SCT: Single Commodity Transfer. GCT: Group Commodity Transfer. ACT: AllCommodity Transfer. OTP: Other Transfers to Producers.Source: OECD, PSE/CSE database, 2007.
1 2 http://dx.doi.org/10.1787/075753010546
Table III.8. Australia: Breakdown of PSE by degree of commodity specificity (cont.)(Including SCT by commodity)
1986-88 2004-06 2004 2005 2006p
AGRICULTURAL POLICIES IN OECD COUNTRIES: MONITORING AND EVALUATION 2007 – ISBN 978-92-64-02746-6 – © OECD 2007256
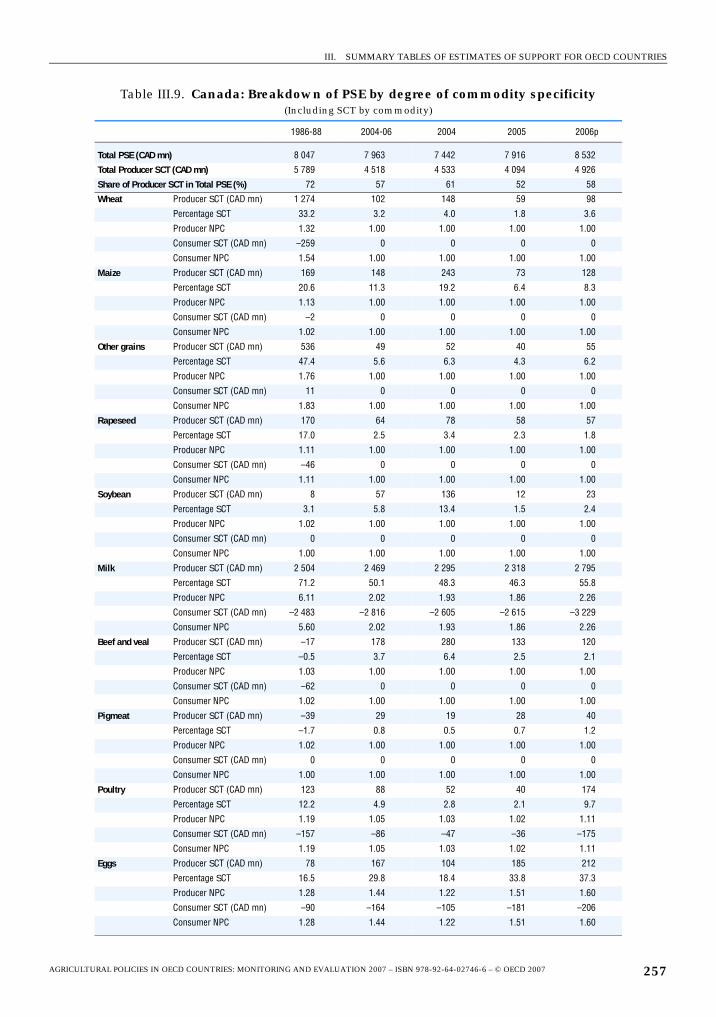
III. SUMMARY TABLES OF ESTIMATES OF SUPPORT FOR OECD COUNTRIES
Table III.9. Canada: Breakdown of PSE by degree of commodity specificity(Including SCT by commodity)
1986-88 2004-06 2004 2005 2006p
Total PSE (CAD mn) 8 047 7 963 7 442 7 916 8 532
Total Producer SCT (CAD mn) 5 789 4 518 4 533 4 094 4 926
Share of Producer SCT in Total PSE (%) 72 57 61 52 58
Wheat Producer SCT (CAD mn) 1 274 102 148 59 98
Percentage SCT 33.2 3.2 4.0 1.8 3.6
Producer NPC 1.32 1.00 1.00 1.00 1.00
Consumer SCT (CAD mn) –259 0 0 0 0
Consumer NPC 1.54 1.00 1.00 1.00 1.00
Maize Producer SCT (CAD mn) 169 148 243 73 128
Percentage SCT 20.6 11.3 19.2 6.4 8.3
Producer NPC 1.13 1.00 1.00 1.00 1.00
Consumer SCT (CAD mn) –2 0 0 0 0
Consumer NPC 1.02 1.00 1.00 1.00 1.00
Other grains Producer SCT (CAD mn) 536 49 52 40 55
Percentage SCT 47.4 5.6 6.3 4.3 6.2
Producer NPC 1.76 1.00 1.00 1.00 1.00
Consumer SCT (CAD mn) 11 0 0 0 0
Consumer NPC 1.83 1.00 1.00 1.00 1.00
Rapeseed Producer SCT (CAD mn) 170 64 78 58 57
Percentage SCT 17.0 2.5 3.4 2.3 1.8
Producer NPC 1.11 1.00 1.00 1.00 1.00
Consumer SCT (CAD mn) –46 0 0 0 0
Consumer NPC 1.11 1.00 1.00 1.00 1.00
Soybean Producer SCT (CAD mn) 8 57 136 12 23
Percentage SCT 3.1 5.8 13.4 1.5 2.4
Producer NPC 1.02 1.00 1.00 1.00 1.00
Consumer SCT (CAD mn) 0 0 0 0 0
Consumer NPC 1.00 1.00 1.00 1.00 1.00
Milk Producer SCT (CAD mn) 2 504 2 469 2 295 2 318 2 795
Percentage SCT 71.2 50.1 48.3 46.3 55.8
Producer NPC 6.11 2.02 1.93 1.86 2.26
Consumer SCT (CAD mn) –2 483 –2 816 –2 605 –2 615 –3 229
Consumer NPC 5.60 2.02 1.93 1.86 2.26
Beef and veal Producer SCT (CAD mn) –17 178 280 133 120
Percentage SCT –0.5 3.7 6.4 2.5 2.1
Producer NPC 1.03 1.00 1.00 1.00 1.00
Consumer SCT (CAD mn) –62 0 0 0 0
Consumer NPC 1.02 1.00 1.00 1.00 1.00
Pigmeat Producer SCT (CAD mn) –39 29 19 28 40
Percentage SCT –1.7 0.8 0.5 0.7 1.2
Producer NPC 1.02 1.00 1.00 1.00 1.00
Consumer SCT (CAD mn) 0 0 0 0 0
Consumer NPC 1.00 1.00 1.00 1.00 1.00
Poultry Producer SCT (CAD mn) 123 88 52 40 174
Percentage SCT 12.2 4.9 2.8 2.1 9.7
Producer NPC 1.19 1.05 1.03 1.02 1.11
Consumer SCT (CAD mn) –157 –86 –47 –36 –175
Consumer NPC 1.19 1.05 1.03 1.02 1.11
Eggs Producer SCT (CAD mn) 78 167 104 185 212
Percentage SCT 16.5 29.8 18.4 33.8 37.3
Producer NPC 1.28 1.44 1.22 1.51 1.60
Consumer SCT (CAD mn) –90 –164 –105 –181 –206
Consumer NPC 1.28 1.44 1.22 1.51 1.60
AGRICULTURAL POLICIES IN OECD COUNTRIES: MONITORING AND EVALUATION 2007 – ISBN 978-92-64-02746-6 – © OECD 2007 257
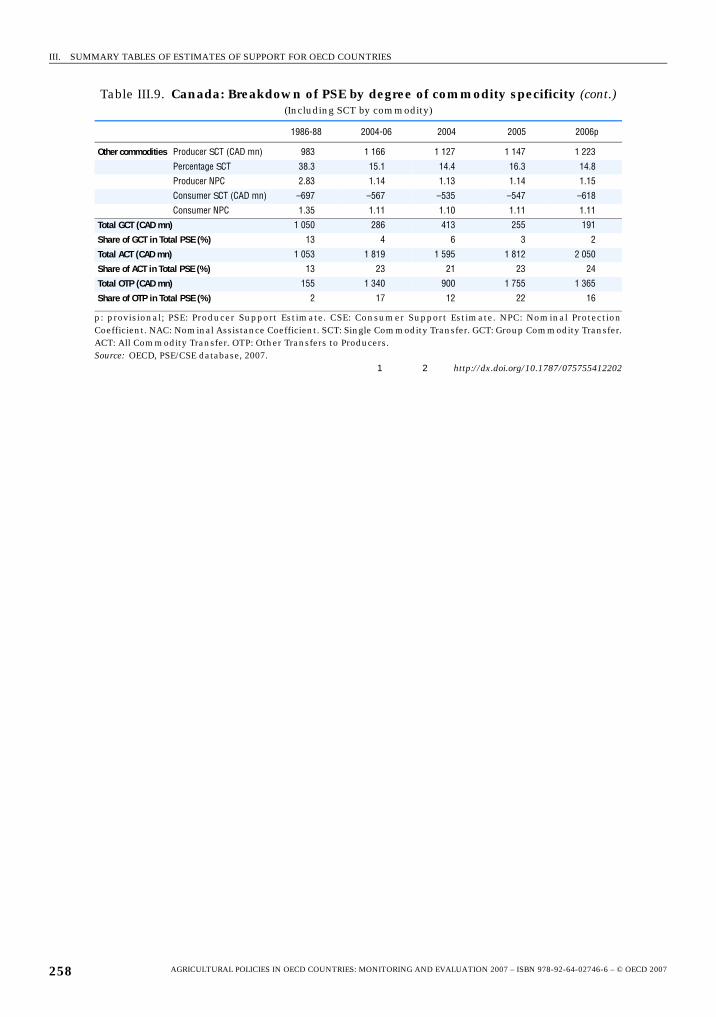
III. SUMMARY TABLES OF ESTIMATES OF SUPPORT FOR OECD COUNTRIES
Other commodities Producer SCT (CAD mn) 983 1 166 1 127 1 147 1 223
Percentage SCT 38.3 15.1 14.4 16.3 14.8
Producer NPC 2.83 1.14 1.13 1.14 1.15
Consumer SCT (CAD mn) –697 –567 –535 –547 –618
Consumer NPC 1.35 1.11 1.10 1.11 1.11
Total GCT (CAD mn) 1 050 286 413 255 191
Share of GCT in Total PSE (%) 13 4 6 3 2
Total ACT (CAD mn) 1 053 1 819 1 595 1 812 2 050
Share of ACT in Total PSE (%) 13 23 21 23 24
Total OTP (CAD mn) 155 1 340 900 1 755 1 365
Share of OTP in Total PSE (%) 2 17 12 22 16
p: provisional; PSE: Producer Support Estimate. CSE: Consumer Support Estimate. NPC: Nominal ProtectionCoefficient. NAC: Nominal Assistance Coefficient. SCT: Single Commodity Transfer. GCT: Group Commodity Transfer.ACT: All Commodity Transfer. OTP: Other Transfers to Producers.Source: OECD, PSE/CSE database, 2007.
1 2 http://dx.doi.org/10.1787/075755412202
Table III.9. Canada: Breakdown of PSE by degree of commodity specificity (cont.)(Including SCT by commodity)
1986-88 2004-06 2004 2005 2006p
AGRICULTURAL POLICIES IN OECD COUNTRIES: MONITORING AND EVALUATION 2007 – ISBN 978-92-64-02746-6 – © OECD 2007258
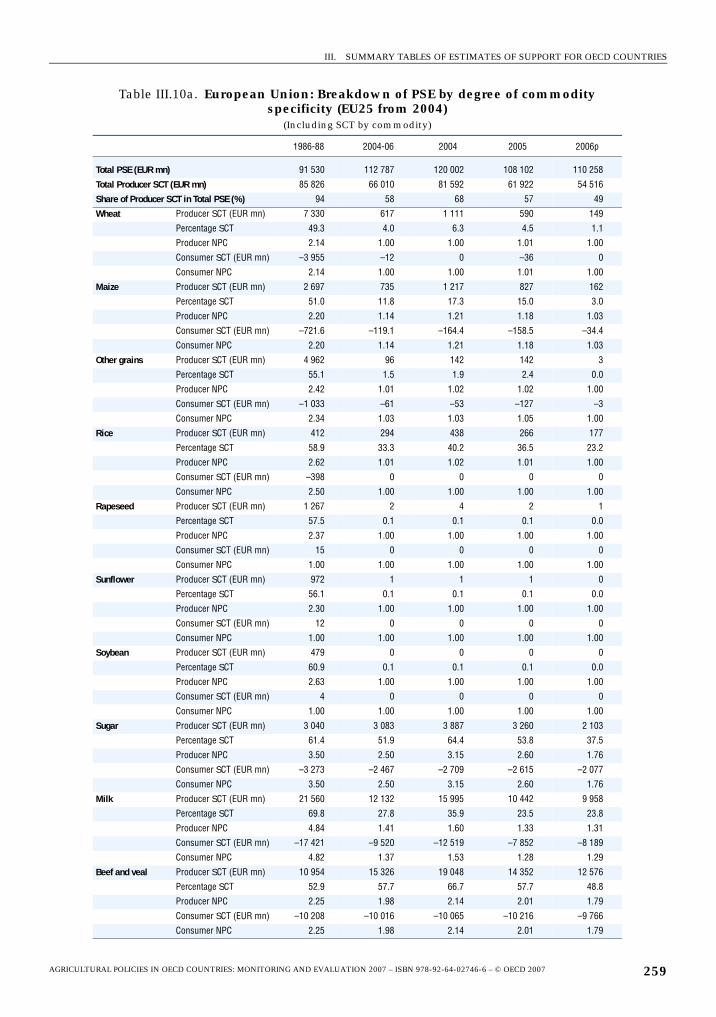
III. SUMMARY TABLES OF ESTIMATES OF SUPPORT FOR OECD COUNTRIES
Table III.10a. European Union: Breakdown of PSE by degree of commodity specificity (EU25 from 2004)
(Including SCT by commodity)
1986-88 2004-06 2004 2005 2006p
Total PSE (EUR mn) 91 530 112 787 120 002 108 102 110 258
Total Producer SCT (EUR mn) 85 826 66 010 81 592 61 922 54 516
Share of Producer SCT in Total PSE (%) 94 58 68 57 49
Wheat Producer SCT (EUR mn) 7 330 617 1 111 590 149
Percentage SCT 49.3 4.0 6.3 4.5 1.1
Producer NPC 2.14 1.00 1.00 1.01 1.00
Consumer SCT (EUR mn) –3 955 –12 0 –36 0
Consumer NPC 2.14 1.00 1.00 1.01 1.00
Maize Producer SCT (EUR mn) 2 697 735 1 217 827 162
Percentage SCT 51.0 11.8 17.3 15.0 3.0
Producer NPC 2.20 1.14 1.21 1.18 1.03
Consumer SCT (EUR mn) –721.6 –119.1 –164.4 –158.5 –34.4
Consumer NPC 2.20 1.14 1.21 1.18 1.03
Other grains Producer SCT (EUR mn) 4 962 96 142 142 3
Percentage SCT 55.1 1.5 1.9 2.4 0.0
Producer NPC 2.42 1.01 1.02 1.02 1.00
Consumer SCT (EUR mn) –1 033 –61 –53 –127 –3
Consumer NPC 2.34 1.03 1.03 1.05 1.00
Rice Producer SCT (EUR mn) 412 294 438 266 177
Percentage SCT 58.9 33.3 40.2 36.5 23.2
Producer NPC 2.62 1.01 1.02 1.01 1.00
Consumer SCT (EUR mn) –398 0 0 0 0
Consumer NPC 2.50 1.00 1.00 1.00 1.00
Rapeseed Producer SCT (EUR mn) 1 267 2 4 2 1
Percentage SCT 57.5 0.1 0.1 0.1 0.0
Producer NPC 2.37 1.00 1.00 1.00 1.00
Consumer SCT (EUR mn) 15 0 0 0 0
Consumer NPC 1.00 1.00 1.00 1.00 1.00
Sunflower Producer SCT (EUR mn) 972 1 1 1 0
Percentage SCT 56.1 0.1 0.1 0.1 0.0
Producer NPC 2.30 1.00 1.00 1.00 1.00
Consumer SCT (EUR mn) 12 0 0 0 0
Consumer NPC 1.00 1.00 1.00 1.00 1.00
Soybean Producer SCT (EUR mn) 479 0 0 0 0
Percentage SCT 60.9 0.1 0.1 0.1 0.0
Producer NPC 2.63 1.00 1.00 1.00 1.00
Consumer SCT (EUR mn) 4 0 0 0 0
Consumer NPC 1.00 1.00 1.00 1.00 1.00
Sugar Producer SCT (EUR mn) 3 040 3 083 3 887 3 260 2 103
Percentage SCT 61.4 51.9 64.4 53.8 37.5
Producer NPC 3.50 2.50 3.15 2.60 1.76
Consumer SCT (EUR mn) –3 273 –2 467 –2 709 –2 615 –2 077
Consumer NPC 3.50 2.50 3.15 2.60 1.76
Milk Producer SCT (EUR mn) 21 560 12 132 15 995 10 442 9 958
Percentage SCT 69.8 27.8 35.9 23.5 23.8
Producer NPC 4.84 1.41 1.60 1.33 1.31
Consumer SCT (EUR mn) –17 421 –9 520 –12 519 –7 852 –8 189
Consumer NPC 4.82 1.37 1.53 1.28 1.29
Beef and veal Producer SCT (EUR mn) 10 954 15 326 19 048 14 352 12 576
Percentage SCT 52.9 57.7 66.7 57.7 48.8
Producer NPC 2.25 1.98 2.14 2.01 1.79
Consumer SCT (EUR mn) –10 208 –10 016 –10 065 –10 216 –9 766
Consumer NPC 2.25 1.98 2.14 2.01 1.79
AGRICULTURAL POLICIES IN OECD COUNTRIES: MONITORING AND EVALUATION 2007 – ISBN 978-92-64-02746-6 – © OECD 2007 259
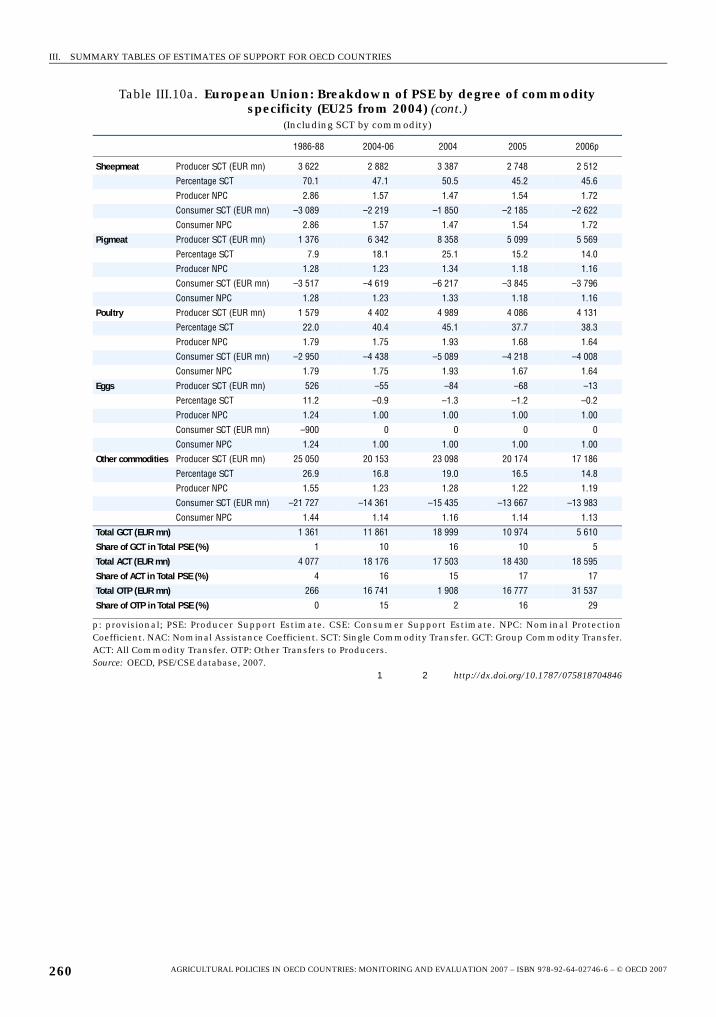
III. SUMMARY TABLES OF ESTIMATES OF SUPPORT FOR OECD COUNTRIES
Sheepmeat Producer SCT (EUR mn) 3 622 2 882 3 387 2 748 2 512
Percentage SCT 70.1 47.1 50.5 45.2 45.6
Producer NPC 2.86 1.57 1.47 1.54 1.72
Consumer SCT (EUR mn) –3 089 –2 219 –1 850 –2 185 –2 622
Consumer NPC 2.86 1.57 1.47 1.54 1.72
Pigmeat Producer SCT (EUR mn) 1 376 6 342 8 358 5 099 5 569
Percentage SCT 7.9 18.1 25.1 15.2 14.0
Producer NPC 1.28 1.23 1.34 1.18 1.16
Consumer SCT (EUR mn) –3 517 –4 619 –6 217 –3 845 –3 796
Consumer NPC 1.28 1.23 1.33 1.18 1.16
Poultry Producer SCT (EUR mn) 1 579 4 402 4 989 4 086 4 131
Percentage SCT 22.0 40.4 45.1 37.7 38.3
Producer NPC 1.79 1.75 1.93 1.68 1.64
Consumer SCT (EUR mn) –2 950 –4 438 –5 089 –4 218 –4 008
Consumer NPC 1.79 1.75 1.93 1.67 1.64
Eggs Producer SCT (EUR mn) 526 –55 –84 –68 –13
Percentage SCT 11.2 –0.9 –1.3 –1.2 –0.2
Producer NPC 1.24 1.00 1.00 1.00 1.00
Consumer SCT (EUR mn) –900 0 0 0 0
Consumer NPC 1.24 1.00 1.00 1.00 1.00
Other commodities Producer SCT (EUR mn) 25 050 20 153 23 098 20 174 17 186
Percentage SCT 26.9 16.8 19.0 16.5 14.8
Producer NPC 1.55 1.23 1.28 1.22 1.19
Consumer SCT (EUR mn) –21 727 –14 361 –15 435 –13 667 –13 983
Consumer NPC 1.44 1.14 1.16 1.14 1.13
Total GCT (EUR mn) 1 361 11 861 18 999 10 974 5 610
Share of GCT in Total PSE (%) 1 10 16 10 5
Total ACT (EUR mn) 4 077 18 176 17 503 18 430 18 595
Share of ACT in Total PSE (%) 4 16 15 17 17
Total OTP (EUR mn) 266 16 741 1 908 16 777 31 537
Share of OTP in Total PSE (%) 0 15 2 16 29
p: provisional; PSE: Producer Support Estimate. CSE: Consumer Support Estimate. NPC: Nominal ProtectionCoefficient. NAC: Nominal Assistance Coefficient. SCT: Single Commodity Transfer. GCT: Group Commodity Transfer.ACT: All Commodity Transfer. OTP: Other Transfers to Producers.Source: OECD, PSE/CSE database, 2007.
1 2 http://dx.doi.org/10.1787/075818704846
Table III.10a. European Union: Breakdown of PSE by degree of commodity specificity (EU25 from 2004) (cont.)
(Including SCT by commodity)
1986-88 2004-06 2004 2005 2006p
AGRICULTURAL POLICIES IN OECD COUNTRIES: MONITORING AND EVALUATION 2007 – ISBN 978-92-64-02746-6 – © OECD 2007260
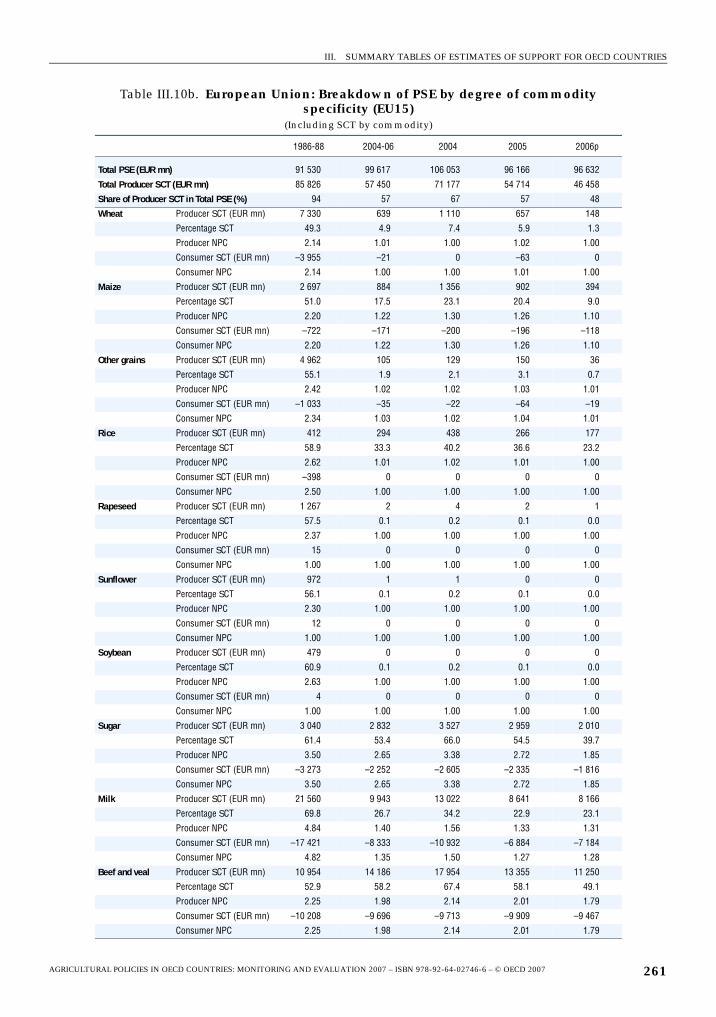
III. SUMMARY TABLES OF ESTIMATES OF SUPPORT FOR OECD COUNTRIES
Table III.10b. European Union: Breakdown of PSE by degree of commodity specificity (EU15)
(Including SCT by commodity)
1986-88 2004-06 2004 2005 2006p
Total PSE (EUR mn) 91 530 99 617 106 053 96 166 96 632
Total Producer SCT (EUR mn) 85 826 57 450 71 177 54 714 46 458
Share of Producer SCT in Total PSE (%) 94 57 67 57 48
Wheat Producer SCT (EUR mn) 7 330 639 1 110 657 148
Percentage SCT 49.3 4.9 7.4 5.9 1.3
Producer NPC 2.14 1.01 1.00 1.02 1.00
Consumer SCT (EUR mn) –3 955 –21 0 –63 0
Consumer NPC 2.14 1.00 1.00 1.01 1.00
Maize Producer SCT (EUR mn) 2 697 884 1 356 902 394
Percentage SCT 51.0 17.5 23.1 20.4 9.0
Producer NPC 2.20 1.22 1.30 1.26 1.10
Consumer SCT (EUR mn) –722 –171 –200 –196 –118
Consumer NPC 2.20 1.22 1.30 1.26 1.10
Other grains Producer SCT (EUR mn) 4 962 105 129 150 36
Percentage SCT 55.1 1.9 2.1 3.1 0.7
Producer NPC 2.42 1.02 1.02 1.03 1.01
Consumer SCT (EUR mn) –1 033 –35 –22 –64 –19
Consumer NPC 2.34 1.03 1.02 1.04 1.01
Rice Producer SCT (EUR mn) 412 294 438 266 177
Percentage SCT 58.9 33.3 40.2 36.6 23.2
Producer NPC 2.62 1.01 1.02 1.01 1.00
Consumer SCT (EUR mn) –398 0 0 0 0
Consumer NPC 2.50 1.00 1.00 1.00 1.00
Rapeseed Producer SCT (EUR mn) 1 267 2 4 2 1
Percentage SCT 57.5 0.1 0.2 0.1 0.0
Producer NPC 2.37 1.00 1.00 1.00 1.00
Consumer SCT (EUR mn) 15 0 0 0 0
Consumer NPC 1.00 1.00 1.00 1.00 1.00
Sunflower Producer SCT (EUR mn) 972 1 1 0 0
Percentage SCT 56.1 0.1 0.2 0.1 0.0
Producer NPC 2.30 1.00 1.00 1.00 1.00
Consumer SCT (EUR mn) 12 0 0 0 0
Consumer NPC 1.00 1.00 1.00 1.00 1.00
Soybean Producer SCT (EUR mn) 479 0 0 0 0
Percentage SCT 60.9 0.1 0.2 0.1 0.0
Producer NPC 2.63 1.00 1.00 1.00 1.00
Consumer SCT (EUR mn) 4 0 0 0 0
Consumer NPC 1.00 1.00 1.00 1.00 1.00
Sugar Producer SCT (EUR mn) 3 040 2 832 3 527 2 959 2 010
Percentage SCT 61.4 53.4 66.0 54.5 39.7
Producer NPC 3.50 2.65 3.38 2.72 1.85
Consumer SCT (EUR mn) –3 273 –2 252 –2 605 –2 335 –1 816
Consumer NPC 3.50 2.65 3.38 2.72 1.85
Milk Producer SCT (EUR mn) 21 560 9 943 13 022 8 641 8 166
Percentage SCT 69.8 26.7 34.2 22.9 23.1
Producer NPC 4.84 1.40 1.56 1.33 1.31
Consumer SCT (EUR mn) –17 421 –8 333 –10 932 –6 884 –7 184
Consumer NPC 4.82 1.35 1.50 1.27 1.28
Beef and veal Producer SCT (EUR mn) 10 954 14 186 17 954 13 355 11 250
Percentage SCT 52.9 58.2 67.4 58.1 49.1
Producer NPC 2.25 1.98 2.14 2.01 1.79
Consumer SCT (EUR mn) –10 208 –9 696 –9 713 –9 909 –9 467
Consumer NPC 2.25 1.98 2.14 2.01 1.79
AGRICULTURAL POLICIES IN OECD COUNTRIES: MONITORING AND EVALUATION 2007 – ISBN 978-92-64-02746-6 – © OECD 2007 261
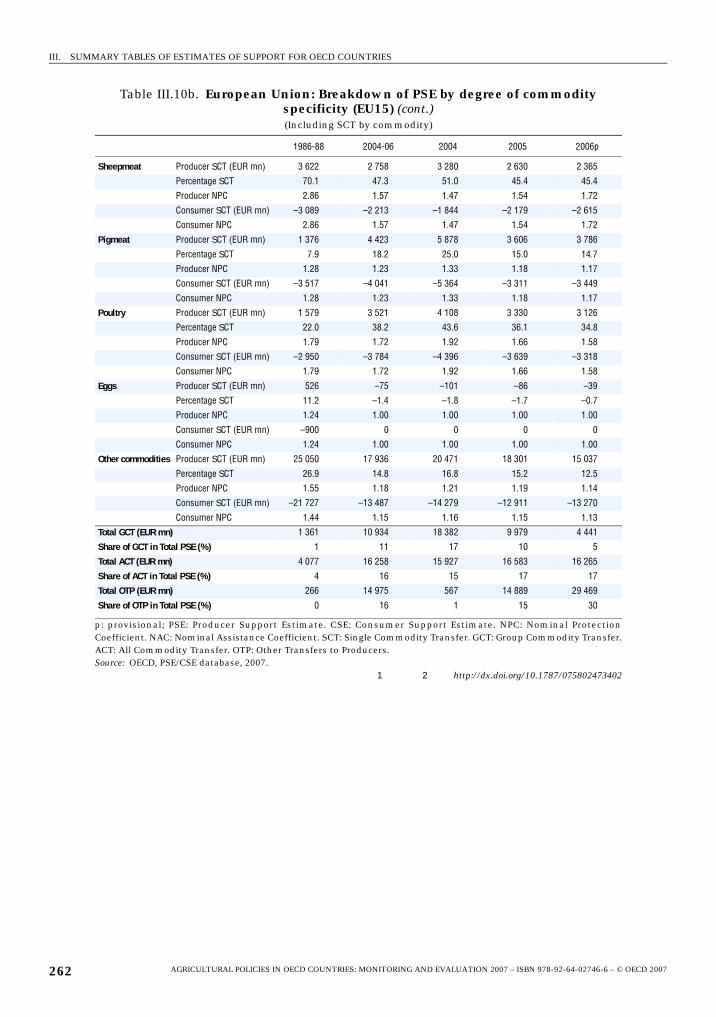
III. SUMMARY TABLES OF ESTIMATES OF SUPPORT FOR OECD COUNTRIES
Sheepmeat Producer SCT (EUR mn) 3 622 2 758 3 280 2 630 2 365
Percentage SCT 70.1 47.3 51.0 45.4 45.4
Producer NPC 2.86 1.57 1.47 1.54 1.72
Consumer SCT (EUR mn) –3 089 –2 213 –1 844 –2 179 –2 615
Consumer NPC 2.86 1.57 1.47 1.54 1.72
Pigmeat Producer SCT (EUR mn) 1 376 4 423 5 878 3 606 3 786
Percentage SCT 7.9 18.2 25.0 15.0 14.7
Producer NPC 1.28 1.23 1.33 1.18 1.17
Consumer SCT (EUR mn) –3 517 –4 041 –5 364 –3 311 –3 449
Consumer NPC 1.28 1.23 1.33 1.18 1.17
Poultry Producer SCT (EUR mn) 1 579 3 521 4 108 3 330 3 126
Percentage SCT 22.0 38.2 43.6 36.1 34.8
Producer NPC 1.79 1.72 1.92 1.66 1.58
Consumer SCT (EUR mn) –2 950 –3 784 –4 396 –3 639 –3 318
Consumer NPC 1.79 1.72 1.92 1.66 1.58
Eggs Producer SCT (EUR mn) 526 –75 –101 –86 –39
Percentage SCT 11.2 –1.4 –1.8 –1.7 –0.7
Producer NPC 1.24 1.00 1.00 1.00 1.00
Consumer SCT (EUR mn) –900 0 0 0 0
Consumer NPC 1.24 1.00 1.00 1.00 1.00
Other commodities Producer SCT (EUR mn) 25 050 17 936 20 471 18 301 15 037
Percentage SCT 26.9 14.8 16.8 15.2 12.5
Producer NPC 1.55 1.18 1.21 1.19 1.14
Consumer SCT (EUR mn) –21 727 –13 487 –14 279 –12 911 –13 270
Consumer NPC 1.44 1.15 1.16 1.15 1.13
Total GCT (EUR mn) 1 361 10 934 18 382 9 979 4 441
Share of GCT in Total PSE (%) 1 11 17 10 5
Total ACT (EUR mn) 4 077 16 258 15 927 16 583 16 265
Share of ACT in Total PSE (%) 4 16 15 17 17
Total OTP (EUR mn) 266 14 975 567 14 889 29 469
Share of OTP in Total PSE (%) 0 16 1 15 30
p: provisional; PSE: Producer Support Estimate. CSE: Consumer Support Estimate. NPC: Nominal ProtectionCoefficient. NAC: Nominal Assistance Coefficient. SCT: Single Commodity Transfer. GCT: Group Commodity Transfer.ACT: All Commodity Transfer. OTP: Other Transfers to Producers.Source: OECD, PSE/CSE database, 2007.
1 2 http://dx.doi.org/10.1787/075802473402
Table III.10b. European Union: Breakdown of PSE by degree of commodity specificity (EU15) (cont.)(Including SCT by commodity)
1986-88 2004-06 2004 2005 2006p
AGRICULTURAL POLICIES IN OECD COUNTRIES: MONITORING AND EVALUATION 2007 – ISBN 978-92-64-02746-6 – © OECD 2007262
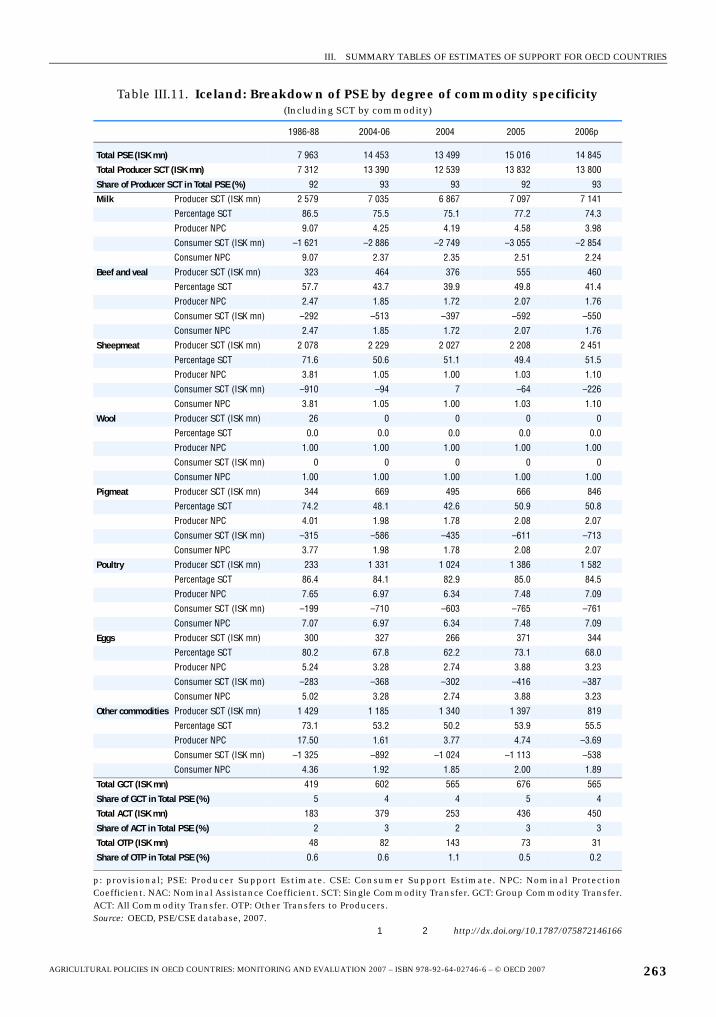
III. SUMMARY TABLES OF ESTIMATES OF SUPPORT FOR OECD COUNTRIES
Table III.11. Iceland: Breakdown of PSE by degree of commodity specificity(Including SCT by commodity)
1986-88 2004-06 2004 2005 2006p
Total PSE (ISK mn) 7 963 14 453 13 499 15 016 14 845
Total Producer SCT (ISK mn) 7 312 13 390 12 539 13 832 13 800
Share of Producer SCT in Total PSE (%) 92 93 93 92 93
Milk Producer SCT (ISK mn) 2 579 7 035 6 867 7 097 7 141
Percentage SCT 86.5 75.5 75.1 77.2 74.3
Producer NPC 9.07 4.25 4.19 4.58 3.98
Consumer SCT (ISK mn) –1 621 –2 886 –2 749 –3 055 –2 854
Consumer NPC 9.07 2.37 2.35 2.51 2.24
Beef and veal Producer SCT (ISK mn) 323 464 376 555 460
Percentage SCT 57.7 43.7 39.9 49.8 41.4
Producer NPC 2.47 1.85 1.72 2.07 1.76
Consumer SCT (ISK mn) –292 –513 –397 –592 –550
Consumer NPC 2.47 1.85 1.72 2.07 1.76
Sheepmeat Producer SCT (ISK mn) 2 078 2 229 2 027 2 208 2 451
Percentage SCT 71.6 50.6 51.1 49.4 51.5
Producer NPC 3.81 1.05 1.00 1.03 1.10
Consumer SCT (ISK mn) –910 –94 7 –64 –226
Consumer NPC 3.81 1.05 1.00 1.03 1.10
Wool Producer SCT (ISK mn) 26 0 0 0 0
Percentage SCT 0.0 0.0 0.0 0.0 0.0
Producer NPC 1.00 1.00 1.00 1.00 1.00
Consumer SCT (ISK mn) 0 0 0 0 0
Consumer NPC 1.00 1.00 1.00 1.00 1.00
Pigmeat Producer SCT (ISK mn) 344 669 495 666 846
Percentage SCT 74.2 48.1 42.6 50.9 50.8
Producer NPC 4.01 1.98 1.78 2.08 2.07
Consumer SCT (ISK mn) –315 –586 –435 –611 –713
Consumer NPC 3.77 1.98 1.78 2.08 2.07
Poultry Producer SCT (ISK mn) 233 1 331 1 024 1 386 1 582
Percentage SCT 86.4 84.1 82.9 85.0 84.5
Producer NPC 7.65 6.97 6.34 7.48 7.09
Consumer SCT (ISK mn) –199 –710 –603 –765 –761
Consumer NPC 7.07 6.97 6.34 7.48 7.09
Eggs Producer SCT (ISK mn) 300 327 266 371 344
Percentage SCT 80.2 67.8 62.2 73.1 68.0
Producer NPC 5.24 3.28 2.74 3.88 3.23
Consumer SCT (ISK mn) –283 –368 –302 –416 –387
Consumer NPC 5.02 3.28 2.74 3.88 3.23
Other commodities Producer SCT (ISK mn) 1 429 1 185 1 340 1 397 819
Percentage SCT 73.1 53.2 50.2 53.9 55.5
Producer NPC 17.50 1.61 3.77 4.74 –3.69
Consumer SCT (ISK mn) –1 325 –892 –1 024 –1 113 –538
Consumer NPC 4.36 1.92 1.85 2.00 1.89
Total GCT (ISK mn) 419 602 565 676 565
Share of GCT in Total PSE (%) 5 4 4 5 4
Total ACT (ISK mn) 183 379 253 436 450
Share of ACT in Total PSE (%) 2 3 2 3 3
Total OTP (ISK mn) 48 82 143 73 31
Share of OTP in Total PSE (%) 0.6 0.6 1.1 0.5 0.2
p: provisional; PSE: Producer Support Estimate. CSE: Consumer Support Estimate. NPC: Nominal ProtectionCoefficient. NAC: Nominal Assistance Coefficient. SCT: Single Commodity Transfer. GCT: Group Commodity Transfer.ACT: All Commodity Transfer. OTP: Other Transfers to Producers.Source: OECD, PSE/CSE database, 2007.
1 2 http://dx.doi.org/10.1787/075872146166
AGRICULTURAL POLICIES IN OECD COUNTRIES: MONITORING AND EVALUATION 2007 – ISBN 978-92-64-02746-6 – © OECD 2007 263
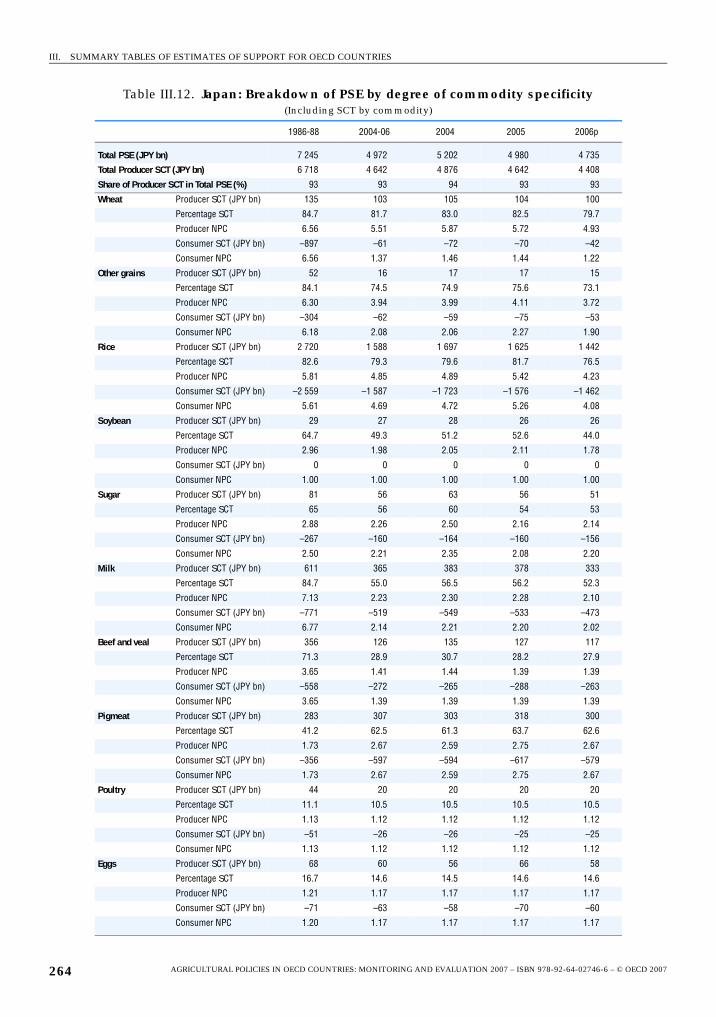
III. SUMMARY TABLES OF ESTIMATES OF SUPPORT FOR OECD COUNTRIES
Table III.12. Japan: Breakdown of PSE by degree of commodity specificity(Including SCT by commodity)
1986-88 2004-06 2004 2005 2006p
Total PSE (JPY bn) 7 245 4 972 5 202 4 980 4 735
Total Producer SCT (JPY bn) 6 718 4 642 4 876 4 642 4 408
Share of Producer SCT in Total PSE (%) 93 93 94 93 93
Wheat Producer SCT (JPY bn) 135 103 105 104 100
Percentage SCT 84.7 81.7 83.0 82.5 79.7
Producer NPC 6.56 5.51 5.87 5.72 4.93
Consumer SCT (JPY bn) –897 –61 –72 –70 –42
Consumer NPC 6.56 1.37 1.46 1.44 1.22
Other grains Producer SCT (JPY bn) 52 16 17 17 15
Percentage SCT 84.1 74.5 74.9 75.6 73.1
Producer NPC 6.30 3.94 3.99 4.11 3.72
Consumer SCT (JPY bn) –304 –62 –59 –75 –53
Consumer NPC 6.18 2.08 2.06 2.27 1.90
Rice Producer SCT (JPY bn) 2 720 1 588 1 697 1 625 1 442
Percentage SCT 82.6 79.3 79.6 81.7 76.5
Producer NPC 5.81 4.85 4.89 5.42 4.23
Consumer SCT (JPY bn) –2 559 –1 587 –1 723 –1 576 –1 462
Consumer NPC 5.61 4.69 4.72 5.26 4.08
Soybean Producer SCT (JPY bn) 29 27 28 26 26
Percentage SCT 64.7 49.3 51.2 52.6 44.0
Producer NPC 2.96 1.98 2.05 2.11 1.78
Consumer SCT (JPY bn) 0 0 0 0 0
Consumer NPC 1.00 1.00 1.00 1.00 1.00
Sugar Producer SCT (JPY bn) 81 56 63 56 51
Percentage SCT 65 56 60 54 53
Producer NPC 2.88 2.26 2.50 2.16 2.14
Consumer SCT (JPY bn) –267 –160 –164 –160 –156
Consumer NPC 2.50 2.21 2.35 2.08 2.20
Milk Producer SCT (JPY bn) 611 365 383 378 333
Percentage SCT 84.7 55.0 56.5 56.2 52.3
Producer NPC 7.13 2.23 2.30 2.28 2.10
Consumer SCT (JPY bn) –771 –519 –549 –533 –473
Consumer NPC 6.77 2.14 2.21 2.20 2.02
Beef and veal Producer SCT (JPY bn) 356 126 135 127 117
Percentage SCT 71.3 28.9 30.7 28.2 27.9
Producer NPC 3.65 1.41 1.44 1.39 1.39
Consumer SCT (JPY bn) –558 –272 –265 –288 –263
Consumer NPC 3.65 1.39 1.39 1.39 1.39
Pigmeat Producer SCT (JPY bn) 283 307 303 318 300
Percentage SCT 41.2 62.5 61.3 63.7 62.6
Producer NPC 1.73 2.67 2.59 2.75 2.67
Consumer SCT (JPY bn) –356 –597 –594 –617 –579
Consumer NPC 1.73 2.67 2.59 2.75 2.67
Poultry Producer SCT (JPY bn) 44 20 20 20 20
Percentage SCT 11.1 10.5 10.5 10.5 10.5
Producer NPC 1.13 1.12 1.12 1.12 1.12
Consumer SCT (JPY bn) –51 –26 –26 –25 –25
Consumer NPC 1.13 1.12 1.12 1.12 1.12
Eggs Producer SCT (JPY bn) 68 60 56 66 58
Percentage SCT 16.7 14.6 14.5 14.6 14.6
Producer NPC 1.21 1.17 1.17 1.17 1.17
Consumer SCT (JPY bn) –71 –63 –58 –70 –60
Consumer NPC 1.20 1.17 1.17 1.17 1.17
AGRICULTURAL POLICIES IN OECD COUNTRIES: MONITORING AND EVALUATION 2007 – ISBN 978-92-64-02746-6 – © OECD 2007264
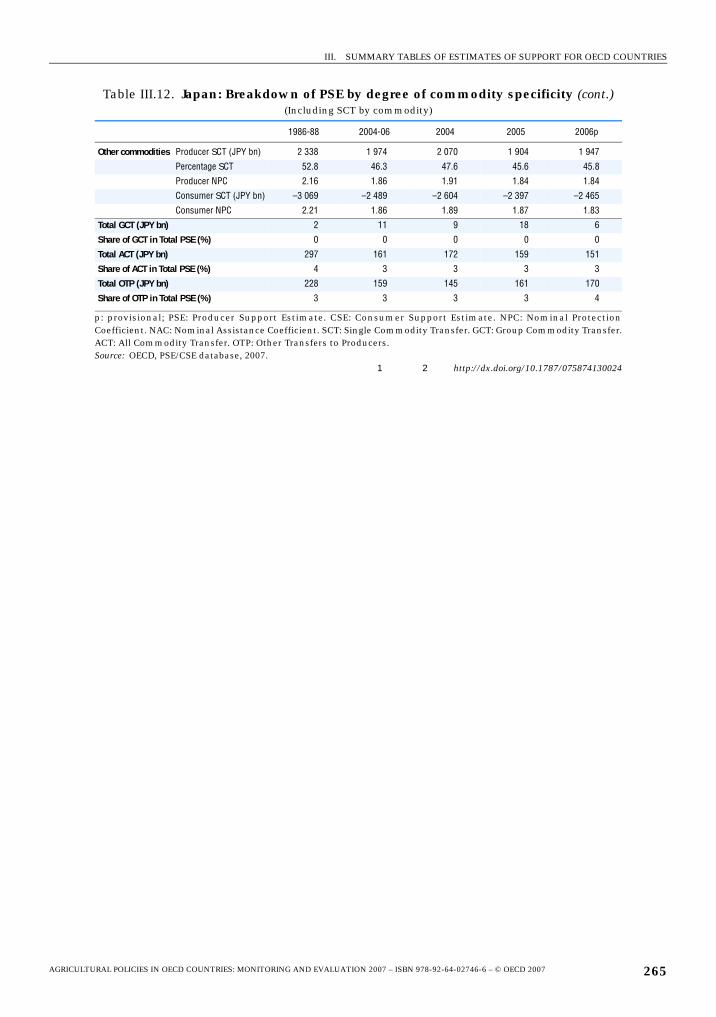
III. SUMMARY TABLES OF ESTIMATES OF SUPPORT FOR OECD COUNTRIES
Other commodities Producer SCT (JPY bn) 2 338 1 974 2 070 1 904 1 947
Percentage SCT 52.8 46.3 47.6 45.6 45.8
Producer NPC 2.16 1.86 1.91 1.84 1.84
Consumer SCT (JPY bn) –3 069 –2 489 –2 604 –2 397 –2 465
Consumer NPC 2.21 1.86 1.89 1.87 1.83
Total GCT (JPY bn) 2 11 9 18 6
Share of GCT in Total PSE (%) 0 0 0 0 0
Total ACT (JPY bn) 297 161 172 159 151
Share of ACT in Total PSE (%) 4 3 3 3 3
Total OTP (JPY bn) 228 159 145 161 170
Share of OTP in Total PSE (%) 3 3 3 3 4
p: provisional; PSE: Producer Support Estimate. CSE: Consumer Support Estimate. NPC: Nominal ProtectionCoefficient. NAC: Nominal Assistance Coefficient. SCT: Single Commodity Transfer. GCT: Group Commodity Transfer.ACT: All Commodity Transfer. OTP: Other Transfers to Producers.Source: OECD, PSE/CSE database, 2007.
1 2 http://dx.doi.org/10.1787/075874130024
Table III.12. Japan: Breakdown of PSE by degree of commodity specificity (cont.)(Including SCT by commodity)
1986-88 2004-06 2004 2005 2006p
AGRICULTURAL POLICIES IN OECD COUNTRIES: MONITORING AND EVALUATION 2007 – ISBN 978-92-64-02746-6 – © OECD 2007 265
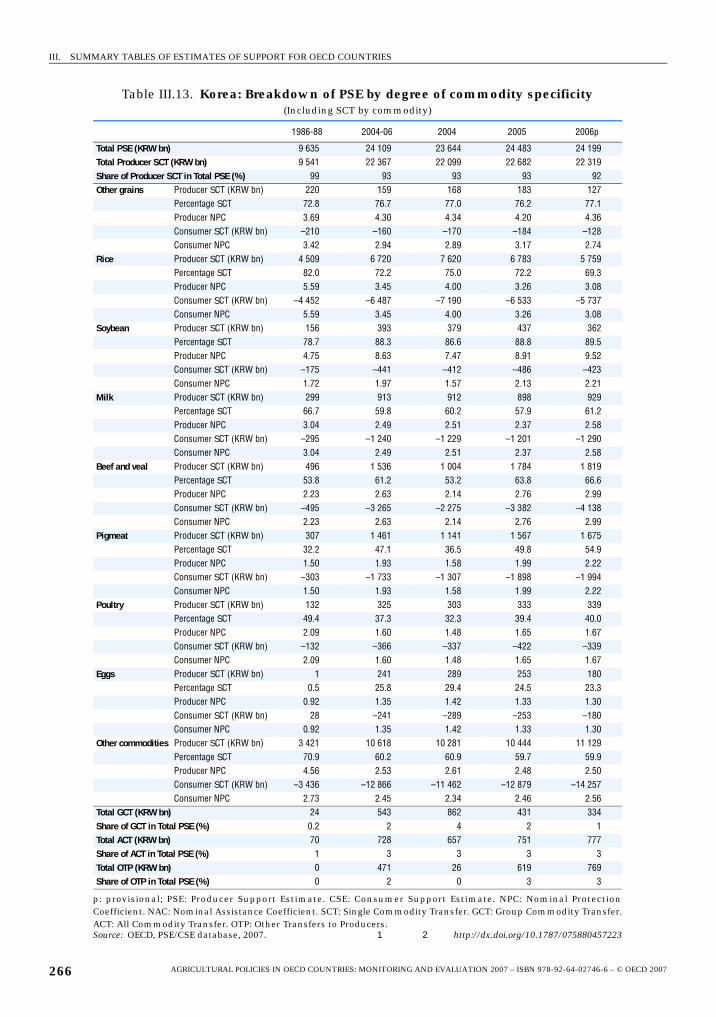
III. SUMMARY TABLES OF ESTIMATES OF SUPPORT FOR OECD COUNTRIES
Table III.13. Korea: Breakdown of PSE by degree of commodity specificity(Including SCT by commodity)
1986-88 2004-06 2004 2005 2006p
Total PSE (KRW bn) 9 635 24 109 23 644 24 483 24 199Total Producer SCT (KRW bn) 9 541 22 367 22 099 22 682 22 319Share of Producer SCT in Total PSE (%) 99 93 93 93 92Other grains Producer SCT (KRW bn) 220 159 168 183 127
Percentage SCT 72.8 76.7 77.0 76.2 77.1Producer NPC 3.69 4.30 4.34 4.20 4.36Consumer SCT (KRW bn) –210 –160 –170 –184 –128Consumer NPC 3.42 2.94 2.89 3.17 2.74
Rice Producer SCT (KRW bn) 4 509 6 720 7 620 6 783 5 759Percentage SCT 82.0 72.2 75.0 72.2 69.3Producer NPC 5.59 3.45 4.00 3.26 3.08Consumer SCT (KRW bn) –4 452 –6 487 –7 190 –6 533 –5 737Consumer NPC 5.59 3.45 4.00 3.26 3.08
Soybean Producer SCT (KRW bn) 156 393 379 437 362Percentage SCT 78.7 88.3 86.6 88.8 89.5Producer NPC 4.75 8.63 7.47 8.91 9.52Consumer SCT (KRW bn) –175 –441 –412 –486 –423Consumer NPC 1.72 1.97 1.57 2.13 2.21
Milk Producer SCT (KRW bn) 299 913 912 898 929Percentage SCT 66.7 59.8 60.2 57.9 61.2Producer NPC 3.04 2.49 2.51 2.37 2.58Consumer SCT (KRW bn) –295 –1 240 –1 229 –1 201 –1 290Consumer NPC 3.04 2.49 2.51 2.37 2.58
Beef and veal Producer SCT (KRW bn) 496 1 536 1 004 1 784 1 819Percentage SCT 53.8 61.2 53.2 63.8 66.6Producer NPC 2.23 2.63 2.14 2.76 2.99Consumer SCT (KRW bn) –495 –3 265 –2 275 –3 382 –4 138Consumer NPC 2.23 2.63 2.14 2.76 2.99
Pigmeat Producer SCT (KRW bn) 307 1 461 1 141 1 567 1 675Percentage SCT 32.2 47.1 36.5 49.8 54.9Producer NPC 1.50 1.93 1.58 1.99 2.22Consumer SCT (KRW bn) –303 –1 733 –1 307 –1 898 –1 994Consumer NPC 1.50 1.93 1.58 1.99 2.22
Poultry Producer SCT (KRW bn) 132 325 303 333 339Percentage SCT 49.4 37.3 32.3 39.4 40.0Producer NPC 2.09 1.60 1.48 1.65 1.67Consumer SCT (KRW bn) –132 –366 –337 –422 –339Consumer NPC 2.09 1.60 1.48 1.65 1.67
Eggs Producer SCT (KRW bn) 1 241 289 253 180Percentage SCT 0.5 25.8 29.4 24.5 23.3Producer NPC 0.92 1.35 1.42 1.33 1.30Consumer SCT (KRW bn) 28 –241 –289 –253 –180Consumer NPC 0.92 1.35 1.42 1.33 1.30
Other commodities Producer SCT (KRW bn) 3 421 10 618 10 281 10 444 11 129Percentage SCT 70.9 60.2 60.9 59.7 59.9Producer NPC 4.56 2.53 2.61 2.48 2.50Consumer SCT (KRW bn) –3 436 –12 866 –11 462 –12 879 –14 257Consumer NPC 2.73 2.45 2.34 2.46 2.56
Total GCT (KRW bn) 24 543 862 431 334Share of GCT in Total PSE (%) 0.2 2 4 2 1Total ACT (KRW bn) 70 728 657 751 777Share of ACT in Total PSE (%) 1 3 3 3 3Total OTP (KRW bn) 0 471 26 619 769Share of OTP in Total PSE (%) 0 2 0 3 3
p: provisional; PSE: Producer Support Estimate. CSE: Consumer Support Estimate. NPC: Nominal ProtectionCoefficient. NAC: Nominal Assistance Coefficient. SCT: Single Commodity Transfer. GCT: Group Commodity Transfer.ACT: All Commodity Transfer. OTP: Other Transfers to Producers.Source: OECD, PSE/CSE database, 2007. 1 2 http://dx.doi.org/10.1787/075880457223
AGRICULTURAL POLICIES IN OECD COUNTRIES: MONITORING AND EVALUATION 2007 – ISBN 978-92-64-02746-6 – © OECD 2007266
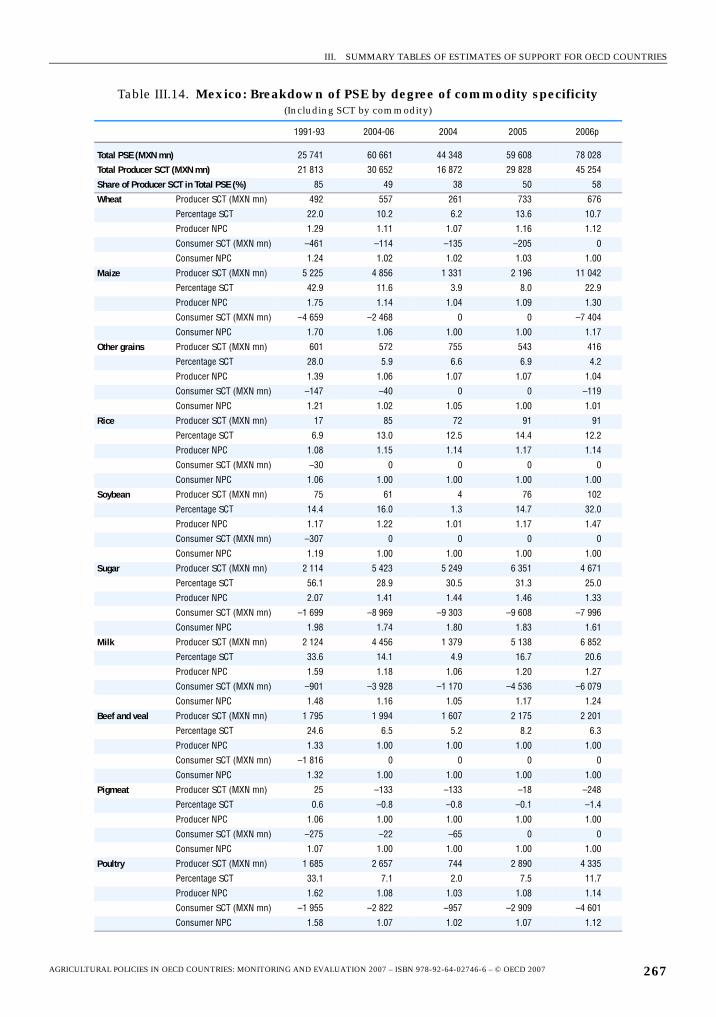
III. SUMMARY TABLES OF ESTIMATES OF SUPPORT FOR OECD COUNTRIES
Table III.14. Mexico: Breakdown of PSE by degree of commodity specificity(Including SCT by commodity)
1991-93 2004-06 2004 2005 2006p
Total PSE (MXN mn) 25 741 60 661 44 348 59 608 78 028
Total Producer SCT (MXN mn) 21 813 30 652 16 872 29 828 45 254
Share of Producer SCT in Total PSE (%) 85 49 38 50 58
Wheat Producer SCT (MXN mn) 492 557 261 733 676
Percentage SCT 22.0 10.2 6.2 13.6 10.7
Producer NPC 1.29 1.11 1.07 1.16 1.12
Consumer SCT (MXN mn) –461 –114 –135 –205 0
Consumer NPC 1.24 1.02 1.02 1.03 1.00
Maize Producer SCT (MXN mn) 5 225 4 856 1 331 2 196 11 042
Percentage SCT 42.9 11.6 3.9 8.0 22.9
Producer NPC 1.75 1.14 1.04 1.09 1.30
Consumer SCT (MXN mn) –4 659 –2 468 0 0 –7 404
Consumer NPC 1.70 1.06 1.00 1.00 1.17
Other grains Producer SCT (MXN mn) 601 572 755 543 416
Percentage SCT 28.0 5.9 6.6 6.9 4.2
Producer NPC 1.39 1.06 1.07 1.07 1.04
Consumer SCT (MXN mn) –147 –40 0 0 –119
Consumer NPC 1.21 1.02 1.05 1.00 1.01
Rice Producer SCT (MXN mn) 17 85 72 91 91
Percentage SCT 6.9 13.0 12.5 14.4 12.2
Producer NPC 1.08 1.15 1.14 1.17 1.14
Consumer SCT (MXN mn) –30 0 0 0 0
Consumer NPC 1.06 1.00 1.00 1.00 1.00
Soybean Producer SCT (MXN mn) 75 61 4 76 102
Percentage SCT 14.4 16.0 1.3 14.7 32.0
Producer NPC 1.17 1.22 1.01 1.17 1.47
Consumer SCT (MXN mn) –307 0 0 0 0
Consumer NPC 1.19 1.00 1.00 1.00 1.00
Sugar Producer SCT (MXN mn) 2 114 5 423 5 249 6 351 4 671
Percentage SCT 56.1 28.9 30.5 31.3 25.0
Producer NPC 2.07 1.41 1.44 1.46 1.33
Consumer SCT (MXN mn) –1 699 –8 969 –9 303 –9 608 –7 996
Consumer NPC 1.98 1.74 1.80 1.83 1.61
Milk Producer SCT (MXN mn) 2 124 4 456 1 379 5 138 6 852
Percentage SCT 33.6 14.1 4.9 16.7 20.6
Producer NPC 1.59 1.18 1.06 1.20 1.27
Consumer SCT (MXN mn) –901 –3 928 –1 170 –4 536 –6 079
Consumer NPC 1.48 1.16 1.05 1.17 1.24
Beef and veal Producer SCT (MXN mn) 1 795 1 994 1 607 2 175 2 201
Percentage SCT 24.6 6.5 5.2 8.2 6.3
Producer NPC 1.33 1.00 1.00 1.00 1.00
Consumer SCT (MXN mn) –1 816 0 0 0 0
Consumer NPC 1.32 1.00 1.00 1.00 1.00
Pigmeat Producer SCT (MXN mn) 25 –133 –133 –18 –248
Percentage SCT 0.6 –0.8 –0.8 –0.1 –1.4
Producer NPC 1.06 1.00 1.00 1.00 1.00
Consumer SCT (MXN mn) –275 –22 –65 0 0
Consumer NPC 1.07 1.00 1.00 1.00 1.00
Poultry Producer SCT (MXN mn) 1 685 2 657 744 2 890 4 335
Percentage SCT 33.1 7.1 2.0 7.5 11.7
Producer NPC 1.62 1.08 1.03 1.08 1.14
Consumer SCT (MXN mn) –1 955 –2 822 –957 –2 909 –4 601
Consumer NPC 1.58 1.07 1.02 1.07 1.12
AGRICULTURAL POLICIES IN OECD COUNTRIES: MONITORING AND EVALUATION 2007 – ISBN 978-92-64-02746-6 – © OECD 2007 267
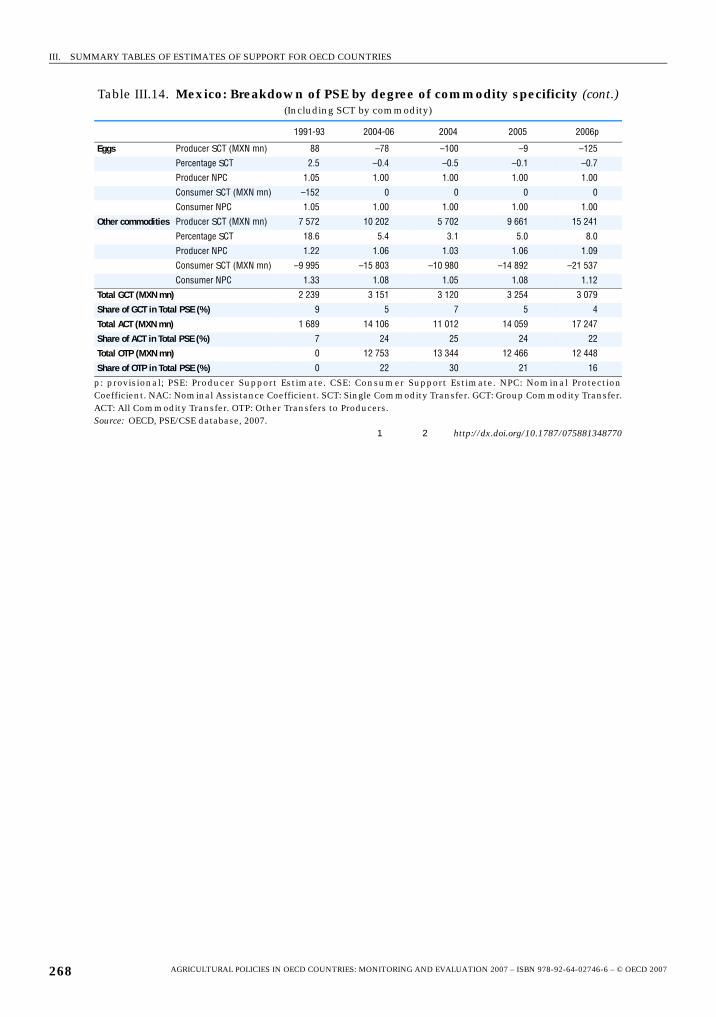
III. SUMMARY TABLES OF ESTIMATES OF SUPPORT FOR OECD COUNTRIES
Eggs Producer SCT (MXN mn) 88 –78 –100 –9 –125
Percentage SCT 2.5 –0.4 –0.5 –0.1 –0.7
Producer NPC 1.05 1.00 1.00 1.00 1.00
Consumer SCT (MXN mn) –152 0 0 0 0
Consumer NPC 1.05 1.00 1.00 1.00 1.00
Other commodities Producer SCT (MXN mn) 7 572 10 202 5 702 9 661 15 241
Percentage SCT 18.6 5.4 3.1 5.0 8.0
Producer NPC 1.22 1.06 1.03 1.06 1.09
Consumer SCT (MXN mn) –9 995 –15 803 –10 980 –14 892 –21 537
Consumer NPC 1.33 1.08 1.05 1.08 1.12
Total GCT (MXN mn) 2 239 3 151 3 120 3 254 3 079
Share of GCT in Total PSE (%) 9 5 7 5 4
Total ACT (MXN mn) 1 689 14 106 11 012 14 059 17 247
Share of ACT in Total PSE (%) 7 24 25 24 22
Total OTP (MXN mn) 0 12 753 13 344 12 466 12 448
Share of OTP in Total PSE (%) 0 22 30 21 16
p: provisional; PSE: Producer Support Estimate. CSE: Consumer Support Estimate. NPC: Nominal ProtectionCoefficient. NAC: Nominal Assistance Coefficient. SCT: Single Commodity Transfer. GCT: Group Commodity Transfer.ACT: All Commodity Transfer. OTP: Other Transfers to Producers.Source: OECD, PSE/CSE database, 2007.
1 2 http://dx.doi.org/10.1787/075881348770
Table III.14. Mexico: Breakdown of PSE by degree of commodity specificity (cont.)(Including SCT by commodity)
1991-93 2004-06 2004 2005 2006p
AGRICULTURAL POLICIES IN OECD COUNTRIES: MONITORING AND EVALUATION 2007 – ISBN 978-92-64-02746-6 – © OECD 2007268
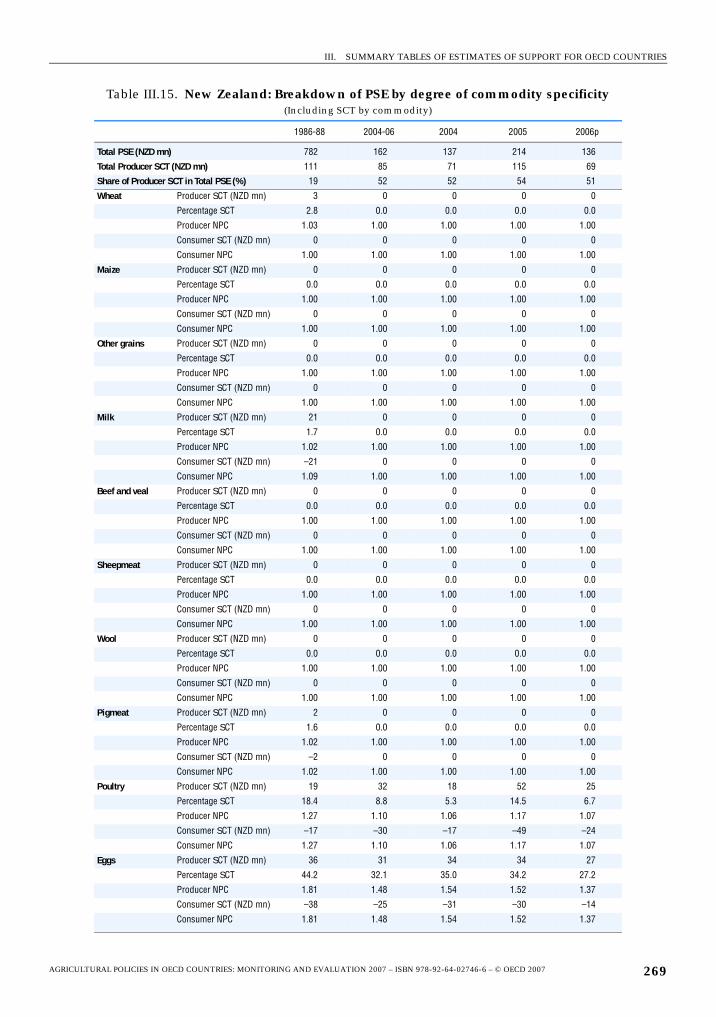
III. SUMMARY TABLES OF ESTIMATES OF SUPPORT FOR OECD COUNTRIES
Table III.15. New Zealand: Breakdown of PSE by degree of commodity specificity(Including SCT by commodity)
1986-88 2004-06 2004 2005 2006p
Total PSE (NZD mn) 782 162 137 214 136
Total Producer SCT (NZD mn) 111 85 71 115 69
Share of Producer SCT in Total PSE (%) 19 52 52 54 51
Wheat Producer SCT (NZD mn) 3 0 0 0 0
Percentage SCT 2.8 0.0 0.0 0.0 0.0
Producer NPC 1.03 1.00 1.00 1.00 1.00
Consumer SCT (NZD mn) 0 0 0 0 0
Consumer NPC 1.00 1.00 1.00 1.00 1.00
Maize Producer SCT (NZD mn) 0 0 0 0 0
Percentage SCT 0.0 0.0 0.0 0.0 0.0
Producer NPC 1.00 1.00 1.00 1.00 1.00
Consumer SCT (NZD mn) 0 0 0 0 0
Consumer NPC 1.00 1.00 1.00 1.00 1.00
Other grains Producer SCT (NZD mn) 0 0 0 0 0
Percentage SCT 0.0 0.0 0.0 0.0 0.0
Producer NPC 1.00 1.00 1.00 1.00 1.00
Consumer SCT (NZD mn) 0 0 0 0 0
Consumer NPC 1.00 1.00 1.00 1.00 1.00
Milk Producer SCT (NZD mn) 21 0 0 0 0
Percentage SCT 1.7 0.0 0.0 0.0 0.0
Producer NPC 1.02 1.00 1.00 1.00 1.00
Consumer SCT (NZD mn) –21 0 0 0 0
Consumer NPC 1.09 1.00 1.00 1.00 1.00
Beef and veal Producer SCT (NZD mn) 0 0 0 0 0
Percentage SCT 0.0 0.0 0.0 0.0 0.0
Producer NPC 1.00 1.00 1.00 1.00 1.00
Consumer SCT (NZD mn) 0 0 0 0 0
Consumer NPC 1.00 1.00 1.00 1.00 1.00
Sheepmeat Producer SCT (NZD mn) 0 0 0 0 0
Percentage SCT 0.0 0.0 0.0 0.0 0.0
Producer NPC 1.00 1.00 1.00 1.00 1.00
Consumer SCT (NZD mn) 0 0 0 0 0
Consumer NPC 1.00 1.00 1.00 1.00 1.00
Wool Producer SCT (NZD mn) 0 0 0 0 0
Percentage SCT 0.0 0.0 0.0 0.0 0.0
Producer NPC 1.00 1.00 1.00 1.00 1.00
Consumer SCT (NZD mn) 0 0 0 0 0
Consumer NPC 1.00 1.00 1.00 1.00 1.00
Pigmeat Producer SCT (NZD mn) 2 0 0 0 0
Percentage SCT 1.6 0.0 0.0 0.0 0.0
Producer NPC 1.02 1.00 1.00 1.00 1.00
Consumer SCT (NZD mn) –2 0 0 0 0
Consumer NPC 1.02 1.00 1.00 1.00 1.00
Poultry Producer SCT (NZD mn) 19 32 18 52 25
Percentage SCT 18.4 8.8 5.3 14.5 6.7
Producer NPC 1.27 1.10 1.06 1.17 1.07
Consumer SCT (NZD mn) –17 –30 –17 –49 –24
Consumer NPC 1.27 1.10 1.06 1.17 1.07
Eggs Producer SCT (NZD mn) 36 31 34 34 27
Percentage SCT 44.2 32.1 35.0 34.2 27.2
Producer NPC 1.81 1.48 1.54 1.52 1.37
Consumer SCT (NZD mn) –38 –25 –31 –30 –14
Consumer NPC 1.81 1.48 1.54 1.52 1.37
AGRICULTURAL POLICIES IN OECD COUNTRIES: MONITORING AND EVALUATION 2007 – ISBN 978-92-64-02746-6 – © OECD 2007 269
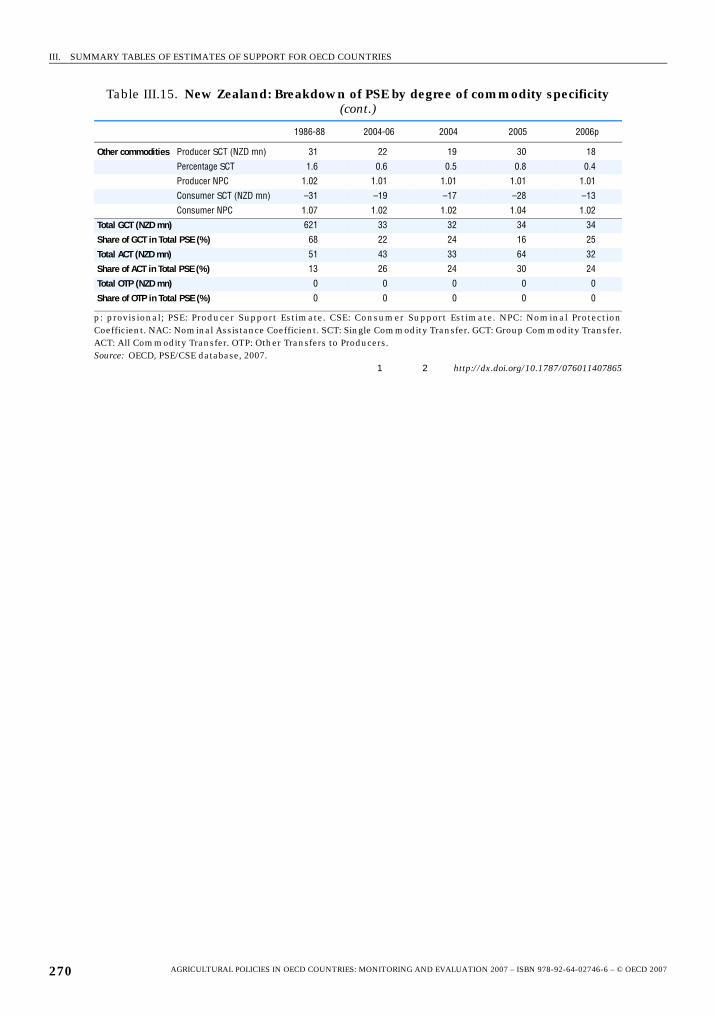
III. SUMMARY TABLES OF ESTIMATES OF SUPPORT FOR OECD COUNTRIES
Other commodities Producer SCT (NZD mn) 31 22 19 30 18
Percentage SCT 1.6 0.6 0.5 0.8 0.4
Producer NPC 1.02 1.01 1.01 1.01 1.01
Consumer SCT (NZD mn) –31 –19 –17 –28 –13
Consumer NPC 1.07 1.02 1.02 1.04 1.02
Total GCT (NZD mn) 621 33 32 34 34
Share of GCT in Total PSE (%) 68 22 24 16 25
Total ACT (NZD mn) 51 43 33 64 32
Share of ACT in Total PSE (%) 13 26 24 30 24
Total OTP (NZD mn) 0 0 0 0 0
Share of OTP in Total PSE (%) 0 0 0 0 0
p: provisional; PSE: Producer Support Estimate. CSE: Consumer Support Estimate. NPC: Nominal ProtectionCoefficient. NAC: Nominal Assistance Coefficient. SCT: Single Commodity Transfer. GCT: Group Commodity Transfer.ACT: All Commodity Transfer. OTP: Other Transfers to Producers.Source: OECD, PSE/CSE database, 2007.
1 2 http://dx.doi.org/10.1787/076011407865
Table III.15. New Zealand: Breakdown of PSE by degree of commodity specificity (cont.)
1986-88 2004-06 2004 2005 2006p
AGRICULTURAL POLICIES IN OECD COUNTRIES: MONITORING AND EVALUATION 2007 – ISBN 978-92-64-02746-6 – © OECD 2007270
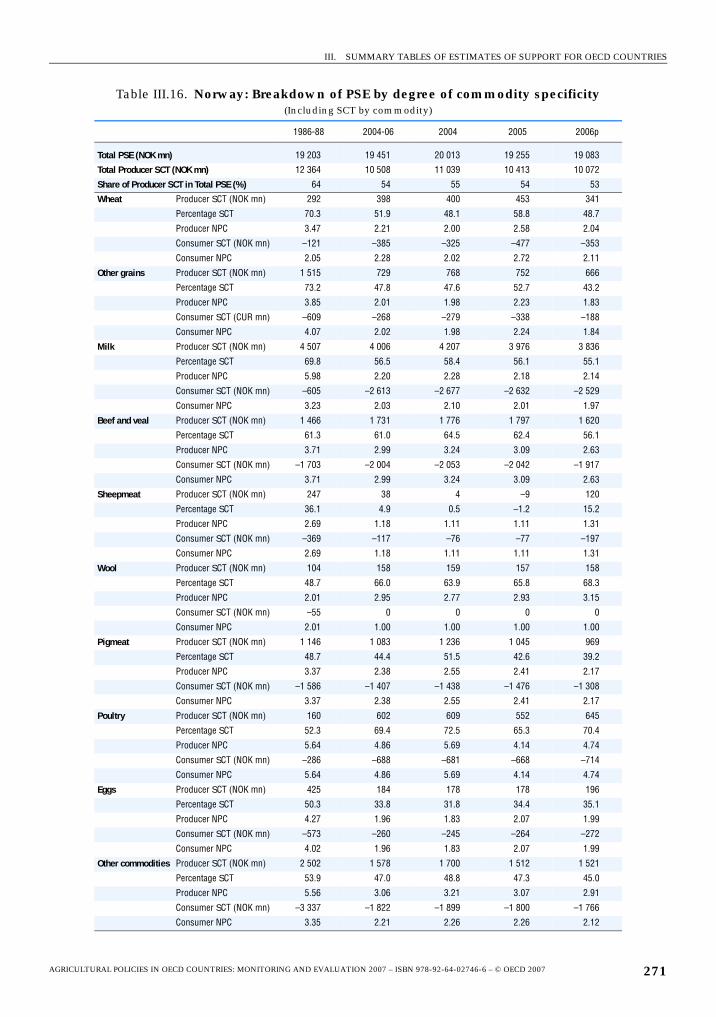
III. SUMMARY TABLES OF ESTIMATES OF SUPPORT FOR OECD COUNTRIES
Table III.16. Norway: Breakdown of PSE by degree of commodity specificity(Including SCT by commodity)
1986-88 2004-06 2004 2005 2006p
Total PSE (NOK mn) 19 203 19 451 20 013 19 255 19 083
Total Producer SCT (NOK mn) 12 364 10 508 11 039 10 413 10 072
Share of Producer SCT in Total PSE (%) 64 54 55 54 53
Wheat Producer SCT (NOK mn) 292 398 400 453 341
Percentage SCT 70.3 51.9 48.1 58.8 48.7
Producer NPC 3.47 2.21 2.00 2.58 2.04
Consumer SCT (NOK mn) –121 –385 –325 –477 –353
Consumer NPC 2.05 2.28 2.02 2.72 2.11
Other grains Producer SCT (NOK mn) 1 515 729 768 752 666
Percentage SCT 73.2 47.8 47.6 52.7 43.2
Producer NPC 3.85 2.01 1.98 2.23 1.83
Consumer SCT (CUR mn) –609 –268 –279 –338 –188
Consumer NPC 4.07 2.02 1.98 2.24 1.84
Milk Producer SCT (NOK mn) 4 507 4 006 4 207 3 976 3 836
Percentage SCT 69.8 56.5 58.4 56.1 55.1
Producer NPC 5.98 2.20 2.28 2.18 2.14
Consumer SCT (NOK mn) –605 –2 613 –2 677 –2 632 –2 529
Consumer NPC 3.23 2.03 2.10 2.01 1.97
Beef and veal Producer SCT (NOK mn) 1 466 1 731 1 776 1 797 1 620
Percentage SCT 61.3 61.0 64.5 62.4 56.1
Producer NPC 3.71 2.99 3.24 3.09 2.63
Consumer SCT (NOK mn) –1 703 –2 004 –2 053 –2 042 –1 917
Consumer NPC 3.71 2.99 3.24 3.09 2.63
Sheepmeat Producer SCT (NOK mn) 247 38 4 –9 120
Percentage SCT 36.1 4.9 0.5 –1.2 15.2
Producer NPC 2.69 1.18 1.11 1.11 1.31
Consumer SCT (NOK mn) –369 –117 –76 –77 –197
Consumer NPC 2.69 1.18 1.11 1.11 1.31
Wool Producer SCT (NOK mn) 104 158 159 157 158
Percentage SCT 48.7 66.0 63.9 65.8 68.3
Producer NPC 2.01 2.95 2.77 2.93 3.15
Consumer SCT (NOK mn) –55 0 0 0 0
Consumer NPC 2.01 1.00 1.00 1.00 1.00
Pigmeat Producer SCT (NOK mn) 1 146 1 083 1 236 1 045 969
Percentage SCT 48.7 44.4 51.5 42.6 39.2
Producer NPC 3.37 2.38 2.55 2.41 2.17
Consumer SCT (NOK mn) –1 586 –1 407 –1 438 –1 476 –1 308
Consumer NPC 3.37 2.38 2.55 2.41 2.17
Poultry Producer SCT (NOK mn) 160 602 609 552 645
Percentage SCT 52.3 69.4 72.5 65.3 70.4
Producer NPC 5.64 4.86 5.69 4.14 4.74
Consumer SCT (NOK mn) –286 –688 –681 –668 –714
Consumer NPC 5.64 4.86 5.69 4.14 4.74
Eggs Producer SCT (NOK mn) 425 184 178 178 196
Percentage SCT 50.3 33.8 31.8 34.4 35.1
Producer NPC 4.27 1.96 1.83 2.07 1.99
Consumer SCT (NOK mn) –573 –260 –245 –264 –272
Consumer NPC 4.02 1.96 1.83 2.07 1.99
Other commodities Producer SCT (NOK mn) 2 502 1 578 1 700 1 512 1 521
Percentage SCT 53.9 47.0 48.8 47.3 45.0
Producer NPC 5.56 3.06 3.21 3.07 2.91
Consumer SCT (NOK mn) –3 337 –1 822 –1 899 –1 800 –1 766
Consumer NPC 3.35 2.21 2.26 2.26 2.12
AGRICULTURAL POLICIES IN OECD COUNTRIES: MONITORING AND EVALUATION 2007 – ISBN 978-92-64-02746-6 – © OECD 2007 271
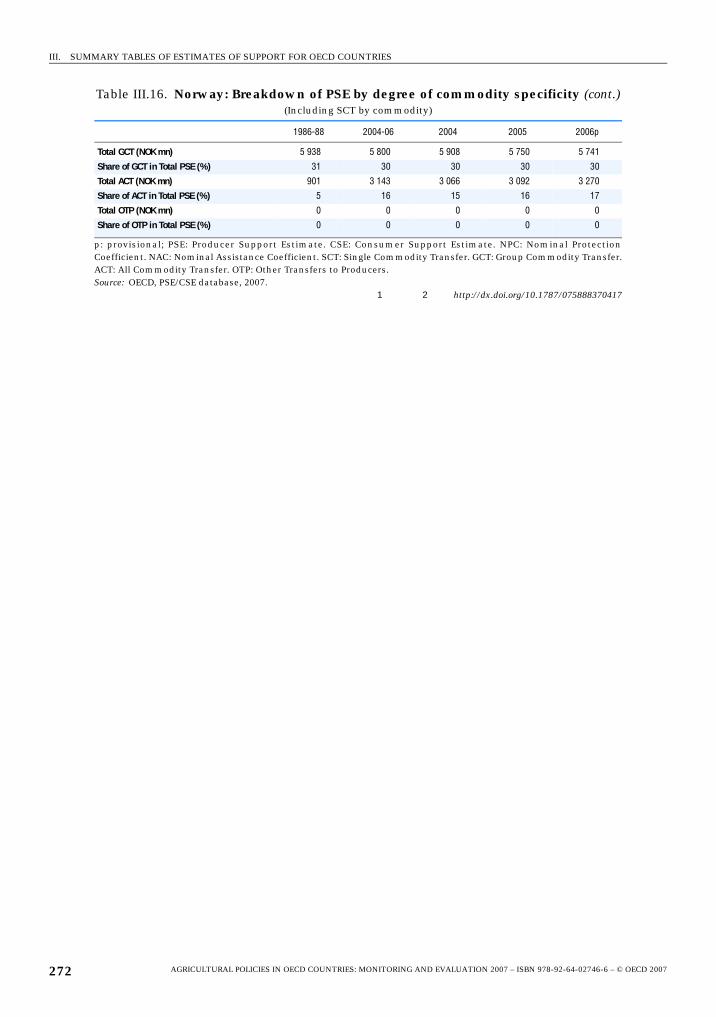
III. SUMMARY TABLES OF ESTIMATES OF SUPPORT FOR OECD COUNTRIES
Total GCT (NOK mn) 5 938 5 800 5 908 5 750 5 741
Share of GCT in Total PSE (%) 31 30 30 30 30
Total ACT (NOK mn) 901 3 143 3 066 3 092 3 270
Share of ACT in Total PSE (%) 5 16 15 16 17
Total OTP (NOK mn) 0 0 0 0 0
Share of OTP in Total PSE (%) 0 0 0 0 0
p: provisional; PSE: Producer Support Estimate. CSE: Consumer Support Estimate. NPC: Nominal ProtectionCoefficient. NAC: Nominal Assistance Coefficient. SCT: Single Commodity Transfer. GCT: Group Commodity Transfer.ACT: All Commodity Transfer. OTP: Other Transfers to Producers.Source: OECD, PSE/CSE database, 2007.
1 2 http://dx.doi.org/10.1787/075888370417
Table III.16. Norway: Breakdown of PSE by degree of commodity specificity (cont.)(Including SCT by commodity)
1986-88 2004-06 2004 2005 2006p
AGRICULTURAL POLICIES IN OECD COUNTRIES: MONITORING AND EVALUATION 2007 – ISBN 978-92-64-02746-6 – © OECD 2007272
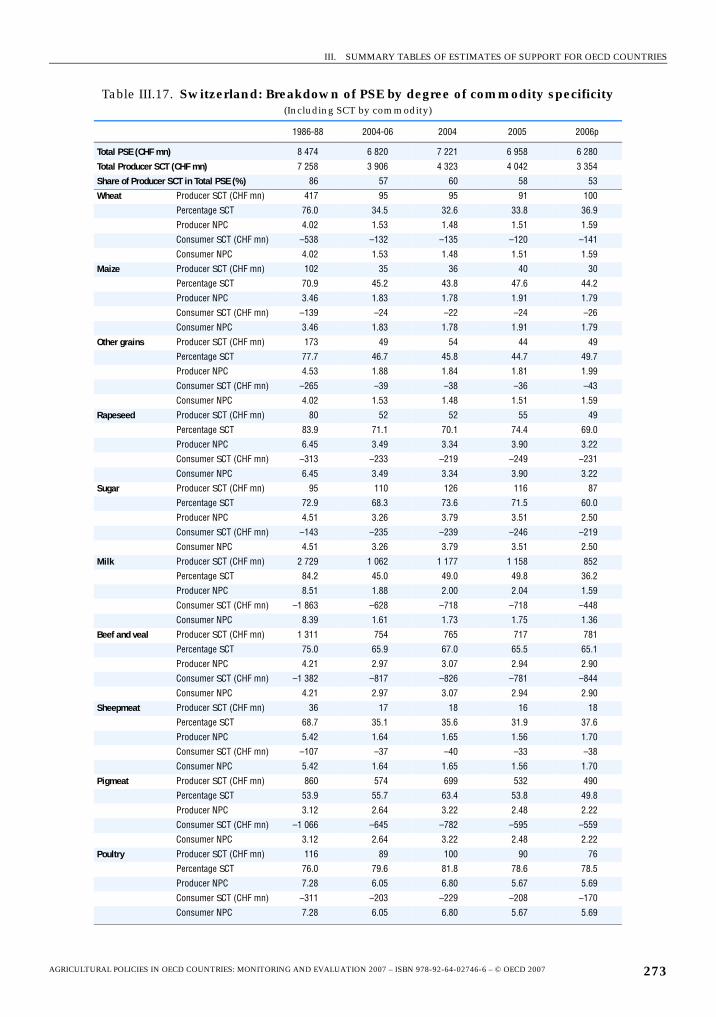
III. SUMMARY TABLES OF ESTIMATES OF SUPPORT FOR OECD COUNTRIES
Table III.17. Switzerland: Breakdown of PSE by degree of commodity specificity(Including SCT by commodity)
1986-88 2004-06 2004 2005 2006p
Total PSE (CHF mn) 8 474 6 820 7 221 6 958 6 280
Total Producer SCT (CHF mn) 7 258 3 906 4 323 4 042 3 354
Share of Producer SCT in Total PSE (%) 86 57 60 58 53
Wheat Producer SCT (CHF mn) 417 95 95 91 100
Percentage SCT 76.0 34.5 32.6 33.8 36.9
Producer NPC 4.02 1.53 1.48 1.51 1.59
Consumer SCT (CHF mn) –538 –132 –135 –120 –141
Consumer NPC 4.02 1.53 1.48 1.51 1.59
Maize Producer SCT (CHF mn) 102 35 36 40 30
Percentage SCT 70.9 45.2 43.8 47.6 44.2
Producer NPC 3.46 1.83 1.78 1.91 1.79
Consumer SCT (CHF mn) –139 –24 –22 –24 –26
Consumer NPC 3.46 1.83 1.78 1.91 1.79
Other grains Producer SCT (CHF mn) 173 49 54 44 49
Percentage SCT 77.7 46.7 45.8 44.7 49.7
Producer NPC 4.53 1.88 1.84 1.81 1.99
Consumer SCT (CHF mn) –265 –39 –38 –36 –43
Consumer NPC 4.02 1.53 1.48 1.51 1.59
Rapeseed Producer SCT (CHF mn) 80 52 52 55 49
Percentage SCT 83.9 71.1 70.1 74.4 69.0
Producer NPC 6.45 3.49 3.34 3.90 3.22
Consumer SCT (CHF mn) –313 –233 –219 –249 –231
Consumer NPC 6.45 3.49 3.34 3.90 3.22
Sugar Producer SCT (CHF mn) 95 110 126 116 87
Percentage SCT 72.9 68.3 73.6 71.5 60.0
Producer NPC 4.51 3.26 3.79 3.51 2.50
Consumer SCT (CHF mn) –143 –235 –239 –246 –219
Consumer NPC 4.51 3.26 3.79 3.51 2.50
Milk Producer SCT (CHF mn) 2 729 1 062 1 177 1 158 852
Percentage SCT 84.2 45.0 49.0 49.8 36.2
Producer NPC 8.51 1.88 2.00 2.04 1.59
Consumer SCT (CHF mn) –1 863 –628 –718 –718 –448
Consumer NPC 8.39 1.61 1.73 1.75 1.36
Beef and veal Producer SCT (CHF mn) 1 311 754 765 717 781
Percentage SCT 75.0 65.9 67.0 65.5 65.1
Producer NPC 4.21 2.97 3.07 2.94 2.90
Consumer SCT (CHF mn) –1 382 –817 –826 –781 –844
Consumer NPC 4.21 2.97 3.07 2.94 2.90
Sheepmeat Producer SCT (CHF mn) 36 17 18 16 18
Percentage SCT 68.7 35.1 35.6 31.9 37.6
Producer NPC 5.42 1.64 1.65 1.56 1.70
Consumer SCT (CHF mn) –107 –37 –40 –33 –38
Consumer NPC 5.42 1.64 1.65 1.56 1.70
Pigmeat Producer SCT (CHF mn) 860 574 699 532 490
Percentage SCT 53.9 55.7 63.4 53.8 49.8
Producer NPC 3.12 2.64 3.22 2.48 2.22
Consumer SCT (CHF mn) –1 066 –645 –782 –595 –559
Consumer NPC 3.12 2.64 3.22 2.48 2.22
Poultry Producer SCT (CHF mn) 116 89 100 90 76
Percentage SCT 76.0 79.6 81.8 78.6 78.5
Producer NPC 7.28 6.05 6.80 5.67 5.69
Consumer SCT (CHF mn) –311 –203 –229 –208 –170
Consumer NPC 7.28 6.05 6.80 5.67 5.69
AGRICULTURAL POLICIES IN OECD COUNTRIES: MONITORING AND EVALUATION 2007 – ISBN 978-92-64-02746-6 – © OECD 2007 273
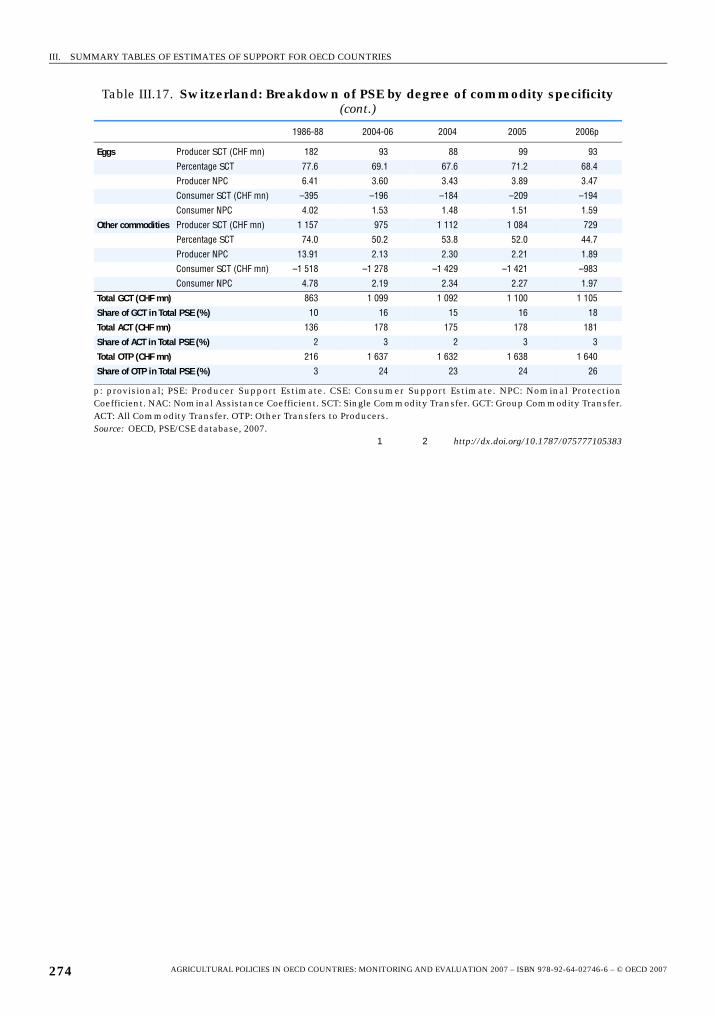
III. SUMMARY TABLES OF ESTIMATES OF SUPPORT FOR OECD COUNTRIES
Eggs Producer SCT (CHF mn) 182 93 88 99 93
Percentage SCT 77.6 69.1 67.6 71.2 68.4
Producer NPC 6.41 3.60 3.43 3.89 3.47
Consumer SCT (CHF mn) –395 –196 –184 –209 –194
Consumer NPC 4.02 1.53 1.48 1.51 1.59
Other commodities Producer SCT (CHF mn) 1 157 975 1 112 1 084 729
Percentage SCT 74.0 50.2 53.8 52.0 44.7
Producer NPC 13.91 2.13 2.30 2.21 1.89
Consumer SCT (CHF mn) –1 518 –1 278 –1 429 –1 421 –983
Consumer NPC 4.78 2.19 2.34 2.27 1.97
Total GCT (CHF mn) 863 1 099 1 092 1 100 1 105
Share of GCT in Total PSE (%) 10 16 15 16 18
Total ACT (CHF mn) 136 178 175 178 181
Share of ACT in Total PSE (%) 2 3 2 3 3
Total OTP (CHF mn) 216 1 637 1 632 1 638 1 640
Share of OTP in Total PSE (%) 3 24 23 24 26
p: provisional; PSE: Producer Support Estimate. CSE: Consumer Support Estimate. NPC: Nominal ProtectionCoefficient. NAC: Nominal Assistance Coefficient. SCT: Single Commodity Transfer. GCT: Group Commodity Transfer.ACT: All Commodity Transfer. OTP: Other Transfers to Producers.Source: OECD, PSE/CSE database, 2007.
1 2 http://dx.doi.org/10.1787/075777105383
Table III.17. Switzerland: Breakdown of PSE by degree of commodity specificity (cont.)
1986-88 2004-06 2004 2005 2006p
AGRICULTURAL POLICIES IN OECD COUNTRIES: MONITORING AND EVALUATION 2007 – ISBN 978-92-64-02746-6 – © OECD 2007274
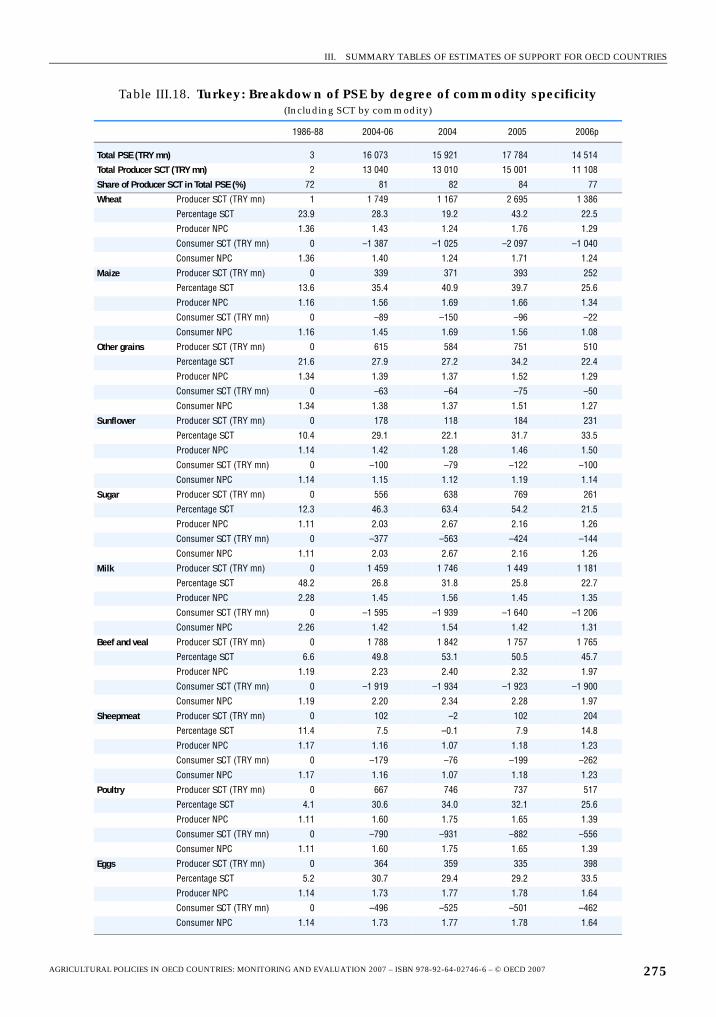
III. SUMMARY TABLES OF ESTIMATES OF SUPPORT FOR OECD COUNTRIES
Table III.18. Turkey: Breakdown of PSE by degree of commodity specificity(Including SCT by commodity)
1986-88 2004-06 2004 2005 2006p
Total PSE (TRY mn) 3 16 073 15 921 17 784 14 514
Total Producer SCT (TRY mn) 2 13 040 13 010 15 001 11 108
Share of Producer SCT in Total PSE (%) 72 81 82 84 77
Wheat Producer SCT (TRY mn) 1 1 749 1 167 2 695 1 386
Percentage SCT 23.9 28.3 19.2 43.2 22.5
Producer NPC 1.36 1.43 1.24 1.76 1.29
Consumer SCT (TRY mn) 0 –1 387 –1 025 –2 097 –1 040
Consumer NPC 1.36 1.40 1.24 1.71 1.24
Maize Producer SCT (TRY mn) 0 339 371 393 252
Percentage SCT 13.6 35.4 40.9 39.7 25.6
Producer NPC 1.16 1.56 1.69 1.66 1.34
Consumer SCT (TRY mn) 0 –89 –150 –96 –22
Consumer NPC 1.16 1.45 1.69 1.56 1.08
Other grains Producer SCT (TRY mn) 0 615 584 751 510
Percentage SCT 21.6 27.9 27.2 34.2 22.4
Producer NPC 1.34 1.39 1.37 1.52 1.29
Consumer SCT (TRY mn) 0 –63 –64 –75 –50
Consumer NPC 1.34 1.38 1.37 1.51 1.27
Sunflower Producer SCT (TRY mn) 0 178 118 184 231
Percentage SCT 10.4 29.1 22.1 31.7 33.5
Producer NPC 1.14 1.42 1.28 1.46 1.50
Consumer SCT (TRY mn) 0 –100 –79 –122 –100
Consumer NPC 1.14 1.15 1.12 1.19 1.14
Sugar Producer SCT (TRY mn) 0 556 638 769 261
Percentage SCT 12.3 46.3 63.4 54.2 21.5
Producer NPC 1.11 2.03 2.67 2.16 1.26
Consumer SCT (TRY mn) 0 –377 –563 –424 –144
Consumer NPC 1.11 2.03 2.67 2.16 1.26
Milk Producer SCT (TRY mn) 0 1 459 1 746 1 449 1 181
Percentage SCT 48.2 26.8 31.8 25.8 22.7
Producer NPC 2.28 1.45 1.56 1.45 1.35
Consumer SCT (TRY mn) 0 –1 595 –1 939 –1 640 –1 206
Consumer NPC 2.26 1.42 1.54 1.42 1.31
Beef and veal Producer SCT (TRY mn) 0 1 788 1 842 1 757 1 765
Percentage SCT 6.6 49.8 53.1 50.5 45.7
Producer NPC 1.19 2.23 2.40 2.32 1.97
Consumer SCT (TRY mn) 0 –1 919 –1 934 –1 923 –1 900
Consumer NPC 1.19 2.20 2.34 2.28 1.97
Sheepmeat Producer SCT (TRY mn) 0 102 –2 102 204
Percentage SCT 11.4 7.5 –0.1 7.9 14.8
Producer NPC 1.17 1.16 1.07 1.18 1.23
Consumer SCT (TRY mn) 0 –179 –76 –199 –262
Consumer NPC 1.17 1.16 1.07 1.18 1.23
Poultry Producer SCT (TRY mn) 0 667 746 737 517
Percentage SCT 4.1 30.6 34.0 32.1 25.6
Producer NPC 1.11 1.60 1.75 1.65 1.39
Consumer SCT (TRY mn) 0 –790 –931 –882 –556
Consumer NPC 1.11 1.60 1.75 1.65 1.39
Eggs Producer SCT (TRY mn) 0 364 359 335 398
Percentage SCT 5.2 30.7 29.4 29.2 33.5
Producer NPC 1.14 1.73 1.77 1.78 1.64
Consumer SCT (TRY mn) 0 –496 –525 –501 –462
Consumer NPC 1.14 1.73 1.77 1.78 1.64
AGRICULTURAL POLICIES IN OECD COUNTRIES: MONITORING AND EVALUATION 2007 – ISBN 978-92-64-02746-6 – © OECD 2007 275
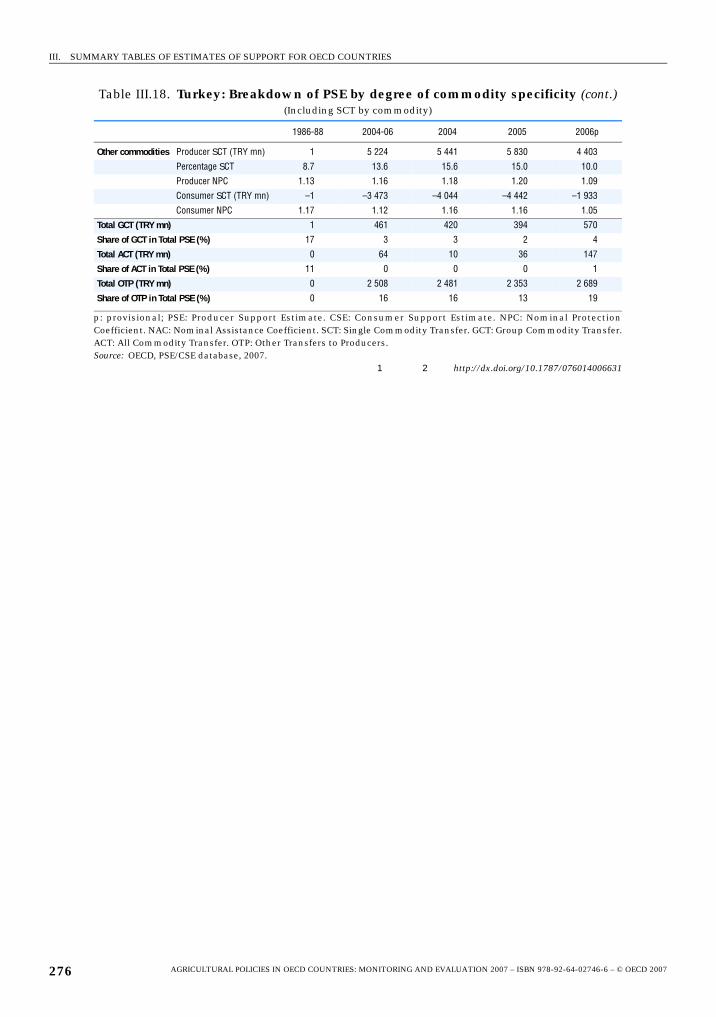
III. SUMMARY TABLES OF ESTIMATES OF SUPPORT FOR OECD COUNTRIES
Other commodities Producer SCT (TRY mn) 1 5 224 5 441 5 830 4 403
Percentage SCT 8.7 13.6 15.6 15.0 10.0
Producer NPC 1.13 1.16 1.18 1.20 1.09
Consumer SCT (TRY mn) –1 –3 473 –4 044 –4 442 –1 933
Consumer NPC 1.17 1.12 1.16 1.16 1.05
Total GCT (TRY mn) 1 461 420 394 570
Share of GCT in Total PSE (%) 17 3 3 2 4
Total ACT (TRY mn) 0 64 10 36 147
Share of ACT in Total PSE (%) 11 0 0 0 1
Total OTP (TRY mn) 0 2 508 2 481 2 353 2 689
Share of OTP in Total PSE (%) 0 16 16 13 19
p: provisional; PSE: Producer Support Estimate. CSE: Consumer Support Estimate. NPC: Nominal ProtectionCoefficient. NAC: Nominal Assistance Coefficient. SCT: Single Commodity Transfer. GCT: Group Commodity Transfer.ACT: All Commodity Transfer. OTP: Other Transfers to Producers.Source: OECD, PSE/CSE database, 2007.
1 2 http://dx.doi.org/10.1787/076014006631
Table III.18. Turkey: Breakdown of PSE by degree of commodity specificity (cont.)(Including SCT by commodity)
1986-88 2004-06 2004 2005 2006p
AGRICULTURAL POLICIES IN OECD COUNTRIES: MONITORING AND EVALUATION 2007 – ISBN 978-92-64-02746-6 – © OECD 2007276
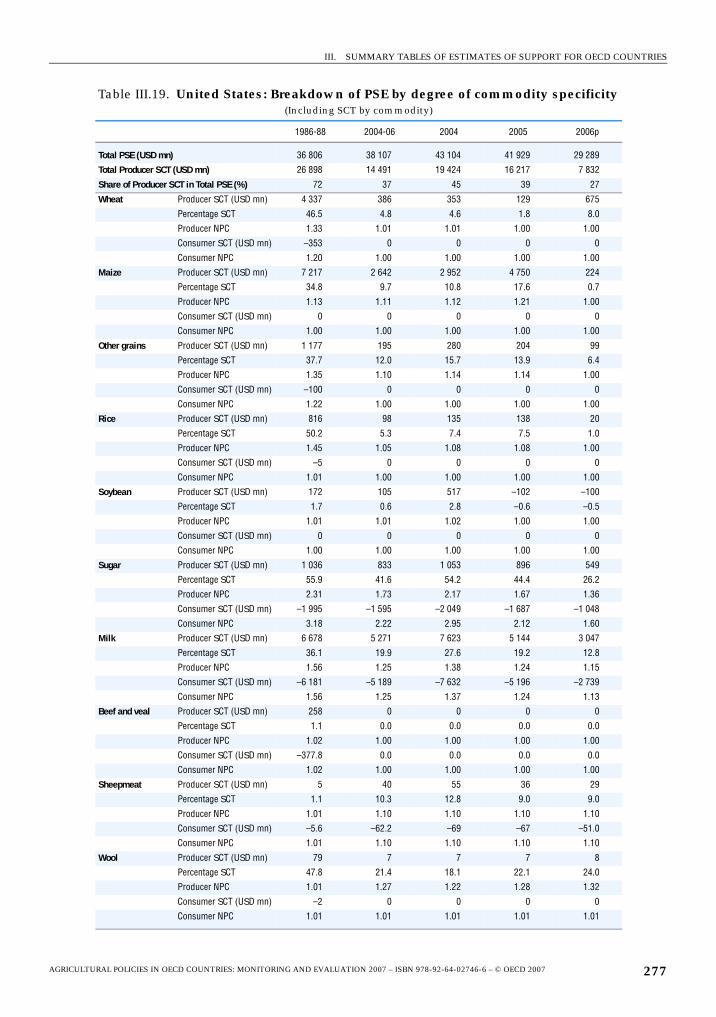
III. SUMMARY TABLES OF ESTIMATES OF SUPPORT FOR OECD COUNTRIES
Table III.19. United States: Breakdown of PSE by degree of commodity specificity(Including SCT by commodity)
1986-88 2004-06 2004 2005 2006p
Total PSE (USD mn) 36 806 38 107 43 104 41 929 29 289
Total Producer SCT (USD mn) 26 898 14 491 19 424 16 217 7 832
Share of Producer SCT in Total PSE (%) 72 37 45 39 27
Wheat Producer SCT (USD mn) 4 337 386 353 129 675
Percentage SCT 46.5 4.8 4.6 1.8 8.0
Producer NPC 1.33 1.01 1.01 1.00 1.00
Consumer SCT (USD mn) –353 0 0 0 0
Consumer NPC 1.20 1.00 1.00 1.00 1.00
Maize Producer SCT (USD mn) 7 217 2 642 2 952 4 750 224
Percentage SCT 34.8 9.7 10.8 17.6 0.7
Producer NPC 1.13 1.11 1.12 1.21 1.00
Consumer SCT (USD mn) 0 0 0 0 0
Consumer NPC 1.00 1.00 1.00 1.00 1.00
Other grains Producer SCT (USD mn) 1 177 195 280 204 99
Percentage SCT 37.7 12.0 15.7 13.9 6.4
Producer NPC 1.35 1.10 1.14 1.14 1.00
Consumer SCT (USD mn) –100 0 0 0 0
Consumer NPC 1.22 1.00 1.00 1.00 1.00
Rice Producer SCT (USD mn) 816 98 135 138 20
Percentage SCT 50.2 5.3 7.4 7.5 1.0
Producer NPC 1.45 1.05 1.08 1.08 1.00
Consumer SCT (USD mn) –5 0 0 0 0
Consumer NPC 1.01 1.00 1.00 1.00 1.00
Soybean Producer SCT (USD mn) 172 105 517 –102 –100
Percentage SCT 1.7 0.6 2.8 –0.6 –0.5
Producer NPC 1.01 1.01 1.02 1.00 1.00
Consumer SCT (USD mn) 0 0 0 0 0
Consumer NPC 1.00 1.00 1.00 1.00 1.00
Sugar Producer SCT (USD mn) 1 036 833 1 053 896 549
Percentage SCT 55.9 41.6 54.2 44.4 26.2
Producer NPC 2.31 1.73 2.17 1.67 1.36
Consumer SCT (USD mn) –1 995 –1 595 –2 049 –1 687 –1 048
Consumer NPC 3.18 2.22 2.95 2.12 1.60
Milk Producer SCT (USD mn) 6 678 5 271 7 623 5 144 3 047
Percentage SCT 36.1 19.9 27.6 19.2 12.8
Producer NPC 1.56 1.25 1.38 1.24 1.15
Consumer SCT (USD mn) –6 181 –5 189 –7 632 –5 196 –2 739
Consumer NPC 1.56 1.25 1.37 1.24 1.13
Beef and veal Producer SCT (USD mn) 258 0 0 0 0
Percentage SCT 1.1 0.0 0.0 0.0 0.0
Producer NPC 1.02 1.00 1.00 1.00 1.00
Consumer SCT (USD mn) –377.8 0.0 0.0 0.0 0.0
Consumer NPC 1.02 1.00 1.00 1.00 1.00
Sheepmeat Producer SCT (USD mn) 5 40 55 36 29
Percentage SCT 1.1 10.3 12.8 9.0 9.0
Producer NPC 1.01 1.10 1.10 1.10 1.10
Consumer SCT (USD mn) –5.6 –62.2 –69 –67 –51.0
Consumer NPC 1.01 1.10 1.10 1.10 1.10
Wool Producer SCT (USD mn) 79 7 7 7 8
Percentage SCT 47.8 21.4 18.1 22.1 24.0
Producer NPC 1.01 1.27 1.22 1.28 1.32
Consumer SCT (USD mn) –2 0 0 0 0
Consumer NPC 1.01 1.01 1.01 1.01 1.01
AGRICULTURAL POLICIES IN OECD COUNTRIES: MONITORING AND EVALUATION 2007 – ISBN 978-92-64-02746-6 – © OECD 2007 277
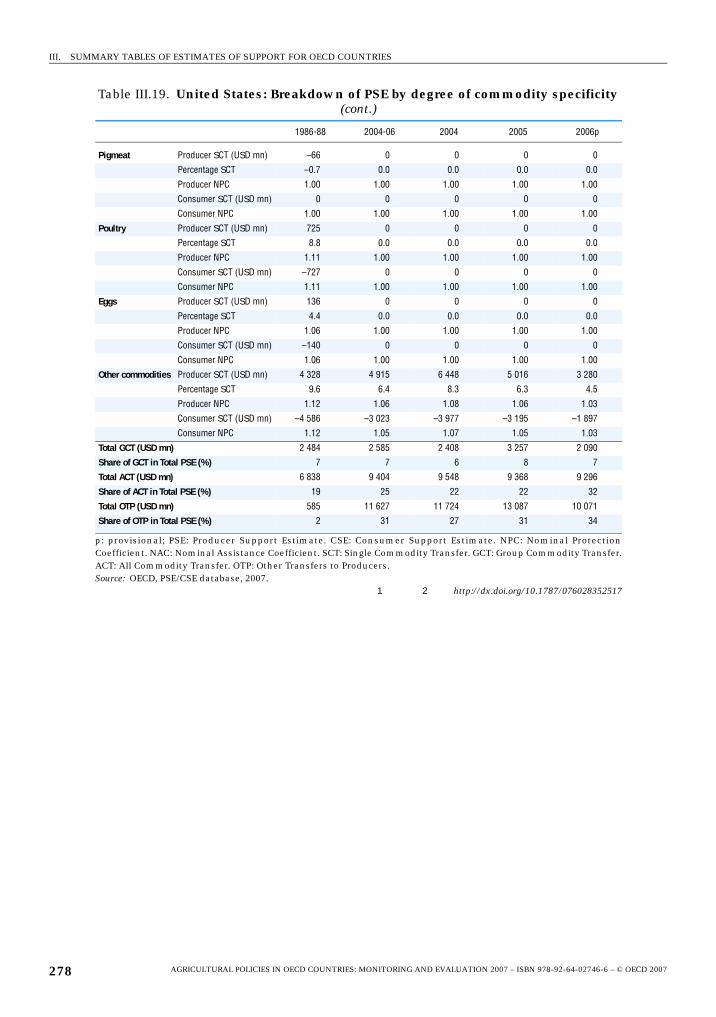
III. SUMMARY TABLES OF ESTIMATES OF SUPPORT FOR OECD COUNTRIES
Pigmeat Producer SCT (USD mn) –66 0 0 0 0
Percentage SCT –0.7 0.0 0.0 0.0 0.0
Producer NPC 1.00 1.00 1.00 1.00 1.00
Consumer SCT (USD mn) 0 0 0 0 0
Consumer NPC 1.00 1.00 1.00 1.00 1.00
Poultry Producer SCT (USD mn) 725 0 0 0 0
Percentage SCT 8.8 0.0 0.0 0.0 0.0
Producer NPC 1.11 1.00 1.00 1.00 1.00
Consumer SCT (USD mn) –727 0 0 0 0
Consumer NPC 1.11 1.00 1.00 1.00 1.00
Eggs Producer SCT (USD mn) 136 0 0 0 0
Percentage SCT 4.4 0.0 0.0 0.0 0.0
Producer NPC 1.06 1.00 1.00 1.00 1.00
Consumer SCT (USD mn) –140 0 0 0 0
Consumer NPC 1.06 1.00 1.00 1.00 1.00
Other commodities Producer SCT (USD mn) 4 328 4 915 6 448 5 016 3 280
Percentage SCT 9.6 6.4 8.3 6.3 4.5
Producer NPC 1.12 1.06 1.08 1.06 1.03
Consumer SCT (USD mn) –4 586 –3 023 –3 977 –3 195 –1 897
Consumer NPC 1.12 1.05 1.07 1.05 1.03
Total GCT (USD mn) 2 484 2 585 2 408 3 257 2 090
Share of GCT in Total PSE (%) 7 7 6 8 7
Total ACT (USD mn) 6 838 9 404 9 548 9 368 9 296
Share of ACT in Total PSE (%) 19 25 22 22 32
Total OTP (USD mn) 585 11 627 11 724 13 087 10 071
Share of OTP in Total PSE (%) 2 31 27 31 34
p: provisional; PSE: Producer Support Estimate. CSE: Consumer Support Estimate. NPC: Nominal ProtectionCoefficient. NAC: Nominal Assistance Coefficient. SCT: Single Commodity Transfer. GCT: Group Commodity Transfer.ACT: All Commodity Transfer. OTP: Other Transfers to Producers.Source: OECD, PSE/CSE database, 2007.
1 2 http://dx.doi.org/10.1787/076028352517
Table III.19. United States: Breakdown of PSE by degree of commodity specificity (cont.)
1986-88 2004-06 2004 2005 2006p
AGRICULTURAL POLICIES IN OECD COUNTRIES: MONITORING AND EVALUATION 2007 – ISBN 978-92-64-02746-6 – © OECD 2007278
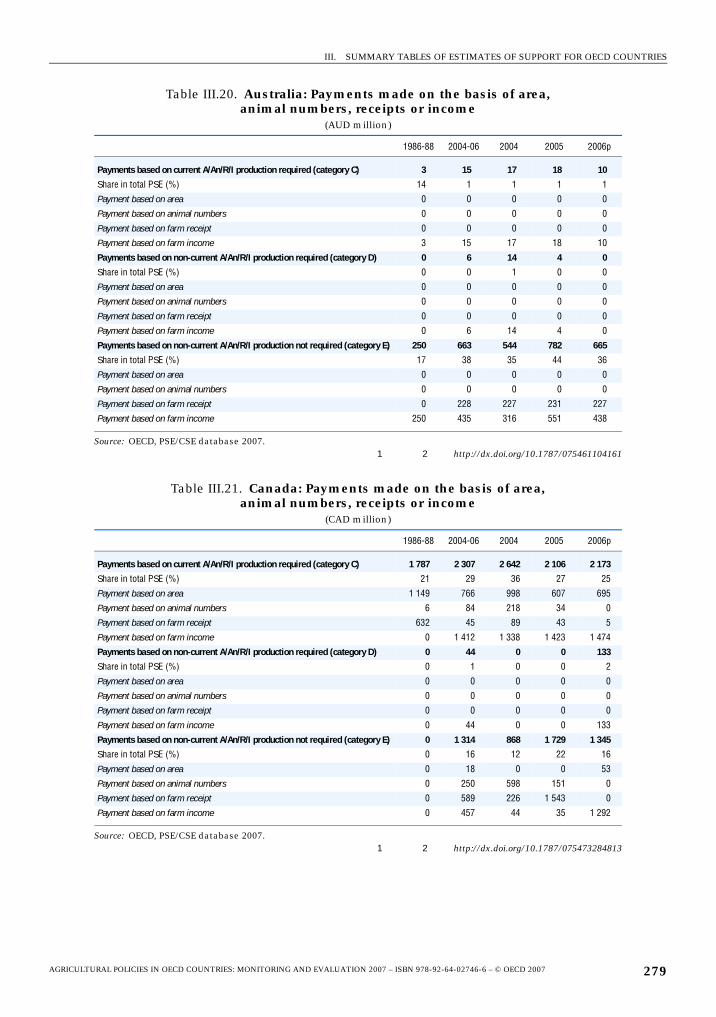
III. SUMMARY TABLES OF ESTIMATES OF SUPPORT FOR OECD COUNTRIES
Table III.20. Australia: Payments made on the basis of area,animal numbers, receipts or income
(AUD million)
1986-88 2004-06 2004 2005 2006p
Payments based on current A/An/R/I production required (category C) 3 15 17 18 10
Share in total PSE (%) 14 1 1 1 1
Payment based on area 0 0 0 0 0
Payment based on animal numbers 0 0 0 0 0
Payment based on farm receipt 0 0 0 0 0
Payment based on farm income 3 15 17 18 10
Payments based on non-current A/An/R/I production required (category D) 0 6 14 4 0
Share in total PSE (%) 0 0 1 0 0
Payment based on area 0 0 0 0 0
Payment based on animal numbers 0 0 0 0 0
Payment based on farm receipt 0 0 0 0 0
Payment based on farm income 0 6 14 4 0
Payments based on non-current A/An/R/I production not required (category E) 250 663 544 782 665
Share in total PSE (%) 17 38 35 44 36
Payment based on area 0 0 0 0 0
Payment based on animal numbers 0 0 0 0 0
Payment based on farm receipt 0 228 227 231 227
Payment based on farm income 250 435 316 551 438
Source: OECD, PSE/CSE database 2007.1 2 http://dx.doi.org/10.1787/075461104161
Table III.21. Canada: Payments made on the basis of area,animal numbers, receipts or income
(CAD million)
1986-88 2004-06 2004 2005 2006p
Payments based on current A/An/R/I production required (category C) 1 787 2 307 2 642 2 106 2 173
Share in total PSE (%) 21 29 36 27 25
Payment based on area 1 149 766 998 607 695
Payment based on animal numbers 6 84 218 34 0
Payment based on farm receipt 632 45 89 43 5
Payment based on farm income 0 1 412 1 338 1 423 1 474
Payments based on non-current A/An/R/I production required (category D) 0 44 0 0 133
Share in total PSE (%) 0 1 0 0 2
Payment based on area 0 0 0 0 0
Payment based on animal numbers 0 0 0 0 0
Payment based on farm receipt 0 0 0 0 0
Payment based on farm income 0 44 0 0 133
Payments based on non-current A/An/R/I production not required (category E) 0 1 314 868 1 729 1 345
Share in total PSE (%) 0 16 12 22 16
Payment based on area 0 18 0 0 53
Payment based on animal numbers 0 250 598 151 0
Payment based on farm receipt 0 589 226 1 543 0
Payment based on farm income 0 457 44 35 1 292
Source: OECD, PSE/CSE database 2007.1 2 http://dx.doi.org/10.1787/075473284813
AGRICULTURAL POLICIES IN OECD COUNTRIES: MONITORING AND EVALUATION 2007 – ISBN 978-92-64-02746-6 – © OECD 2007 279
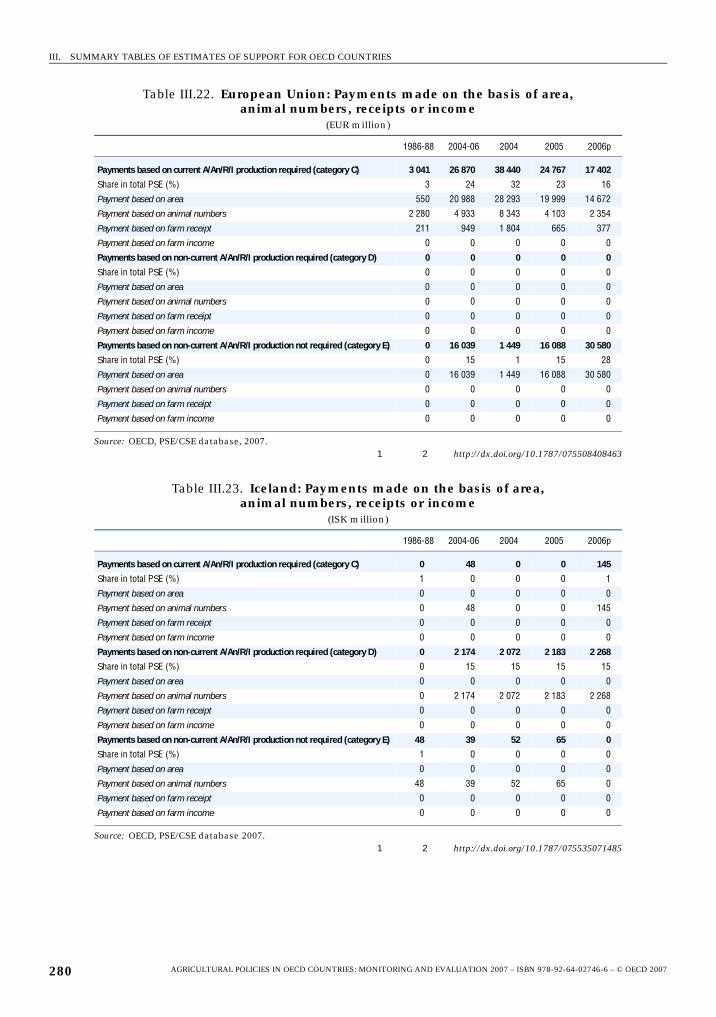
III. SUMMARY TABLES OF ESTIMATES OF SUPPORT FOR OECD COUNTRIES
Table III.22. European Union: Payments made on the basis of area,animal numbers, receipts or income
(EUR million)
1986-88 2004-06 2004 2005 2006p
Payments based on current A/An/R/I production required (category C) 3 041 26 870 38 440 24 767 17 402
Share in total PSE (%) 3 24 32 23 16
Payment based on area 550 20 988 28 293 19 999 14 672
Payment based on animal numbers 2 280 4 933 8 343 4 103 2 354
Payment based on farm receipt 211 949 1 804 665 377
Payment based on farm income 0 0 0 0 0
Payments based on non-current A/An/R/I production required (category D) 0 0 0 0 0
Share in total PSE (%) 0 0 0 0 0
Payment based on area 0 0 0 0 0
Payment based on animal numbers 0 0 0 0 0
Payment based on farm receipt 0 0 0 0 0
Payment based on farm income 0 0 0 0 0
Payments based on non-current A/An/R/I production not required (category E) 0 16 039 1 449 16 088 30 580
Share in total PSE (%) 0 15 1 15 28
Payment based on area 0 16 039 1 449 16 088 30 580
Payment based on animal numbers 0 0 0 0 0
Payment based on farm receipt 0 0 0 0 0
Payment based on farm income 0 0 0 0 0
Source: OECD, PSE/CSE database, 2007.1 2 http://dx.doi.org/10.1787/075508408463
Table III.23. Iceland: Payments made on the basis of area,animal numbers, receipts or income
(ISK million)
1986-88 2004-06 2004 2005 2006p
Payments based on current A/An/R/I production required (category C) 0 48 0 0 145
Share in total PSE (%) 1 0 0 0 1
Payment based on area 0 0 0 0 0
Payment based on animal numbers 0 48 0 0 145
Payment based on farm receipt 0 0 0 0 0
Payment based on farm income 0 0 0 0 0
Payments based on non-current A/An/R/I production required (category D) 0 2 174 2 072 2 183 2 268
Share in total PSE (%) 0 15 15 15 15
Payment based on area 0 0 0 0 0
Payment based on animal numbers 0 2 174 2 072 2 183 2 268
Payment based on farm receipt 0 0 0 0 0
Payment based on farm income 0 0 0 0 0
Payments based on non-current A/An/R/I production not required (category E) 48 39 52 65 0
Share in total PSE (%) 1 0 0 0 0
Payment based on area 0 0 0 0 0
Payment based on animal numbers 48 39 52 65 0
Payment based on farm receipt 0 0 0 0 0
Payment based on farm income 0 0 0 0 0
Source: OECD, PSE/CSE database 2007.1 2 http://dx.doi.org/10.1787/075535071485
AGRICULTURAL POLICIES IN OECD COUNTRIES: MONITORING AND EVALUATION 2007 – ISBN 978-92-64-02746-6 – © OECD 2007280
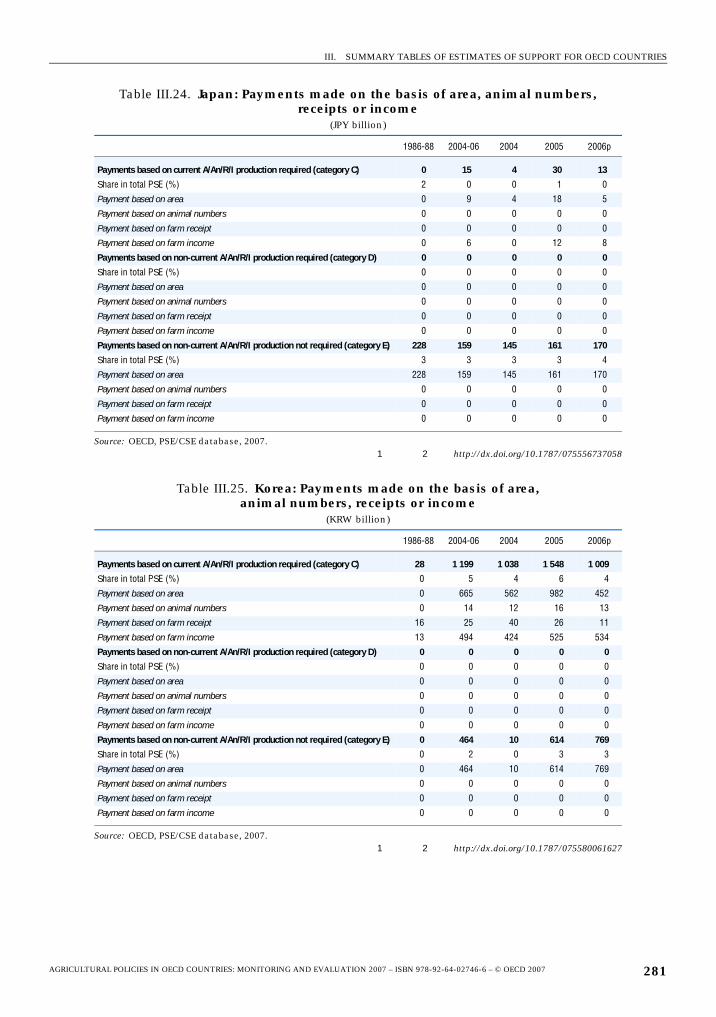
III. SUMMARY TABLES OF ESTIMATES OF SUPPORT FOR OECD COUNTRIES
Table III.24. Japan: Payments made on the basis of area, animal numbers, receipts or income
(JPY billion)
1986-88 2004-06 2004 2005 2006p
Payments based on current A/An/R/I production required (category C) 0 15 4 30 13
Share in total PSE (%) 2 0 0 1 0
Payment based on area 0 9 4 18 5
Payment based on animal numbers 0 0 0 0 0
Payment based on farm receipt 0 0 0 0 0
Payment based on farm income 0 6 0 12 8
Payments based on non-current A/An/R/I production required (category D) 0 0 0 0 0
Share in total PSE (%) 0 0 0 0 0
Payment based on area 0 0 0 0 0
Payment based on animal numbers 0 0 0 0 0
Payment based on farm receipt 0 0 0 0 0
Payment based on farm income 0 0 0 0 0
Payments based on non-current A/An/R/I production not required (category E) 228 159 145 161 170
Share in total PSE (%) 3 3 3 3 4
Payment based on area 228 159 145 161 170
Payment based on animal numbers 0 0 0 0 0
Payment based on farm receipt 0 0 0 0 0
Payment based on farm income 0 0 0 0 0
Source: OECD, PSE/CSE database, 2007.1 2 http://dx.doi.org/10.1787/075556737058
Table III.25. Korea: Payments made on the basis of area,animal numbers, receipts or income
(KRW billion)
1986-88 2004-06 2004 2005 2006p
Payments based on current A/An/R/I production required (category C) 28 1 199 1 038 1 548 1 009
Share in total PSE (%) 0 5 4 6 4
Payment based on area 0 665 562 982 452
Payment based on animal numbers 0 14 12 16 13
Payment based on farm receipt 16 25 40 26 11
Payment based on farm income 13 494 424 525 534
Payments based on non-current A/An/R/I production required (category D) 0 0 0 0 0
Share in total PSE (%) 0 0 0 0 0
Payment based on area 0 0 0 0 0
Payment based on animal numbers 0 0 0 0 0
Payment based on farm receipt 0 0 0 0 0
Payment based on farm income 0 0 0 0 0
Payments based on non-current A/An/R/I production not required (category E) 0 464 10 614 769
Share in total PSE (%) 0 2 0 3 3
Payment based on area 0 464 10 614 769
Payment based on animal numbers 0 0 0 0 0
Payment based on farm receipt 0 0 0 0 0
Payment based on farm income 0 0 0 0 0
Source: OECD, PSE/CSE database, 2007.1 2 http://dx.doi.org/10.1787/075580061627
AGRICULTURAL POLICIES IN OECD COUNTRIES: MONITORING AND EVALUATION 2007 – ISBN 978-92-64-02746-6 – © OECD 2007 281
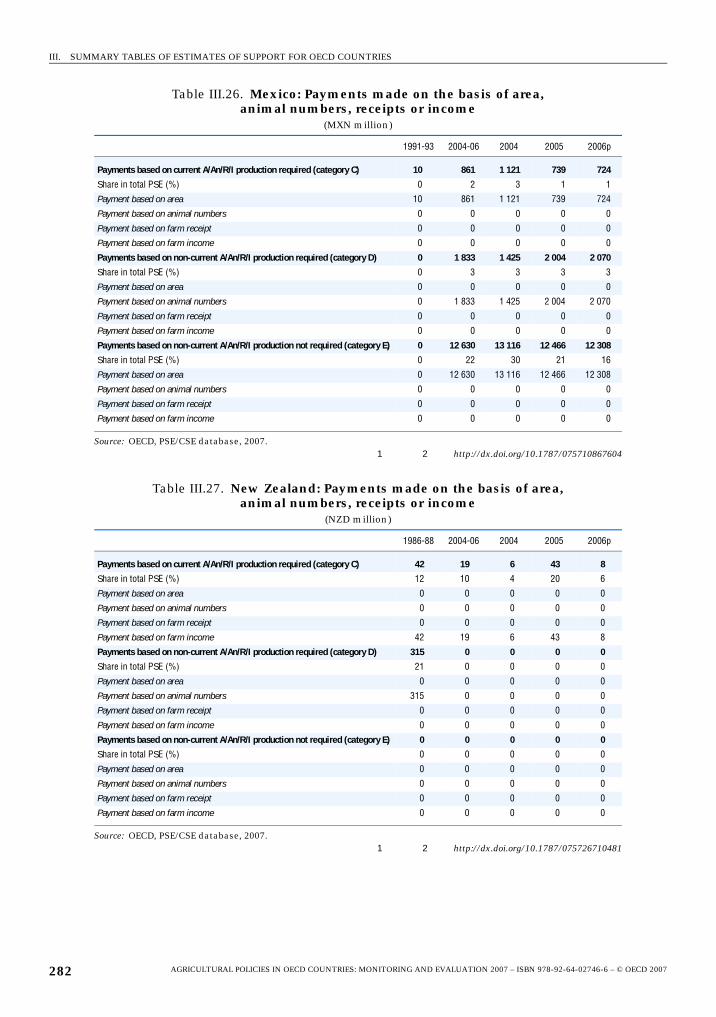
III. SUMMARY TABLES OF ESTIMATES OF SUPPORT FOR OECD COUNTRIES
Table III.26. Mexico: Payments made on the basis of area,animal numbers, receipts or income
(MXN million)
1991-93 2004-06 2004 2005 2006p
Payments based on current A/An/R/I production required (category C) 10 861 1 121 739 724
Share in total PSE (%) 0 2 3 1 1
Payment based on area 10 861 1 121 739 724
Payment based on animal numbers 0 0 0 0 0
Payment based on farm receipt 0 0 0 0 0
Payment based on farm income 0 0 0 0 0
Payments based on non-current A/An/R/I production required (category D) 0 1 833 1 425 2 004 2 070
Share in total PSE (%) 0 3 3 3 3
Payment based on area 0 0 0 0 0
Payment based on animal numbers 0 1 833 1 425 2 004 2 070
Payment based on farm receipt 0 0 0 0 0
Payment based on farm income 0 0 0 0 0
Payments based on non-current A/An/R/I production not required (category E) 0 12 630 13 116 12 466 12 308
Share in total PSE (%) 0 22 30 21 16
Payment based on area 0 12 630 13 116 12 466 12 308
Payment based on animal numbers 0 0 0 0 0
Payment based on farm receipt 0 0 0 0 0
Payment based on farm income 0 0 0 0 0
Source: OECD, PSE/CSE database, 2007.1 2 http://dx.doi.org/10.1787/075710867604
Table III.27. New Zealand: Payments made on the basis of area,animal numbers, receipts or income
(NZD million)
1986-88 2004-06 2004 2005 2006p
Payments based on current A/An/R/I production required (category C) 42 19 6 43 8
Share in total PSE (%) 12 10 4 20 6
Payment based on area 0 0 0 0 0
Payment based on animal numbers 0 0 0 0 0
Payment based on farm receipt 0 0 0 0 0
Payment based on farm income 42 19 6 43 8
Payments based on non-current A/An/R/I production required (category D) 315 0 0 0 0
Share in total PSE (%) 21 0 0 0 0
Payment based on area 0 0 0 0 0
Payment based on animal numbers 315 0 0 0 0
Payment based on farm receipt 0 0 0 0 0
Payment based on farm income 0 0 0 0 0
Payments based on non-current A/An/R/I production not required (category E) 0 0 0 0 0
Share in total PSE (%) 0 0 0 0 0
Payment based on area 0 0 0 0 0
Payment based on animal numbers 0 0 0 0 0
Payment based on farm receipt 0 0 0 0 0
Payment based on farm income 0 0 0 0 0
Source: OECD, PSE/CSE database, 2007.1 2 http://dx.doi.org/10.1787/075726710481
AGRICULTURAL POLICIES IN OECD COUNTRIES: MONITORING AND EVALUATION 2007 – ISBN 978-92-64-02746-6 – © OECD 2007282
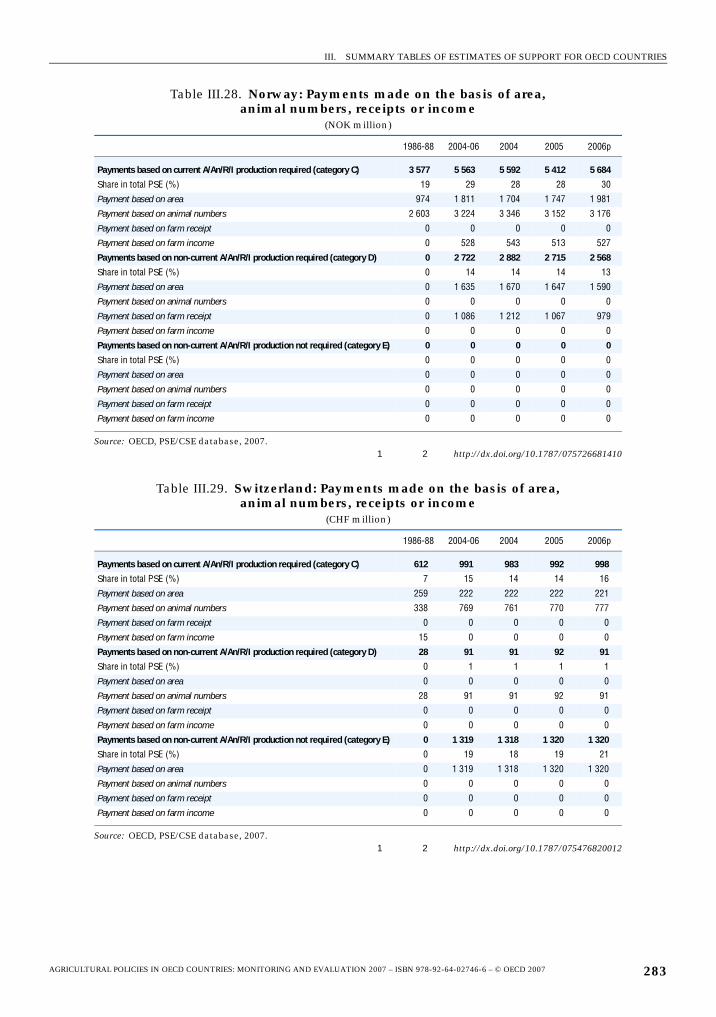
III. SUMMARY TABLES OF ESTIMATES OF SUPPORT FOR OECD COUNTRIES
Table III.28. Norway: Payments made on the basis of area,animal numbers, receipts or income
(NOK million)
1986-88 2004-06 2004 2005 2006p
Payments based on current A/An/R/I production required (category C) 3 577 5 563 5 592 5 412 5 684
Share in total PSE (%) 19 29 28 28 30
Payment based on area 974 1 811 1 704 1 747 1 981
Payment based on animal numbers 2 603 3 224 3 346 3 152 3 176
Payment based on farm receipt 0 0 0 0 0
Payment based on farm income 0 528 543 513 527
Payments based on non-current A/An/R/I production required (category D) 0 2 722 2 882 2 715 2 568
Share in total PSE (%) 0 14 14 14 13
Payment based on area 0 1 635 1 670 1 647 1 590
Payment based on animal numbers 0 0 0 0 0
Payment based on farm receipt 0 1 086 1 212 1 067 979
Payment based on farm income 0 0 0 0 0
Payments based on non-current A/An/R/I production not required (category E) 0 0 0 0 0
Share in total PSE (%) 0 0 0 0 0
Payment based on area 0 0 0 0 0
Payment based on animal numbers 0 0 0 0 0
Payment based on farm receipt 0 0 0 0 0
Payment based on farm income 0 0 0 0 0
Source: OECD, PSE/CSE database, 2007.1 2 http://dx.doi.org/10.1787/075726681410
Table III.29. Switzerland: Payments made on the basis of area,animal numbers, receipts or income
(CHF million)
1986-88 2004-06 2004 2005 2006p
Payments based on current A/An/R/I production required (category C) 612 991 983 992 998
Share in total PSE (%) 7 15 14 14 16
Payment based on area 259 222 222 222 221
Payment based on animal numbers 338 769 761 770 777
Payment based on farm receipt 0 0 0 0 0
Payment based on farm income 15 0 0 0 0
Payments based on non-current A/An/R/I production required (category D) 28 91 91 92 91
Share in total PSE (%) 0 1 1 1 1
Payment based on area 0 0 0 0 0
Payment based on animal numbers 28 91 91 92 91
Payment based on farm receipt 0 0 0 0 0
Payment based on farm income 0 0 0 0 0
Payments based on non-current A/An/R/I production not required (category E) 0 1 319 1 318 1 320 1 320
Share in total PSE (%) 0 19 18 19 21
Payment based on area 0 1 319 1 318 1 320 1 320
Payment based on animal numbers 0 0 0 0 0
Payment based on farm receipt 0 0 0 0 0
Payment based on farm income 0 0 0 0 0
Source: OECD, PSE/CSE database, 2007.1 2 http://dx.doi.org/10.1787/075476820012
AGRICULTURAL POLICIES IN OECD COUNTRIES: MONITORING AND EVALUATION 2007 – ISBN 978-92-64-02746-6 – © OECD 2007 283
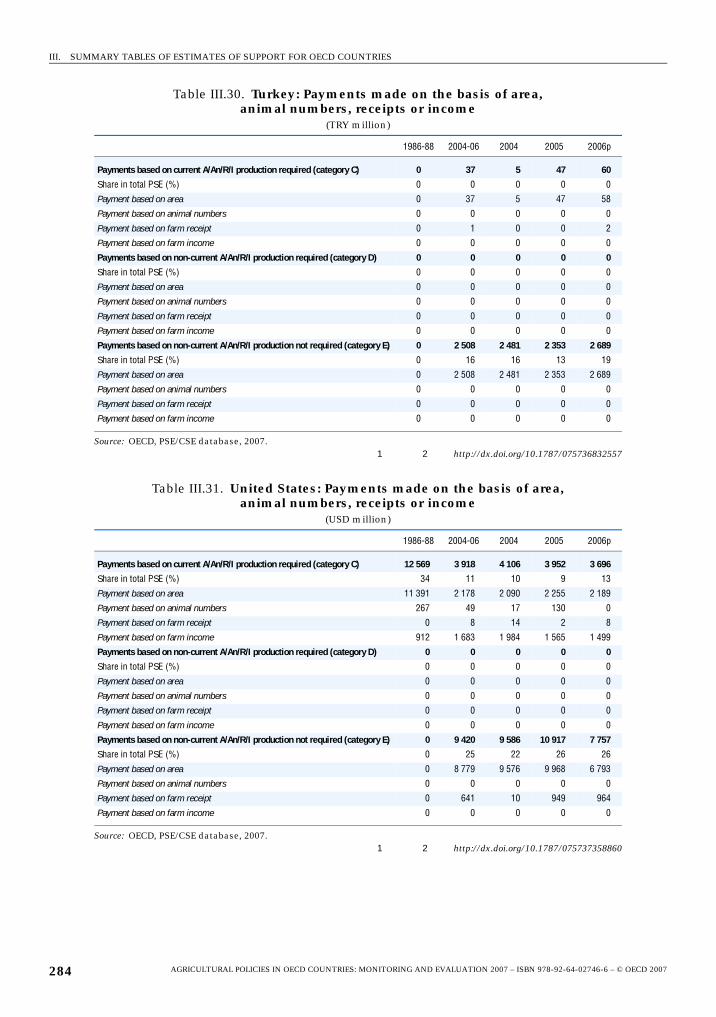
III. SUMMARY TABLES OF ESTIMATES OF SUPPORT FOR OECD COUNTRIES
Table III.30. Turkey: Payments made on the basis of area,animal numbers, receipts or income
(TRY million)
1986-88 2004-06 2004 2005 2006p
Payments based on current A/An/R/I production required (category C) 0 37 5 47 60
Share in total PSE (%) 0 0 0 0 0
Payment based on area 0 37 5 47 58
Payment based on animal numbers 0 0 0 0 0
Payment based on farm receipt 0 1 0 0 2
Payment based on farm income 0 0 0 0 0
Payments based on non-current A/An/R/I production required (category D) 0 0 0 0 0
Share in total PSE (%) 0 0 0 0 0
Payment based on area 0 0 0 0 0
Payment based on animal numbers 0 0 0 0 0
Payment based on farm receipt 0 0 0 0 0
Payment based on farm income 0 0 0 0 0
Payments based on non-current A/An/R/I production not required (category E) 0 2 508 2 481 2 353 2 689
Share in total PSE (%) 0 16 16 13 19
Payment based on area 0 2 508 2 481 2 353 2 689
Payment based on animal numbers 0 0 0 0 0
Payment based on farm receipt 0 0 0 0 0
Payment based on farm income 0 0 0 0 0
Source: OECD, PSE/CSE database, 2007.1 2 http://dx.doi.org/10.1787/075736832557
Table III.31. United States: Payments made on the basis of area,animal numbers, receipts or income
(USD million)
1986-88 2004-06 2004 2005 2006p
Payments based on current A/An/R/I production required (category C) 12 569 3 918 4 106 3 952 3 696
Share in total PSE (%) 34 11 10 9 13
Payment based on area 11 391 2 178 2 090 2 255 2 189
Payment based on animal numbers 267 49 17 130 0
Payment based on farm receipt 0 8 14 2 8
Payment based on farm income 912 1 683 1 984 1 565 1 499
Payments based on non-current A/An/R/I production required (category D) 0 0 0 0 0
Share in total PSE (%) 0 0 0 0 0
Payment based on area 0 0 0 0 0
Payment based on animal numbers 0 0 0 0 0
Payment based on farm receipt 0 0 0 0 0
Payment based on farm income 0 0 0 0 0
Payments based on non-current A/An/R/I production not required (category E) 0 9 420 9 586 10 917 7 757
Share in total PSE (%) 0 25 22 26 26
Payment based on area 0 8 779 9 576 9 968 6 793
Payment based on animal numbers 0 0 0 0 0
Payment based on farm receipt 0 641 10 949 964
Payment based on farm income 0 0 0 0 0
Source: OECD, PSE/CSE database, 2007.1 2 http://dx.doi.org/10.1787/075737358860
AGRICULTURAL POLICIES IN OECD COUNTRIES: MONITORING AND EVALUATION 2007 – ISBN 978-92-64-02746-6 – © OECD 2007284
OECD PUBLICATIONS, 2, rue André-Pascal, 75775 PARIS CEDEX 16
PRINTED IN FRANCE
(51 2007 05 1 P) ISBN 978-92-64-02746-6 – No. 55715 2007
�����������������������
Agricultural Policies in OECD CountriesMONITORING AND EVALUATION 2007Support to farmers in OECD countries accounted for 27% of farm receipts in 2006, a drop of 2 percentage points from 2005. However, for the OECD as a whole, there has been little change in the level of producer support since the late 1990s. In the most recent period, there was progress in the way support is provided to producers, via a noticeable shift away from measures linked to the production of specific commodities. But despite a sizeable reduction, production-linked measures still dominate producer support in most countries. In addition, there has been only limited progress towards policies that target clearly defined objectives and beneficiaries. Better targeting of policies would increase their effectiveness in meeting domestic objectives, enhance efficiency, and improve transparency.
This book is a unique source of up-to-date estimates of support to agriculture. Separate chapters describe and evaluate agricultural policies in each OECD country, including such important developments as the introduction of the single-payment scheme in the EU. This edition also includes a special chapter describing the revised method of estimating support to agriculture used for the first time in this report.
Agricultural Policies in OECD Countries: Monitoring and Evaluation is published every other year, alternating with Agricultural Policies in OECD Countries: At a Glance.
2007
A
gricultural P
olicies in O
EC
D C
ountries M
ON
ITO
RIN
G A
ND
EVA
LUA
TIO
N
ISBN 978-92-64-02746-6 51 2007 05 1 P -:HSTCQE=UW\Y[[:
The full text of this book is available on line via this link: www.sourceoecd.org/agriculture/9789264027466
Those with access to all OECD books on line should use this link: www.sourceoecd.org/9789264027466
SourceOECD is the OECD’s online library of books, periodicals and statistical databases. For more information about this award-winning service and free trials ask your librarian, or write to us at [email protected].
Agricultural Policies in OECD CountriesMONITORING AND EVALUATION 2007